Cambridge IGCSE Environmental Management 0680 — 2014 Oct/Nov Paper 2 · Variant 2
0680/22/O/N/14 · 80 marks · ≈90 min
The question paper and its mark scheme, free to read here and free to download. This is Cambridge’s own paper, exactly as it was sat.
Question paper20 pages


Mark scheme8 pages
Answers below. Sit the paper first if you are practising.
Paper as text
Question paper, page 1
This document consists of 18 printed pages and 2 blank pages. DC (NF/JG) 81082/5 © UCLES 2014 [Turn over Cambridge International Examinations Cambridge International General Certificate of Secondary Education * 1 8 1 6 5 3 1 5 6 0 * ENVIRONMENTAL MANAGEMENT 0680/22 Paper 2 October/November 2014 1 hour 45 minutes Candidates answer on the Question Paper. Additional Materials: Ruler READ THESE INSTRUCTIONS FIRST Write your Centre number, candidate number and name on all the work you hand in. Write in dark blue or black pen. You may use an HB pencil for any diagrams or graphs. Do not use staples, paper clips, glue or correction fluid. DO NOT WRITE IN ANY BARCODES. Answer both questions. Electronic calculators may be used. You may lose marks if you do not show your working or if you do not use appropriate units. At the end of the examination, fasten all your work securely together. The number of marks is given in brackets [ ] at the end of each question or part question.
Question paper, page 2
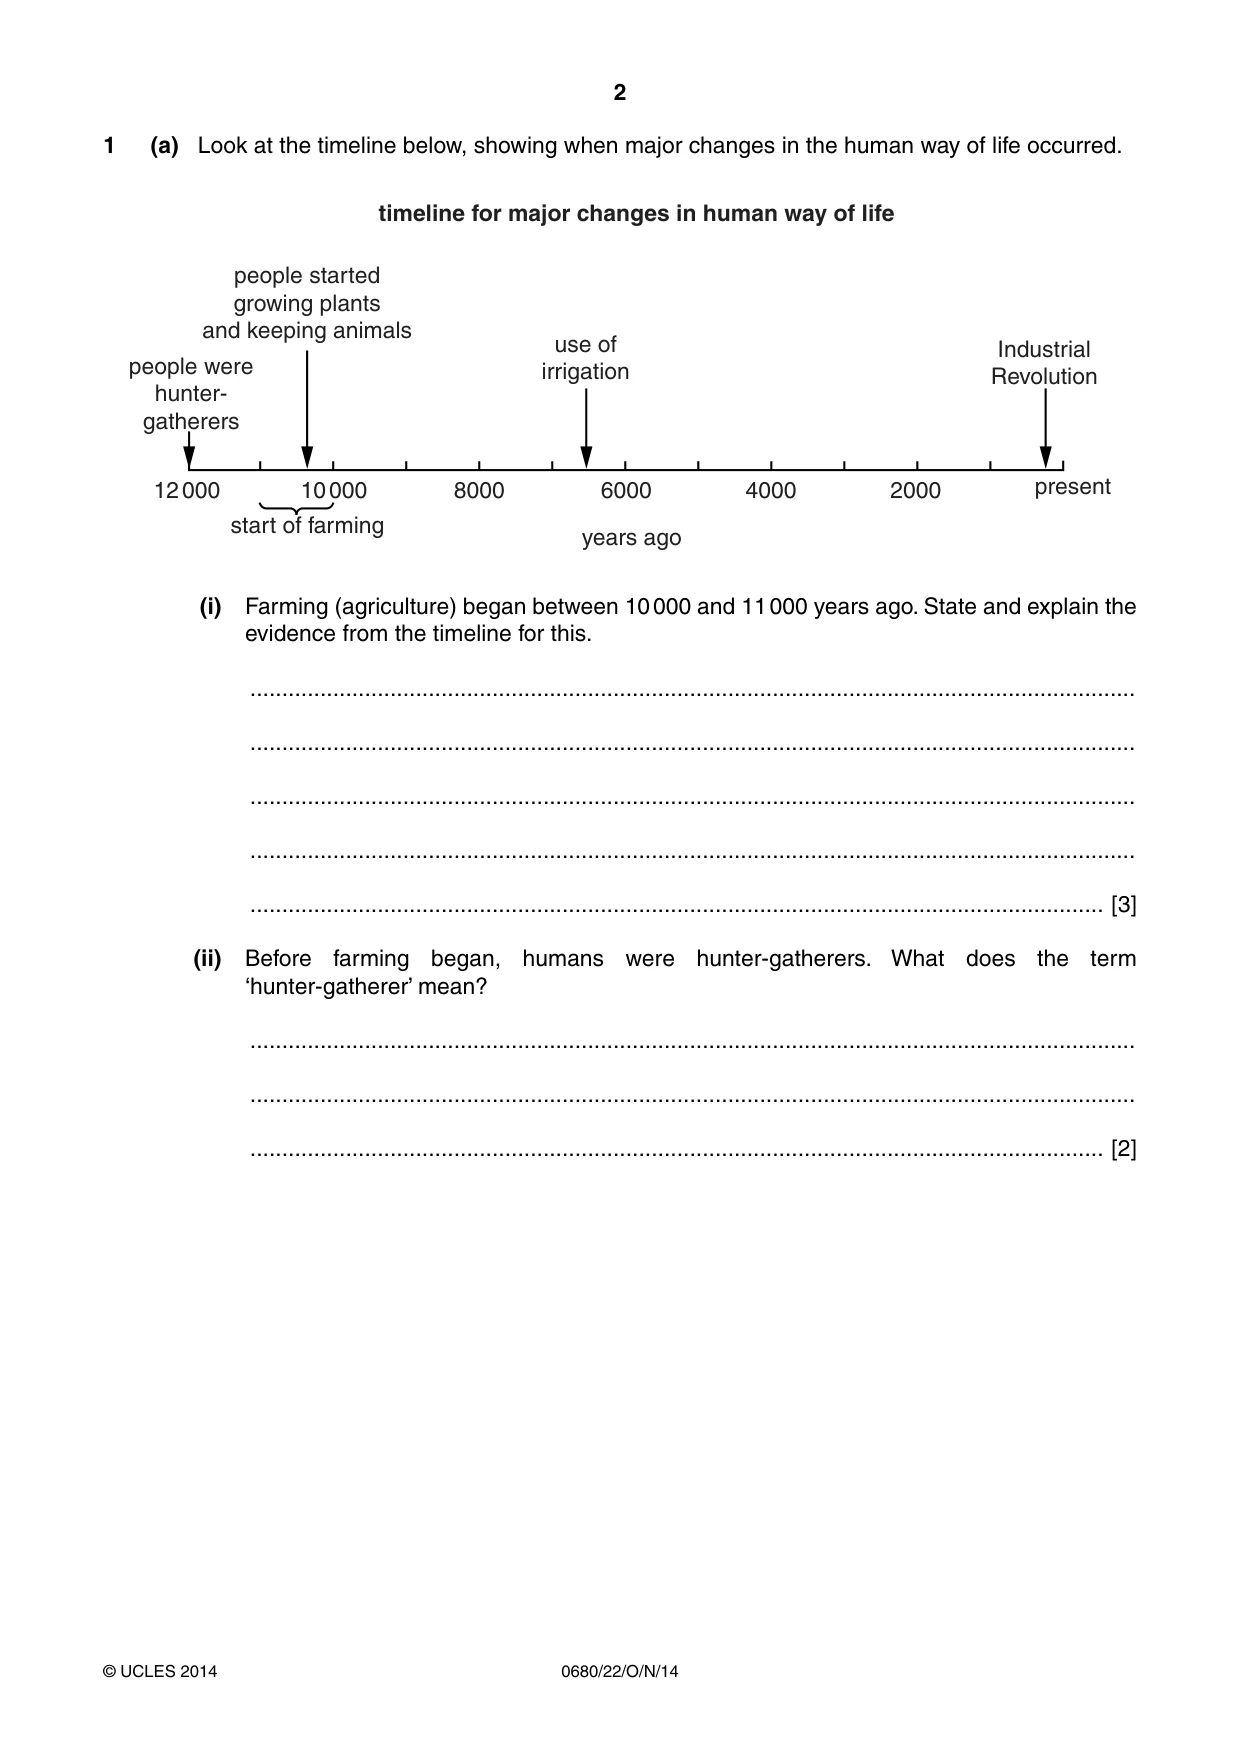
2 0680/22/O/N/14 © UCLES 2014 1 (a) Look at the timeline below, showing when major changes in the human way of life occurred. people were hunter- gatherers use of irrigation Industrial Revolution people started growing plants and keeping animals present 12 000 10 000 8000 6000 4000 2000 years ago timeline for major changes in human way of life start of farming (i) Farming (agriculture) began between 10 000 and 11 000 years ago. State and explain the evidence from the timeline for this. … … … … … [3] (ii) Before farming began, humans were hunter-gatherers. What does the term ‘hunter-gatherer’ mean? … … … [2]
Question paper, page 3
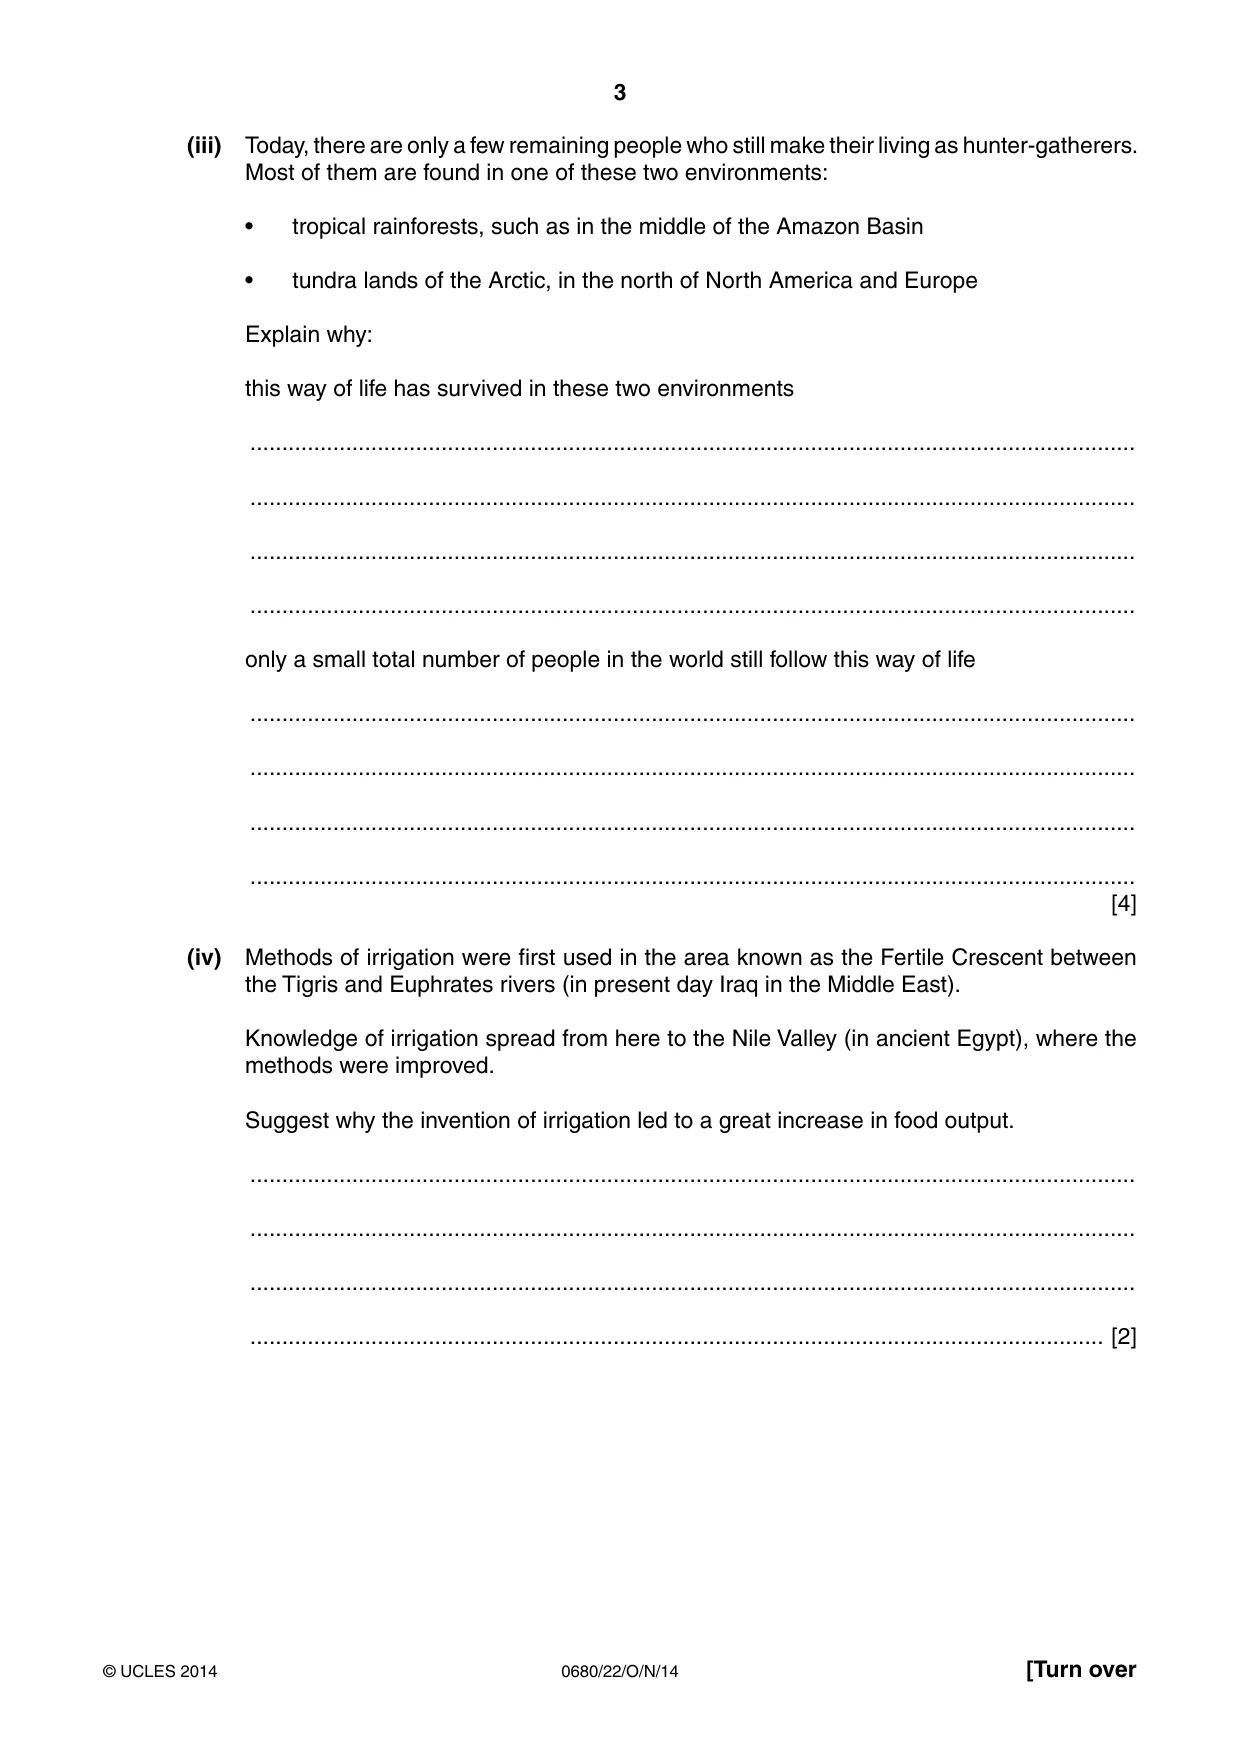
3 0680/22/O/N/14 © UCLES 2014 [Turn over (iii) Today, there are only a few remaining people who still make their living as hunter-gatherers. Most of them are found in one of these two environments: • tropical rainforests, such as in the middle of the Amazon Basin • tundra lands of the Arctic, in the north of North America and Europe Explain why: this way of life has survived in these two environments … … … … only a small total number of people in the world still follow this way of life … … … … [4] (iv) Methods of irrigation were first used in the area known as the Fertile Crescent between the Tigris and Euphrates rivers (in present day Iraq in the Middle East). Knowledge of irrigation spread from here to the Nile Valley (in ancient Egypt), where the methods were improved. Suggest why the invention of irrigation led to a great increase in food output. … … … … [2]
Question paper, page 4
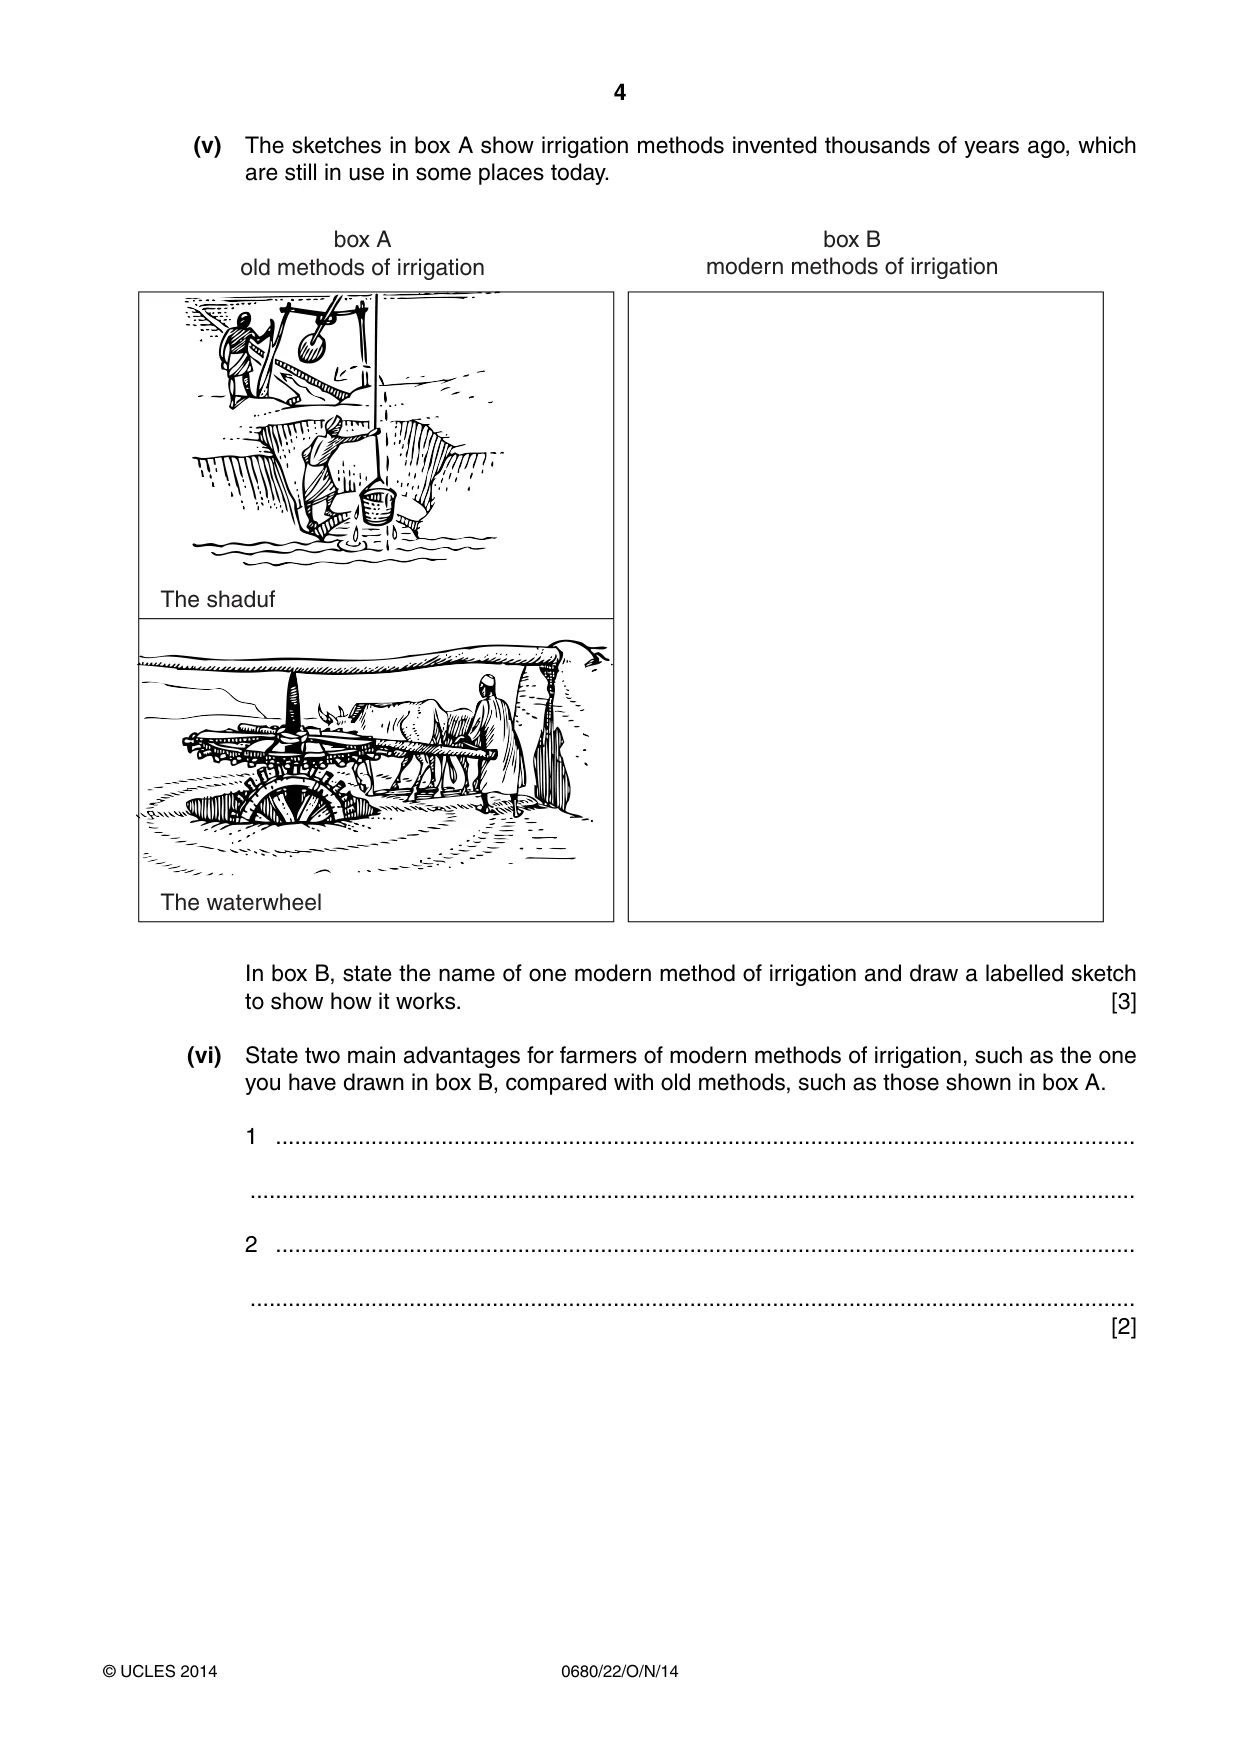
4 0680/22/O/N/14 © UCLES 2014 (v) The sketches in box A show irrigation methods invented thousands of years ago, which are still in use in some places today. The shaduf The waterwheel box A old methods of irrigation box B modern methods of irrigation In box B, state the name of one modern method of irrigation and draw a labelled sketch to show how it works. [3] (vi) State two main advantages for farmers of modern methods of irrigation, such as the one you have drawn in box B, compared with old methods, such as those shown in box A. 1 … … 2 … … [2]
Question paper, page 5
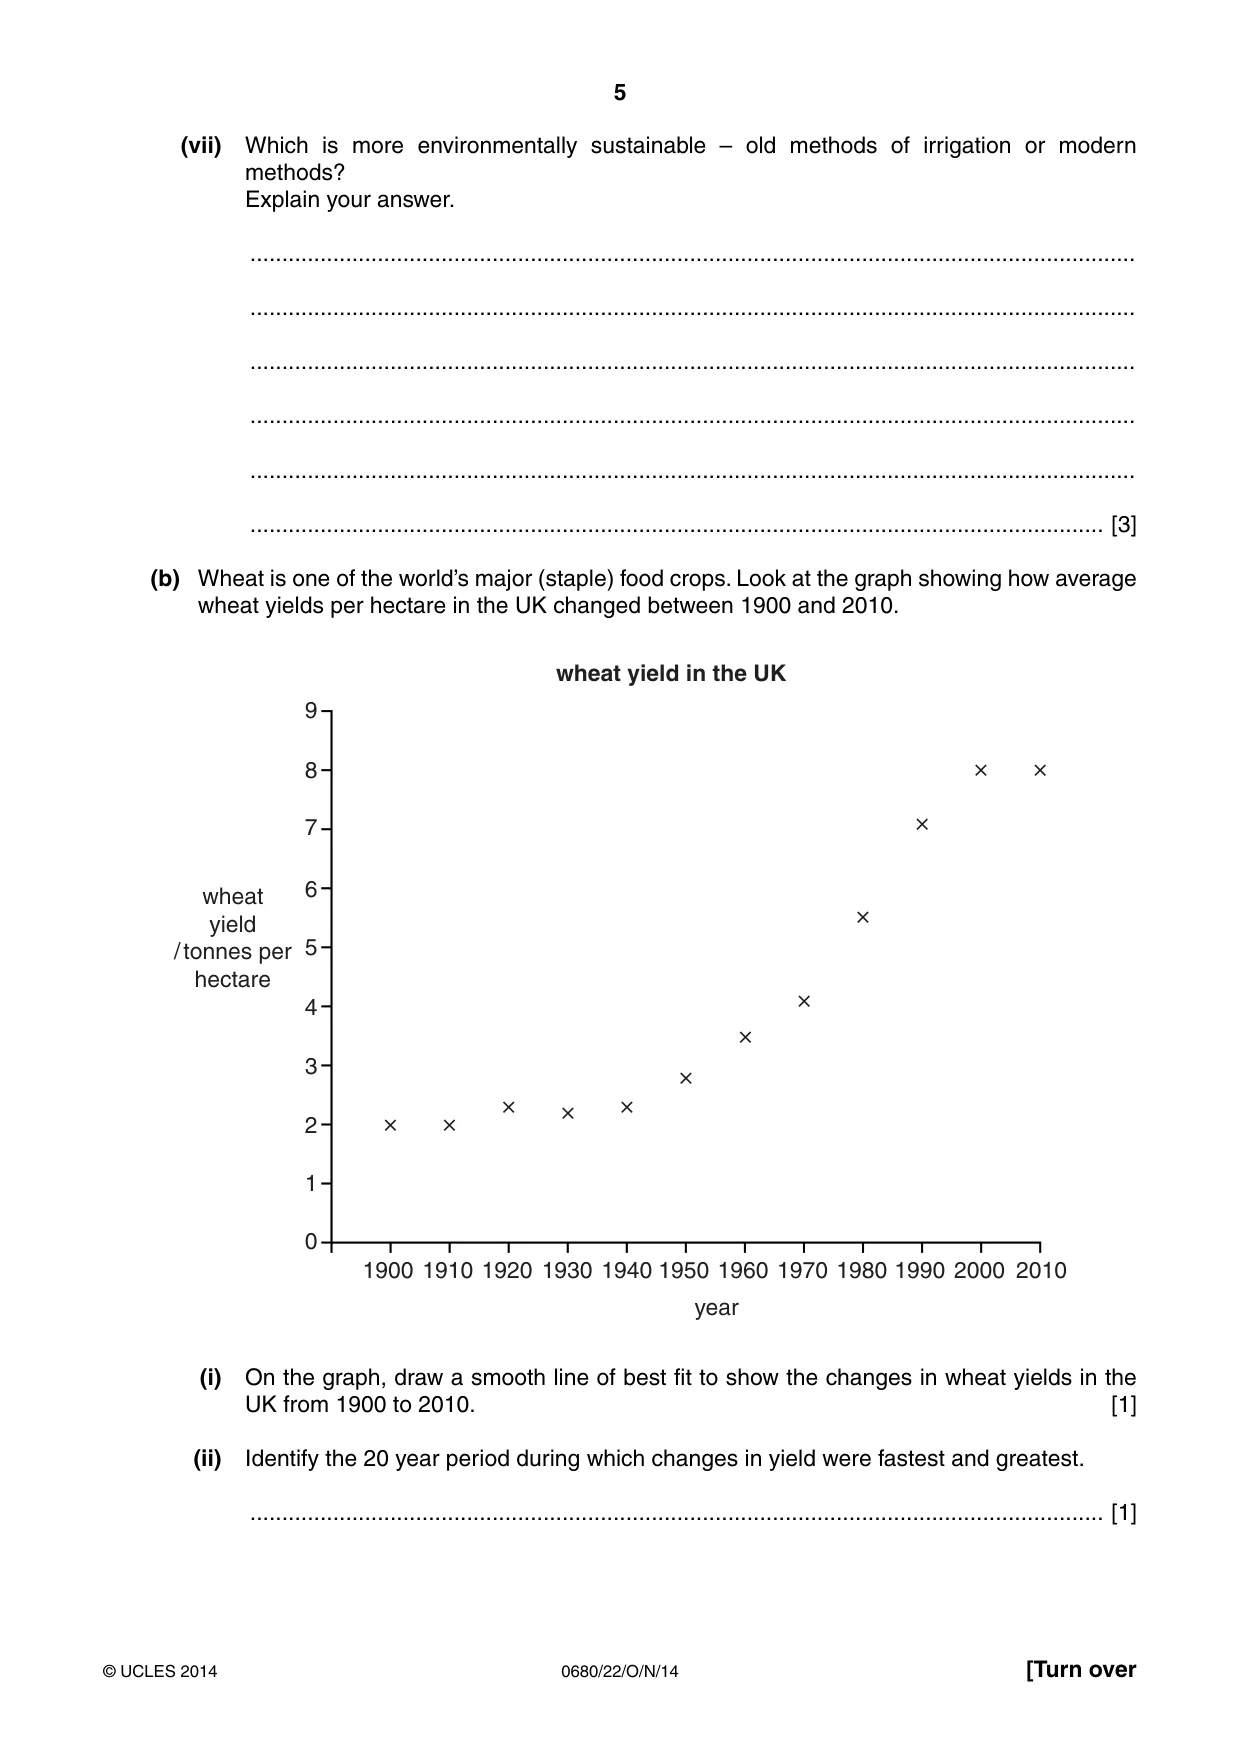
5 0680/22/O/N/14 © UCLES 2014 [Turn over (vii) Which is more environmentally sustainable – old methods of irrigation or modern methods? Explain your answer. … … … … … … [3] (b) Wheat is one of the world’s major (staple) food crops. Look at the graph showing how average wheat yields per hectare in the UK changed between 1900 and 2010. 1900 × × × × × × × × × × × × 1910 1920 1930 1940 1950 1960 1970 1980 1990 2000 2010 0 1 2 3 4 5 6 7 8 9 year wheat yield / tonnes per hectare wheat yield in the UK (i) On the graph, draw a smooth line of best fit to show the changes in wheat yields in the UK from 1900 to 2010. [1] (ii) Identify the 20 year period during which changes in yield were fastest and greatest. … [1]
Question paper, page 6
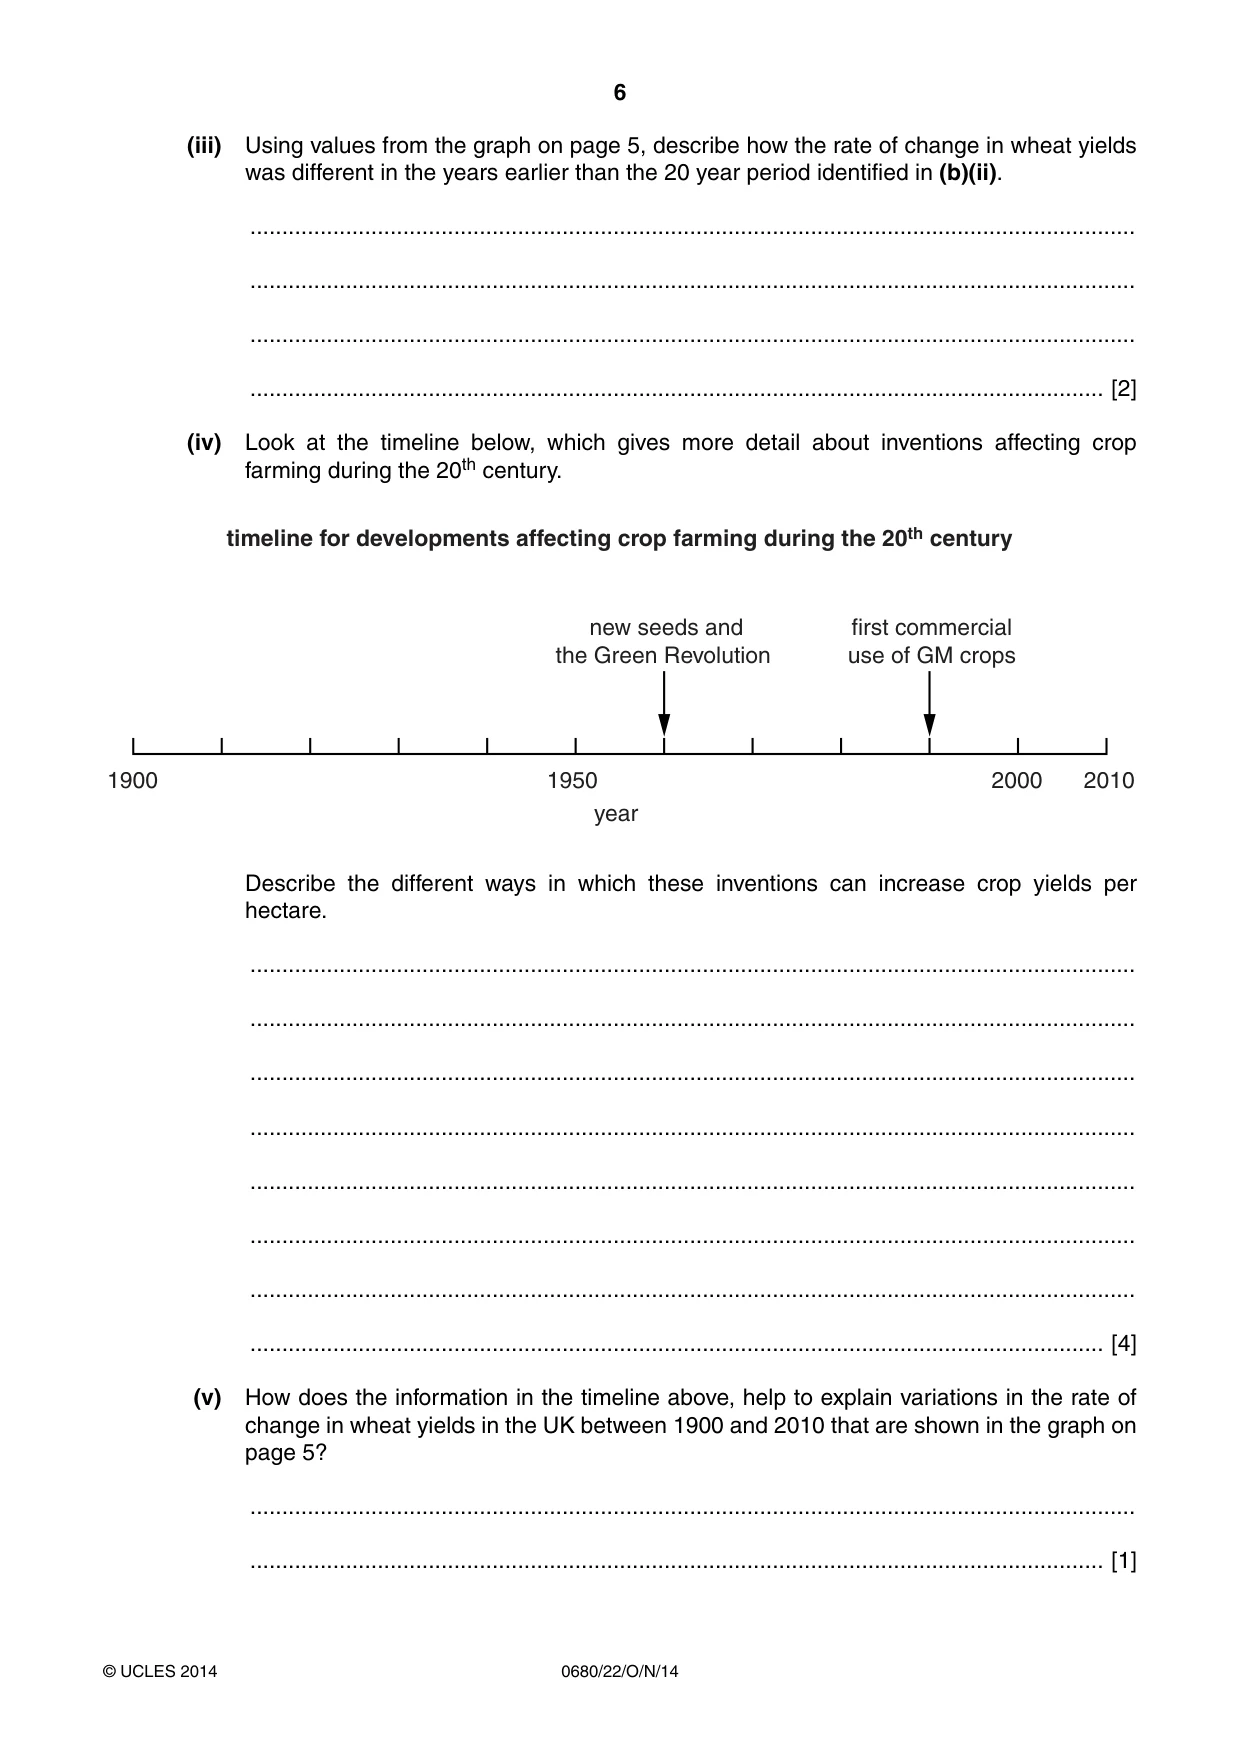
6 0680/22/O/N/14 © UCLES 2014 (iii) Using values from the graph on page 5, describe how the rate of change in wheat yields was different in the years earlier than the 20 year period identified in (b)(ii). … … … … [2] (iv) Look at the timeline below, which gives more detail about inventions affecting crop farming during the 20th century. 1900 1950 year 2010 2000 new seeds and the Green Revolution first commercial use of GM crops timeline for developments affecting crop farming during the 20th century Describe the different ways in which these inventions can increase crop yields per hectare. … … … … … … … … [4] (v) How does the information in the timeline above, help to explain variations in the rate of change in wheat yields in the UK between 1900 and 2010 that are shown in the graph on page 5? … … [1]
Question paper, page 7
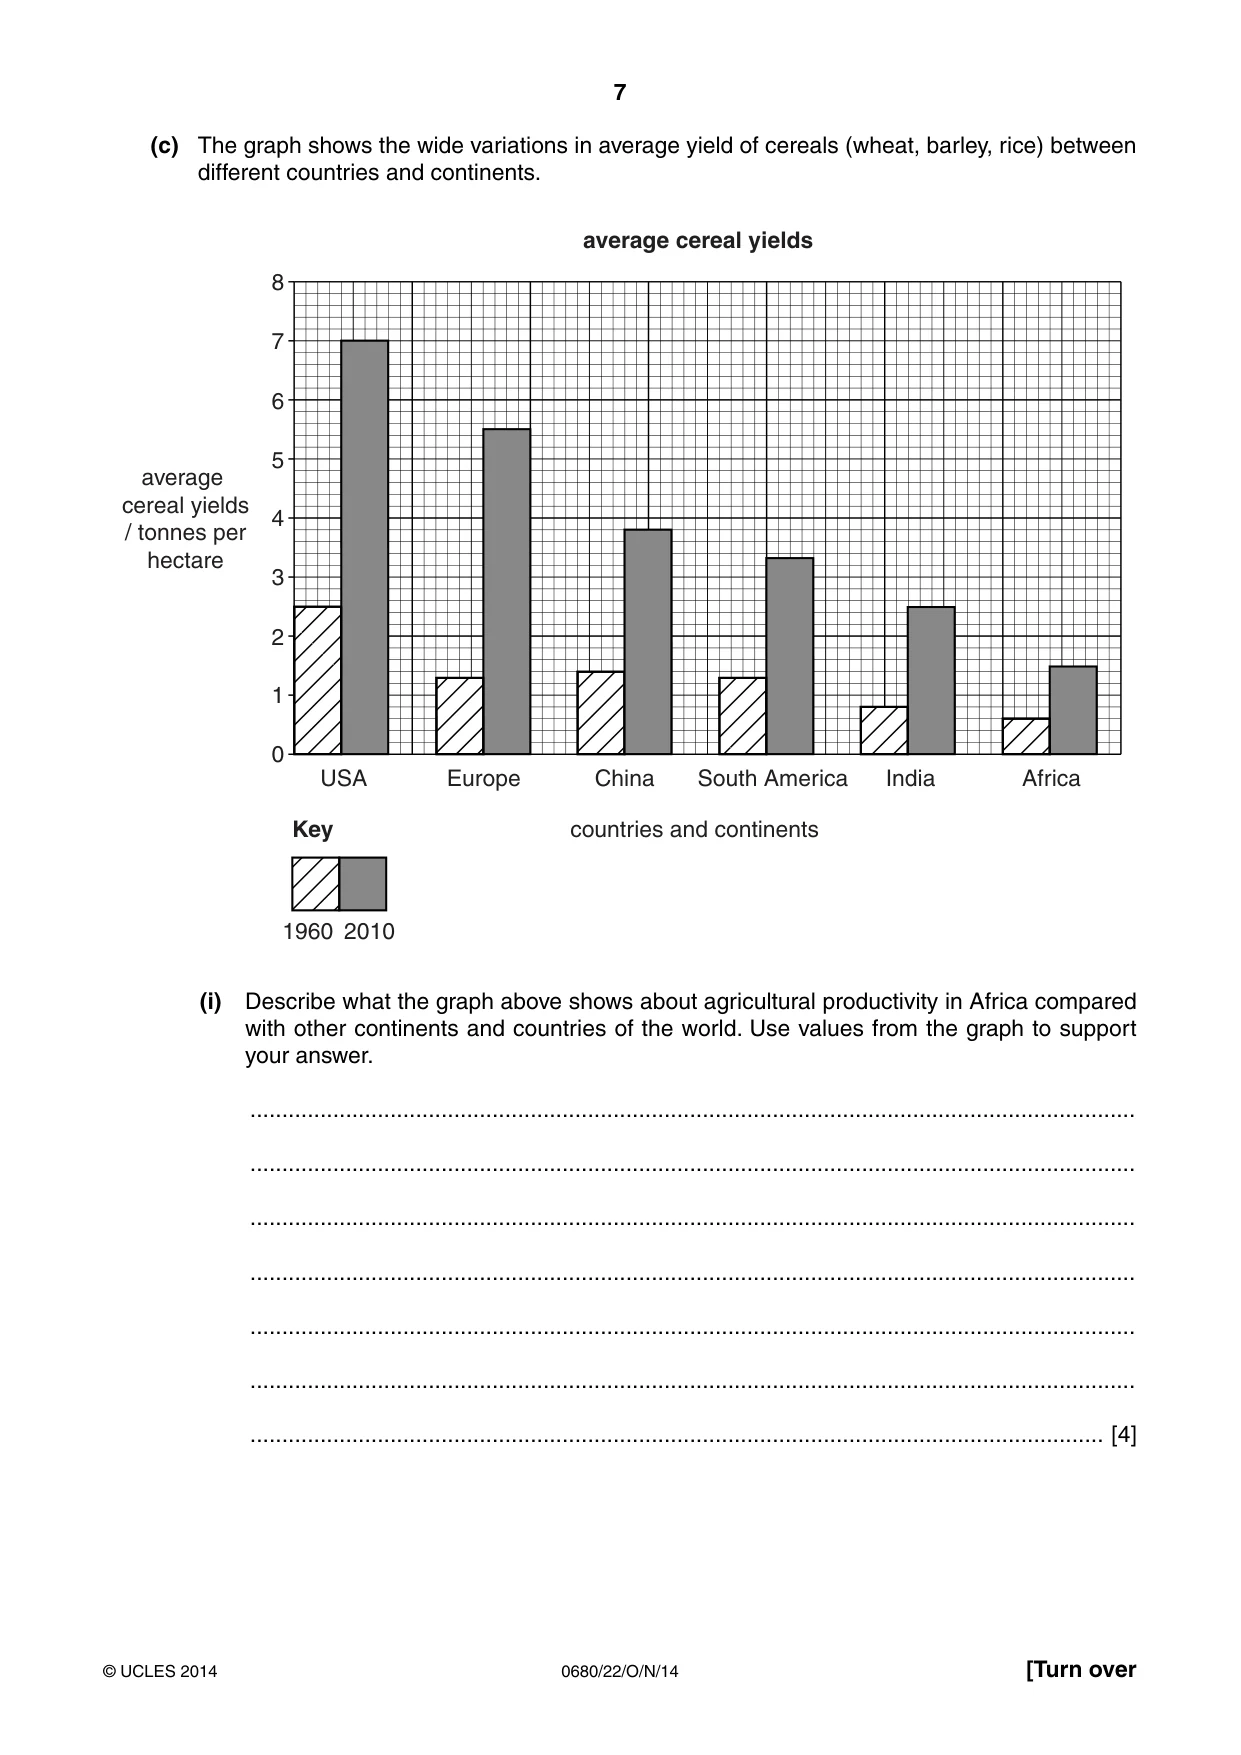
7 0680/22/O/N/14 © UCLES 2014 [Turn over (c) The graph shows the wide variations in average yield of cereals (wheat, barley, rice) between different countries and continents. USA 0 1 2 3 4 5 6 7 8 Europe China India Africa South America Key 1960 2010 average cereal yields / tonnes per hectare countries and continents average cereal yields (i) Describe what the graph above shows about agricultural productivity in Africa compared with other continents and countries of the world. Use values from the graph to support your answer. … … … … … … … [4]
Question paper, page 8
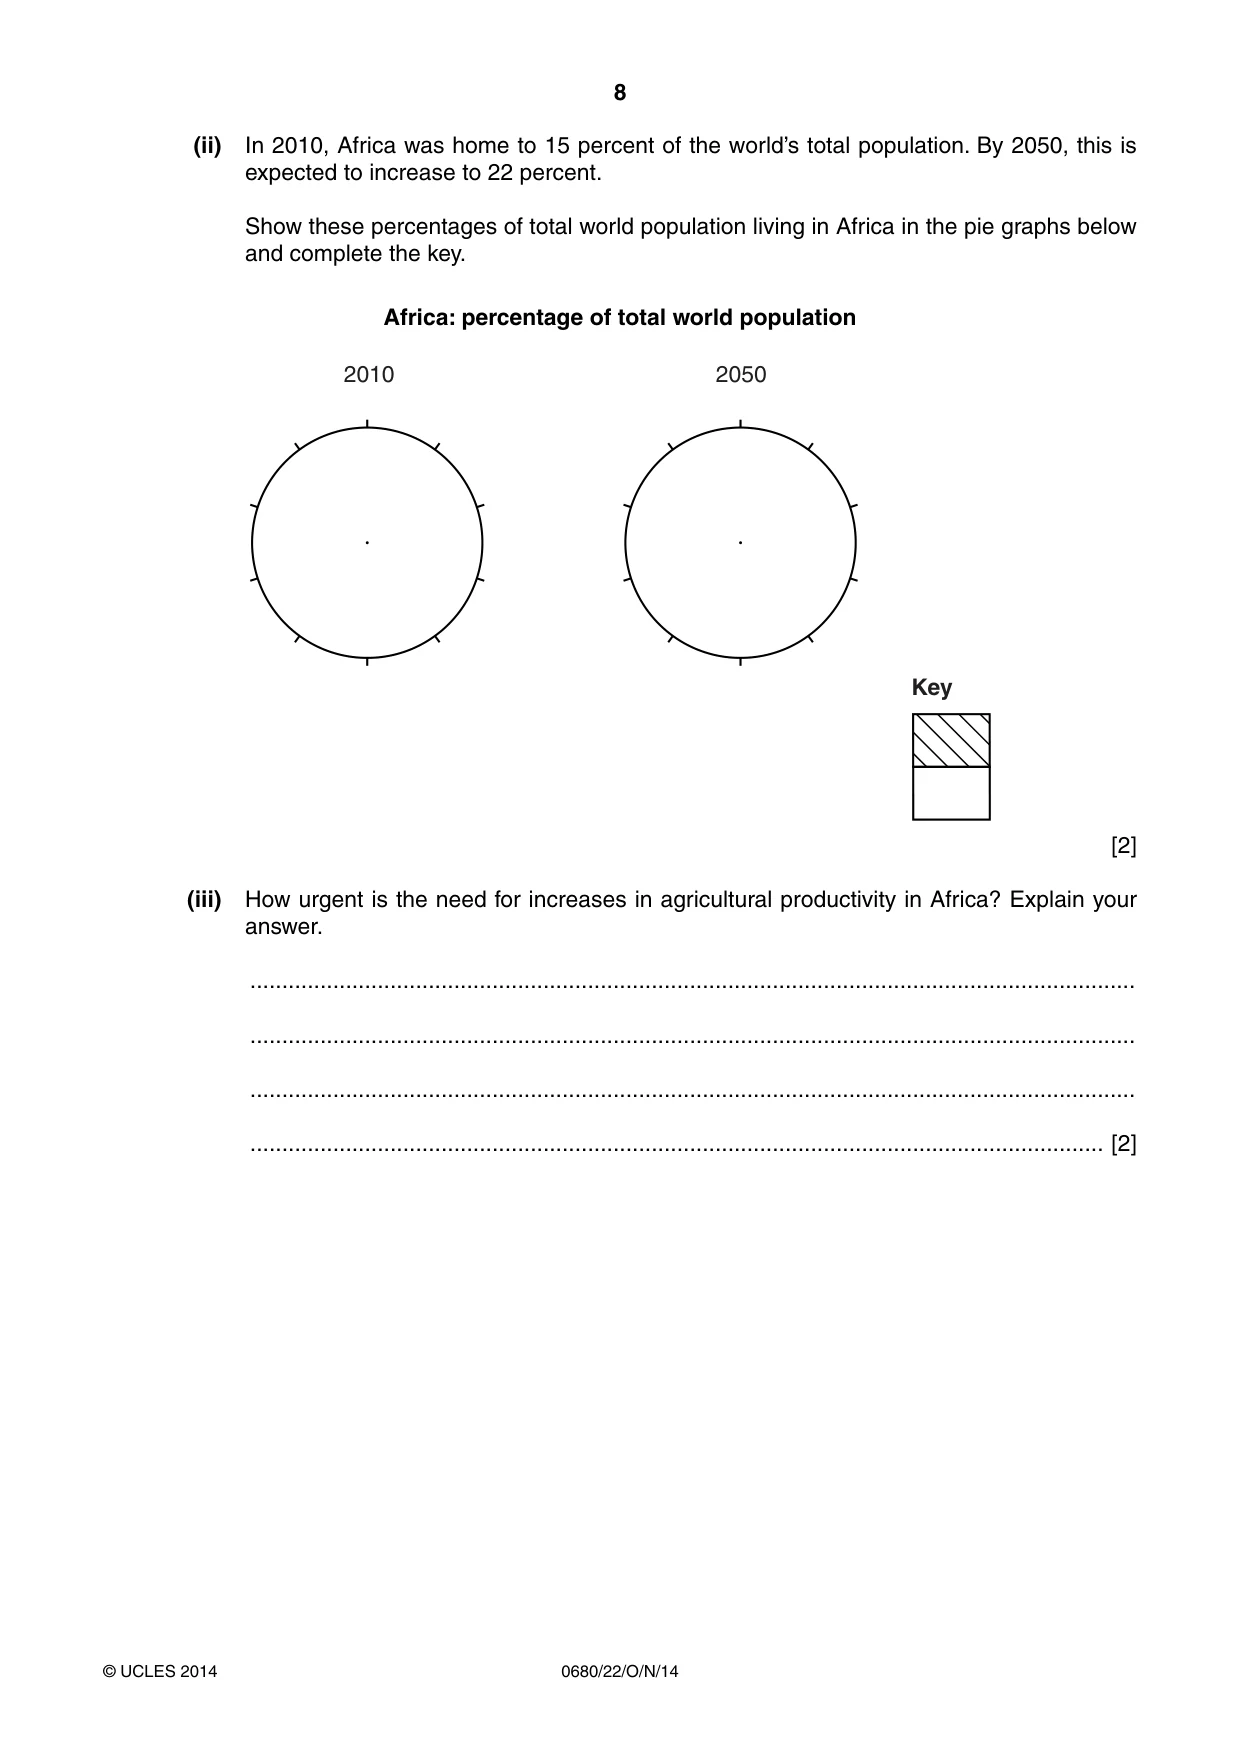
8 0680/22/O/N/14 © UCLES 2014 (ii) In 2010, Africa was home to 15 percent of the world’s total population. By 2050, this is expected to increase to 22 percent. Show these percentages of total world population living in Africa in the pie graphs below and complete the key. Africa: percentage of total world population 2010 2050 Key [2] (iii) How urgent is the need for increases in agricultural productivity in Africa? Explain your answer. … … … … [2]
Question paper, page 9
9 0680/22/O/N/14 © UCLES 2014 [Turn over (iv) Suggest reasons why the agricultural inventions since 1950, shown in the timeline in (b)(iv), have not led to a big increase in crop yields in all continents and countries. … … … … … … … … [4] [Total: 40]
Question paper, page 10
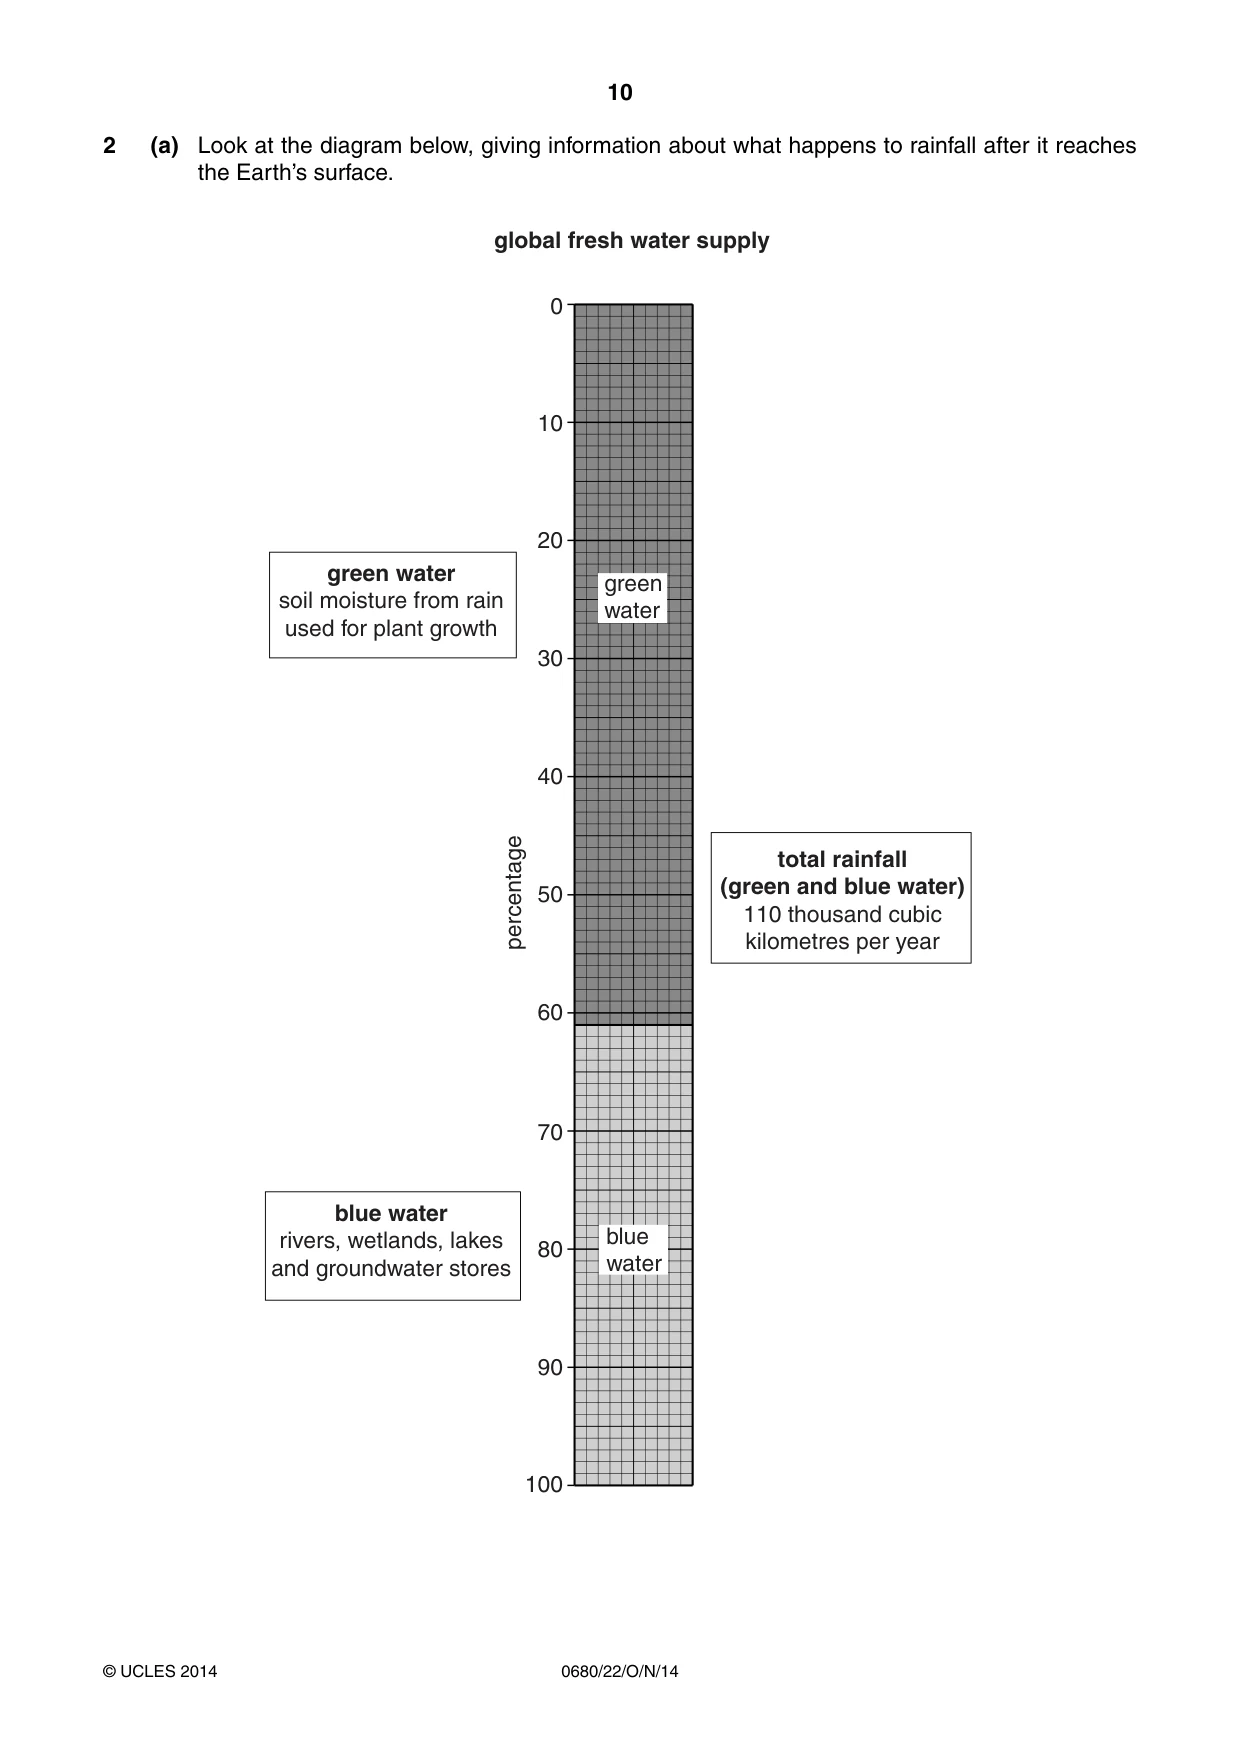
10 0680/22/O/N/14 © UCLES 2014 2 (a) Look at the diagram below, giving information about what happens to rainfall after it reaches the Earth’s surface. 0 100 90 80 70 60 percentage 40 30 20 10 50 global fresh water supply green water soil moisture from rain used for plant growth blue water rivers, wetlands, lakes and groundwater stores green water blue water total rainfall (green and blue water) 110 thousand cubic kilometres per year
Question paper, page 11
11 0680/22/O/N/14 © UCLES 2014 [Turn over (i) State the percentage ratio between green and blue water from rainfall. green water : blue water …% : …% [1] (ii) Explain the difference between green water and blue water. … … … [2]
Question paper, page 12
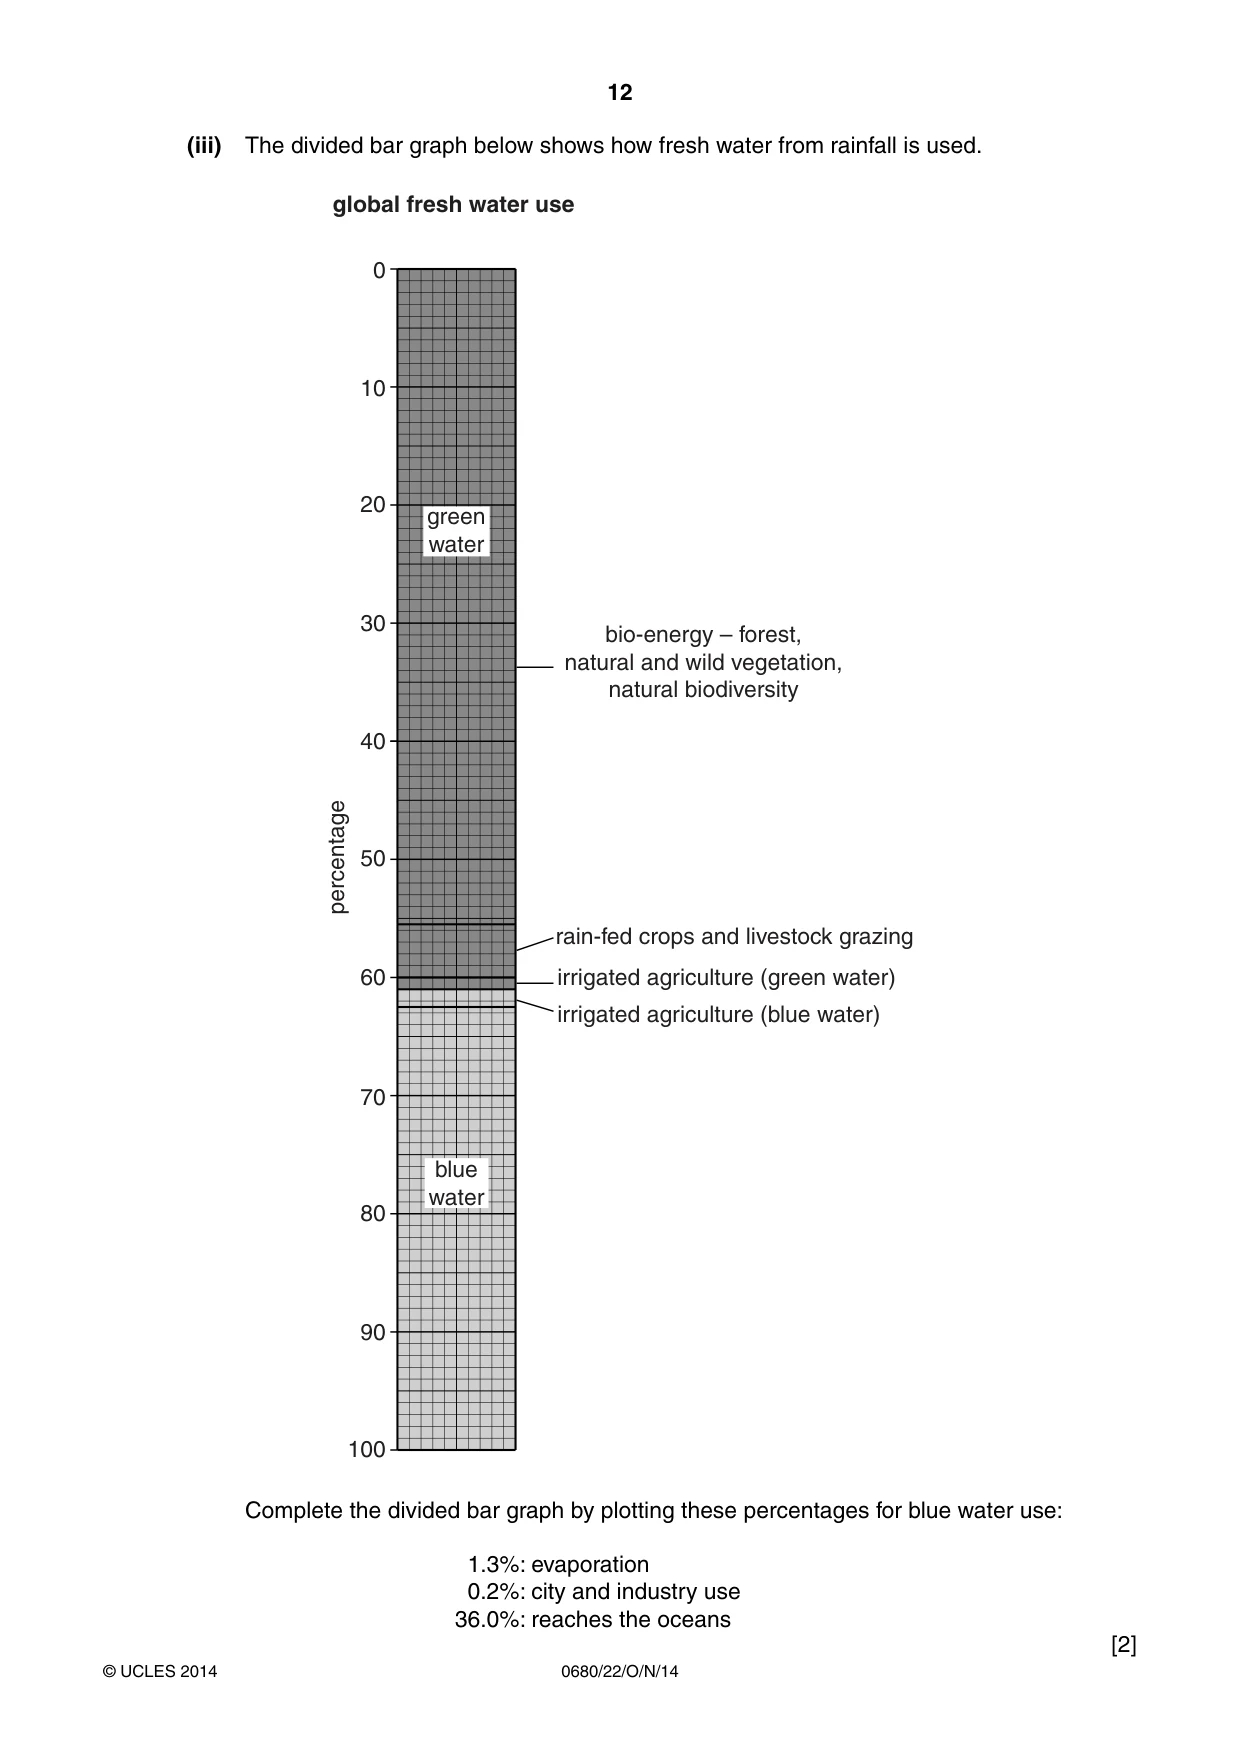
12 0680/22/O/N/14 © UCLES 2014 (iii) The divided bar graph below shows how fresh water from rainfall is used. 0 100 global fresh water use bio-energy – forest, natural and wild vegetation, natural biodiversity rain-fed crops and livestock grazing irrigated agriculture (green water) irrigated agriculture (blue water) green water blue water 90 80 70 60 percentage 40 30 20 10 50 Complete the divided bar graph by plotting these percentages for blue water use: 1.3%: evaporation 0.2%: city and industry use 36.0%: reaches the oceans [2]
Question paper, page 13
13 0680/22/O/N/14 © UCLES 2014 [Turn over (iv) What is the percentage of total rainfall that is used in farming? Show your working. … … … [1] (v) Explain why irrigated agriculture includes water described as both green and blue. … … [1] (vi) How useful and important to humans is the 56% of rainwater used for bio-energy (natural plant growth)? Explain your answer as fully as you can. … … … … … … … … [4]
Question paper, page 14
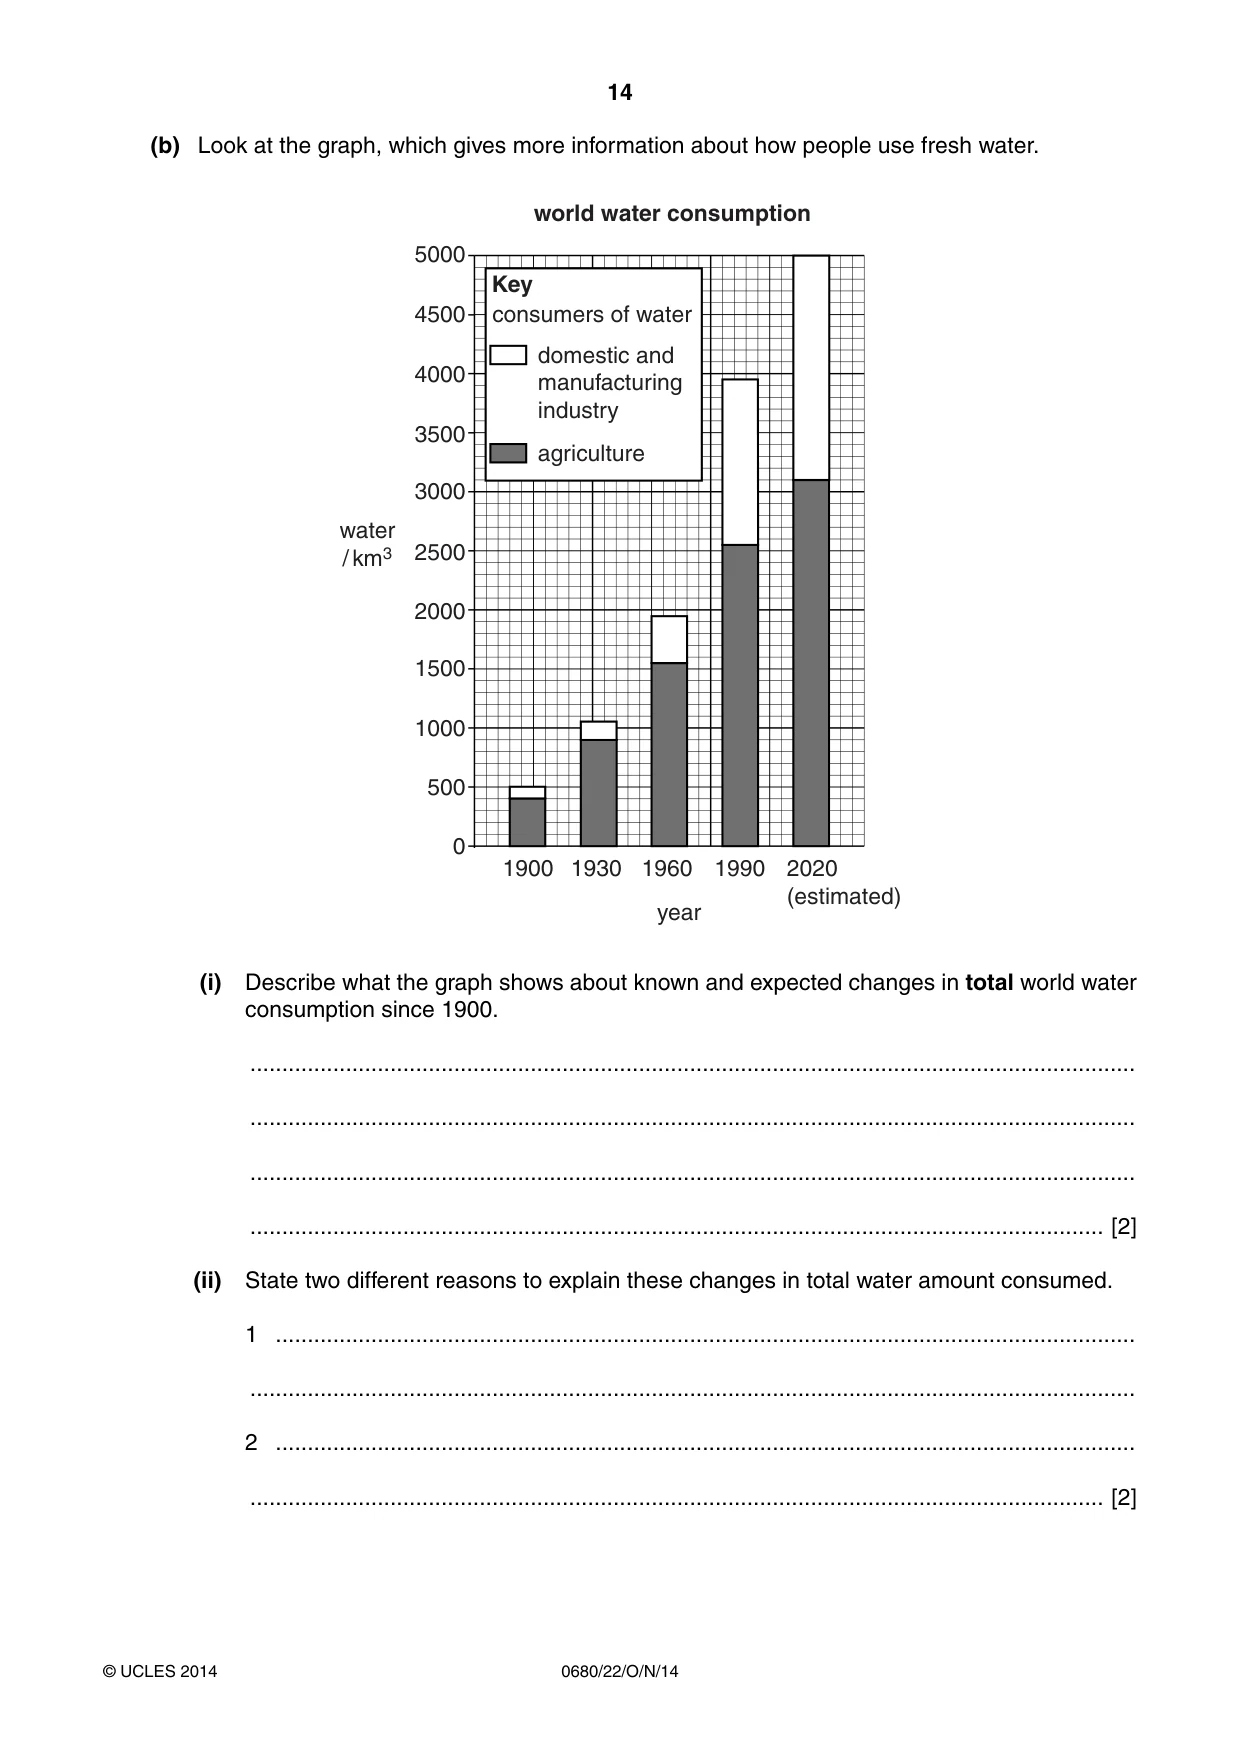
14 0680/22/O/N/14 © UCLES 2014 (b) Look at the graph, which gives more information about how people use fresh water. 0 500 1000 1500 2000 2500 3000 3500 4000 4500 5000 1900 1930 1960 1990 2020 (estimated) domestic and manufacturing industry agriculture Key consumers of water year water / km3 world water consumption (i) Describe what the graph shows about known and expected changes in total world water consumption since 1900. … … … … [2] (ii) State two different reasons to explain these changes in total water amount consumed. 1 … … 2 … … [2]
Question paper, page 15
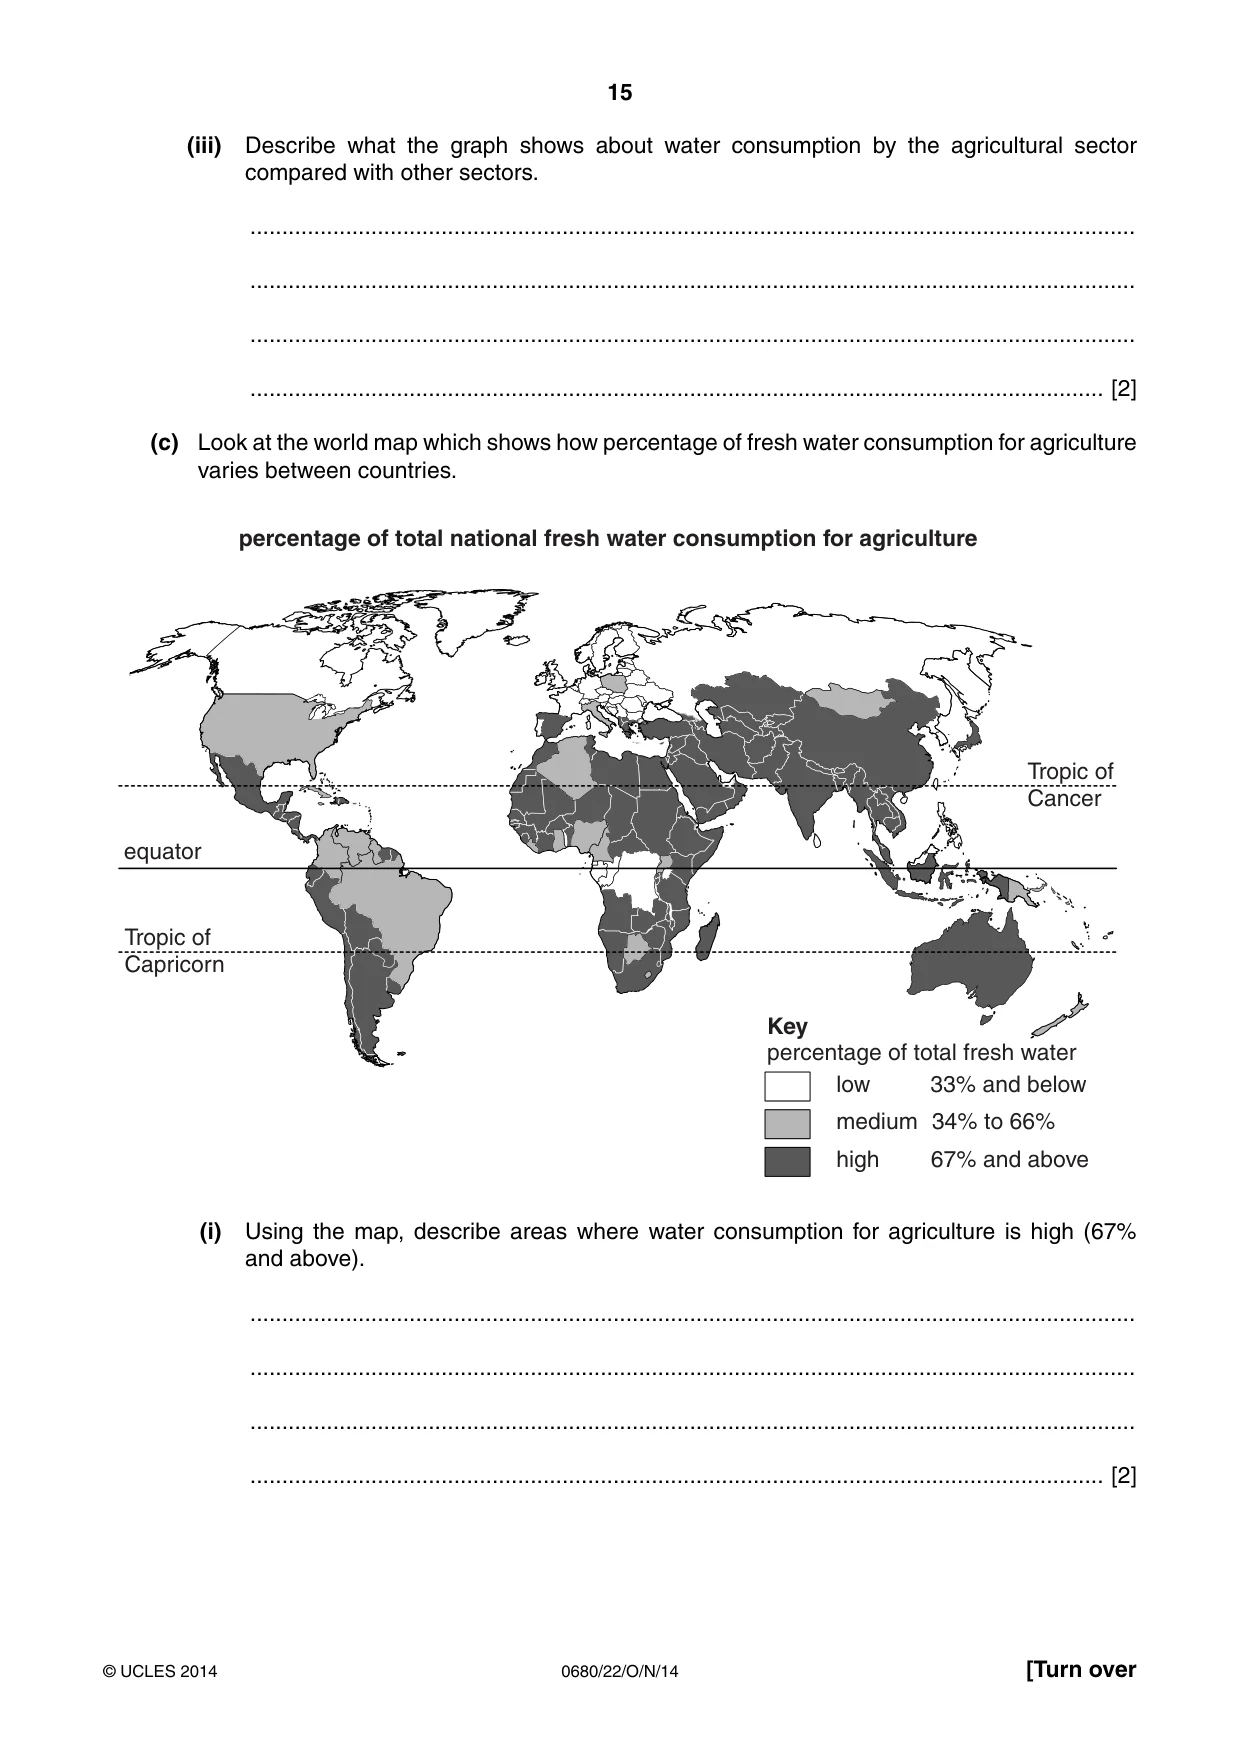
15 0680/22/O/N/14 © UCLES 2014 [Turn over (iii) Describe what the graph shows about water consumption by the agricultural sector compared with other sectors. … … … … [2] (c) Look at the world map which shows how percentage of fresh water consumption for agriculture varies between countries. equator 33% and below 67% and above 34% to 66% percentage of total fresh water Key Tropic of Capricorn Tropic of Cancer percentage of total national fresh water consumption for agriculture low medium high (i) Using the map, describe areas where water consumption for agriculture is high (67% and above). … … … … [2]
Question paper, page 16
16 0680/22/O/N/14 © UCLES 2014 (ii) Using the map on page 15, describe areas where water consumption for agriculture is low (33% and below). … … … … [3] (iii) Suggest reasons for these large variations for water consumption in agriculture. Refer to two countries or areas, one with high use and one with low use, to illustrate your answer. … … … … … … … … [4] (d) (i) It is estimated that about 20 percent of the world’s irrigated land is affected by salinisation. Explain how salinisation occurs. … … … … … … [3] (ii) Explain how the use of irrigation water can be better managed to reduce the risk of salinisation occurring. … … … … [2]
Question paper, page 17
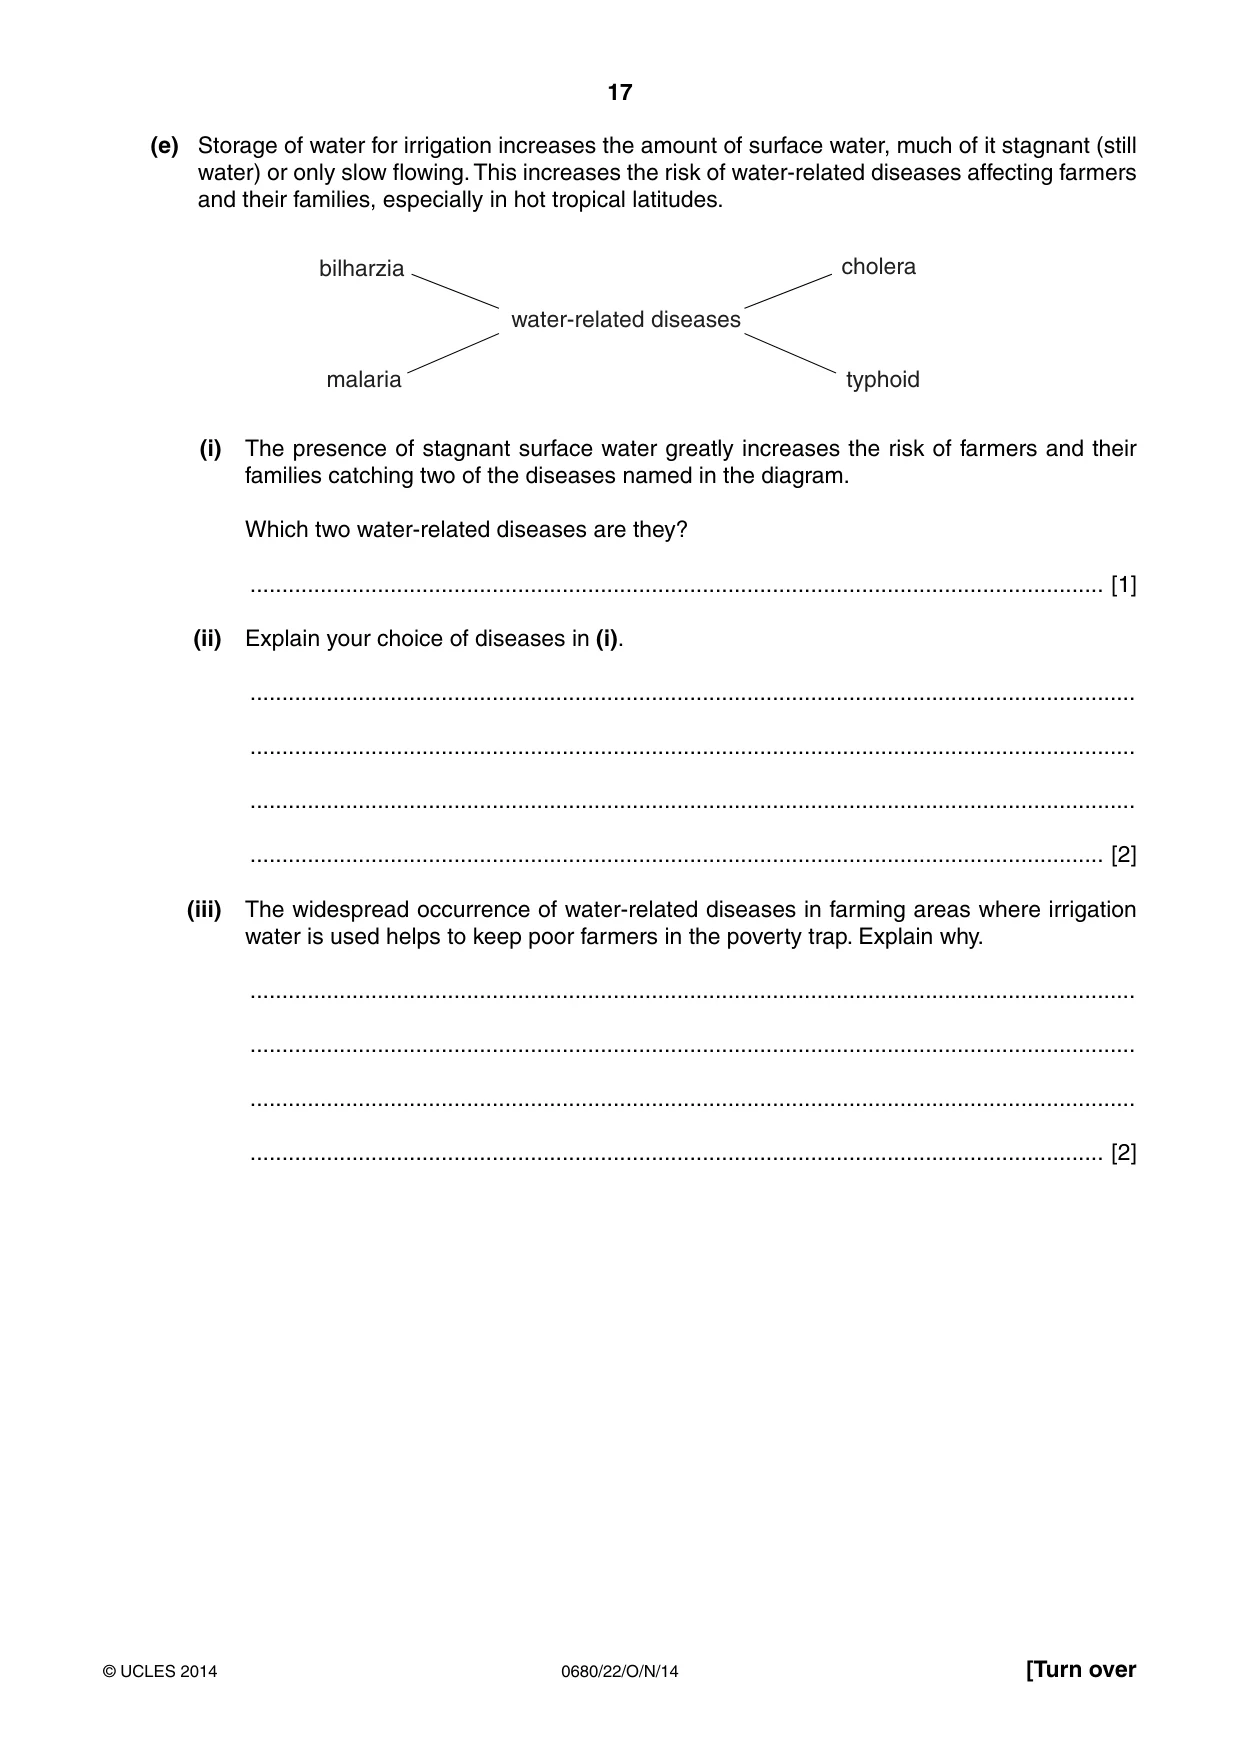
17 0680/22/O/N/14 © UCLES 2014 [Turn over (e) Storage of water for irrigation increases the amount of surface water, much of it stagnant (still water) or only slow flowing. This increases the risk of water-related diseases affecting farmers and their families, especially in hot tropical latitudes. water-related diseases bilharzia cholera malaria typhoid (i) The presence of stagnant surface water greatly increases the risk of farmers and their families catching two of the diseases named in the diagram. Which two water-related diseases are they? … [1] (ii) Explain your choice of diseases in (i). … … … … [2] (iii) The widespread occurrence of water-related diseases in farming areas where irrigation water is used helps to keep poor farmers in the poverty trap. Explain why. … … … … [2]
Question paper, page 18
18 0680/22/O/N/14 © UCLES 2014 (iv) Would you say that the occurrence of water-related diseases is the most important factor keeping many farmers in developing countries in the poverty trap, or do you consider other factors to be more important? Give and explain your view on this. … … … … … … … … [4] [Total: 40]
Question paper, page 19
19 0680/22/O/N/14 © UCLES 2014 BLANK PAGE
Question paper, page 20
20 0680/22/O/N/14 © UCLES 2014 BLANK PAGE Copyright Acknowledgements: Question 1 © G B Redmore; Under the Southern Cross; John Murray; 1973. Permission to reproduce items where third-party owned material protected by copyright is included has been sought and cleared where possible. Every reasonable effort has been made by the publisher (UCLES) to trace copyright holders, but if any items requiring clearance have unwittingly been included, the publisher will be pleased to make amends at the earliest possible opportunity. Cambridge International Examinations is part of the Cambridge Assessment Group. Cambridge Assessment is the brand name of University of Cambridge Local Examinations Syndicate (UCLES), which is itself a department of the University of Cambridge.
Mark scheme, page 1
® IGCSE is the registered trademark of Cambridge International Examinations. CAMBRIDGE INTERNATIONAL EXAMINATIONS Cambridge International General Certificate of Secondary Education MARK SCHEME for the October/November 2014 series 0680 ENVIRONMENTAL MANAGEMENT 0680/22 Paper 2, maximum raw mark 80 This mark scheme is published as an aid to teachers and candidates, to indicate the requirements of the examination. It shows the basis on which Examiners were instructed to award marks. It does not indicate the details of the discussions that took place at an Examiners’ meeting before marking began, which would have considered the acceptability of alternative answers. Mark schemes should be read in conjunction with the question paper and the Principal Examiner Report for Teachers. Cambridge will not enter into discussions about these mark schemes. Cambridge is publishing the mark schemes for the October/November 2014 series for most Cambridge IGCSE®, Cambridge International A and AS Level components and some Cambridge O Level components.
Mark scheme, page 2
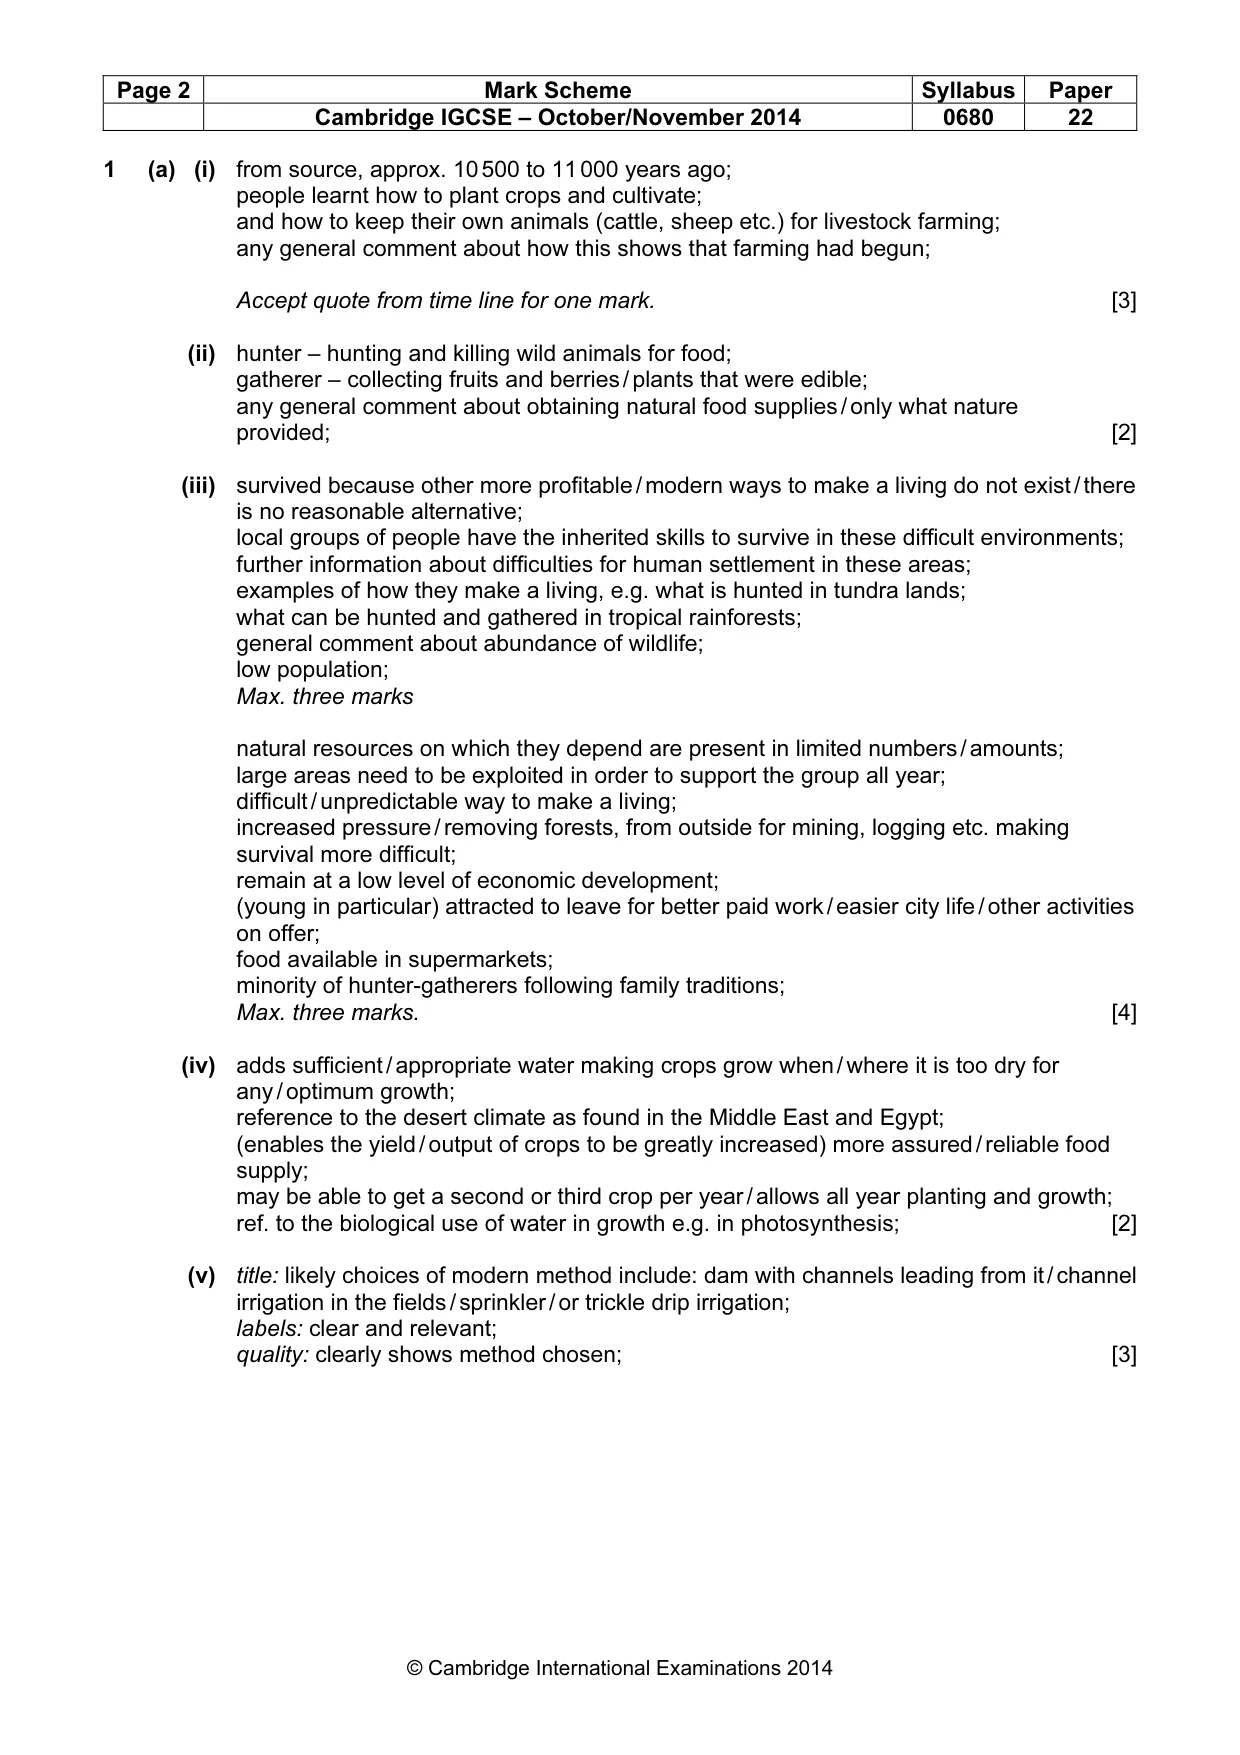
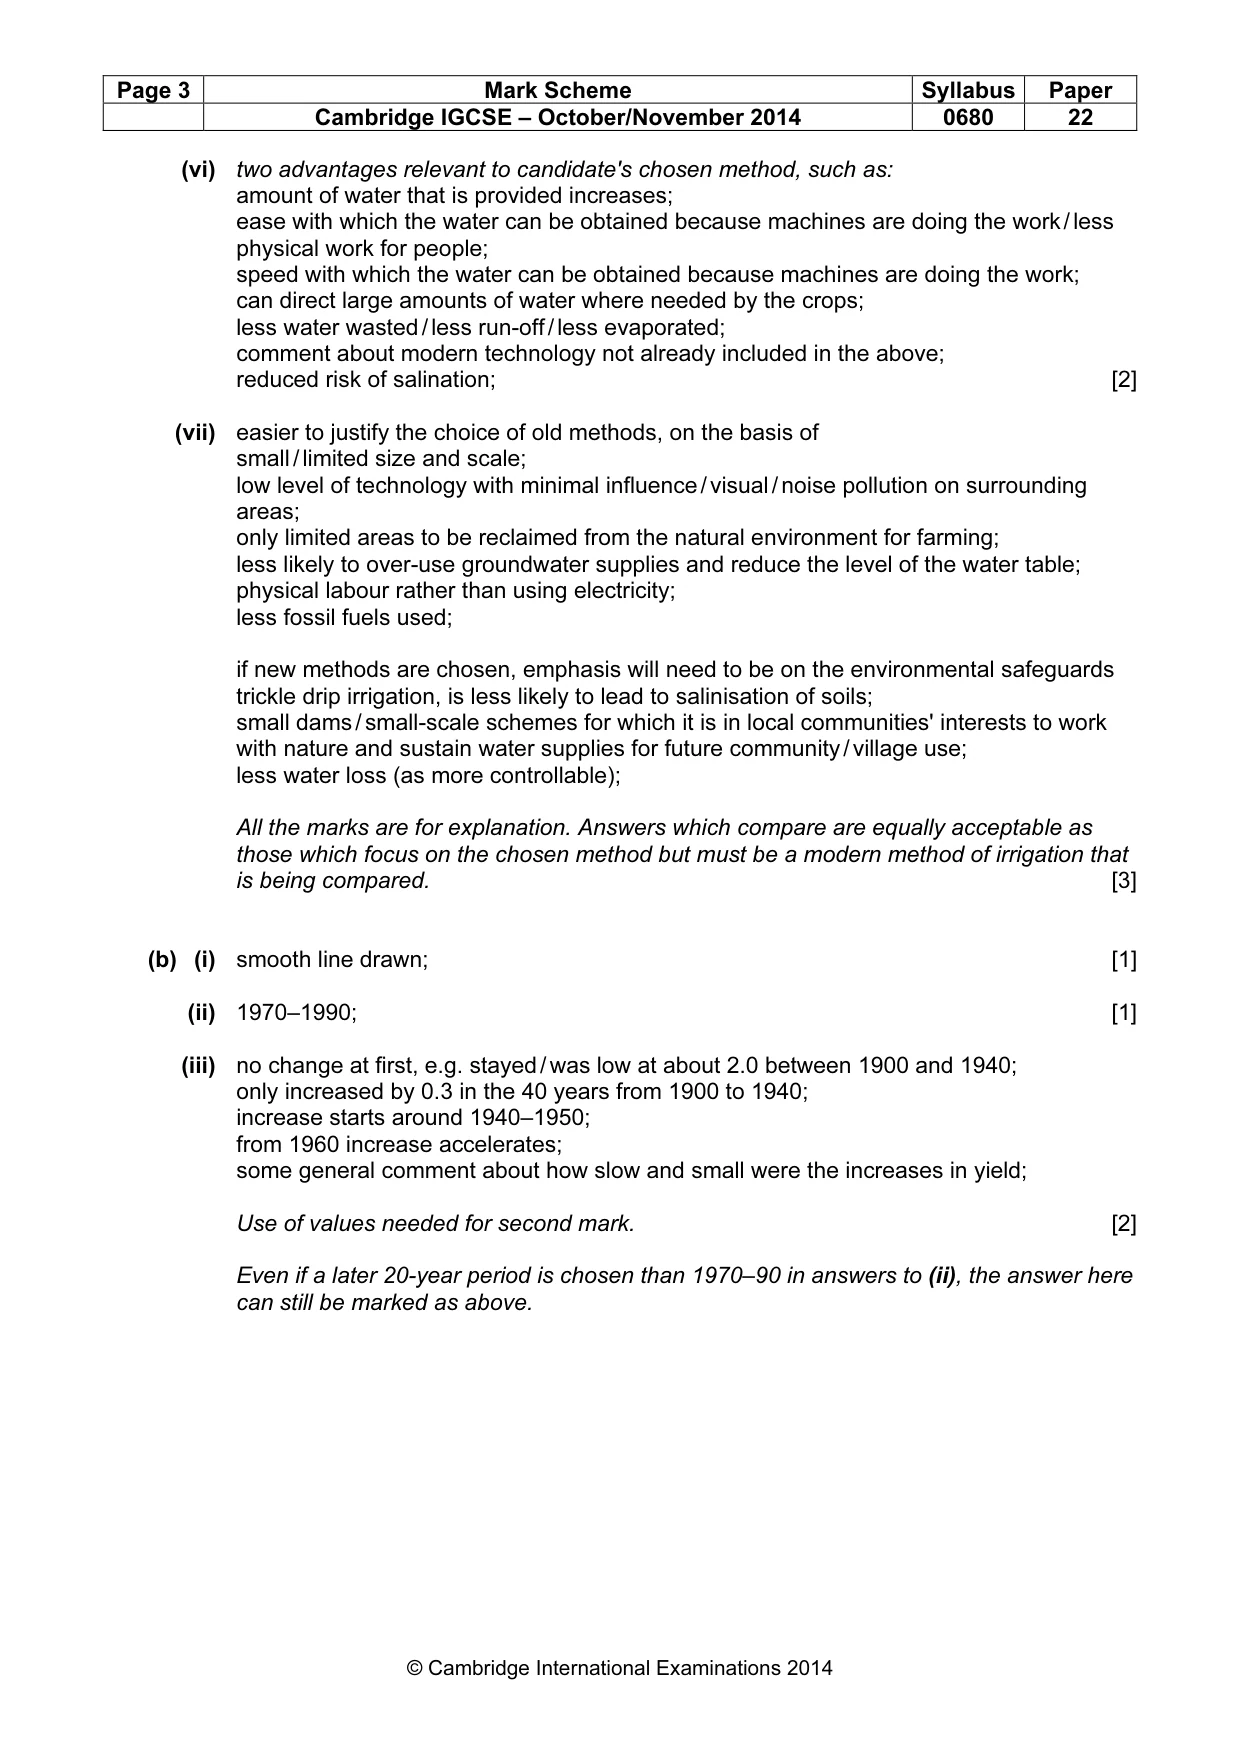
Page 2 Mark Scheme Syllabus Paper Cambridge IGCSE – October/November 2014 0680 22 © Cambridge International Examinations 2014 1 (a) (i) from source, approx. 10 500 to 11 000 years ago; people learnt how to plant crops and cultivate; and how to keep their own animals (cattle, sheep etc.) for livestock farming; any general comment about how this shows that farming had begun; Accept quote from time line for one mark. [3] (ii) hunter – hunting and killing wild animals for food; gatherer – collecting fruits and berries / plants that were edible; any general comment about obtaining natural food supplies / only what nature provided; [2] (iii) survived because other more profitable / modern ways to make a living do not exist / there is no reasonable alternative; local groups of people have the inherited skills to survive in these difficult environments; further information about difficulties for human settlement in these areas; examples of how they make a living, e.g. what is hunted in tundra lands; what can be hunted and gathered in tropical rainforests; general comment about abundance of wildlife; low population; Max. three marks natural resources on which they depend are present in limited numbers / amounts; large areas need to be exploited in order to support the group all year; difficult / unpredictable way to make a living; increased pressure / removing forests, from outside for mining, logging etc. making survival more difficult; remain at a low level of economic development; (young in particular) attracted to leave for better paid work / easier city life / other activities on offer; food available in supermarkets; minority of hunter-gatherers following family traditions; Max. three marks. [4] (iv) adds sufficient / appropriate water making crops grow when / where it is too dry for any / optimum growth; reference to the desert climate as found in the Middle East and Egypt; (enables the yield / output of crops to be greatly increased) more assured / reliable food supply; may be able to get a second or third crop per year / allows all year planting and growth; ref. to the biological use of water in growth e.g. in photosynthesis; [2] (v) title: likely choices of modern method include: dam with channels leading from it / channel irrigation in the fields / sprinkler / or trickle drip irrigation; labels: clear and relevant; quality: clearly shows method chosen; [3]
Mark scheme, page 3
Page 3 Mark Scheme Syllabus Paper Cambridge IGCSE – October/November 2014 0680 22 © Cambridge International Examinations 2014 (vi) two advantages relevant to candidate's chosen method, such as: amount of water that is provided increases; ease with which the water can be obtained because machines are doing the work / less physical work for people; speed with which the water can be obtained because machines are doing the work; can direct large amounts of water where needed by the crops; less water wasted / less run-off / less evaporated; comment about modern technology not already included in the above; reduced risk of salination; [2] (vii) easier to justify the choice of old methods, on the basis of small / limited size and scale; low level of technology with minimal influence / visual / noise pollution on surrounding areas; only limited areas to be reclaimed from the natural environment for farming; less likely to over-use groundwater supplies and reduce the level of the water table; physical labour rather than using electricity; less fossil fuels used; if new methods are chosen, emphasis will need to be on the environmental safeguards trickle drip irrigation, is less likely to lead to salinisation of soils; small dams / small-scale schemes for which it is in local communities' interests to work with nature and sustain water supplies for future community / village use; less water loss (as more controllable); All the marks are for explanation. Answers which compare are equally acceptable as those which focus on the chosen method but must be a modern method of irrigation that is being compared. [3] (b) (i) smooth line drawn; [1] (ii) 1970–1990; [1] (iii) no change at first, e.g. stayed / was low at about 2.0 between 1900 and 1940; only increased by 0.3 in the 40 years from 1900 to 1940; increase starts around 1940–1950; from 1960 increase accelerates; some general comment about how slow and small were the increases in yield; Use of values needed for second mark. [2] Even if a later 20-year period is chosen than 1970–90 in answers to (ii), the answer here can still be marked as above.
Mark scheme, page 4
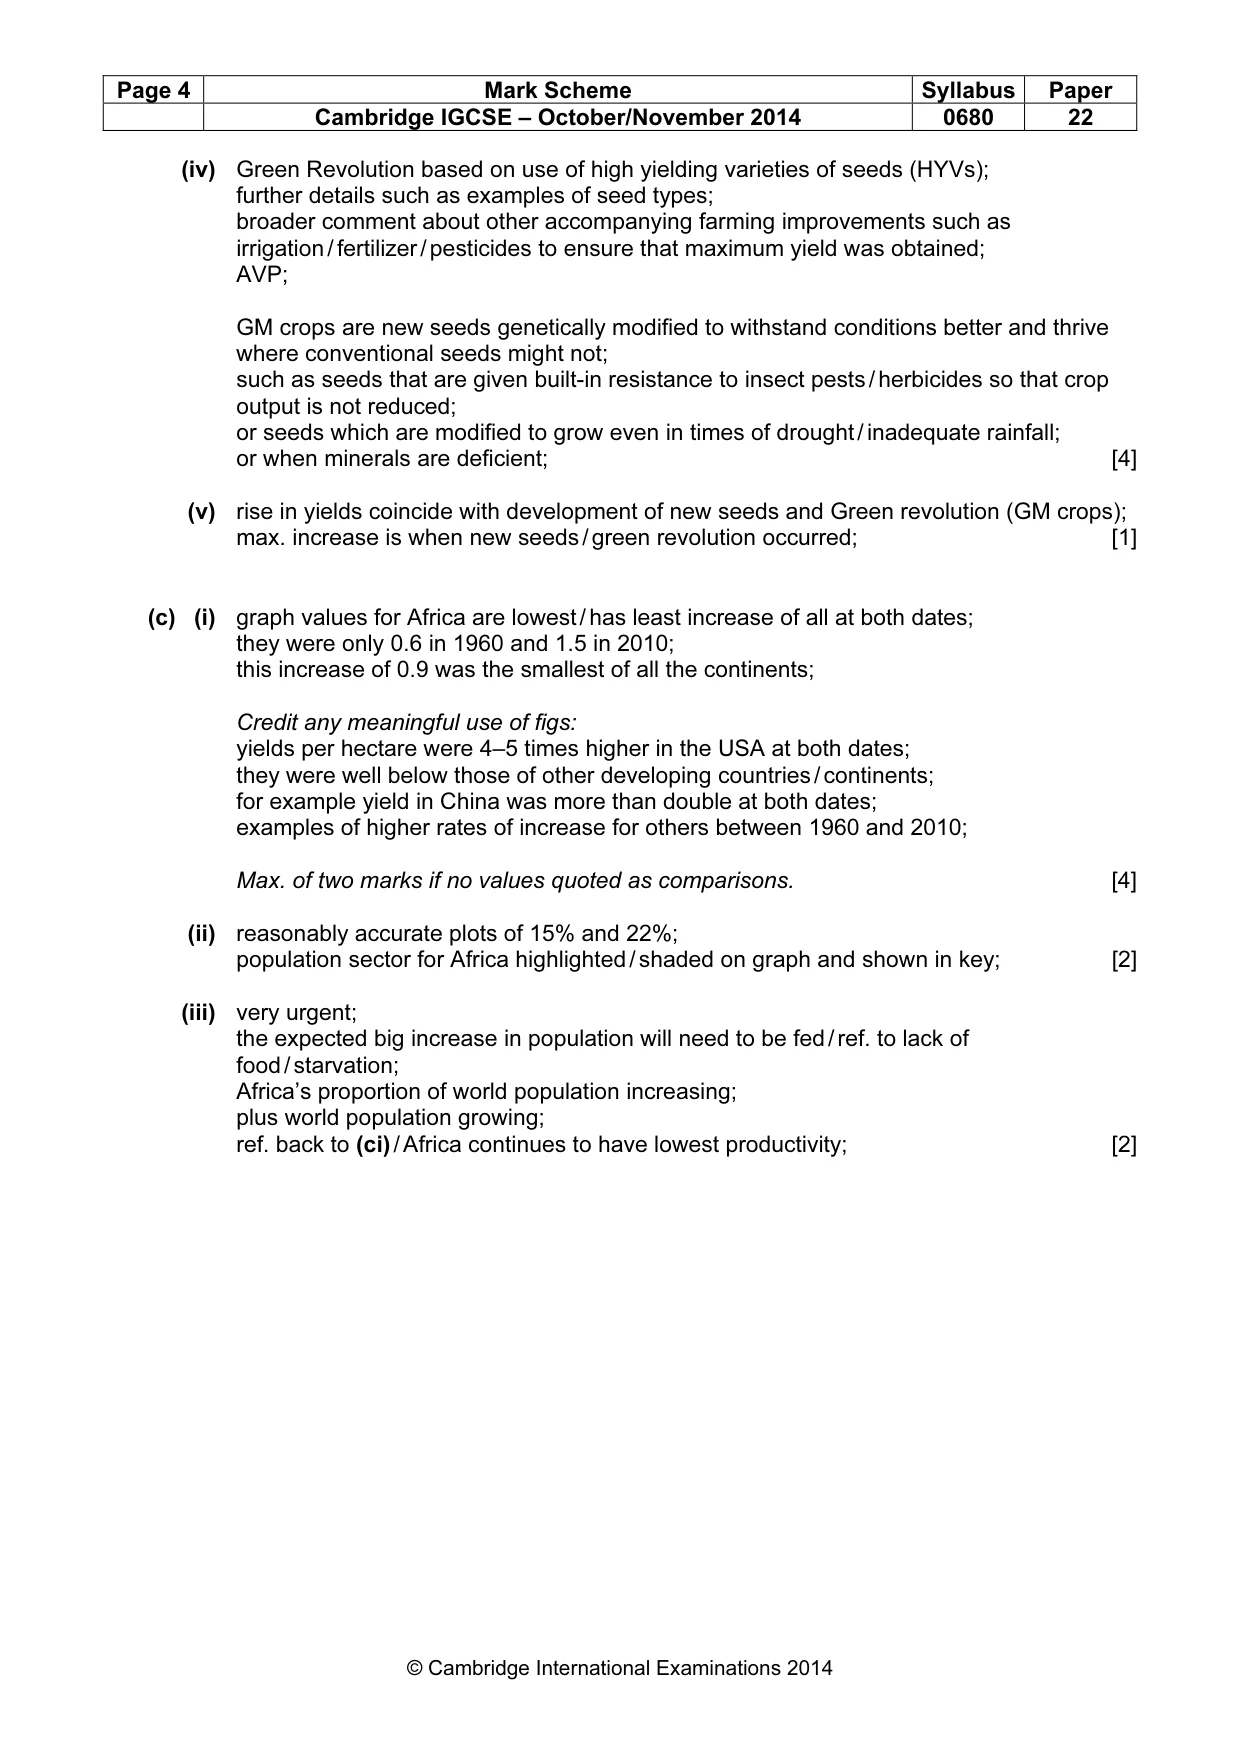
Page 4 Mark Scheme Syllabus Paper Cambridge IGCSE – October/November 2014 0680 22 © Cambridge International Examinations 2014 (iv) Green Revolution based on use of high yielding varieties of seeds (HYVs); further details such as examples of seed types; broader comment about other accompanying farming improvements such as irrigation / fertilizer / pesticides to ensure that maximum yield was obtained; AVP; GM crops are new seeds genetically modified to withstand conditions better and thrive where conventional seeds might not; such as seeds that are given built-in resistance to insect pests / herbicides so that crop output is not reduced; or seeds which are modified to grow even in times of drought / inadequate rainfall; or when minerals are deficient; [4] (v) rise in yields coincide with development of new seeds and Green revolution (GM crops); max. increase is when new seeds / green revolution occurred; [1] (c) (i) graph values for Africa are lowest / has least increase of all at both dates; they were only 0.6 in 1960 and 1.5 in 2010; this increase of 0.9 was the smallest of all the continents; Credit any meaningful use of figs: yields per hectare were 4–5 times higher in the USA at both dates; they were well below those of other developing countries / continents; for example yield in China was more than double at both dates; examples of higher rates of increase for others between 1960 and 2010; Max. of two marks if no values quoted as comparisons. [4] (ii) reasonably accurate plots of 15% and 22%; population sector for Africa highlighted / shaded on graph and shown in key; [2] (iii) very urgent; the expected big increase in population will need to be fed / ref. to lack of food / starvation; Africa’s proportion of world population increasing; plus world population growing; ref. back to (ci) / Africa continues to have lowest productivity; [2]
Mark scheme, page 5
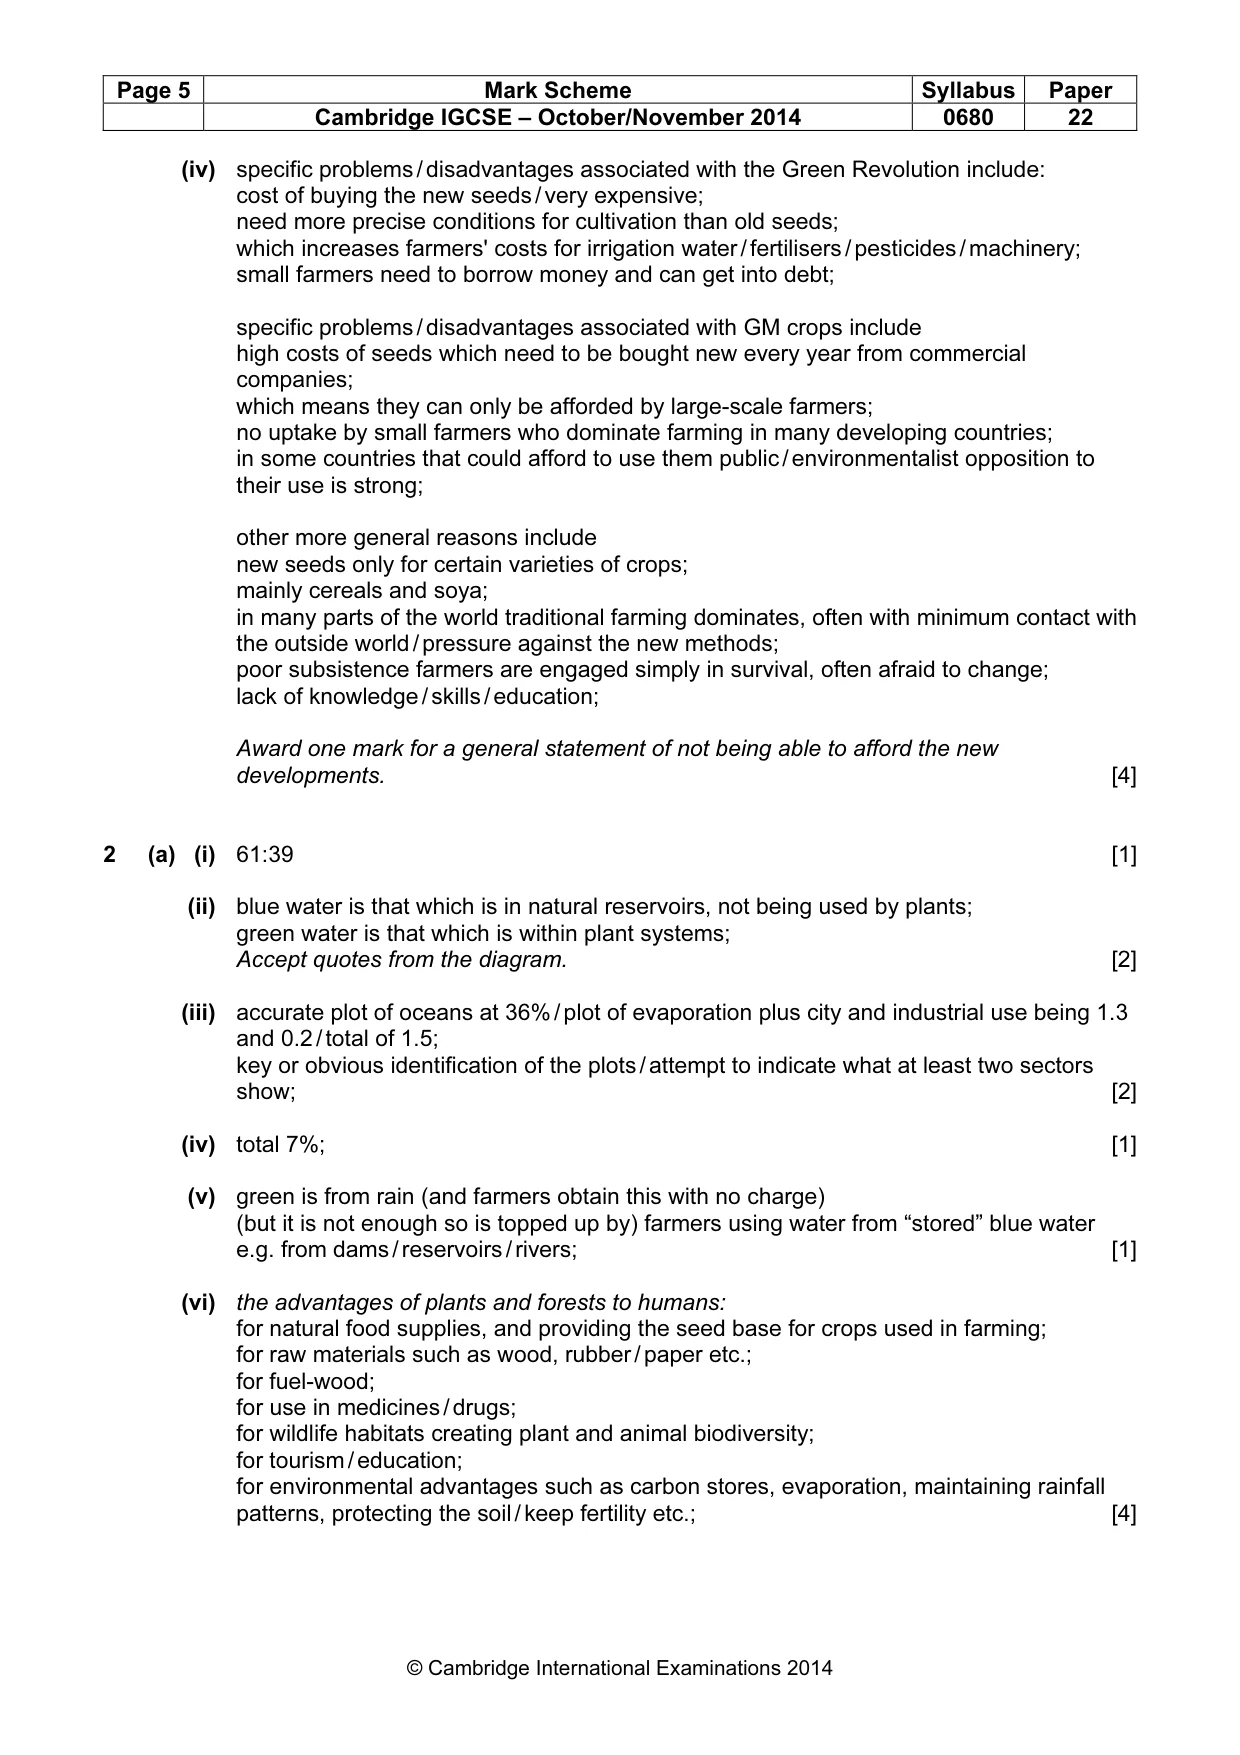
Page 5 Mark Scheme Syllabus Paper Cambridge IGCSE – October/November 2014 0680 22 © Cambridge International Examinations 2014 (iv) specific problems / disadvantages associated with the Green Revolution include: cost of buying the new seeds / very expensive; need more precise conditions for cultivation than old seeds; which increases farmers' costs for irrigation water / fertilisers / pesticides / machinery; small farmers need to borrow money and can get into debt; specific problems / disadvantages associated with GM crops include high costs of seeds which need to be bought new every year from commercial companies; which means they can only be afforded by large-scale farmers; no uptake by small farmers who dominate farming in many developing countries; in some countries that could afford to use them public / environmentalist opposition to their use is strong; other more general reasons include new seeds only for certain varieties of crops; mainly cereals and soya; in many parts of the world traditional farming dominates, often with minimum contact with the outside world / pressure against the new methods; poor subsistence farmers are engaged simply in survival, often afraid to change; lack of knowledge / skills / education; Award one mark for a general statement of not being able to afford the new developments. [4] 2 (a) (i) 61:39 [1] (ii) blue water is that which is in natural reservoirs, not being used by plants; green water is that which is within plant systems; Accept quotes from the diagram. [2] (iii) accurate plot of oceans at 36% / plot of evaporation plus city and industrial use being 1.3 and 0.2 / total of 1.5; key or obvious identification of the plots / attempt to indicate what at least two sectors show; [2] (iv) total 7%; [1] (v) green is from rain (and farmers obtain this with no charge) (but it is not enough so is topped up by) farmers using water from “stored” blue water e.g. from dams / reservoirs / rivers; [1] (vi) the advantages of plants and forests to humans: for natural food supplies, and providing the seed base for crops used in farming; for raw materials such as wood, rubber / paper etc.; for fuel-wood; for use in medicines / drugs; for wildlife habitats creating plant and animal biodiversity; for tourism / education; for environmental advantages such as carbon stores, evaporation, maintaining rainfall patterns, protecting the soil / keep fertility etc.; [4]
Mark scheme, page 6
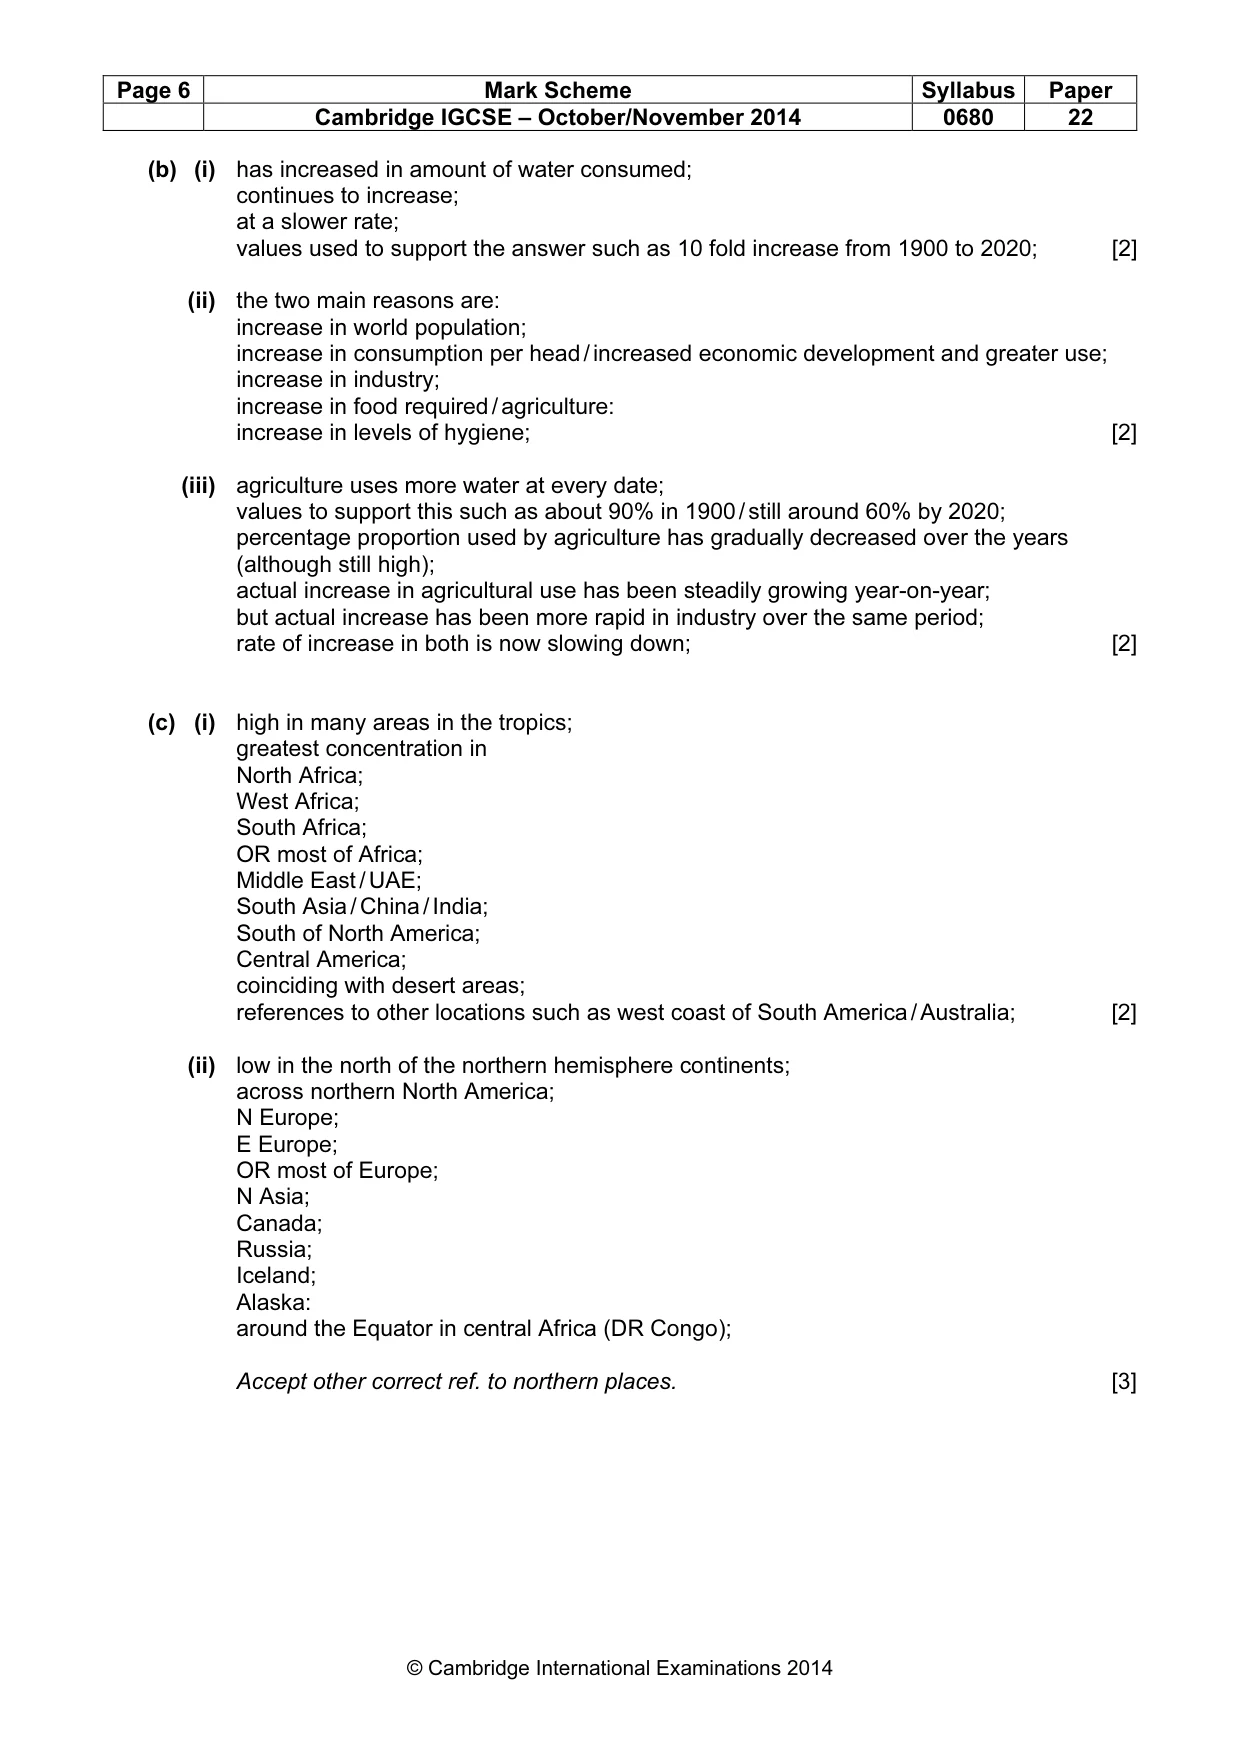
Page 6 Mark Scheme Syllabus Paper Cambridge IGCSE – October/November 2014 0680 22 © Cambridge International Examinations 2014 (b) (i) has increased in amount of water consumed; continues to increase; at a slower rate; values used to support the answer such as 10 fold increase from 1900 to 2020; [2] (ii) the two main reasons are: increase in world population; increase in consumption per head / increased economic development and greater use; increase in industry; increase in food required / agriculture: increase in levels of hygiene; [2] (iii) agriculture uses more water at every date; values to support this such as about 90% in 1900 / still around 60% by 2020; percentage proportion used by agriculture has gradually decreased over the years (although still high); actual increase in agricultural use has been steadily growing year-on-year; but actual increase has been more rapid in industry over the same period; rate of increase in both is now slowing down; [2] (c) (i) high in many areas in the tropics; greatest concentration in North Africa; West Africa; South Africa; OR most of Africa; Middle East / UAE; South Asia / China / India; South of North America; Central America; coinciding with desert areas; references to other locations such as west coast of South America / Australia; [2] (ii) low in the north of the northern hemisphere continents; across northern North America; N Europe; E Europe; OR most of Europe; N Asia; Canada; Russia; Iceland; Alaska: around the Equator in central Africa (DR Congo); Accept other correct ref. to northern places. [3]
Mark scheme, page 7
Page 7 Mark Scheme Syllabus Paper Cambridge IGCSE – October/November 2014 0680 22 © Cambridge International Examinations 2014 (iii) the main reason is climate; either deserts (dry all year) or climates with a dry season such as savanna; in the tropics hot temperatures lead to high rates of evaporation; also temperatures are high enough for crops to be grown all year in the tropics, provided that water is available; type of crop grown, e.g. rice; GM drought resistant crops grown; method of growing crop e.g. hydroponics; (Vice versa for temperate latitudes, N Russia / N Canada / Alaska, especially tundra where climate stops farming taking place, thus no need for water for agriculture) ref. to developing countries operating an agro-economy; likely areas of choice – home areas in India / Pakistan / Middle East for high water use / or more generally Sahara / Sahel; somewhere in tundra lands for low water use; Two marks for references to climate and related reasons. Two marks for references to areas to illustrate reasons. [4] (d) (i) irrigation water in large concentrations on the surface; evaporation leaves salts behind in the soil; further evaporation of moisture draws salts up to surface; leads to the formation of a hard salt crust on the surface; salt concentrates around plant roots; [3] (ii) strategies target the amount needed by the plant (e.g. controlled water use with sprinklers instead of open channel irrigation); supplying the water directly to plants and plant roots instead of the land around them (e.g. as in trickle drip irrigation); right time of day, e.g. sun rise and sun set; porous pot use explained; One method well explained or two with minimal explanation for two marks. [2] (e) (i) bilharzia and malaria; [1] (ii) biharzia: snail lives in still water (larvae grow and multiply inside the snail) / enters through the soles of the feet of people working in irrigated fields; malaria: stagnant waters are breeding grounds for mosquitoes / larva pupates here; [2] (iii) people are regularly / semi-permanently ill; which means that their capacity for working is reduced (reducing family income / food supply); cost of treatment is expensive; [2]
Mark scheme, page 8
Page 8 Mark Scheme Syllabus Paper Cambridge IGCSE – October/November 2014 0680 22 © Cambridge International Examinations 2014 (iv) water-related is most important factor: water-related diseases such as malaria never properly goes away once it is in the bloodstream; people keep suffering from bouts of fever; so cannot work long term; more child deaths; which encourages people in rural areas to keep on having more children / larger families so that some will survive; other factors: landlessness; land held in big estates and by big companies, especially the best farmland, small producers exploited; pressure on the land leading to over-cultivation and soil erosion; expense of obtaining irrigation water to increase output; too poor to invest in new seeds / fertilisers / machinery etc.; earning potential is low in farming; high cost of living, e.g. education, food, housing costs, sanitation; Max. of two marks if no ref. to the factor being most important. [4] [Total: 80]
What you needed in this session
Cambridge’s own grade thresholds for 2014 Oct/Nov, Paper 2 · Variant 2. A higher threshold means an easier paper — the bar moves with how the cohort did.