Cambridge IGCSE Environmental Management 0680 — 2014 Oct/Nov Paper 2 · Variant 1
0680/21/O/N/14 · 80 marks · ≈90 min
The question paper and its mark scheme, free to read here and free to download. This is Cambridge’s own paper, exactly as it was sat.
Question paper16 pages


Mark scheme8 pages
Answers below. Sit the paper first if you are practising.

Paper as text
Question paper, page 1
This document consists of 16 printed pages. DC (CW/JG) 81156/5 © UCLES 2014 [Turn over Cambridge International Examinations Cambridge International General Certificate of Secondary Education * 7 7 3 1 1 0 1 8 6 7 * ENVIRONMENTAL MANAGEMENT 0680/21 Paper 2 October/November 2014 1 hour 45 minutes Candidates answer on the Question Paper. Additional Materials: Ruler READ THESE INSTRUCTIONS FIRST Write your Centre number, candidate number and name on all the work you hand in. Write in dark blue or black pen. You may use an HB pencil for any diagrams or graphs. Do not use staples, paper clips, glue or correction fluid. DO NOT WRITE IN ANY BARCODES. Answer both questions. Electronic calculators may be used. You may lose marks if you do not show your working or if you do not use appropriate units. At the end of the examination, fasten all your work securely together. The number of marks is given in brackets [ ] at the end of each question or part question.
Question paper, page 2
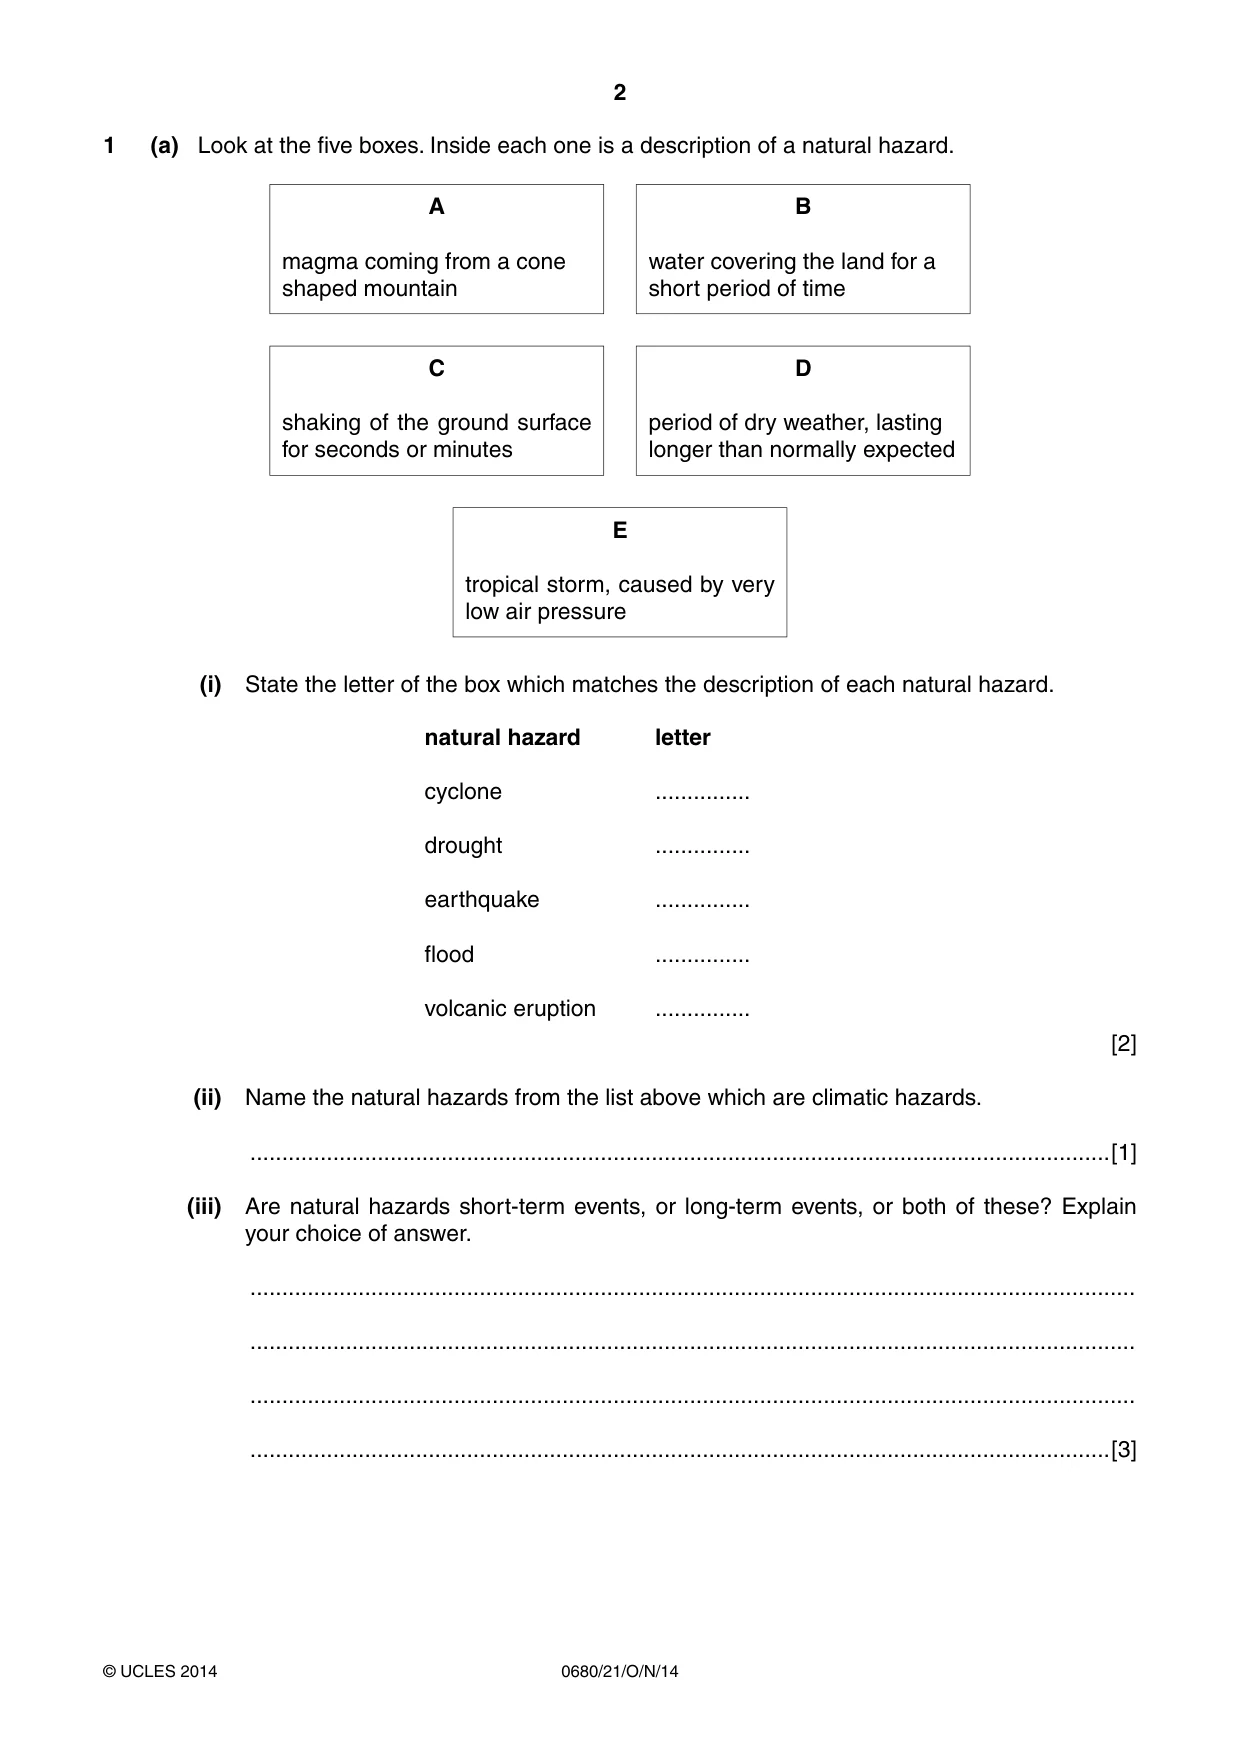
2 0680/21/O/N/14 © UCLES 2014 1 (a) Look at the five boxes. Inside each one is a description of a natural hazard. A magma coming from a cone shaped mountain B water covering the land for a short period of time C shaking of the ground surface for seconds or minutes D period of dry weather, lasting longer than normally expected E tropical storm, caused by very low air pressure (i) State the letter of the box which matches the description of each natural hazard. natural hazard cyclone drought earthquake flood volcanic eruption letter … … … … … [2] (ii) Name the natural hazards from the list above which are climatic hazards. …[1] (iii) Are natural hazards short-term events, or long-term events, or both of these? Explain your choice of answer. … … … …[3]
Question paper, page 3
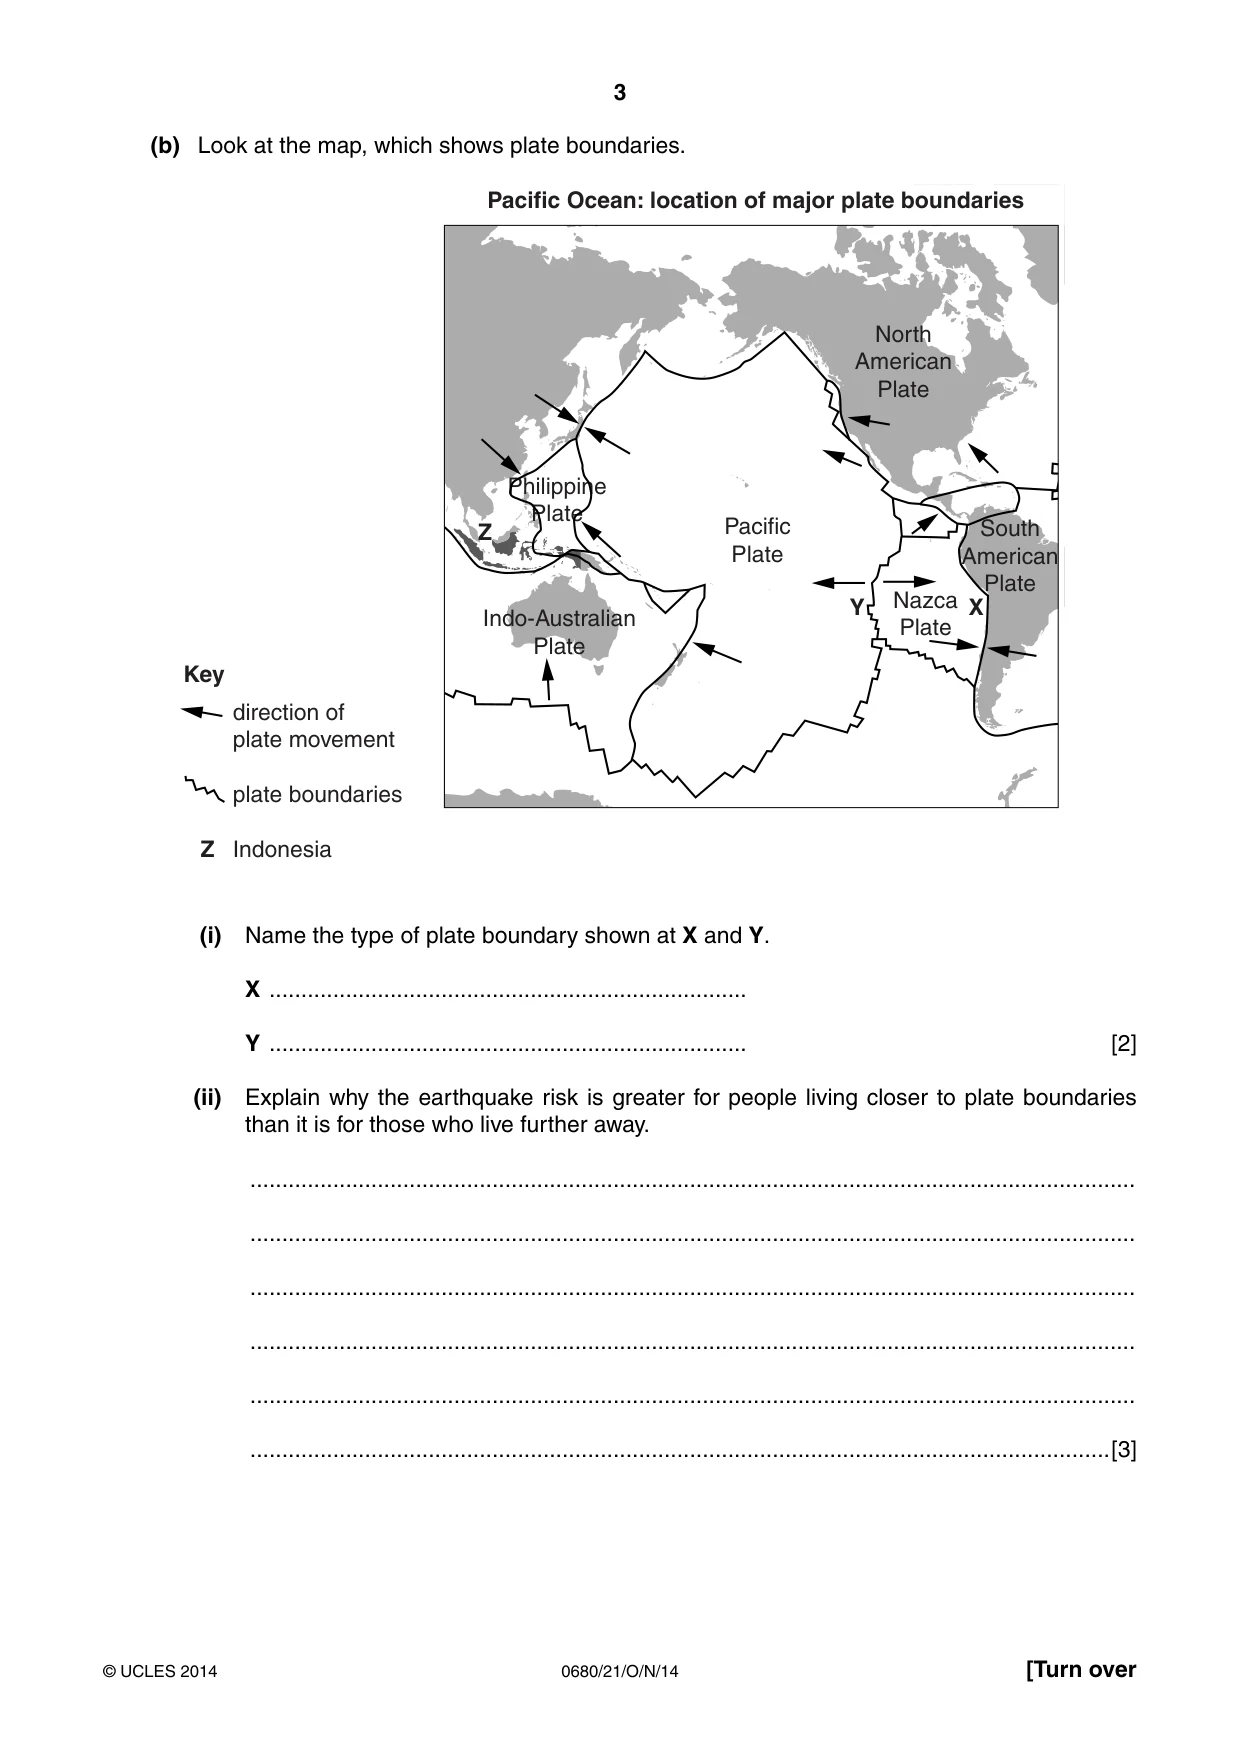
3 0680/21/O/N/14 © UCLES 2014 [Turn over (b) Look at the map, which shows plate boundaries. Pacific Plate Nazca Plate South American Plate North American Plate Philippine Plate Indo-Australian Plate Z Z X Y Key direction of plate movement plate boundaries Indonesia Pacific Ocean: location of major plate boundaries (i) Name the type of plate boundary shown at X and Y. X … Y … [2] (ii) Explain why the earthquake risk is greater for people living closer to plate boundaries than it is for those who live further away. … … … … … …[3]
Question paper, page 4
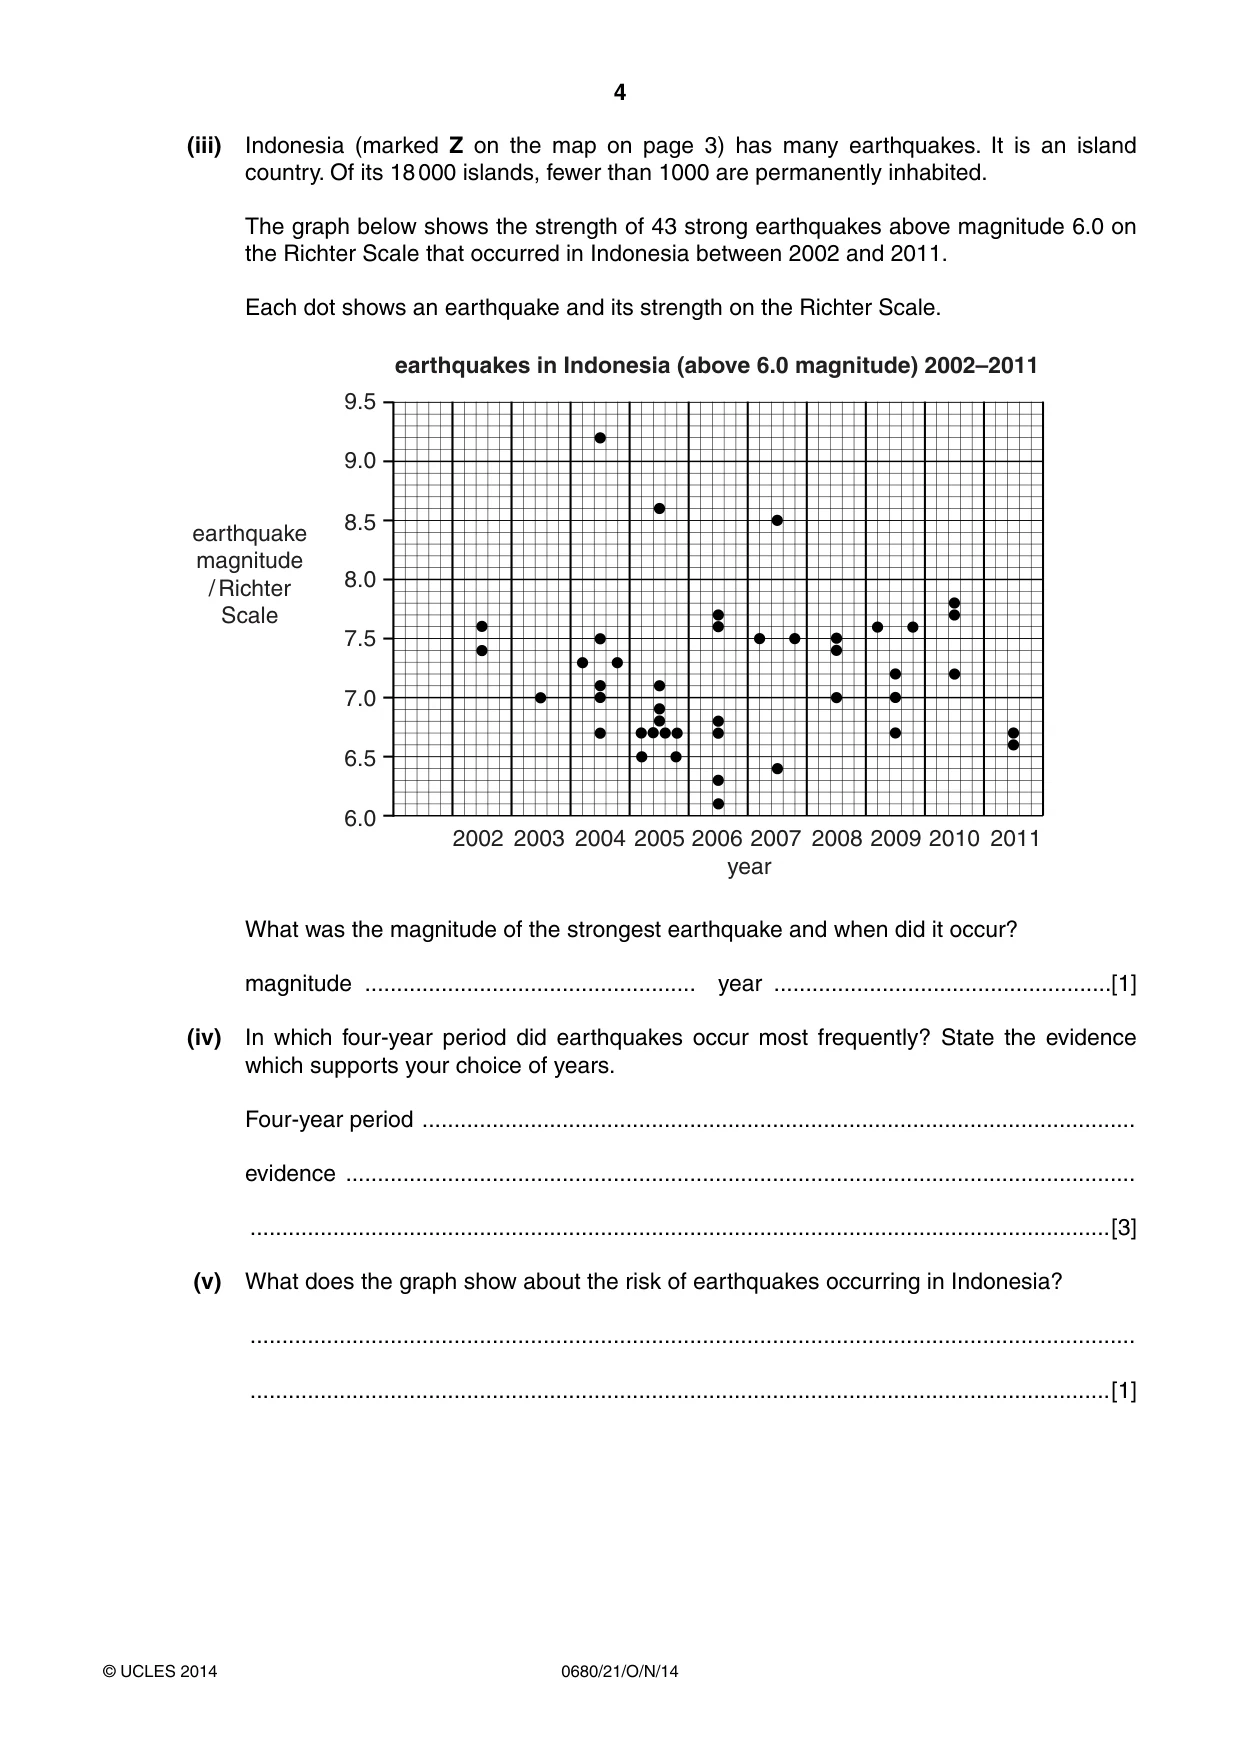
4 0680/21/O/N/14 © UCLES 2014 (iii) Indonesia (marked Z on the map on page 3) has many earthquakes. It is an island country. Of its 18 000 islands, fewer than 1000 are permanently inhabited. The graph below shows the strength of 43 strong earthquakes above magnitude 6.0 on the Richter Scale that occurred in Indonesia between 2002 and 2011. Each dot shows an earthquake and its strength on the Richter Scale. 6.0 6.5 7.0 7.5 8.0 8.5 9.0 9.5 earthquake magnitude / Richter Scale 2002 2003 2004 2005 2006 2007 2008 2009 2010 2011 year earthquakes in Indonesia (above 6.0 magnitude) 2002–2011 What was the magnitude of the strongest earthquake and when did it occur? magnitude … year …[1] (iv) In which four-year period did earthquakes occur most frequently? State the evidence which supports your choice of years. Four-year period … evidence … …[3] (v) What does the graph show about the risk of earthquakes occurring in Indonesia? … …[1]
Question paper, page 5
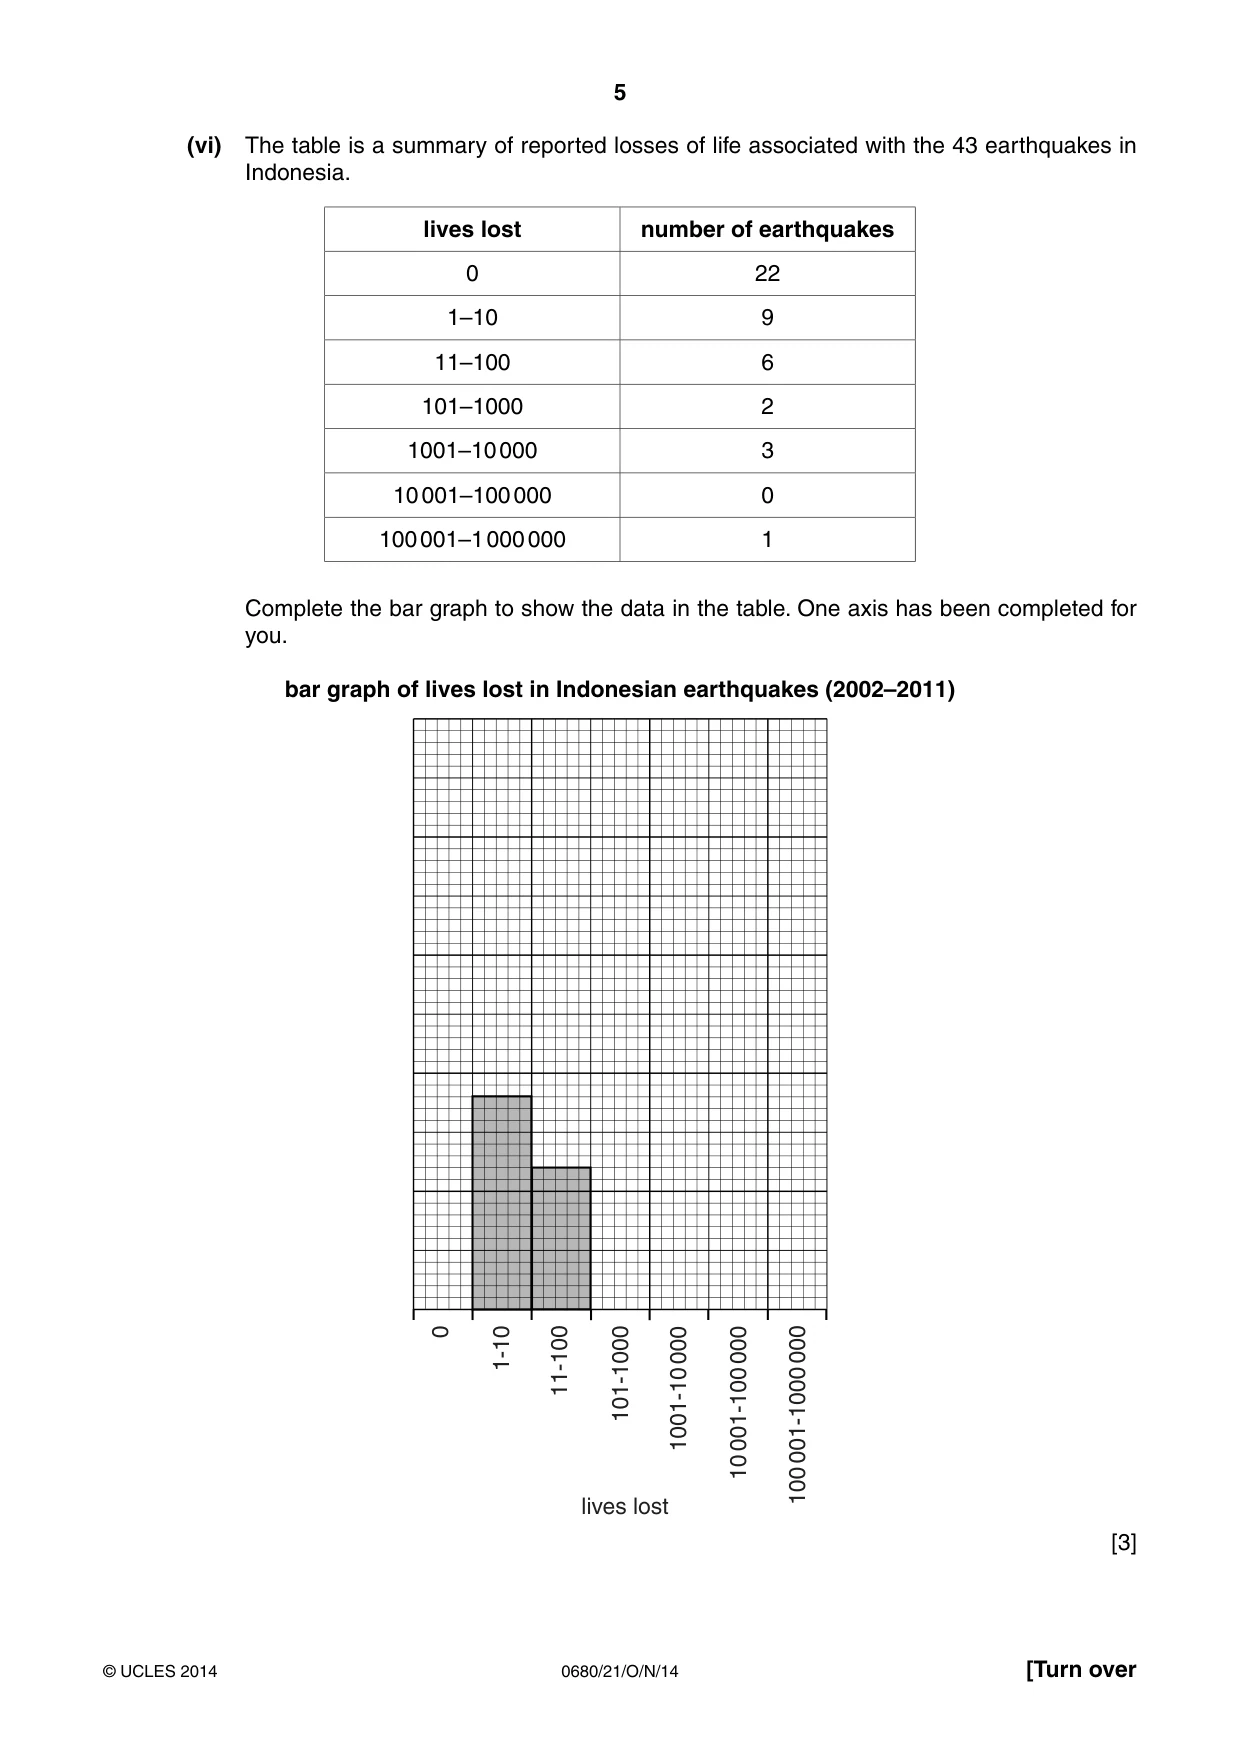
5 0680/21/O/N/14 © UCLES 2014 [Turn over (vi) The table is a summary of reported losses of life associated with the 43 earthquakes in Indonesia. lives lost number of earthquakes 0 22 1–10 9 11–100 6 101–1000 2 1001–10 000 3 10 001–100 000 0 100 001–1 000 000 1 Complete the bar graph to show the data in the table. One axis has been completed for you. bar graph of lives lost in Indonesian earthquakes (2002–2011) lives lost 0 11-100 101-1000 1001-10 000 100 001-1000 000 1-10 10 001-100 000 [3]
Question paper, page 6
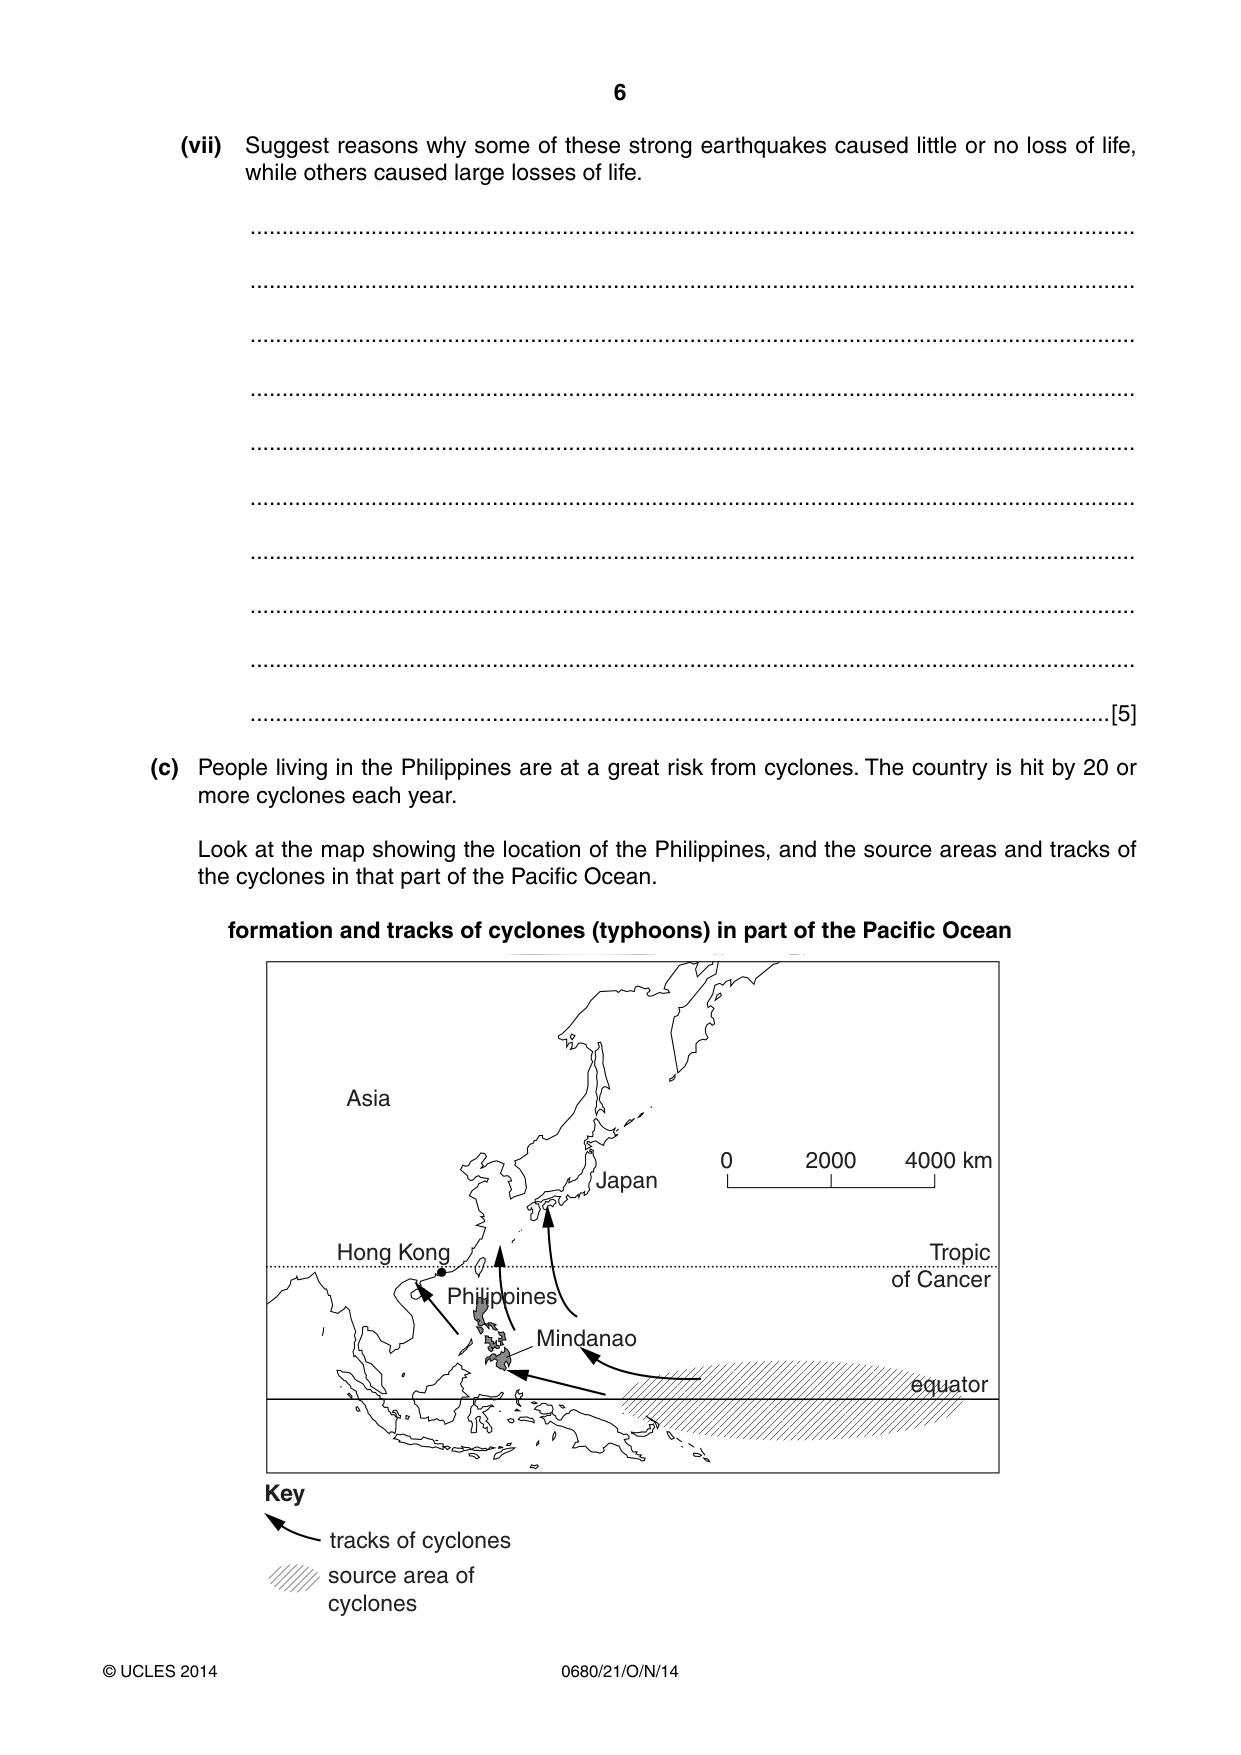
6 0680/21/O/N/14 © UCLES 2014 (vii) Suggest reasons why some of these strong earthquakes caused little or no loss of life, while others caused large losses of life. … … … … … … … … … …[5] (c) People living in the Philippines are at a great risk from cyclones. The country is hit by 20 or more cyclones each year. Look at the map showing the location of the Philippines, and the source areas and tracks of the cyclones in that part of the Pacific Ocean. formation and tracks of cyclones (typhoons) in part of the Pacific Ocean Mindanao Philippines Hong Kong Asia 0 2000 4000 km Japan equator Tropic of Cancer source area of cyclones tracks of cyclones Key
Question paper, page 7
7 0680/21/O/N/14 © UCLES 2014 [Turn over (i) Explain why many cyclones are formed every year in the source area shown on the map. … … … … … …[3] (ii) Suggest why the greatest cyclone risk in the Philippines is during September and October. … …[1] (iii) In most years, the Philippines is hit by more cyclones than other places in the Far East, such as Hong Kong and Japan. Using the map on page 6, suggest reasons for this. … … … …[2]
Question paper, page 8
8 0680/21/O/N/14 © UCLES 2014 (d) In December 2011 the full effects of a cyclone called Typhoon Washi were felt on the island of Mindanao. It is located in the south of the Philippines and south of the capital city, Manila. The people living in the northern part of Mindanao were affected by the cyclone in the following ways: • severe flooding everywhere, including the main city Cagayan de Oro • flash floods and landslides swept houses into rivers and out to sea • at least 1250 people died, most of them from drowning • up to half a million people lost their homes (i) In most cyclones, damage to property and loss of life are caused by the combined effects of very strong winds and heavy rainfall. Which one of these two causes was more important in Typhoon Washi? Describe the evidence which supports your choice. … … … …[2] (ii) Survivors of Typhoon Washi blamed the government and local authorities for not doing enough to protect Mindanao against the cyclone risk. State why you would expect the authorities in the Philippines to be well prepared for cyclones. … …[1]
Question paper, page 9
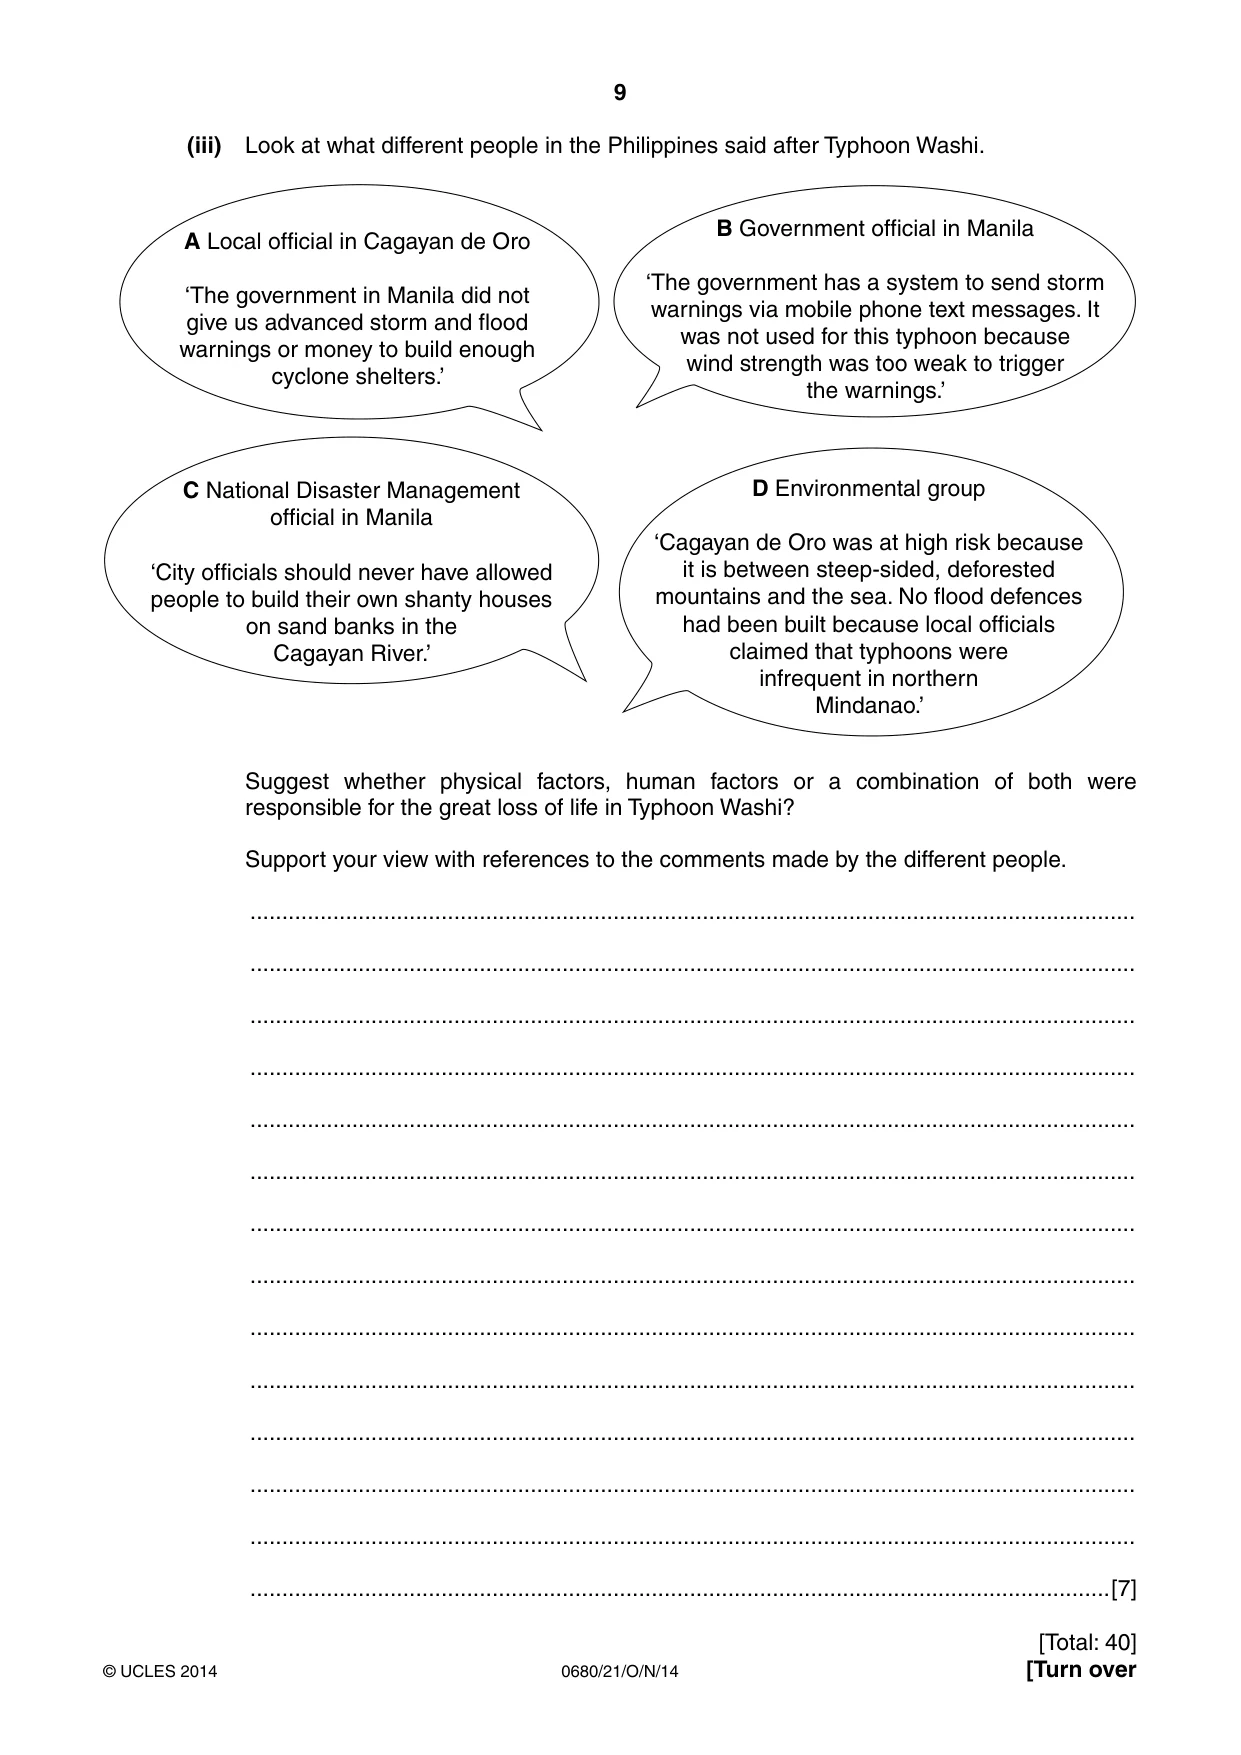
9 0680/21/O/N/14 © UCLES 2014 [Turn over (iii) Look at what different people in the Philippines said after Typhoon Washi. A Local official in Cagayan de Oro ‘The government in Manila did not give us advanced storm and flood warnings or money to build enough cyclone shelters.’ B Government official in Manila ‘The government has a system to send storm warnings via mobile phone text messages. It was not used for this typhoon because wind strength was too weak to trigger the warnings.’ C National Disaster Management official in Manila ‘City officials should never have allowed people to build their own shanty houses on sand banks in the Cagayan River.’ D Environmental group ‘Cagayan de Oro was at high risk because it is between steep-sided, deforested mountains and the sea. No flood defences had been built because local officials claimed that typhoons were infrequent in northern Mindanao.’ Suggest whether physical factors, human factors or a combination of both were responsible for the great loss of life in Typhoon Washi? Support your view with references to the comments made by the different people. … … … … … … … … … … … … … …[7] [Total: 40]
Question paper, page 10
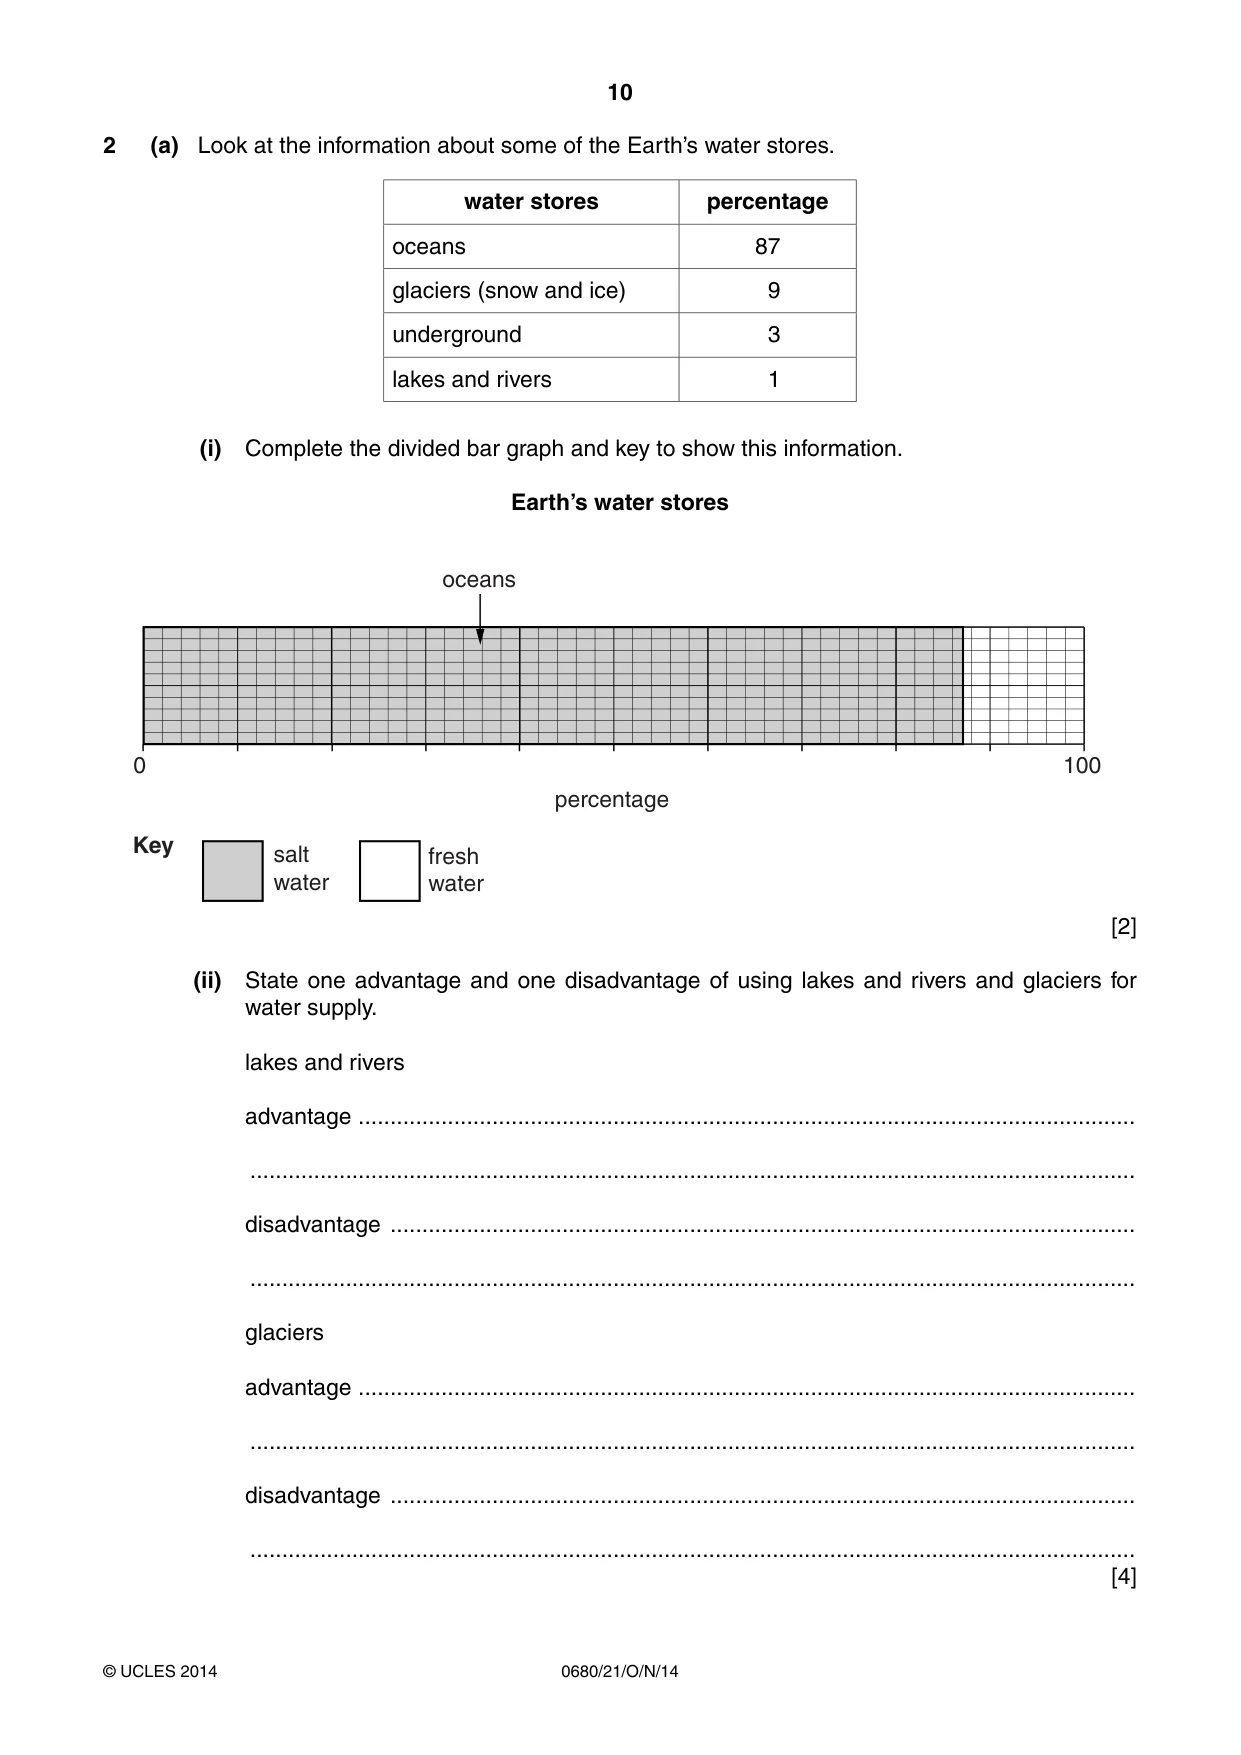
10 0680/21/O/N/14 © UCLES 2014 2 (a) Look at the information about some of the Earth’s water stores. water stores percentage oceans 87 glaciers (snow and ice) 9 underground 3 lakes and rivers 1 (i) Complete the divided bar graph and key to show this information. Earth’s water stores salt water fresh water 0 100 oceans percentage Key [2] (ii) State one advantage and one disadvantage of using lakes and rivers and glaciers for water supply. lakes and rivers advantage … … disadvantage … … glaciers advantage … … disadvantage … … [4]
Question paper, page 11
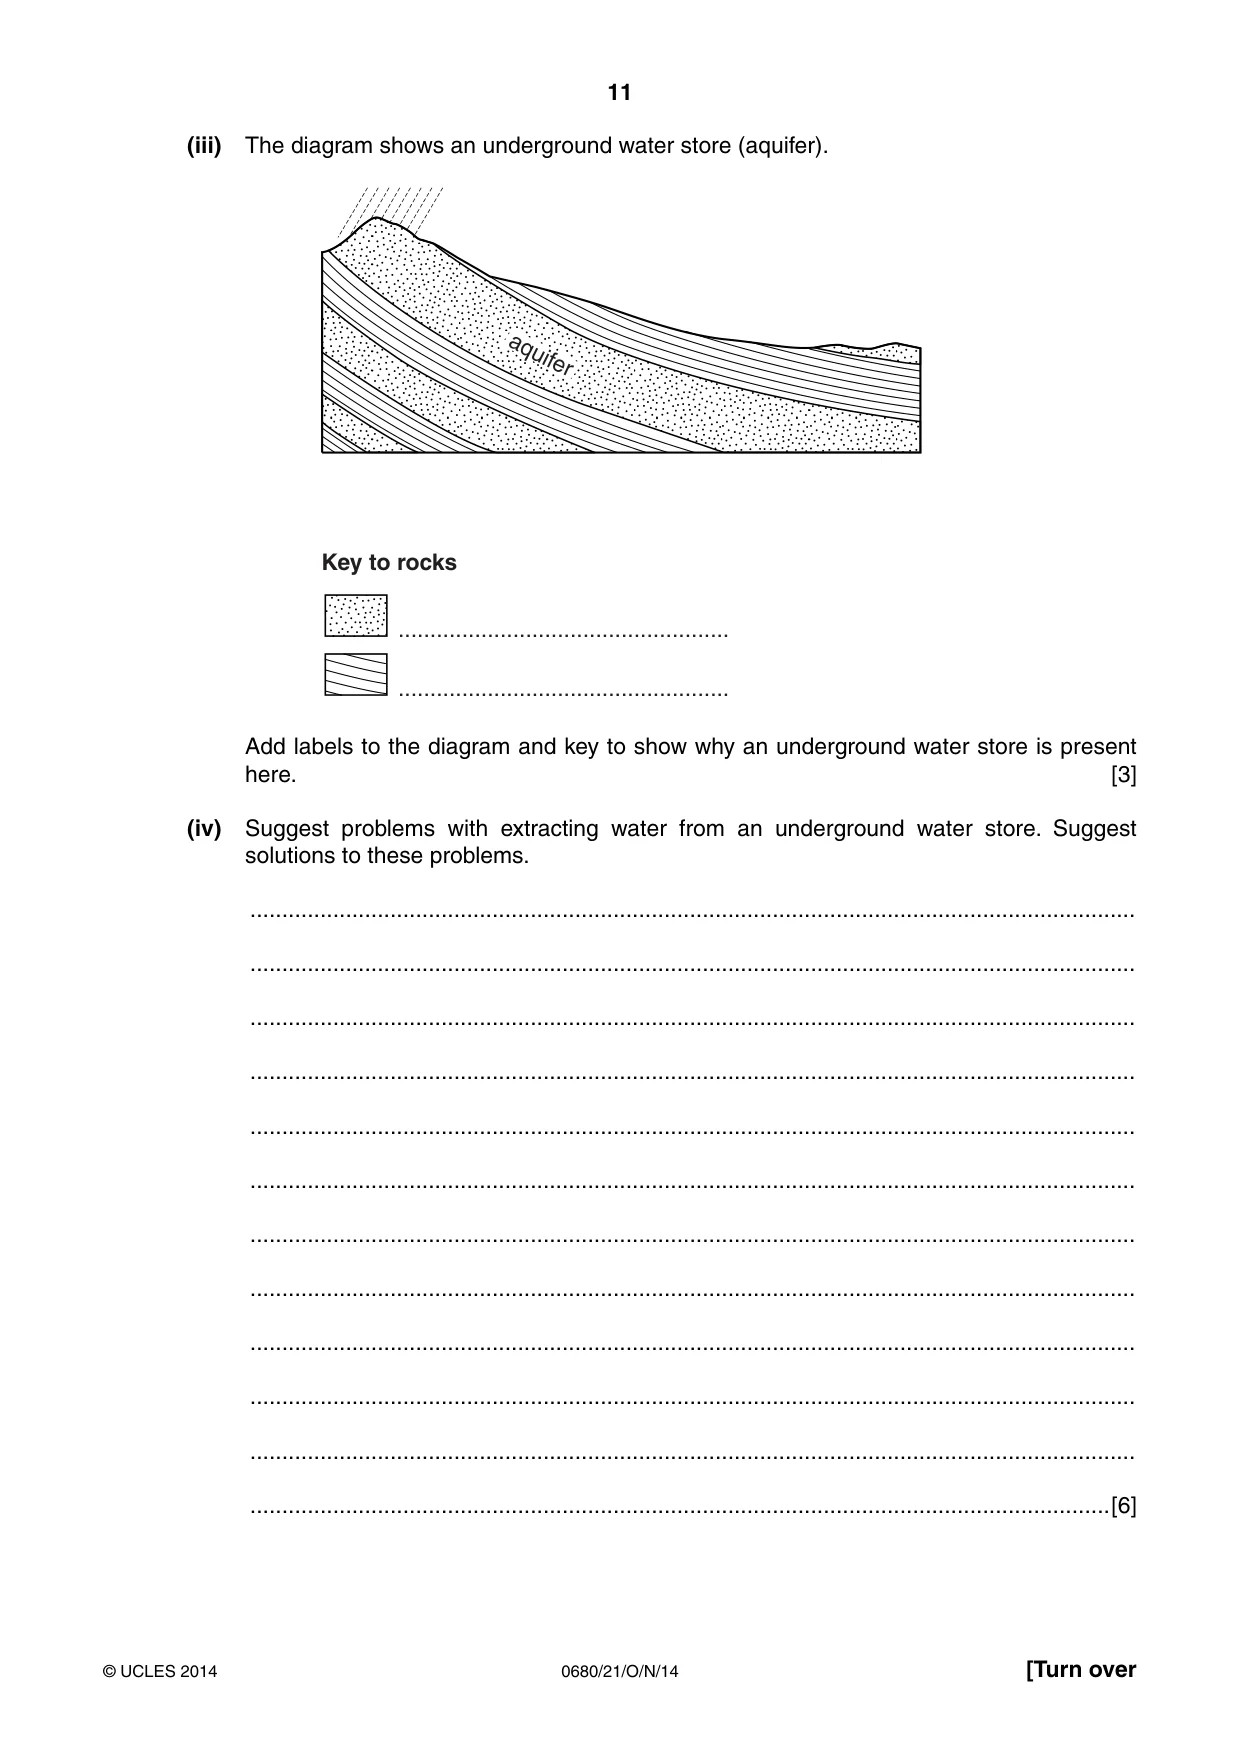
11 0680/21/O/N/14 © UCLES 2014 [Turn over (iii) The diagram shows an underground water store (aquifer). aqu ifer Key to rocks … … Add labels to the diagram and key to show why an underground water store is present here. [3] (iv) Suggest problems with extracting water from an underground water store. Suggest solutions to these problems. … … … … … … … … … … … …[6]
Question paper, page 12
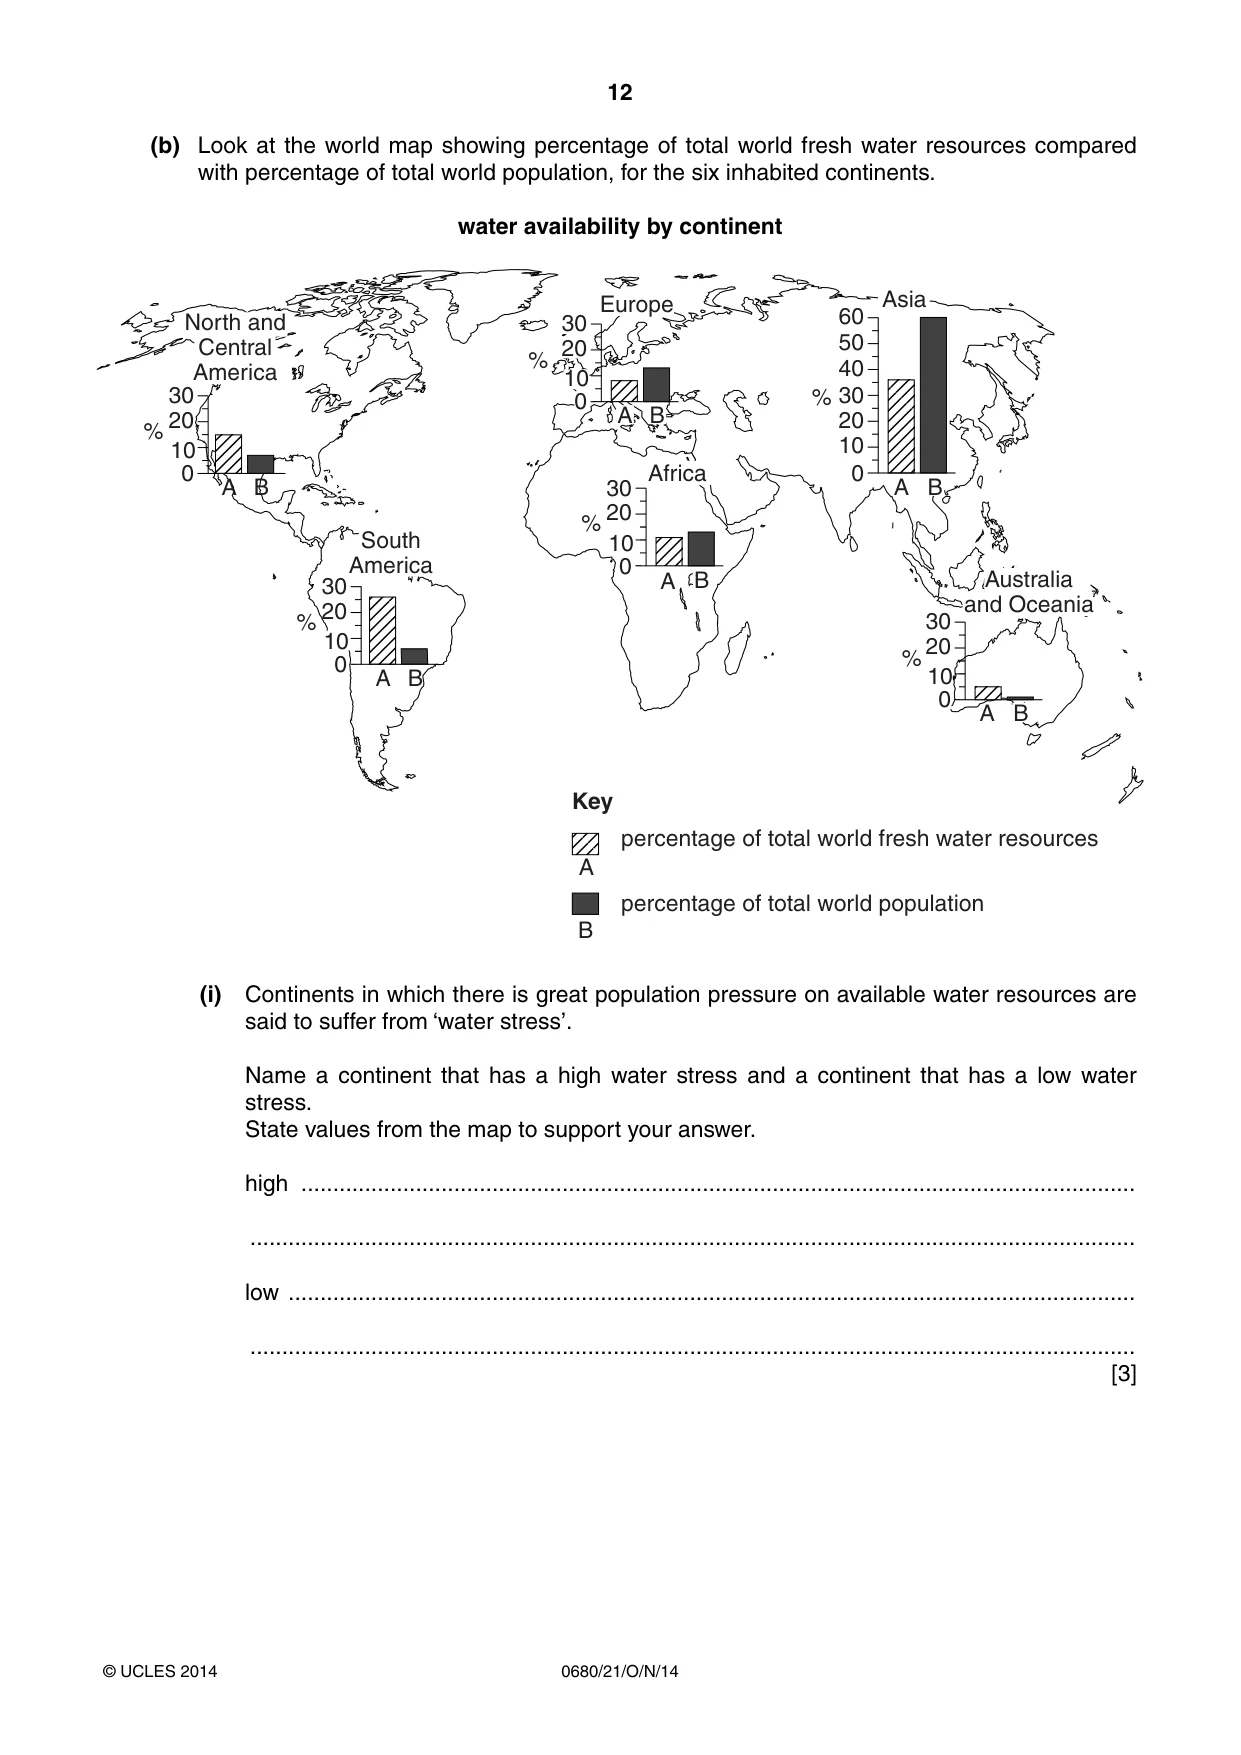
12 0680/21/O/N/14 © UCLES 2014 (b) Look at the world map showing percentage of total world fresh water resources compared with percentage of total world population, for the six inhabited continents. water availability by continent % % % % 0 10 20 30 40 50 60 0 10 20 30 0 10 20 30 % 0 10 20 30 % 0 10 20 30 0 10 20 30 A A percentage of total world fresh water resources percentage of total world population B B A B A B A B A B A B Key North and Central America South America Australia and Oceania Africa Europe Asia (i) Continents in which there is great population pressure on available water resources are said to suffer from ‘water stress’. Name a continent that has a high water stress and a continent that has a low water stress. State values from the map to support your answer. high … … low … … [3]
Question paper, page 13
13 0680/21/O/N/14 © UCLES 2014 [Turn over (ii) Look at what the map shows about Europe and Africa: • both have the same percentages of total world population (13%) • water resources in Europe are lower than in Africa • water stress in many African countries is much greater than in most European countries Suggest both physical and human reasons why water stress is generally greater in Africa than in Europe. … … … … … … … …[4] (c) One way for water-poor countries to increase their supplies of clean water for domestic, industrial and agricultural use is desalination. Look at the diagram showing how sea water is desalinated to give clean water using a process called reverse osmosis. the desalination process large pump forces sea water through giant pipes sea water is pumped under very high pressure through thousands of fine membranes to remove salt, which uses a lot of energy clean water for domestic, industrial and agricultural uses membrane sea step 1 step 2 step 3 (i) Using the diagram, describe how salt is removed from sea water to make the clean water for human use. … …[1]
Question paper, page 14
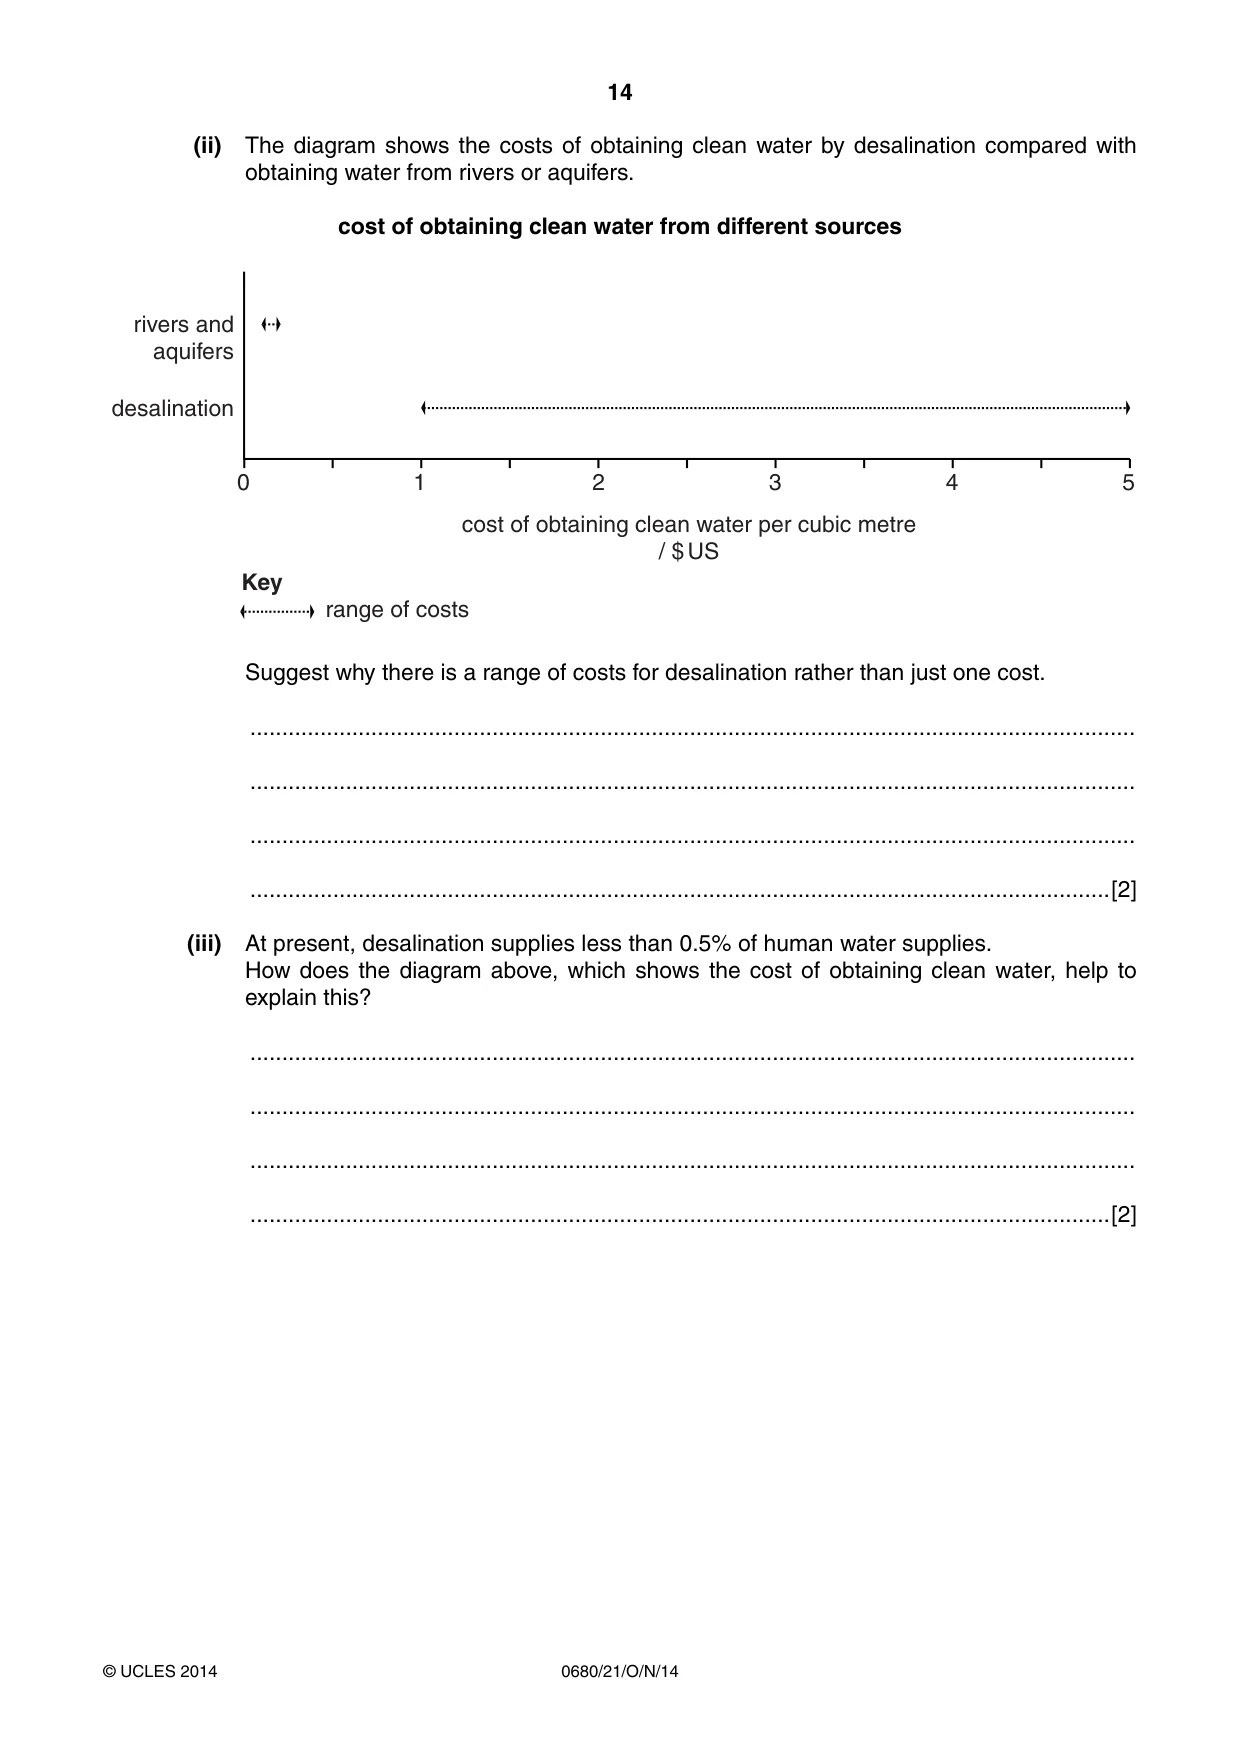
14 0680/21/O/N/14 © UCLES 2014 (ii) The diagram shows the costs of obtaining clean water by desalination compared with obtaining water from rivers or aquifers. cost of obtaining clean water from different sources rivers and aquifers desalination 0 1 2 3 4 5 cost of obtaining clean water per cubic metre / $ US range of costs Key Suggest why there is a range of costs for desalination rather than just one cost. … … … …[2] (iii) At present, desalination supplies less than 0.5% of human water supplies. How does the diagram above, which shows the cost of obtaining clean water, help to explain this? … … … …[2]
Question paper, page 15
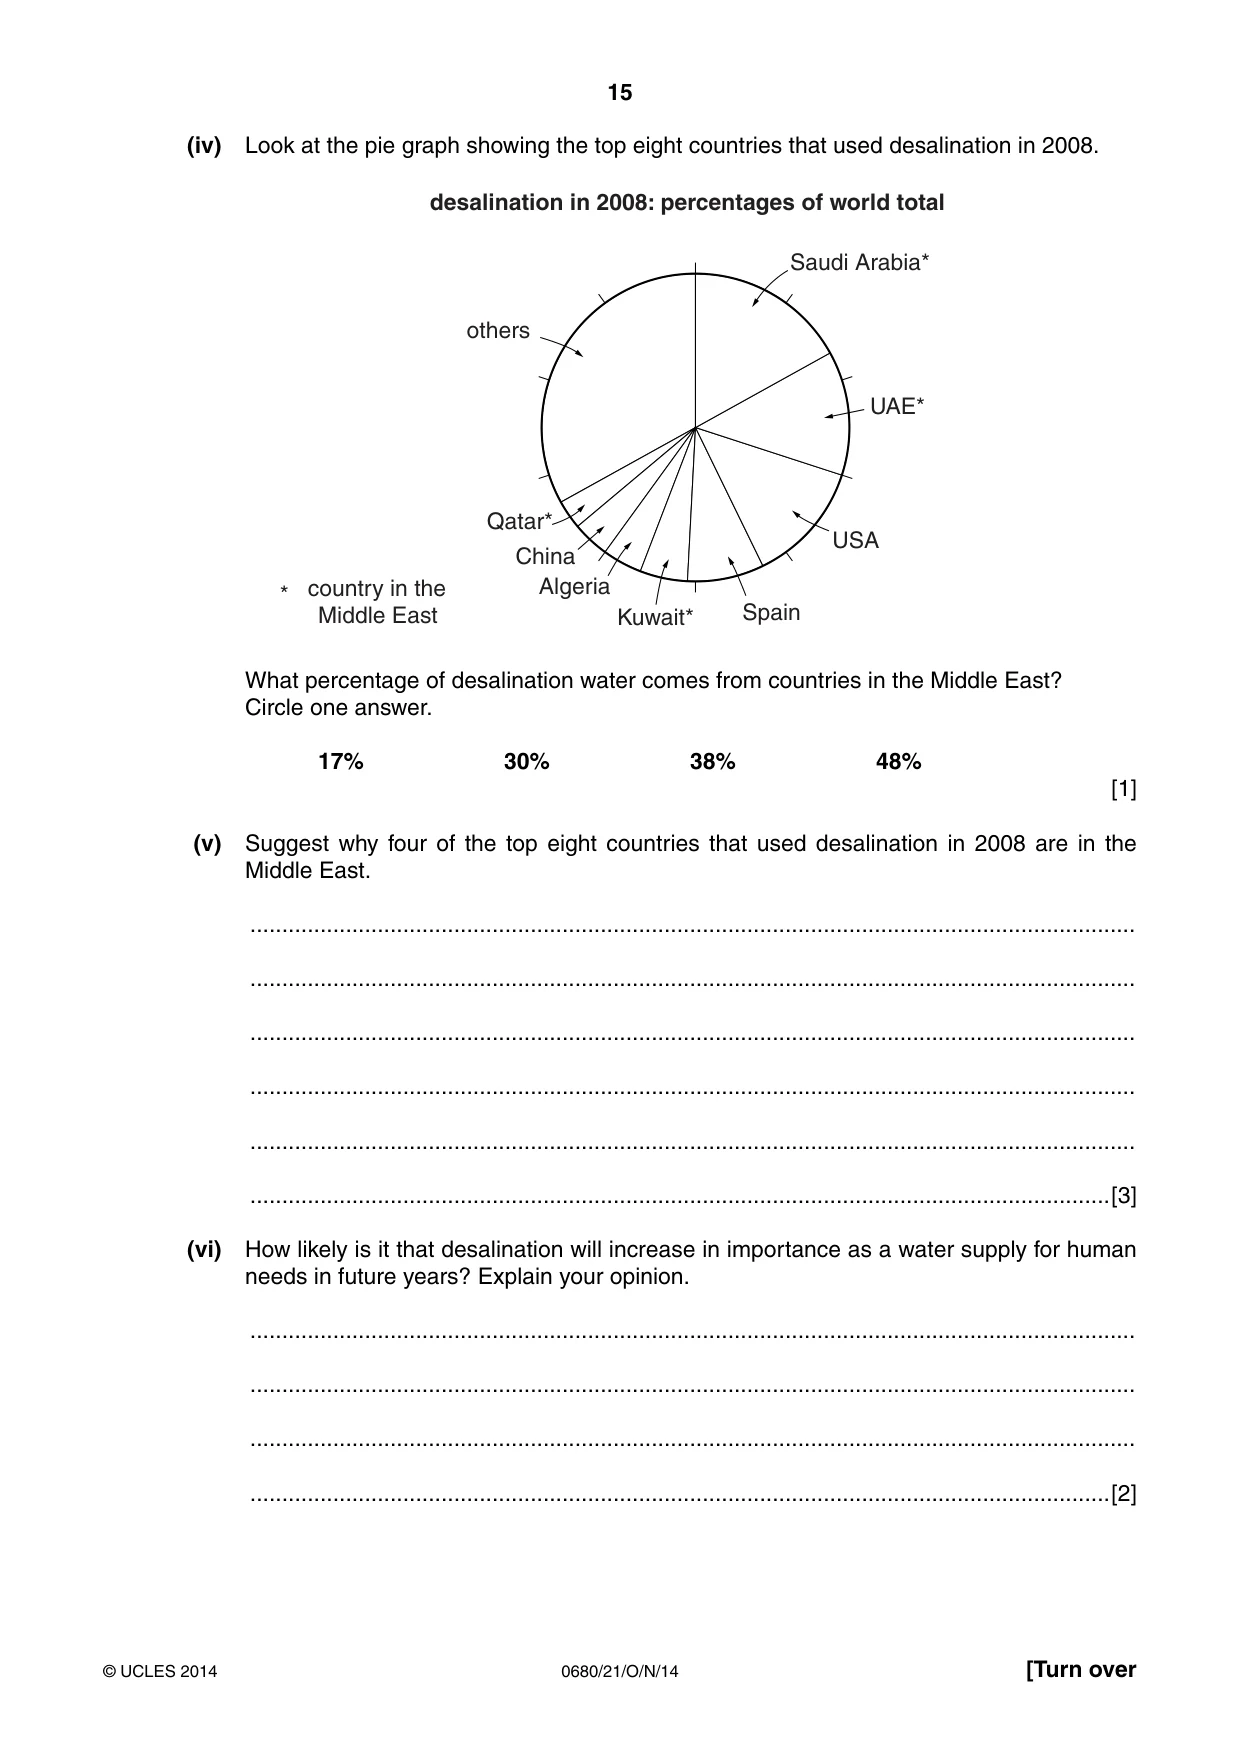
15 0680/21/O/N/14 © UCLES 2014 [Turn over (iv) Look at the pie graph showing the top eight countries that used desalination in 2008. Saudi Arabia* UAE* * country in the Middle East USA Spain Kuwait* Algeria China Qatar* others desalination in 2008: percentages of world total What percentage of desalination water comes from countries in the Middle East? Circle one answer. 17% 30% 38% 48% [1] (v) Suggest why four of the top eight countries that used desalination in 2008 are in the Middle East. … … … … … …[3] (vi) How likely is it that desalination will increase in importance as a water supply for human needs in future years? Explain your opinion. … … … …[2]
Question paper, page 16
16 0680/21/O/N/14 © UCLES 2014 (d) Agriculture accounts for about two-thirds of world water consumption. (i) Describe how farmers can make more efficient use of water when irrigating their crops. … … … … … …[3] (ii) State some of the environmental issues that result from inefficient use of water by farmers. … … … … … … … …[4] [Total: 40] Permission to reproduce items where third-party owned material protected by copyright is included has been sought and cleared where possible. Every reasonable effort has been made by the publisher (UCLES) to trace copyright holders, but if any items requiring clearance have unwittingly been included, the publisher will be pleased to make amends at the earliest possible opportunity. Cambridge International Examinations is part of the Cambridge Assessment Group. Cambridge Assessment is the brand name of University of Cambridge Local Examinations Syndicate (UCLES), which is itself a department of the University of Cambridge.
Mark scheme, page 1
® IGCSE is the registered trademark of Cambridge International Examinations. CAMBRIDGE INTERNATIONAL EXAMINATIONS Cambridge International General Certificate of Secondary Education MARK SCHEME for the October/November 2014 series 0680 ENVIRONMENTAL MANAGEMENT 0680/21 Paper 2, maximum raw mark 80 This mark scheme is published as an aid to teachers and candidates, to indicate the requirements of the examination. It shows the basis on which Examiners were instructed to award marks. It does not indicate the details of the discussions that took place at an Examiners’ meeting before marking began, which would have considered the acceptability of alternative answers. Mark schemes should be read in conjunction with the question paper and the Principal Examiner Report for Teachers. Cambridge will not enter into discussions about these mark schemes. Cambridge is publishing the mark schemes for the October/November 2014 series for most Cambridge IGCSE®, Cambridge International A and AS Level components and some Cambridge O Level components.
Mark scheme, page 2
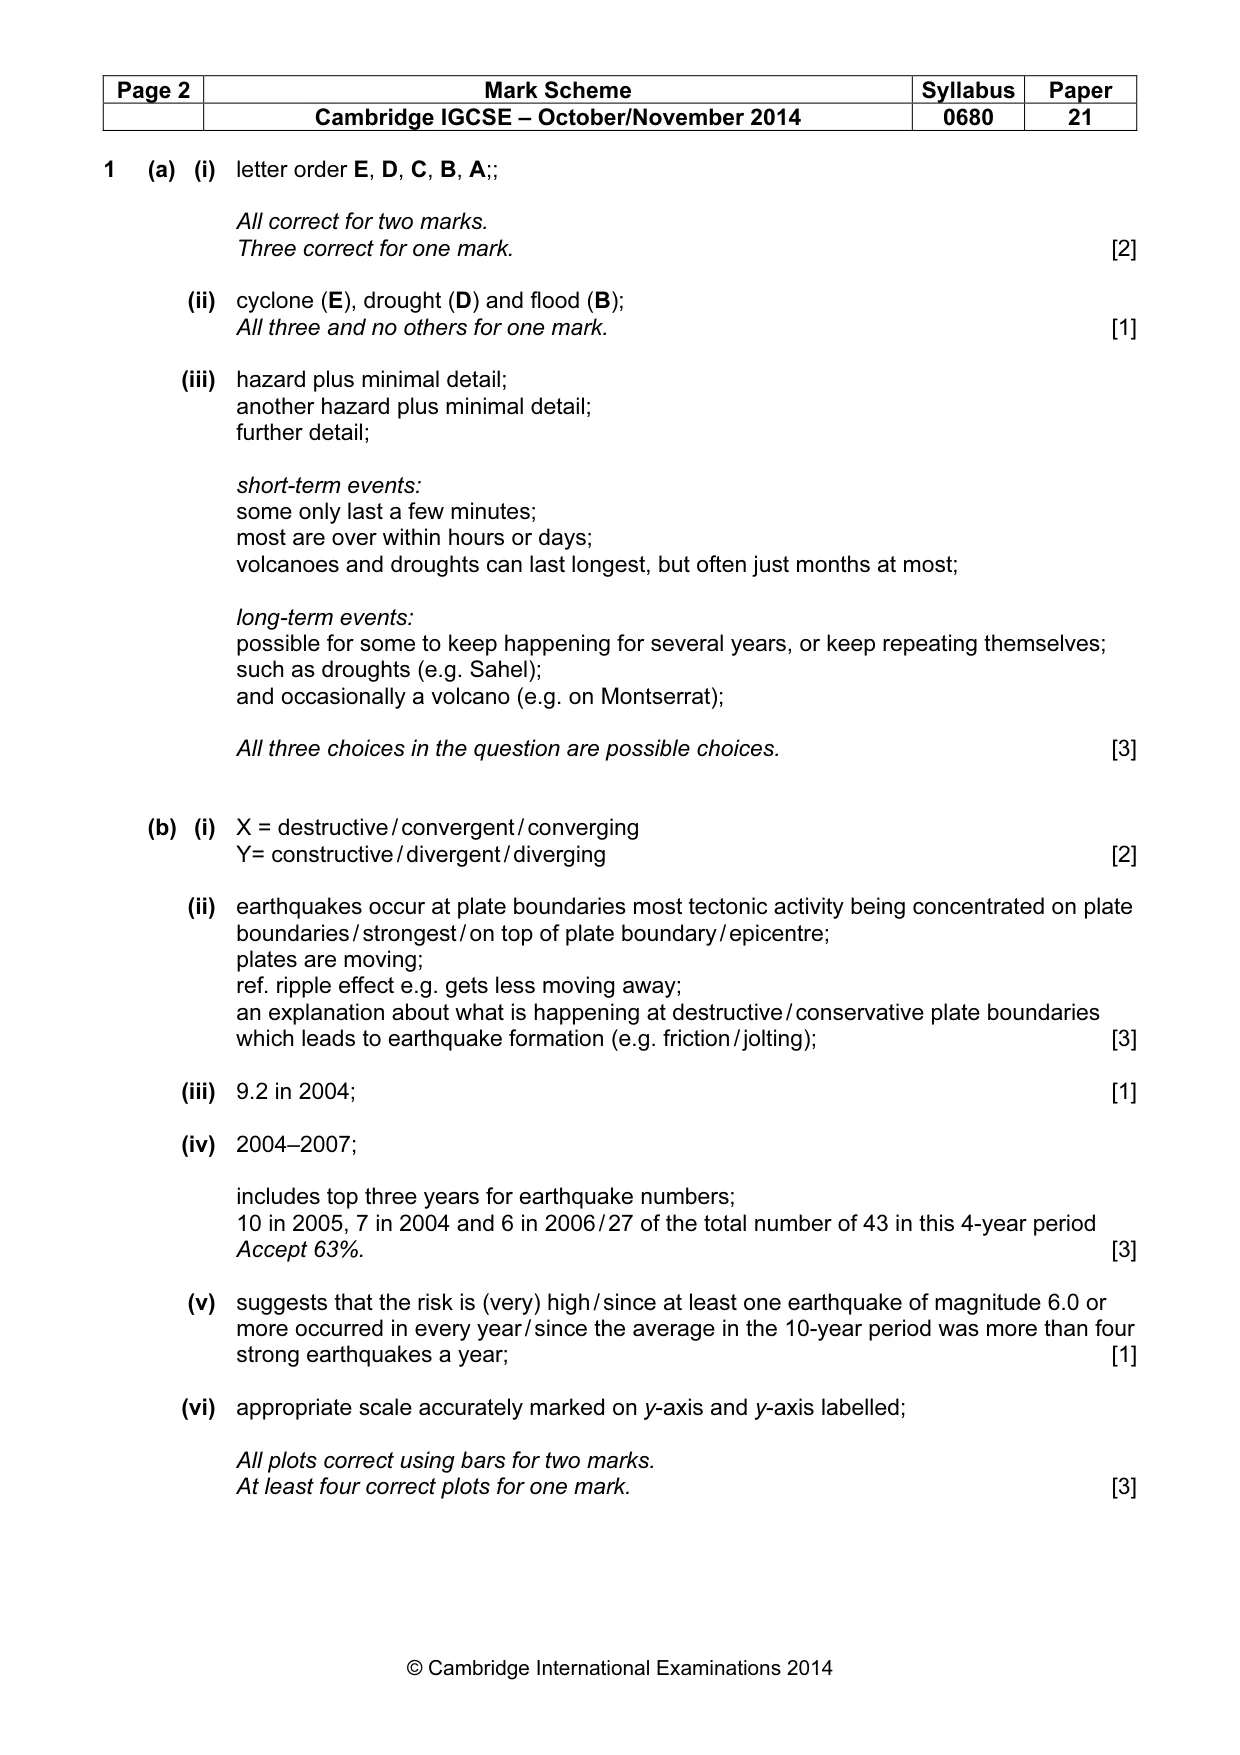
Page 2 Mark Scheme Syllabus Paper Cambridge IGCSE – October/November 2014 0680 21 © Cambridge International Examinations 2014 1 (a) (i) letter order E, D, C, B, A;; All correct for two marks. Three correct for one mark. [2] (ii) cyclone (E), drought (D) and flood (B); All three and no others for one mark. [1] (iii) hazard plus minimal detail; another hazard plus minimal detail; further detail; short-term events: some only last a few minutes; most are over within hours or days; volcanoes and droughts can last longest, but often just months at most; long-term events: possible for some to keep happening for several years, or keep repeating themselves; such as droughts (e.g. Sahel); and occasionally a volcano (e.g. on Montserrat); All three choices in the question are possible choices. [3] (b) (i) X = destructive / convergent / converging Y= constructive / divergent / diverging [2] (ii) earthquakes occur at plate boundaries most tectonic activity being concentrated on plate boundaries / strongest / on top of plate boundary / epicentre; plates are moving; ref. ripple effect e.g. gets less moving away; an explanation about what is happening at destructive / conservative plate boundaries which leads to earthquake formation (e.g. friction / jolting); [3] (iii) 9.2 in 2004; [1] (iv) 2004–2007; includes top three years for earthquake numbers; 10 in 2005, 7 in 2004 and 6 in 2006 / 27 of the total number of 43 in this 4-year period Accept 63%. [3] (v) suggests that the risk is (very) high / since at least one earthquake of magnitude 6.0 or more occurred in every year / since the average in the 10-year period was more than four strong earthquakes a year; [1] (vi) appropriate scale accurately marked on y-axis and y-axis labelled; All plots correct using bars for two marks. At least four correct plots for one mark. [3]
Mark scheme, page 3
Page 3 Mark Scheme Syllabus Paper Cambridge IGCSE – October/November 2014 0680 21 © Cambridge International Examinations 2014 (vii) magnitude on Richter scale / earthquake strength: referring to those of exceptional strength such as the 9.2 and 8.6, and / or by referring to the logarithmic nature of Richter scale; nature of the earthquake: such as depth of the focus / length of ground shaking / frequency / strength of after- shocks; low lying coastal locations are also at risk from tsunamis; density of population: highest in urban areas, many coastal areas; least in mountainous areas / none in the islands of Indonesia that are not inhabited; high density of high rise buildings increases risks to people living or visiting there; time of day earthquake occurred: people more alert to what is happening during the day and more likely to be able to reach open spaces; human factors related to: earthquake proofing of buildings; preparations in advance (with examples such as education / food supplies / shelters / medical facilities);; differences between rich and poor neighbourhoods in terms of house structure also in terms of inferior locations of slums on hillsides where landslides are more likely to be triggered; [5] (c) (i) ocean location where sea-water heats up most / is warm (around the Equator); 26 / 27 °C are needed for cyclone formation; further details about how this triggers off rising air currents / leading to condensation of water vapour / formation of towering cumulonimbus clouds / formation of deep area of low pressure; [3] (ii) (end of summer season) when sea-water temperatures are at their highest / sea-water takes longer to heat up than land surfaces which means later than the time when the Sun is overhead; [1] (iii) Philippines is much closer to the source area / cyclones reach the Philippines first; further supporting use of the map such as: location of the islands in relation to Japan and Hong Kong / or to tracks of cyclones which become more varied away from the source so that only some carry on towards Hong Kong or Japan whereas fewer miss the Philippines; [2] (d) (i) evidence for heavy rainfall: (severe) flooding (everywhere); flash floods; (most of the dead were) from drowning; houses swept into rivers and out to sea; [2]
Mark scheme, page 4
Page 4 Mark Scheme Syllabus Paper Cambridge IGCSE – October/November 2014 0680 21 © Cambridge International Examinations 2014 (ii) island nature of the country so very vulnerable to effects of cyclones / cyclones happen (every year / often / regular) since one of the closest land areas to the source / comment about the way the tracks of the cyclones bend northwards; [1] (iii) physical factors: wind strength was too weak; to trigger mobile phone text messages; great wind strength usually expected from typhoons hitting the Philippines; but on this occasion it was flooding which did the damage; massive amounts of rainwater must have fallen to make the rivers flood so badly showing the force of nature; and perhaps its non-predictability (all natural hazard events are different); Cagayan de Oro geographical factors of steep-sided mountains: proximity to the sea; deforested slopes*; human factors: poverty meant slum houses / poor quality houses have been built; lack of planning leads to building on sand banks in the middle of the river; lack of money spent by government with examples such as to build shelters; lack of flood defences; despite previous warnings about a location between steep mountain sides and the sea; lack of sending advance warnings; not looking at advance weather information as would be the case in a more developed country; lack of shelters; deforested slopes*; * Credit once only. or a mixture of the two: can never prevent large losses of life from natural hazards; on the other hand, most developed countries are much better prepared than was the Philippines, especially considering that typhoons are regular events and there is a known time of the year when they will occur; [7]
Mark scheme, page 5
Page 5 Mark Scheme Syllabus Paper Cambridge IGCSE – October/November 2014 0680 21 © Cambridge International Examinations 2014 2 (a) (i) accurate plots for the three percentages; sectors correctly labelled; [2] (ii) lakes and rivers it is fresh / sweet water / does not need desalination; easily accessible surface supplies; widely available / widespread distribution; reliable source / large amounts of water can be readily available; small amount comparatively; most at risk from pollution / problems of dirty water supply; surface waters used as places of disposal for human wastes / ref. water-borne diseases; in some places natural contamination as well / other hazards (dangerous animals); may destroy habitats supported by existence of lakes and rivers; Max. two marks. glaciers it is fresh water / does not need desalination; clean water supply; more water released in summer when often it is most needed; very extensive supply (biggest reservoir of fresh water on Earth) / supplies some of the world's major surface rivers (e.g. Ganges); located in some of the most inaccessible places away from people; winter freezing can cut off supplies to people; store decreasing as mountain glaciers are melting; Max. two marks. [4] (iii) possible labels: rainwater to fill the aquifer; arrows or labels to show water seeping underground through the aquifer; aquifer labelled as permeable or porous rock either in key or on diagram; impermeable (impervious) rock labelled in key or on diagram; (limestone / sandstone / chalk / shale) in correct place in key or on diagram; (granite / marble / basalt / slate) in correct place in key or on diagram; additional labelling about impermeable acting as a water trap for the permeable; labelling for folding of rocks / downfold / syncline; [3]
Mark scheme, page 6
Page 6 Mark Scheme Syllabus Paper Cambridge IGCSE – October/November 2014 0680 21 © Cambridge International Examinations 2014 (iv) contamination by terrestrial activities; ref. pollution control measures; running out of water in the aquifer, use > replenishment; ref. water conservation measures; collapse of ground; constructing buildings / dykes to take account / recharge of aquifer; saltwater intrusion in coastal sites; water conservation; overexploitation leads to less water elsewhere / other countries / ref. to conflict; political discourse / agreement; ref. engineering problems / cost of drilling / hard to extract; aid for money / expertise from outside; At least two marks needed from each of problems and from solutions. [6] (b) (i) high water stress: Asia, because it has about 59–60% of total world population for 35–38% of world's water resources. Europe with 12–14% of population for 7–9% of water. low water stress: South America, because it has only 5–6% of the world population for 25–27% of the world's water resources. Oceania, because it has only 1–2% of population for 5–6%. N and C America it has only 5–7% of population for 15%. Asia / Europe and South America / Oceania / N and C America; use of supporting values for each;; [3]
Mark scheme, page 7
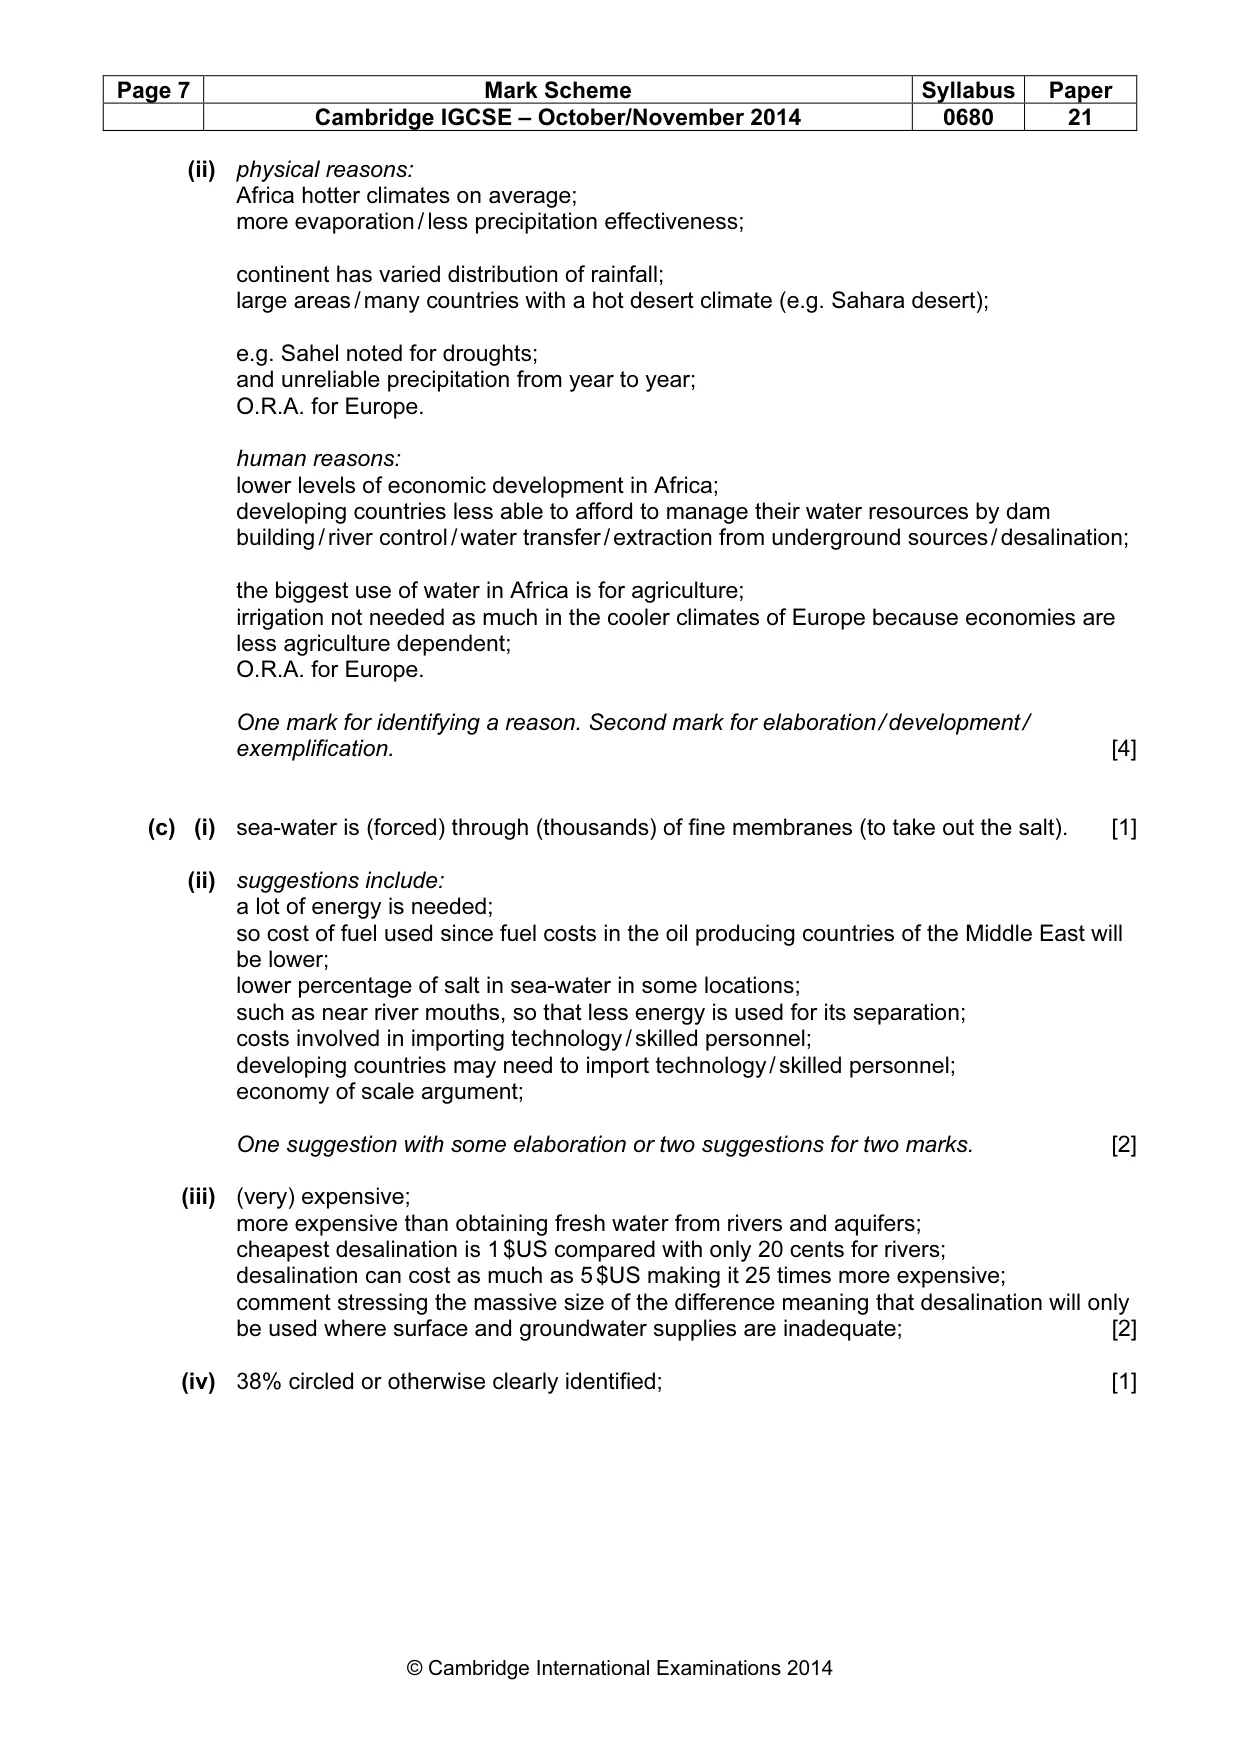
Page 7 Mark Scheme Syllabus Paper Cambridge IGCSE – October/November 2014 0680 21 © Cambridge International Examinations 2014 (ii) physical reasons: Africa hotter climates on average; more evaporation / less precipitation effectiveness; continent has varied distribution of rainfall; large areas / many countries with a hot desert climate (e.g. Sahara desert); e.g. Sahel noted for droughts; and unreliable precipitation from year to year; O.R.A. for Europe. human reasons: lower levels of economic development in Africa; developing countries less able to afford to manage their water resources by dam building / river control / water transfer / extraction from underground sources / desalination; the biggest use of water in Africa is for agriculture; irrigation not needed as much in the cooler climates of Europe because economies are less agriculture dependent; O.R.A. for Europe. One mark for identifying a reason. Second mark for elaboration / development / exemplification. [4] (c) (i) sea-water is (forced) through (thousands) of fine membranes (to take out the salt). [1] (ii) suggestions include: a lot of energy is needed; so cost of fuel used since fuel costs in the oil producing countries of the Middle East will be lower; lower percentage of salt in sea-water in some locations; such as near river mouths, so that less energy is used for its separation; costs involved in importing technology / skilled personnel; developing countries may need to import technology / skilled personnel; economy of scale argument; One suggestion with some elaboration or two suggestions for two marks. [2] (iii) (very) expensive; more expensive than obtaining fresh water from rivers and aquifers; cheapest desalination is 1 $US compared with only 20 cents for rivers; desalination can cost as much as 5 $US making it 25 times more expensive; comment stressing the massive size of the difference meaning that desalination will only be used where surface and groundwater supplies are inadequate; [2] (iv) 38% circled or otherwise clearly identified; [1]
Mark scheme, page 8
Page 8 Mark Scheme Syllabus Paper Cambridge IGCSE – October/November 2014 0680 21 © Cambridge International Examinations 2014 (v) they can afford it; lots of (valuable) oil; rich in energy sources; oil / gas; few / no alternative supplies / not water rich; as desert countries; population centres are close to the coast; sea-water is available; increasing demand for water; as rapid population growth / increased standard of living / urbanisation / tourism; [3] (vi) increase unlikely: can be justified by reference to massive costs; in an era of rising world energy costs / future energy crisis; likely to be increased only in countries where the water need is great and nothing cheaper is available; increase likely: in response to increased world need for water; due to rising world populations; rising standards of living; leading to increased consumption of water per head; as (energy prices fall / alternative energy becomes available) will be more likely; more food output to feed world's people will need more irrigation water; desalination might be the only local / national alternative, despite its costs; [2] (d) (i) most likely answer is to refer to water-efficient methods of irrigation, such as: trickle drip irrigation; root zone / clay pot irrigation; the method described emphasising how the water is targeted at plant roots; calculate water need of crop and just use that / not water excessively; to reduce wastes by seepage and evaporation; changing crops to ones which need less water for successful growth / increased use of drought resistant varieties / saline tolerant plants; water re use / reclamation / recycling; [3] (ii) salination; leaching (of minerals) / infertile; eutrophication; reduced river flow downstream from usage area; loss of wetland habitat; loss of biodiversity; waterlogged; Credit one development mark for any of these. [4] [Total: 80]
What you needed in this session
Cambridge’s own grade thresholds for 2014 Oct/Nov, Paper 2 · Variant 1. A higher threshold means an easier paper — the bar moves with how the cohort did.