Cambridge IGCSE Environmental Management 0680 — 2014 Oct/Nov Paper 2 · Variant 3
0680/23/O/N/14 · 80 marks · ≈90 min
The question paper and its mark scheme, free to read here and free to download. This is Cambridge’s own paper, exactly as it was sat.
Question paper16 pages
Mark scheme7 pages
Answers below. Sit the paper first if you are practising.
Paper as text
Question paper, page 1
This document consists of 16 printed pages. DC (SJF/SW) 91033/4 © UCLES 2014 [Turn over Cambridge International Examinations Cambridge International General Certificate of Secondary Education * 4 2 9 8 1 3 8 8 1 1 * ENVIRONMENTAL MANAGEMENT 0680/23 Paper 2 October/November 2014 1 hour 45 minutes Candidates answer on the Question Paper. Additional Materials: Ruler READ THESE INSTRUCTIONS FIRST Write your Centre number, candidate number and name on all the work you hand in. Write in dark blue or black pen. You may use an HB pencil for any diagrams or graphs. Do not use staples, paper clips, glue or correction fluid. DO NOT WRITE IN ANY BARCODES. Answer both questions. Electronic calculators may be used. You may lose marks if you do not show your working or if you do not use appropriate units. At the end of the examination, fasten all your work securely together. The number of marks is given in brackets [ ] at the end of each question or part question.
Question paper, page 2
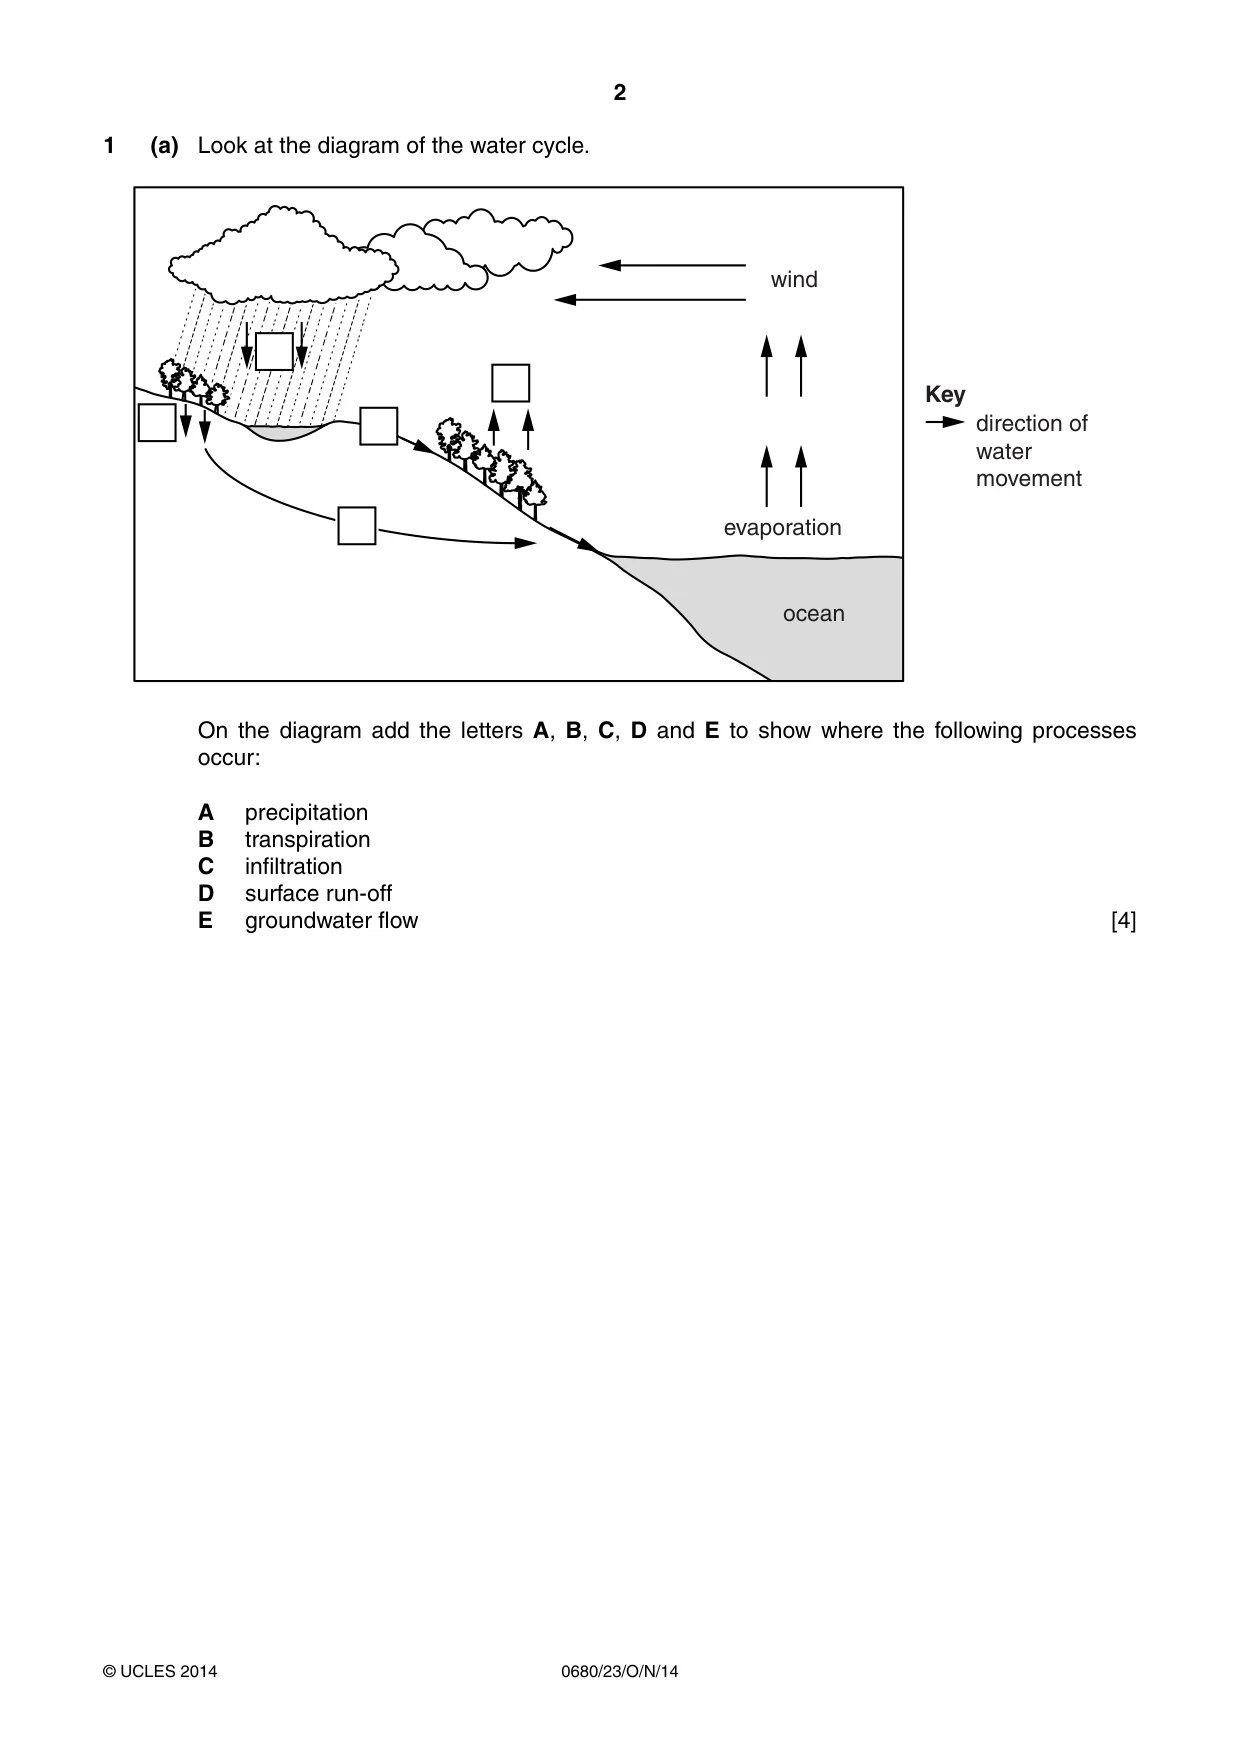
2 0680/23/O/N/14 © UCLES 2014 1 (a) Look at the diagram of the water cycle. Key direction of water movement wind evaporation ocean On the diagram add the letters A, B, C, D and E to show where the following processes occur: A precipitation B transpiration C infiltration D surface run-off E groundwater flow [4]
Question paper, page 3
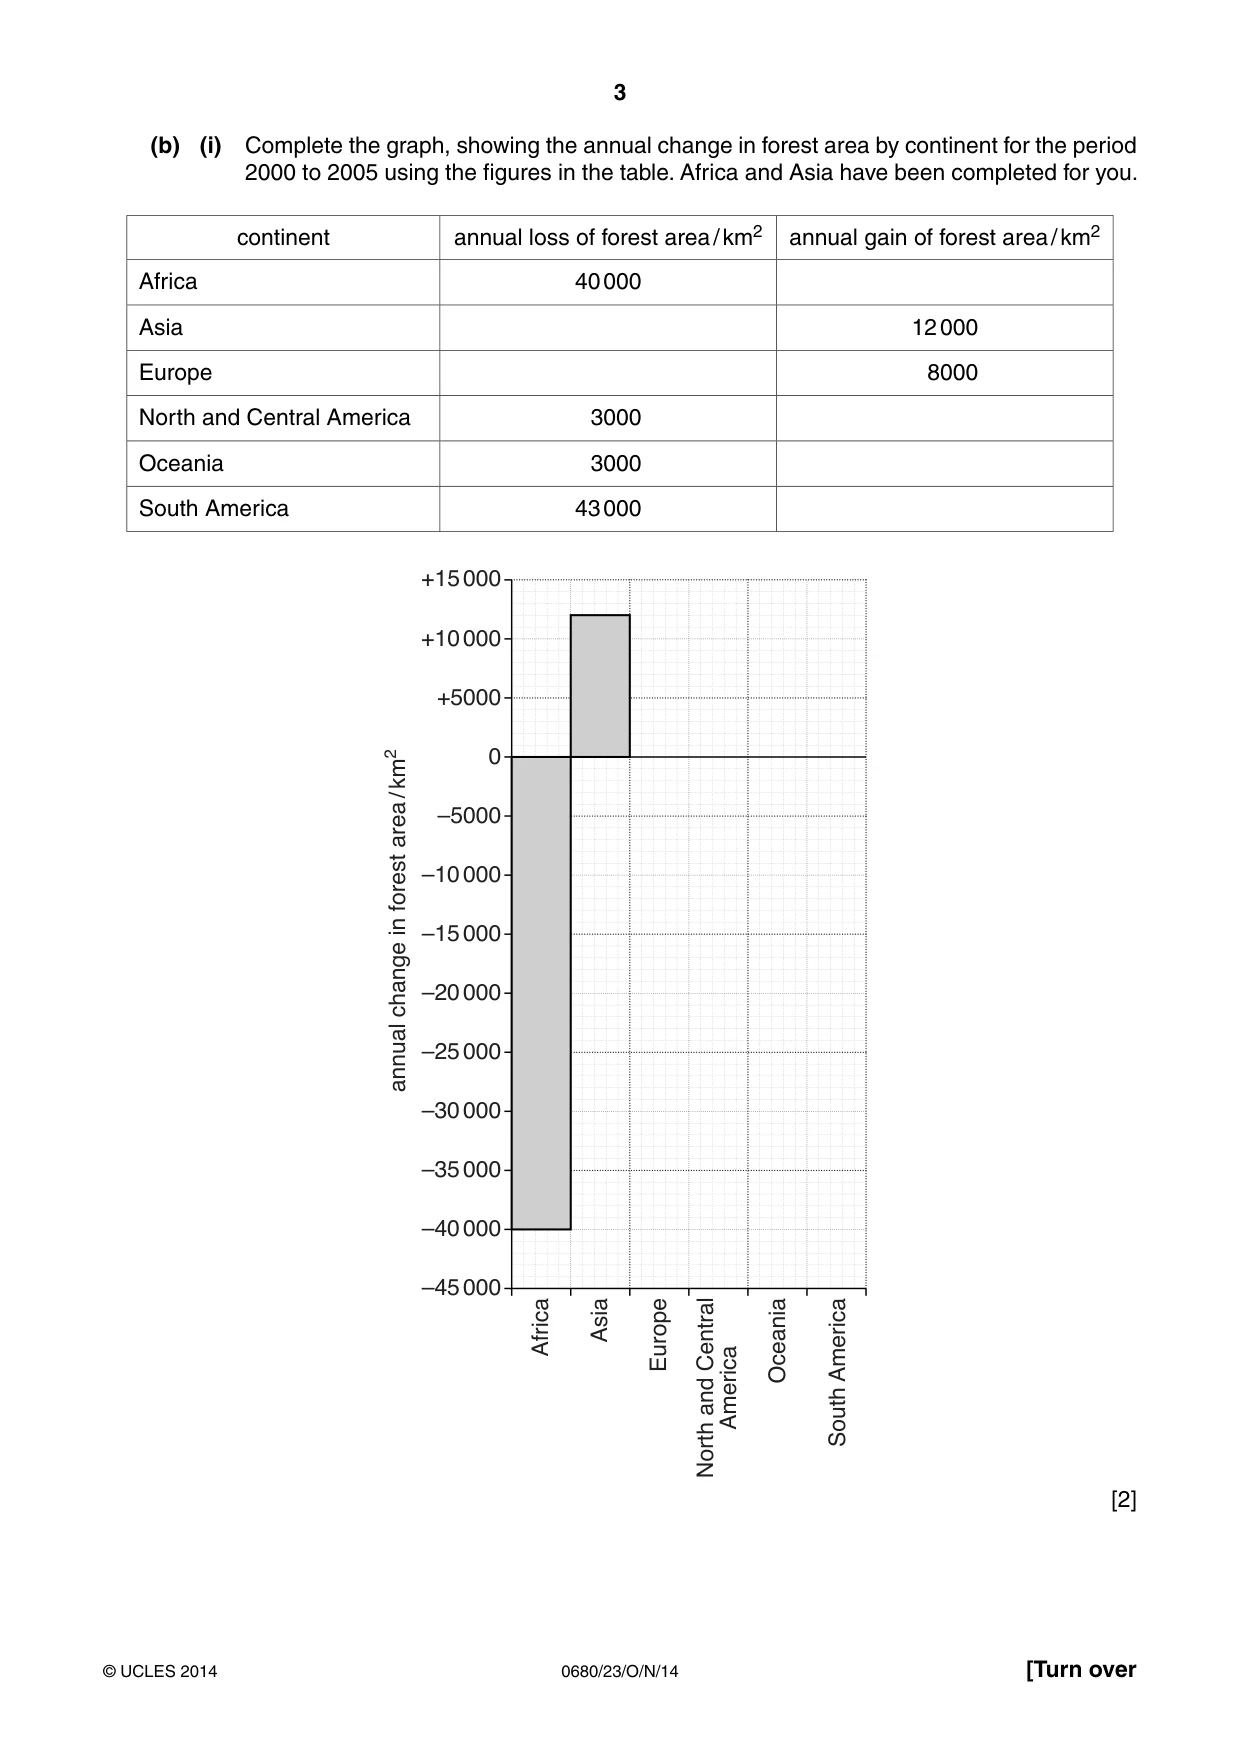
3 0680/23/O/N/14 © UCLES 2014 [Turn over (b) (i) Complete the graph, showing the annual change in forest area by continent for the period 2000 to 2005 using the figures in the table. Africa and Asia have been completed for you. continent annual loss of forest area / km2 annual gain of forest area / km2 Africa 40 000 Asia 12 000 Europe 8000 North and Central America 3000 Oceania 3000 South America 43 000 Africa –45 000 –40 000 –35 000 –30 000 –25 000 –20 000 –15 000 –10 000 –5000 0 annual change in forest area / km2 +5000 +10 000 +15 000 Asia Europe North and Central America Oceania South America [2]
Question paper, page 4
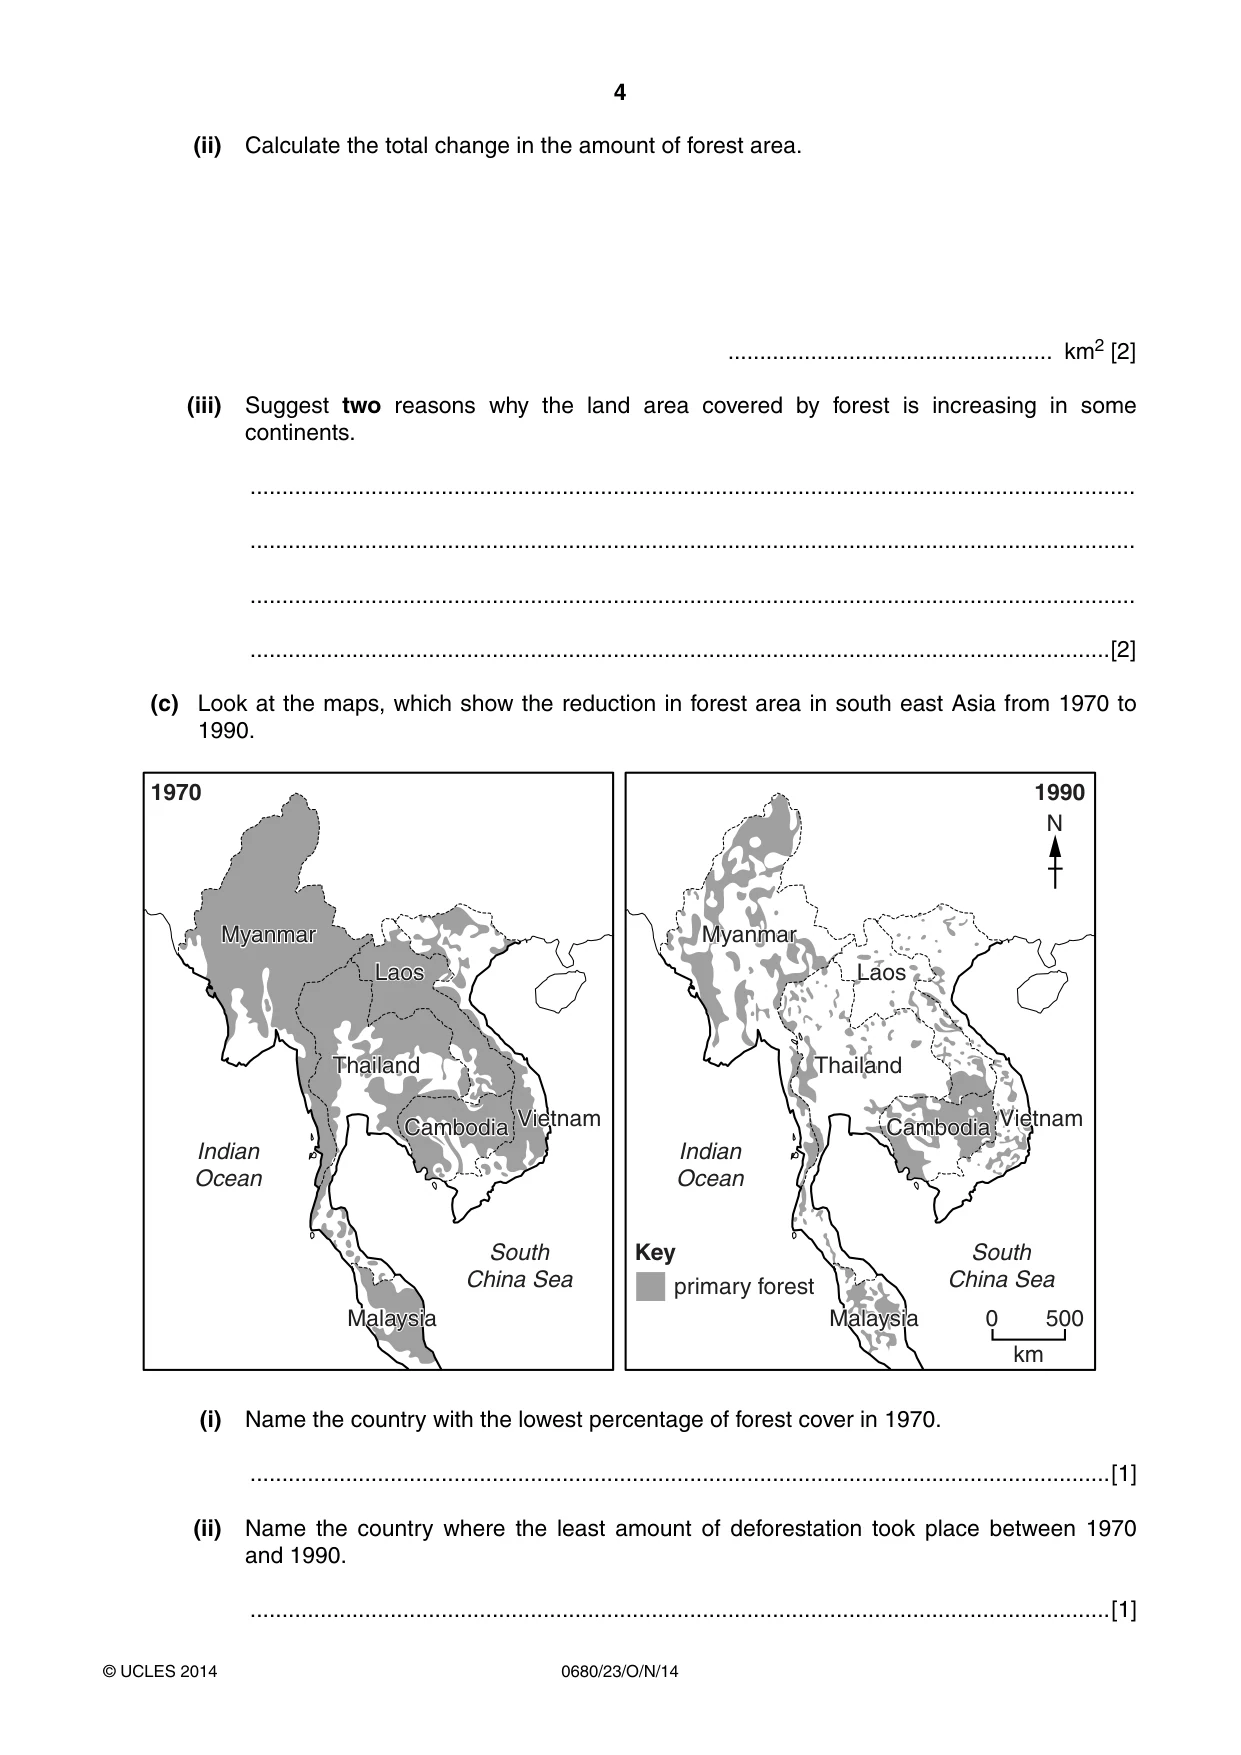
4 0680/23/O/N/14 © UCLES 2014 (ii) Calculate the total change in the amount of forest area. … km2 [2] (iii) Suggest two reasons why the land area covered by forest is increasing in some continents. … … … …[2] (c) Look at the maps, which show the reduction in forest area in south east Asia from 1970 to 1990. 0 500 km Myanmar Myanmar 1970 Laos Cambodia Vietnam South China Sea Indian Ocean Malaysia Thailand 1990 N Laos Cambodia Vietnam South China Sea Indian Ocean Malaysia Thailand Key primary forest (i) Name the country with the lowest percentage of forest cover in 1970. …[1] (ii) Name the country where the least amount of deforestation took place between 1970 and 1990. …[1]
Question paper, page 5
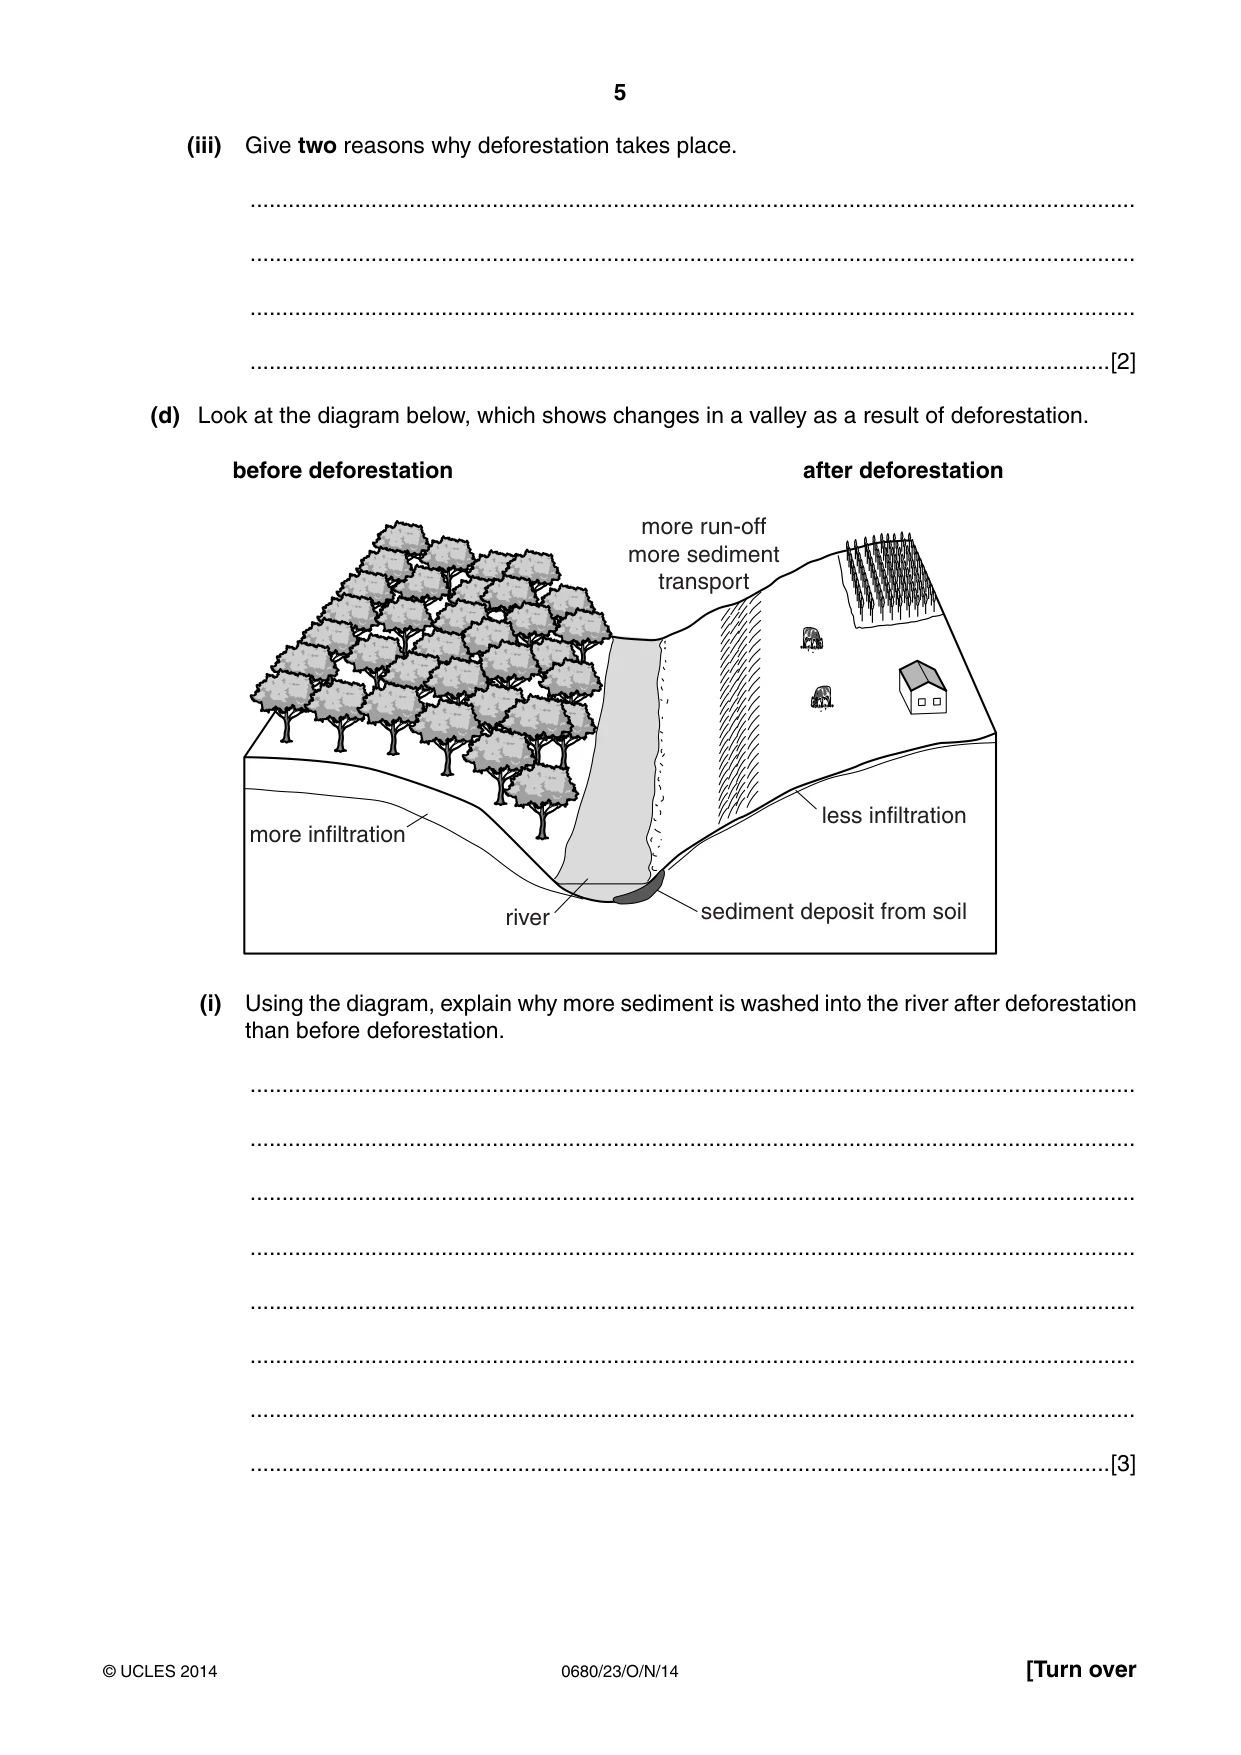
5 0680/23/O/N/14 © UCLES 2014 [Turn over (iii) Give two reasons why deforestation takes place. … … … …[2] (d) Look at the diagram below, which shows changes in a valley as a result of deforestation. before deforestation after deforestation sediment deposit from soil river more infiltration less infiltration more run-off more sediment transport (i) Using the diagram, explain why more sediment is washed into the river after deforestation than before deforestation. … … … … … … … …[3]
Question paper, page 6
6 0680/23/O/N/14 © UCLES 2014 (ii) Using the diagram, explain why the river is more likely to flood after deforestation. … … … … … …[3] (iii) Give one reason why a farmer, who has cleared the forest for farming, would want to stop the loss of soil into the river. … …[1] (iv) Describe how a farmer, who has cleared the forest for farming, could reduce the amount of soil being washed into the river. … … … … … …[3]
Question paper, page 7
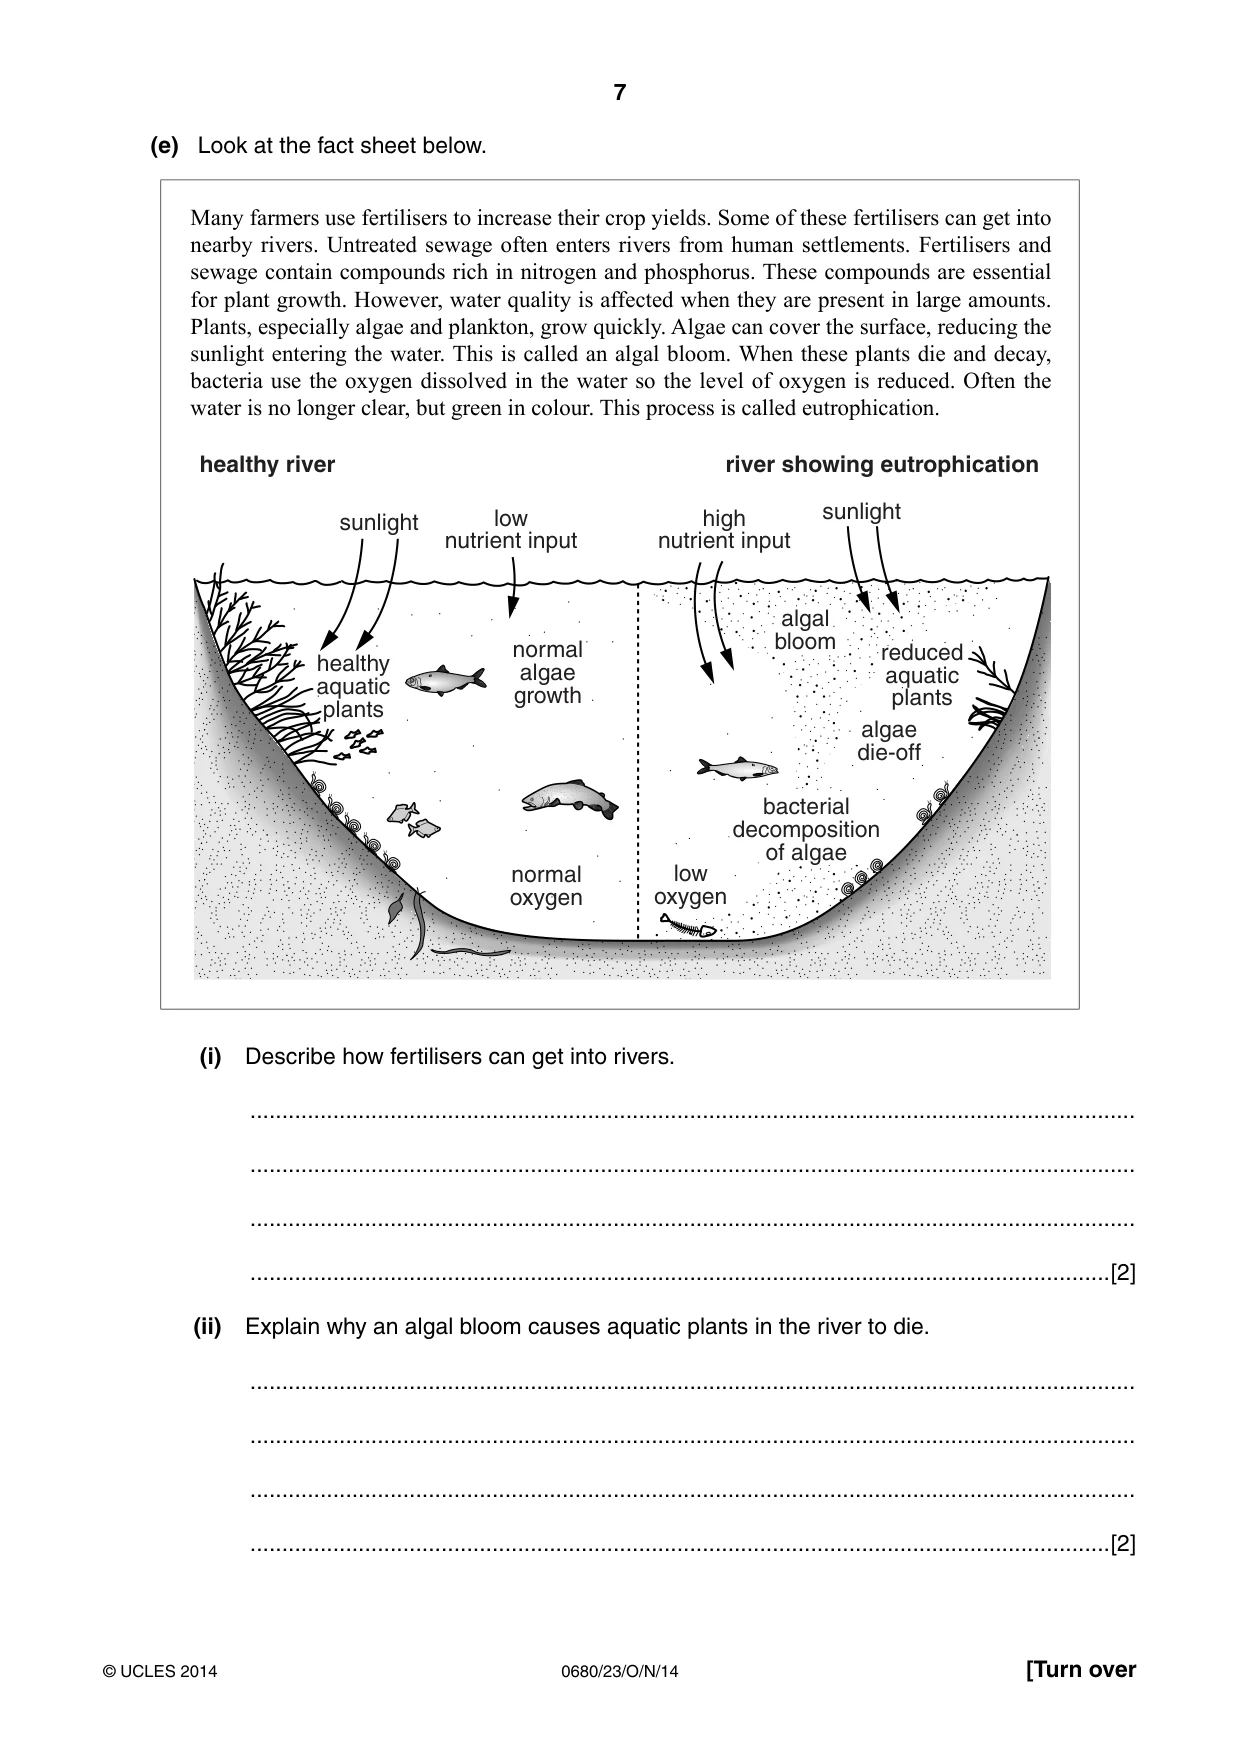
7 0680/23/O/N/14 © UCLES 2014 [Turn over (e) Look at the fact sheet below. Many farmers use fertilisers to increase their crop yields. Some of these fertilisers can get into nearby rivers. Untreated sewage often enters rivers from human settlements. Fertilisers and sewage contain compounds rich in nitrogen and phosphorus. These compounds are essential for plant growth. However, water quality is affected when they are present in large amounts. Plants, especially algae and plankton, grow quickly. Algae can cover the surface, reducing the sunlight entering the water. This is called an algal bloom. When these plants die and decay, bacteria use the oxygen dissolved in the water so the level of oxygen is reduced. Often the water is no longer clear, but green in colour. This process is called eutrophication. healthy aquatic plants reduced aquatic plants normal oxygen low oxygen bacterial decomposition of algae normal algae growth algae die-off algal bloom low nutrient input healthy river river showing eutrophication sunlight sunlight high nutrient input (i) Describe how fertilisers can get into rivers. … … … …[2] (ii) Explain why an algal bloom causes aquatic plants in the river to die. … … … …[2]
Question paper, page 8
8 0680/23/O/N/14 © UCLES 2014 (iii) Explain why eutrophication of a river can cause fish to die. … … … …[2] (iv) Suggest ways in which farmers and people living in settlements could reduce the risk of eutrophication described in the fact sheet. farmers … … … … people … … … …[4] (f) How far do you agree with the following statement? ‘We need to clear more forests for farmland to feed the increasing world population.’ Give reasons for your answer. … … … … … … … … … … … …[6] [Total: 40]
Question paper, page 9
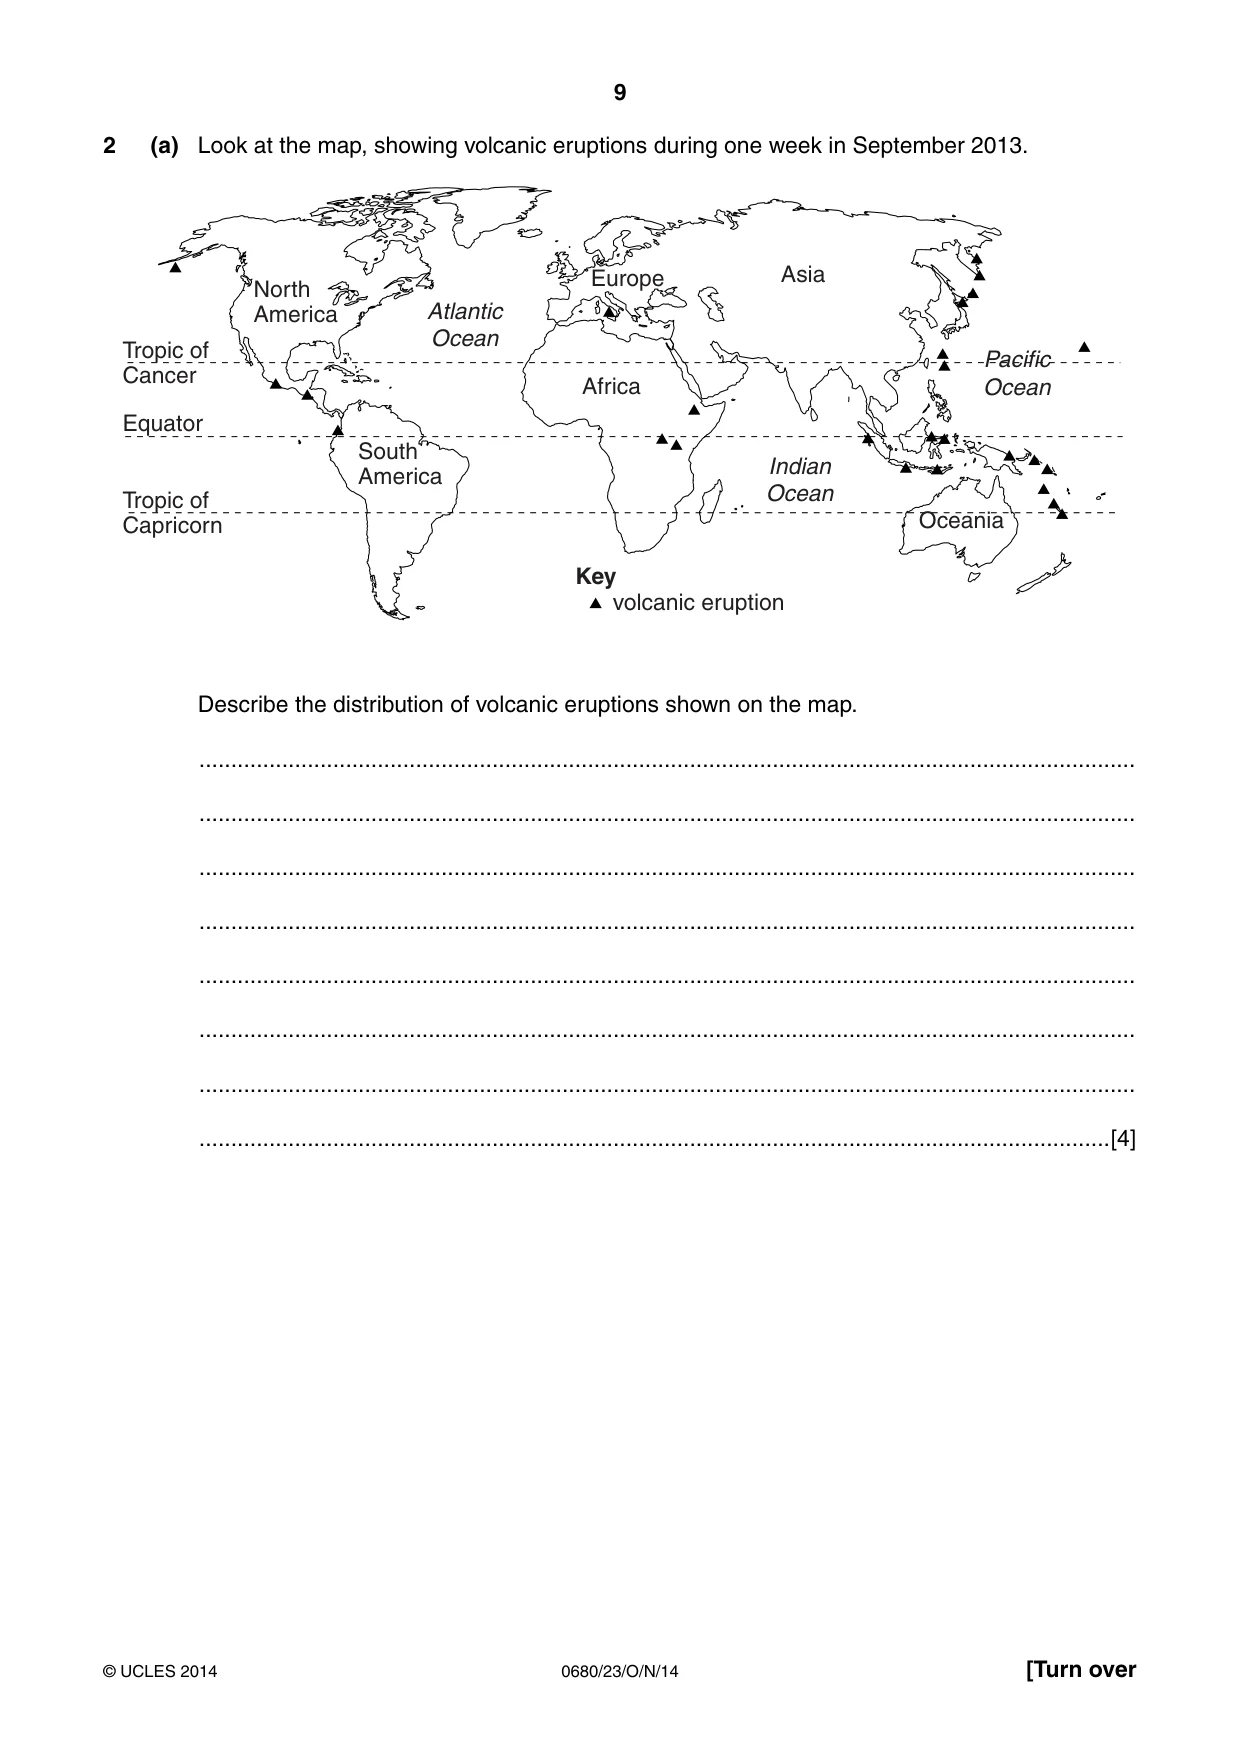
9 0680/23/O/N/14 © UCLES 2014 [Turn over 2 (a) Look at the map, showing volcanic eruptions during one week in September 2013. Tropic of Cancer Equator Tropic of Capricorn Asia Oceania Pacific Ocean Atlantic Ocean Indian Ocean Key volcanic eruption Europe Africa South America North America Describe the distribution of volcanic eruptions shown on the map. … … … … … … … …[4]
Question paper, page 10
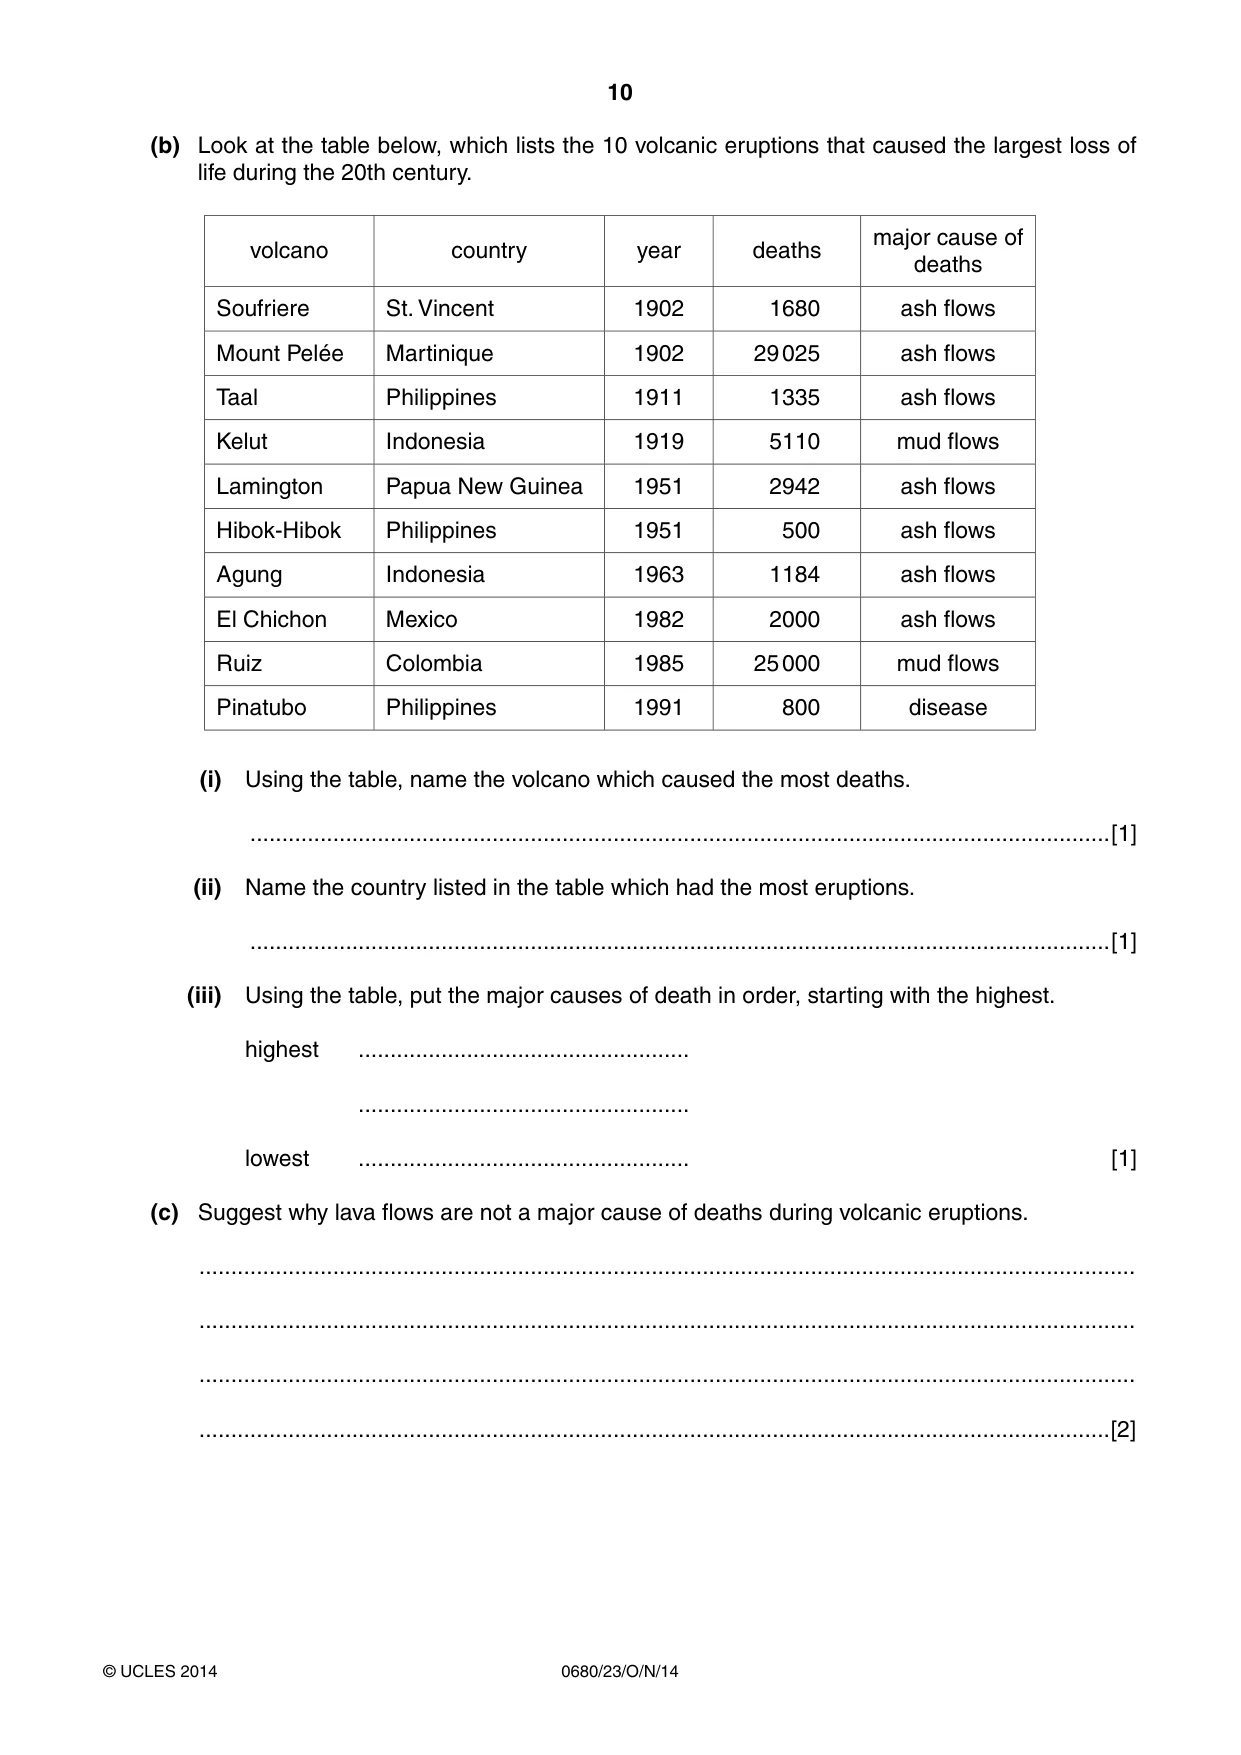
10 0680/23/O/N/14 © UCLES 2014 (b) Look at the table below, which lists the 10 volcanic eruptions that caused the largest loss of life during the 20th century. volcano country year deaths major cause of deaths Soufriere St. Vincent 1902 1680 ash flows Mount Pelée Martinique 1902 29 025 ash flows Taal Philippines 1911 1335 ash flows Kelut Indonesia 1919 5110 mud flows Lamington Papua New Guinea 1951 2942 ash flows Hibok-Hibok Philippines 1951 500 ash flows Agung Indonesia 1963 1184 ash flows El Chichon Mexico 1982 2000 ash flows Ruiz Colombia 1985 25 000 mud flows Pinatubo Philippines 1991 800 disease (i) Using the table, name the volcano which caused the most deaths. …[1] (ii) Name the country listed in the table which had the most eruptions. …[1] (iii) Using the table, put the major causes of death in order, starting with the highest. highest … … lowest … [1] (c) Suggest why lava flows are not a major cause of deaths during volcanic eruptions. … … … …[2]
Question paper, page 11
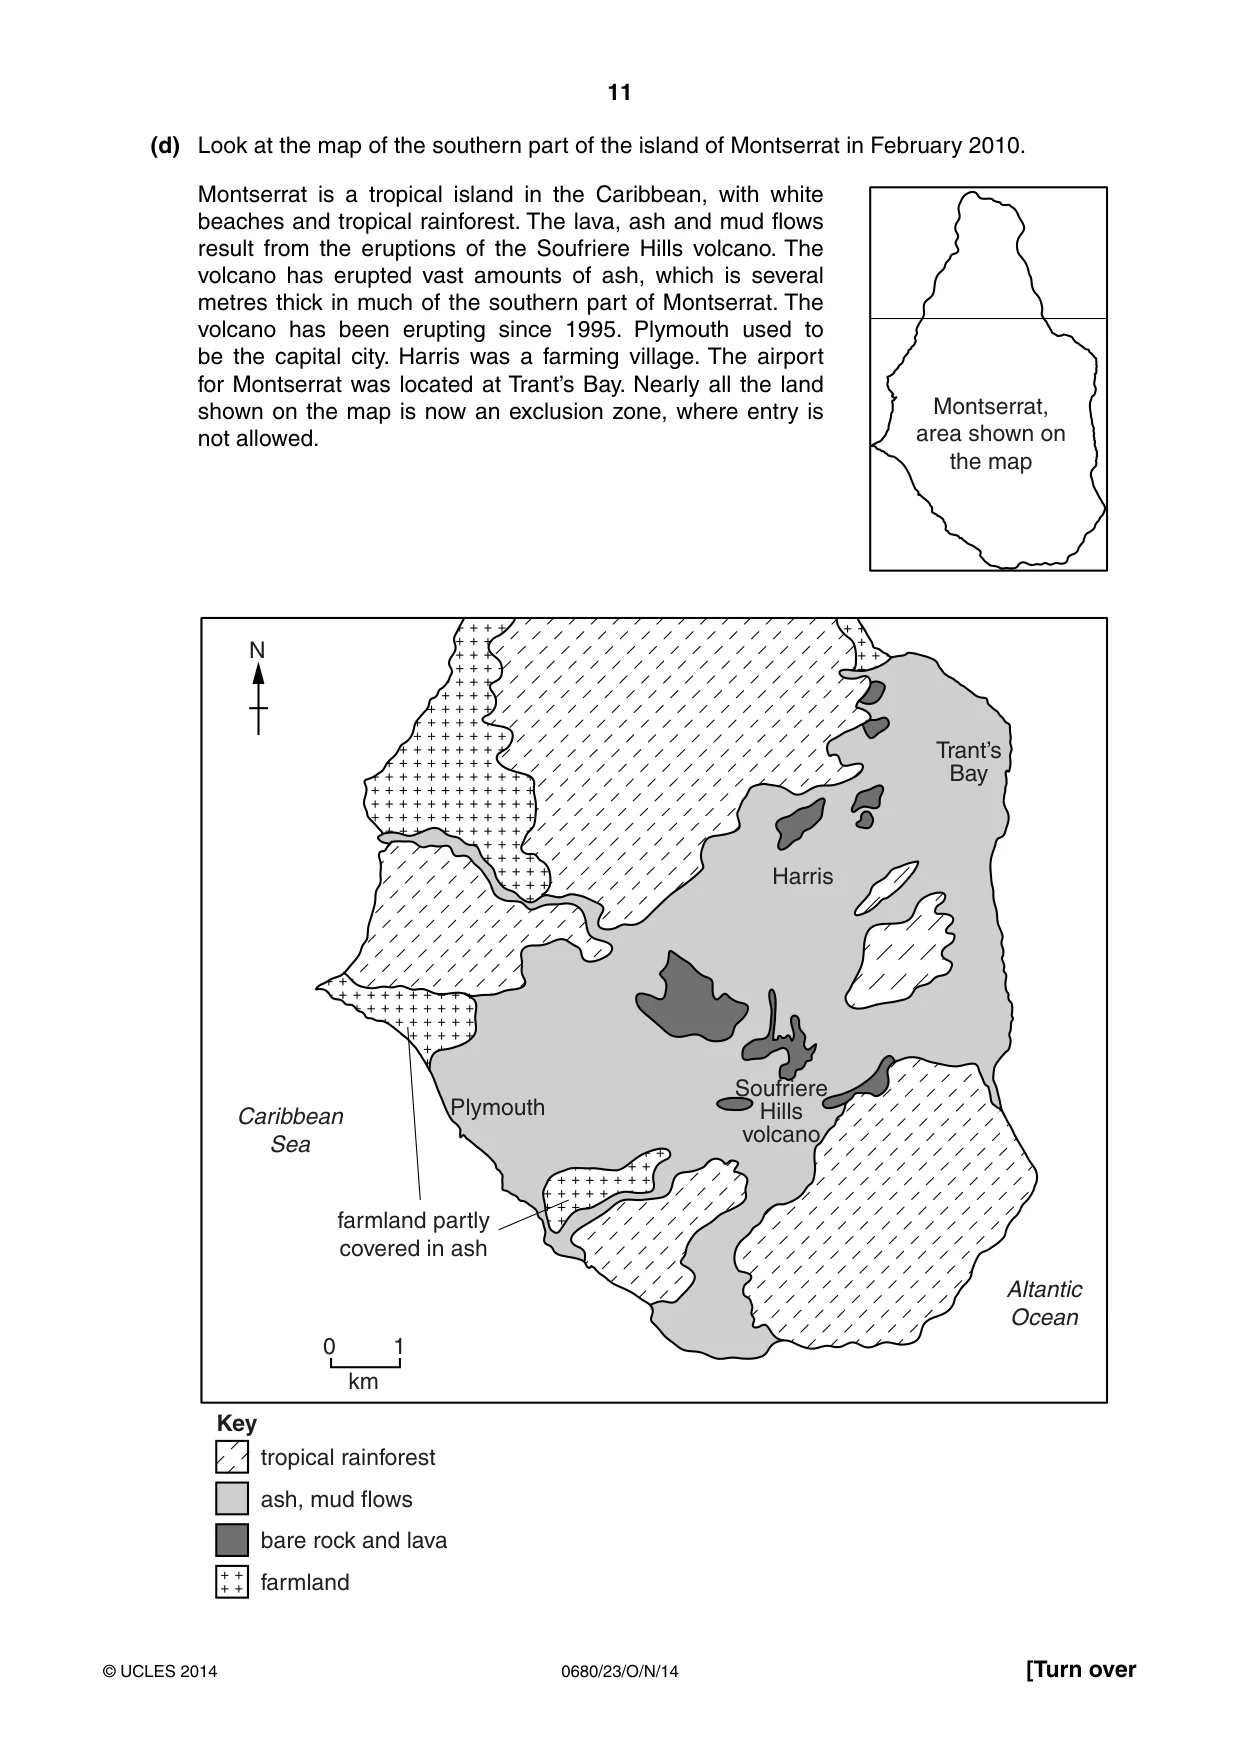
11 0680/23/O/N/14 © UCLES 2014 [Turn over (d) Look at the map of the southern part of the island of Montserrat in February 2010. 0 1 km N Harris Soufriere Hills volcano Plymouth Trant’s Bay Montserrat, area shown on the map Altantic Ocean Caribbean Sea farmland partly covered in ash tropical rainforest ash, mud flows bare rock and lava farmland Key Montserrat is a tropical island in the Caribbean, with white beaches and tropical rainforest. The lava, ash and mud flows result from the eruptions of the Soufriere Hills volcano. The volcano has erupted vast amounts of ash, which is several metres thick in much of the southern part of Montserrat. The volcano has been erupting since 1995. Plymouth used to be the capital city. Harris was a farming village. The airport for Montserrat was located at Trant’s Bay. Nearly all the land shown on the map is now an exclusion zone, where entry is not allowed.
Question paper, page 12
12 0680/23/O/N/14 © UCLES 2014 (i) Suggest why people are no longer allowed into the southern part of Montserrat. … …[2] (ii) Describe the effects of the continuing eruptions on the people and economy of Montserrat. … … … … … … … … … …[5]
Question paper, page 13
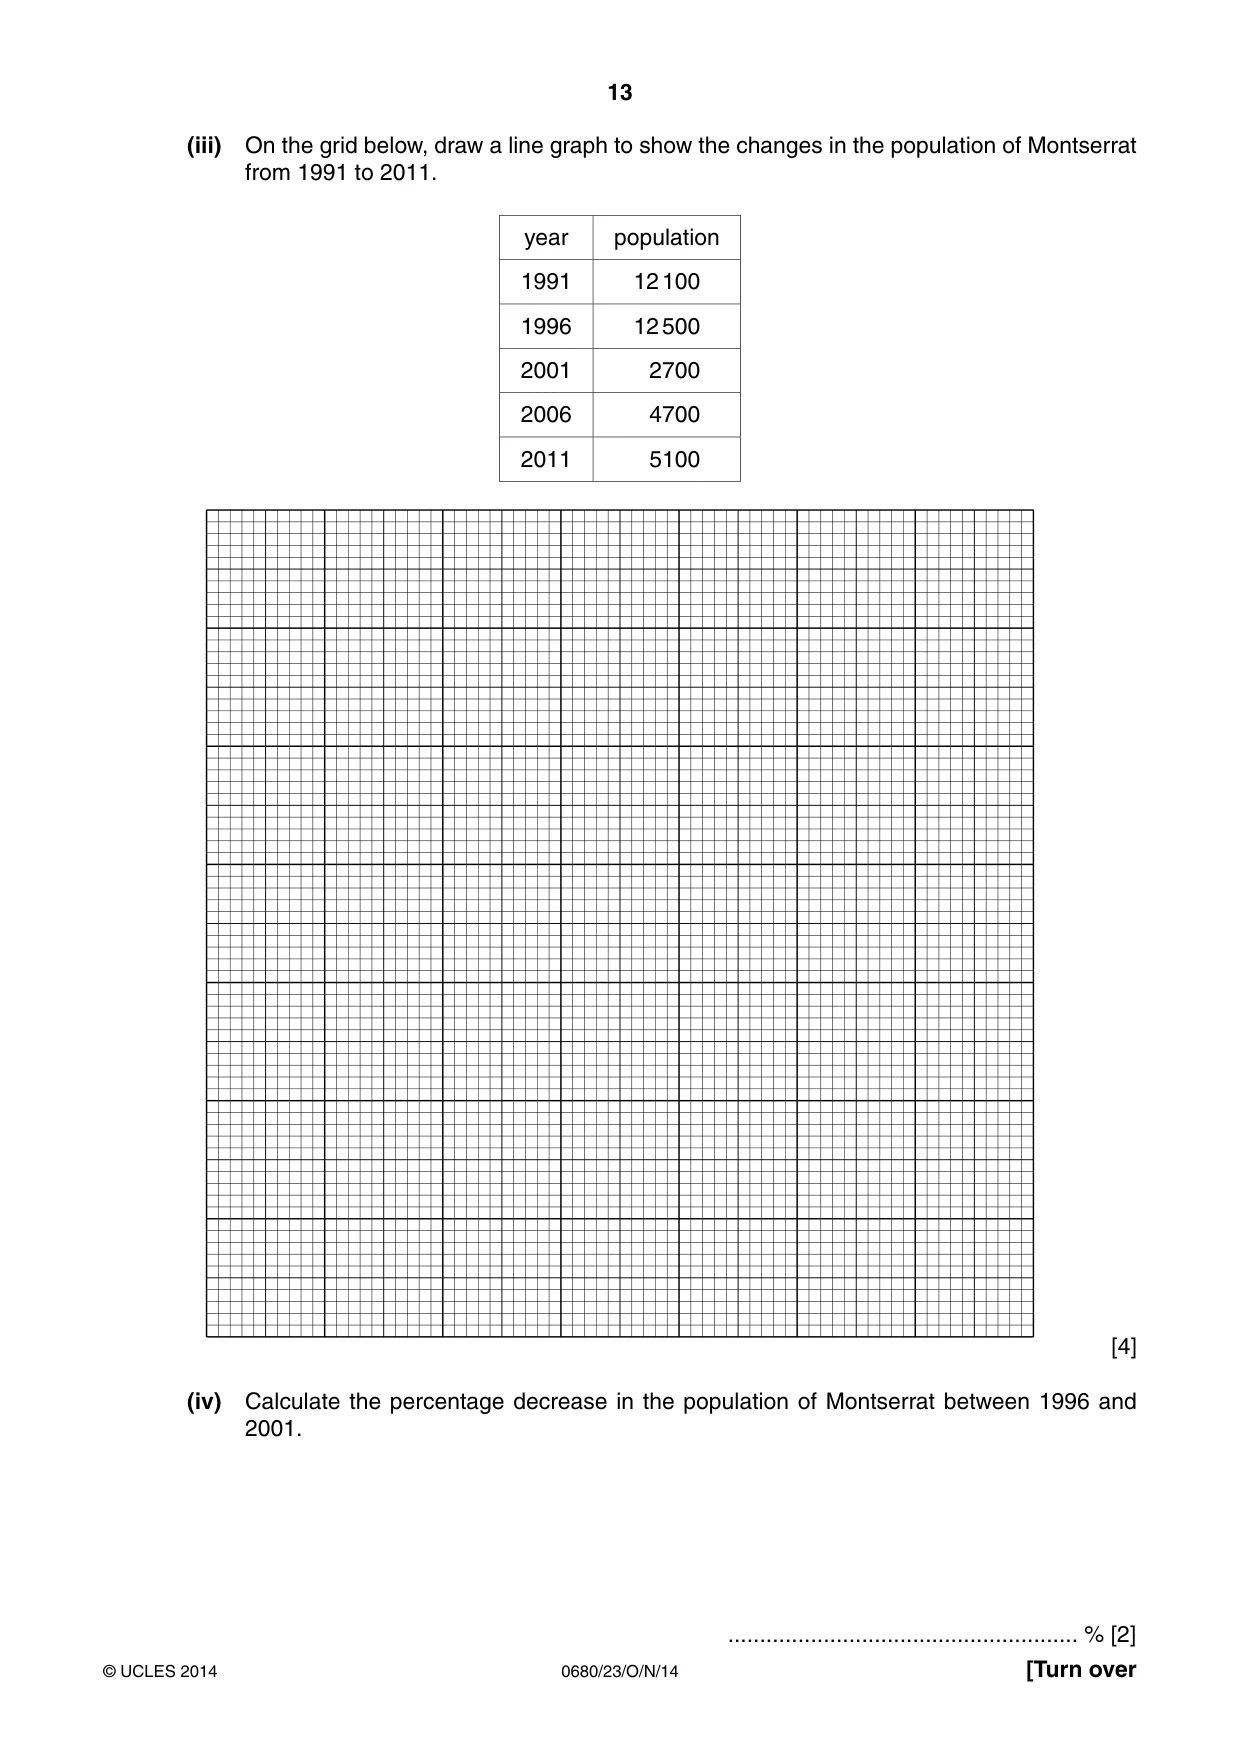
13 0680/23/O/N/14 © UCLES 2014 [Turn over (iii) On the grid below, draw a line graph to show the changes in the population of Montserrat from 1991 to 2011. year population 1991 12 100 1996 12 500 2001 2700 2006 4700 2011 5100 [4] (iv) Calculate the percentage decrease in the population of Montserrat between 1996 and 2001. … % [2]
Question paper, page 14
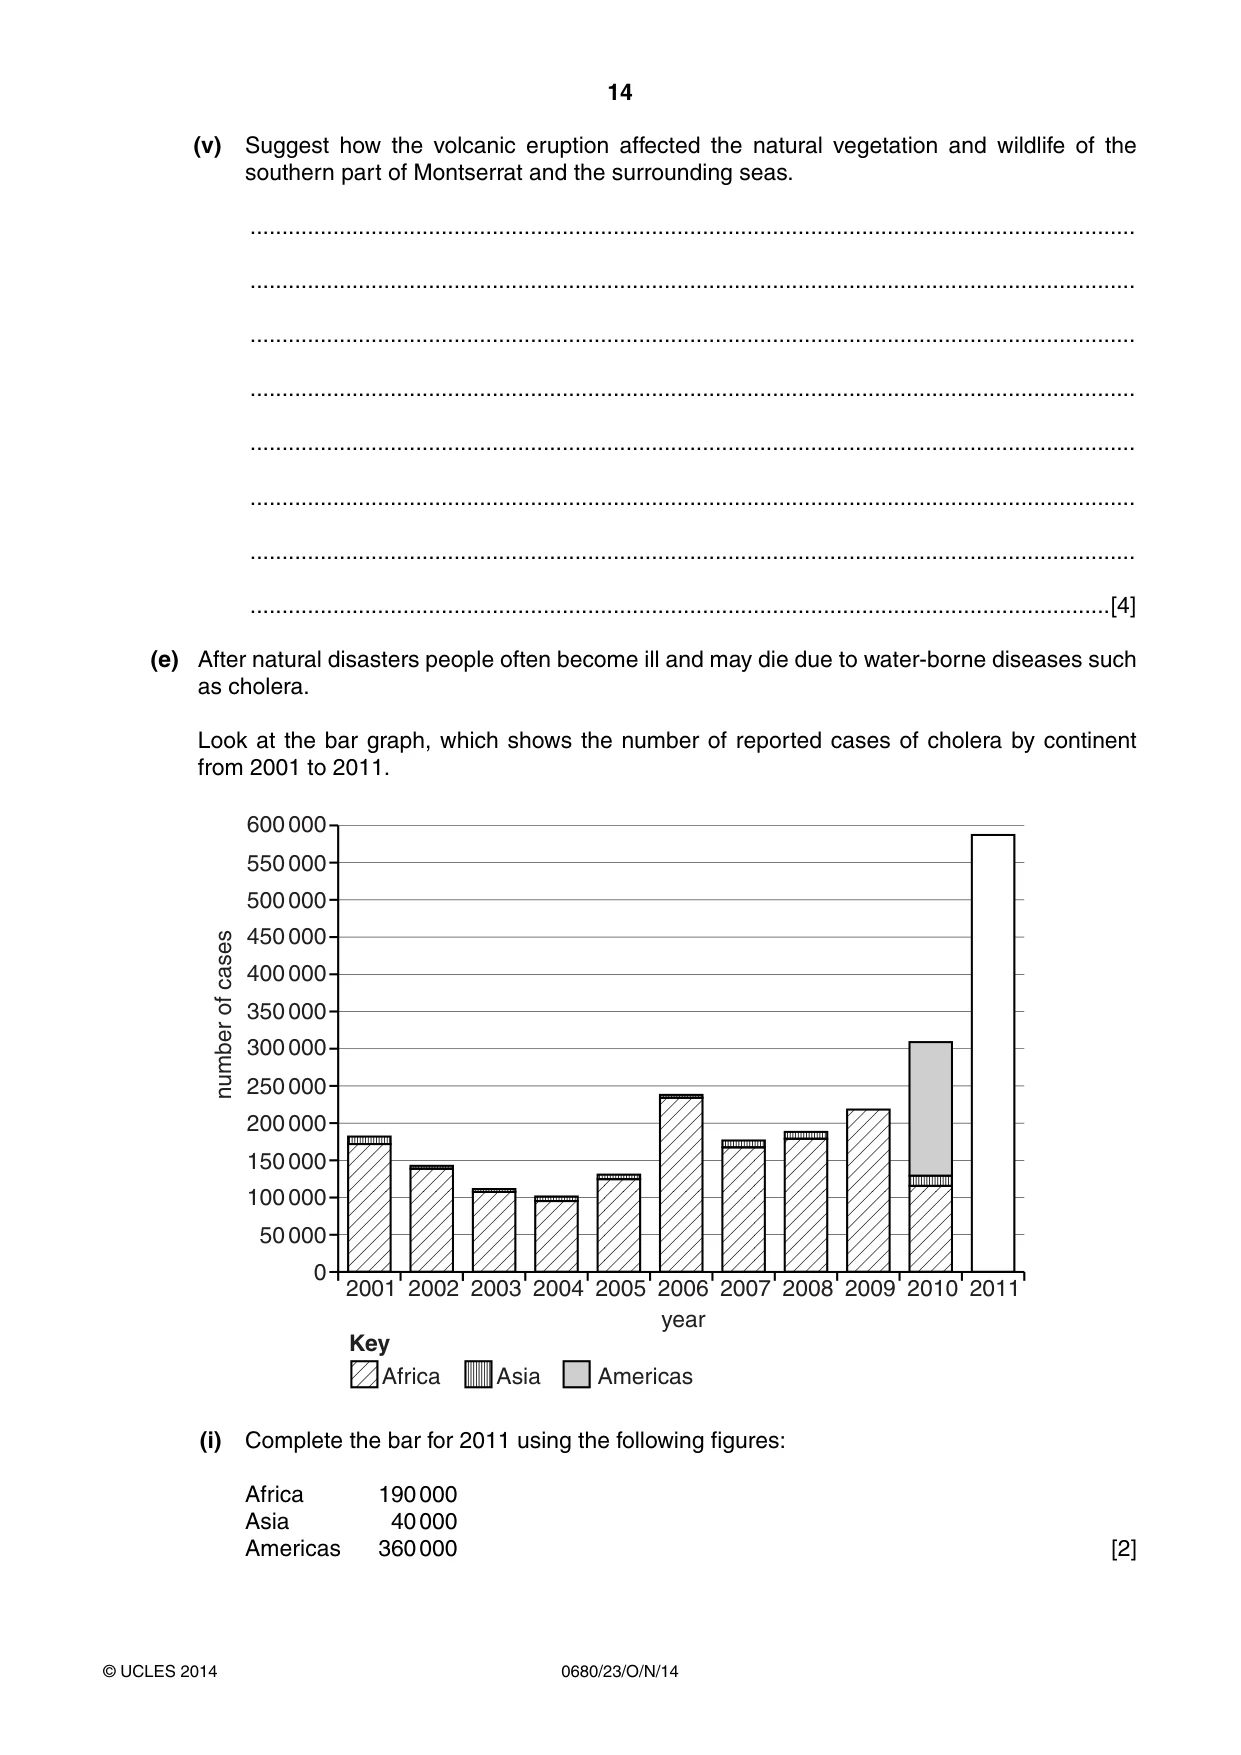
14 0680/23/O/N/14 © UCLES 2014 (v) Suggest how the volcanic eruption affected the natural vegetation and wildlife of the southern part of Montserrat and the surrounding seas. … … … … … … … …[4] (e) After natural disasters people often become ill and may die due to water-borne diseases such as cholera. Look at the bar graph, which shows the number of reported cases of cholera by continent from 2001 to 2011. 600 000 500 000 400 000 300 000 200 000 number of cases 100 000 0 550 000 450 000 350 000 250 000 150 000 50 000 2001 2002 2003 2004 2005 2006 year 2007 2008 2009 2010 2011 Americas Asia Key Africa (i) Complete the bar for 2011 using the following figures: Africa 190 000 Asia 40 000 Americas 360 000 [2]
Question paper, page 15
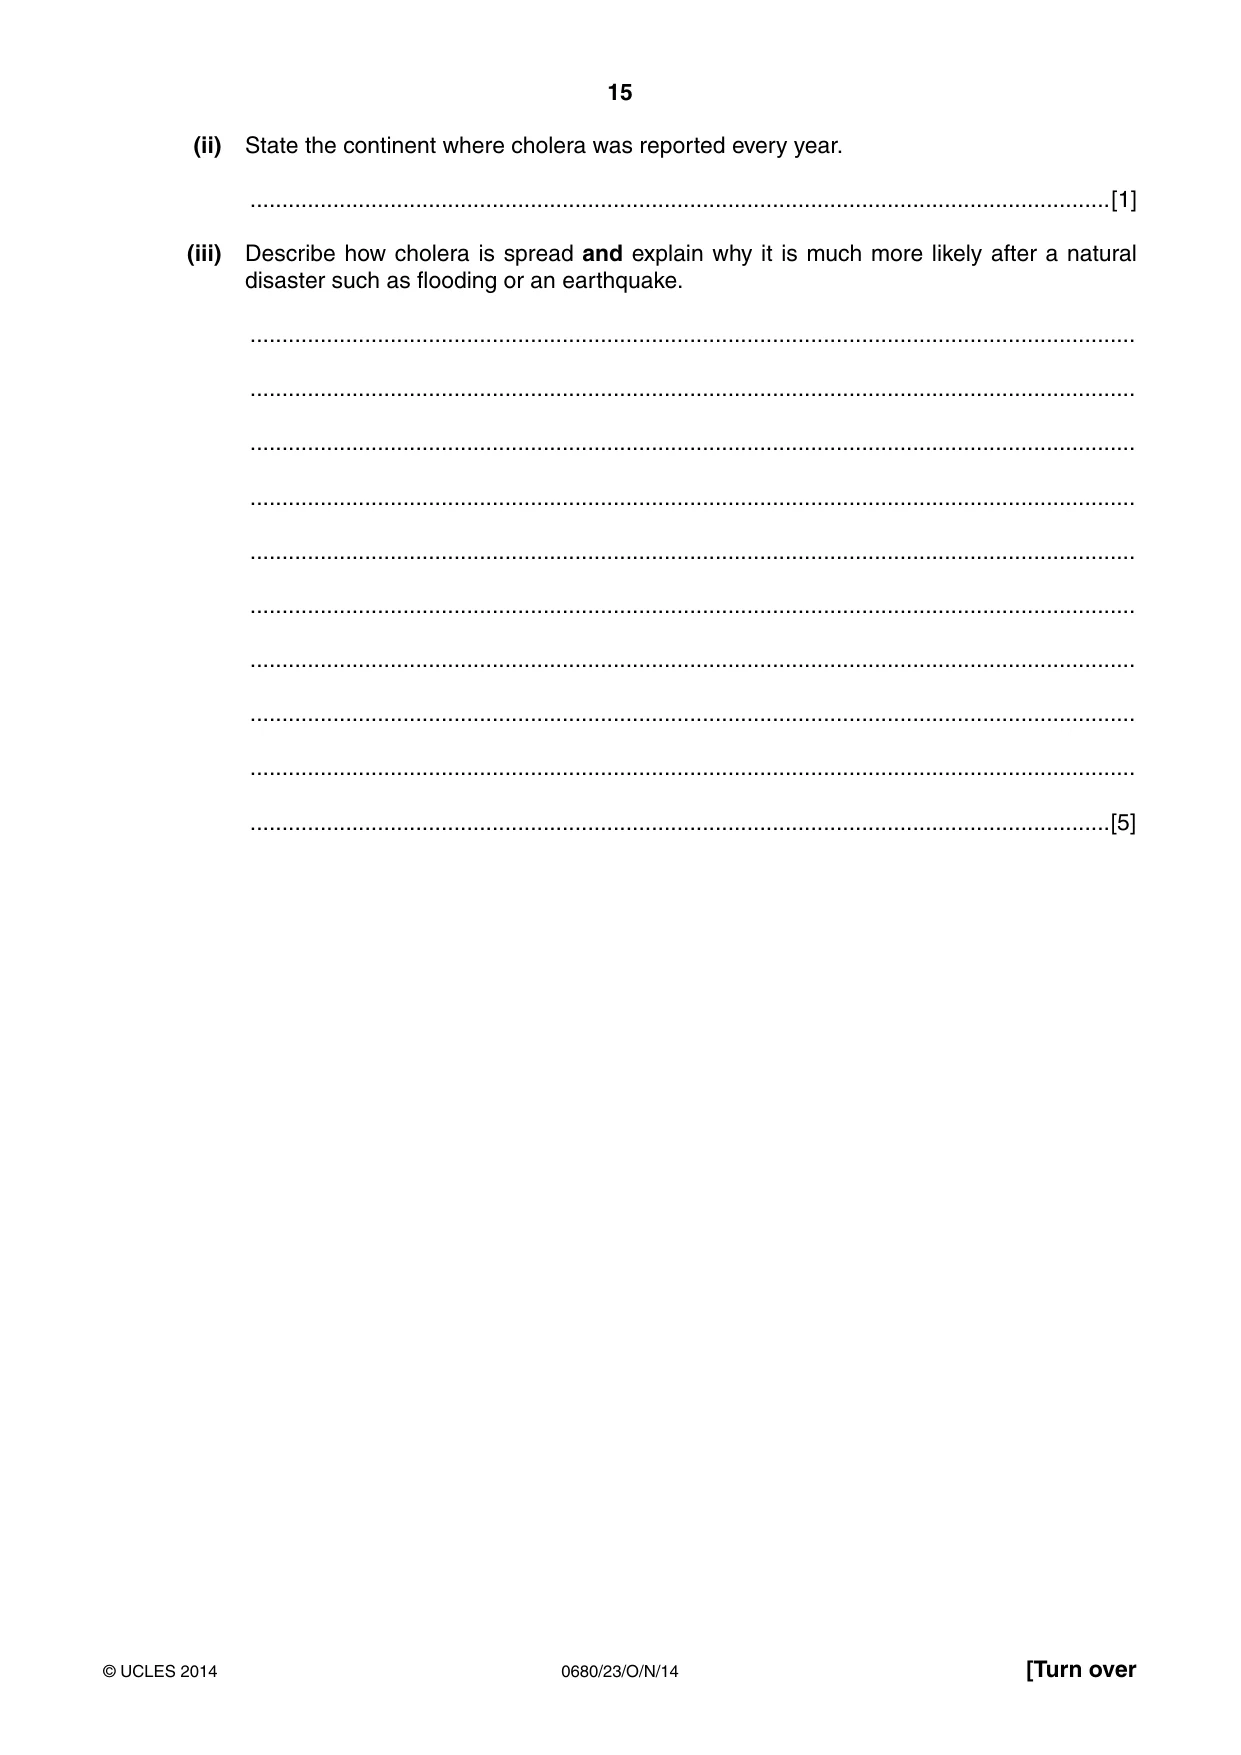
15 0680/23/O/N/14 © UCLES 2014 [Turn over (ii) State the continent where cholera was reported every year. …[1] (iii) Describe how cholera is spread and explain why it is much more likely after a natural disaster such as flooding or an earthquake. … … … … … … … … … …[5]
Question paper, page 16
16 0680/23/O/N/14 © UCLES 2014 Permission to reproduce items where third-party owned material protected by copyright is included has been sought and cleared where possible. Every reasonable effort has been made by the publisher (UCLES) to trace copyright holders, but if any items requiring clearance have unwittingly been included, the publisher will be pleased to make amends at the earliest possible opportunity. Cambridge International Examinations is part of the Cambridge Assessment Group. Cambridge Assessment is the brand name of University of Cambridge Local Examinations Syndicate (UCLES), which is itself a department of the University of Cambridge. (f) Malaria is a water-bred disease, which kills many people every year. (i) Explain why malaria is a water-bred disease. … … … …[2] (ii) Suggest the best ways to control the spread of malaria. Give reasons for your answer. … … … … … … … …[4] [Total: 40]
Mark scheme, page 1
® IGCSE is the registered trademark of Cambridge International Examinations. CAMBRIDGE INTERNATIONAL EXAMINATIONS Cambridge International General Certificate of Secondary Education MARK SCHEME for the October/November 2014 series 0680 ENVIRONMENTAL MANAGEMENT 0680/23 Paper 2, maximum raw mark 80 This mark scheme is published as an aid to teachers and candidates, to indicate the requirements of the examination. It shows the basis on which Examiners were instructed to award marks. It does not indicate the details of the discussions that took place at an Examiners’ meeting before marking began, which would have considered the acceptability of alternative answers. Mark schemes should be read in conjunction with the question paper and the Principal Examiner Report for Teachers. Cambridge will not enter into discussions about these mark schemes. Cambridge is publishing the mark schemes for the October/November 2014 series for most Cambridge IGCSE®, Cambridge International A and AS Level components and some Cambridge O Level components.
Mark scheme, page 2
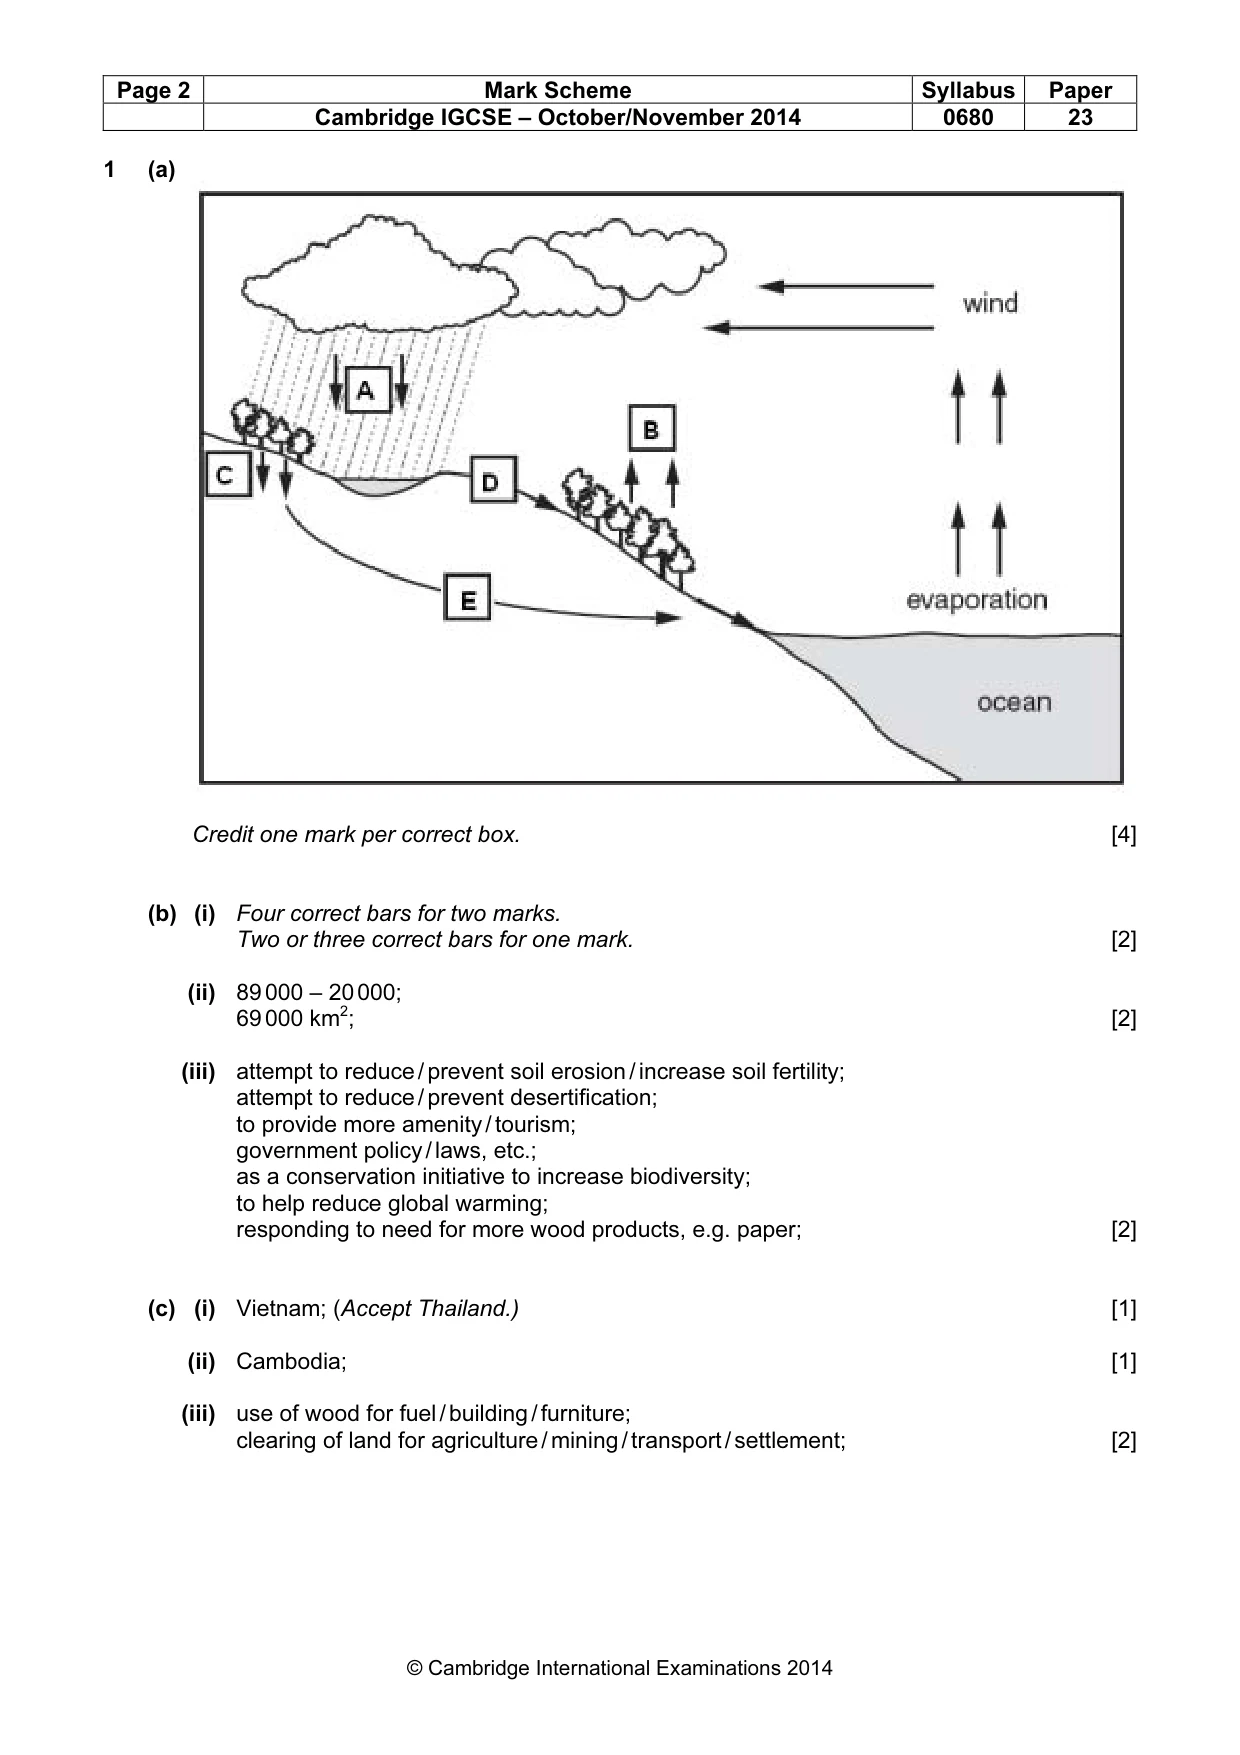
Page 2 Mark Scheme Syllabus Paper Cambridge IGCSE – October/November 2014 0680 23 © Cambridge International Examinations 2014 1 (a) Credit one mark per correct box. [4] (b) (i) Four correct bars for two marks. Two or three correct bars for one mark. [2] (ii) 89 000 – 20 000; 69 000 km2; [2] (iii) attempt to reduce / prevent soil erosion / increase soil fertility; attempt to reduce / prevent desertification; to provide more amenity / tourism; government policy / laws, etc.; as a conservation initiative to increase biodiversity; to help reduce global warming; responding to need for more wood products, e.g. paper; [2] (c) (i) Vietnam; (Accept Thailand.) [1] (ii) Cambodia; [1] (iii) use of wood for fuel / building / furniture; clearing of land for agriculture / mining / transport / settlement; [2]
Mark scheme, page 3
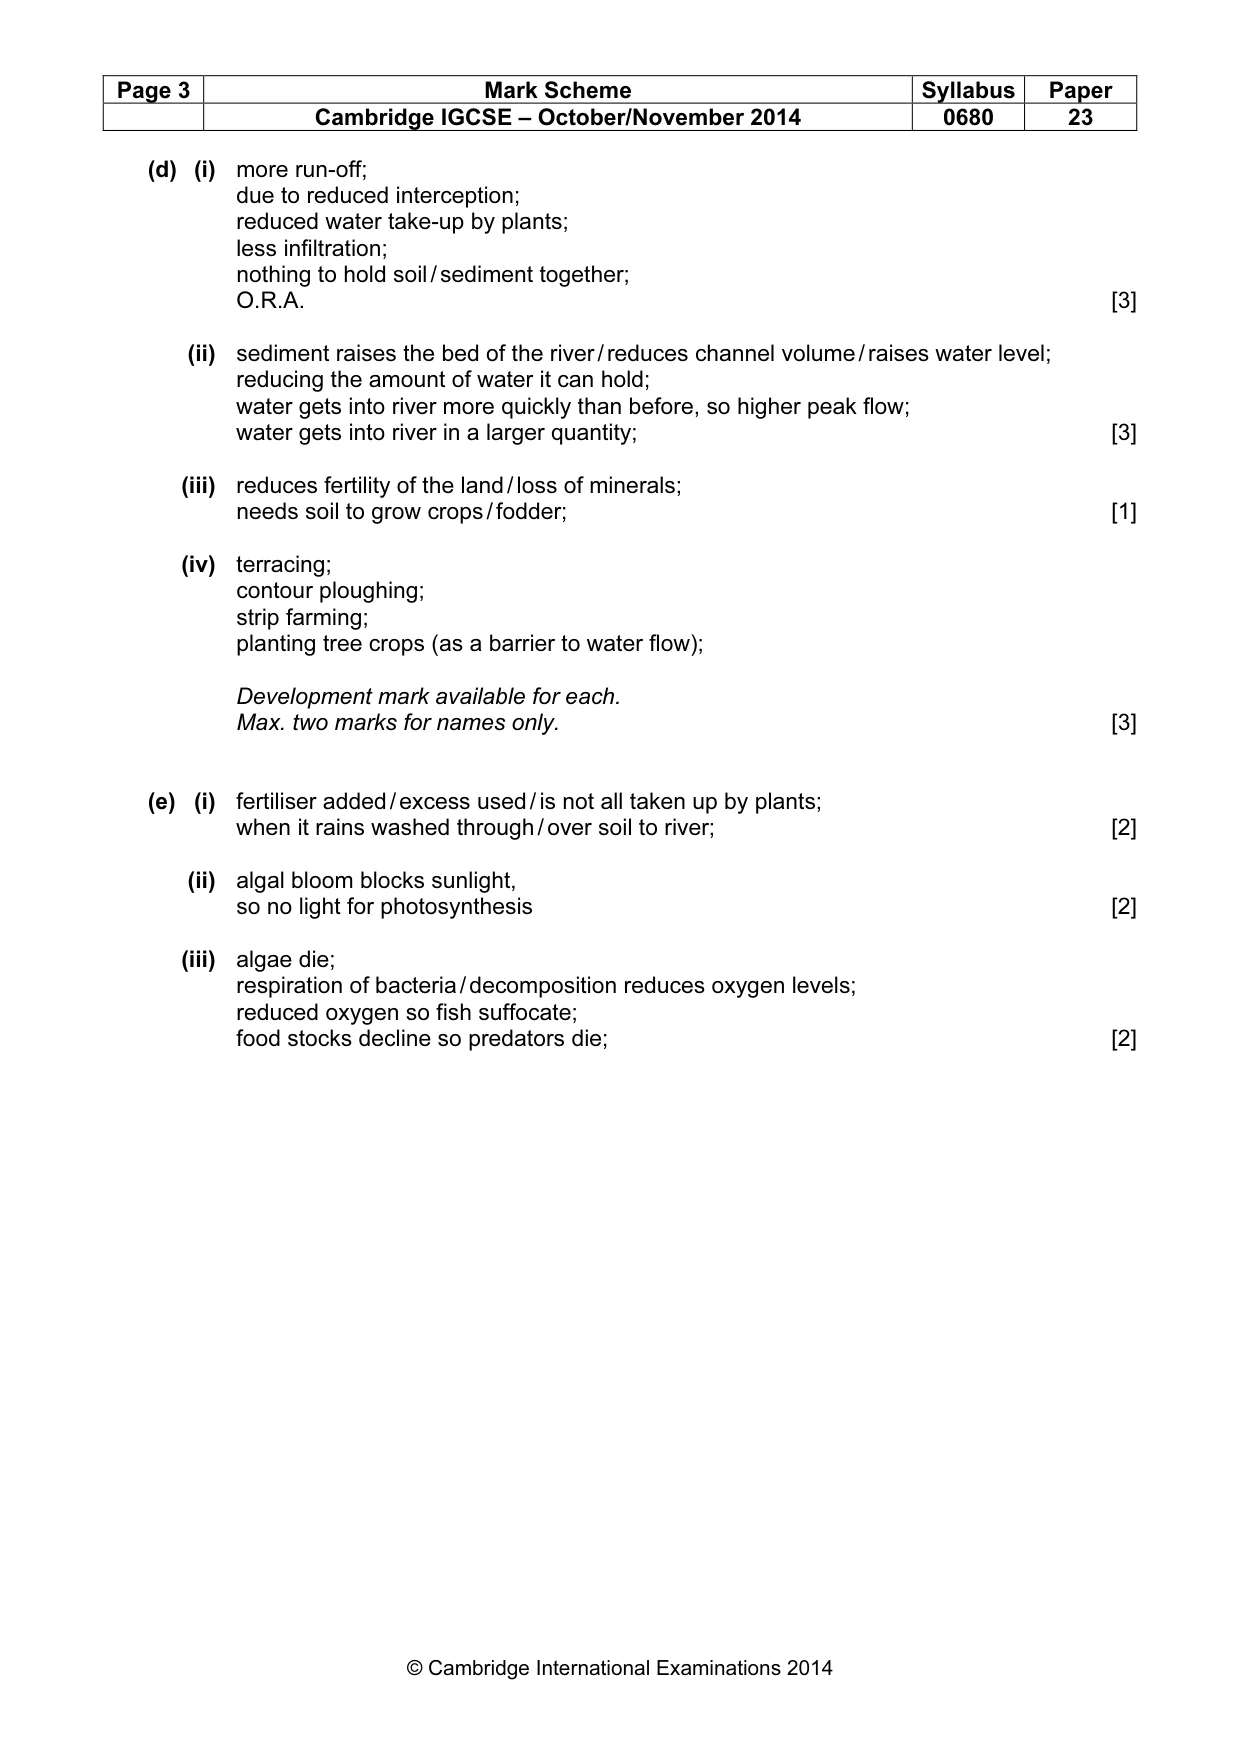
Page 3 Mark Scheme Syllabus Paper Cambridge IGCSE – October/November 2014 0680 23 © Cambridge International Examinations 2014 (d) (i) more run-off; due to reduced interception; reduced water take-up by plants; less infiltration; nothing to hold soil / sediment together; O.R.A. [3] (ii) sediment raises the bed of the river / reduces channel volume / raises water level; reducing the amount of water it can hold; water gets into river more quickly than before, so higher peak flow; water gets into river in a larger quantity; [3] (iii) reduces fertility of the land / loss of minerals; needs soil to grow crops / fodder; [1] (iv) terracing; contour ploughing; strip farming; planting tree crops (as a barrier to water flow); Development mark available for each. Max. two marks for names only. [3] (e) (i) fertiliser added / excess used / is not all taken up by plants; when it rains washed through / over soil to river; [2] (ii) algal bloom blocks sunlight, so no light for photosynthesis [2] (iii) algae die; respiration of bacteria / decomposition reduces oxygen levels; reduced oxygen so fish suffocate; food stocks decline so predators die; [2]
Mark scheme, page 4
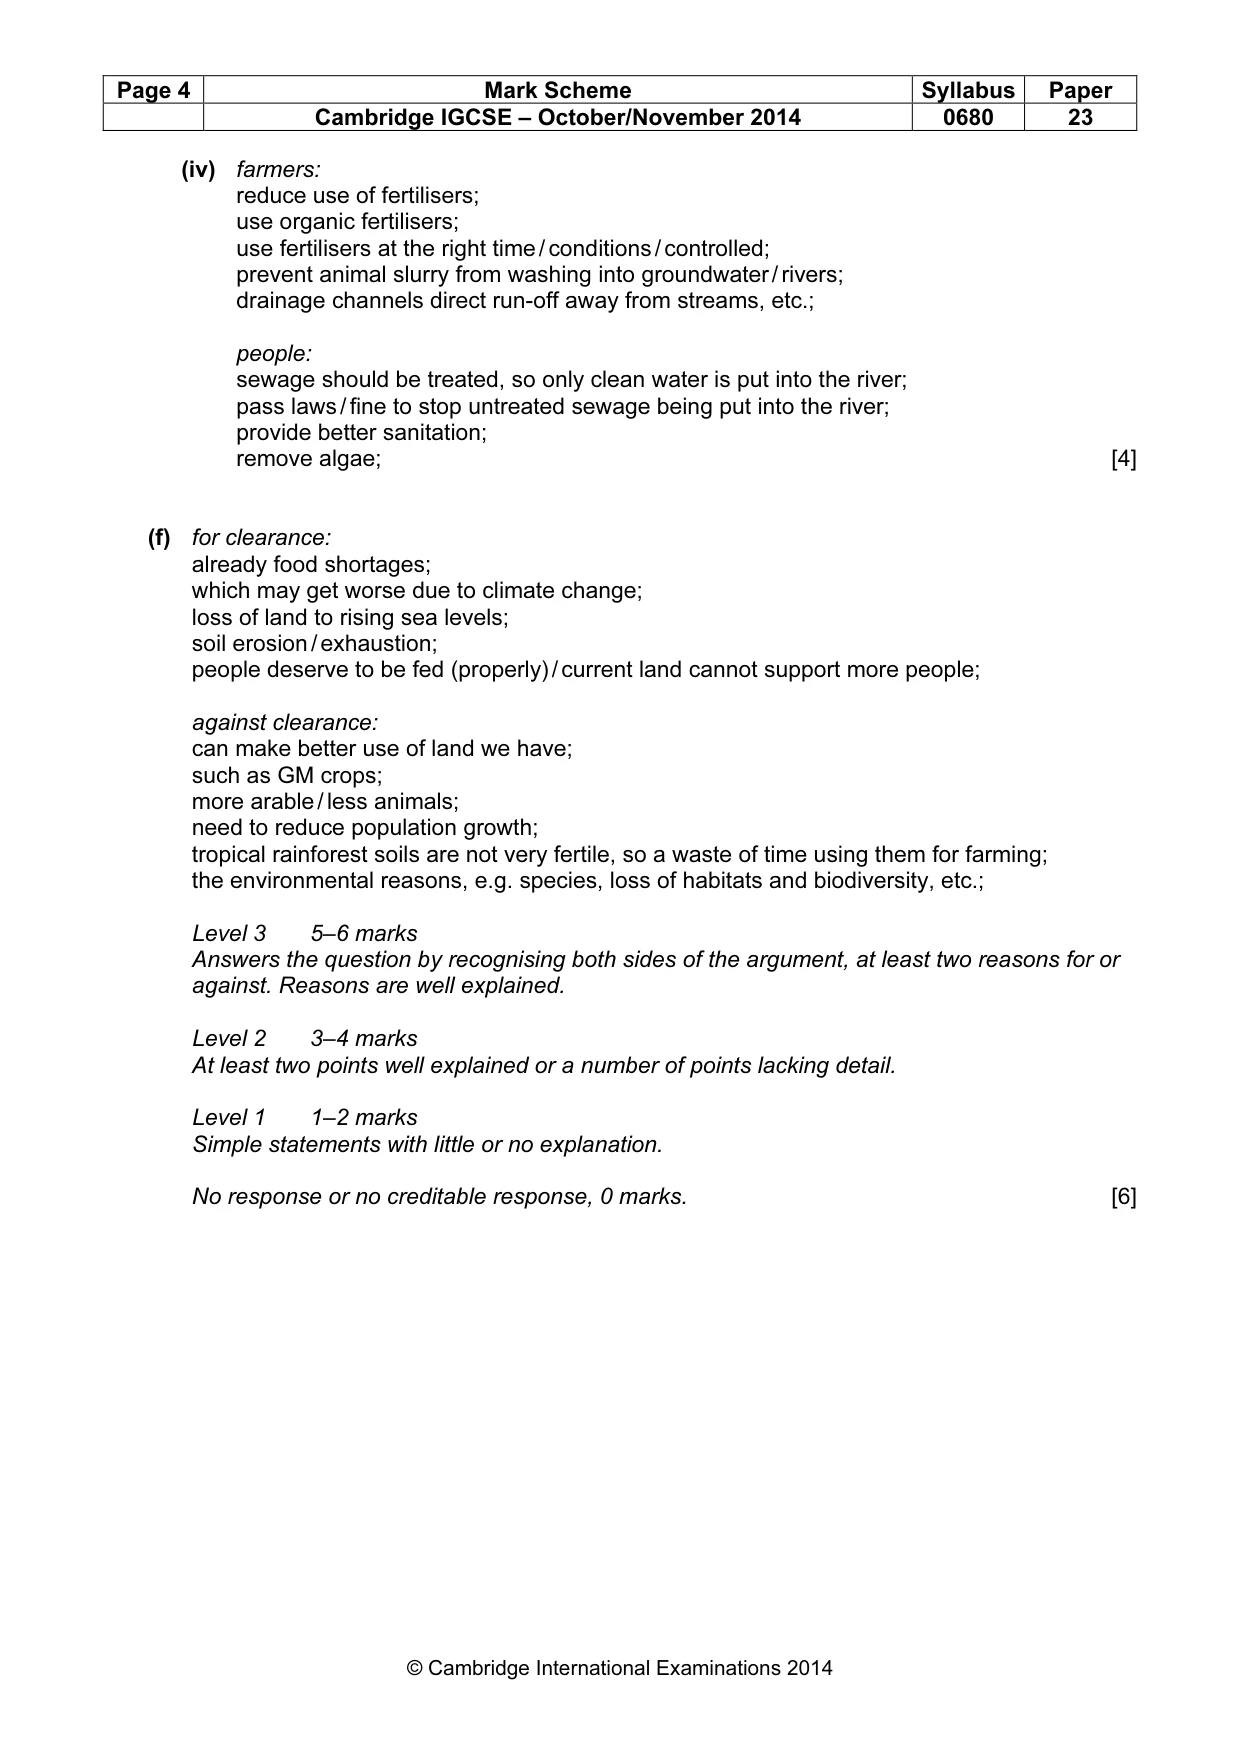
Page 4 Mark Scheme Syllabus Paper Cambridge IGCSE – October/November 2014 0680 23 © Cambridge International Examinations 2014 (iv) farmers: reduce use of fertilisers; use organic fertilisers; use fertilisers at the right time / conditions / controlled; prevent animal slurry from washing into groundwater / rivers; drainage channels direct run-off away from streams, etc.; people: sewage should be treated, so only clean water is put into the river; pass laws / fine to stop untreated sewage being put into the river; provide better sanitation; remove algae; [4] (f) for clearance: already food shortages; which may get worse due to climate change; loss of land to rising sea levels; soil erosion / exhaustion; people deserve to be fed (properly) / current land cannot support more people; against clearance: can make better use of land we have; such as GM crops; more arable / less animals; need to reduce population growth; tropical rainforest soils are not very fertile, so a waste of time using them for farming; the environmental reasons, e.g. species, loss of habitats and biodiversity, etc.; Level 3 5–6 marks Answers the question by recognising both sides of the argument, at least two reasons for or against. Reasons are well explained. Level 2 3–4 marks At least two points well explained or a number of points lacking detail. Level 1 1–2 marks Simple statements with little or no explanation. No response or no creditable response, 0 marks. [6]
Mark scheme, page 5
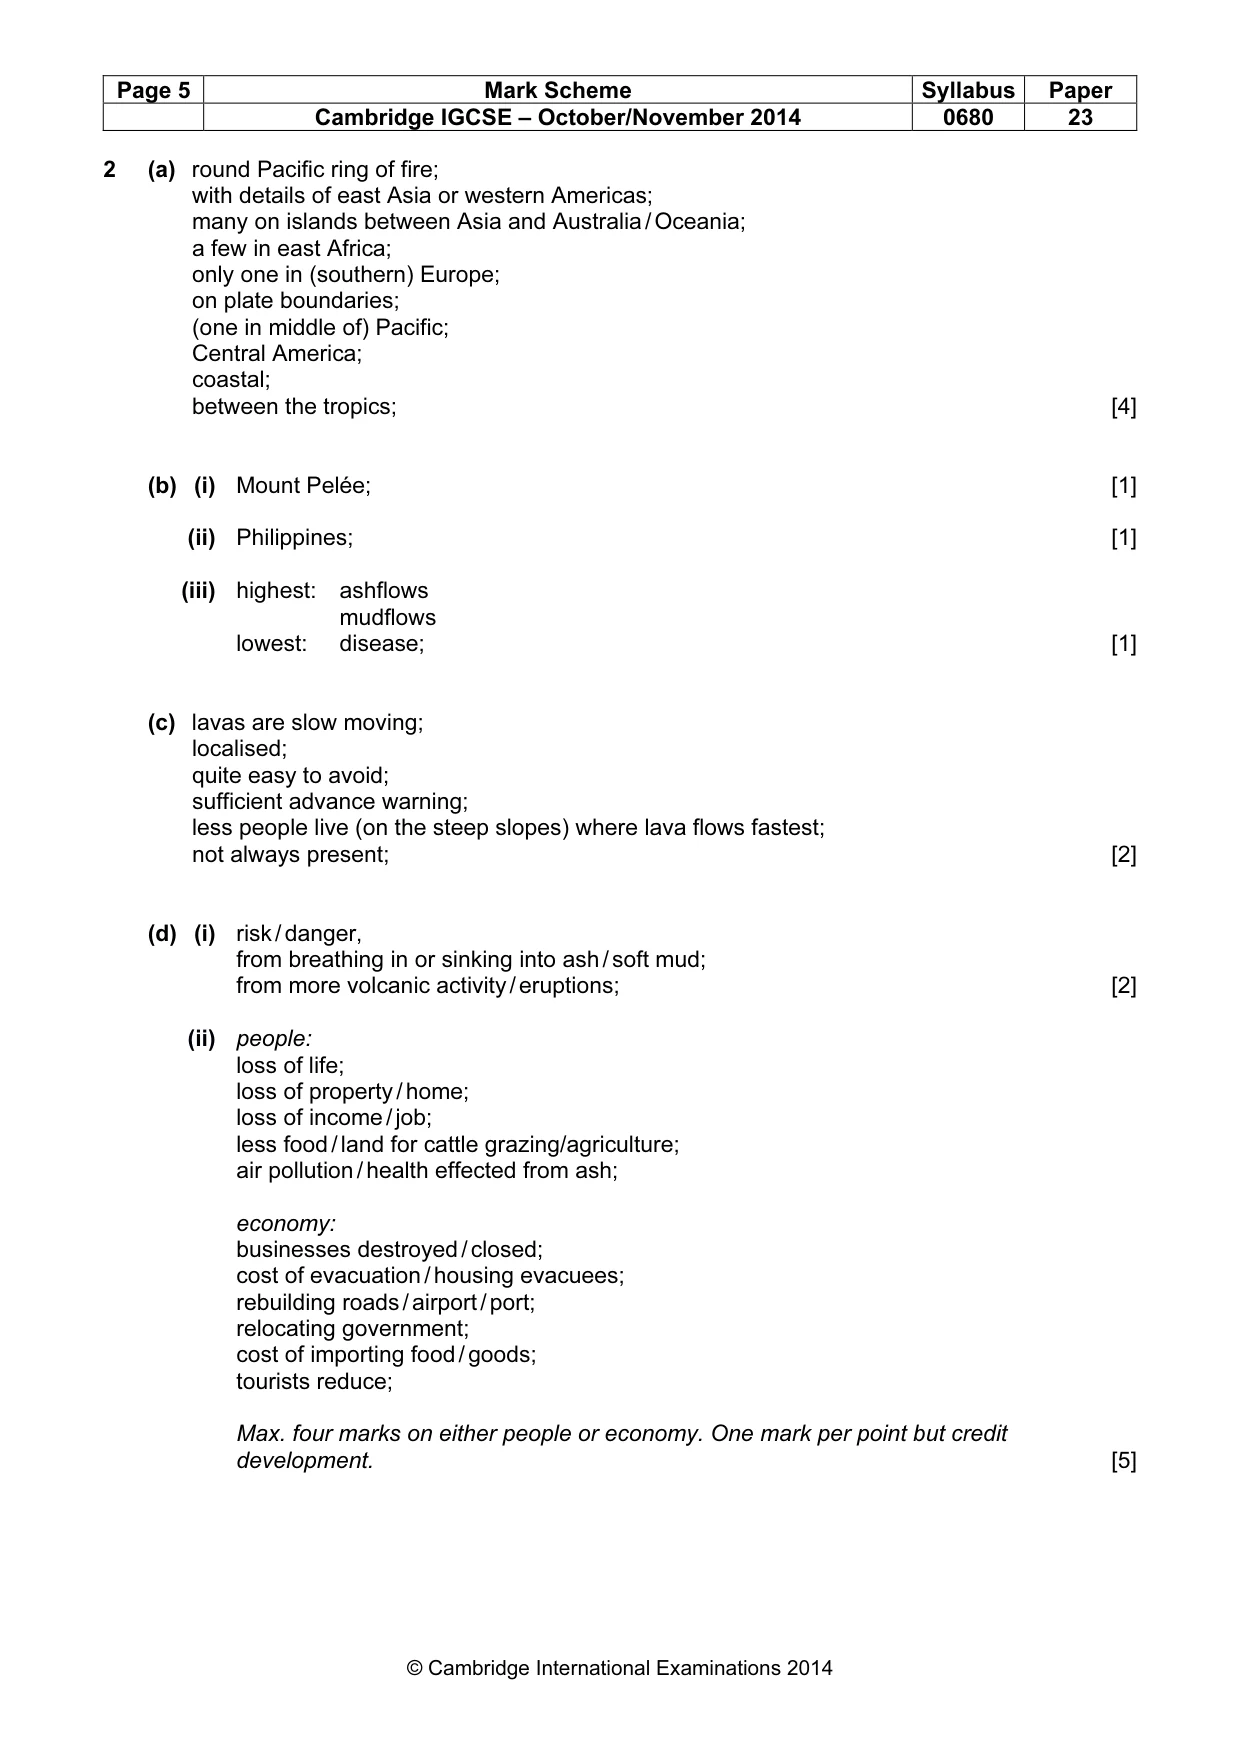
Page 5 Mark Scheme Syllabus Paper Cambridge IGCSE – October/November 2014 0680 23 © Cambridge International Examinations 2014 2 (a) round Pacific ring of fire; with details of east Asia or western Americas; many on islands between Asia and Australia / Oceania; a few in east Africa; only one in (southern) Europe; on plate boundaries; (one in middle of) Pacific; Central America; coastal; between the tropics; [4] (b) (i) Mount Pelée; [1] (ii) Philippines; [1] (iii) highest: ashflows mudflows lowest: disease; [1] (c) lavas are slow moving; localised; quite easy to avoid; sufficient advance warning; less people live (on the steep slopes) where lava flows fastest; not always present; [2] (d) (i) risk / danger, from breathing in or sinking into ash / soft mud; from more volcanic activity / eruptions; [2] (ii) people: loss of life; loss of property / home; loss of income / job; less food / land for cattle grazing/agriculture; air pollution / health effected from ash; economy: businesses destroyed / closed; cost of evacuation / housing evacuees; rebuilding roads / airport / port; relocating government; cost of importing food / goods; tourists reduce; Max. four marks on either people or economy. One mark per point but credit development. [5]
Mark scheme, page 6
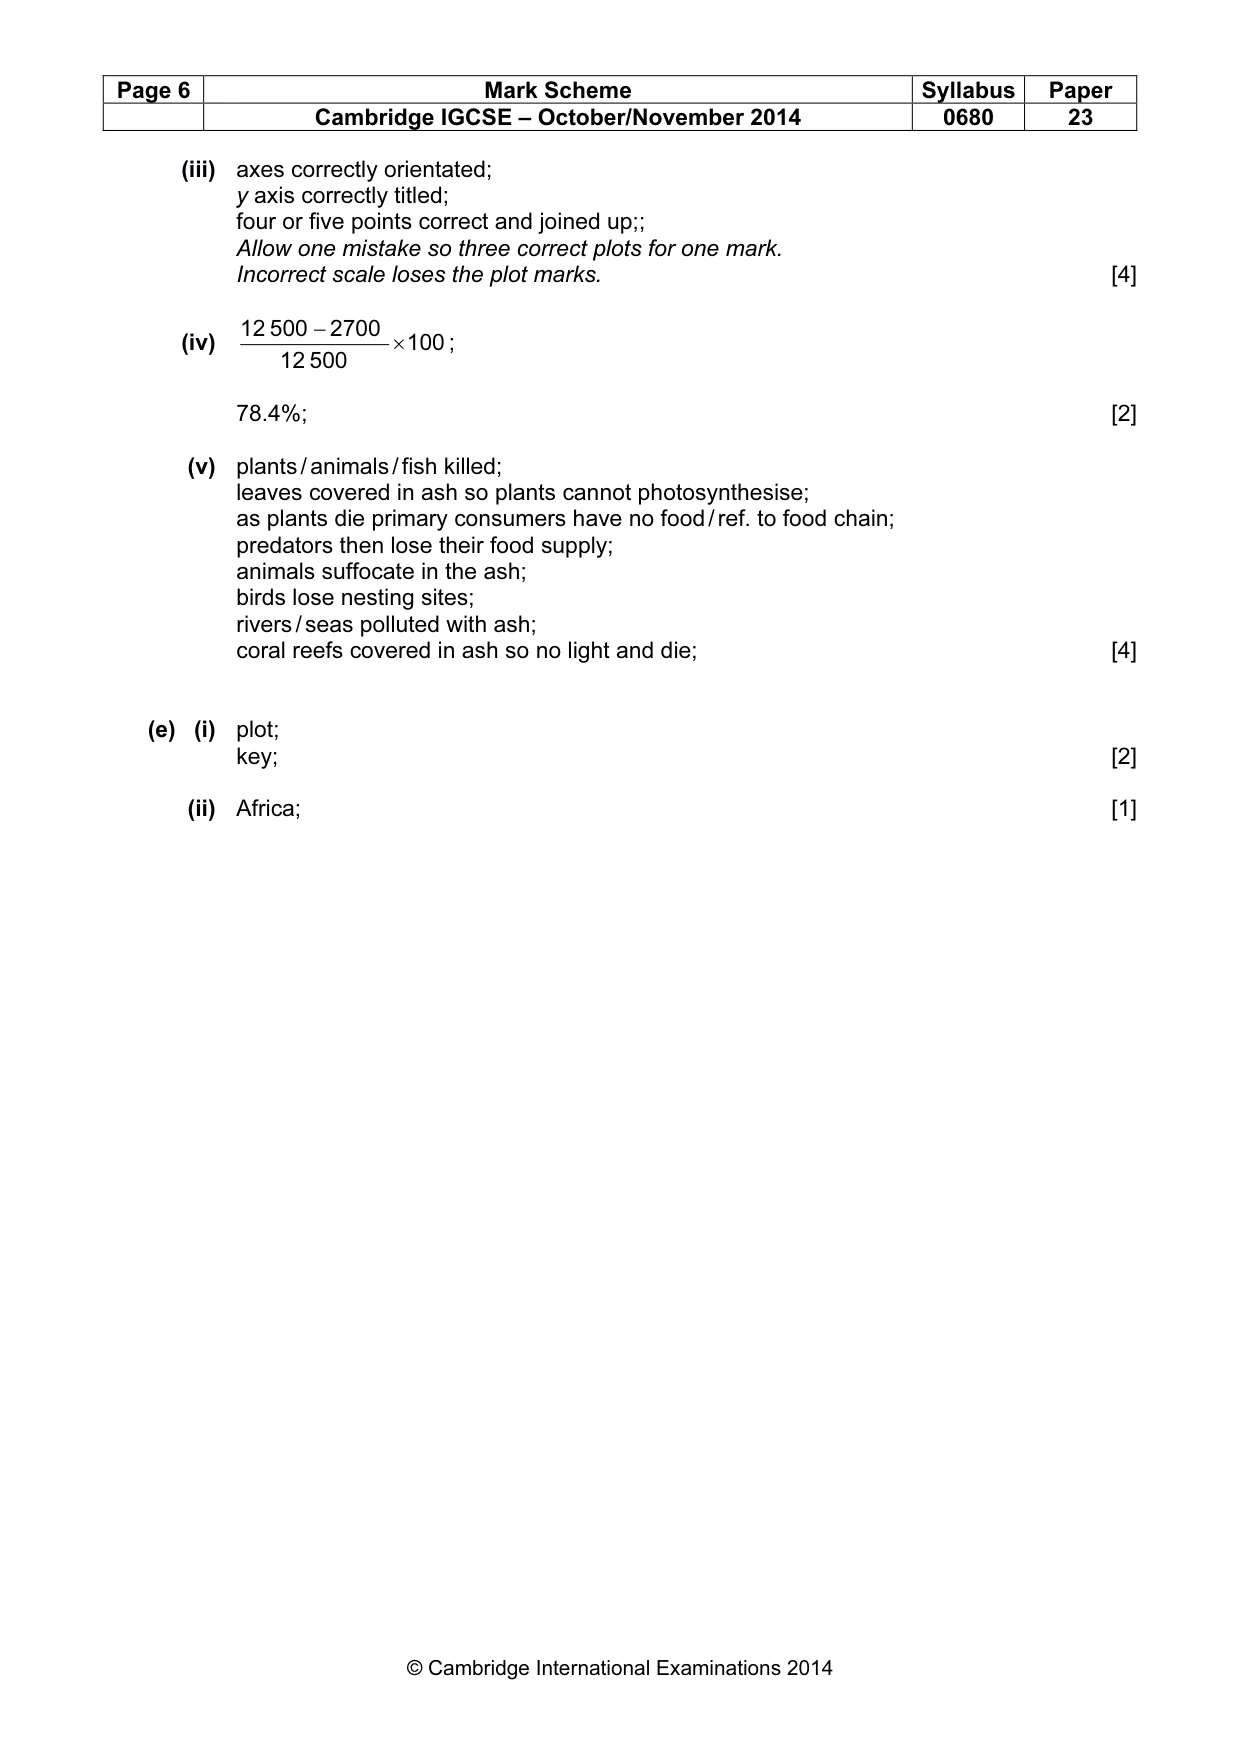
Page 6 Mark Scheme Syllabus Paper Cambridge IGCSE – October/November 2014 0680 23 © Cambridge International Examinations 2014 (iii) axes correctly orientated; y axis correctly titled; four or five points correct and joined up;; Allow one mistake so three correct plots for one mark. Incorrect scale loses the plot marks. [4] (iv) 100 500 12 2700 500 12 × − ; 78.4%; [2] (v) plants / animals / fish killed; leaves covered in ash so plants cannot photosynthesise; as plants die primary consumers have no food / ref. to food chain; predators then lose their food supply; animals suffocate in the ash; birds lose nesting sites; rivers / seas polluted with ash; coral reefs covered in ash so no light and die; [4] (e) (i) plot; key; [2] (ii) Africa; [1]
Mark scheme, page 7
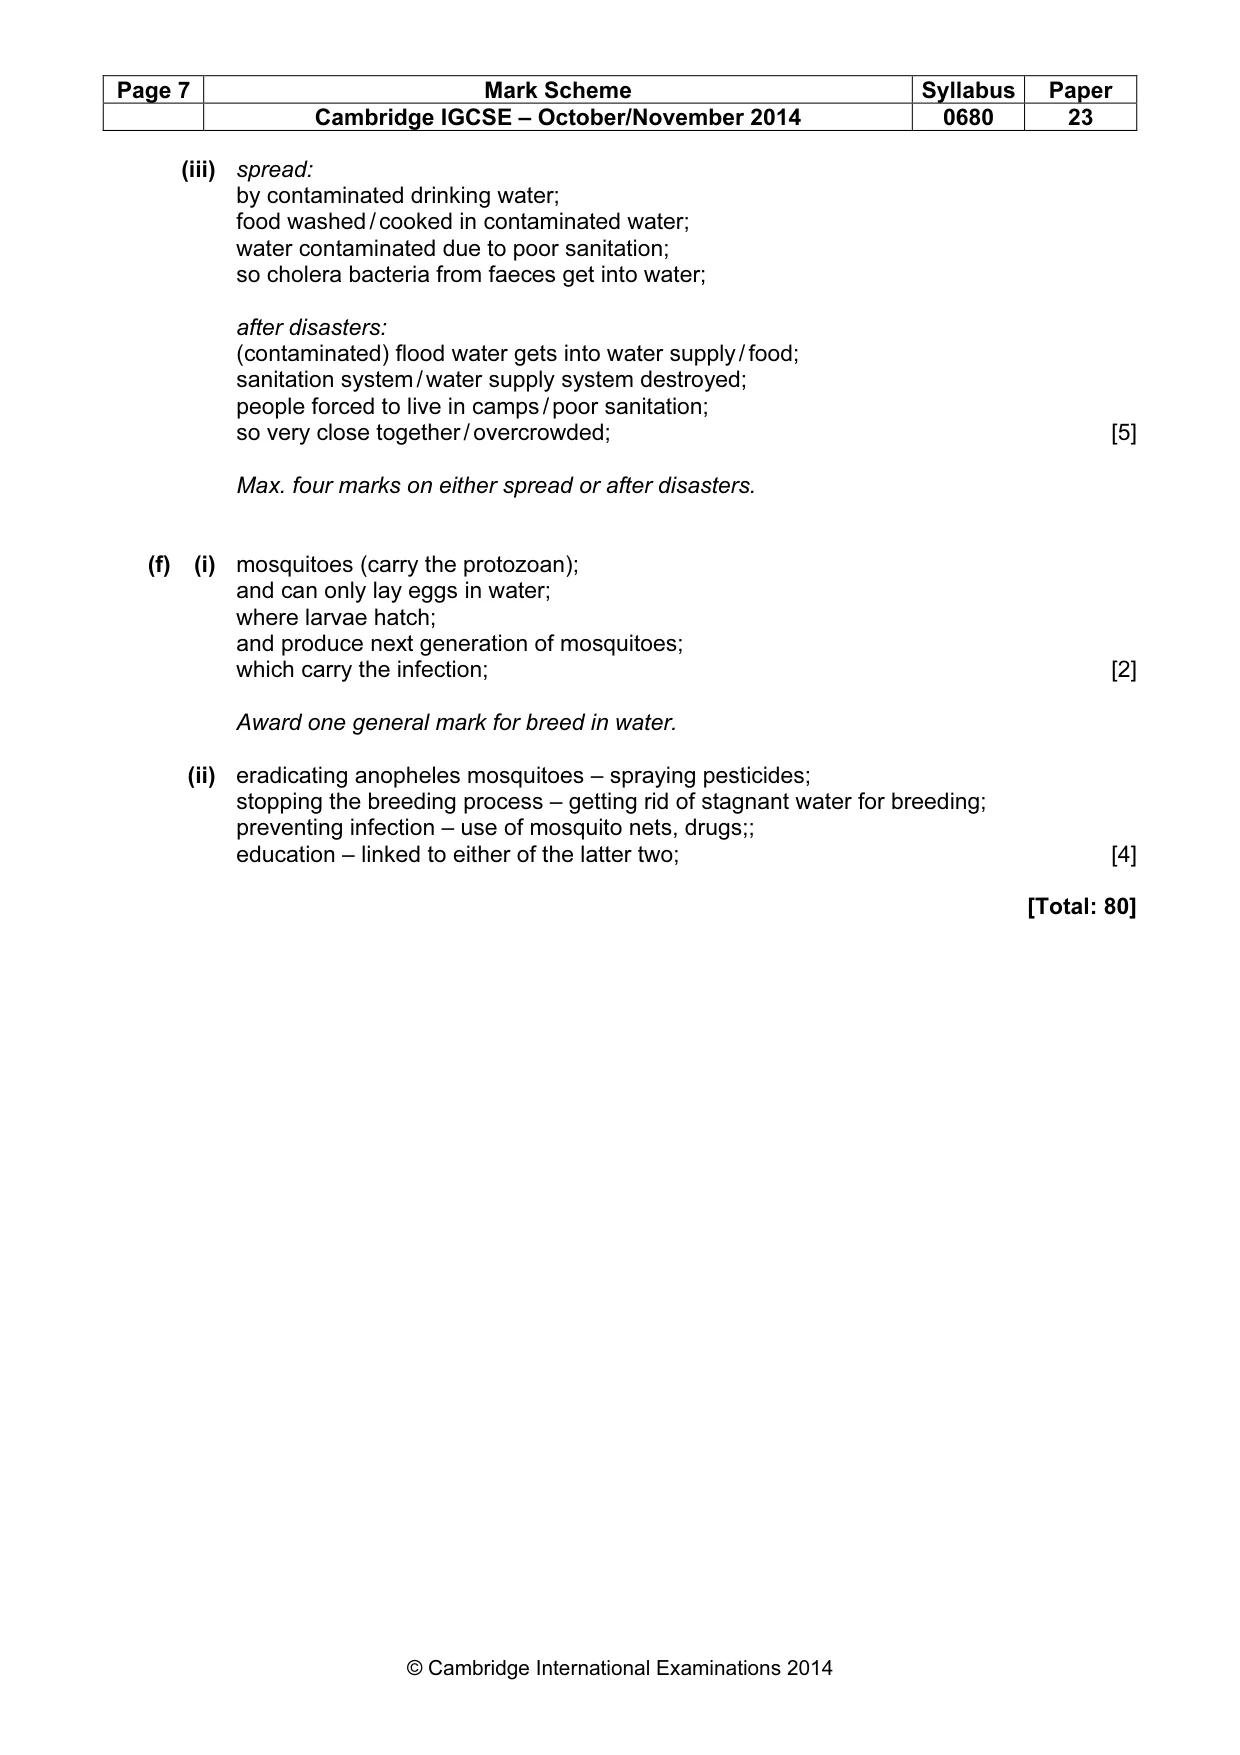
Page 7 Mark Scheme Syllabus Paper Cambridge IGCSE – October/November 2014 0680 23 © Cambridge International Examinations 2014 (iii) spread: by contaminated drinking water; food washed / cooked in contaminated water; water contaminated due to poor sanitation; so cholera bacteria from faeces get into water; after disasters: (contaminated) flood water gets into water supply / food; sanitation system / water supply system destroyed; people forced to live in camps / poor sanitation; so very close together / overcrowded; [5] Max. four marks on either spread or after disasters. (f) (i) mosquitoes (carry the protozoan); and can only lay eggs in water; where larvae hatch; and produce next generation of mosquitoes; which carry the infection; [2] Award one general mark for breed in water. (ii) eradicating anopheles mosquitoes – spraying pesticides; stopping the breeding process – getting rid of stagnant water for breeding; preventing infection – use of mosquito nets, drugs;; education – linked to either of the latter two; [4] [Total: 80]
What you needed in this session
Cambridge’s own grade thresholds for 2014 Oct/Nov, Paper 2 · Variant 3. A higher threshold means an easier paper — the bar moves with how the cohort did.