Cambridge A Level Psychology (from 2018) 9990 — 2025 May/June Paper 2 · Variant 2
9990/22/M/J/25 · 10 questions · 60 marks · 90 min
The question paper and its mark scheme, free to read here and free to download. This is Cambridge’s own paper, exactly as it was sat.
Question paper12 pages
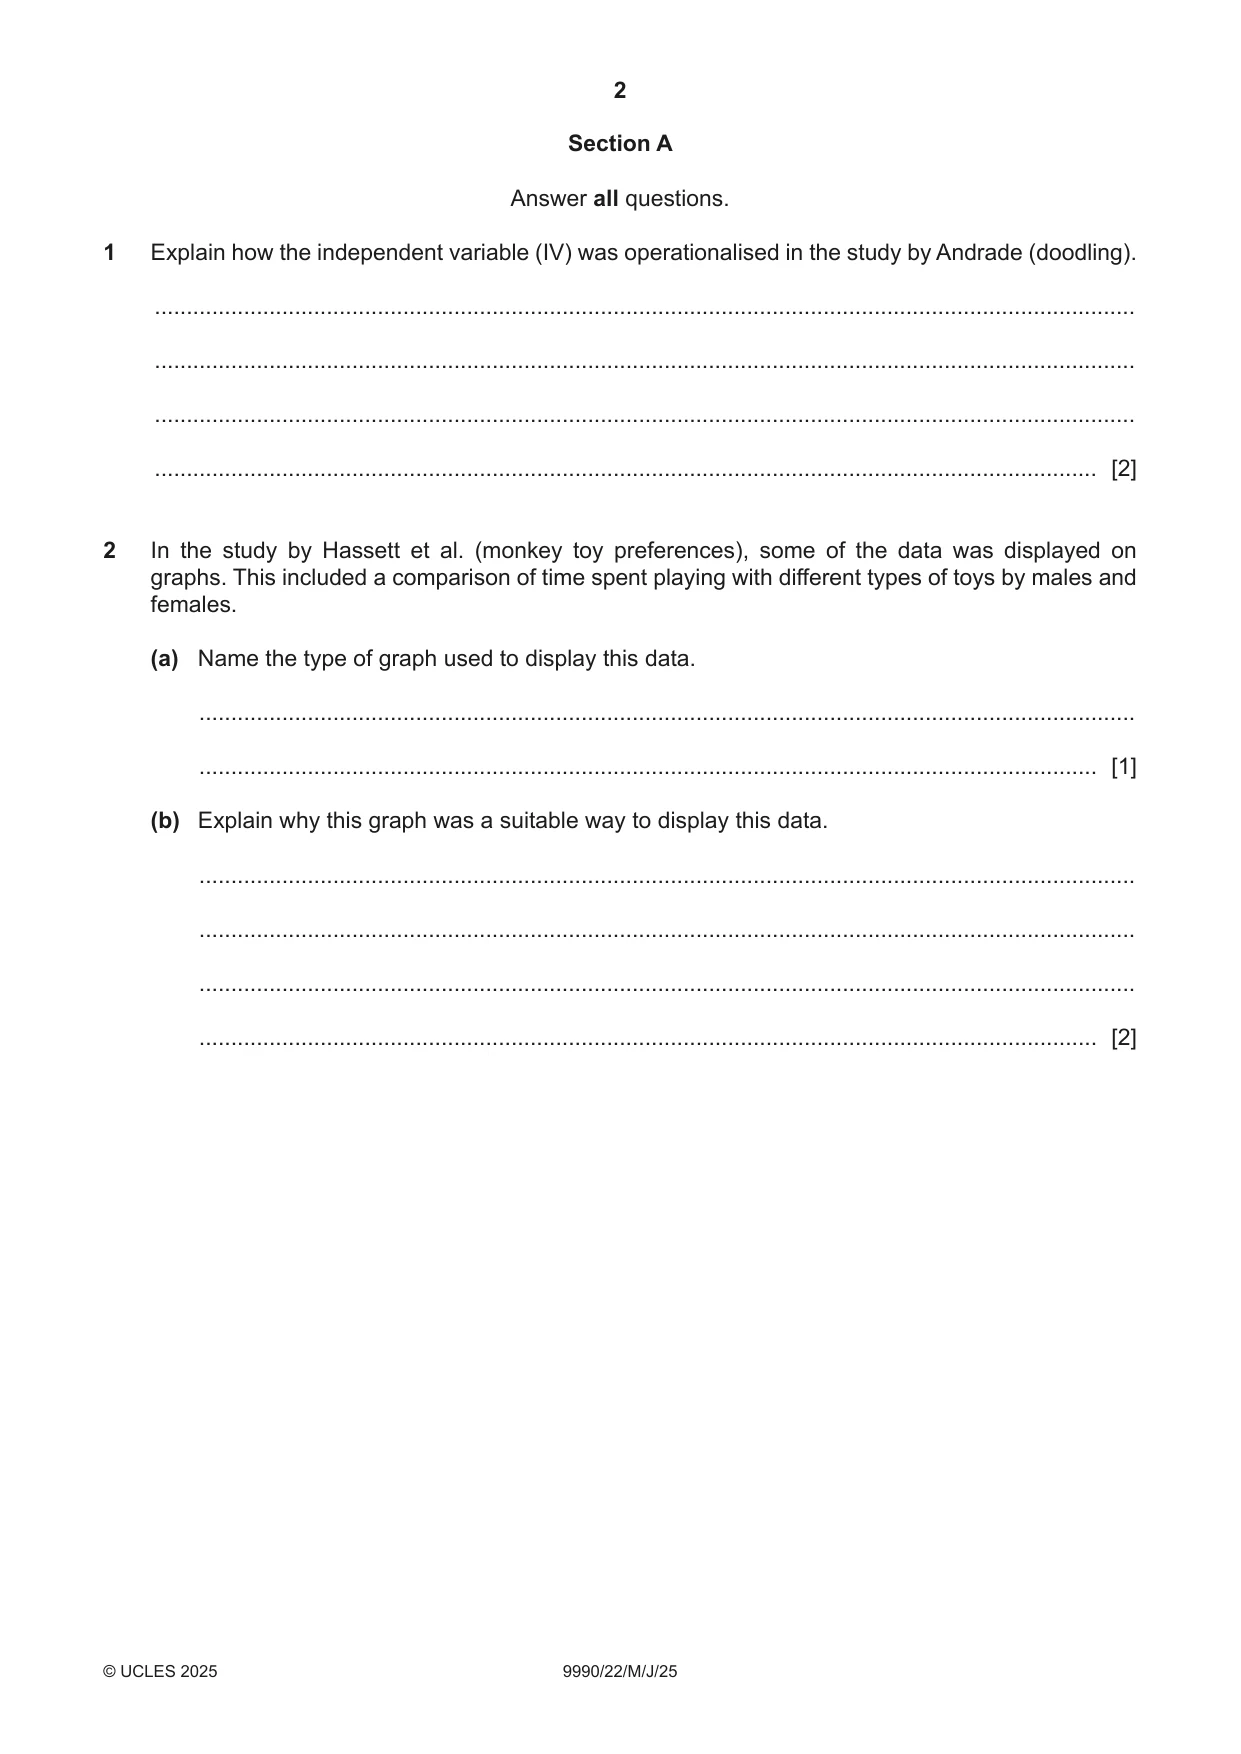
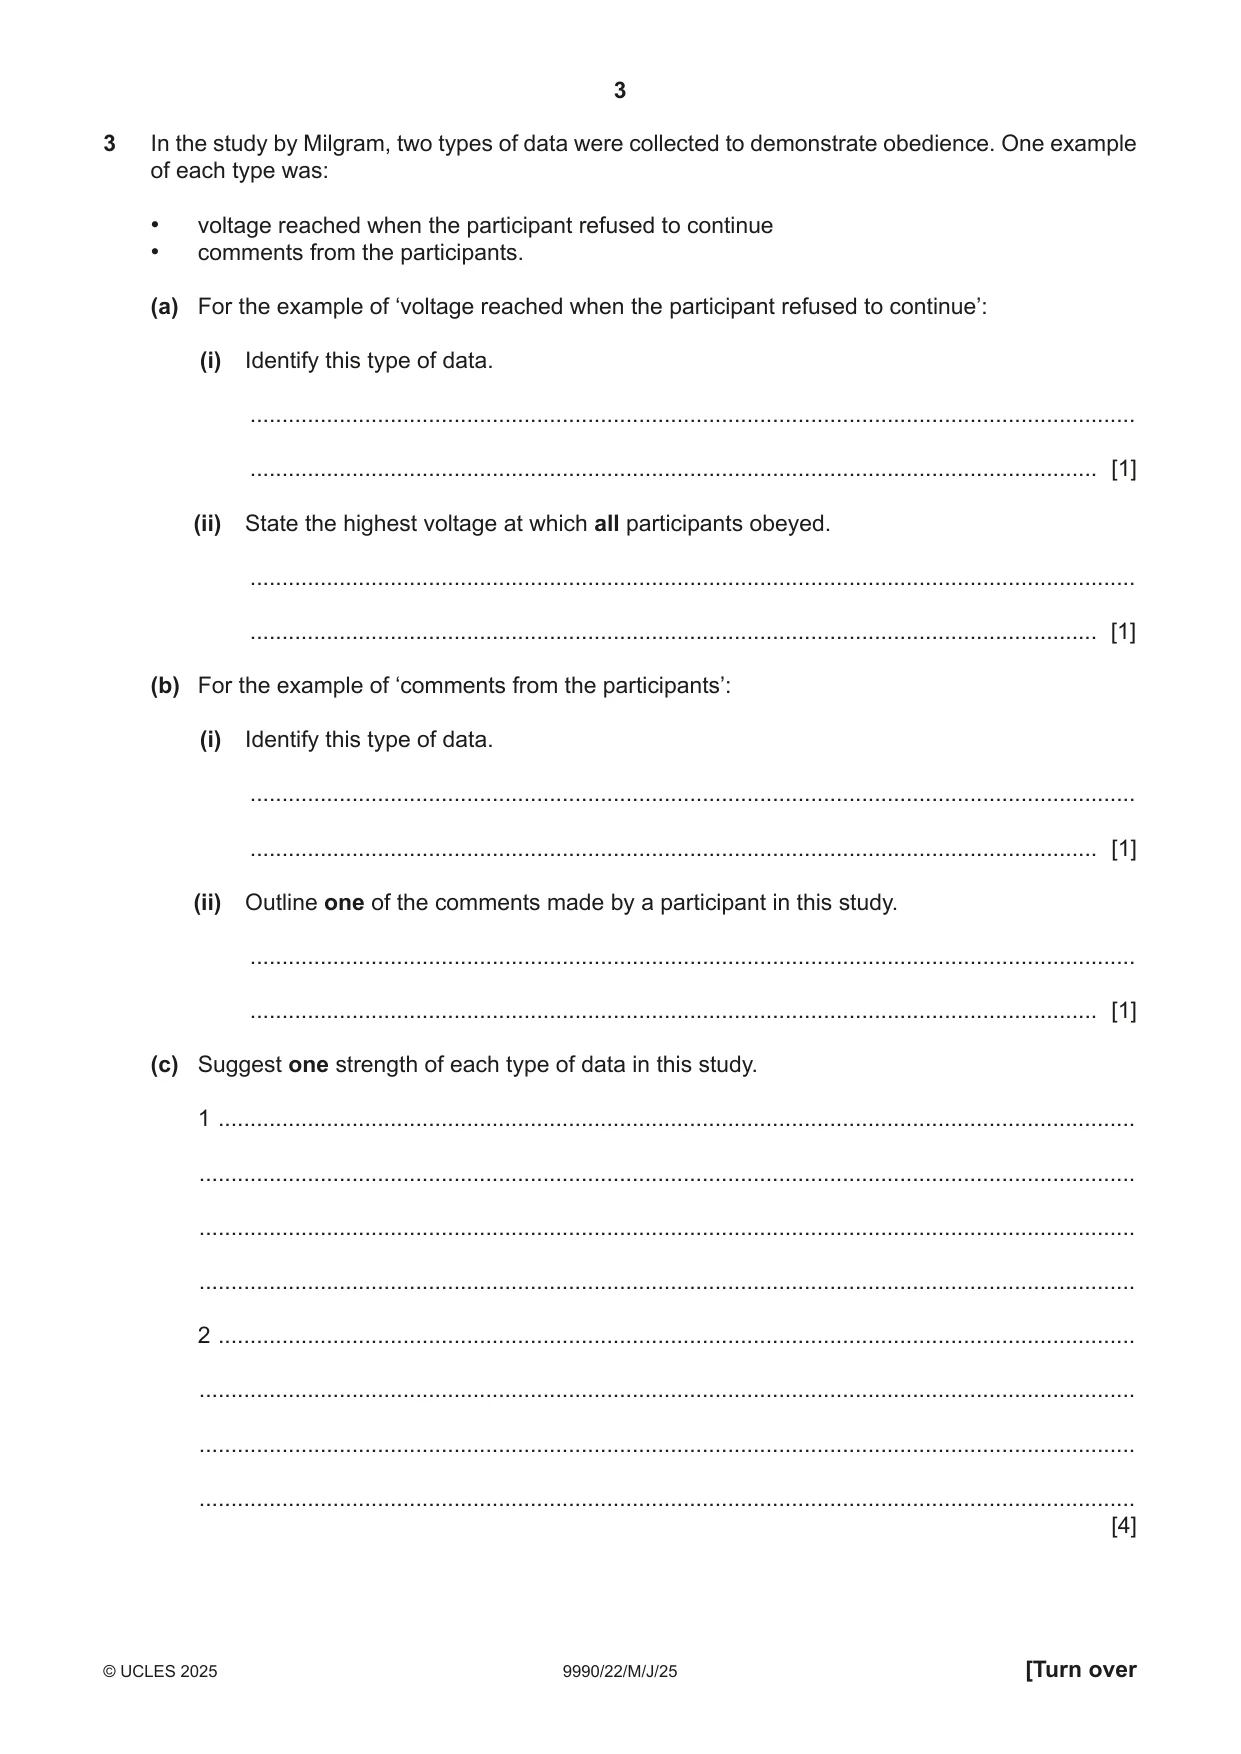
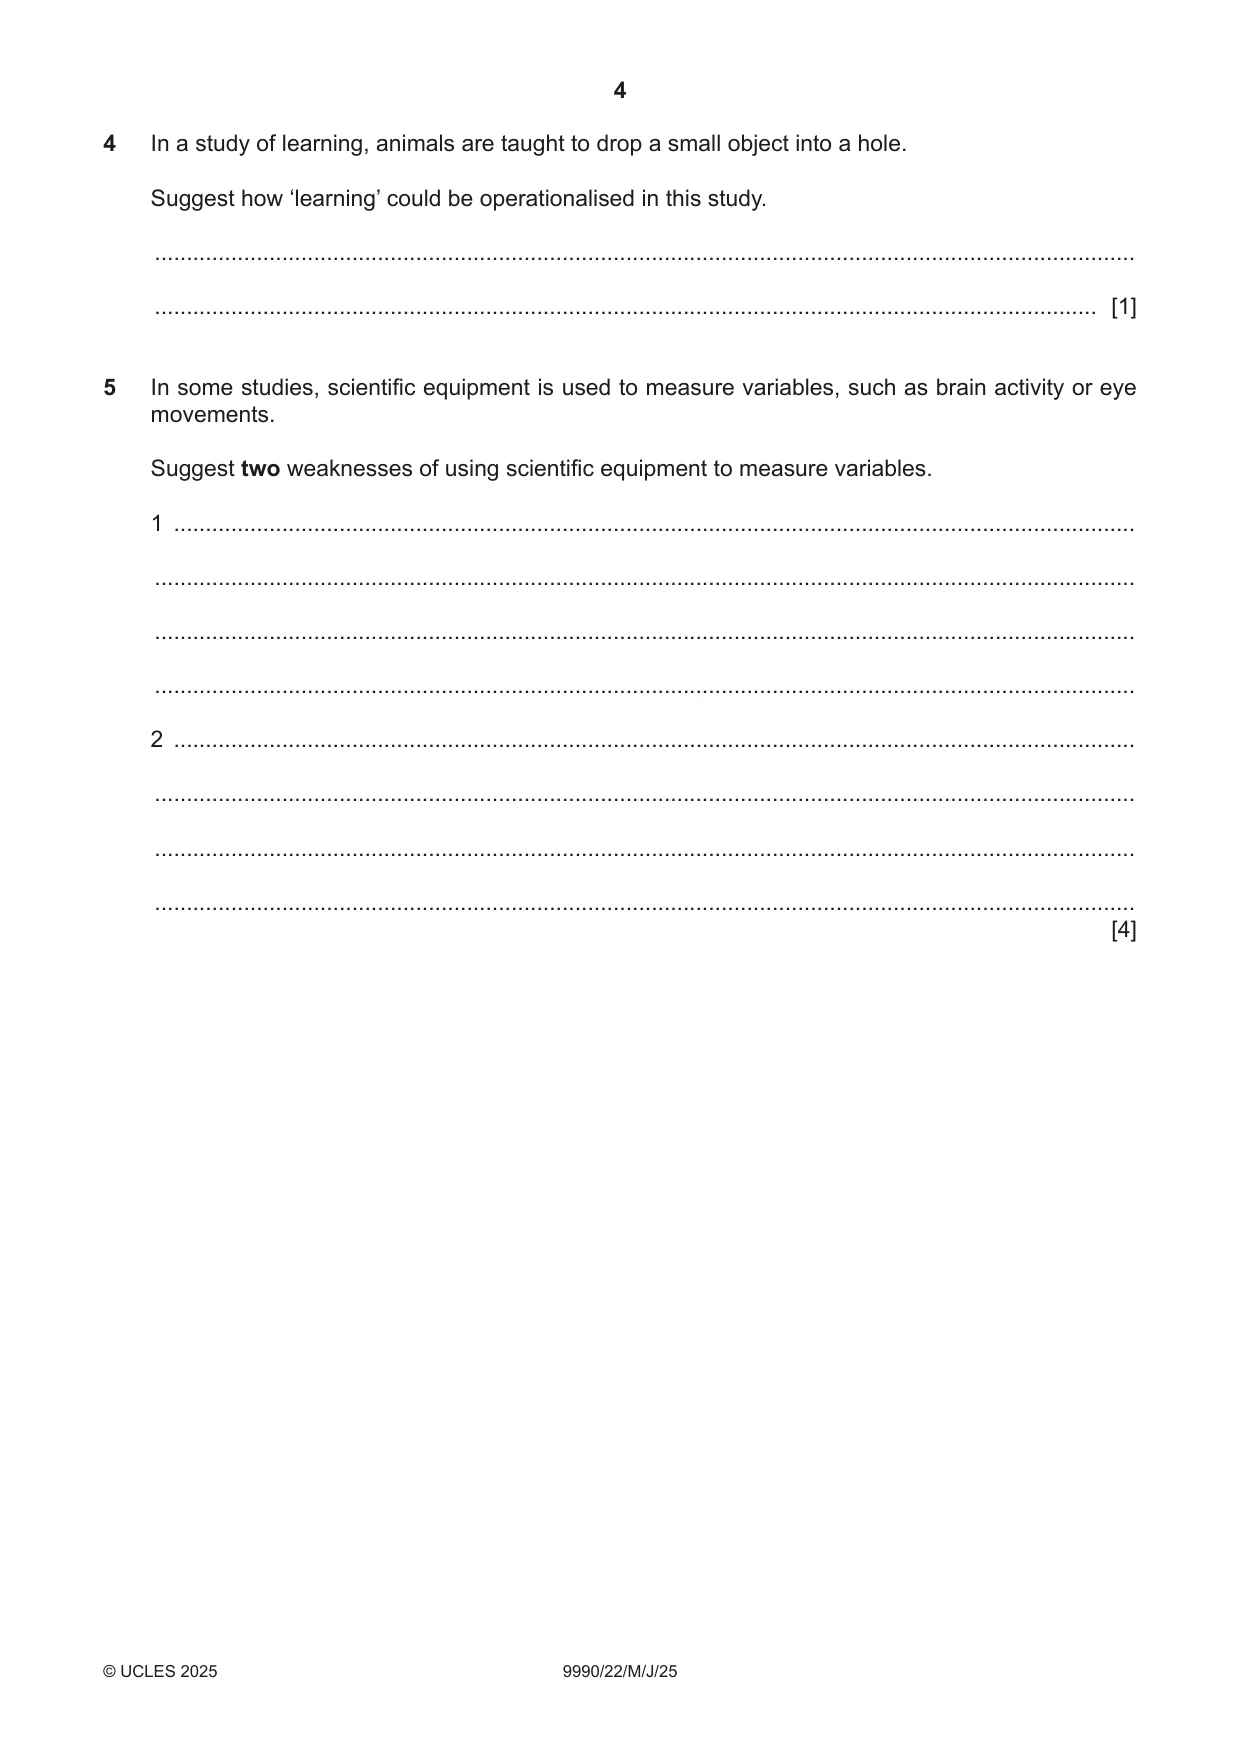

Mark scheme26 pages
Answers below. Sit the paper first if you are practising.

Questions as text
Q1 · Explain how the independent variable (IV) was operationalised in the study by Andrade…
1 Explain how the independent variable (IV) was operationalised in the study by Andrade (doodling). .......................................................................................................................................................... .......................................................................................................................................................... .......................................................................................................................................................... .................................................................................................................................................... [2]
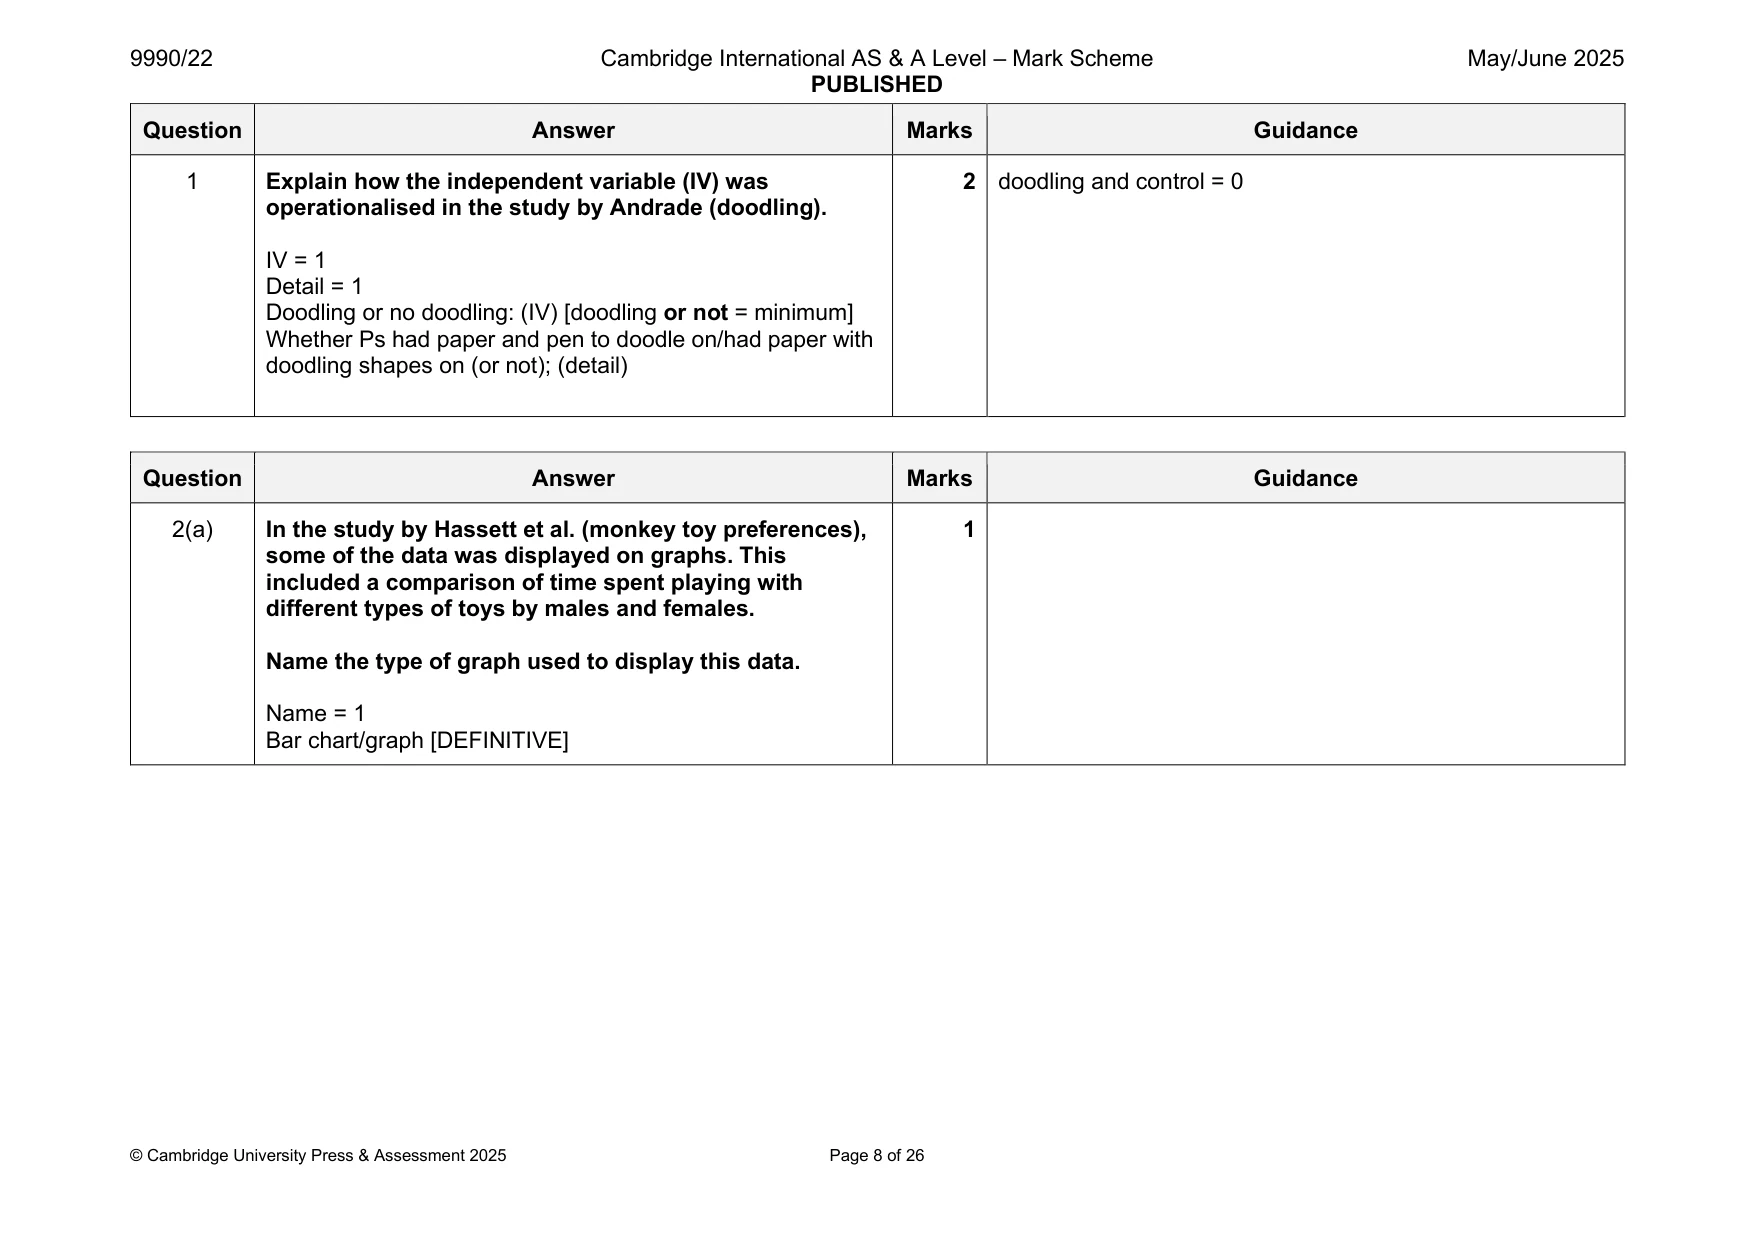
Mark scheme: Question Answer Marks Guidance 1 Explain how the independent variable (IV) was 2 doodling and control = 0 operationalised in the study by Andrade (doodling). IV = 1 Detail = 1 Doodling or no doodling: (IV) [doodling or not = minimum] Whether Ps had paper and pen to doodle on/had paper with doodling shapes on (or not); (detail)
Q2 · In the study by Hassett et al
2 In the study by Hassett et al. (monkey toy preferences), some of the data was displayed on graphs. This included a comparison of time spent playing with different types of toys by males and females. (a) Name the type of graph used to display this data. ................................................................................................................................................... ............................................................................................................................................. [1] (b) Explain why this graph was a suitable way to display this data. ................................................................................................................................................... ................................................................................................................................................... ................................................................................................................................................... ............................................................................................................................................. [2]
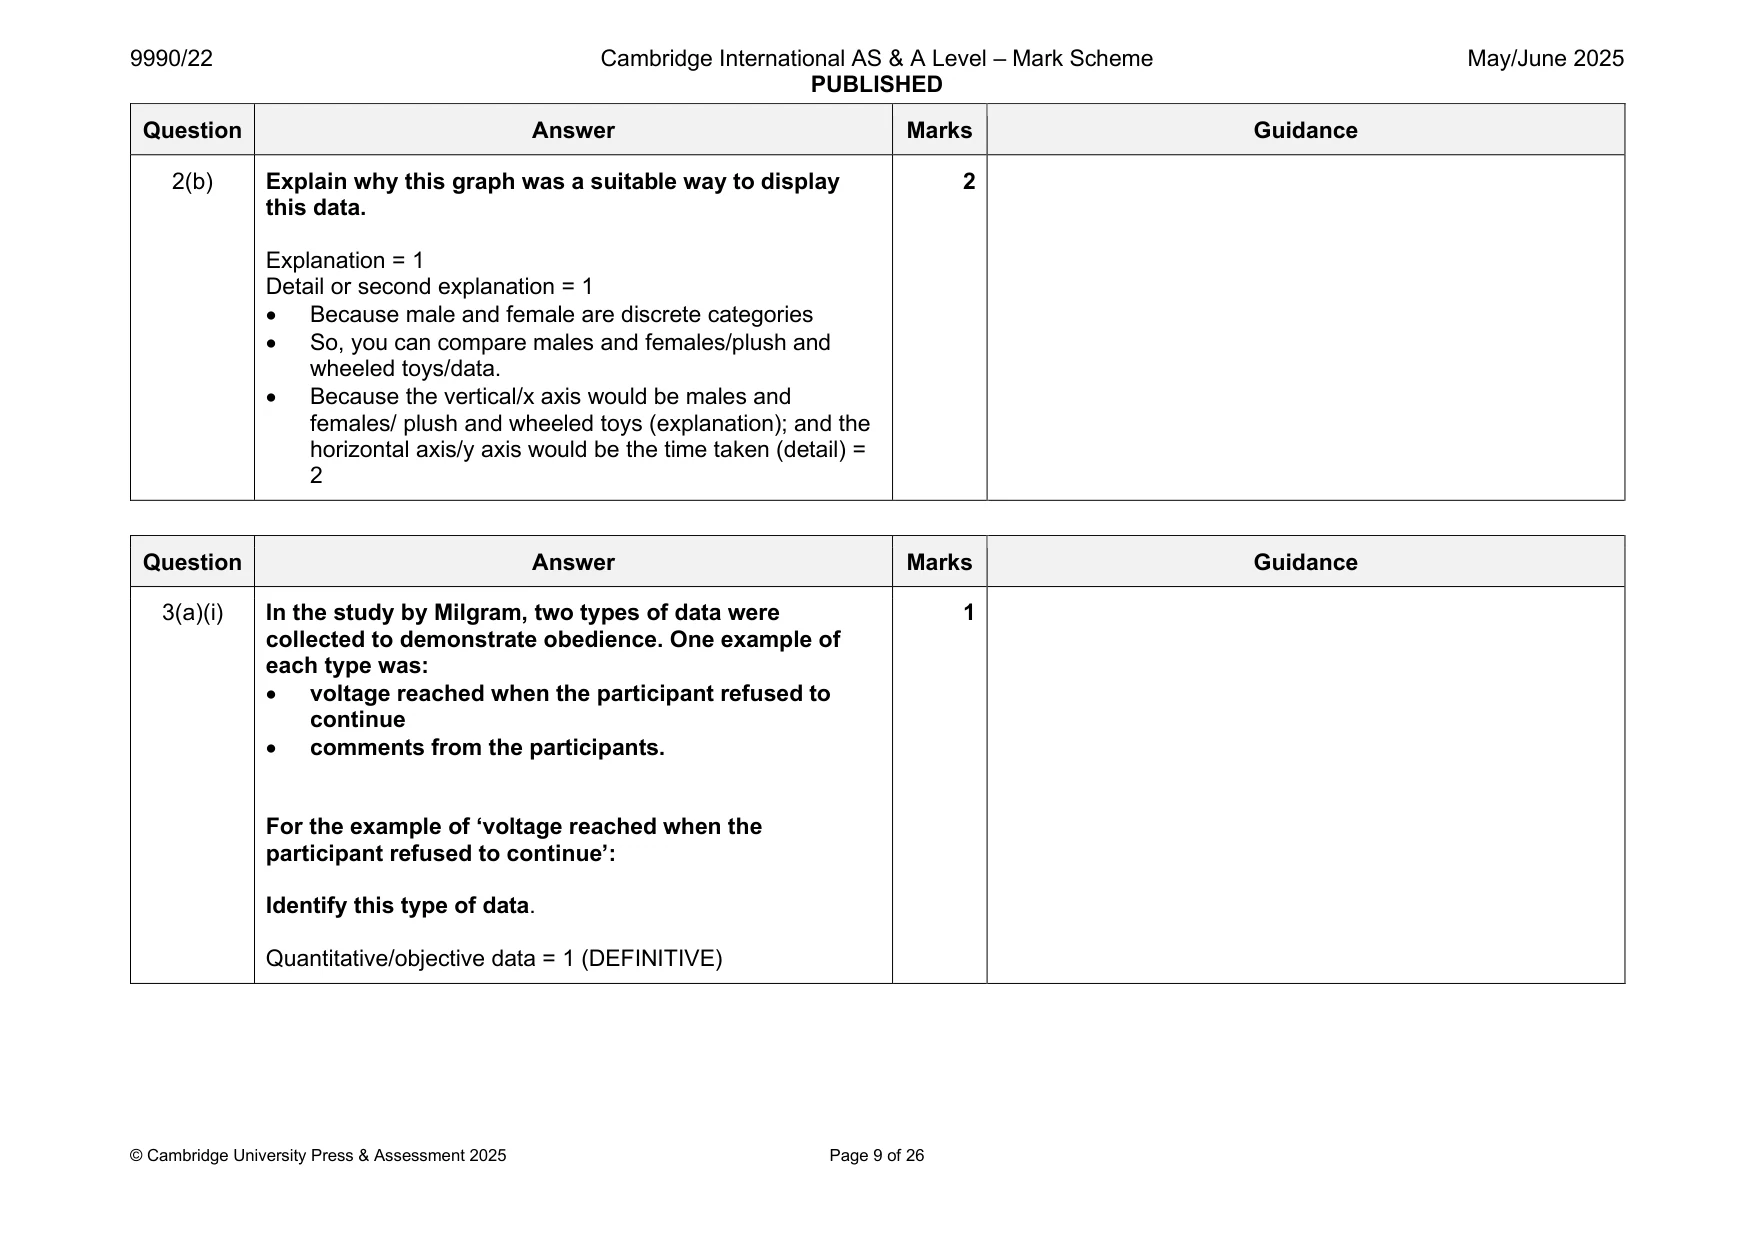
Mark scheme: 2(a) In the study by Hassett et al. (monkey toy preferences), 1 some of the data was displayed on graphs. This included a comparison of time spent playing with different types of toys by males and females. Name the type of graph used to display this data. Name = 1 Bar chart/graph [DEFINITIVE] 2(b) Explain why this graph was a suitable way to display 2 this data. Explanation = 1 Detail or second explanation = 1 • Because male and female are discrete categories • So, you can compare males and females/plush and wheeled toys/data. • Because the vertical/x axis would be males and females/ plush and wheeled toys (explanation); and the horizontal axis/y axis would be the time taken (detail) = 2
Q3 · In the study by Milgram, two types of data were collected to demonstrate obedience
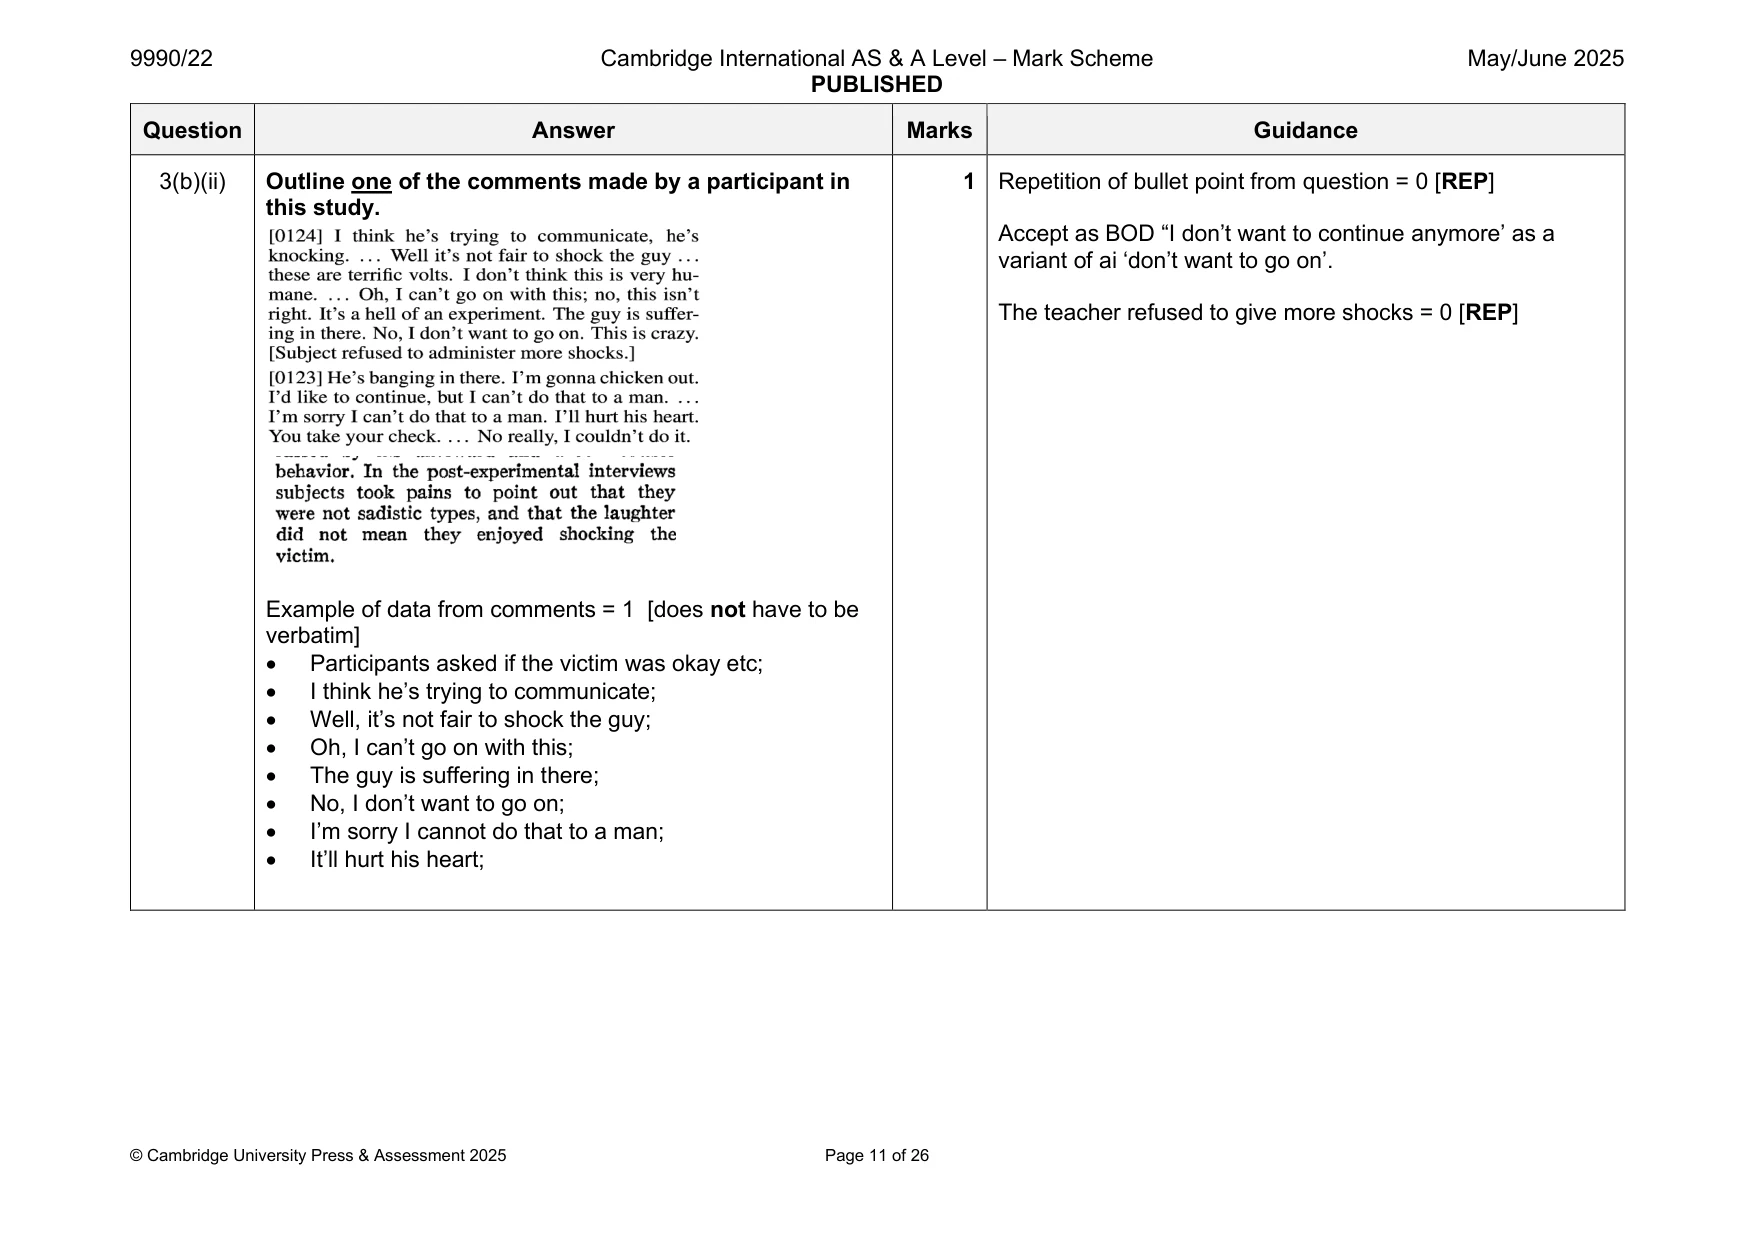
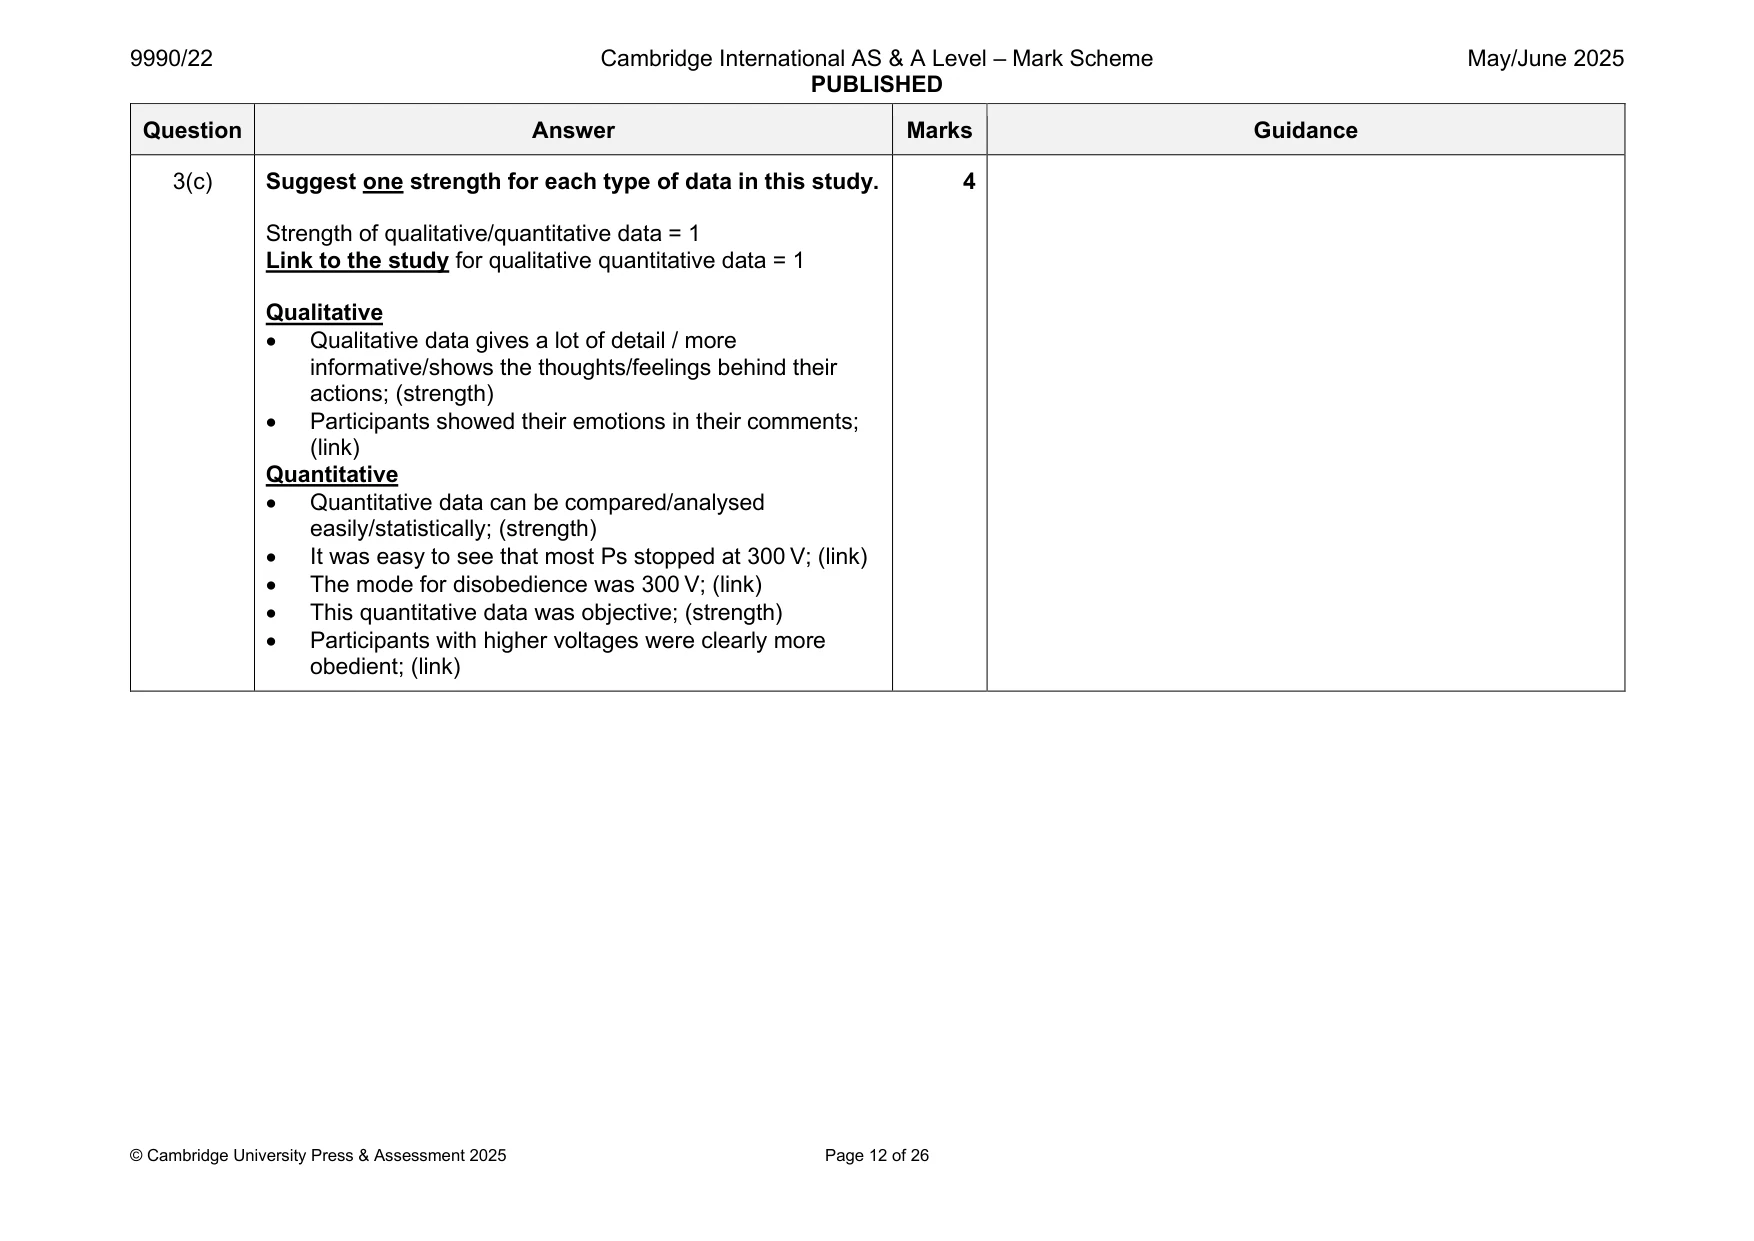
3 In the study by Milgram, two types of data were collected to demonstrate obedience. One example of each type was: • voltage reached when the participant refused to continue • comments from the participants. (a) For the example of ‘voltage reached when the participant refused to continue’: (i) Identify this type of data. ........................................................................................................................................... ..................................................................................................................................... [1] (ii) State the highest voltage at which all participants obeyed. ........................................................................................................................................... ..................................................................................................................................... [1] (b) For the example of ‘comments from the participants’: (i) Identify this type of data. ........................................................................................................................................... ..................................................................................................................................... [1] (ii) Outline one of the comments made by a participant in this study. ........................................................................................................................................... ..................................................................................................................................... [1] (c) Suggest one strength of each type of data in this study. 1 ................................................................................................................................................ ................................................................................................................................................... ................................................................................................................................................... ................................................................................................................................................... 2 ................................................................................................................................................ ................................................................................................................................................... ................................................................................................................................................... ................................................................................................................................................... [4]
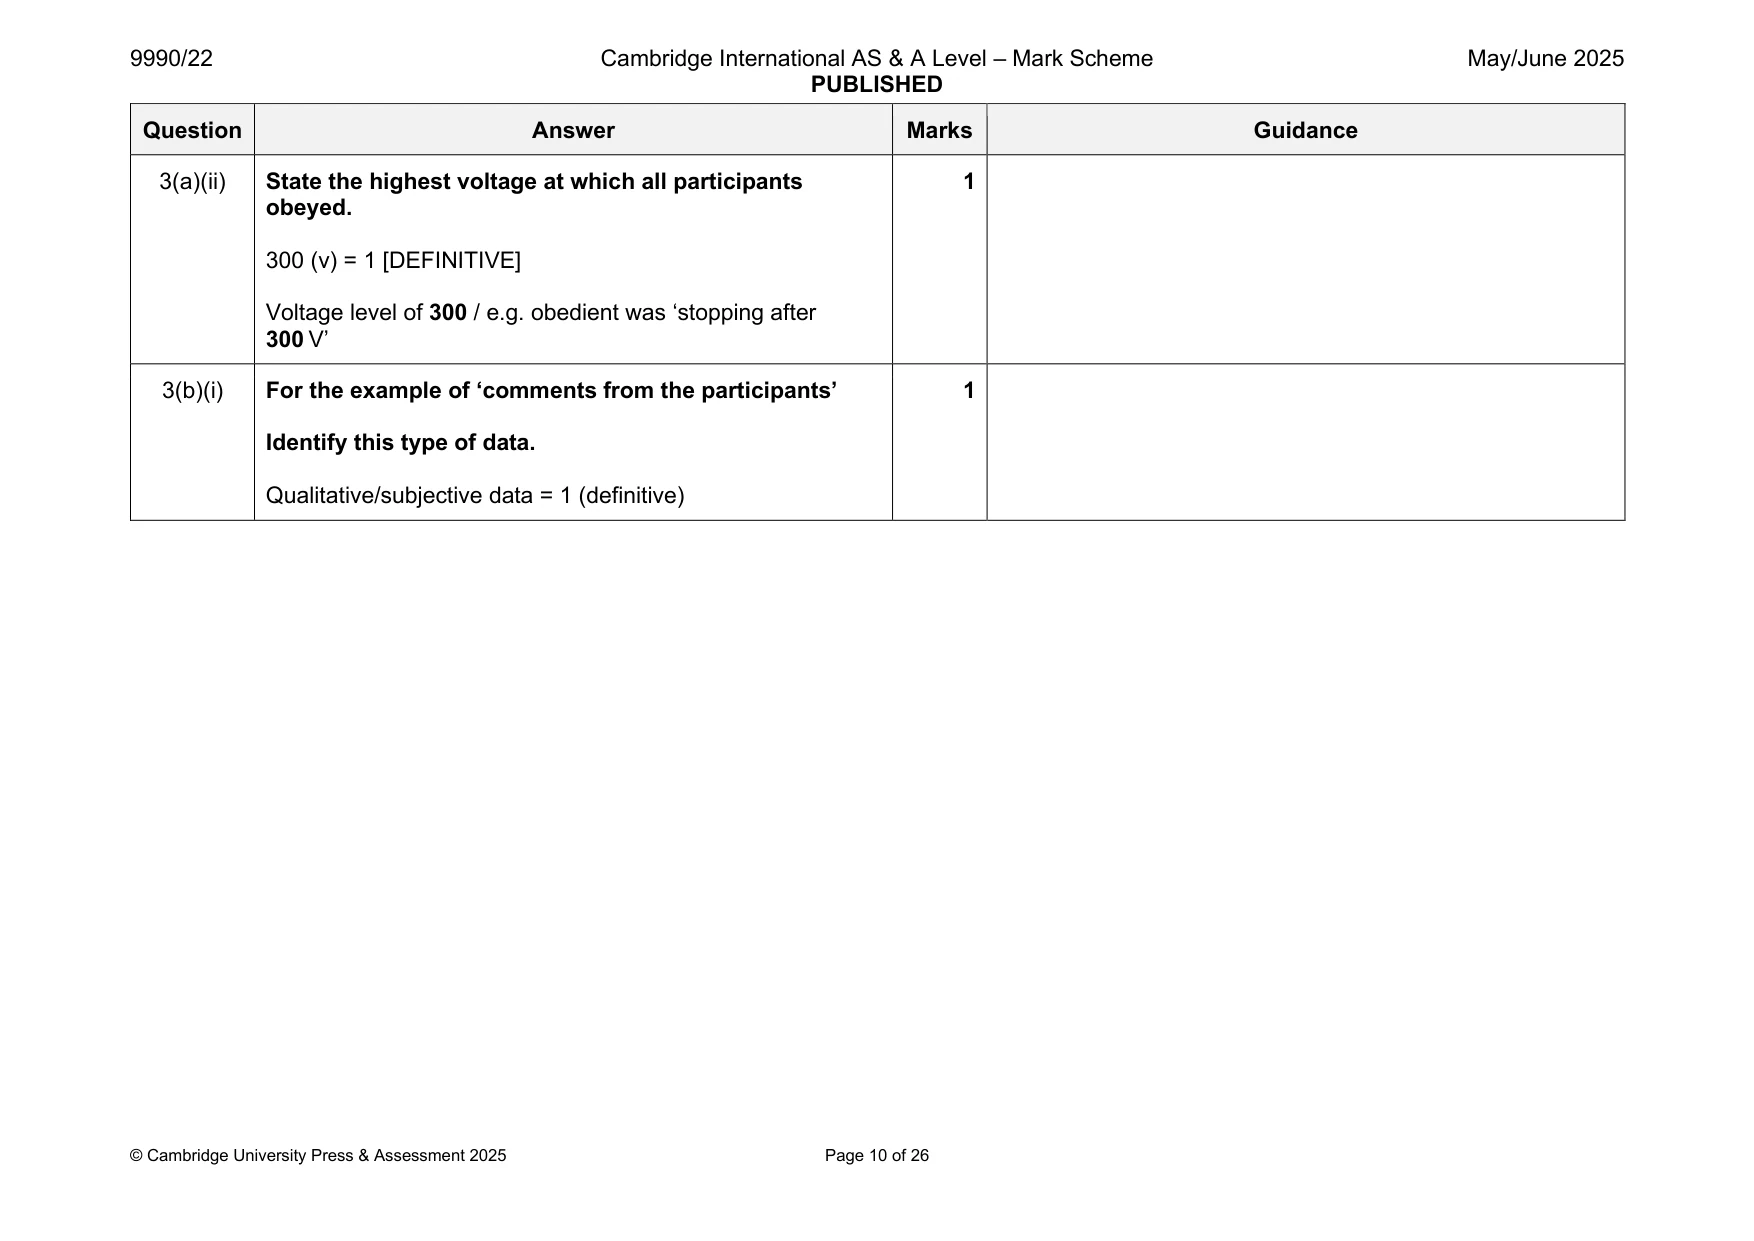
Mark scheme: 3(a)(i) In the study by Milgram, two types of data were 1 collected to demonstrate obedience. One example of each type was: • voltage reached when the participant refused to continue • comments from the participants. For the example of ‘voltage reached when the participant refused to continue’: Identify this type of data. Quantitative/objective data = 1 (DEFINITIVE) 3(a)(ii) State the highest voltage at which all participants 1 obeyed. 300 (v) = 1 [DEFINITIVE] Voltage level of 300 / e.g. obedient was ‘stopping after 300 V’ 3(b)(i) For the example of ‘comments from the participants’ 1 Identify this type of data. Qualitative/subjective data = 1 (definitive) 3(b)(ii) Outline one of the comments made by a participant in 1 Repetition of bullet point from question = 0 [REP] this study. Accept as BOD “I don’t want to continue anymore’ as a variant of ai ‘don’t want to go on’. The teacher refused to give more shocks = 0 [REP] Example of data from comments = 1 [does not have to be verbatim] • Participants asked if the victim was okay etc; • I think he’s trying to communicate; • Well, it’s not fair to shock the guy; • Oh, I can’t go on with this; • The guy is suffering in there; • No, I don’t want to go on; • I’m sorry I cannot do that to a man; • It’ll hurt his heart; 3(c) Suggest one strength for each type of data in this study. 4 Strength of qualitative/quantitative data = 1 Link to the study for qualitative quantitative data = 1 Qualitative • Qualitative data gives a lot of detail / more informative/shows the thoughts/feelings behind their actions; (strength) • Participants showed their emotions in their comments; (link) Quantitative • Quantitative data can be compared/analysed easily/statistically; (strength) • It was easy to see that most Ps stopped at 300 V; (link) • The mode for disobedience was 300 V; (link) • This quantitative data was objective; (strength) • Participants with higher voltages were clearly more obedient; (link)
Q4 · In a study of learning, animals are taught to drop a small object into a hole
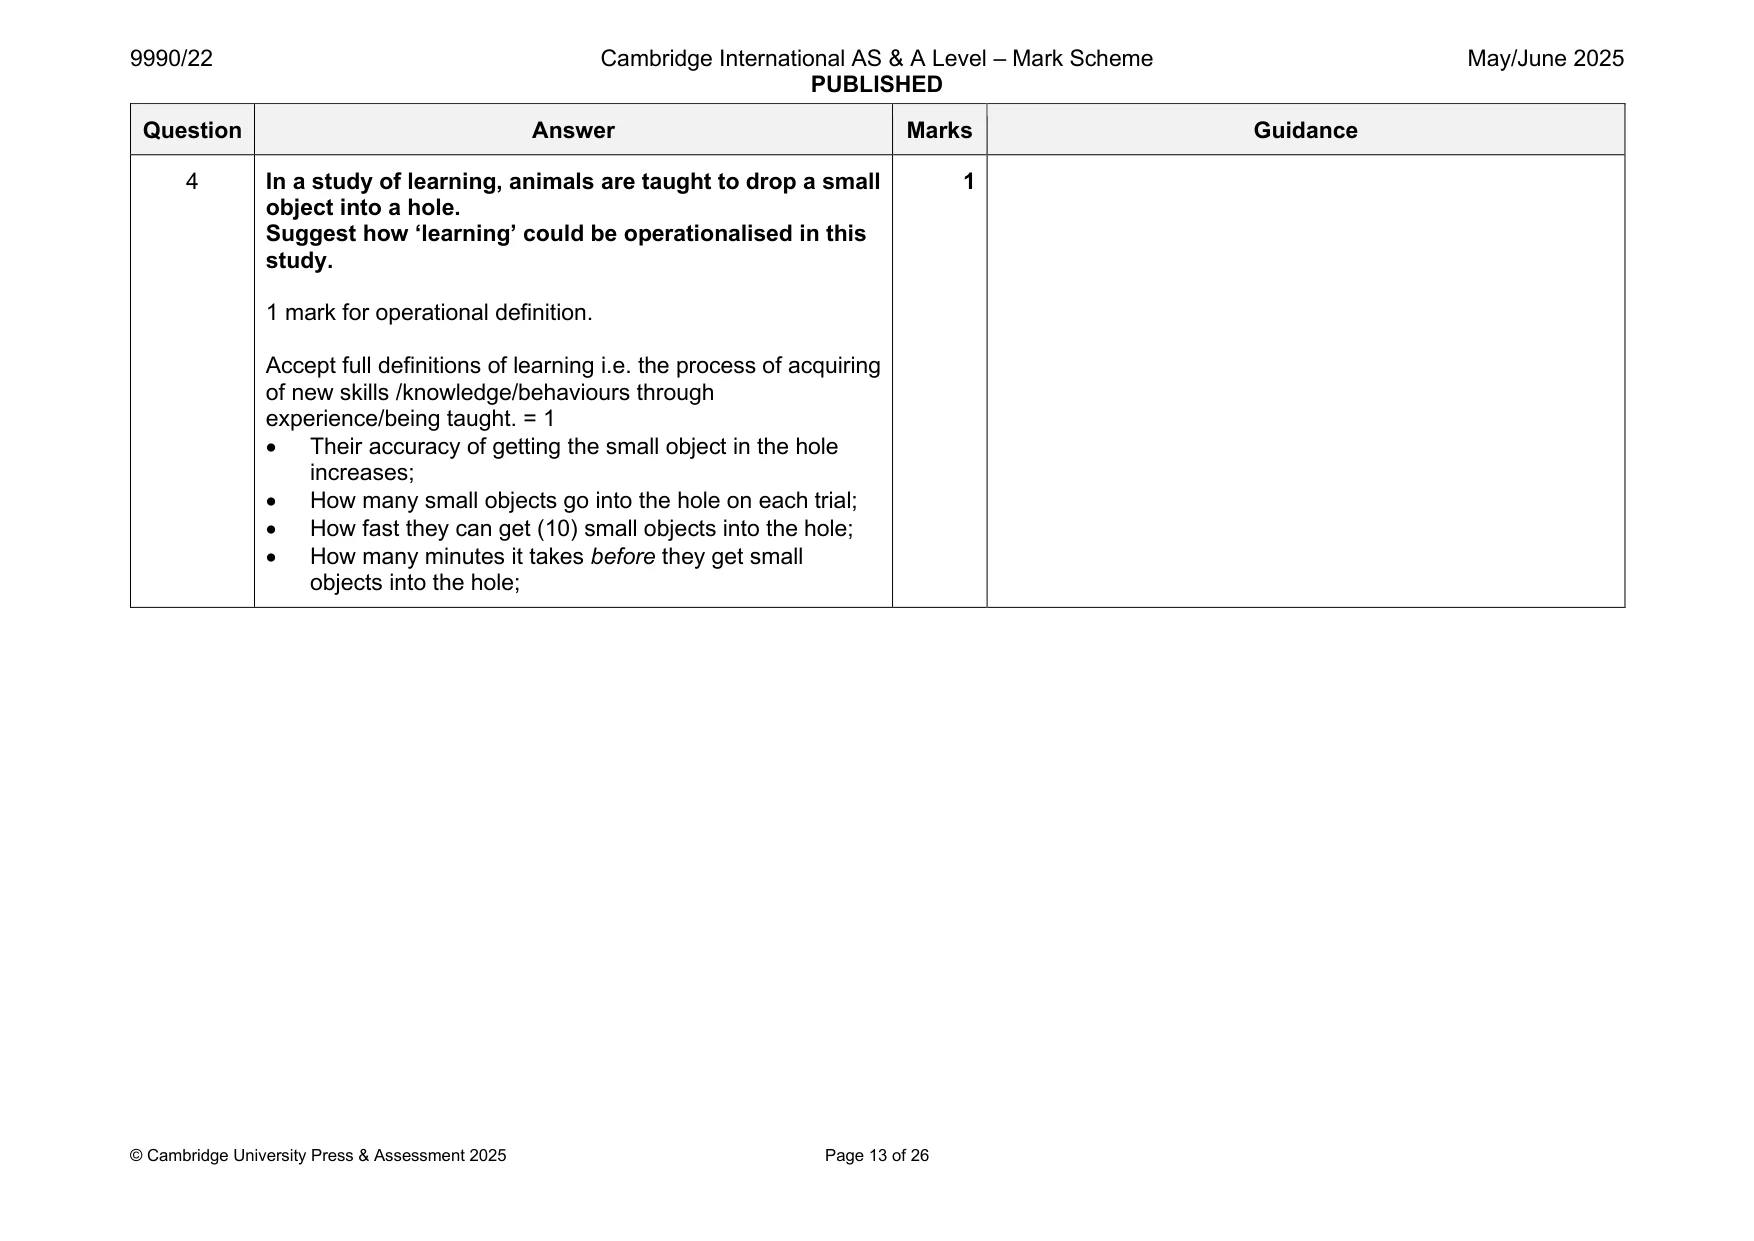
4 In a study of learning, animals are taught to drop a small object into a hole. Suggest how ‘learning’ could be operationalised in this study. .......................................................................................................................................................... .................................................................................................................................................... [1]
Mark scheme: 4 In a study of learning, animals are taught to drop a small 1 object into a hole. Suggest how ‘learning’ could be operationalised in this study. 1 mark for operational definition. Accept full definitions of learning i.e. the process of acquiring of new skills /knowledge/behaviours through experience/being taught. = 1 • Their accuracy of getting the small object in the hole increases; • How many small objects go into the hole on each trial; • How fast they can get (10) small objects into the hole; • How many minutes it takes before they get small objects into the hole;
Q5 · In some studies, scientific equipment is used to measure variables, such as brain…
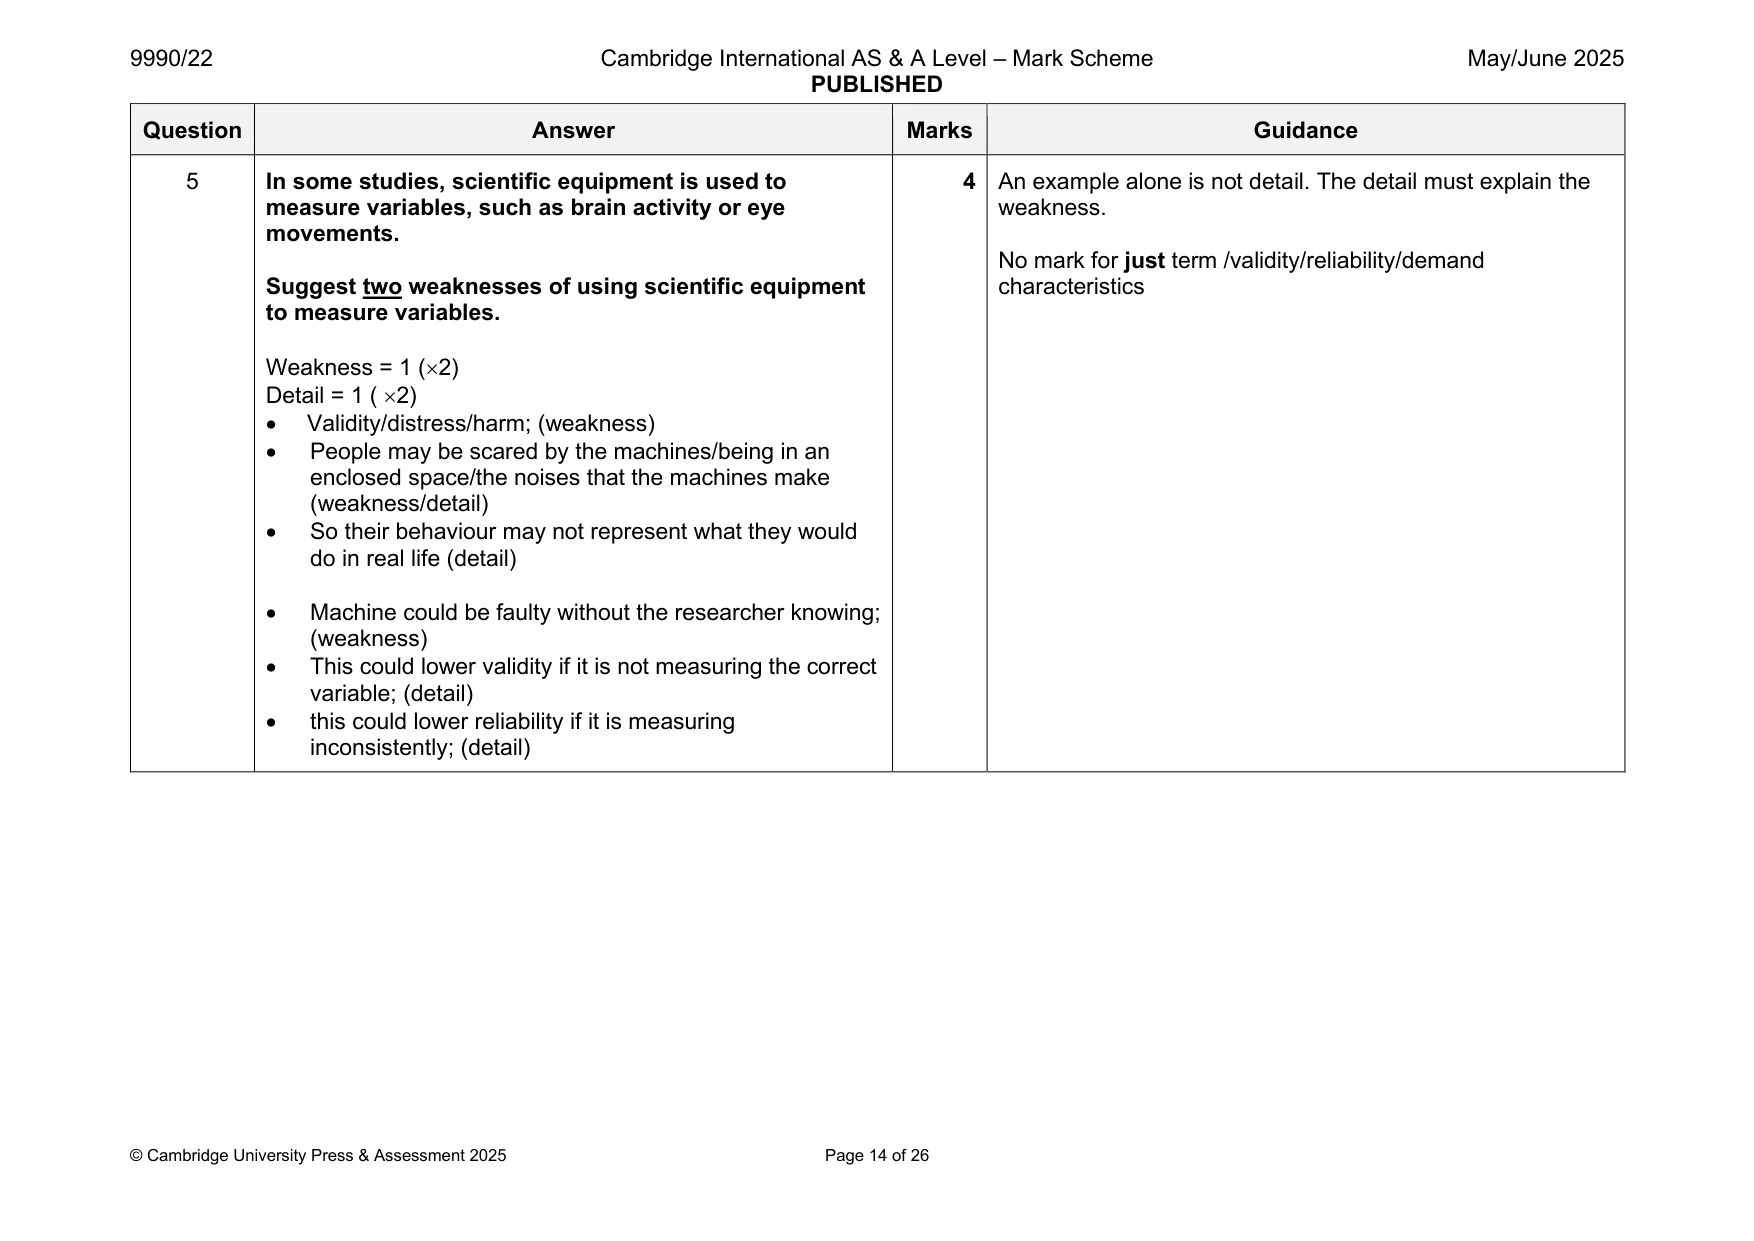
5 In some studies, scientific equipment is used to measure variables, such as brain activity or eye movements. Suggest two weaknesses of using scientific equipment to measure variables. 1 ....................................................................................................................................................... .......................................................................................................................................................... .......................................................................................................................................................... .......................................................................................................................................................... 2 ....................................................................................................................................................... .......................................................................................................................................................... .......................................................................................................................................................... .......................................................................................................................................................... [4]
Mark scheme: 5 In some studies, scientific equipment is used to 4 An example alone is not detail. The detail must explain the measure variables, such as brain activity or eye weakness. movements. No mark for just term /validity/reliability/demand Suggest two weaknesses of using scientific equipment characteristics to measure variables. Weakness = 1 (2) Detail = 1 ( 2) • Validity/distress/harm; (weakness) • People may be scared by the machines/being in an enclosed space/the noises that the machines make (weakness/detail) • So their behaviour may not represent what they would do in real life (detail) • Machine could be faulty without the researcher knowing; (weakness) • This could lower validity if it is not measuring the correct variable; (detail) • this could lower reliability if it is measuring inconsistently; (detail)
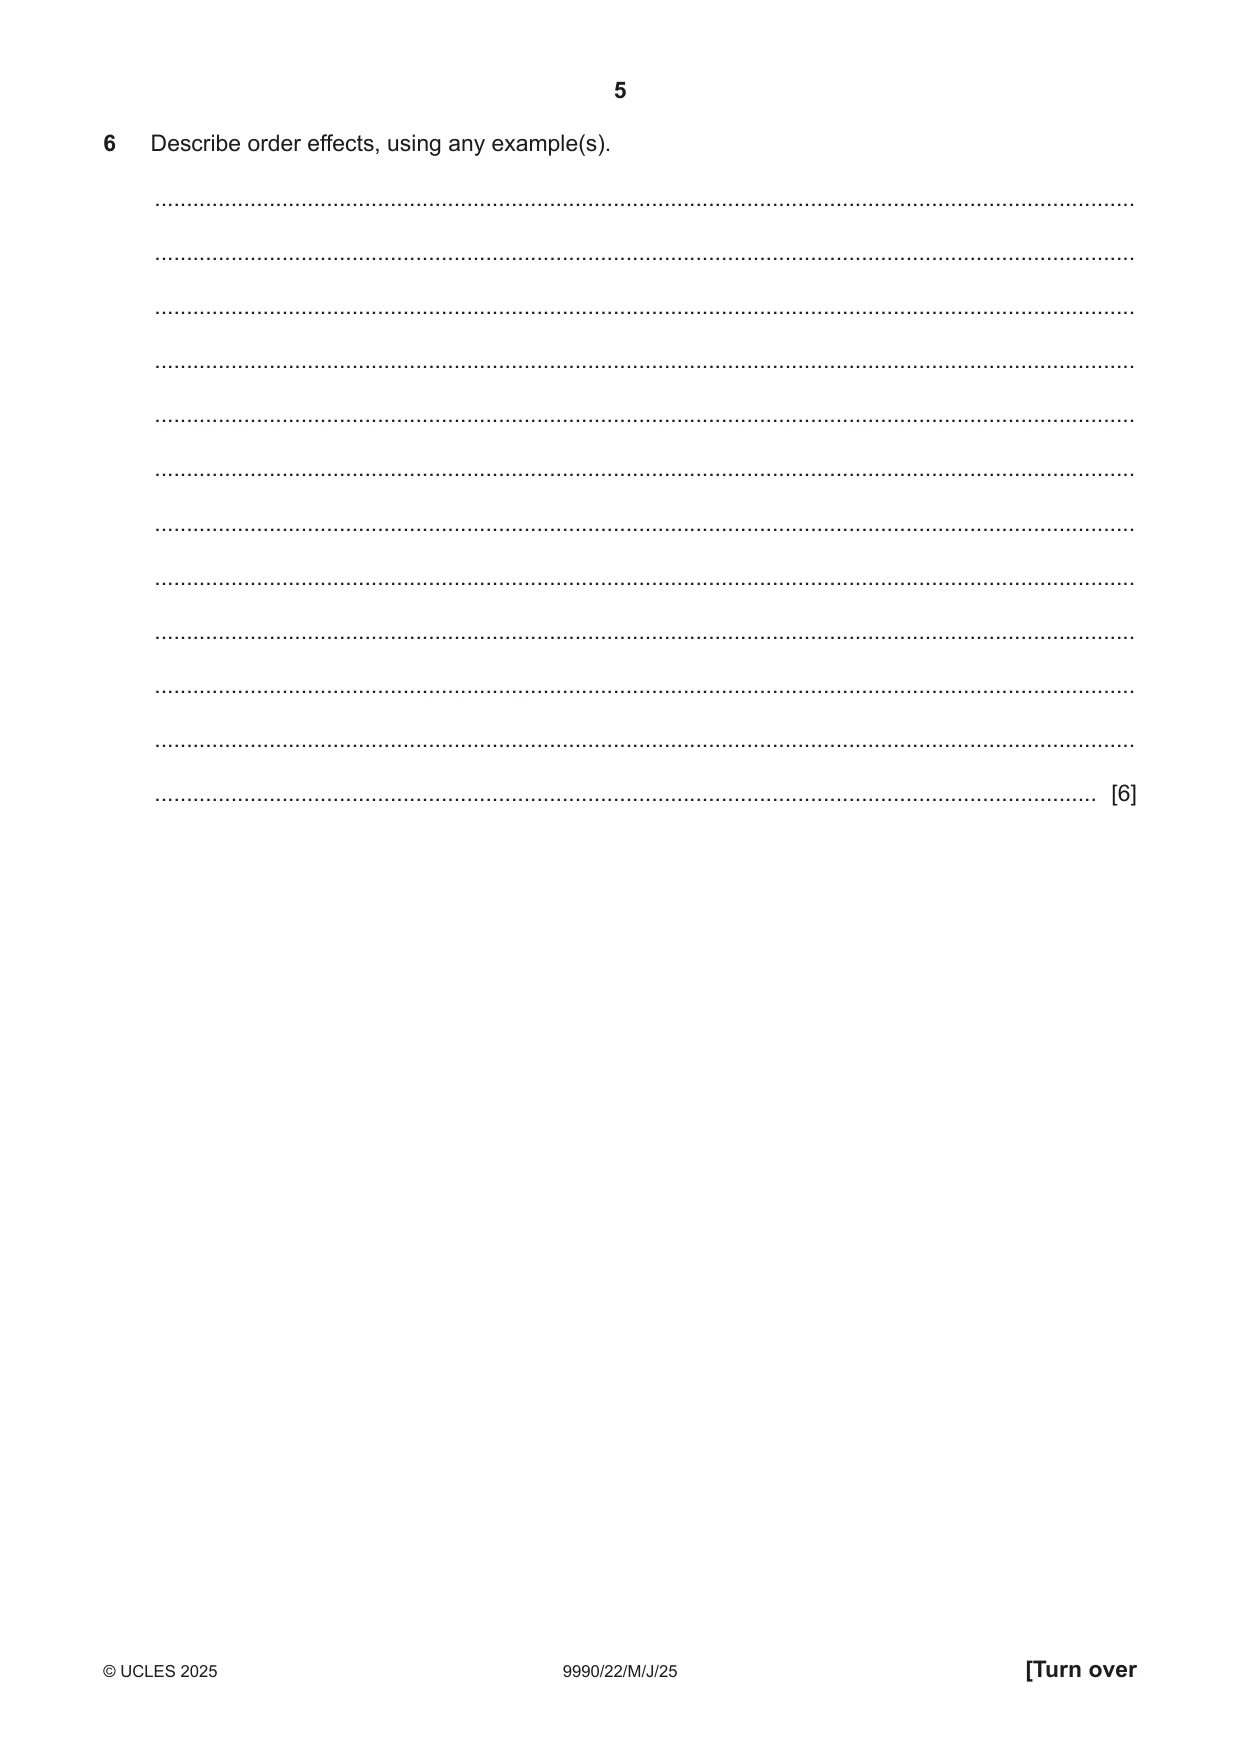
Q6 · Describe order effects, using any example(s)
6 Describe order effects, using any example(s). .......................................................................................................................................................... .......................................................................................................................................................... .......................................................................................................................................................... .......................................................................................................................................................... .......................................................................................................................................................... .......................................................................................................................................................... .......................................................................................................................................................... .......................................................................................................................................................... .......................................................................................................................................................... .......................................................................................................................................................... .......................................................................................................................................................... .................................................................................................................................................... [6]
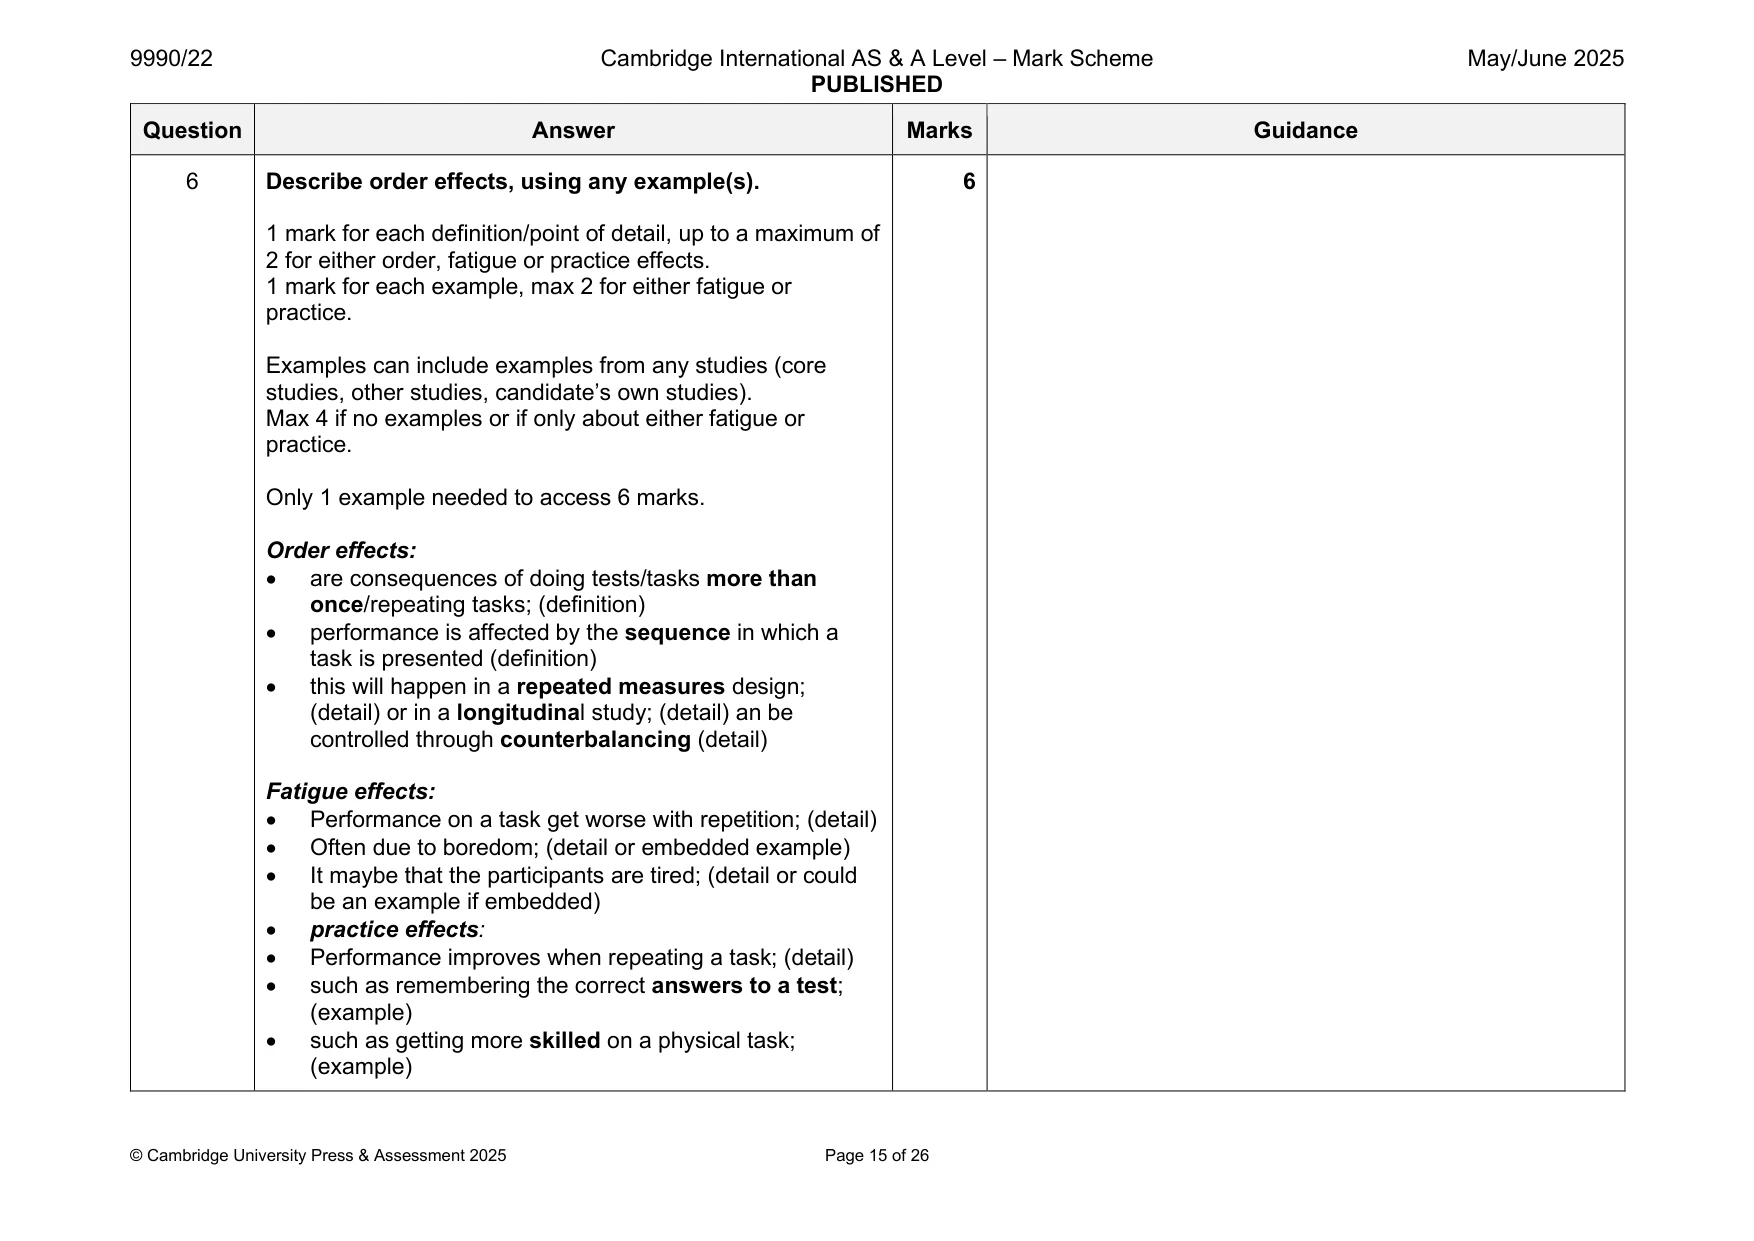
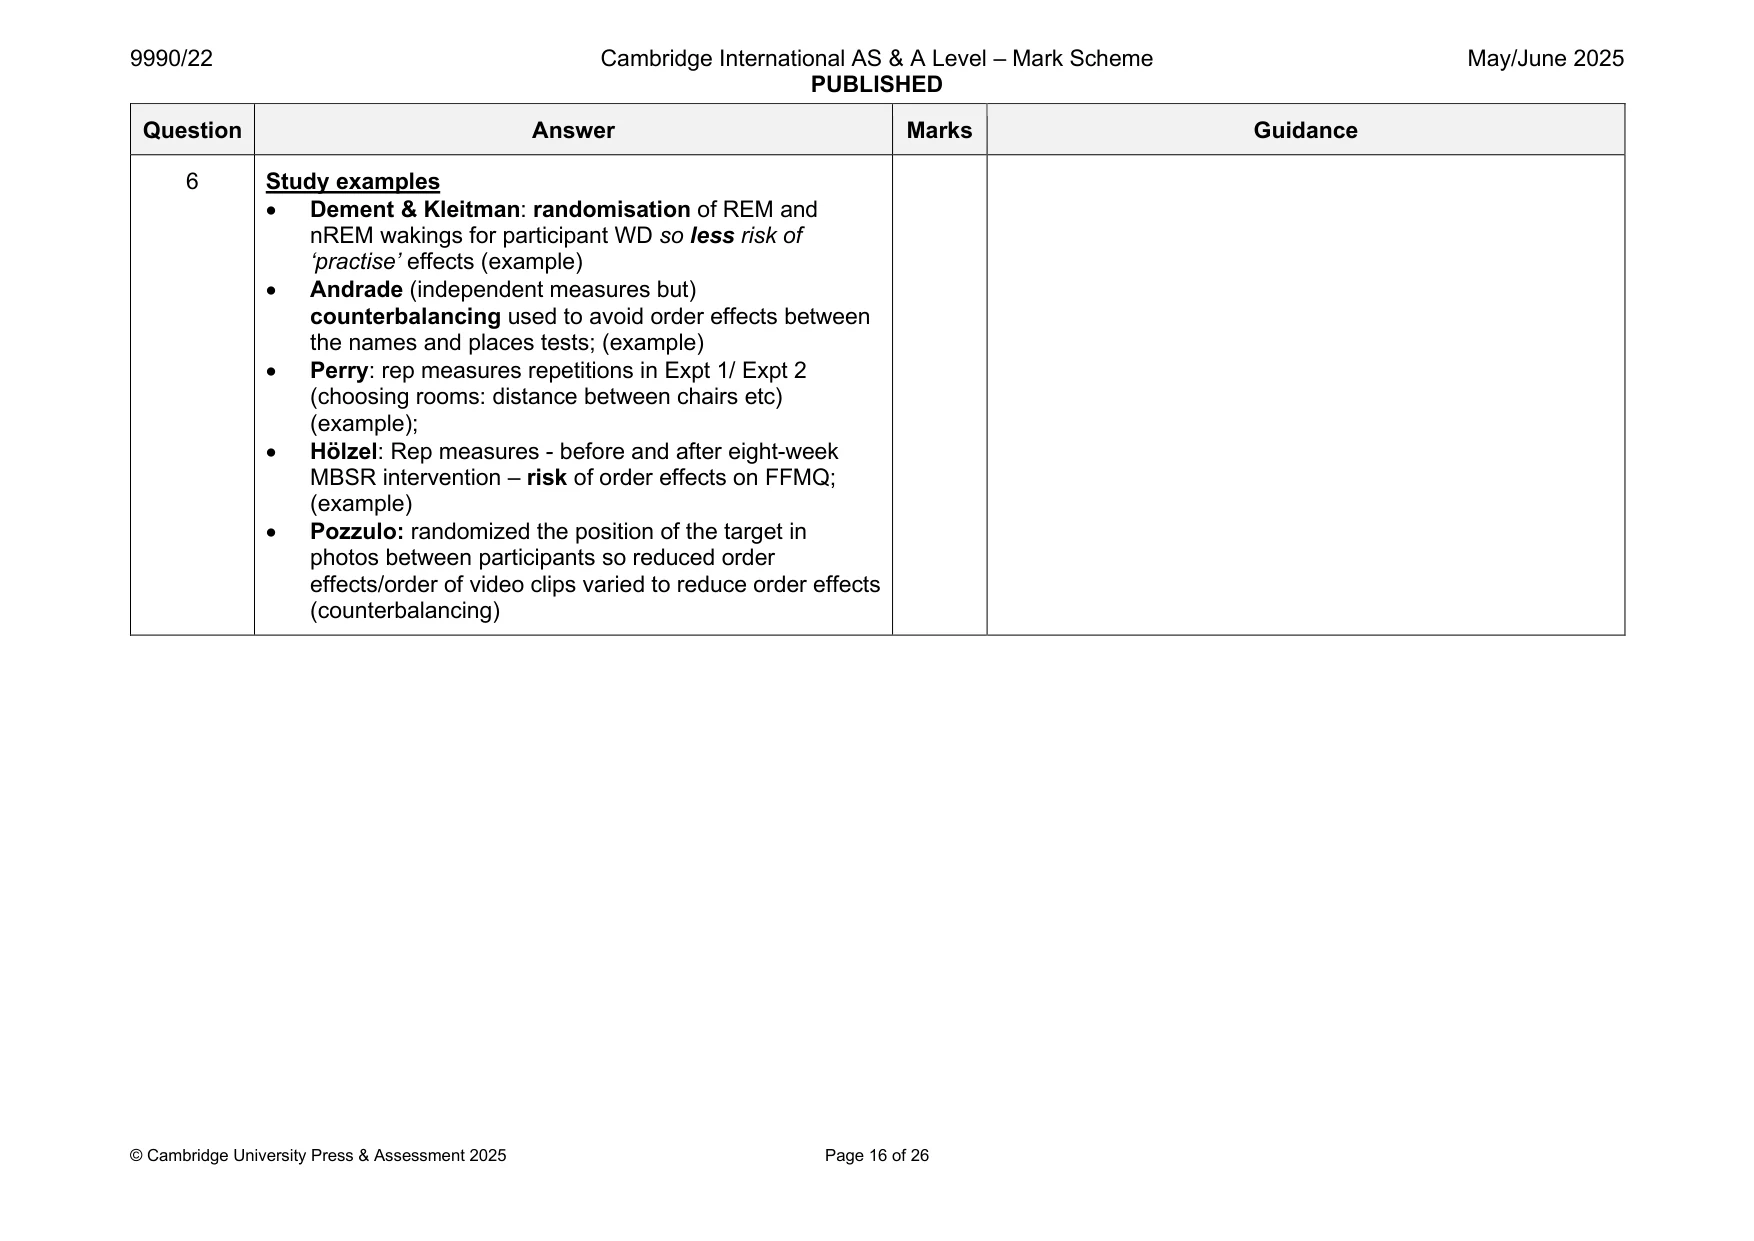
Mark scheme: 6 Describe order effects, using any example(s). 6 1 mark for each definition/point of detail, up to a maximum of 2 for either order, fatigue or practice effects. 1 mark for each example, max 2 for either fatigue or practice. Examples can include examples from any studies (core studies, other studies, candidate’s own studies). Max 4 if no examples or if only about either fatigue or practice. Only 1 example needed to access 6 marks. Order effects: • are consequences of doing tests/tasks more than once/repeating tasks; (definition) • performance is affected by the sequence in which a task is presented (definition) • this will happen in a repeated measures design; (detail) or in a longitudinal study; (detail) an be controlled through counterbalancing (detail) Fatigue effects: • Performance on a task get worse with repetition; (detail) • Often due to boredom; (detail or embedded example) • It maybe that the participants are tired; (detail or could be an example if embedded) • practice effects: • Performance improves when repeating a task; (detail) • such as remembering the correct answers to a test; (example) • such as getting more skilled on a physical task; (example) 6 Study examples • Dement & Kleitman: randomisation of REM and nREM wakings for participant WD so less risk of ‘practise’ effects (example) • Andrade (independent measures but) counterbalancing used to avoid order effects between the names and places tests; (example) • Perry: rep measures repetitions in Expt 1/ Expt 2 (choosing rooms: distance between chairs etc) (example); • Hölzel: Rep measures - before and after eight-week MBSR intervention – risk of order effects on FFMQ; (example) • Pozzulo: randomized the position of the target in photos between participants so reduced order effects/order of video clips varied to reduce order effects (counterbalancing)
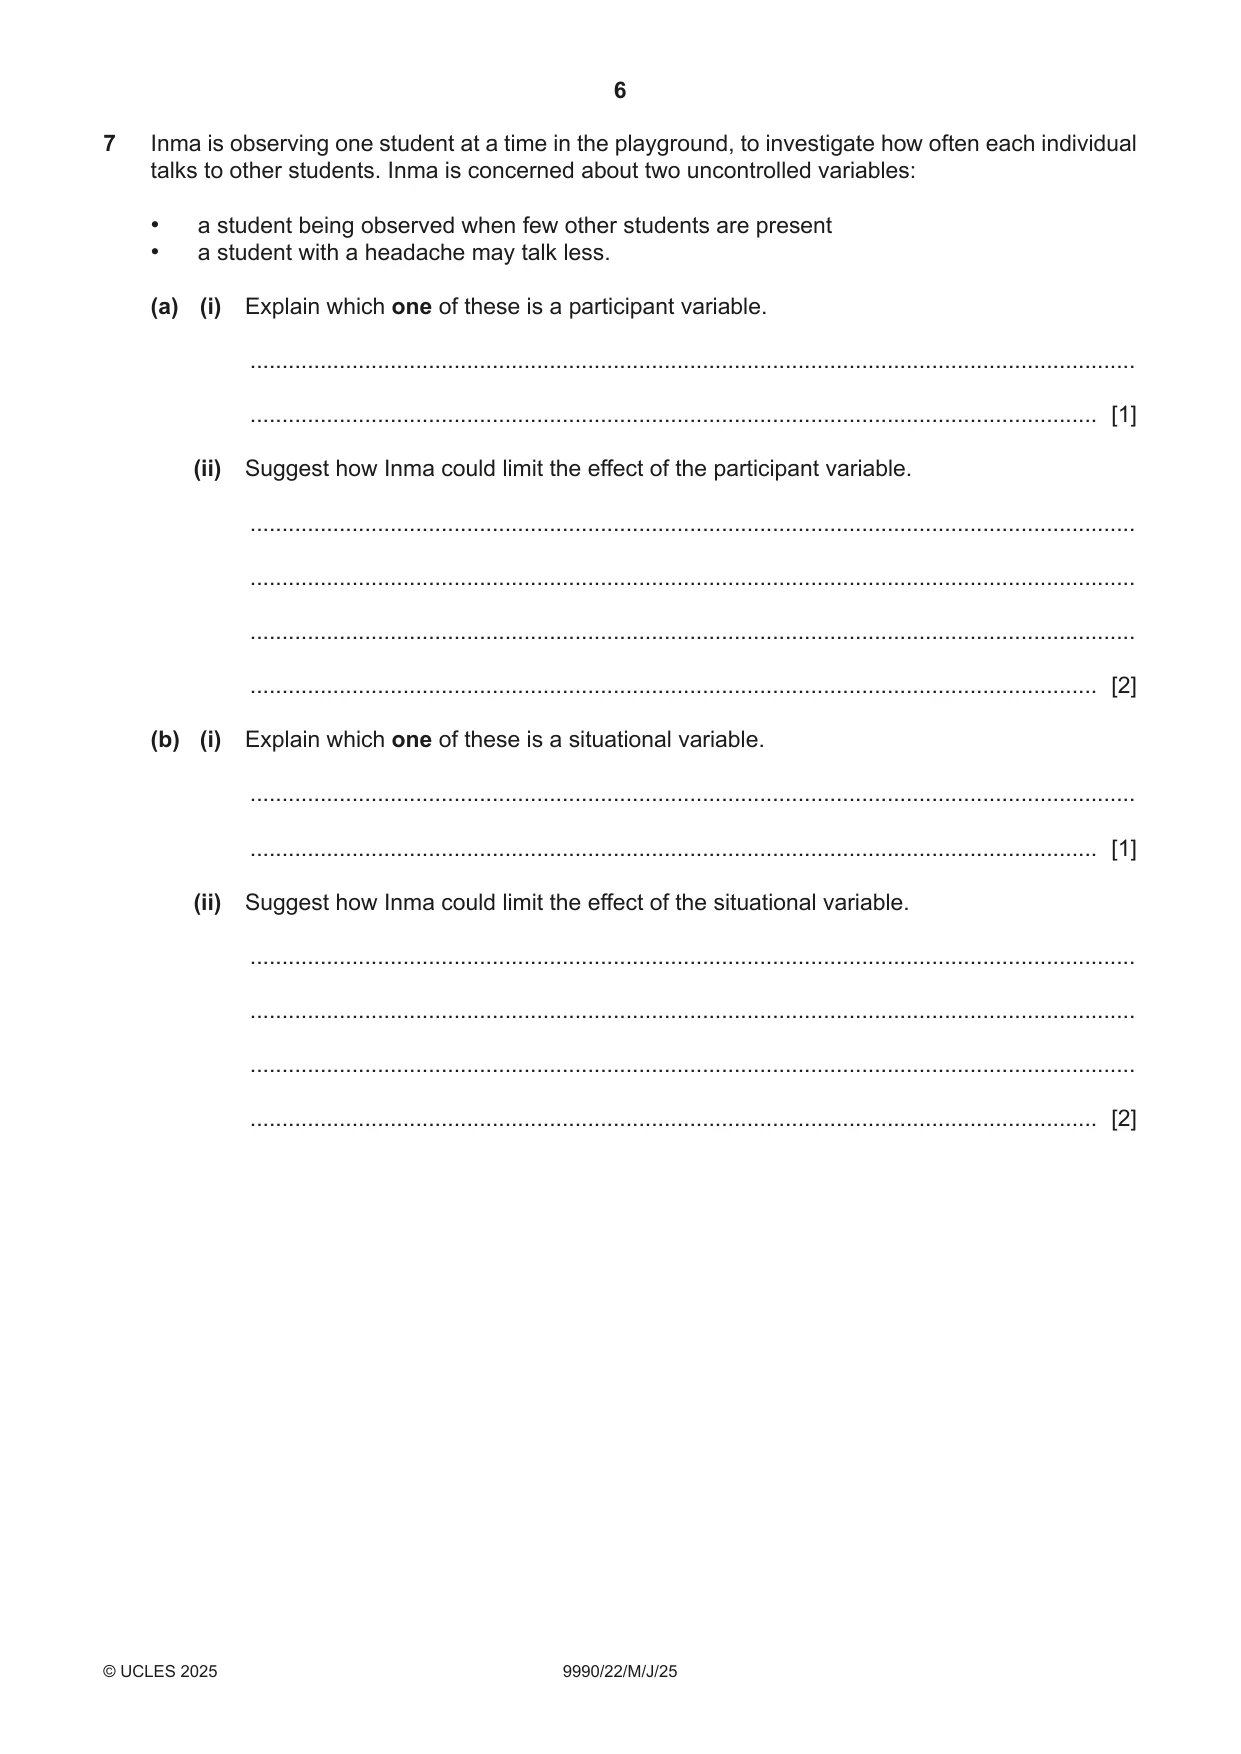
Q7 · Inma is observing one student at a time in the playground, to investigate how often each…
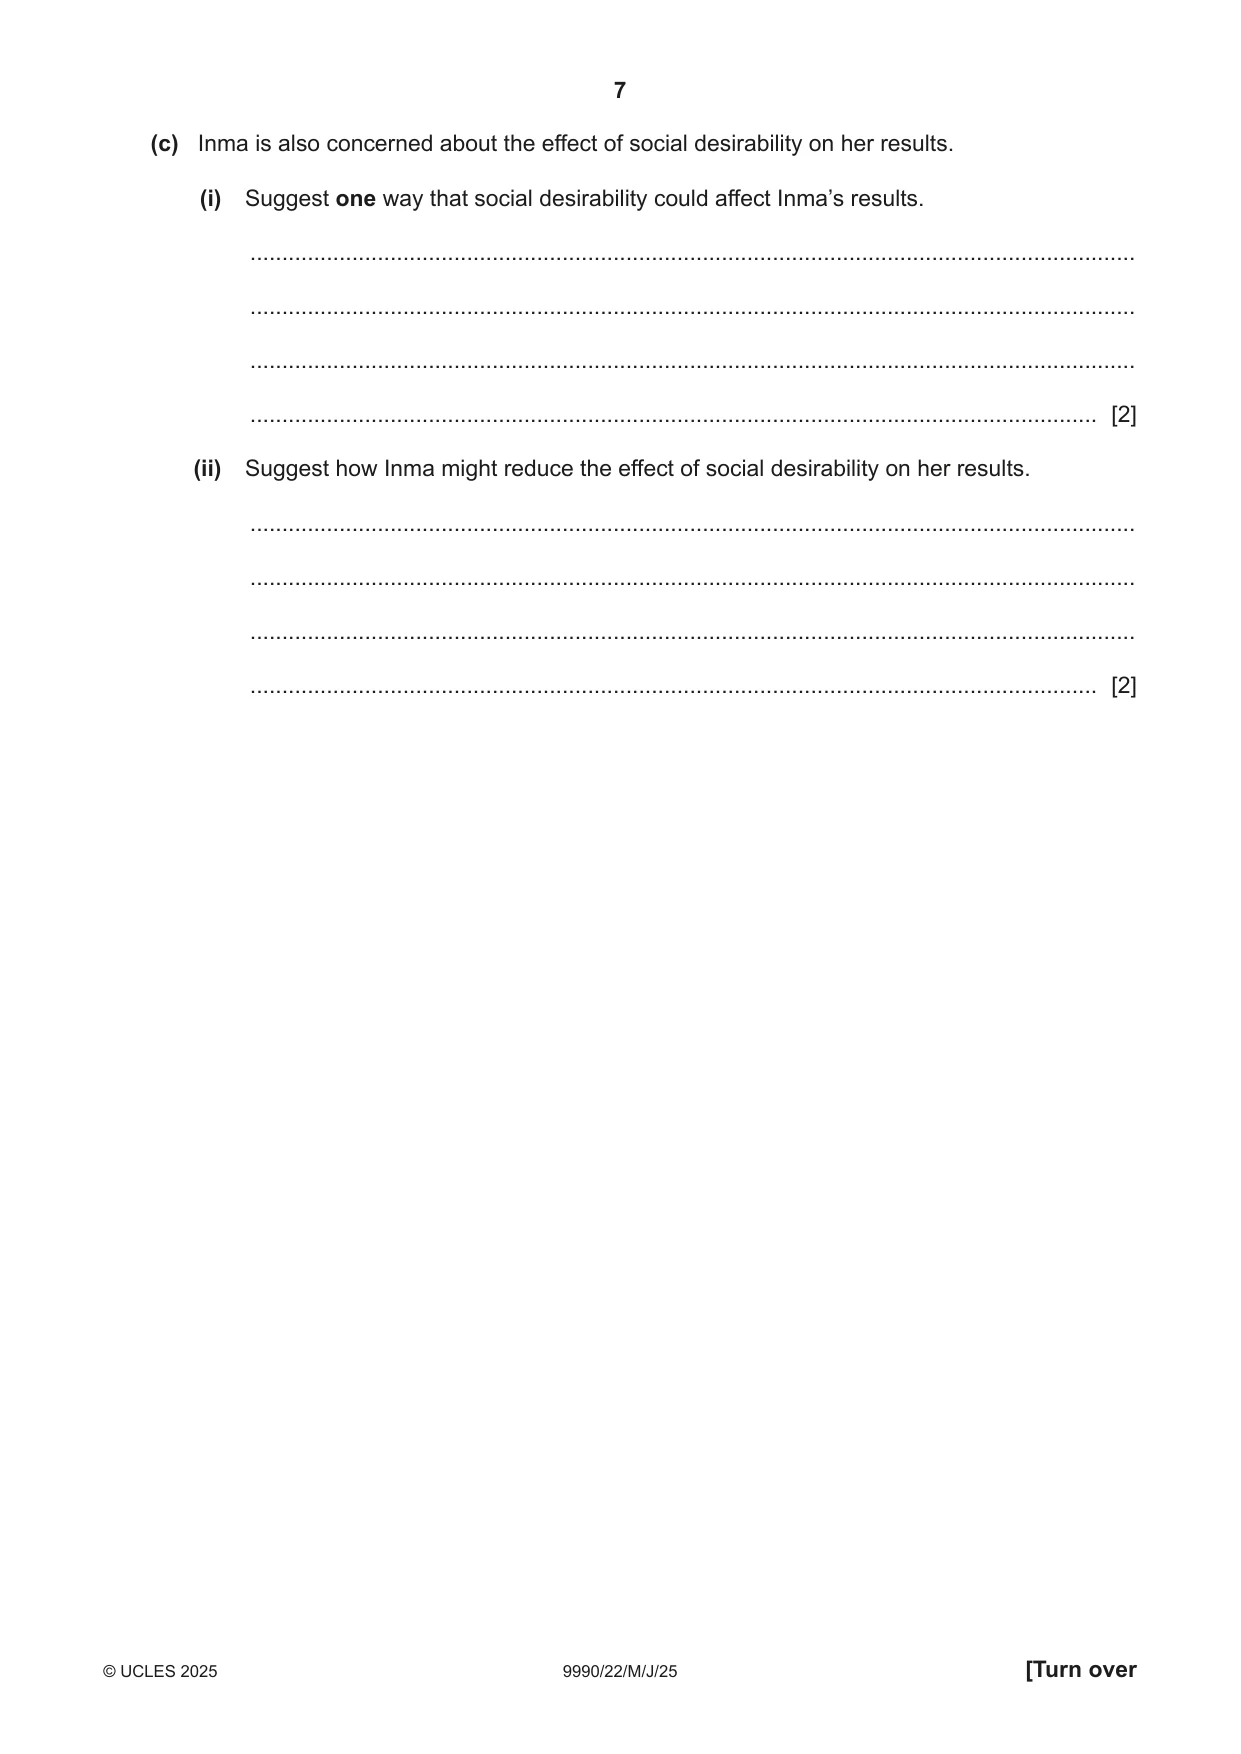
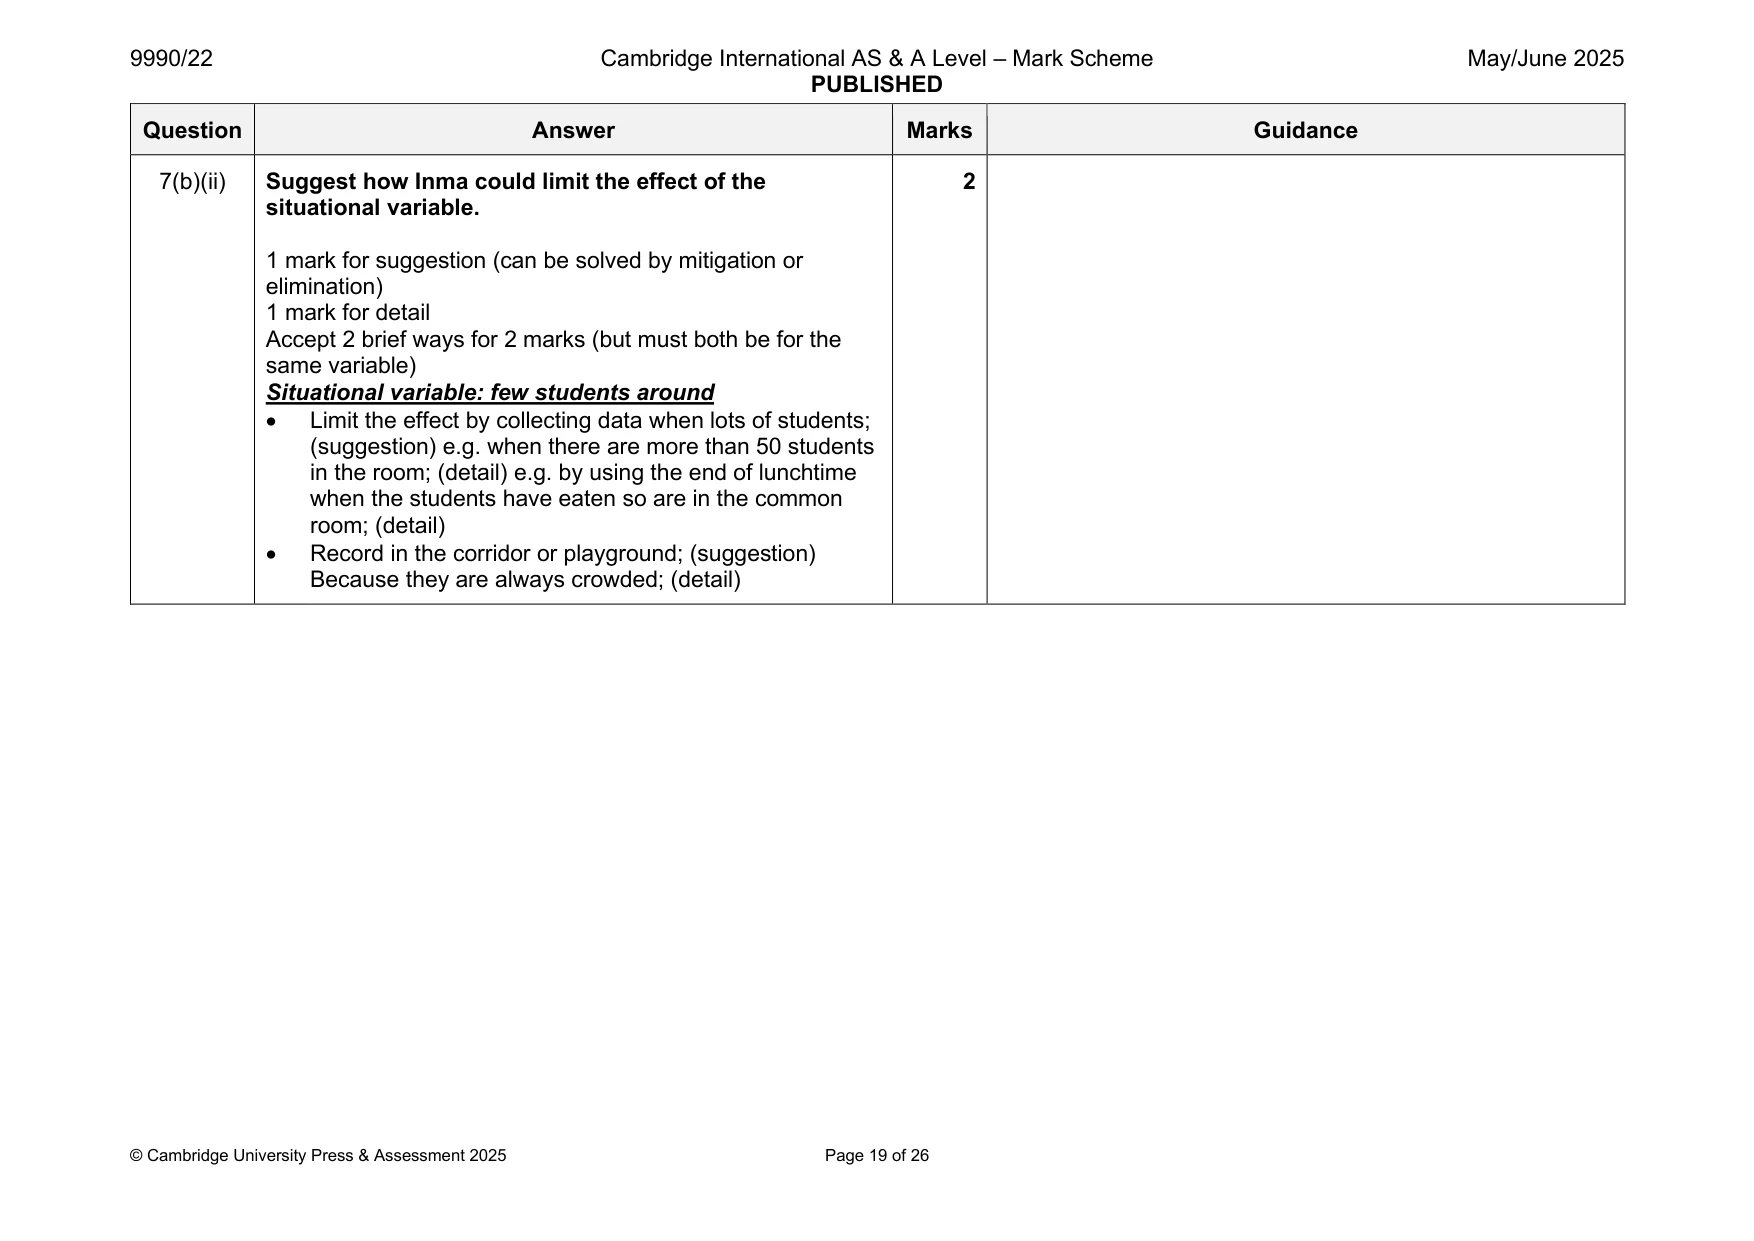
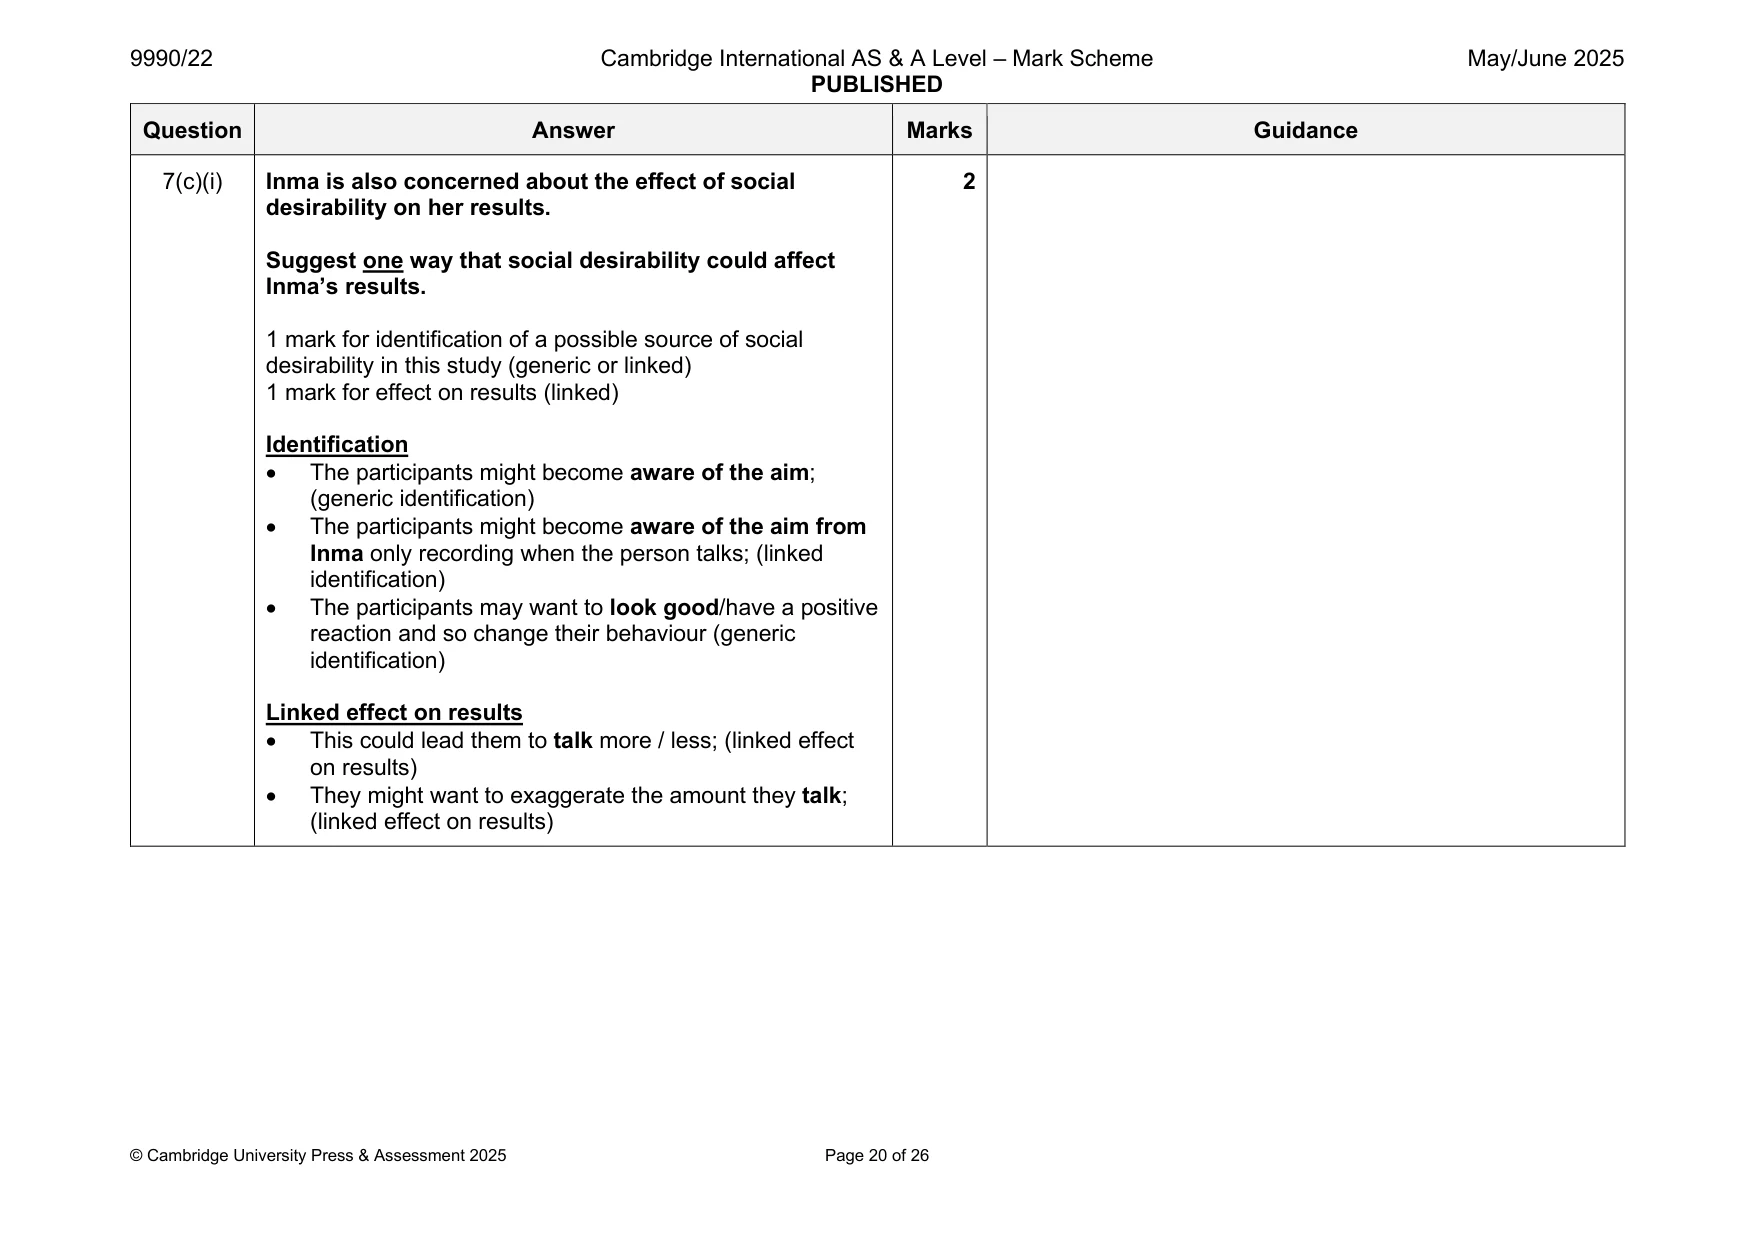
7 Inma is observing one student at a time in the playground, to investigate how often each individual talks to other students. Inma is concerned about two uncontrolled variables: • a student being observed when few other students are present • a student with a headache may talk less. (a) (i) Explain which one of these is a participant variable. ........................................................................................................................................... ..................................................................................................................................... [1] (ii) Suggest how Inma could limit the effect of the participant variable. ........................................................................................................................................... ........................................................................................................................................... ........................................................................................................................................... ..................................................................................................................................... [2] (b) (i) Explain which one of these is a situational variable. ........................................................................................................................................... ..................................................................................................................................... [1] (ii) Suggest how Inma could limit the effect of the situational variable. ........................................................................................................................................... ........................................................................................................................................... ........................................................................................................................................... ..................................................................................................................................... [2] (c) Inma is also concerned about the effect of social desirability on her results. (i) Suggest one way that social desirability could affect Inma’s results. ........................................................................................................................................... ........................................................................................................................................... ........................................................................................................................................... ..................................................................................................................................... [2] (ii) Suggest how Inma might reduce the effect of social desirability on her results. ........................................................................................................................................... ........................................................................................................................................... ........................................................................................................................................... ..................................................................................................................................... [2]
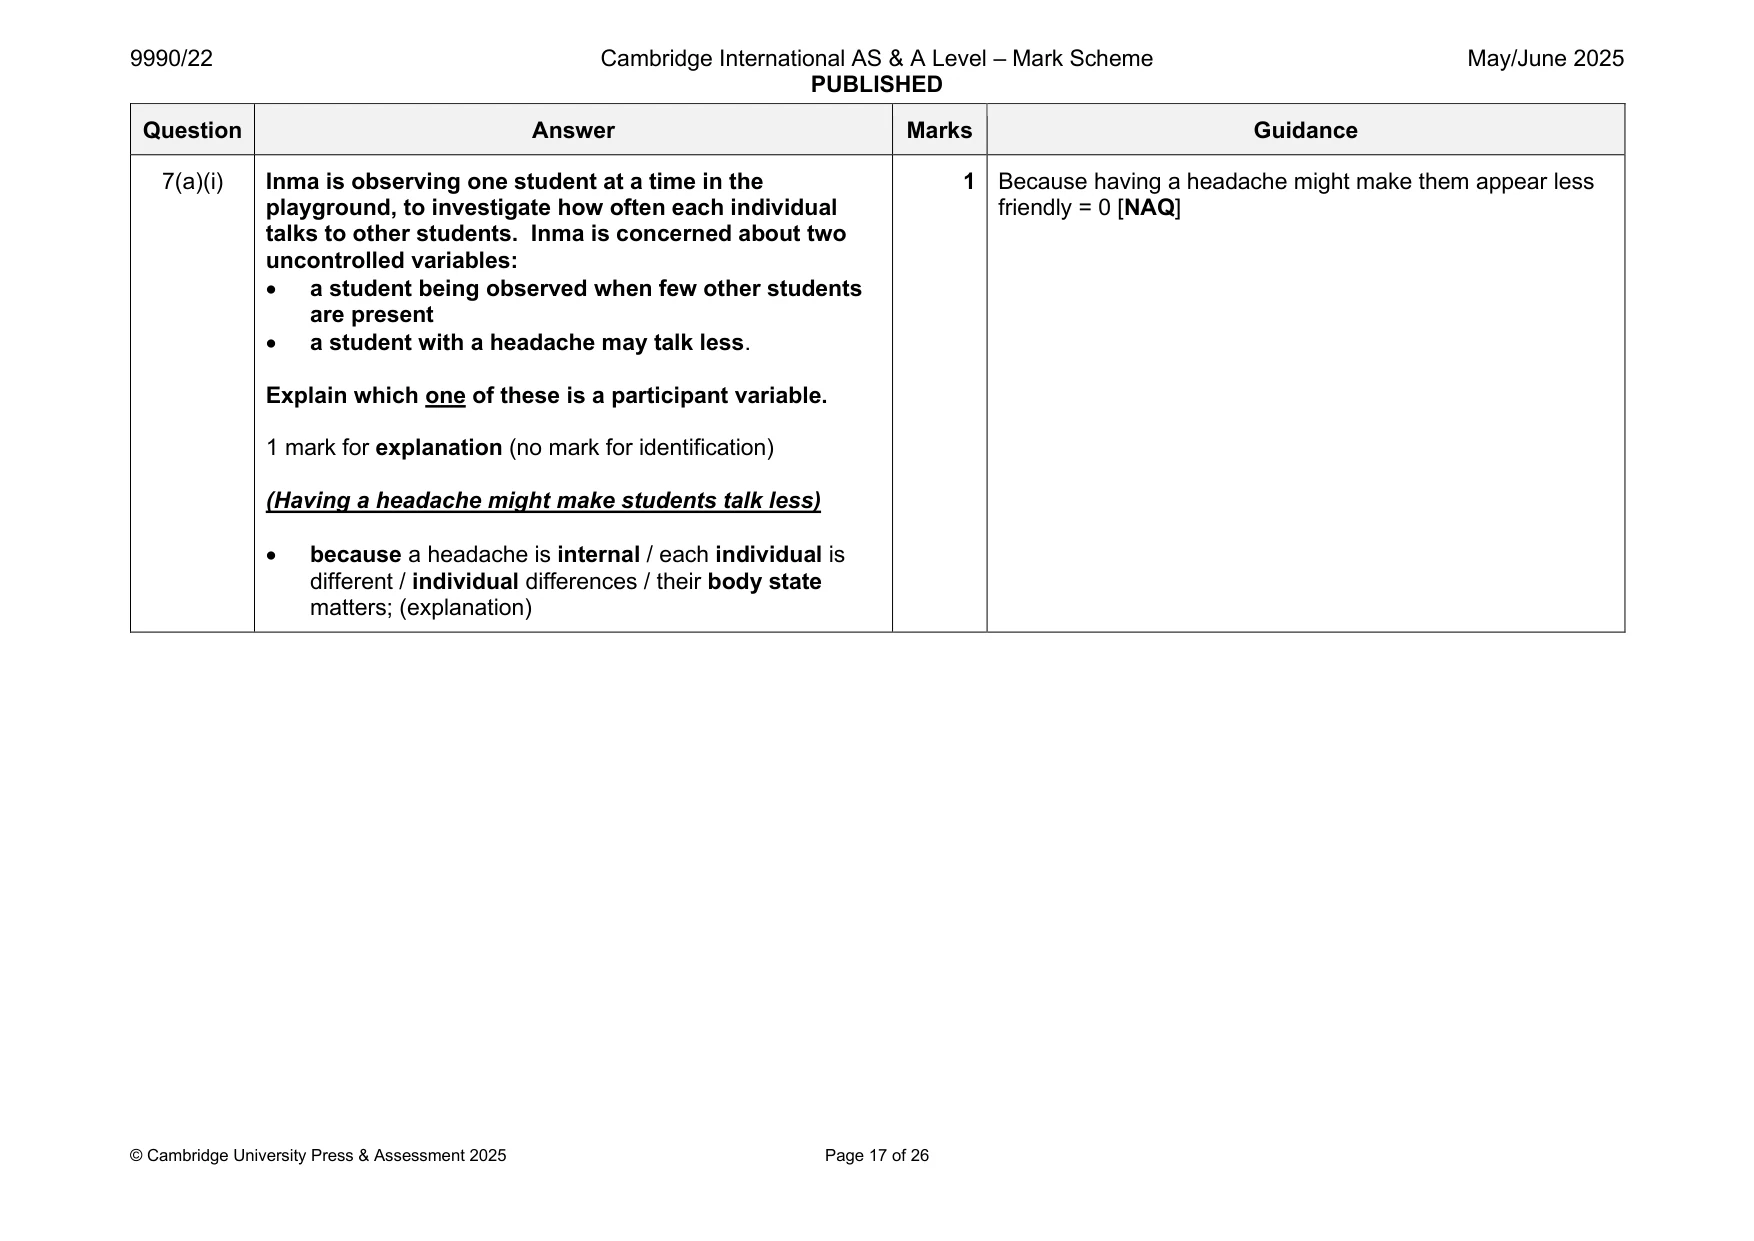
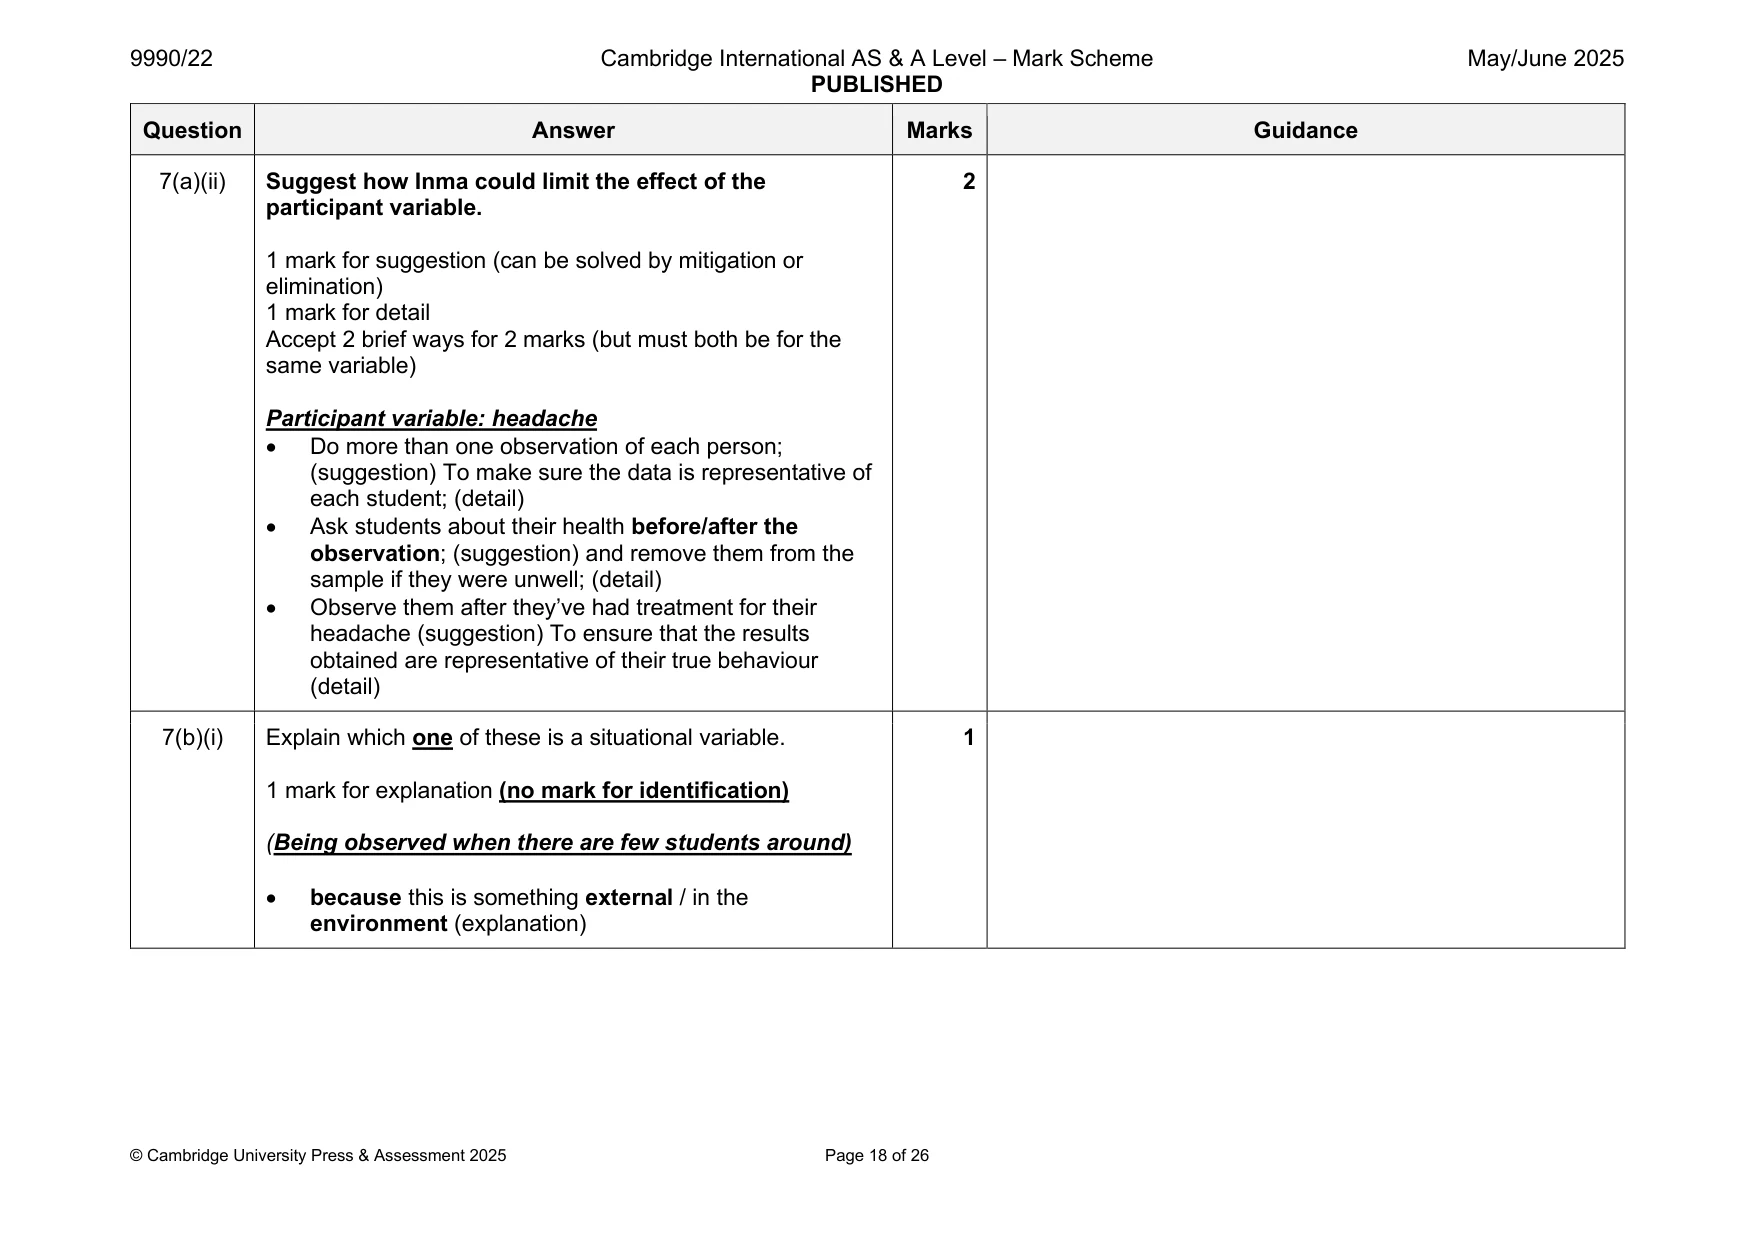
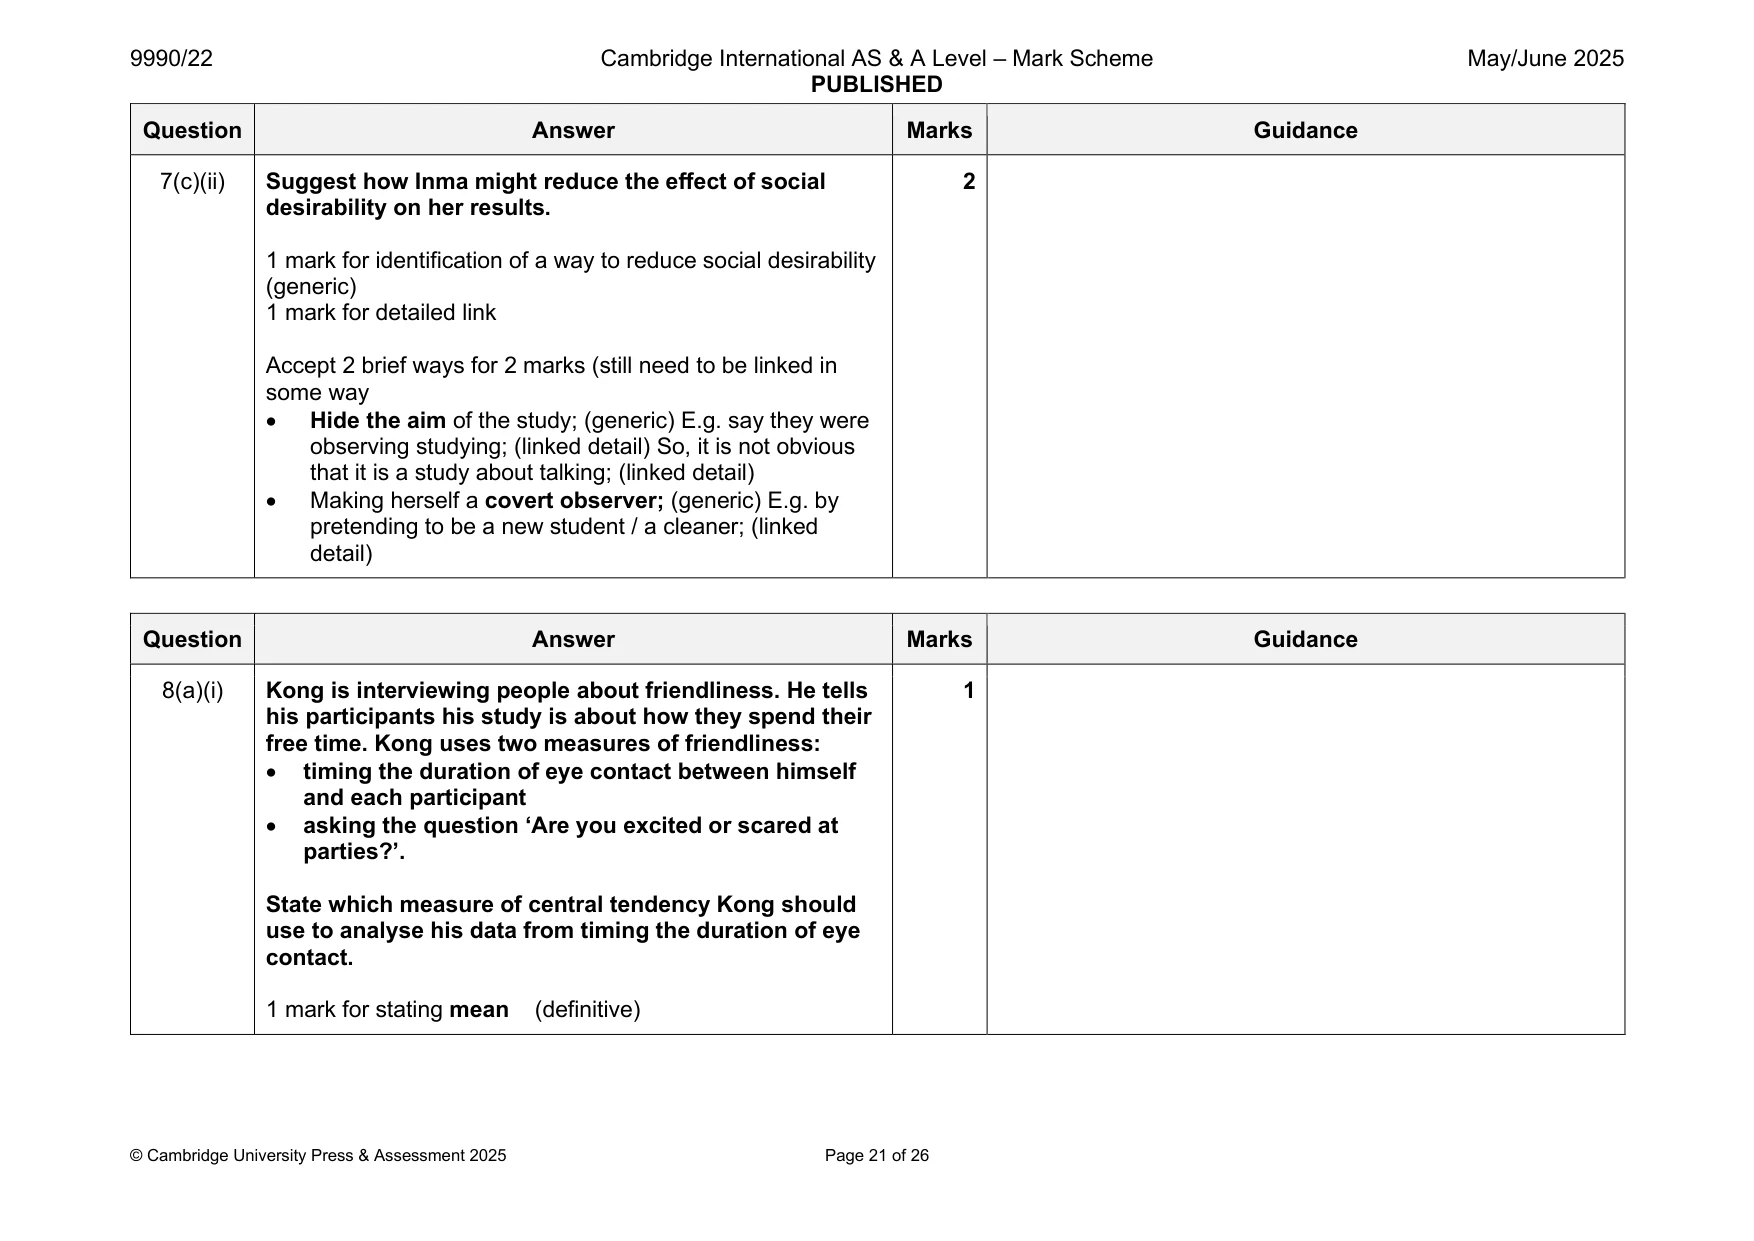
Mark scheme: 7(a)(i) Inma is observing one student at a time in the 1 Because having a headache might make them appear less playground, to investigate how often each individual friendly = 0 [NAQ] talks to other students. Inma is concerned about two uncontrolled variables: • a student being observed when few other students are present • a student with a headache may talk less. Explain which one of these is a participant variable. 1 mark for explanation (no mark for identification) (Having a headache might make students talk less) • because a headache is internal / each individual is different / individual differences / their body state matters; (explanation) 7(a)(ii) Suggest how Inma could limit the effect of the 2 participant variable. 1 mark for suggestion (can be solved by mitigation or elimination) 1 mark for detail Accept 2 brief ways for 2 marks (but must both be for the same variable) Participant variable: headache • Do more than one observation of each person; (suggestion) To make sure the data is representative of each student; (detail) • Ask students about their health before/after the observation; (suggestion) and remove them from the sample if they were unwell; (detail) • Observe them after they’ve had treatment for their headache (suggestion) To ensure that the results obtained are representative of their true behaviour (detail) 7(b)(i) Explain which one of these is a situational variable. 1 1 mark for explanation (no mark for identification) (Being observed when there are few students around) • because this is something external / in the environment (explanation) 7(b)(ii) Suggest how Inma could limit the effect of the 2 situational variable. 1 mark for suggestion (can be solved by mitigation or elimination) 1 mark for detail Accept 2 brief ways for 2 marks (but must both be for the same variable) Situational variable: few students around • Limit the effect by collecting data when lots of students; (suggestion) e.g. when there are more than 50 students in the room; (detail) e.g. by using the end of lunchtime when the students have eaten so are in the common room; (detail) • Record in the corridor or playground; (suggestion) Because they are always crowded; (detail) 7(c)(i) Inma is also concerned about the effect of social 2 desirability on her results. Suggest one way that social desirability could affect Inma’s results. 1 mark for identification of a possible source of social desirability in this study (generic or linked) 1 mark for effect on results (linked) Identification • The participants might become aware of the aim; (generic identification) • The participants might become aware of the aim from Inma only recording when the person talks; (linked identification) • The participants may want to look good/have a positive reaction and so change their behaviour (generic identification) Linked effect on results • This could lead them to talk more / less; (linked effect on results) • They might want to exaggerate the amount they talk; (linked effect on results) 7(c)(ii) Suggest how Inma might reduce the effect of social 2 desirability on her results. 1 mark for identification of a way to reduce social desirability (generic) 1 mark for detailed link Accept 2 brief ways for 2 marks (still need to be linked in some way • Hide the aim of the study; (generic) E.g. say they were observing studying; (linked detail) So, it is not obvious that it is a study about talking; (linked detail) • Making herself a covert observer; (generic) E.g. by pretending to be a new student / a cleaner; (linked detail)
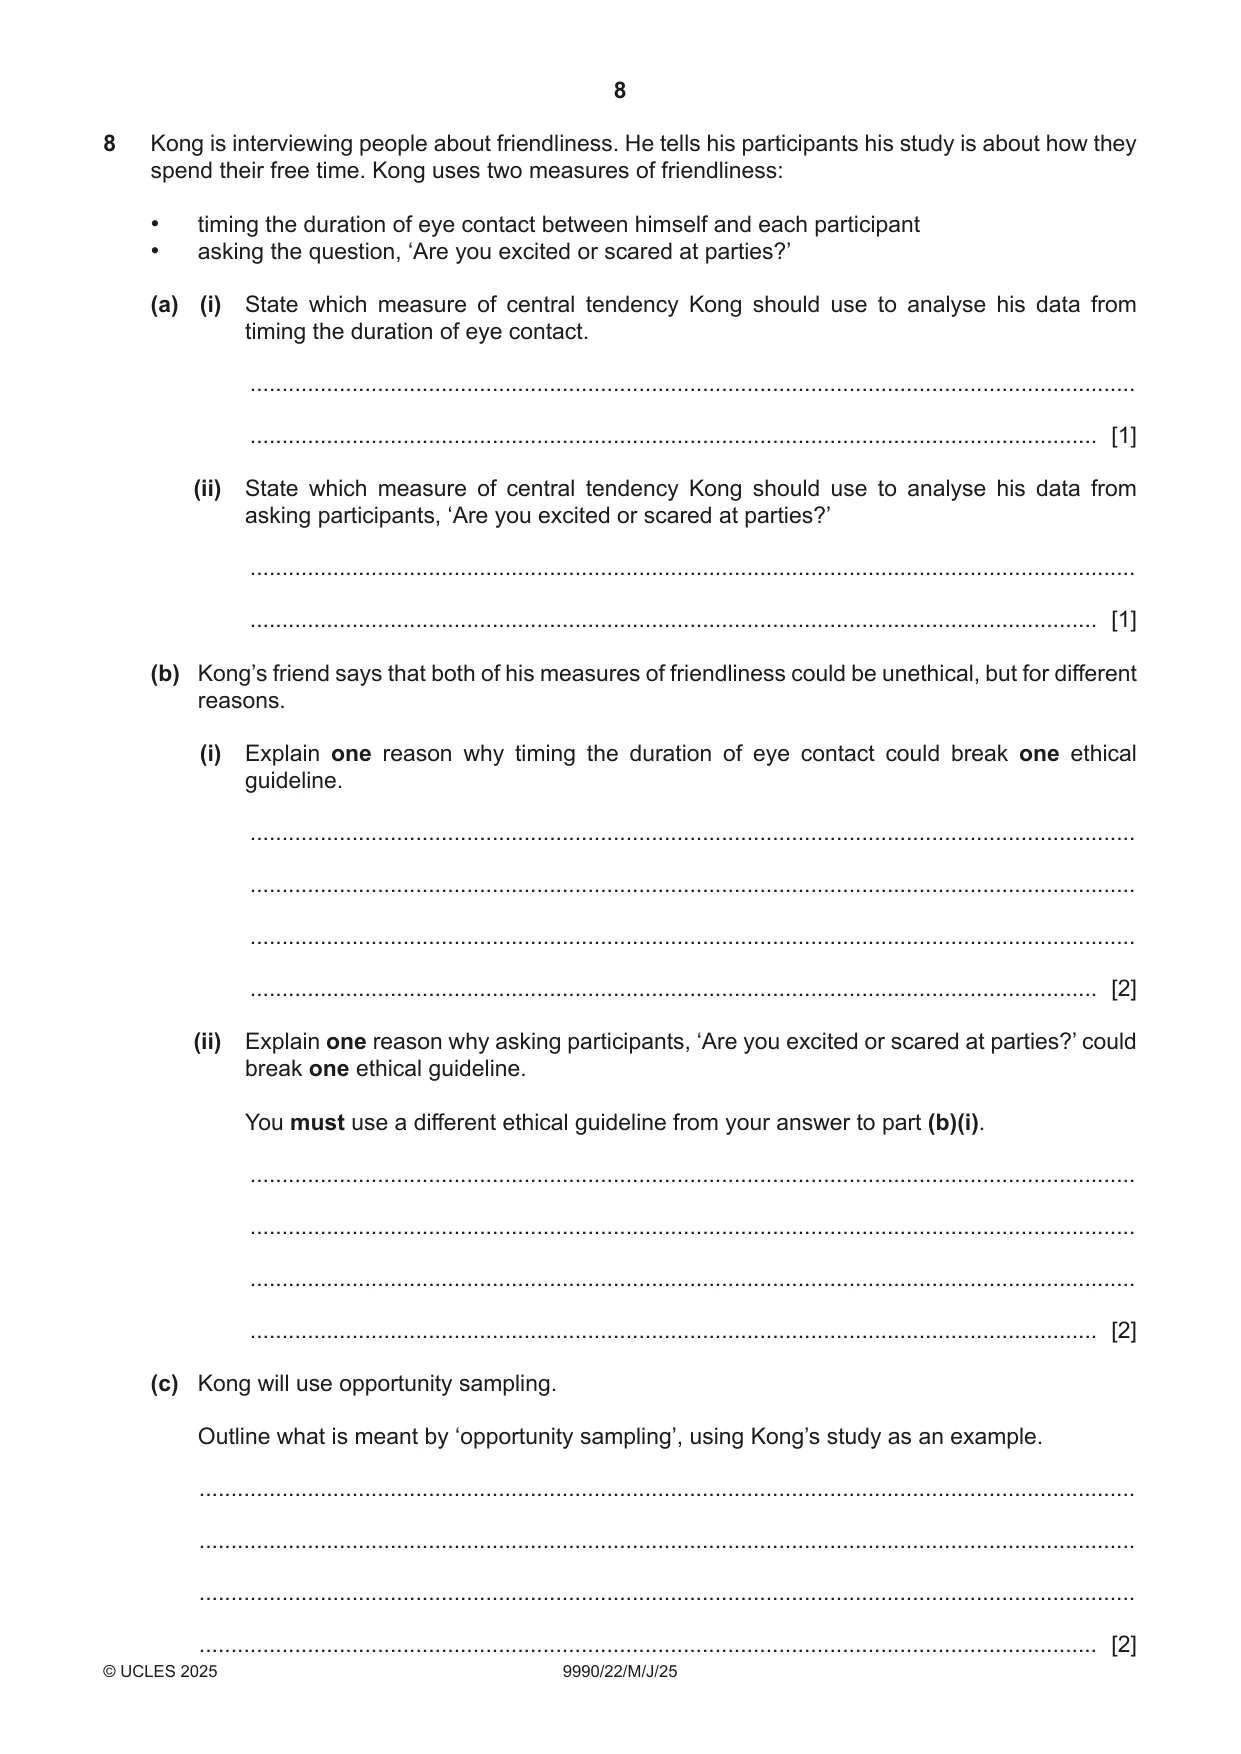
Q8 · Kong is interviewing people about friendliness
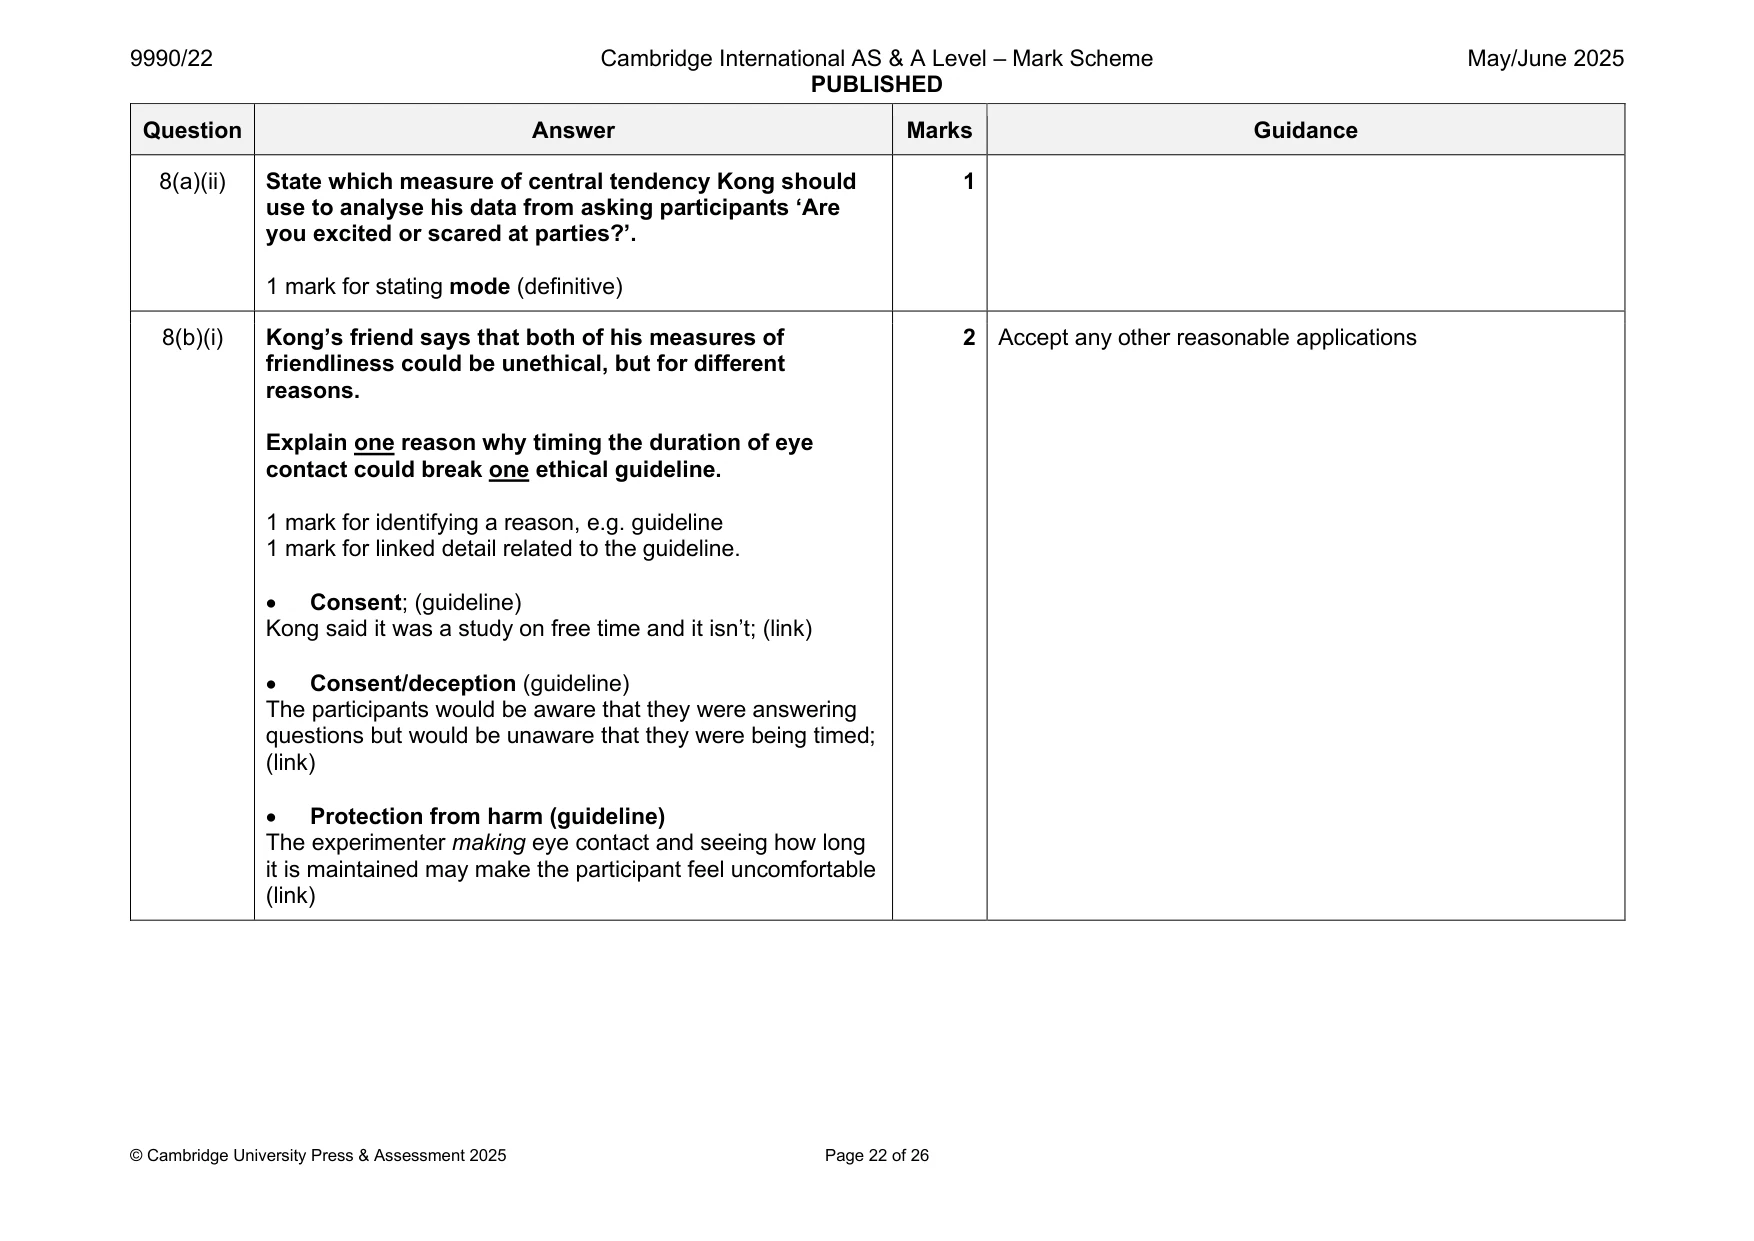
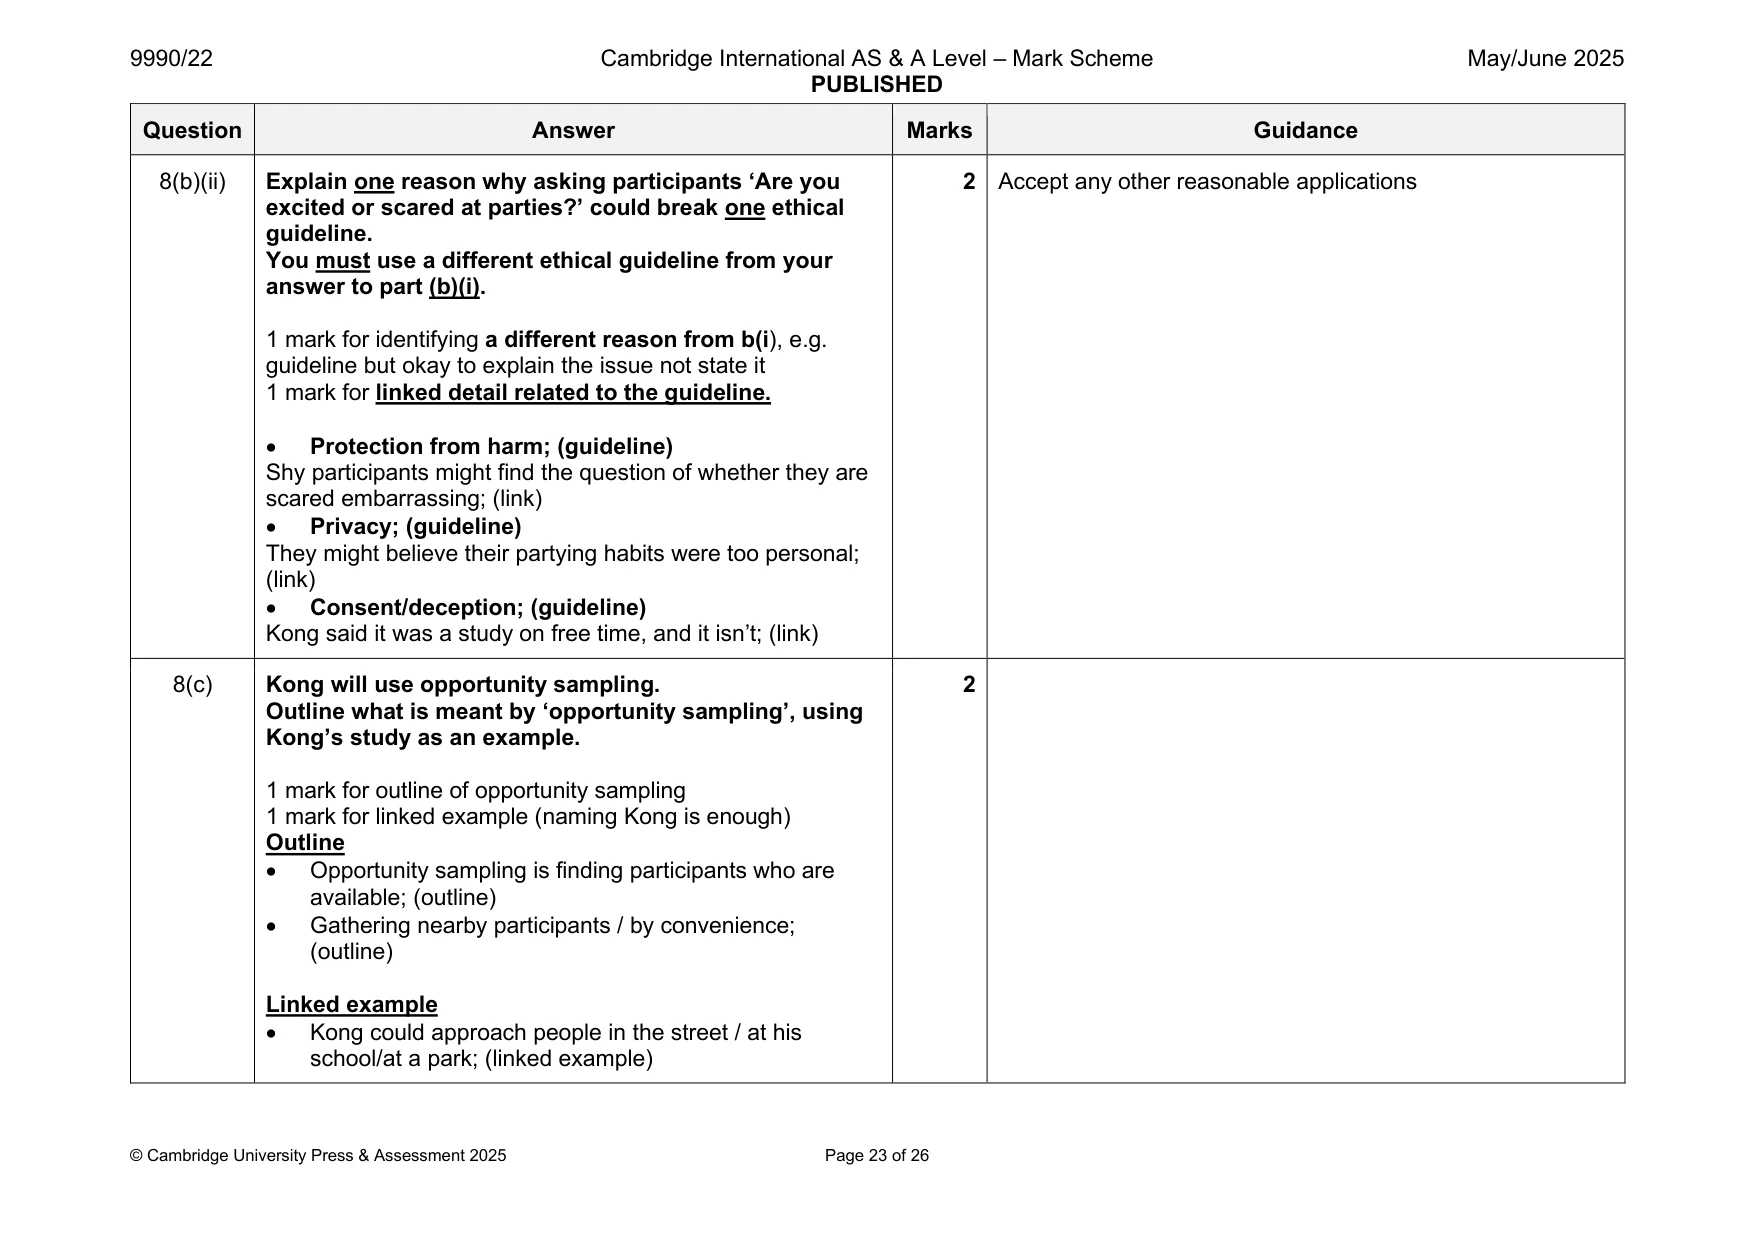
8 Kong is interviewing people about friendliness. He tells his participants his study is about how they spend their free time. Kong uses two measures of friendliness: • timing the duration of eye contact between himself and each participant • asking the question, ‘Are you excited or scared at parties?’ (a) (i) State which measure of central tendency Kong should use to analyse his data from timing the duration of eye contact. ........................................................................................................................................... ..................................................................................................................................... [1] (ii) State which measure of central tendency Kong should use to analyse his data from asking participants, ‘Are you excited or scared at parties?’ ........................................................................................................................................... ..................................................................................................................................... [1] (b) Kong’s friend says that both of his measures of friendliness could be unethical, but for different reasons. (i) Explain one reason why timing the duration of eye contact could break one ethical guideline. ........................................................................................................................................... ........................................................................................................................................... ........................................................................................................................................... ..................................................................................................................................... [2] (ii) Explain one reason why asking participants, ‘Are you excited or scared at parties?’ could break one ethical guideline. You must use a different ethical guideline from your answer to part (b)(i). ........................................................................................................................................... ........................................................................................................................................... ........................................................................................................................................... ..................................................................................................................................... [2] (c) Kong will use opportunity sampling. Outline what is meant by ‘opportunity sampling’, using Kong’s study as an example. ................................................................................................................................................... ................................................................................................................................................... ................................................................................................................................................... ............................................................................................................................................. [2]
Mark scheme: 8(a)(i) Kong is interviewing people about friendliness. He tells 1 his participants his study is about how they spend their free time. Kong uses two measures of friendliness: • timing the duration of eye contact between himself and each participant • asking the question ‘Are you excited or scared at parties?’. State which measure of central tendency Kong should use to analyse his data from timing the duration of eye contact. 1 mark for stating mean (definitive) 8(a)(ii) State which measure of central tendency Kong should 1 use to analyse his data from asking participants ‘Are you excited or scared at parties?’. 1 mark for stating mode (definitive) 8(b)(i) Kong’s friend says that both of his measures of 2 Accept any other reasonable applications friendliness could be unethical, but for different reasons. Explain one reason why timing the duration of eye contact could break one ethical guideline. 1 mark for identifying a reason, e.g. guideline 1 mark for linked detail related to the guideline. • Consent; (guideline) Kong said it was a study on free time and it isn’t; (link) • Consent/deception (guideline) The participants would be aware that they were answering questions but would be unaware that they were being timed; (link) • Protection from harm (guideline) The experimenter making eye contact and seeing how long it is maintained may make the participant feel uncomfortable (link) 8(b)(ii) Explain one reason why asking participants ‘Are you 2 Accept any other reasonable applications excited or scared at parties?’ could break one ethical guideline. You must use a different ethical guideline from your answer to part (b)(i). 1 mark for identifying a different reason from b(i), e.g. guideline but okay to explain the issue not state it 1 mark for linked detail related to the guideline. • Protection from harm; (guideline) Shy participants might find the question of whether they are scared embarrassing; (link) • Privacy; (guideline) They might believe their partying habits were too personal; (link) • Consent/deception; (guideline) Kong said it was a study on free time, and it isn’t; (link) 8(c) Kong will use opportunity sampling. 2 Outline what is meant by ‘opportunity sampling’, using Kong’s study as an example. 1 mark for outline of opportunity sampling 1 mark for linked example (naming Kong is enough) Outline • Opportunity sampling is finding participants who are available; (outline) • Gathering nearby participants / by convenience; (outline) Linked example • Kong could approach people in the street / at his school/at a park; (linked example)
Q9 · Dr Shaw is planning a questionnaire about early childhood memories
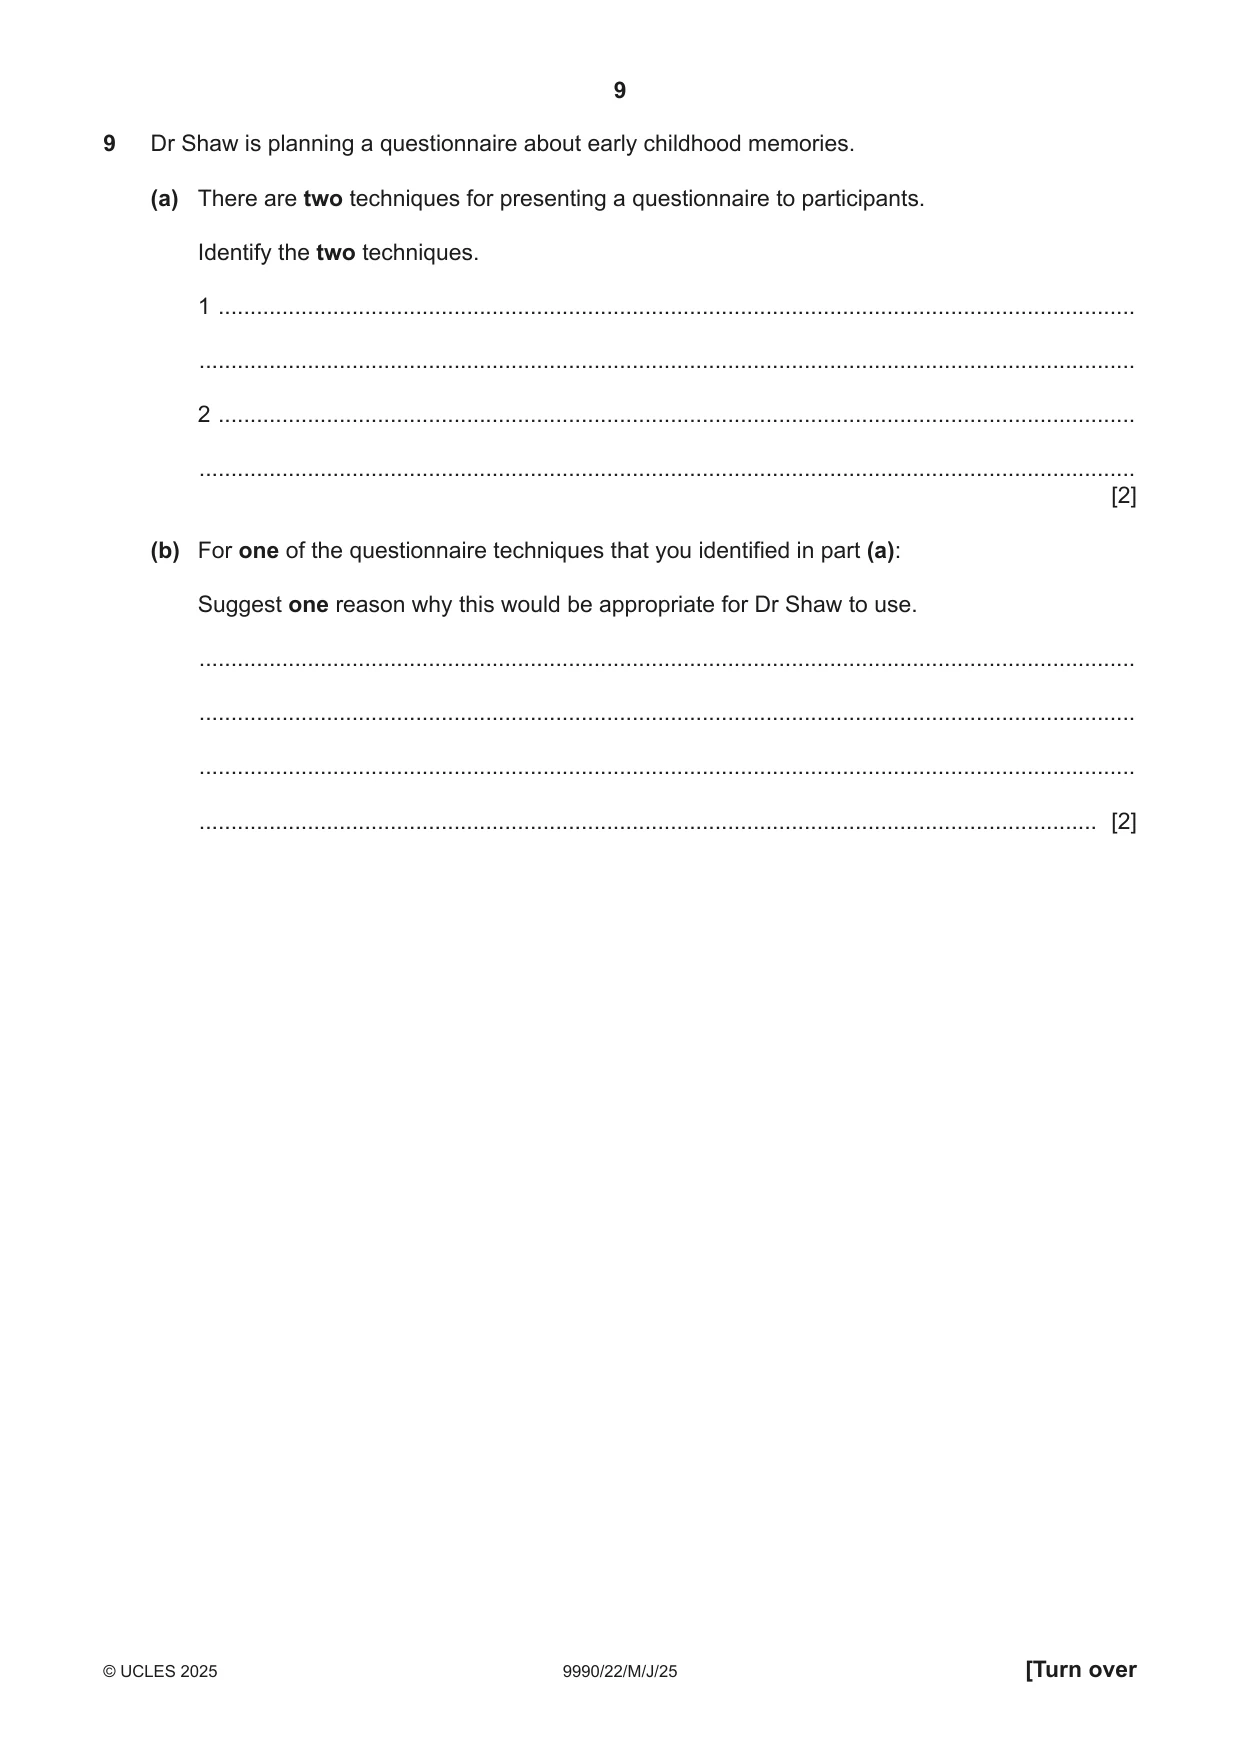
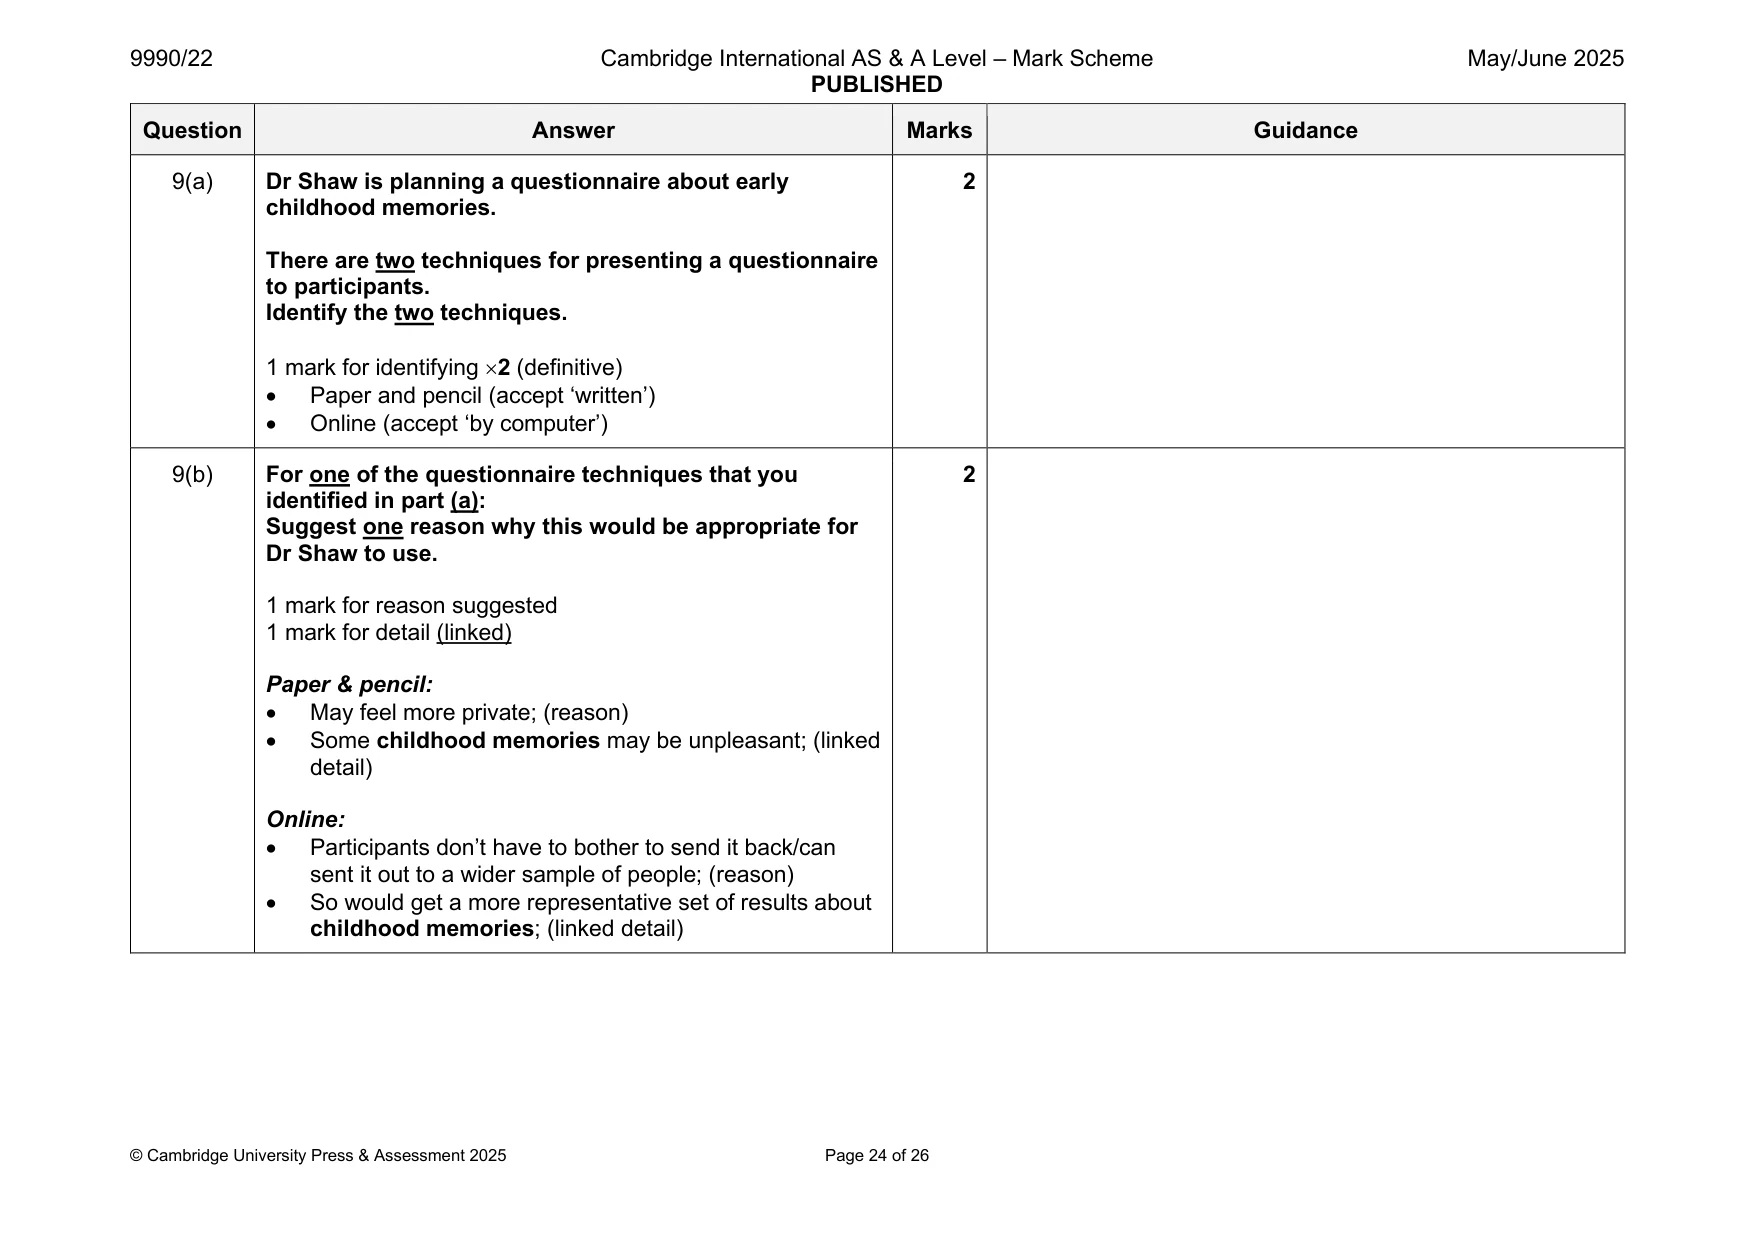
9 Dr Shaw is planning a questionnaire about early childhood memories. (a) There are two techniques for presenting a questionnaire to participants. Identify the two techniques. 1 ................................................................................................................................................ ................................................................................................................................................... 2 ................................................................................................................................................ ................................................................................................................................................... [2] (b) For one of the questionnaire techniques that you identified in part (a): Suggest one reason why this would be appropriate for Dr Shaw to use. ................................................................................................................................................... ................................................................................................................................................... ................................................................................................................................................... ............................................................................................................................................. [2]
Mark scheme: 9(a) Dr Shaw is planning a questionnaire about early 2 childhood memories. There are two techniques for presenting a questionnaire to participants. Identify the two techniques. 1 mark for identifying 2 (definitive) • Paper and pencil (accept ‘written’) • Online (accept ‘by computer’) 9(b) For one of the questionnaire techniques that you 2 identified in part (a): Suggest one reason why this would be appropriate for Dr Shaw to use. 1 mark for reason suggested 1 mark for detail (linked) Paper & pencil: • May feel more private; (reason) • Some childhood memories may be unpleasant; (linked detail) Online: • Participants don’t have to bother to send it back/can sent it out to a wider sample of people; (reason) • So would get a more representative set of results about childhood memories; (linked detail)
Q10 · Dr Brent works in a busy hospital
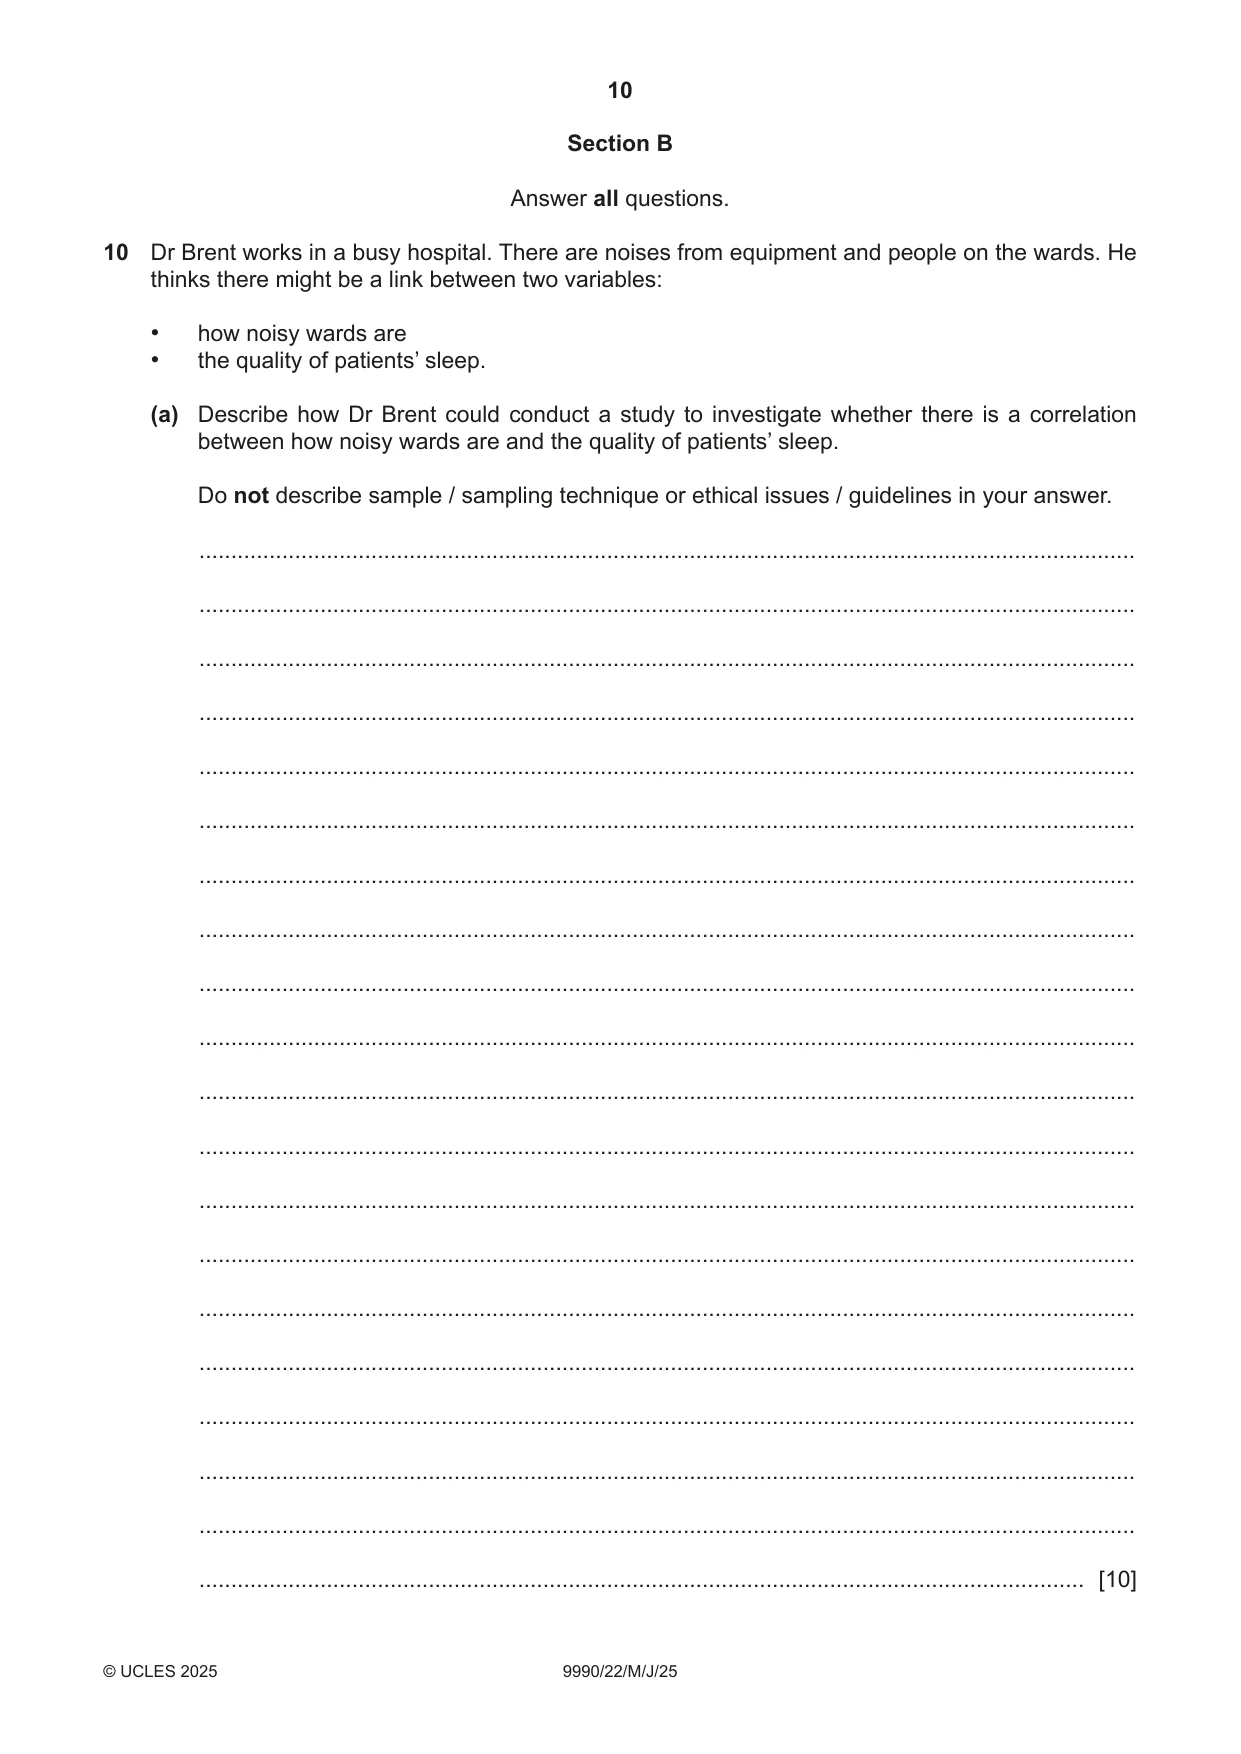
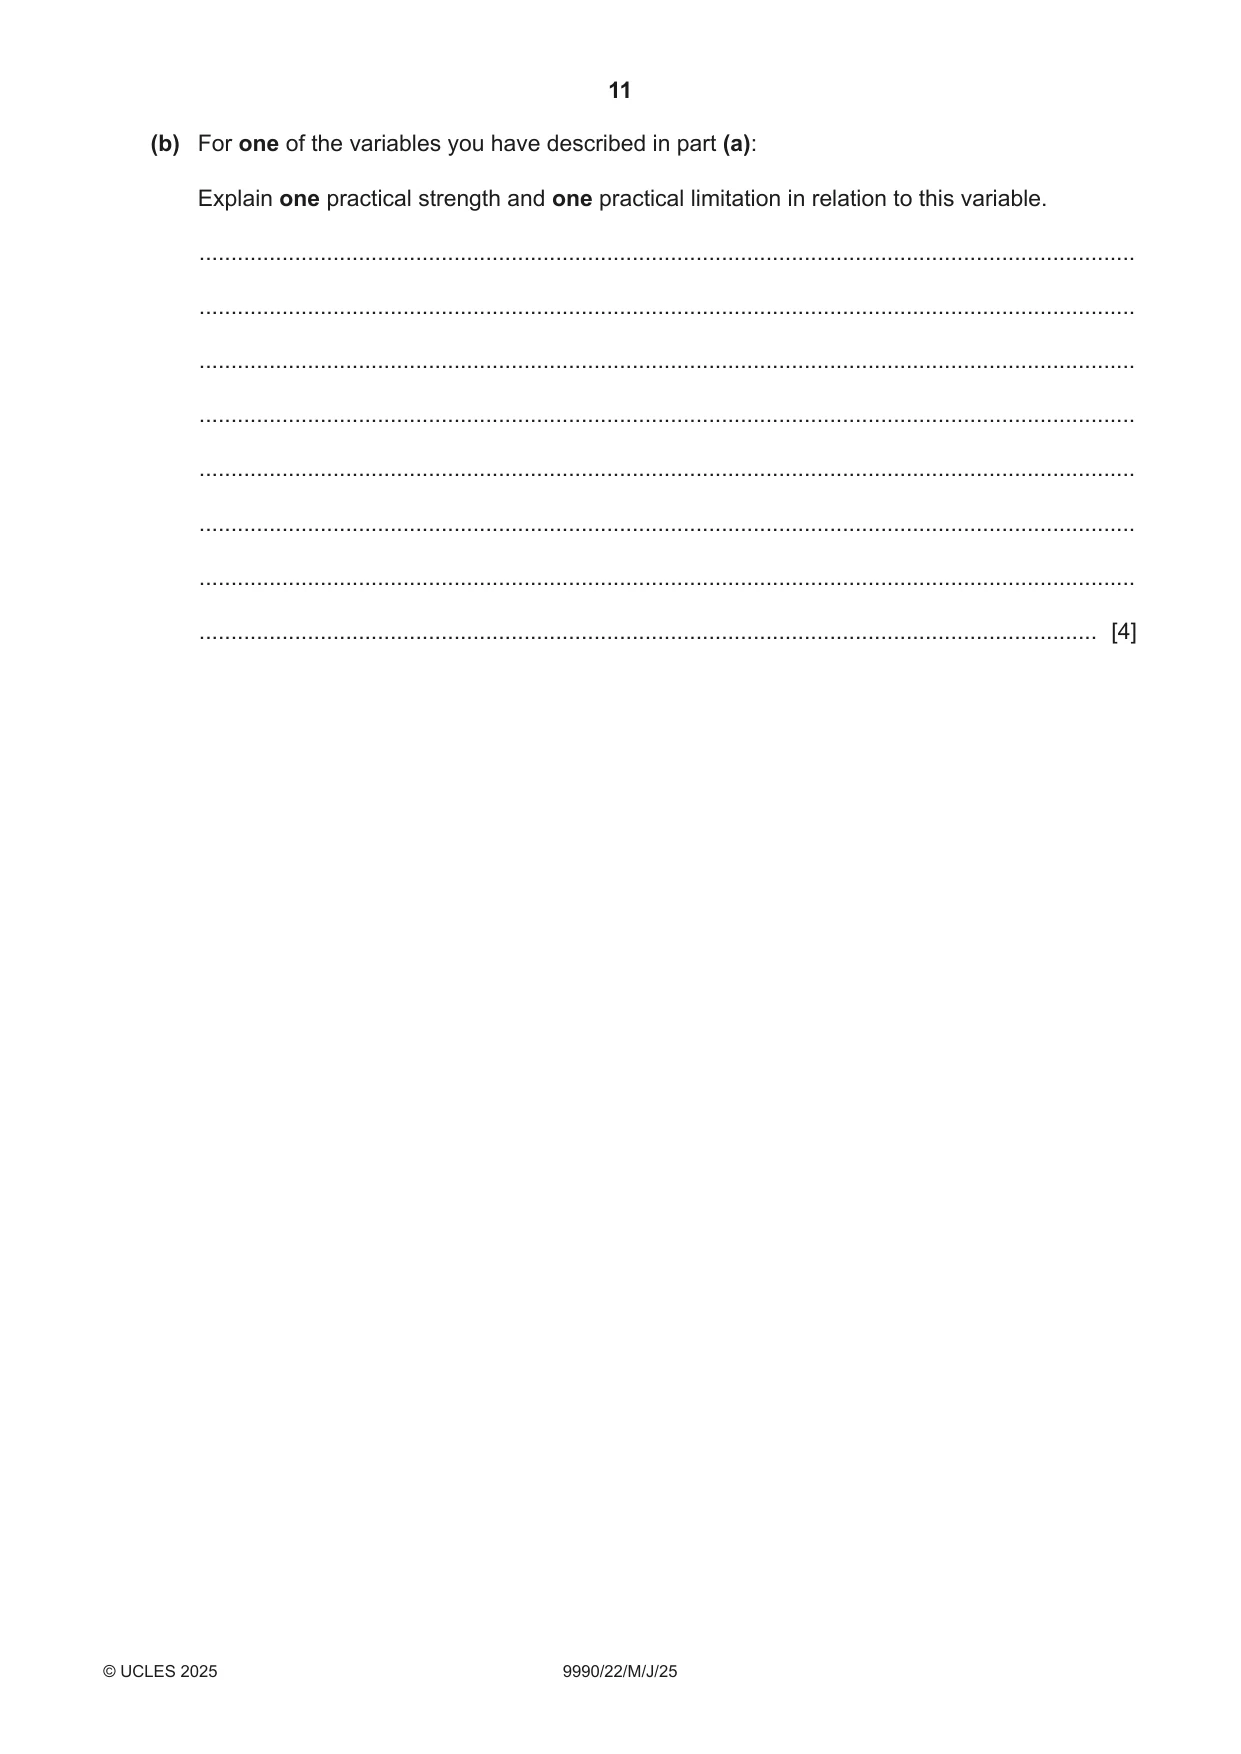
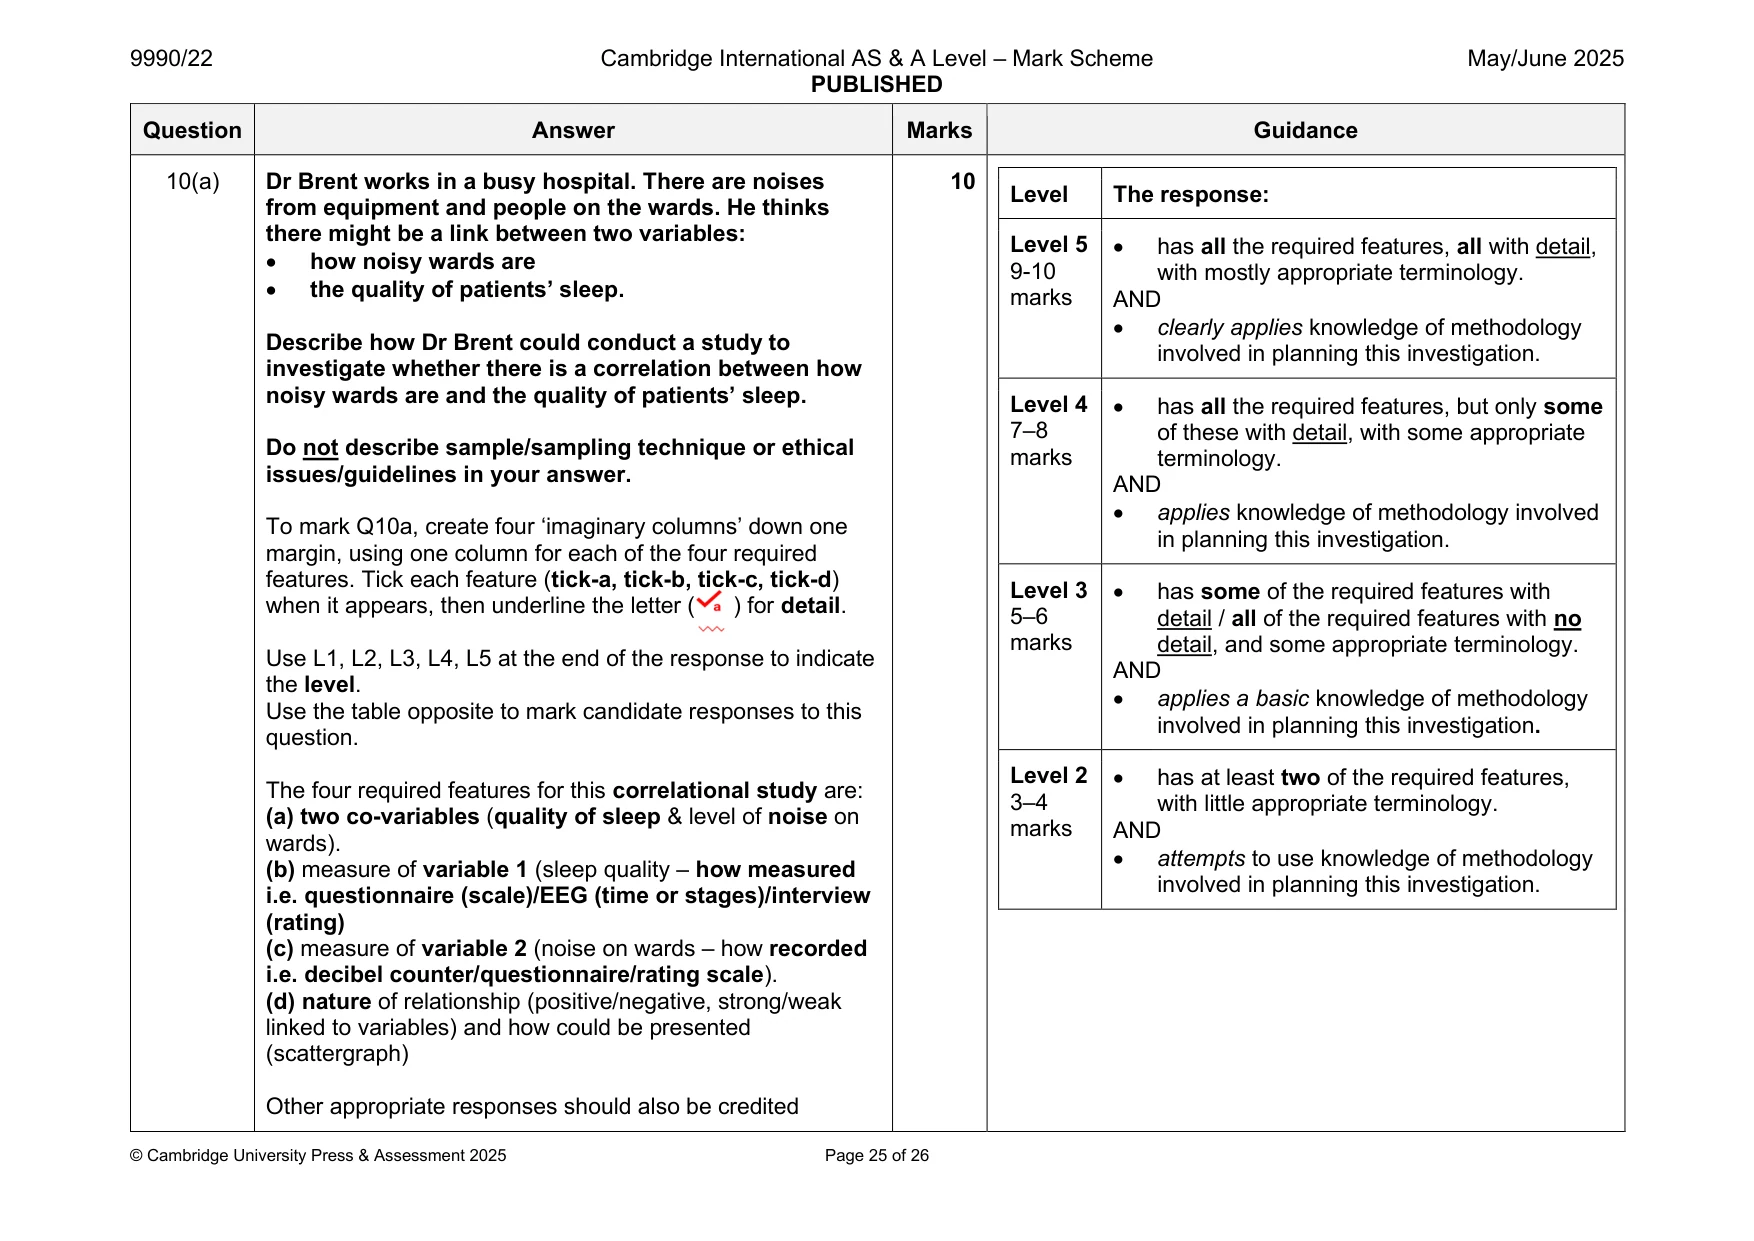
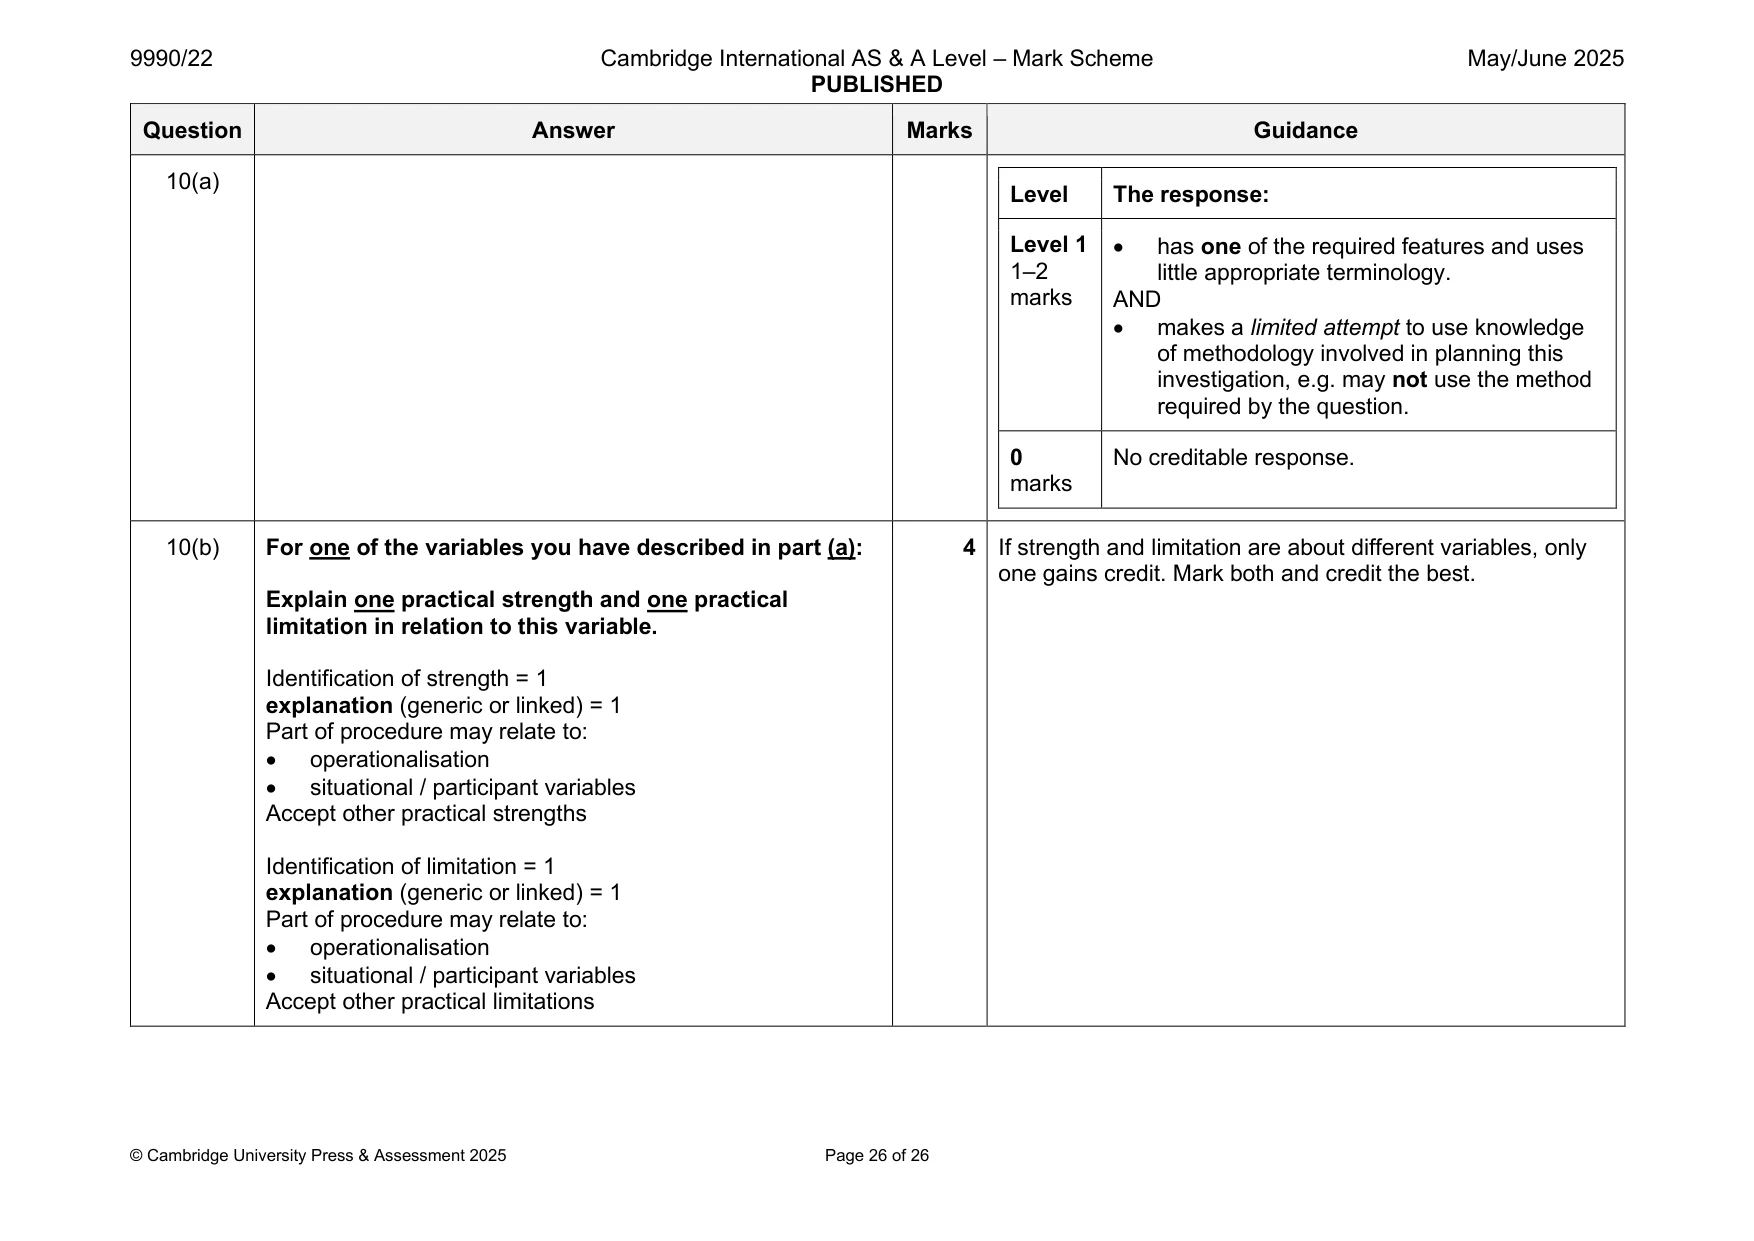
10 Dr Brent works in a busy hospital. There are noises from equipment and people on the wards. He thinks there might be a link between two variables: • how noisy wards are • the quality of patients’ sleep. (a) Describe how Dr Brent could conduct a study to investigate whether there is a correlation between how noisy wards are and the quality of patients’ sleep. Do not describe sample / sampling technique or ethical issues / guidelines in your answer. ................................................................................................................................................... ................................................................................................................................................... ................................................................................................................................................... ................................................................................................................................................... ................................................................................................................................................... ................................................................................................................................................... ................................................................................................................................................... ................................................................................................................................................... ................................................................................................................................................... ................................................................................................................................................... ................................................................................................................................................... ................................................................................................................................................... ................................................................................................................................................... ................................................................................................................................................... ................................................................................................................................................... ................................................................................................................................................... ................................................................................................................................................... ................................................................................................................................................... ................................................................................................................................................... ........................................................................................................................................... [10] (b) For one of the variables you have described in part (a): Explain one practical strength and one practical limitation in relation to this variable. ................................................................................................................................................... ................................................................................................................................................... ................................................................................................................................................... ................................................................................................................................................... ................................................................................................................................................... ................................................................................................................................................... ................................................................................................................................................... ............................................................................................................................................. [4]
Mark scheme: 10(a) Dr Brent works in a busy hospital. There are noises 10 Level The response: from equipment and people on the wards. He thinks there might be a link between two variables: Level 5 • has all the required features, all with detail, • how noisy wards are 9-10 with mostly appropriate terminology. • the quality of patients’ sleep. marks AND • clearly applies knowledge of methodology Describe how Dr Brent could conduct a study to involved in planning this investigation. investigate whether there is a correlation between how noisy wards are and the quality of patients’ sleep. Level 4 • has all the required features, but only some 7–8 of these with detail, with some appropriate Do not describe sample/sampling technique or ethical marks terminology. issues/guidelines in your answer. AND • applies knowledge of methodology involved To mark Q10a, create four ‘imaginary columns’ down one in planning this investigation. margin, using one column for each of the four required features. Tick each feature (tick-a, tick-b, tick-c, tick-d) Level 3 • has some of the required features with when it appears, then underline the letter ( ) for detail. 5–6 detail / all of the required features with no marks detail, and some appropriate terminology. Use L1, L2, L3, L4, L5 at the end of the response to indicate AND the level. • applies a basic knowledge of methodology Use the table opposite to mark candidate responses to this involved in planning this investigation. question. Level 2 • has at least two of the required features, The four required features for this correlational study are: 3–4 with little appropriate terminology. (a) two co-variables (quality of sleep & level of noise on marks AND wards). • attempts to use knowledge of methodology (b) measure of variable 1 (sleep quality – how measured involved in planning this investigation. i.e. questionnaire (scale)/EEG (time or stages)/interview (rating) (c) measure of variable 2 (noise on wards – how recorded i.e. decibel counter/questionnaire/rating scale). (d) nature of relationship (positive/negative, strong/weak linked to variables) and how could be presented (scattergraph) Other appropriate responses should also be credited 10(a) Level The response: Level 1 • has one of the required features and uses 1–2 little appropriate terminology. marks AND • makes a limited attempt to use knowledge of methodology involved in planning this investigation, e.g. may not use the method required by the question. 0 No creditable response. marks 10(b) For one of the variables you have described in part (a): 4 If strength and limitation are about different variables, only one gains credit. Mark both and credit the best. Explain one practical strength and one practical limitation in relation to this variable. Identification of strength = 1 explanation (generic or linked) = 1 Part of procedure may relate to: • operationalisation • situational / participant variables Accept other practical strengths Identification of limitation = 1 explanation (generic or linked) = 1 Part of procedure may relate to: • operationalisation • situational / participant variables Accept other practical limitations
What was in this paper
The subtopics covered by these 10 questions, and how many questions each got. Open one in a new tab to see every Cambridge question on it.
What you needed in this session
Cambridge’s own grade thresholds for 2025 May/June, Paper 2 · Variant 2. A higher threshold means an easier paper — the bar moves with how the cohort did.