Cambridge A Level Psychology (from 2018) 9990 — 2023 Oct/Nov Paper 2 · Variant 3
9990/23/O/N/23 · 10 questions · 60 marks · ≈68 min
The question paper and its mark scheme, free to read here and free to download. This is Cambridge’s own paper, exactly as it was sat.
Question paper12 pages
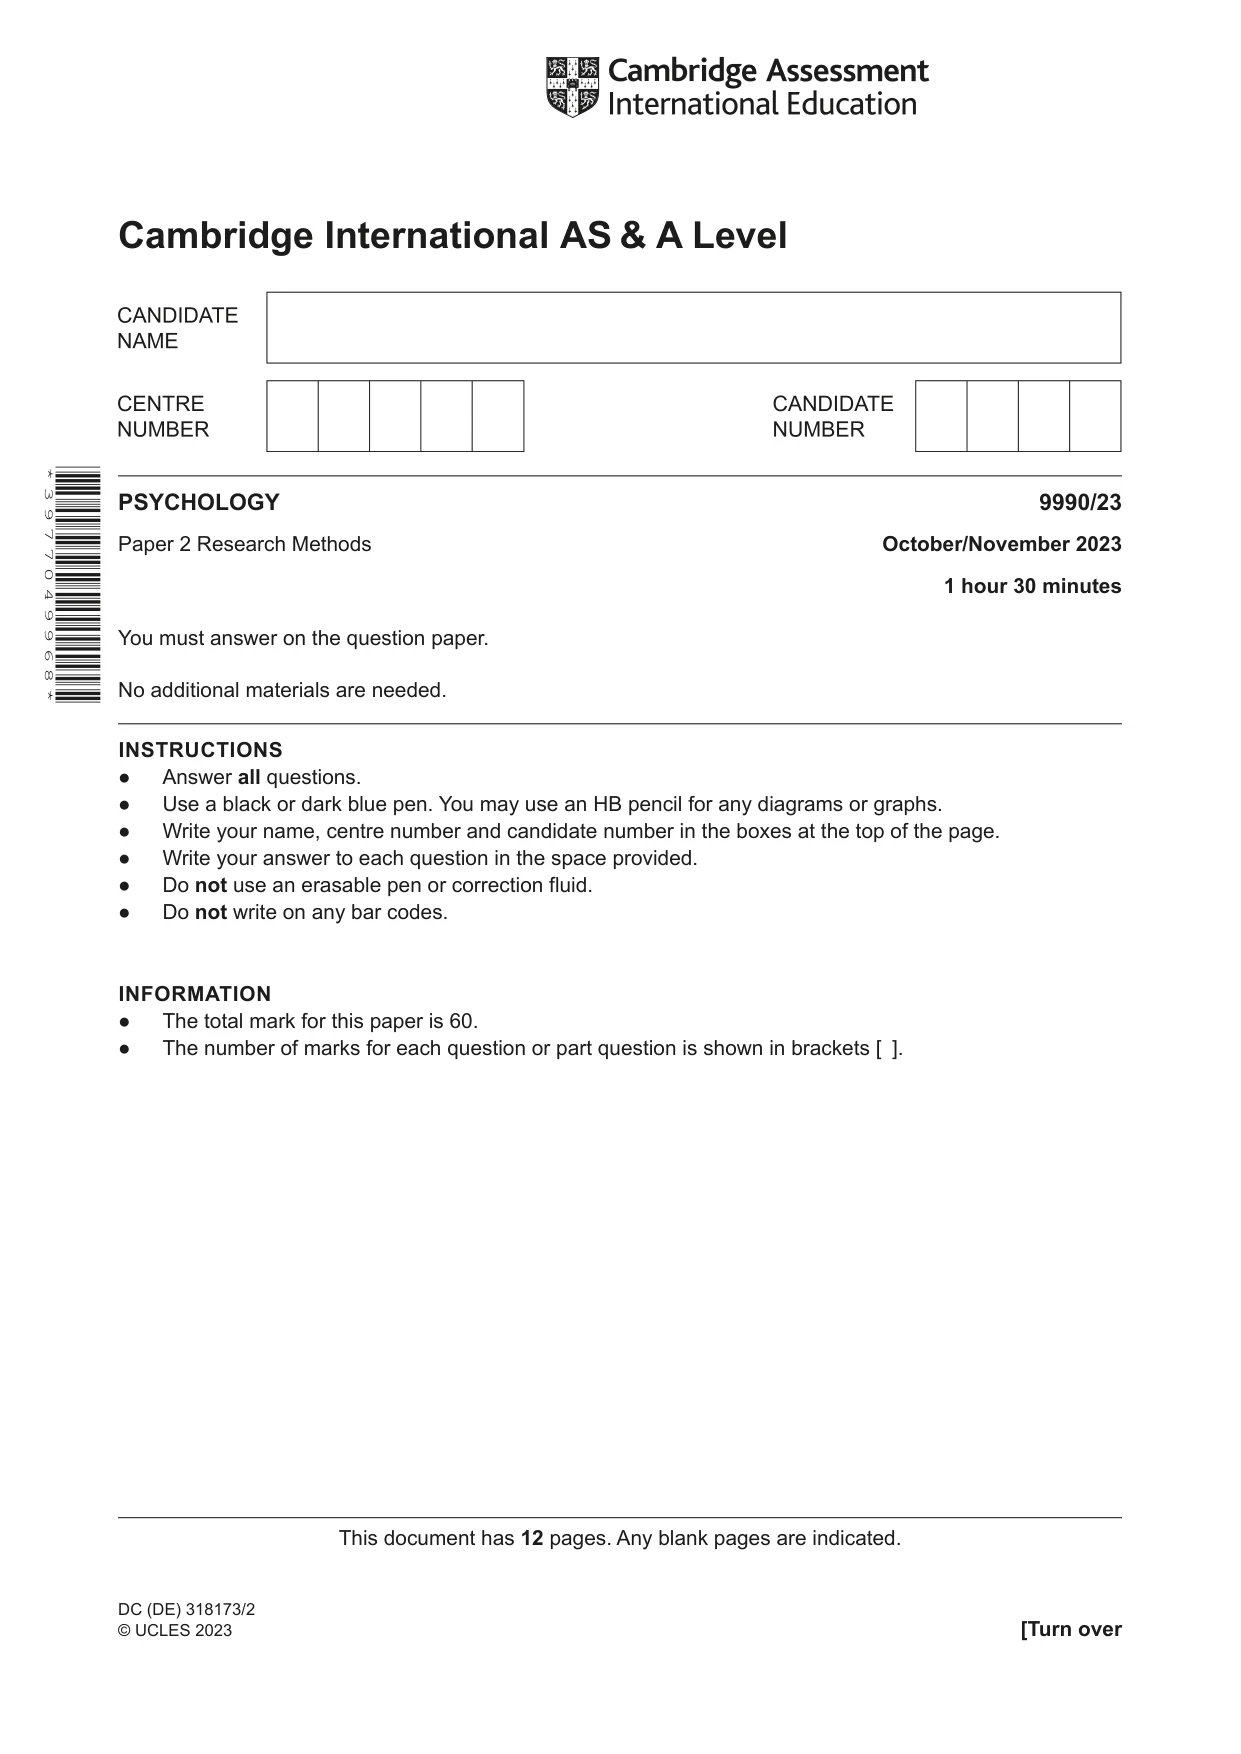



Mark scheme17 pages
Answers below. Sit the paper first if you are practising.
Questions as text
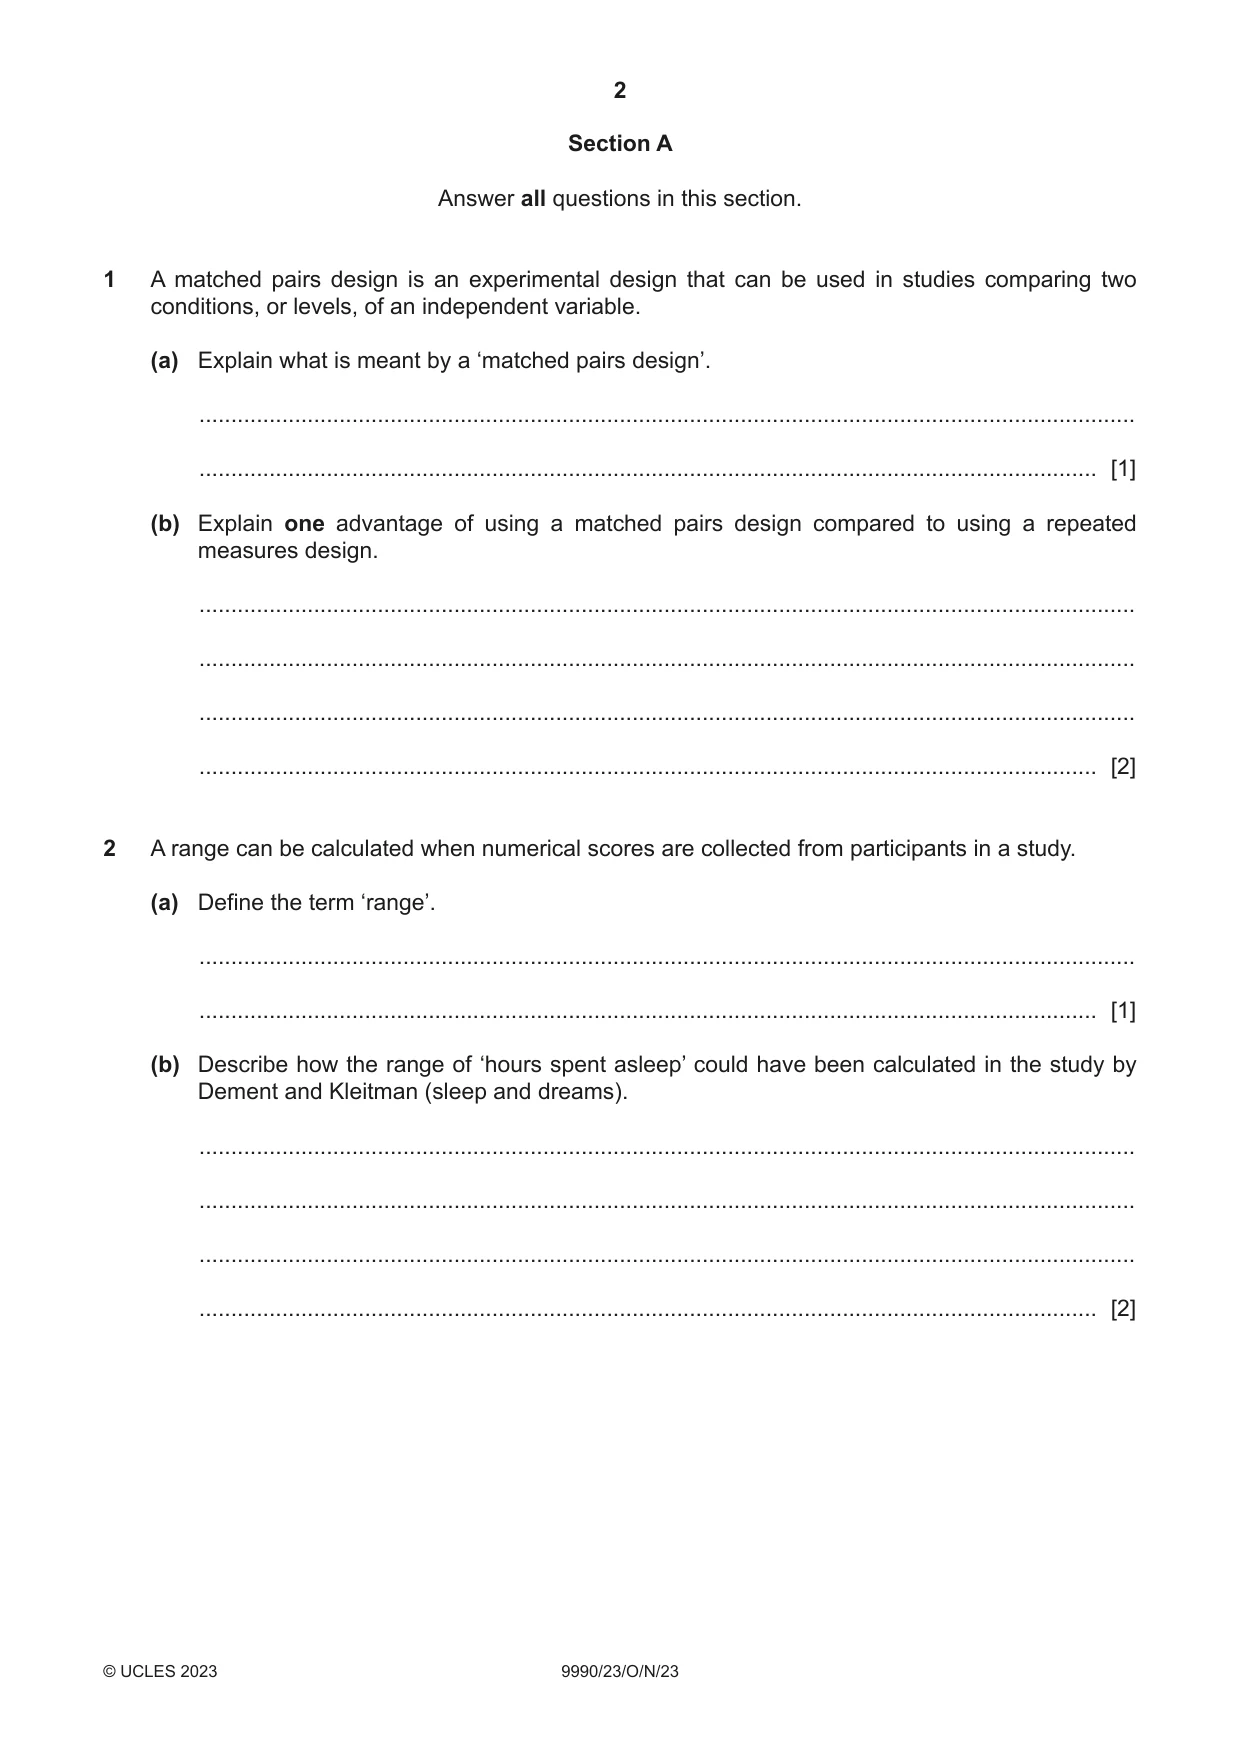
Q1 · A matched pairs design is an experimental design that can be used in studies comparing…
1 A matched pairs design is an experimental design that can be used in studies comparing two conditions, or levels, of an independent variable. (a) Explain what is meant by a ‘matched pairs design’. ................................................................................................................................................... ............................................................................................................................................. [1] (b) Explain one advantage of using a matched pairs design compared to using a repeated measures design. ................................................................................................................................................... ................................................................................................................................................... ................................................................................................................................................... ............................................................................................................................................. [2]
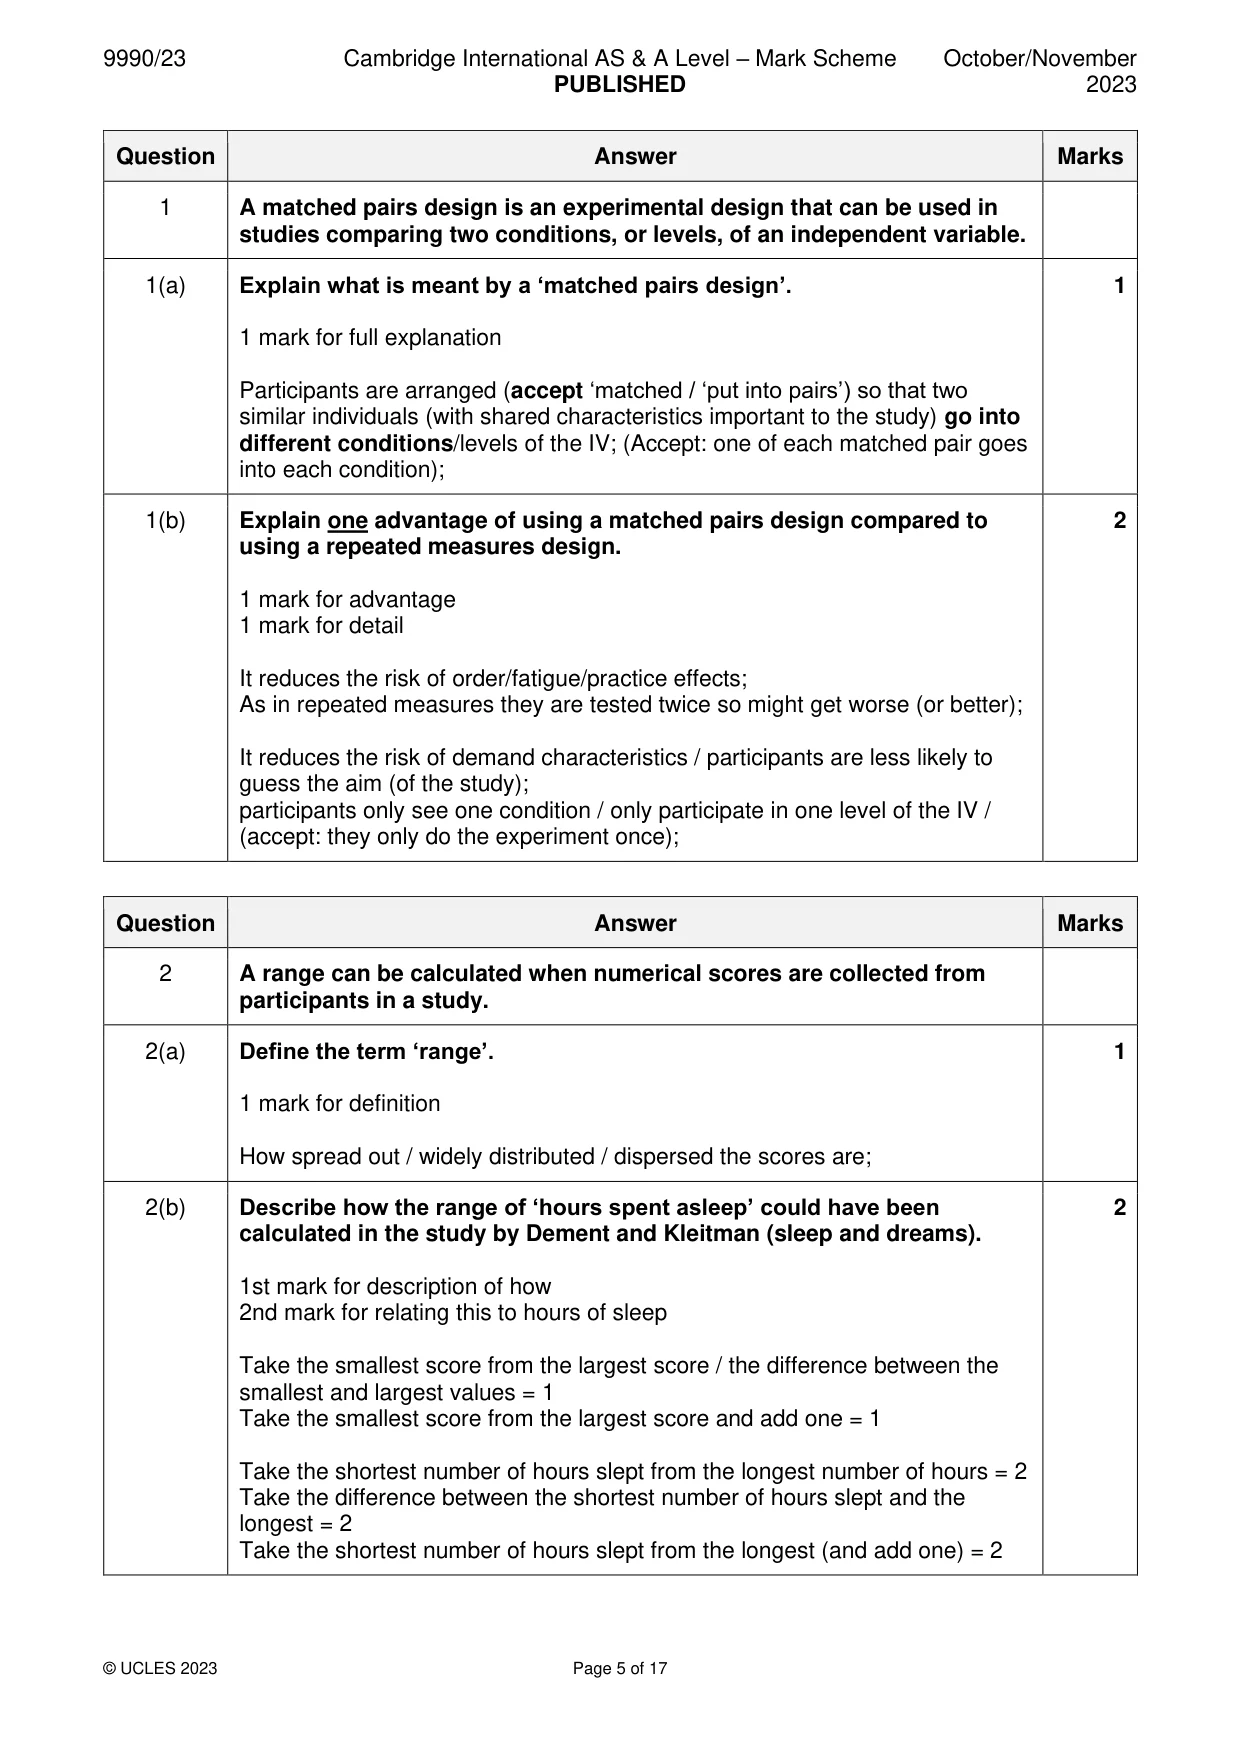
Mark scheme: Question Answer Marks 1 A matched pairs design is an experimental design that can be used in studies comparing two conditions, or levels, of an independent variable. 1(a) Explain what is meant by a ‘matched pairs design’. 1 1 mark for full explanation Participants are arranged (accept ‘matched / ‘put into pairs’) so that two similar individuals (with shared characteristics important to the study) go into different conditions/levels of the IV; (Accept: one of each matched pair goes into each condition); 1(b) Explain one advantage of using a matched pairs design compared to 2 using a repeated measures design. 1 mark for advantage 1 mark for detail It reduces the risk of order/fatigue/practice effects; As in repeated measures they are tested twice so might get worse (or better); It reduces the risk of demand characteristics / participants are less likely to guess the aim (of the study); participants only see one condition / only participate in one level of the IV / (accept: they only do the experiment once);
Q2 · A range can be calculated when numerical scores are collected from participants in a study
2 A range can be calculated when numerical scores are collected from participants in a study. (a) Define the term ‘range’. ................................................................................................................................................... ............................................................................................................................................. [1] (b) Describe how the range of ‘hours spent asleep’ could have been calculated in the study by Dement and Kleitman (sleep and dreams). ................................................................................................................................................... ................................................................................................................................................... ................................................................................................................................................... ............................................................................................................................................. [2]
Mark scheme: 2 A range can be calculated when numerical scores are collected from participants in a study. 2(a) Define the term ‘range’. 1 1 mark for definition How spread out / widely distributed / dispersed the scores are; 2(b) Describe how the range of ‘hours spent asleep’ could have been 2 calculated in the study by Dement and Kleitman (sleep and dreams). 1st mark for description of how 2nd mark for relating this to hours of sleep Take the smallest score from the largest score / the difference between the smallest and largest values = 1 Take the smallest score from the largest score and add one = 1 Take the shortest number of hours slept from the longest number of hours = 2 Take the difference between the shortest number of hours slept and the longest = 2 Take the shortest number of hours slept from the longest (and add one) = 2
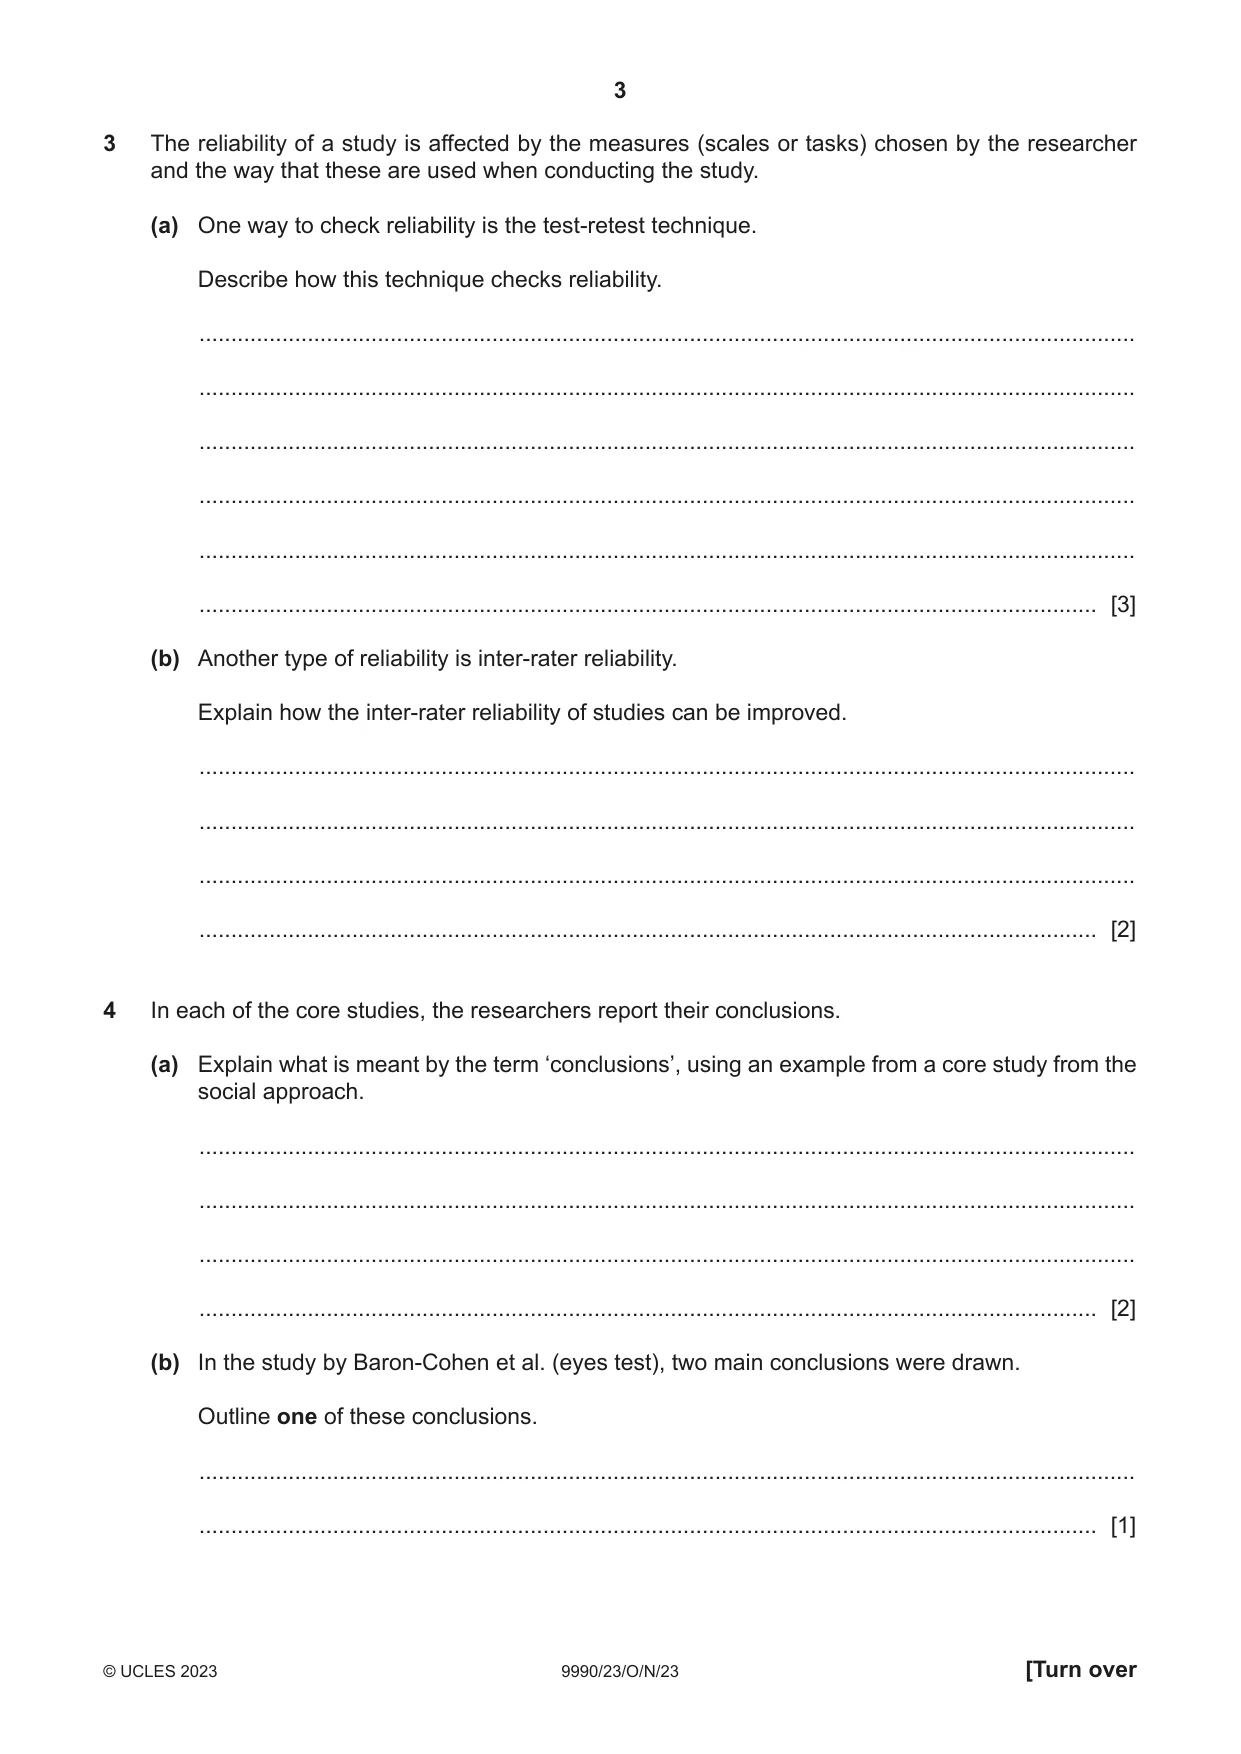
Q3 · The reliability of a study is affected by the measures (scales or tasks) chosen by the…
3 The reliability of a study is affected by the measures (scales or tasks) chosen by the researcher and the way that these are used when conducting the study. (a) One way to check reliability is the test-retest technique. Describe how this technique checks reliability. ................................................................................................................................................... ................................................................................................................................................... ................................................................................................................................................... ................................................................................................................................................... ................................................................................................................................................... ............................................................................................................................................. [3] (b) Another type of reliability is inter-rater reliability. Explain how the inter-rater reliability of studies can be improved. ................................................................................................................................................... ................................................................................................................................................... ................................................................................................................................................... ............................................................................................................................................. [2]
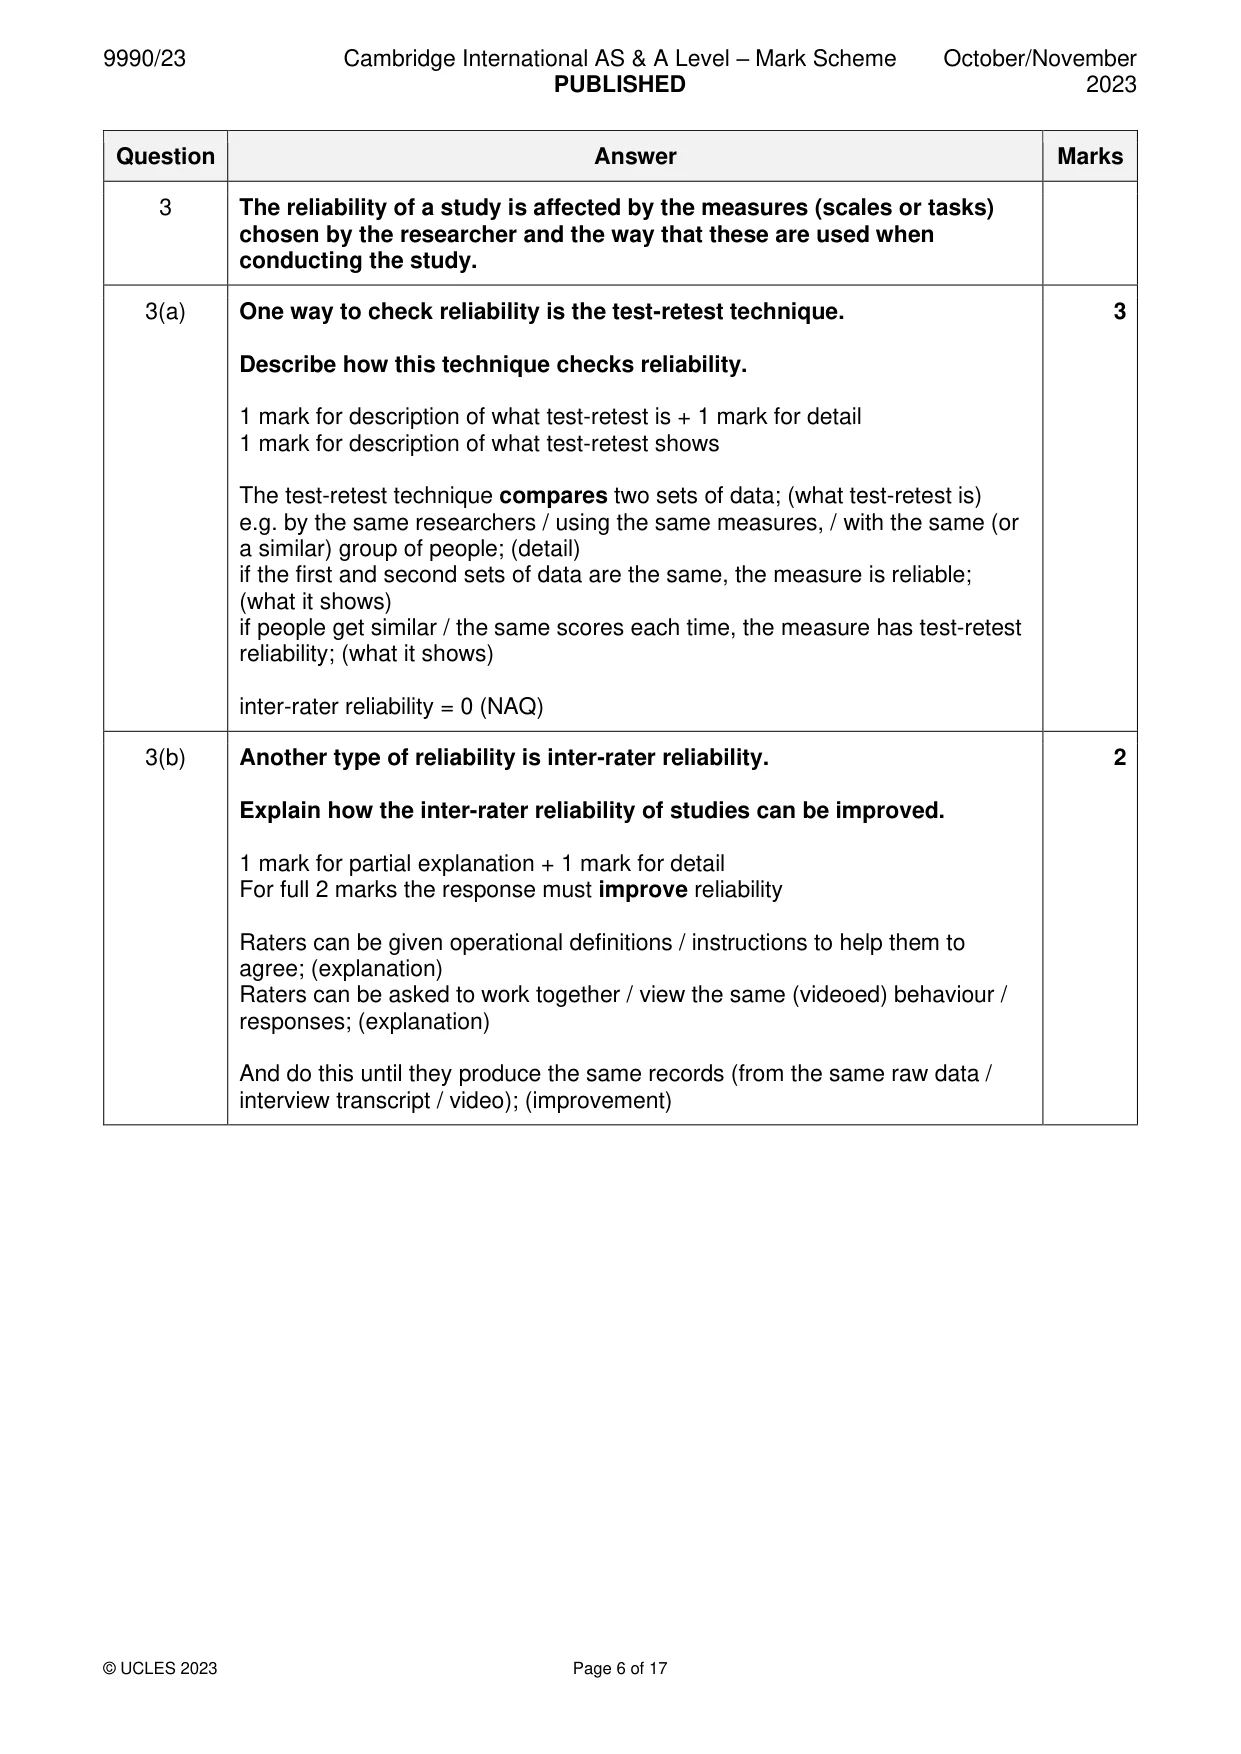
Mark scheme: 3 The reliability of a study is affected by the measures (scales or tasks) chosen by the researcher and the way that these are used when conducting the study. 3(a) One way to check reliability is the test-retest technique. 3 Describe how this technique checks reliability. 1 mark for description of what test-retest is + 1 mark for detail 1 mark for description of what test-retest shows The test-retest technique compares two sets of data; (what test-retest is) e.g. by the same researchers / using the same measures, / with the same (or a similar) group of people; (detail) if the first and second sets of data are the same, the measure is reliable; (what it shows) if people get similar / the same scores each time, the measure has test-retest reliability; (what it shows) inter-rater reliability = 0 (NAQ) 3(b) Another type of reliability is inter-rater reliability. 2 Explain how the inter-rater reliability of studies can be improved. 1 mark for partial explanation + 1 mark for detail For full 2 marks the response must improve reliability Raters can be given operational definitions / instructions to help them to agree; (explanation) Raters can be asked to work together / view the same (videoed) behaviour / responses; (explanation) And do this until they produce the same records (from the same raw data / interview transcript / video); (improvement)
Q4 · In each of the core studies, the researchers report their conclusions
4 In each of the core studies, the researchers report their conclusions. (a) Explain what is meant by the term ‘conclusions’, using an example from a core study from the social approach. ................................................................................................................................................... ................................................................................................................................................... ................................................................................................................................................... ............................................................................................................................................. [2] (b) In the study by Baron-Cohen et al. (eyes test), two main conclusions were drawn. Outline one of these conclusions. ................................................................................................................................................... ............................................................................................................................................. [1]
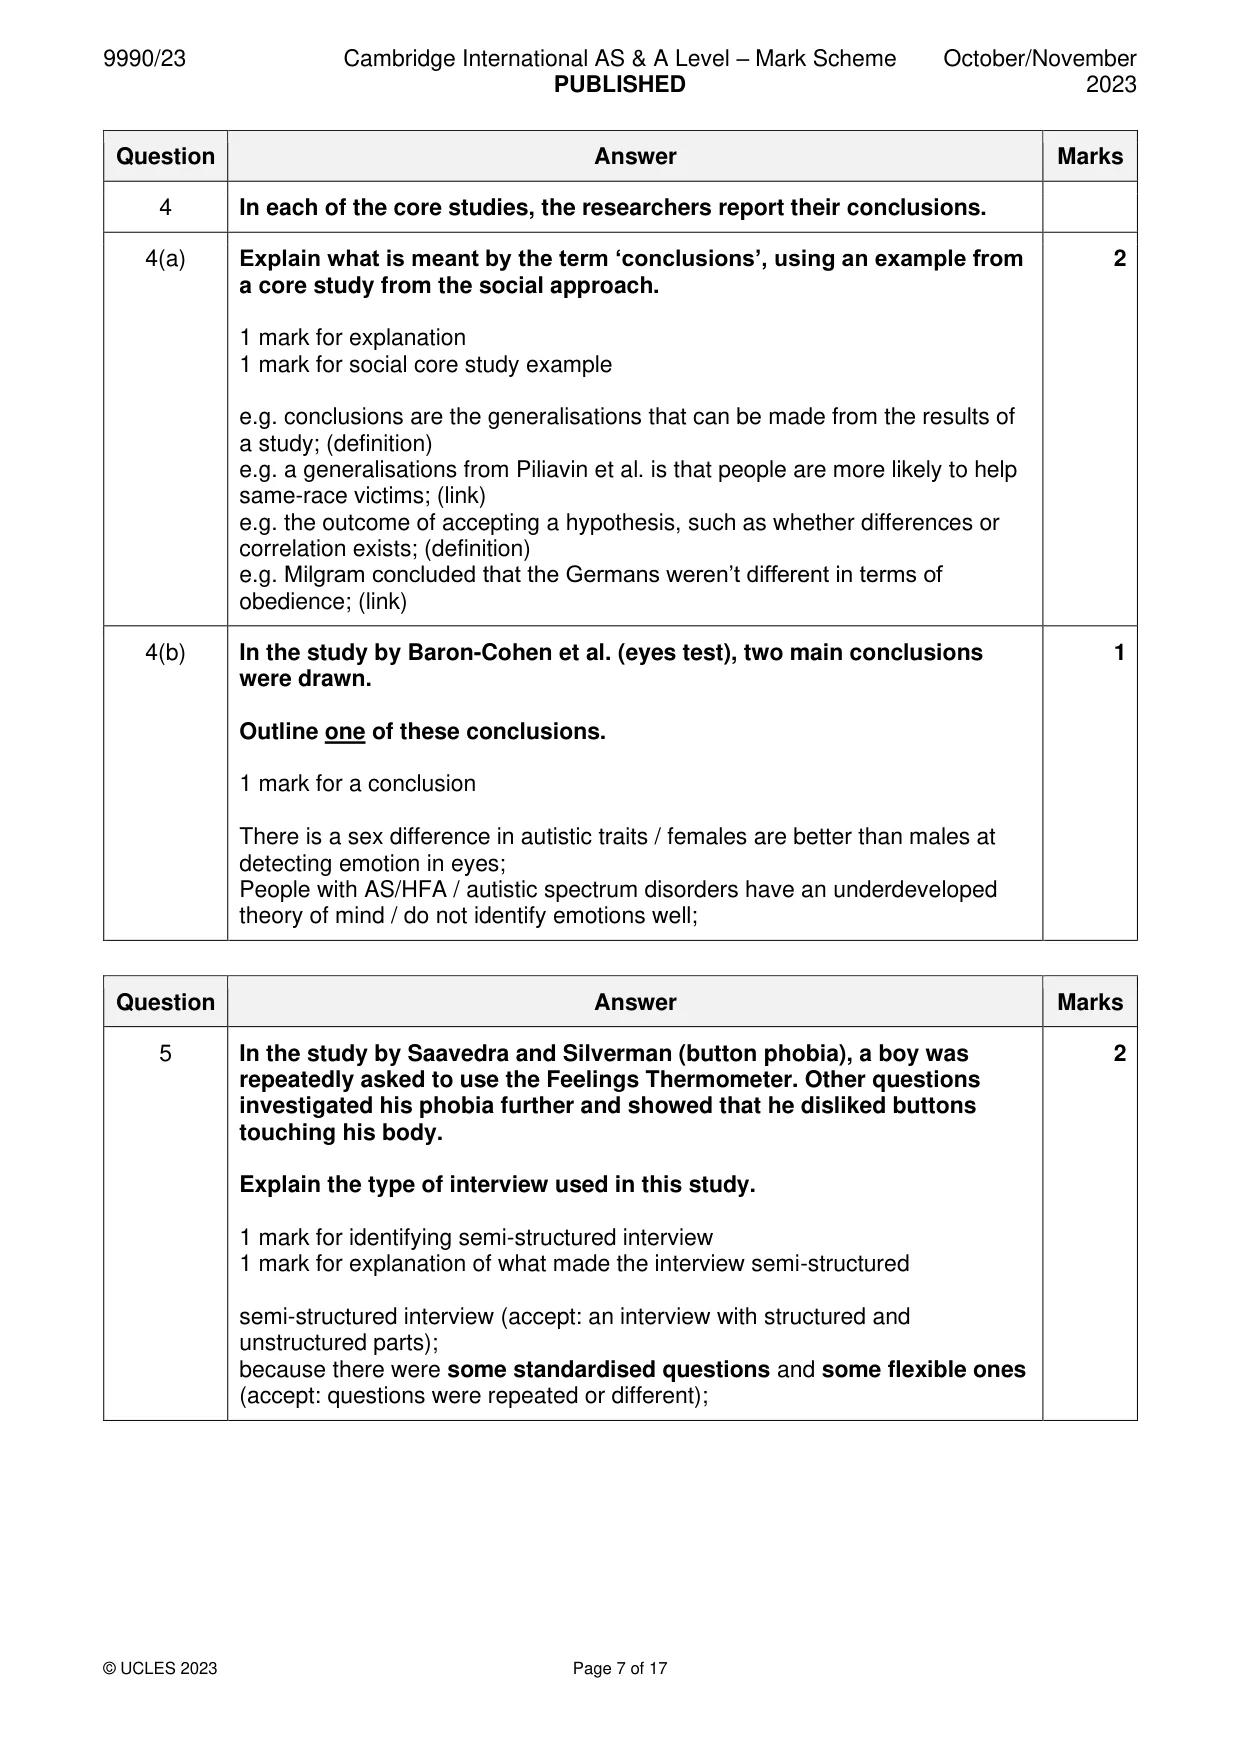
Mark scheme: 4 In each of the core studies, the researchers report their conclusions. 4(a) Explain what is meant by the term ‘conclusions’, using an example from 2 a core study from the social approach. 1 mark for explanation 1 mark for social core study example e.g. conclusions are the generalisations that can be made from the results of a study; (definition) e.g. a generalisations from Piliavin et al. is that people are more likely to help same-race victims; (link) e.g. the outcome of accepting a hypothesis, such as whether differences or correlation exists; (definition) e.g. Milgram concluded that the Germans weren’t different in terms of obedience; (link) 4(b) In the study by Baron-Cohen et al. (eyes test), two main conclusions 1 were drawn. Outline one of these conclusions. 1 mark for a conclusion There is a sex difference in autistic traits / females are better than males at detecting emotion in eyes; People with AS/HFA / autistic spectrum disorders have an underdeveloped theory of mind / do not identify emotions well;
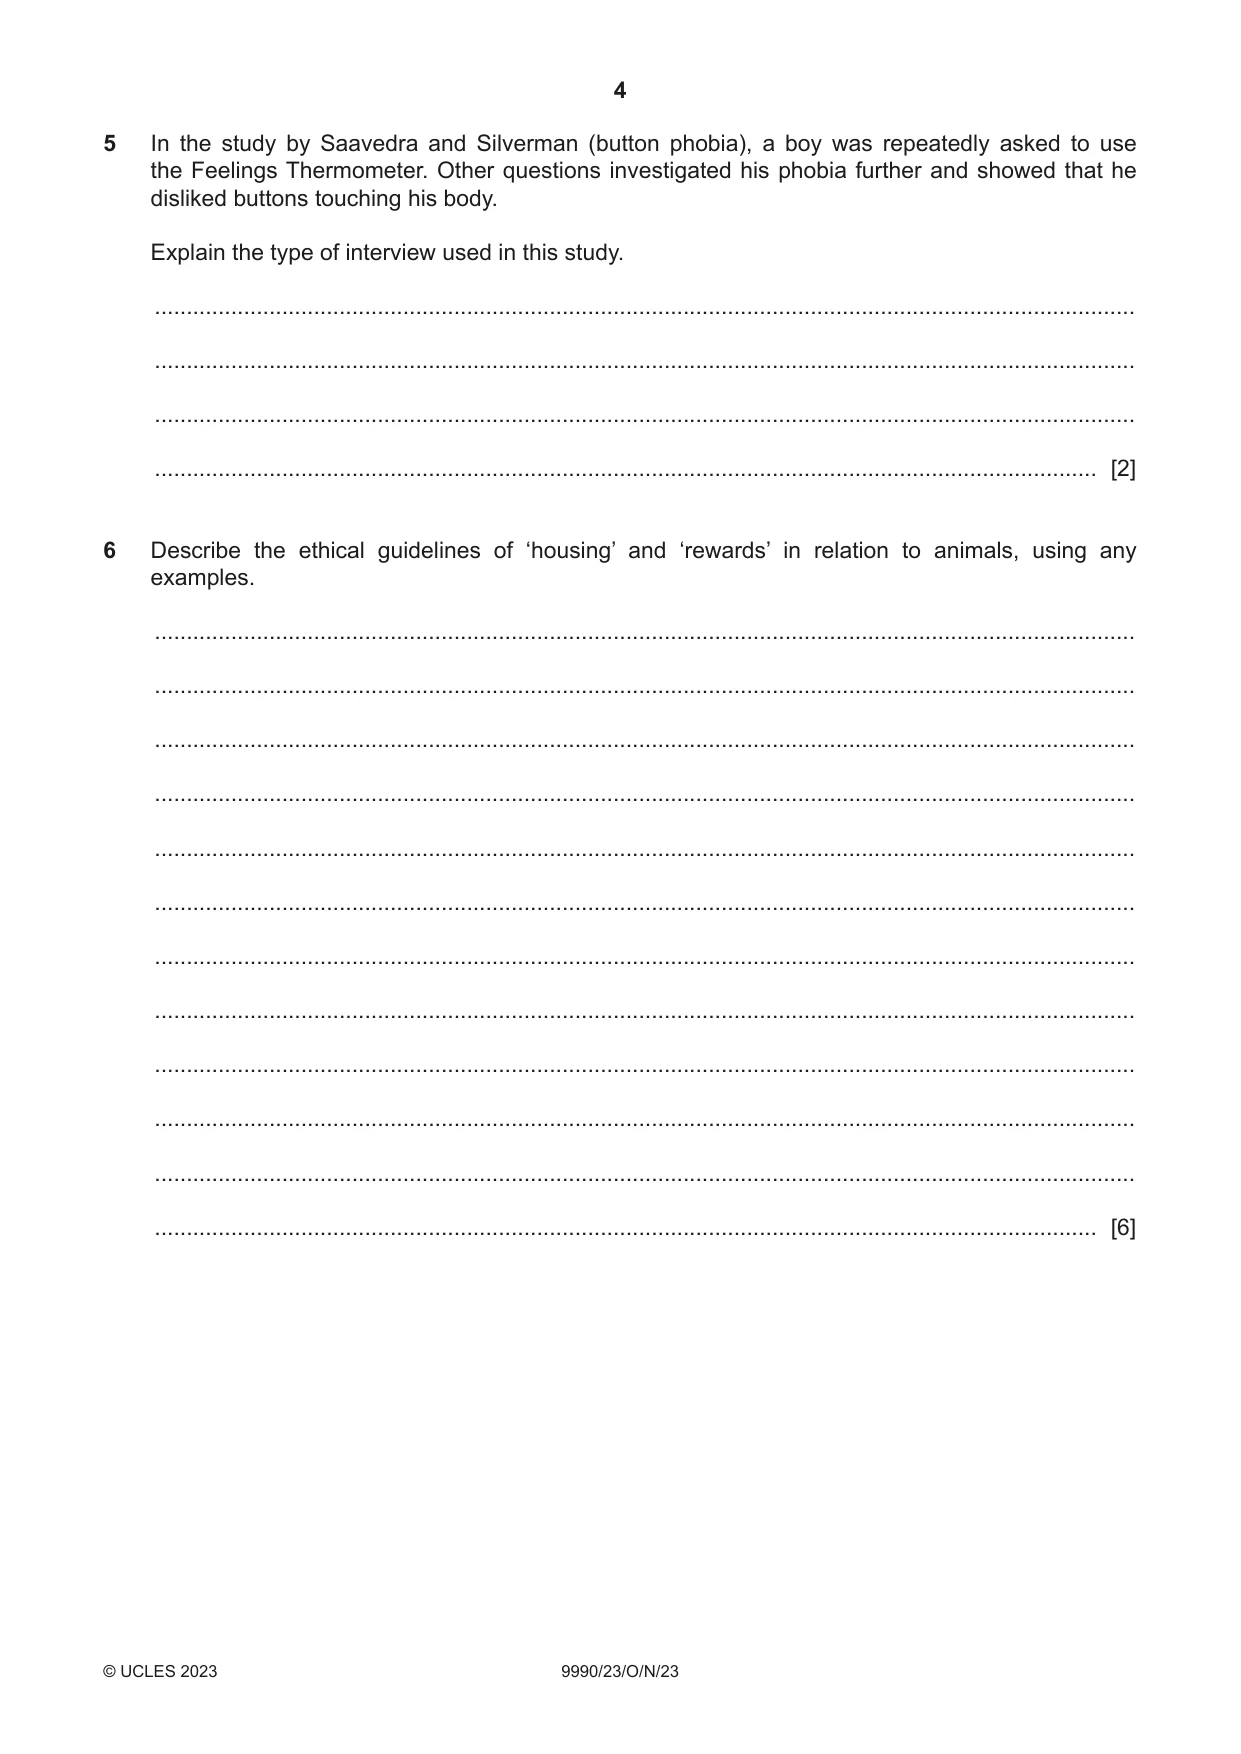
Q5 · In the study by Saavedra and Silverman (button phobia), a boy was repeatedly asked to use…
5 In the study by Saavedra and Silverman (button phobia), a boy was repeatedly asked to use the Feelings Thermometer. Other questions investigated his phobia further and showed that he disliked buttons touching his body. Explain the type of interview used in this study. .......................................................................................................................................................... .......................................................................................................................................................... .......................................................................................................................................................... .................................................................................................................................................... [2]
Mark scheme: 5 In the study by Saavedra and Silverman (button phobia), a boy was 2 repeatedly asked to use the Feelings Thermometer. Other questions investigated his phobia further and showed that he disliked buttons touching his body. Explain the type of interview used in this study. 1 mark for identifying semi-structured interview 1 mark for explanation of what made the interview semi-structured semi-structured interview (accept: an interview with structured and unstructured parts); because there were some standardised questions and some flexible ones (accept: questions were repeated or different);
More questions on Anxiety disorders and fear-related disorders
Q6 · Describe the ethical guidelines of ‘housing’ and ‘rewards’ in relation to animals, using…
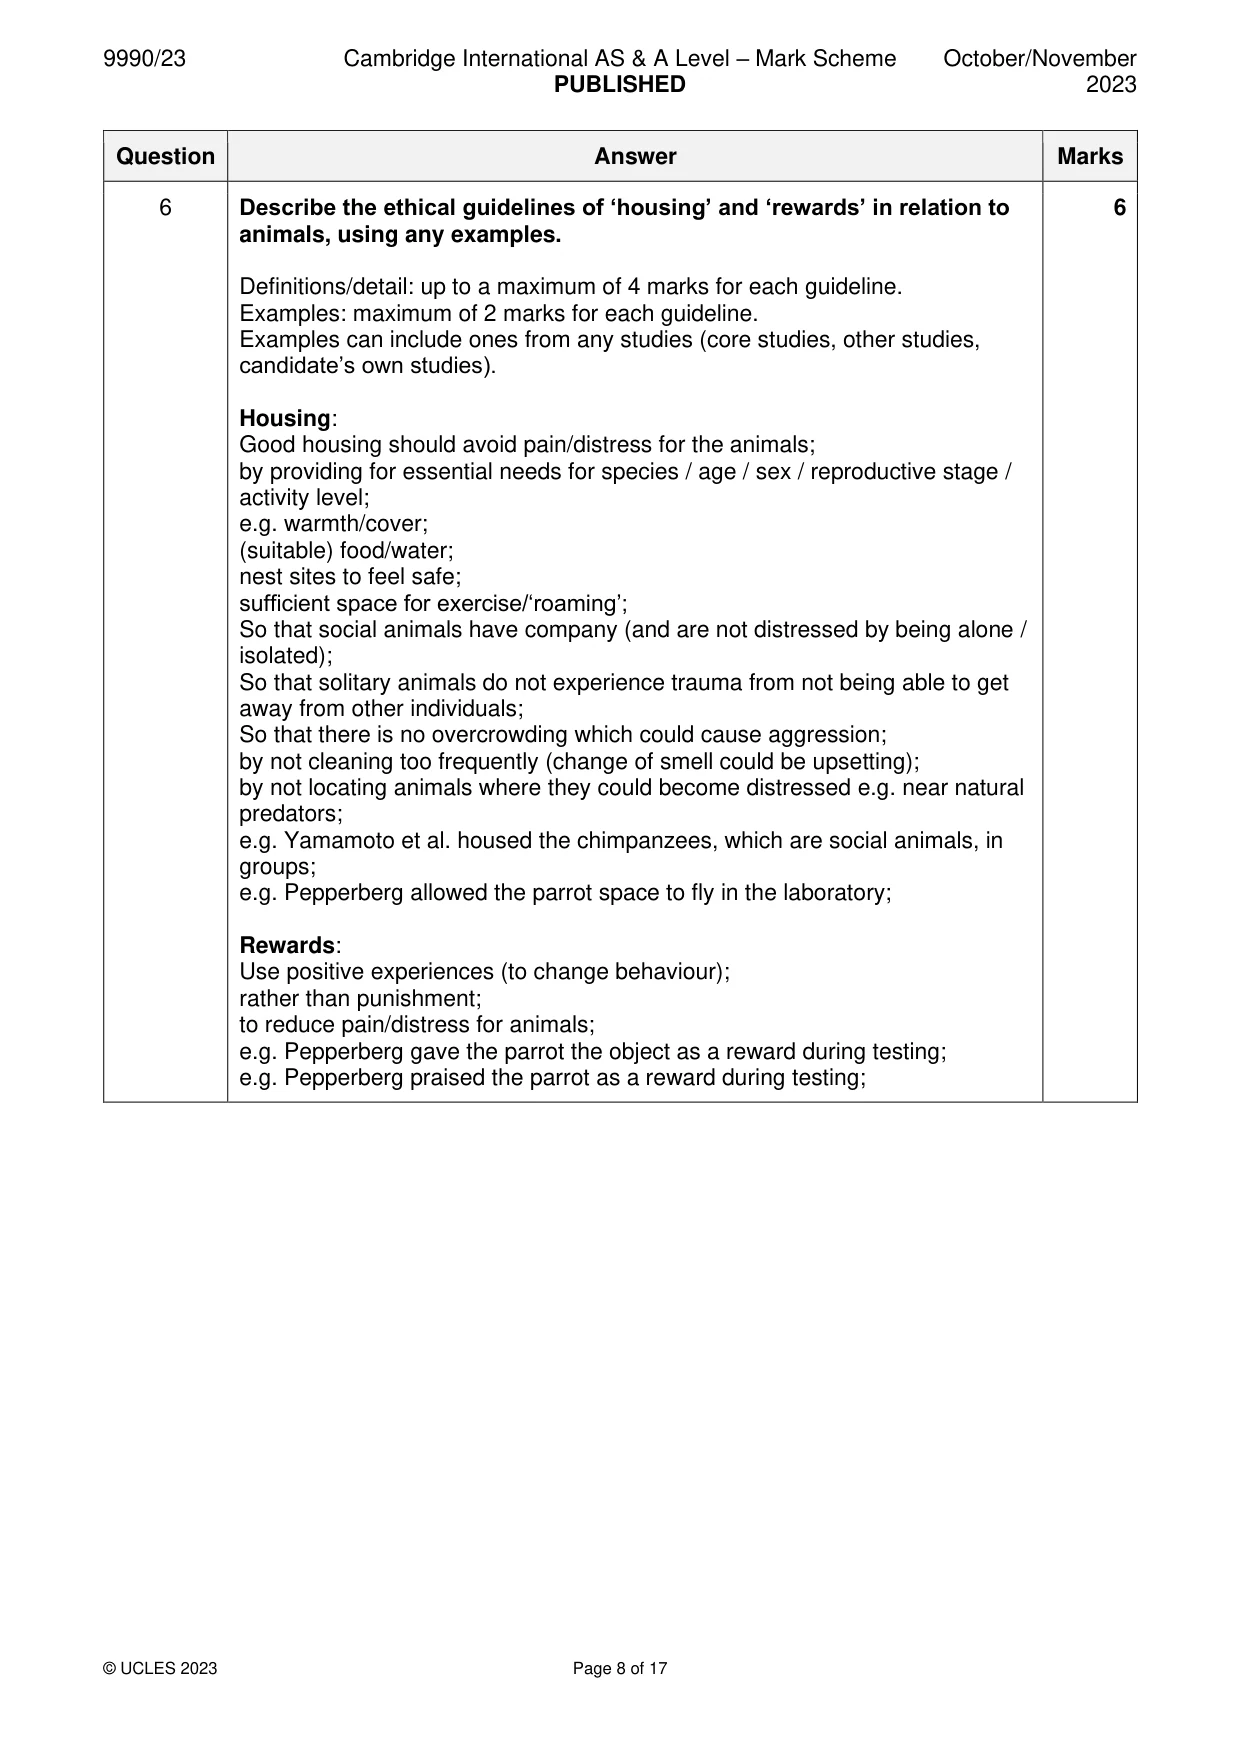
6 Describe the ethical guidelines of ‘housing’ and ‘rewards’ in relation to animals, using any examples. .......................................................................................................................................................... .......................................................................................................................................................... .......................................................................................................................................................... .......................................................................................................................................................... .......................................................................................................................................................... .......................................................................................................................................................... .......................................................................................................................................................... .......................................................................................................................................................... .......................................................................................................................................................... .......................................................................................................................................................... .......................................................................................................................................................... .................................................................................................................................................... [6] Question 7 appears on Page 6.
Mark scheme: 6 Describe the ethical guidelines of ‘housing’ and ‘rewards’ in relation to 6 animals, using any examples. Definitions/detail: up to a maximum of 4 marks for each guideline. Examples: maximum of 2 marks for each guideline. Examples can include ones from any studies (core studies, other studies, candidate’s own studies). Housing: Good housing should avoid pain/distress for the animals; by providing for essential needs for species / age / sex / reproductive stage / activity level; e.g. warmth/cover; (suitable) food/water; nest sites to feel safe; sufficient space for exercise/‘roaming’; So that social animals have company (and are not distressed by being alone / isolated); So that solitary animals do not experience trauma from not being able to get away from other individuals; So that there is no overcrowding which could cause aggression; by not cleaning too frequently (change of smell could be upsetting); by not locating animals where they could become distressed e.g. near natural predators; e.g. Yamamoto et al. housed the chimpanzees, which are social animals, in groups; e.g. Pepperberg allowed the parrot space to fly in the laboratory; Rewards: Use positive experiences (to change behaviour); rather than punishment; to reduce pain/distress for animals; e.g. Pepperberg gave the parrot the object as a reward during testing; e.g. Pepperberg praised the parrot as a reward during testing;
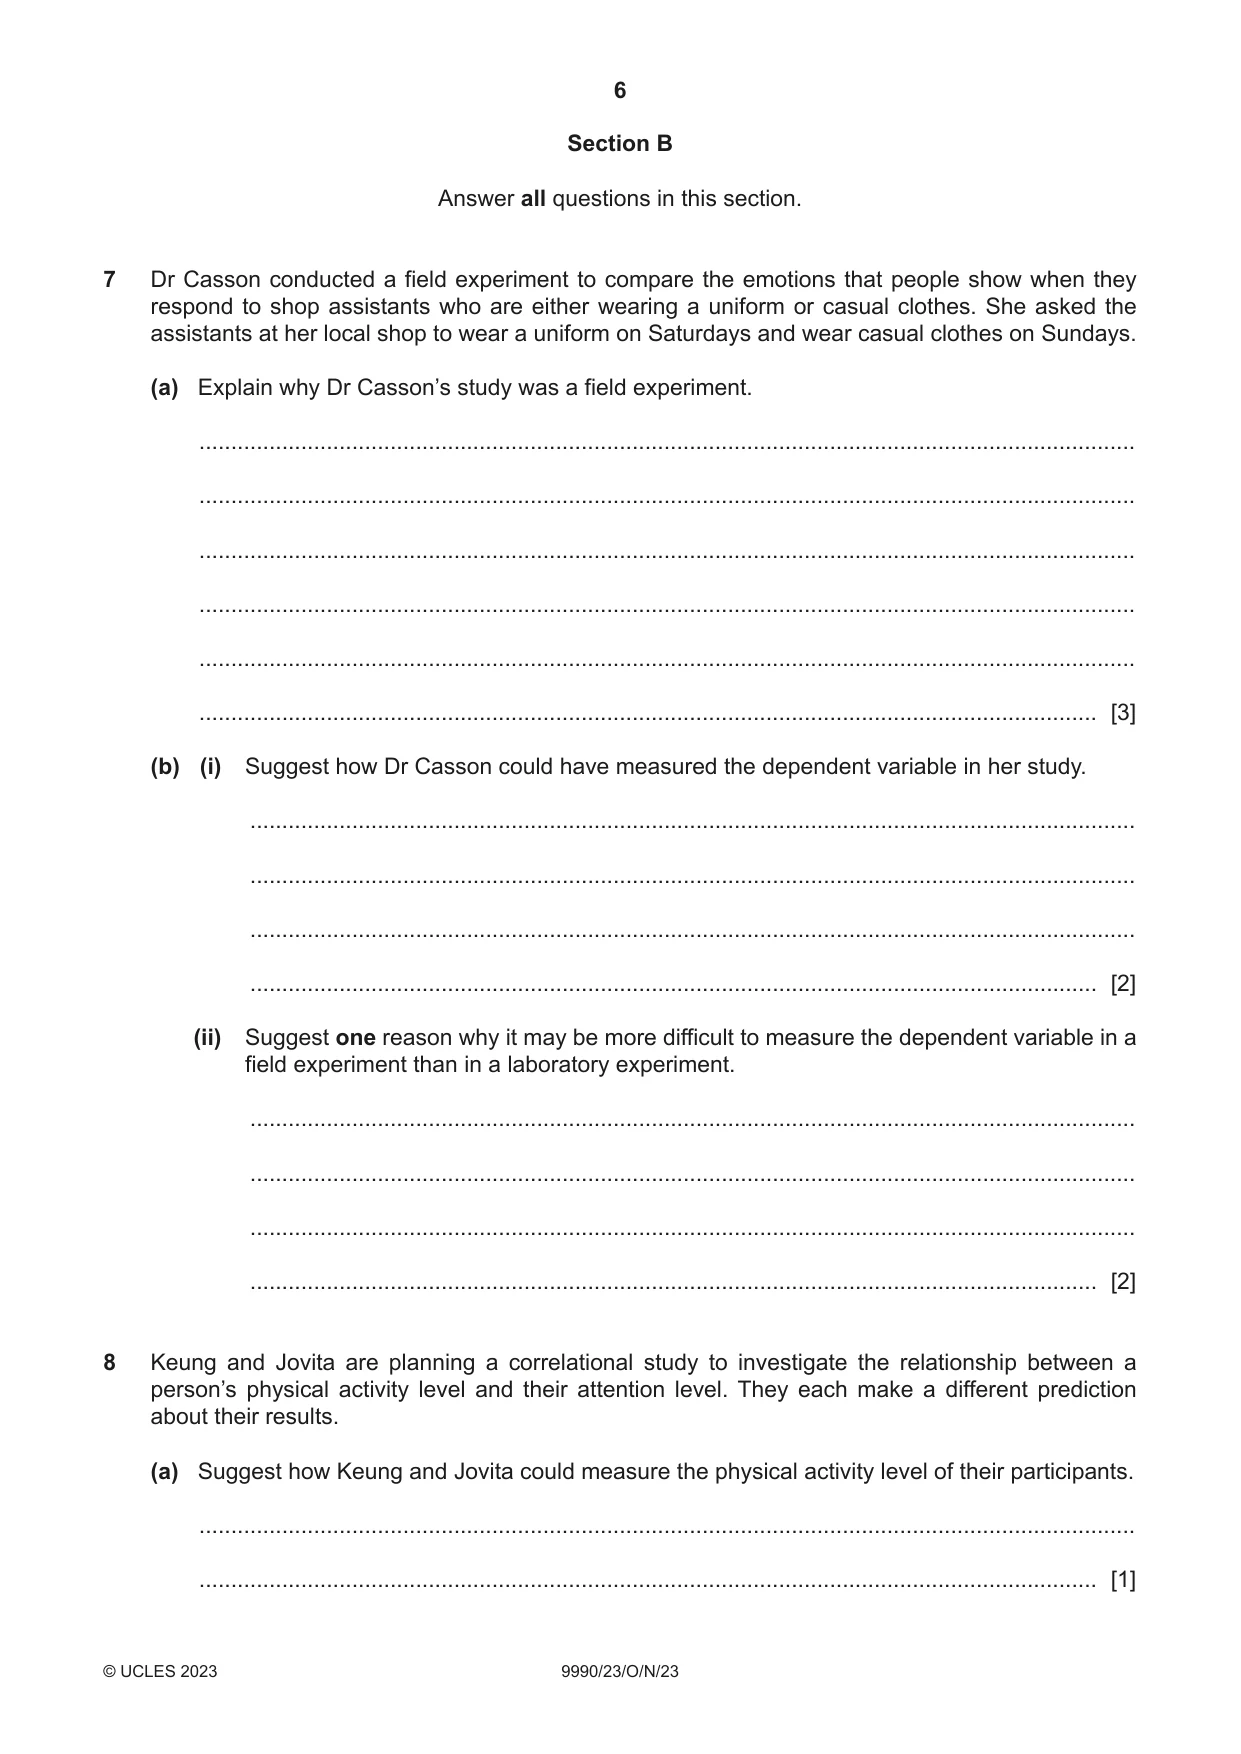
Q7 · Dr Casson conducted a field experiment to compare the emotions that people show when they…
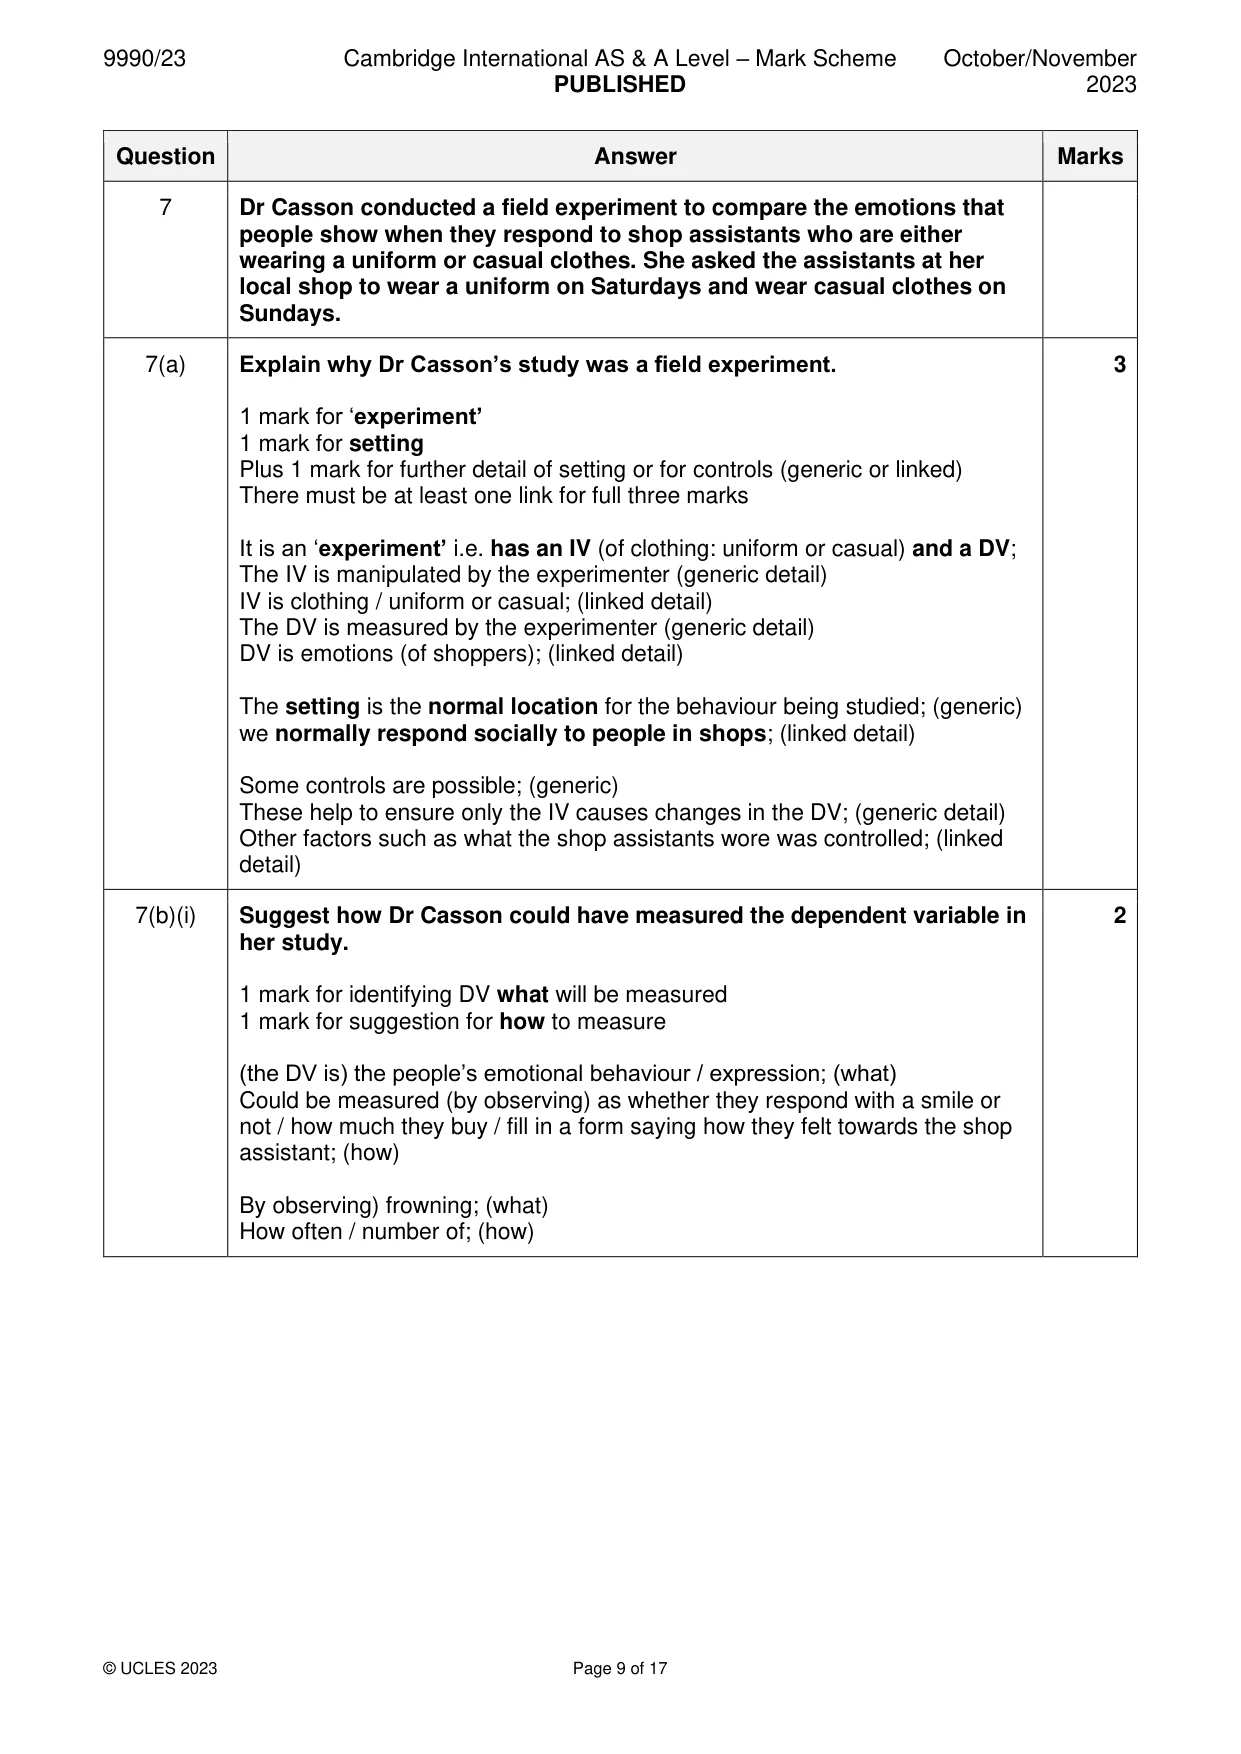
7 Dr Casson conducted a field experiment to compare the emotions that people show when they respond to shop assistants who are either wearing a uniform or casual clothes. She asked the assistants at her local shop to wear a uniform on Saturdays and wear casual clothes on Sundays. (a) Explain why Dr Casson’s study was a field experiment. ................................................................................................................................................... ................................................................................................................................................... ................................................................................................................................................... ................................................................................................................................................... ................................................................................................................................................... ............................................................................................................................................. [3] (b) (i) Suggest how Dr Casson could have measured the dependent variable in her study. ........................................................................................................................................... ........................................................................................................................................... ........................................................................................................................................... ..................................................................................................................................... [2] (ii) Suggest one reason why it may be more difficult to measure the dependent variable in a field experiment than in a laboratory experiment. ........................................................................................................................................... ........................................................................................................................................... ........................................................................................................................................... ..................................................................................................................................... [2]
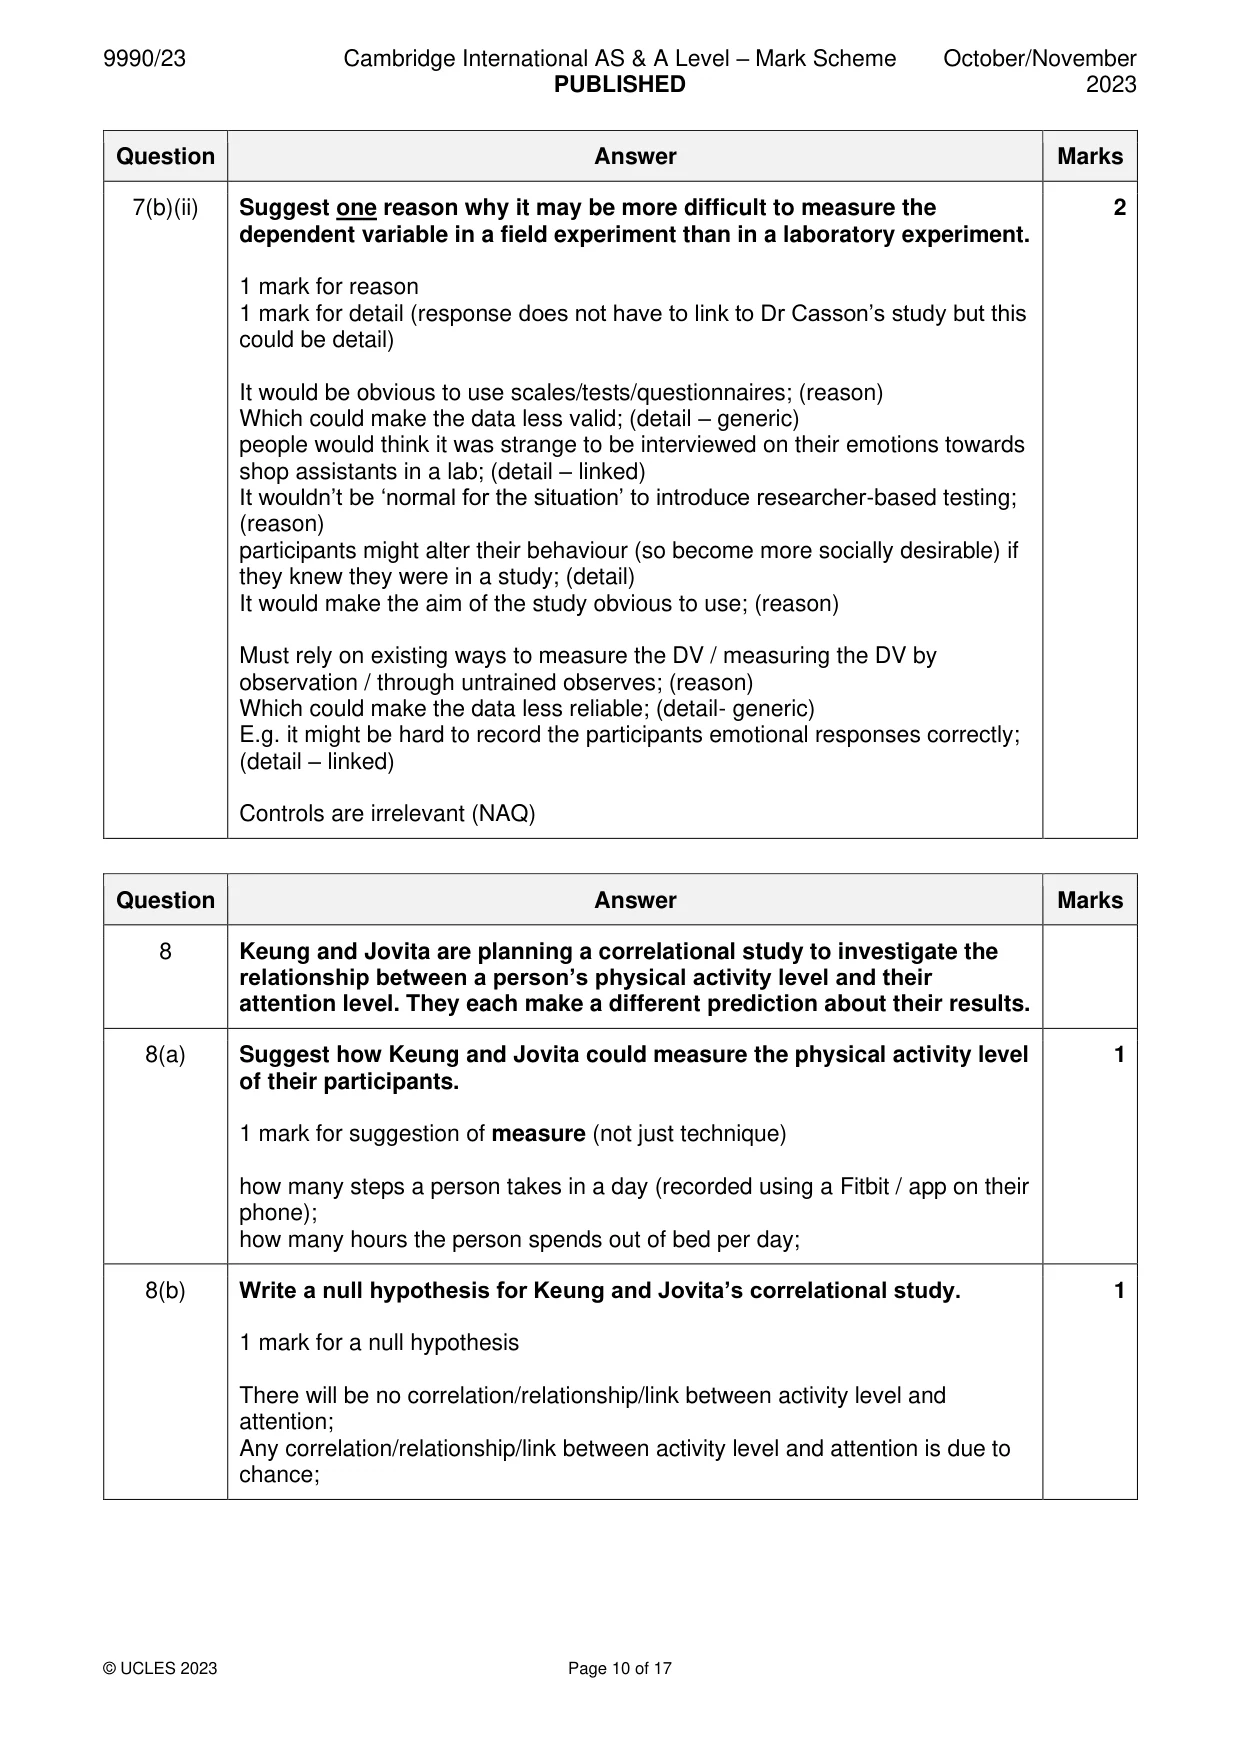
Mark scheme: 7 Dr Casson conducted a field experiment to compare the emotions that people show when they respond to shop assistants who are either wearing a uniform or casual clothes. She asked the assistants at her local shop to wear a uniform on Saturdays and wear casual clothes on Sundays. 7(a) Explain why Dr Casson’s study was a field experiment. 3 1 mark for ‘experiment’ 1 mark for setting Plus 1 mark for further detail of setting or for controls (generic or linked) There must be at least one link for full three marks It is an ‘experiment’ i.e. has an IV (of clothing: uniform or casual) and a DV; The IV is manipulated by the experimenter (generic detail) IV is clothing / uniform or casual; (linked detail) The DV is measured by the experimenter (generic detail) DV is emotions (of shoppers); (linked detail) The setting is the normal location for the behaviour being studied; (generic) we normally respond socially to people in shops; (linked detail) Some controls are possible; (generic) These help to ensure only the IV causes changes in the DV; (generic detail) Other factors such as what the shop assistants wore was controlled; (linked detail) 7(b)(i) Suggest how Dr Casson could have measured the dependent variable in 2 her study. 1 mark for identifying DV what will be measured 1 mark for suggestion for how to measure (the DV is) the people’s emotional behaviour / expression; (what) Could be measured (by observing) as whether they respond with a smile or not / how much they buy / fill in a form saying how they felt towards the shop assistant; (how) By observing) frowning; (what) How often / number of; (how) 7(b)(ii) Suggest one reason why it may be more difficult to measure the 2 dependent variable in a field experiment than in a laboratory experiment. 1 mark for reason 1 mark for detail (response does not have to link to Dr Casson’s study but this could be detail) It would be obvious to use scales/tests/questionnaires; (reason) Which could make the data less valid; (detail – generic) people would think it was strange to be interviewed on their emotions towards shop assistants in a lab; (detail – linked) It wouldn’t be ‘normal for the situation’ to introduce researcher-based testing; (reason) participants might alter their behaviour (so become more socially desirable) if they knew they were in a study; (detail) It would make the aim of the study obvious to use; (reason) Must rely on existing ways to measure the DV / measuring the DV by observation / through untrained observes; (reason) Which could make the data less reliable; (detail- generic) E.g. it might be hard to record the participants emotional responses correctly; (detail – linked) Controls are irrelevant (NAQ)
Q8 · Keung and Jovita are planning a correlational study to investigate the relationship…
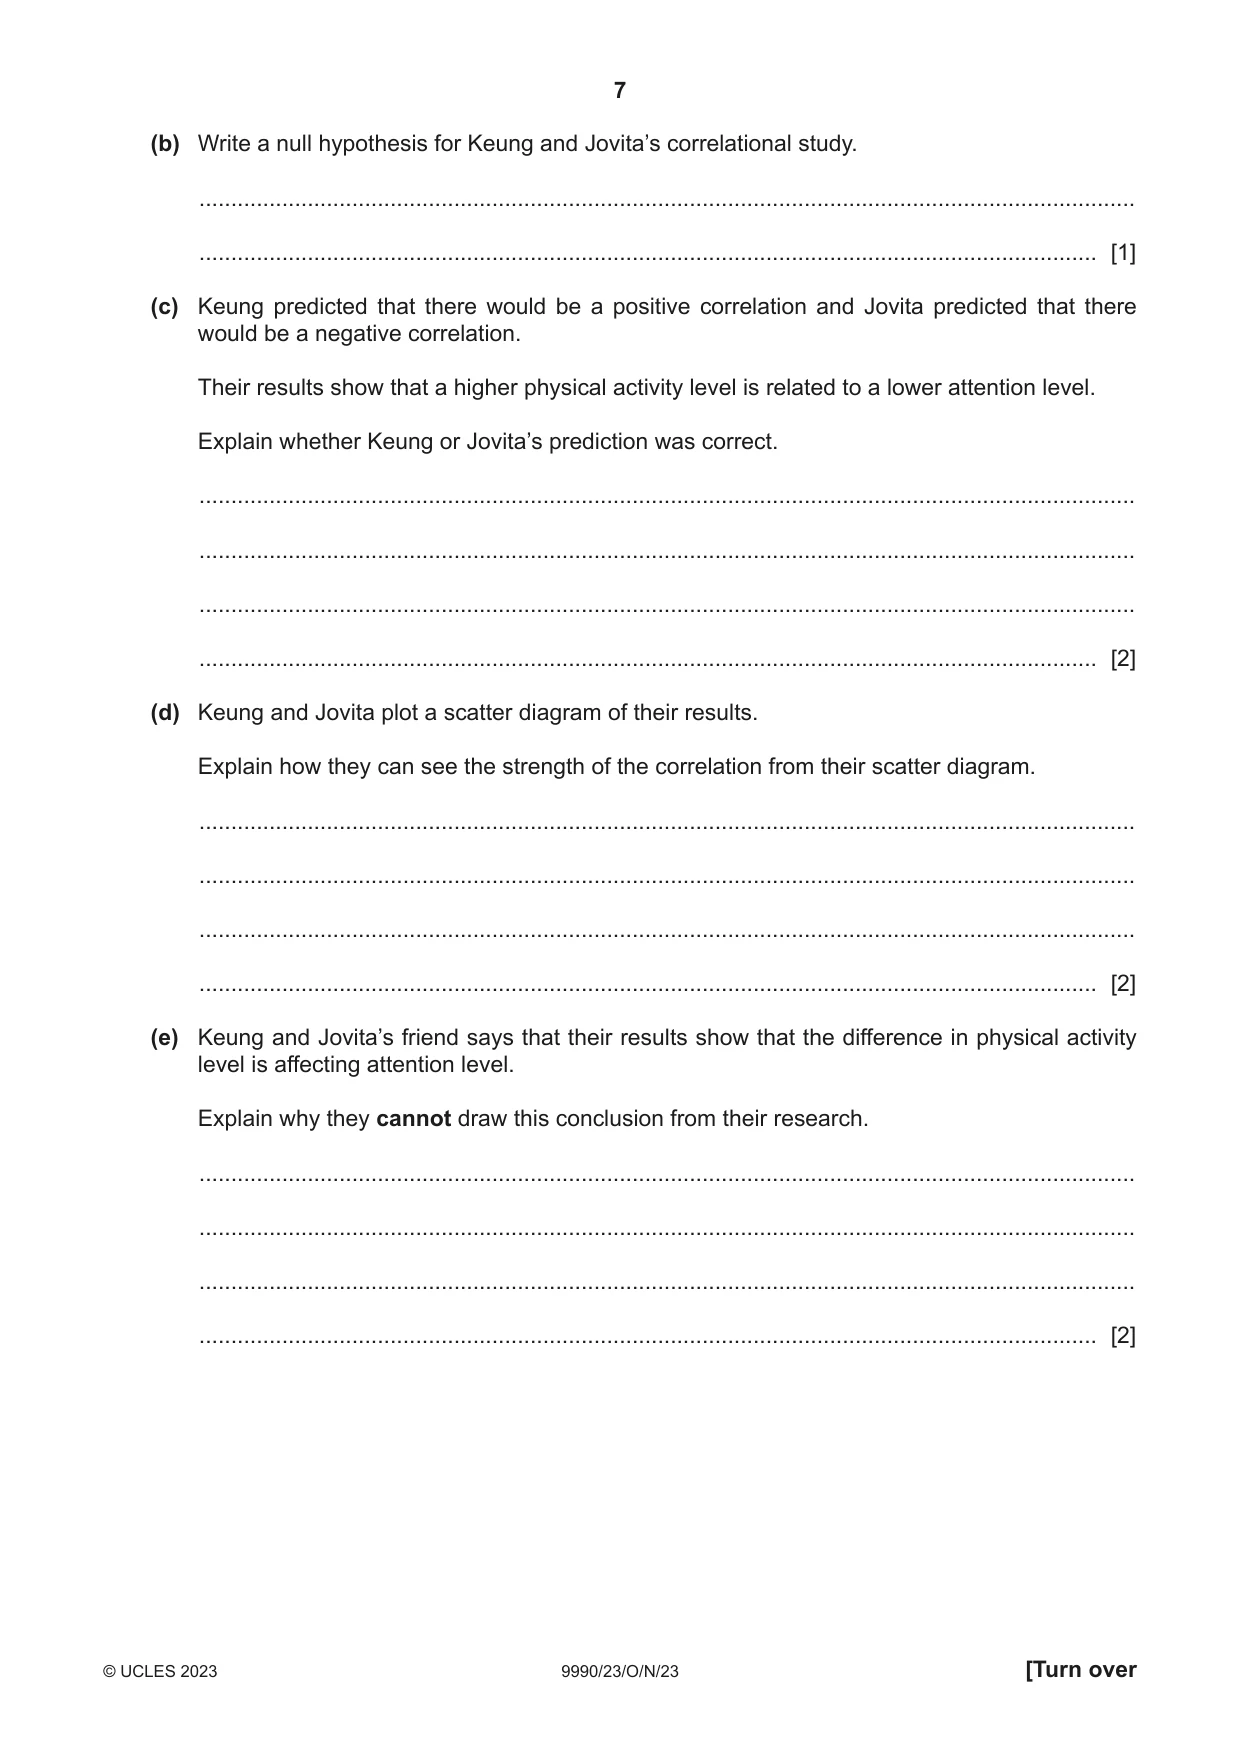
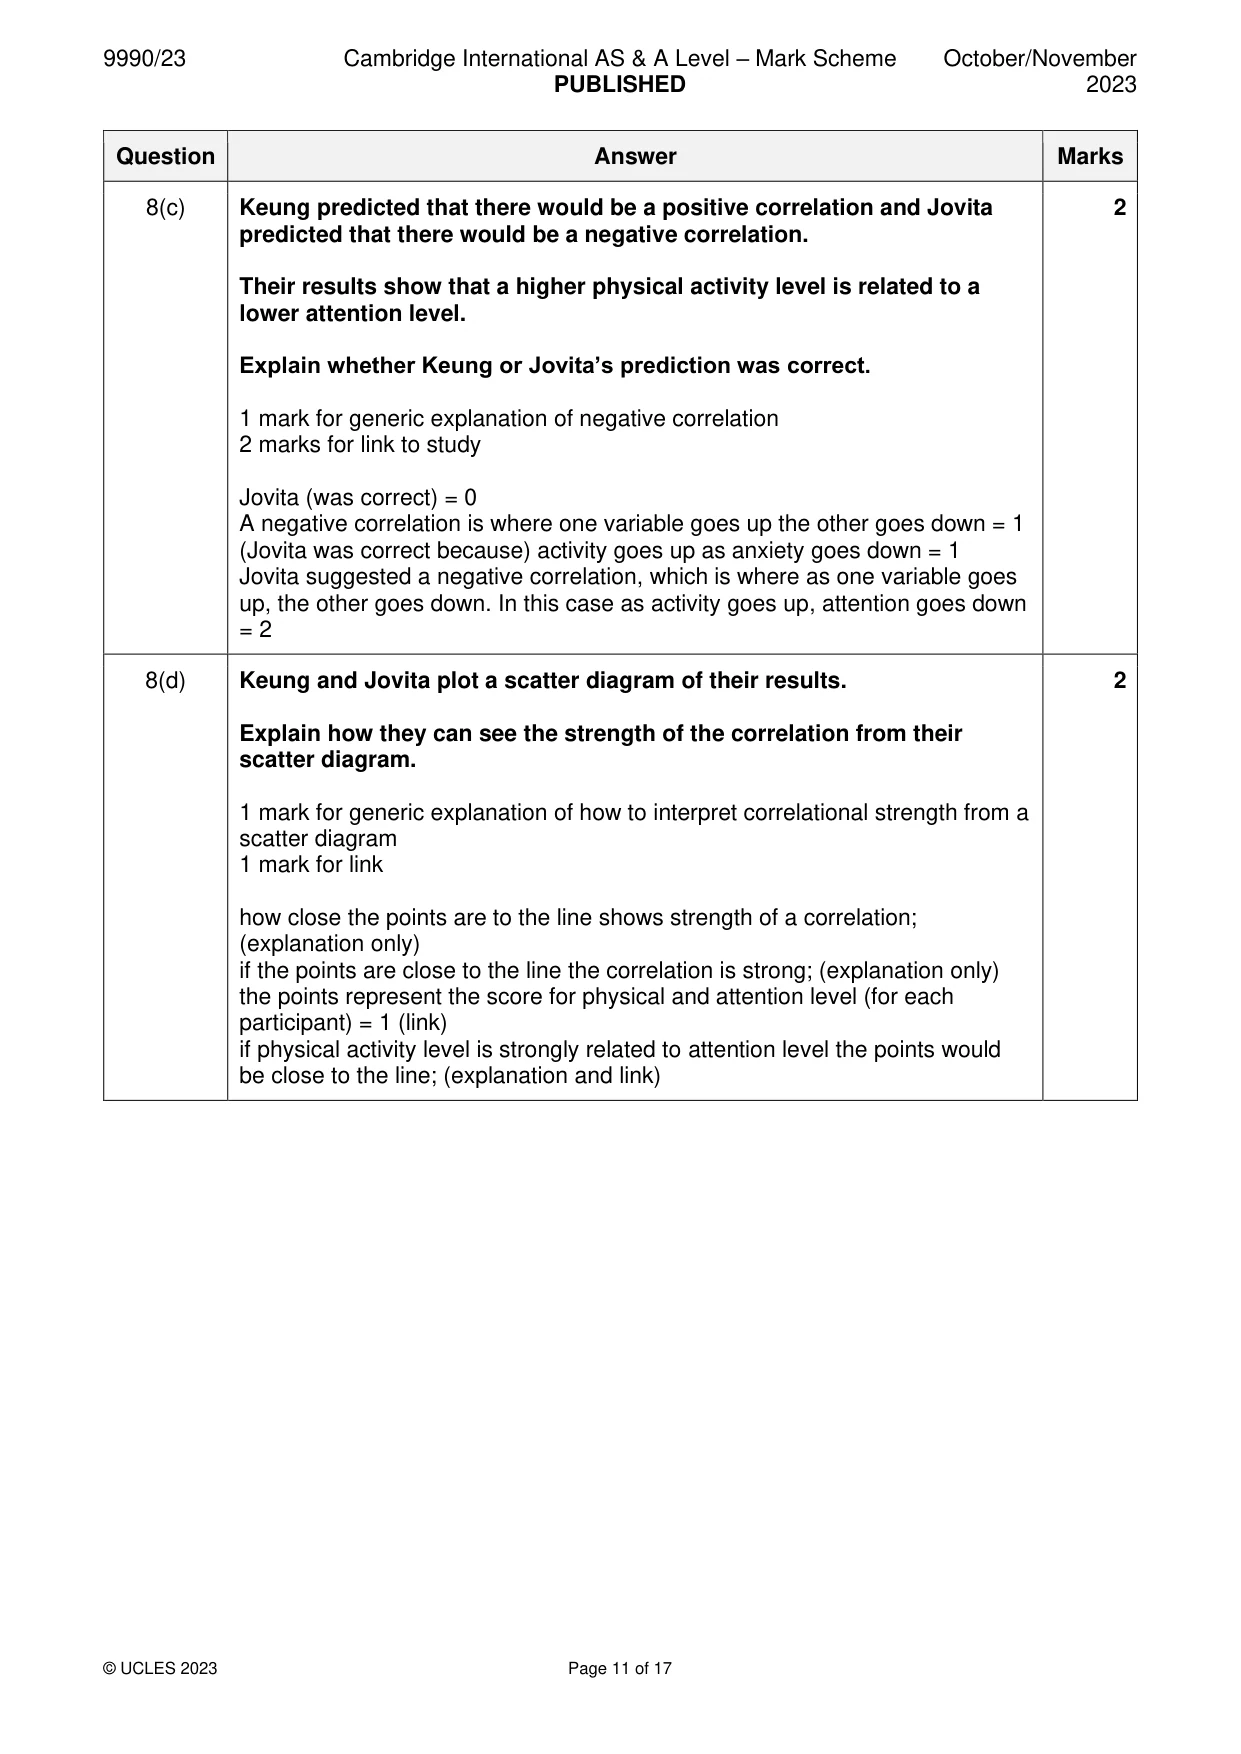
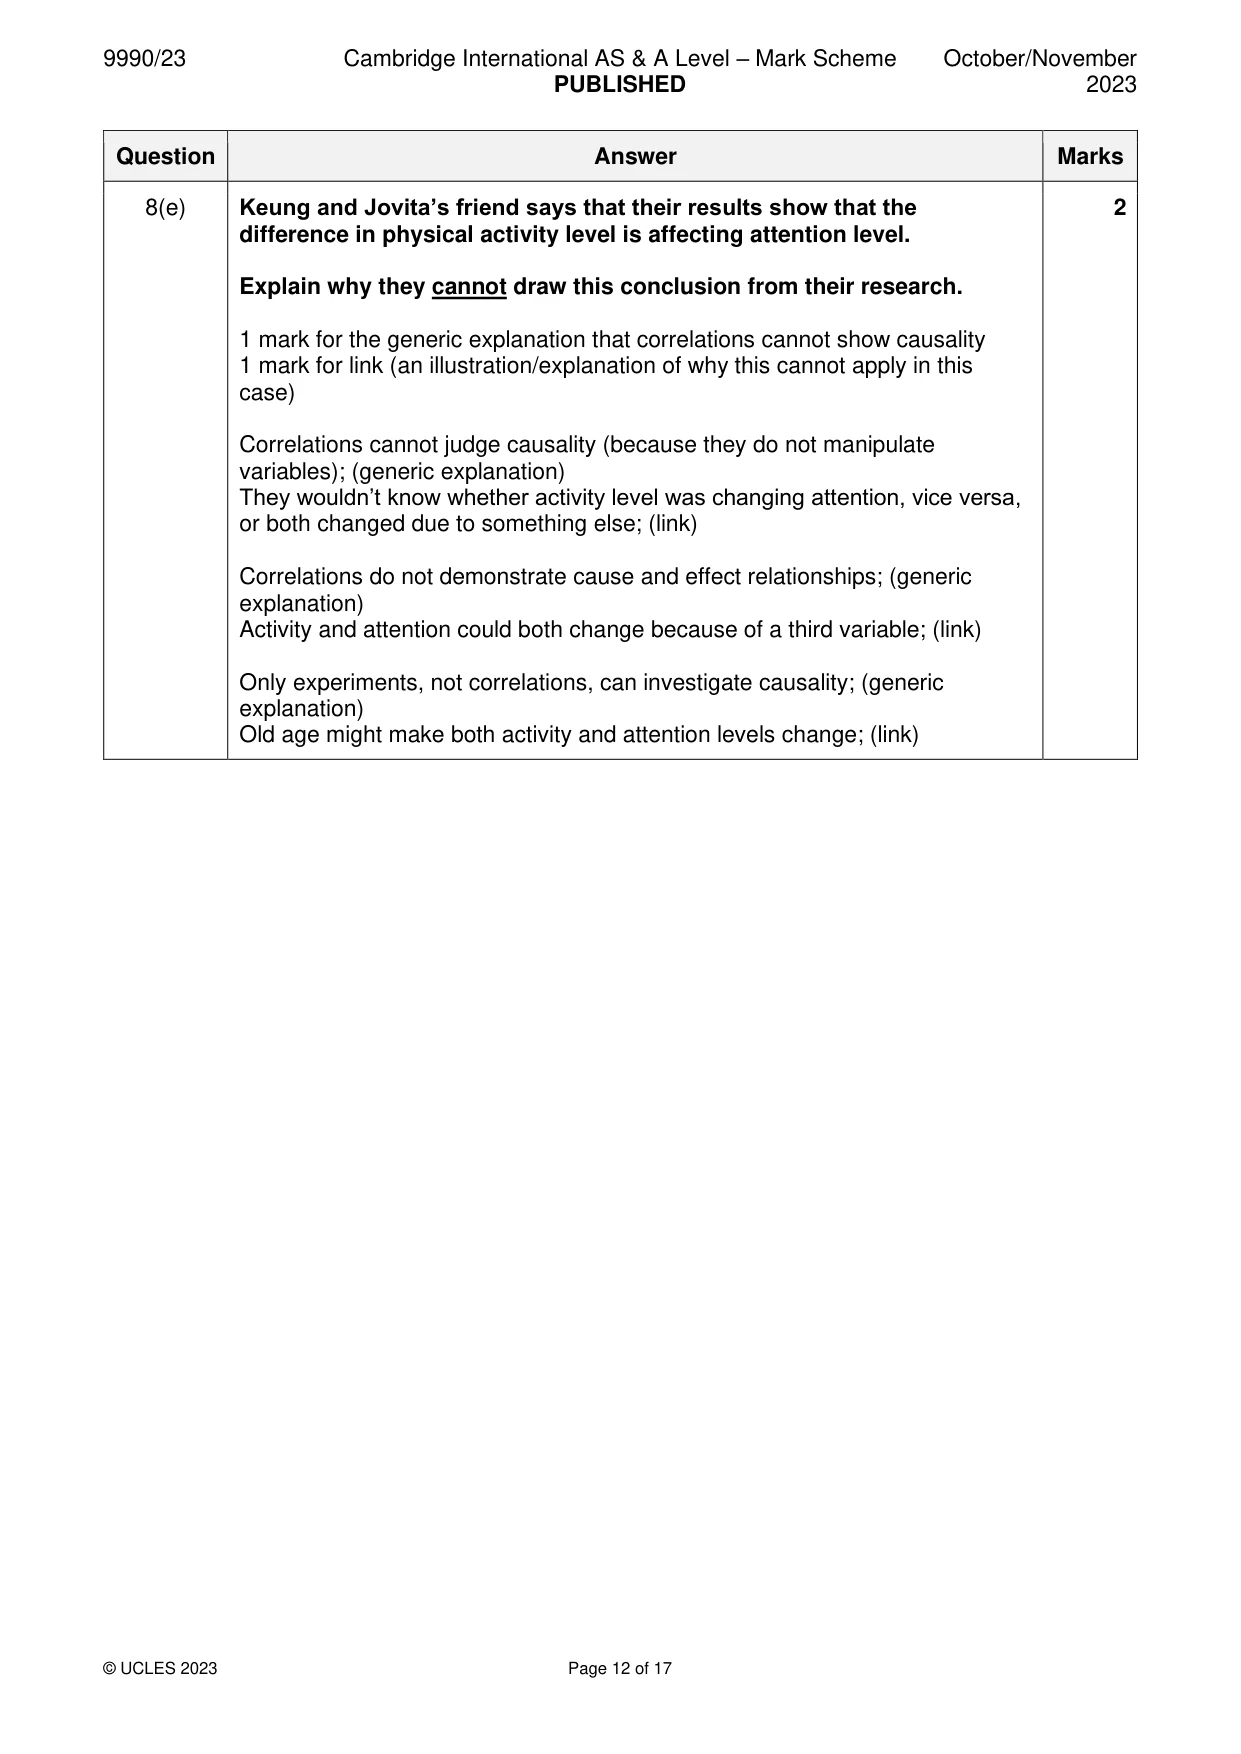
8 Keung and Jovita are planning a correlational study to investigate the relationship between a person’s physical activity level and their attention level. They each make a different prediction about their results. (a) Suggest how Keung and Jovita could measure the physical activity level of their participants. ................................................................................................................................................... ............................................................................................................................................. [1] (b) Write a null hypothesis for Keung and Jovita’s correlational study. ................................................................................................................................................... ............................................................................................................................................. [1] (c) Keung predicted that there would be a positive correlation and Jovita predicted that there would be a negative correlation. Their results show that a higher physical activity level is related to a lower attention level. Explain whether Keung or Jovita’s prediction was correct. ................................................................................................................................................... ................................................................................................................................................... ................................................................................................................................................... ............................................................................................................................................. [2] (d) Keung and Jovita plot a scatter diagram of their results. Explain how they can see the strength of the correlation from their scatter diagram. ................................................................................................................................................... ................................................................................................................................................... ................................................................................................................................................... ............................................................................................................................................. [2] (e) Keung and Jovita’s friend says that their results show that the difference in physical activity level is affecting attention level. Explain why they cannot draw this conclusion from their research. ................................................................................................................................................... ................................................................................................................................................... ................................................................................................................................................... ............................................................................................................................................. [2]
Mark scheme: 8 Keung and Jovita are planning a correlational study to investigate the relationship between a person’s physical activity level and their attention level. They each make a different prediction about their results. 8(a) Suggest how Keung and Jovita could measure the physical activity level 1 of their participants. 1 mark for suggestion of measure (not just technique) how many steps a person takes in a day (recorded using a Fitbit / app on their phone); how many hours the person spends out of bed per day; 8(b) Write a null hypothesis for Keung and Jovita’s correlational study. 1 1 mark for a null hypothesis There will be no correlation/relationship/link between activity level and attention; Any correlation/relationship/link between activity level and attention is due to chance; 8(c) Keung predicted that there would be a positive correlation and Jovita 2 predicted that there would be a negative correlation. Their results show that a higher physical activity level is related to a lower attention level. Explain whether Keung or Jovita’s prediction was correct. 1 mark for generic explanation of negative correlation 2 marks for link to study Jovita (was correct) = 0 A negative correlation is where one variable goes up the other goes down = 1 (Jovita was correct because) activity goes up as anxiety goes down = 1 Jovita suggested a negative correlation, which is where as one variable goes up, the other goes down. In this case as activity goes up, attention goes down = 2 8(d) Keung and Jovita plot a scatter diagram of their results. 2 Explain how they can see the strength of the correlation from their scatter diagram. 1 mark for generic explanation of how to interpret correlational strength from a scatter diagram 1 mark for link how close the points are to the line shows strength of a correlation; (explanation only) if the points are close to the line the correlation is strong; (explanation only) the points represent the score for physical and attention level (for each participant) = 1 (link) if physical activity level is strongly related to attention level the points would be close to the line; (explanation and link) 8(e) Keung and Jovita’s friend says that their results show that the 2 difference in physical activity level is affecting attention level. Explain why they cannot draw this conclusion from their research. 1 mark for the generic explanation that correlations cannot show causality 1 mark for link (an illustration/explanation of why this cannot apply in this case) Correlations cannot judge causality (because they do not manipulate variables); (generic explanation) They wouldn’t know whether activity level was changing attention, vice versa, or both changed due to something else; (link) Correlations do not demonstrate cause and effect relationships; (generic explanation) Activity and attention could both change because of a third variable; (link) Only experiments, not correlations, can investigate causality; (generic explanation) Old age might make both activity and attention levels change; (link)
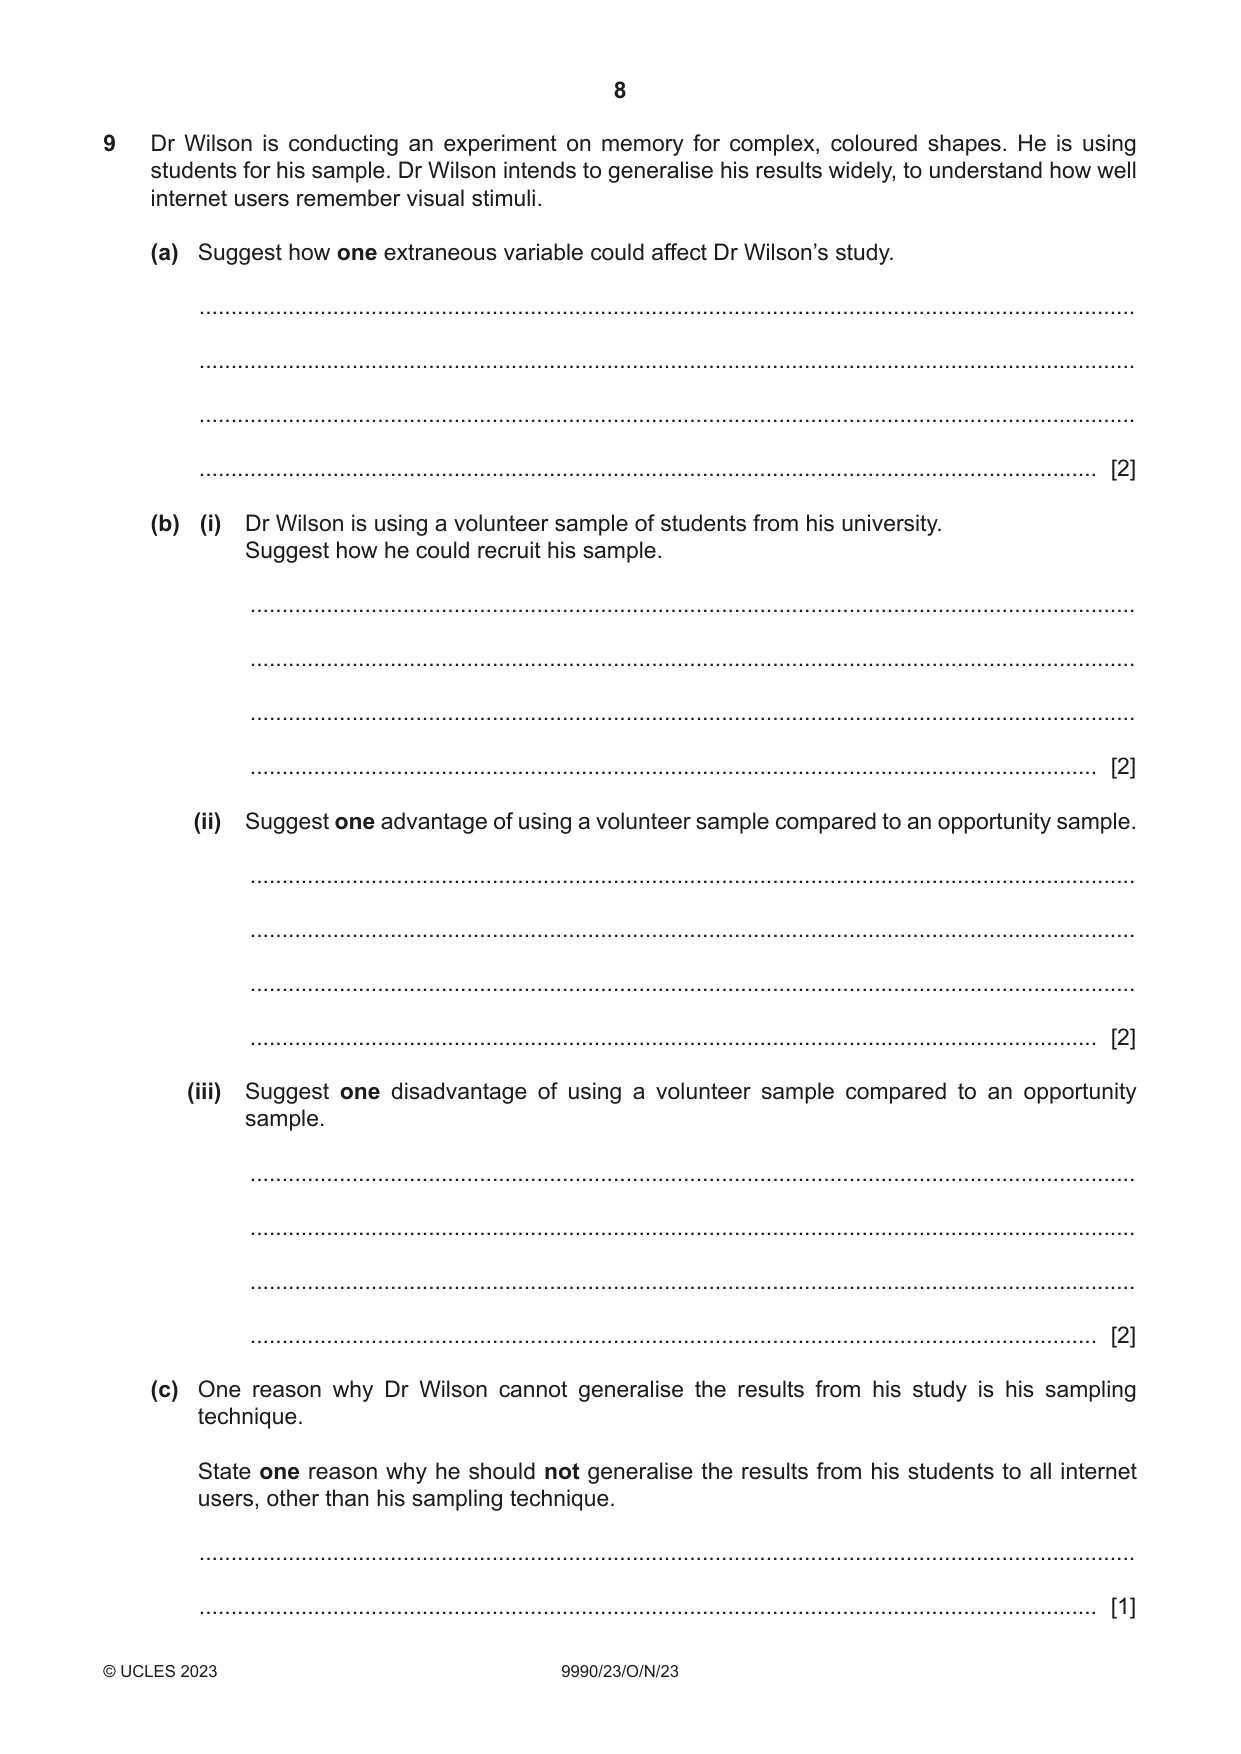
Q9 · Dr Wilson is conducting an experiment on memory for complex, coloured shapes
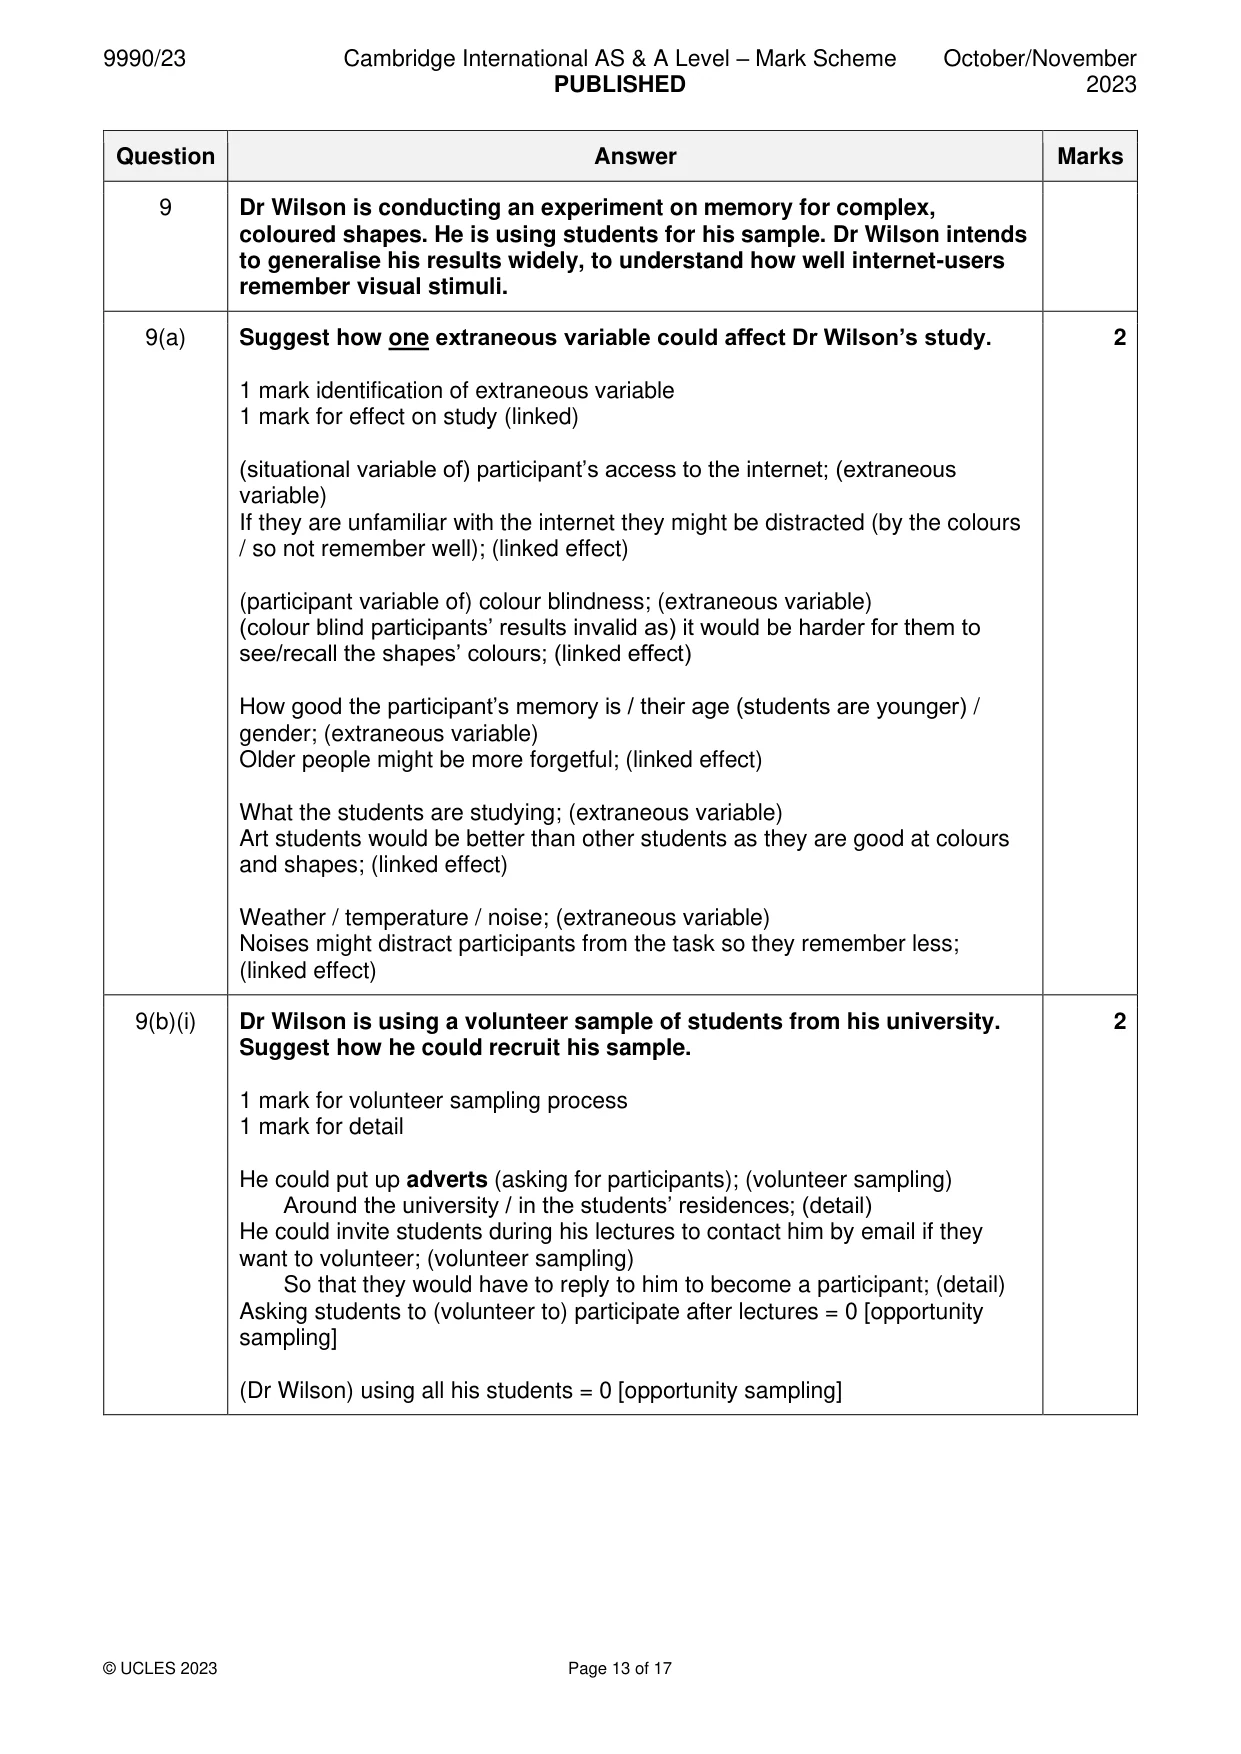
9 Dr Wilson is conducting an experiment on memory for complex, coloured shapes. He is using students for his sample. Dr Wilson intends to generalise his results widely, to understand how well internet users remember visual stimuli. (a) Suggest how one extraneous variable could affect Dr Wilson’s study. ................................................................................................................................................... ................................................................................................................................................... ................................................................................................................................................... ............................................................................................................................................. [2] (b) (i) Dr Wilson is using a volunteer sample of students from his university. Suggest how he could recruit his sample. ........................................................................................................................................... ........................................................................................................................................... ........................................................................................................................................... ..................................................................................................................................... [2] (ii) Suggest one advantage of using a volunteer sample compared to an opportunity sample. ........................................................................................................................................... ........................................................................................................................................... ........................................................................................................................................... ..................................................................................................................................... [2] (iii) Suggest one disadvantage of using a volunteer sample compared to an opportunity sample. ........................................................................................................................................... ........................................................................................................................................... ........................................................................................................................................... ..................................................................................................................................... [2] (c) One reason why Dr Wilson cannot generalise the results from his study is his sampling technique. State one reason why he should not generalise the results from his students to all internet users, other than his sampling technique. ................................................................................................................................................... ............................................................................................................................................. [1] Question 10 appears on Page 10. Section C Answer all questions in this section.
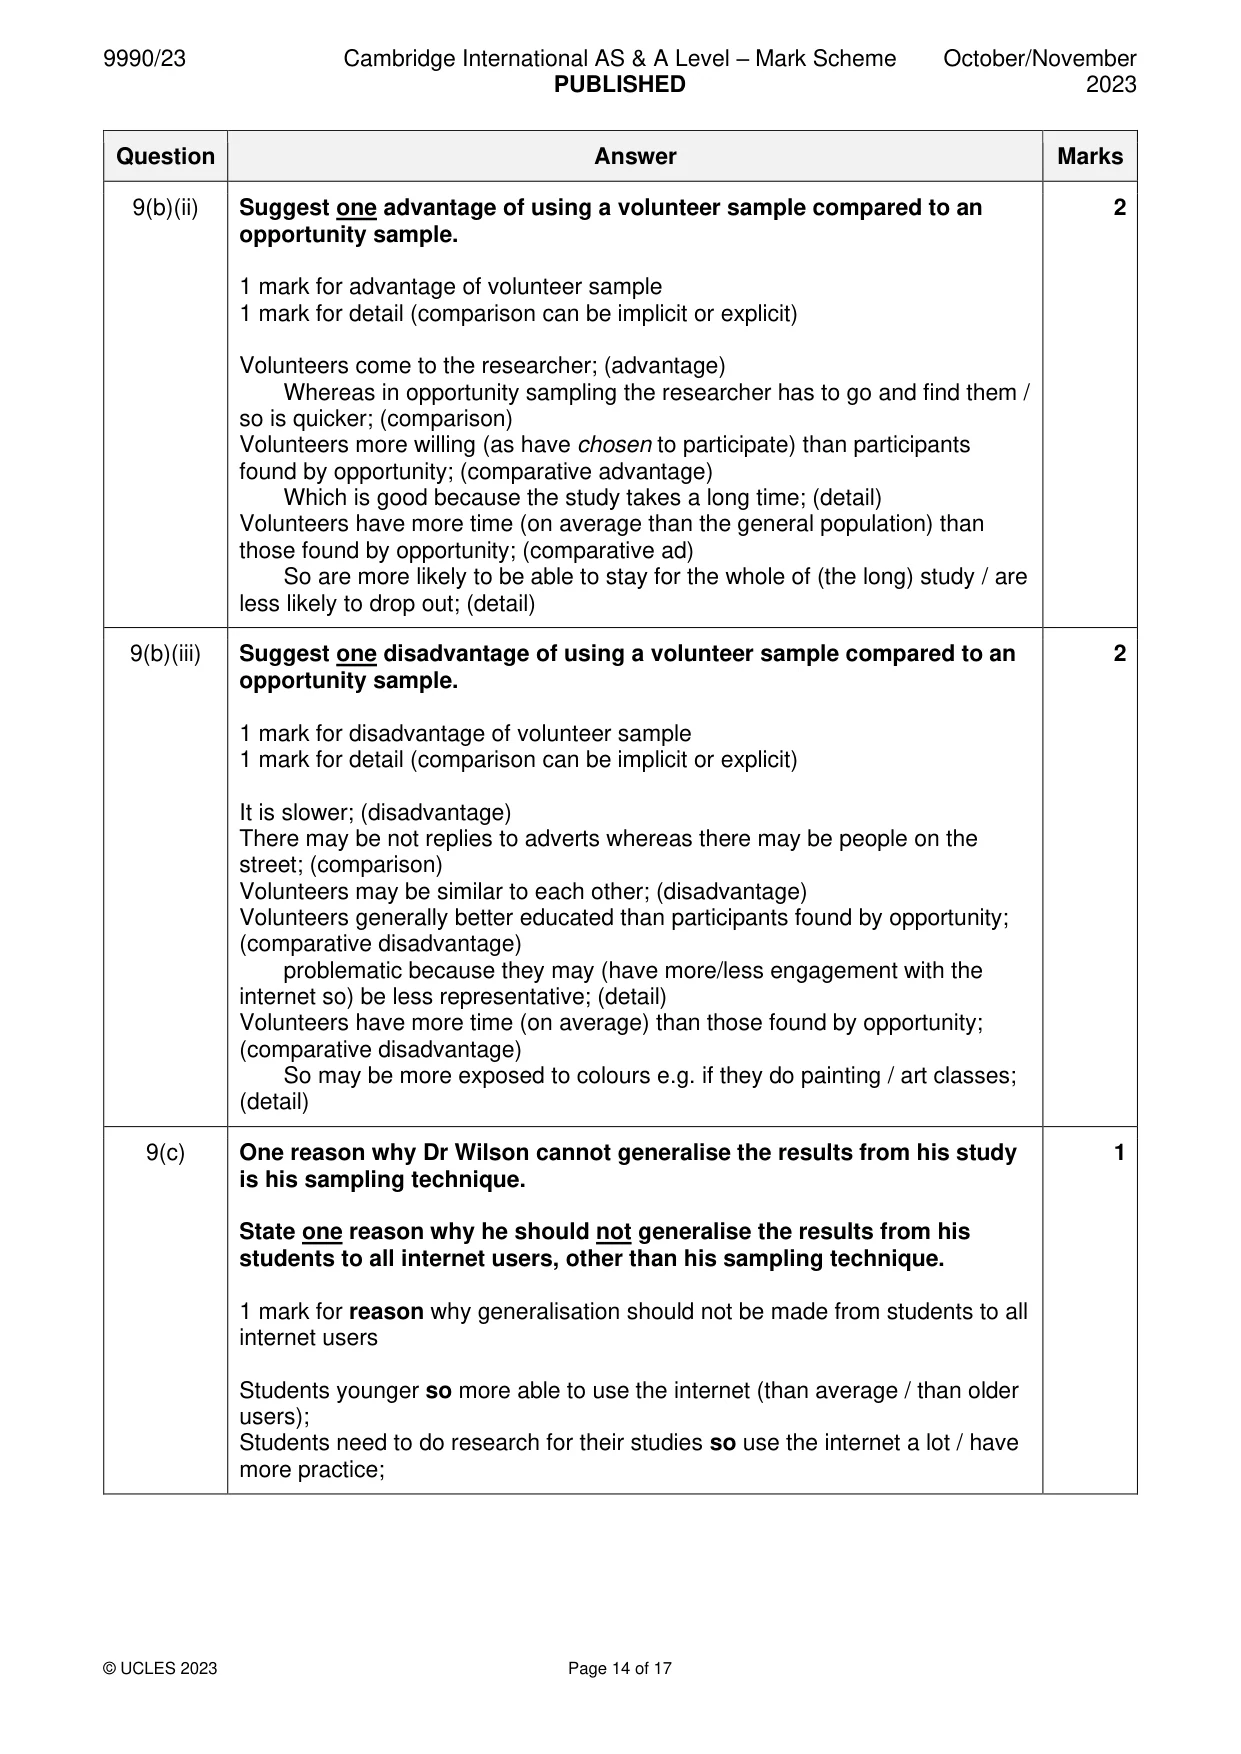
Mark scheme: 9 Dr Wilson is conducting an experiment on memory for complex, coloured shapes. He is using students for his sample. Dr Wilson intends to generalise his results widely, to understand how well internet-users remember visual stimuli. 9(a) Suggest how one extraneous variable could affect Dr Wilson’s study. 2 1 mark identification of extraneous variable 1 mark for effect on study (linked) (situational variable of) participant’s access to the internet; (extraneous variable) If they are unfamiliar with the internet they might be distracted (by the colours / so not remember well); (linked effect) (participant variable of) colour blindness; (extraneous variable) (colour blind participants’ results invalid as) it would be harder for them to see/recall the shapes’ colours; (linked effect) How good the participant’s memory is / their age (students are younger) / gender; (extraneous variable) Older people might be more forgetful; (linked effect) What the students are studying; (extraneous variable) Art students would be better than other students as they are good at colours and shapes; (linked effect) Weather / temperature / noise; (extraneous variable) Noises might distract participants from the task so they remember less; (linked effect) 9(b)(i) Dr Wilson is using a volunteer sample of students from his university. 2 Suggest how he could recruit his sample. 1 mark for volunteer sampling process 1 mark for detail He could put up adverts (asking for participants); (volunteer sampling) Around the university / in the students’ residences; (detail) He could invite students during his lectures to contact him by email if they want to volunteer; (volunteer sampling) So that they would have to reply to him to become a participant; (detail) Asking students to (volunteer to) participate after lectures = 0 [opportunity sampling] (Dr Wilson) using all his students = 0 [opportunity sampling] 9(b)(ii) Suggest one advantage of using a volunteer sample compared to an 2 opportunity sample. 1 mark for advantage of volunteer sample 1 mark for detail (comparison can be implicit or explicit) Volunteers come to the researcher; (advantage) Whereas in opportunity sampling the researcher has to go and find them / so is quicker; (comparison) Volunteers more willing (as have chosen to participate) than participants found by opportunity; (comparative advantage) Which is good because the study takes a long time; (detail) Volunteers have more time (on average than the general population) than those found by opportunity; (comparative ad) So are more likely to be able to stay for the whole of (the long) study / are less likely to drop out; (detail) 9(b)(iii) Suggest one disadvantage of using a volunteer sample compared to an 2 opportunity sample. 1 mark for disadvantage of volunteer sample 1 mark for detail (comparison can be implicit or explicit) It is slower; (disadvantage) There may be not replies to adverts whereas there may be people on the street; (comparison) Volunteers may be similar to each other; (disadvantage) Volunteers generally better educated than participants found by opportunity; (comparative disadvantage) problematic because they may (have more/less engagement with the internet so) be less representative; (detail) Volunteers have more time (on average) than those found by opportunity; (comparative disadvantage) So may be more exposed to colours e.g. if they do painting / art classes; (detail) 9(c) One reason why Dr Wilson cannot generalise the results from his study 1 is his sampling technique. State one reason why he should not generalise the results from his students to all internet users, other than his sampling technique. 1 mark for reason why generalisation should not be made from students to all internet users Students younger so more able to use the internet (than average / than older users); Students need to do research for their studies so use the internet a lot / have more practice;
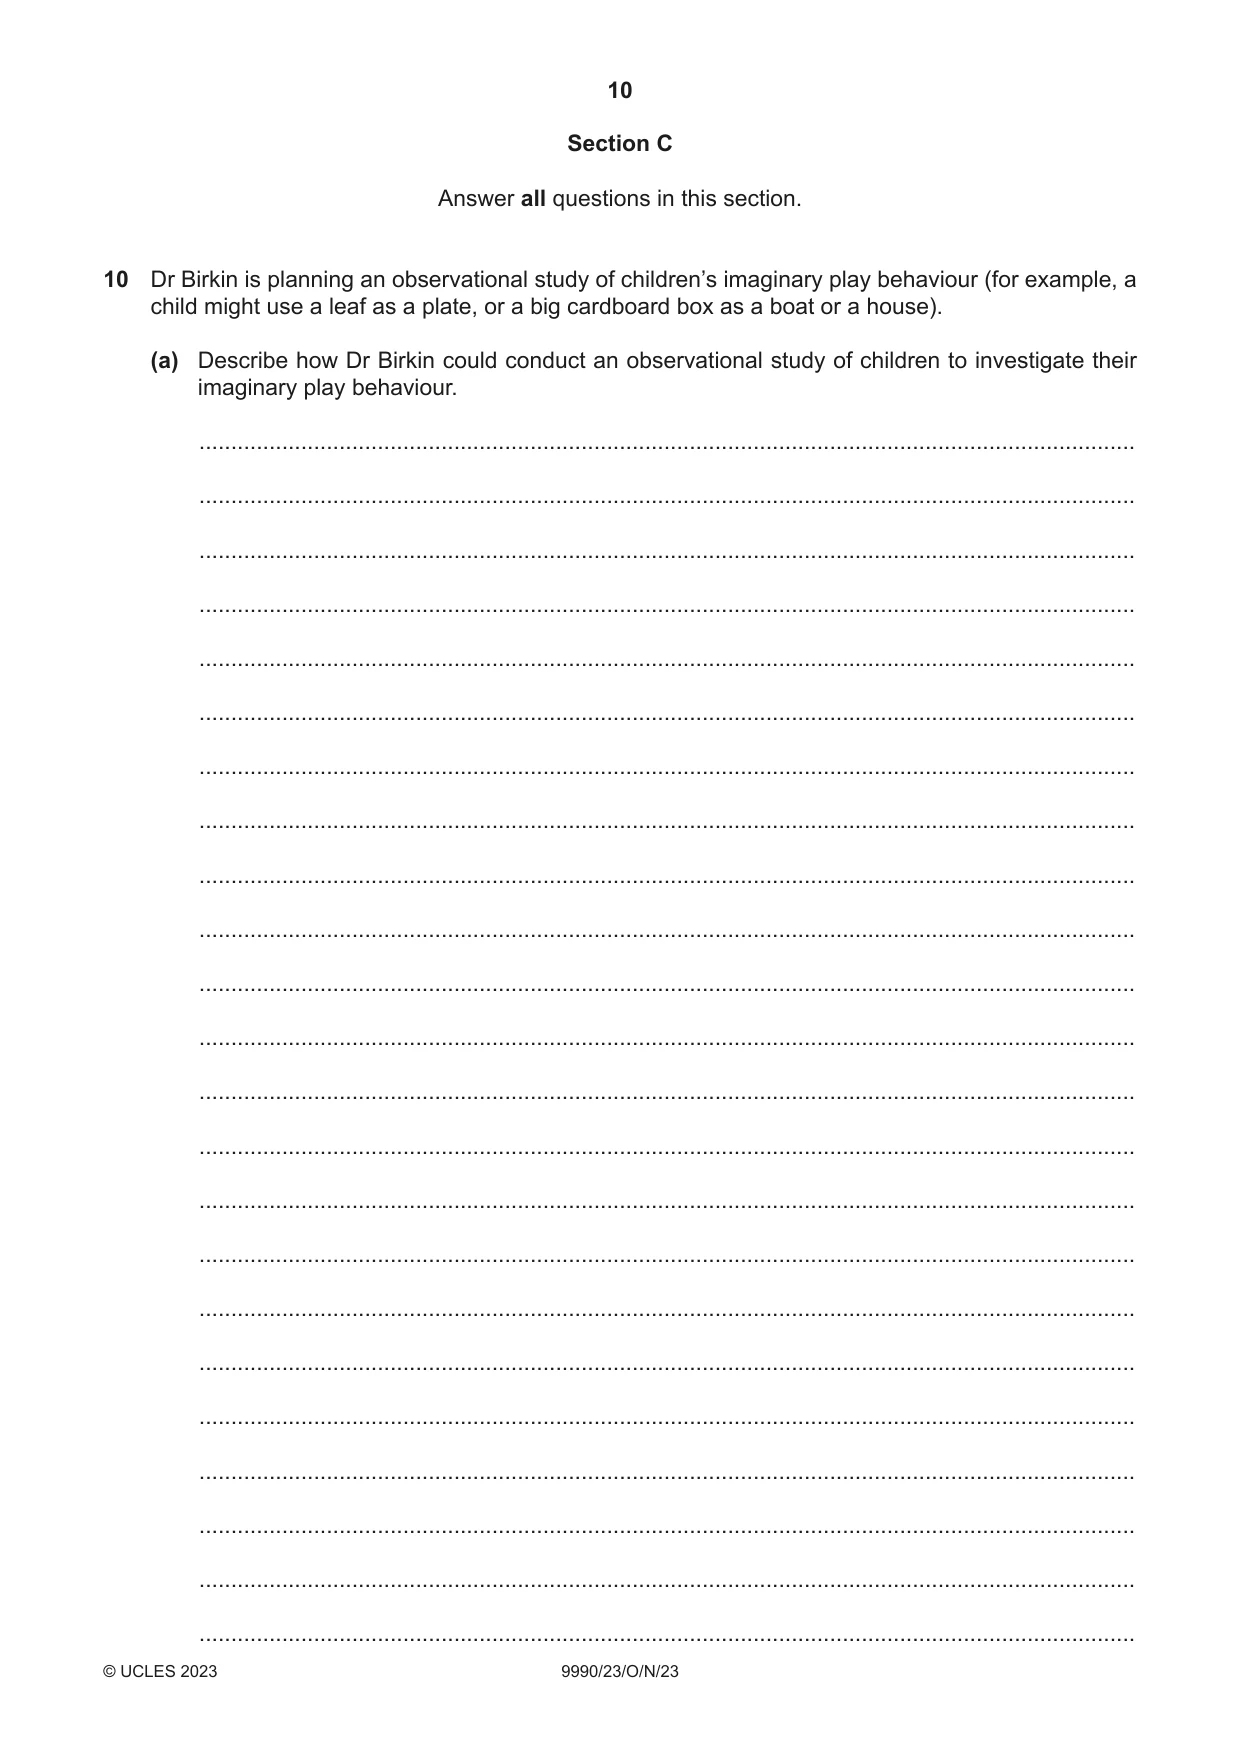
Q10 · Dr Birkin is planning an observational study of children’s imaginary play behaviour (for…
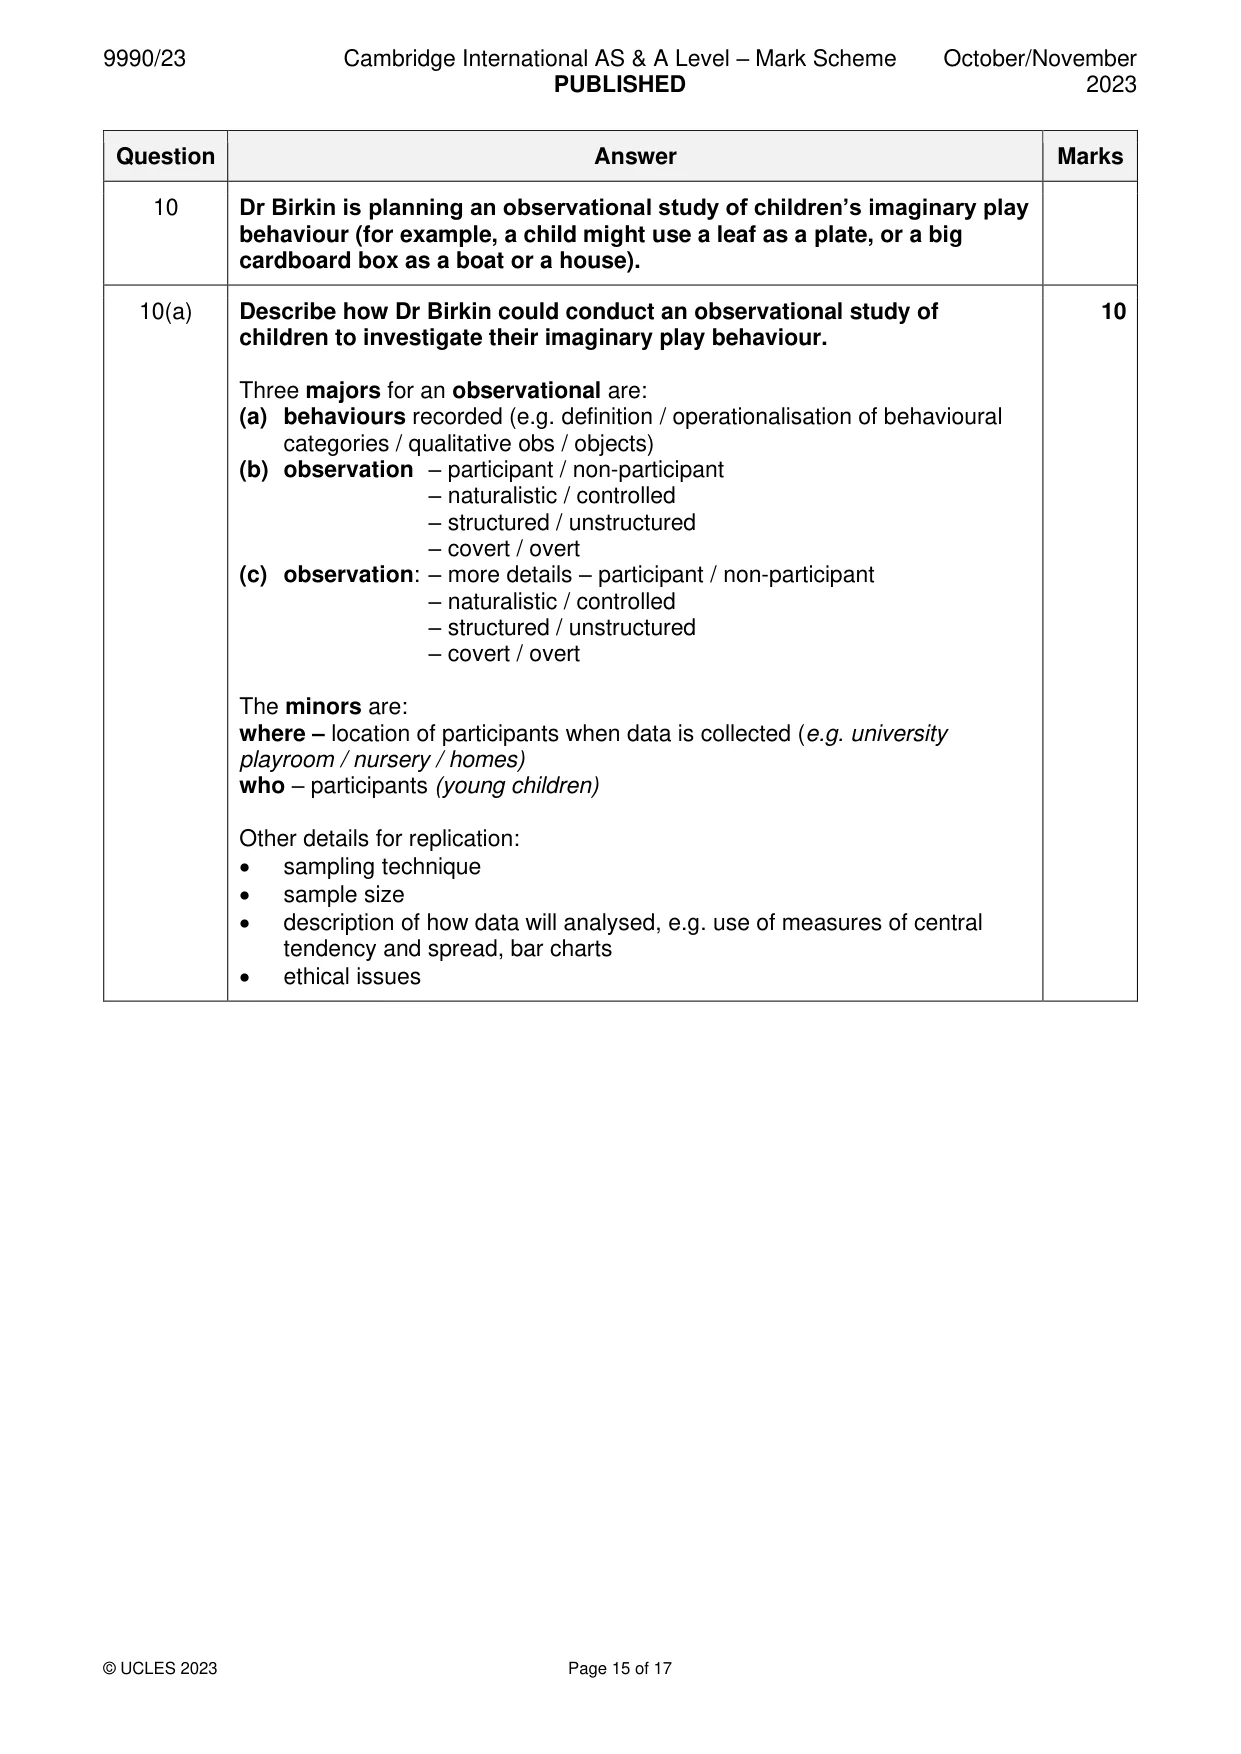
10 Dr Birkin is planning an observational study of children’s imaginary play behaviour (for example, a child might use a leaf as a plate, or a big cardboard box as a boat or a house). (a) Describe how Dr Birkin could conduct an observational study of children to investigate their imaginary play behaviour. ................................................................................................................................................... ................................................................................................................................................... ................................................................................................................................................... ................................................................................................................................................... ................................................................................................................................................... ................................................................................................................................................... ................................................................................................................................................... ................................................................................................................................................... ................................................................................................................................................... ................................................................................................................................................... ................................................................................................................................................... ................................................................................................................................................... ................................................................................................................................................... ................................................................................................................................................... ................................................................................................................................................... ................................................................................................................................................... ................................................................................................................................................... ................................................................................................................................................... ................................................................................................................................................... ................................................................................................................................................... ................................................................................................................................................... ................................................................................................................................................... ................................................................................................................................................... ................................................................................................................................................... ................................................................................................................................................... ................................................................................................................................................... ................................................................................................................................................... ................................................................................................................................................... ................................................................................................................................................... ................................................................................................................................................... ................................................................................................................................................... ................................................................................................................................................... ................................................................................................................................................... ........................................................................................................................................... [10] (b) Identify one practical weakness/limitation with the procedure you have described in your answer to part (a) and suggest how your study might be done differently to overcome the problem. Do not refer to ethics or sampling in your answer. ................................................................................................................................................... ................................................................................................................................................... ................................................................................................................................................... ................................................................................................................................................... ................................................................................................................................................... ................................................................................................................................................... ................................................................................................................................................... ............................................................................................................................................. [4]
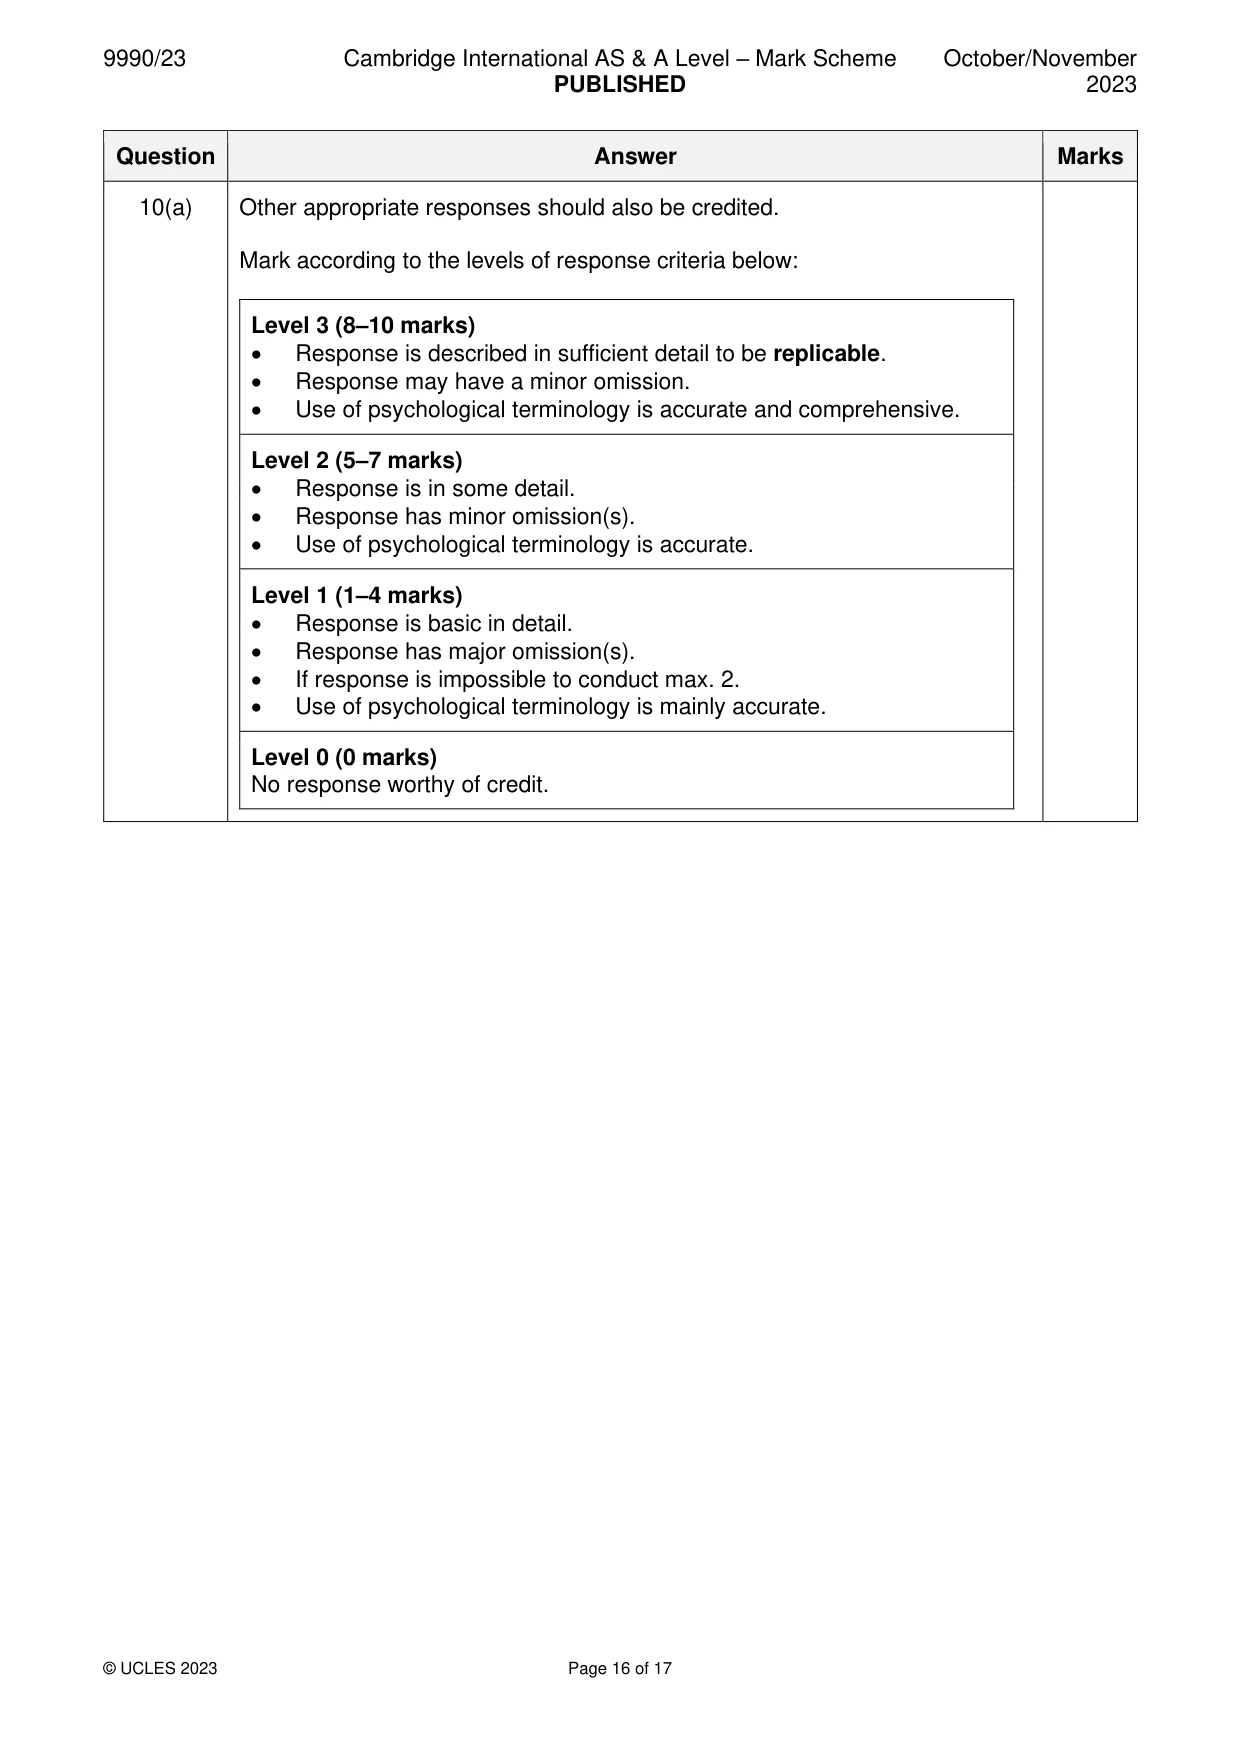
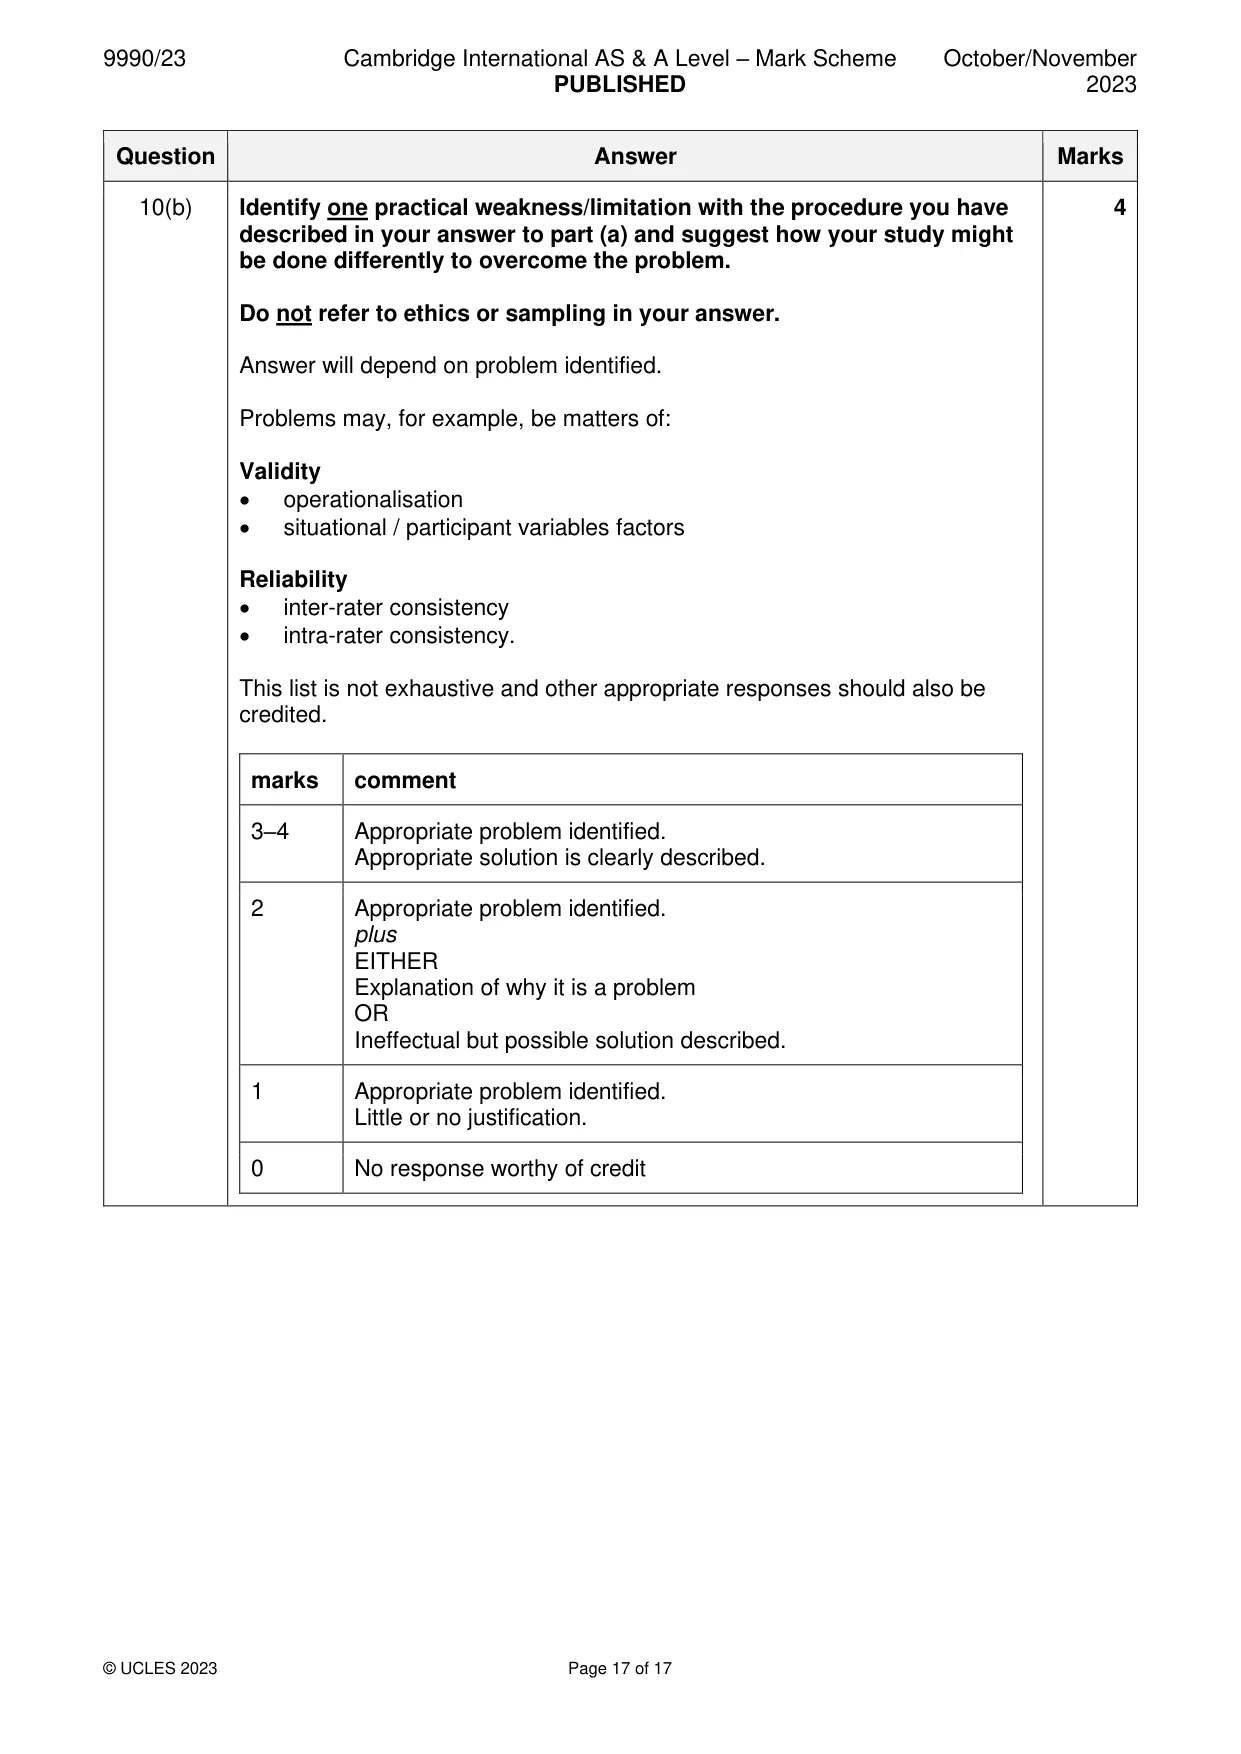
Mark scheme: 10 Dr Birkin is planning an observational study of children’s imaginary play behaviour (for example, a child might use a leaf as a plate, or a big cardboard box as a boat or a house). 10(a) Describe how Dr Birkin could conduct an observational study of 10 children to investigate their imaginary play behaviour. Three majors for an observational are: (a) behaviours recorded (e.g. definition / operationalisation of behavioural categories / qualitative obs / objects) (b) observation – participant / non-participant – naturalistic / controlled – structured / unstructured – covert / overt (c) observation: – more details – participant / non-participant – naturalistic / controlled – structured / unstructured – covert / overt The minors are: where – location of participants when data is collected (e.g. university playroom / nursery / homes) who – participants (young children) Other details for replication: • sampling technique • sample size • description of how data will analysed, e.g. use of measures of central tendency and spread, bar charts • ethical issues 10(a) Other appropriate responses should also be credited. Mark according to the levels of response criteria below: Level 3 (8–10 marks) • Response is described in sufficient detail to be replicable. • Response may have a minor omission. • Use of psychological terminology is accurate and comprehensive. Level 2 (5–7 marks) • Response is in some detail. • Response has minor omission(s). • Use of psychological terminology is accurate. Level 1 (1–4 marks) • Response is basic in detail. • Response has major omission(s). • If response is impossible to conduct max. 2. • Use of psychological terminology is mainly accurate. Level 0 (0 marks) No response worthy of credit. 10(b) Identify one practical weakness/limitation with the procedure you have 4 described in your answer to part (a) and suggest how your study might be done differently to overcome the problem. Do not refer to ethics or sampling in your answer. Answer will depend on problem identified. Problems may, for example, be matters of: Validity • operationalisation • situational / participant variables factors Reliability • inter-rater consistency • intra-rater consistency. This list is not exhaustive and other appropriate responses should also be credited. marks comment 3–4 Appropriate problem identified. Appropriate solution is clearly described. 2 Appropriate problem identified. plus EITHER Explanation of why it is a problem OR Ineffectual but possible solution described. 1 Appropriate problem identified. Little or no justification. 0 No response worthy of credit
What was in this paper
The subtopics covered by these 10 questions, and how many questions each got. Open one in a new tab to see every Cambridge question on it.
What you needed in this session
Cambridge’s own grade thresholds for 2023 Oct/Nov, Paper 2 · Variant 3. A higher threshold means an easier paper — the bar moves with how the cohort did.