Cambridge A Level Psychology (from 2018) 9990 — 2021 May/June Paper 2 · Variant 2
9990/22/M/J/21 · 10 questions · 60 marks · ≈68 min
The question paper and its mark scheme, free to read here and free to download. This is Cambridge’s own paper, exactly as it was sat.
Question paper12 pages
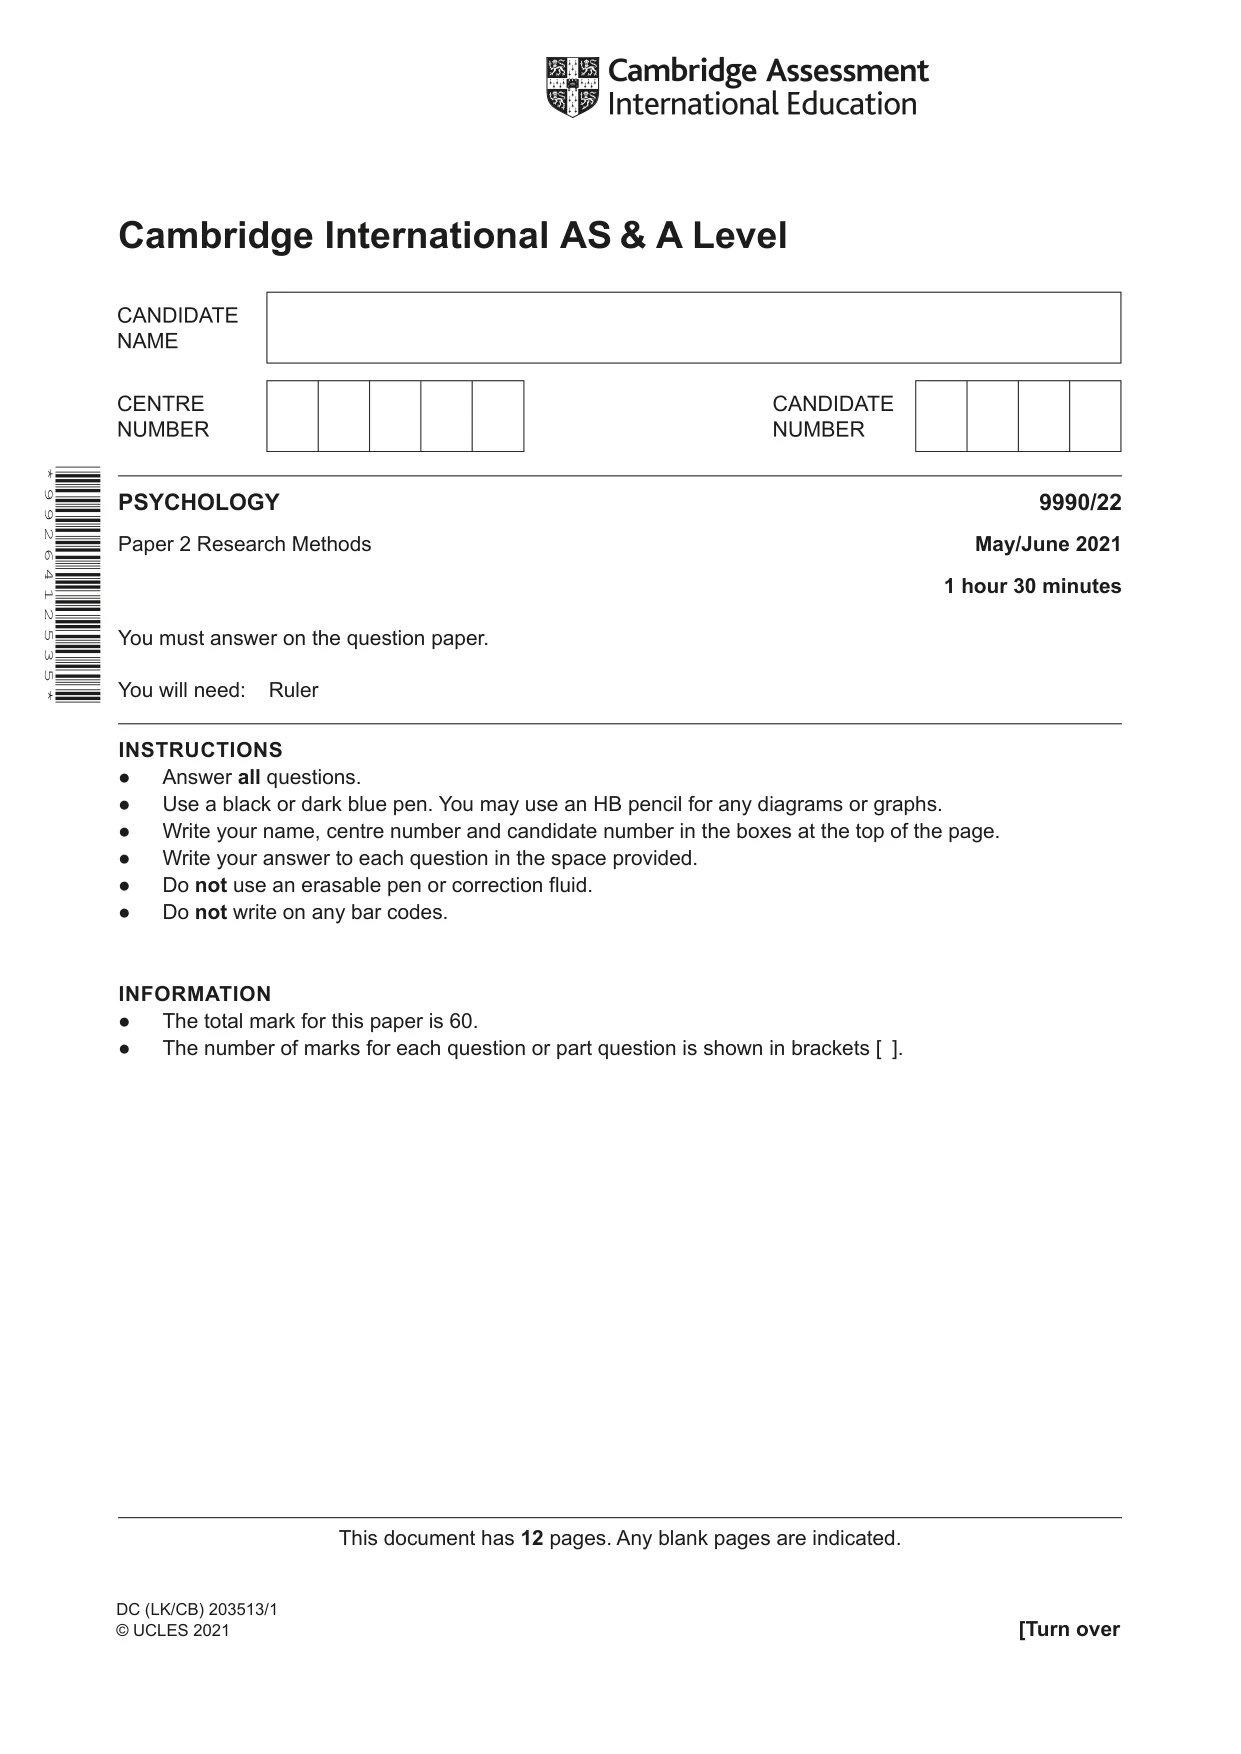


Mark scheme15 pages
Answers below. Sit the paper first if you are practising.

Questions as text
Q1 · State what is meant by an ‘open question’
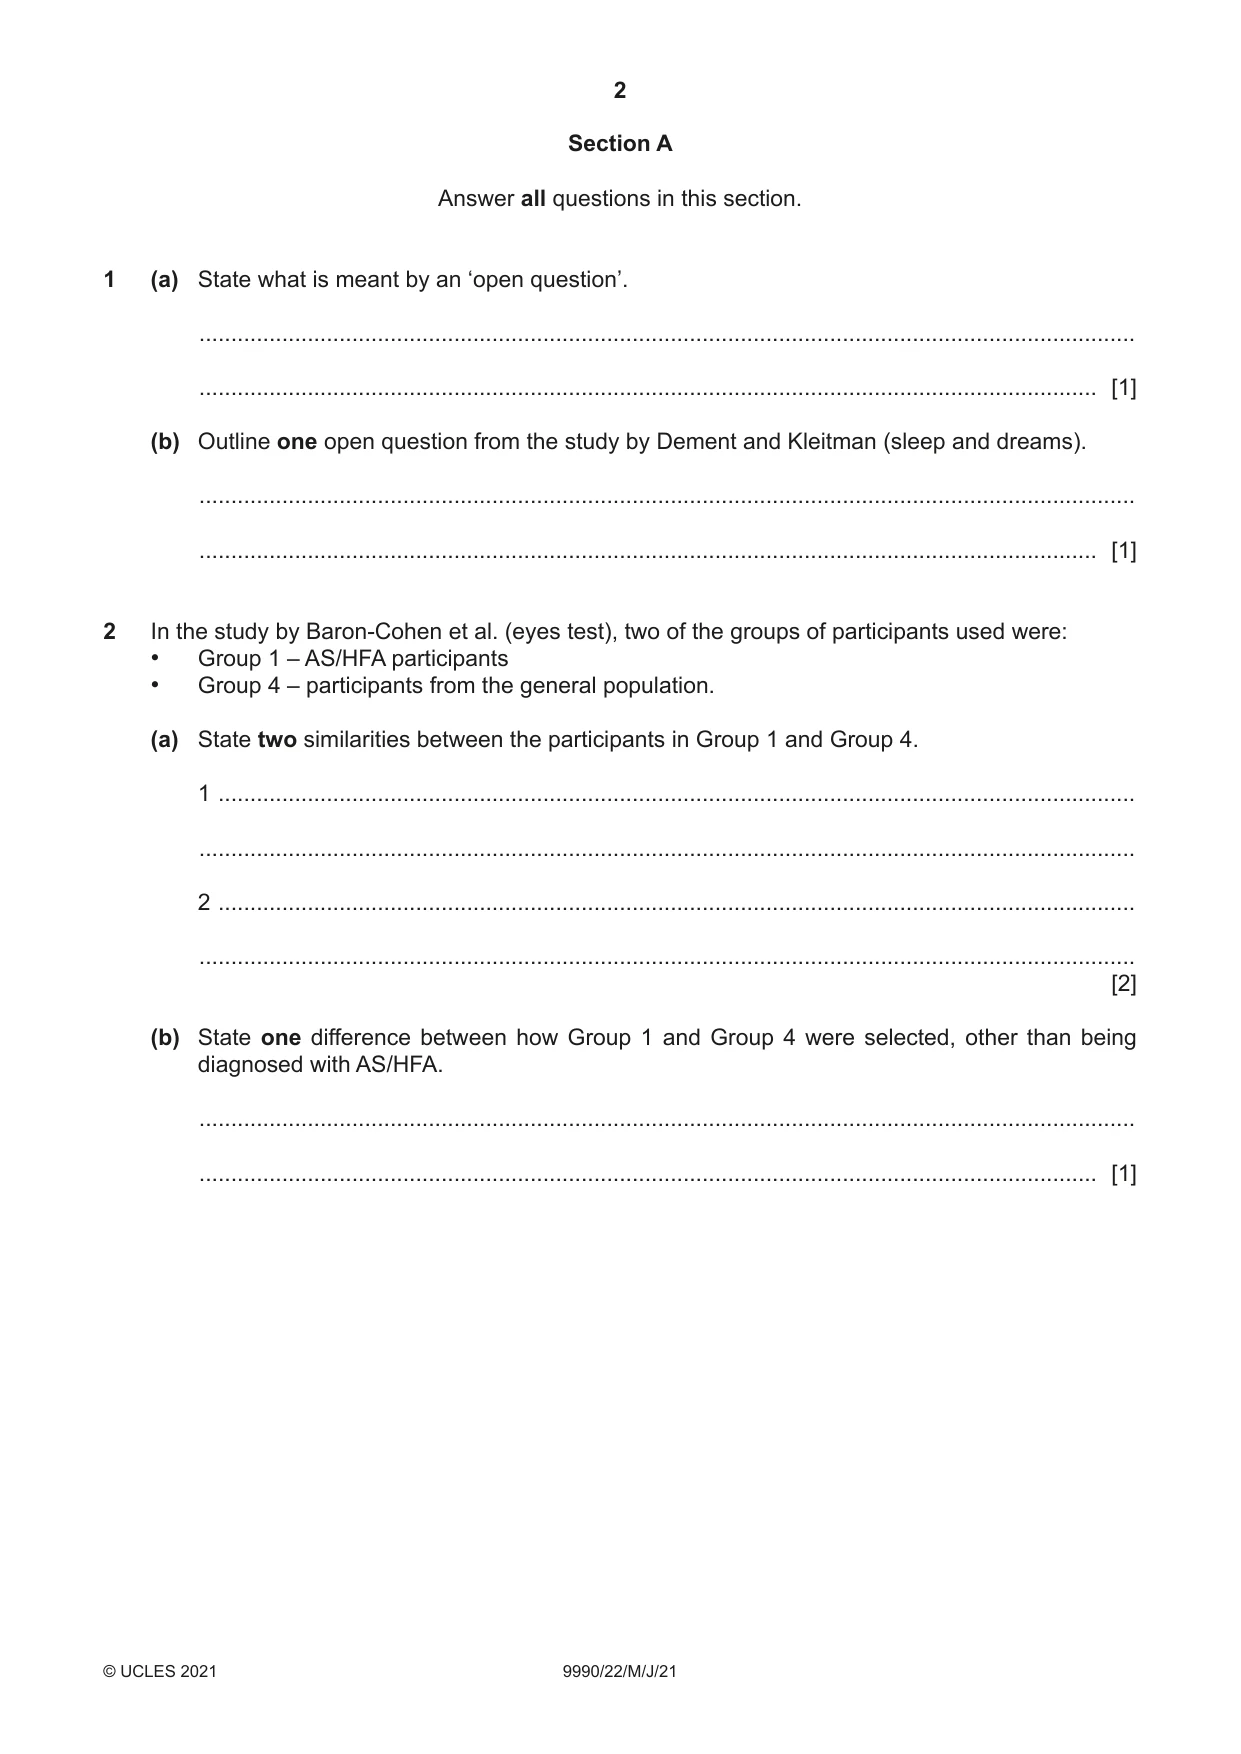
1 (a) State what is meant by an ‘open question’. ................................................................................................................................................... ............................................................................................................................................. [1] (b) Outline one open question from the study by Dement and Kleitman (sleep and dreams). ................................................................................................................................................... ............................................................................................................................................. [1]
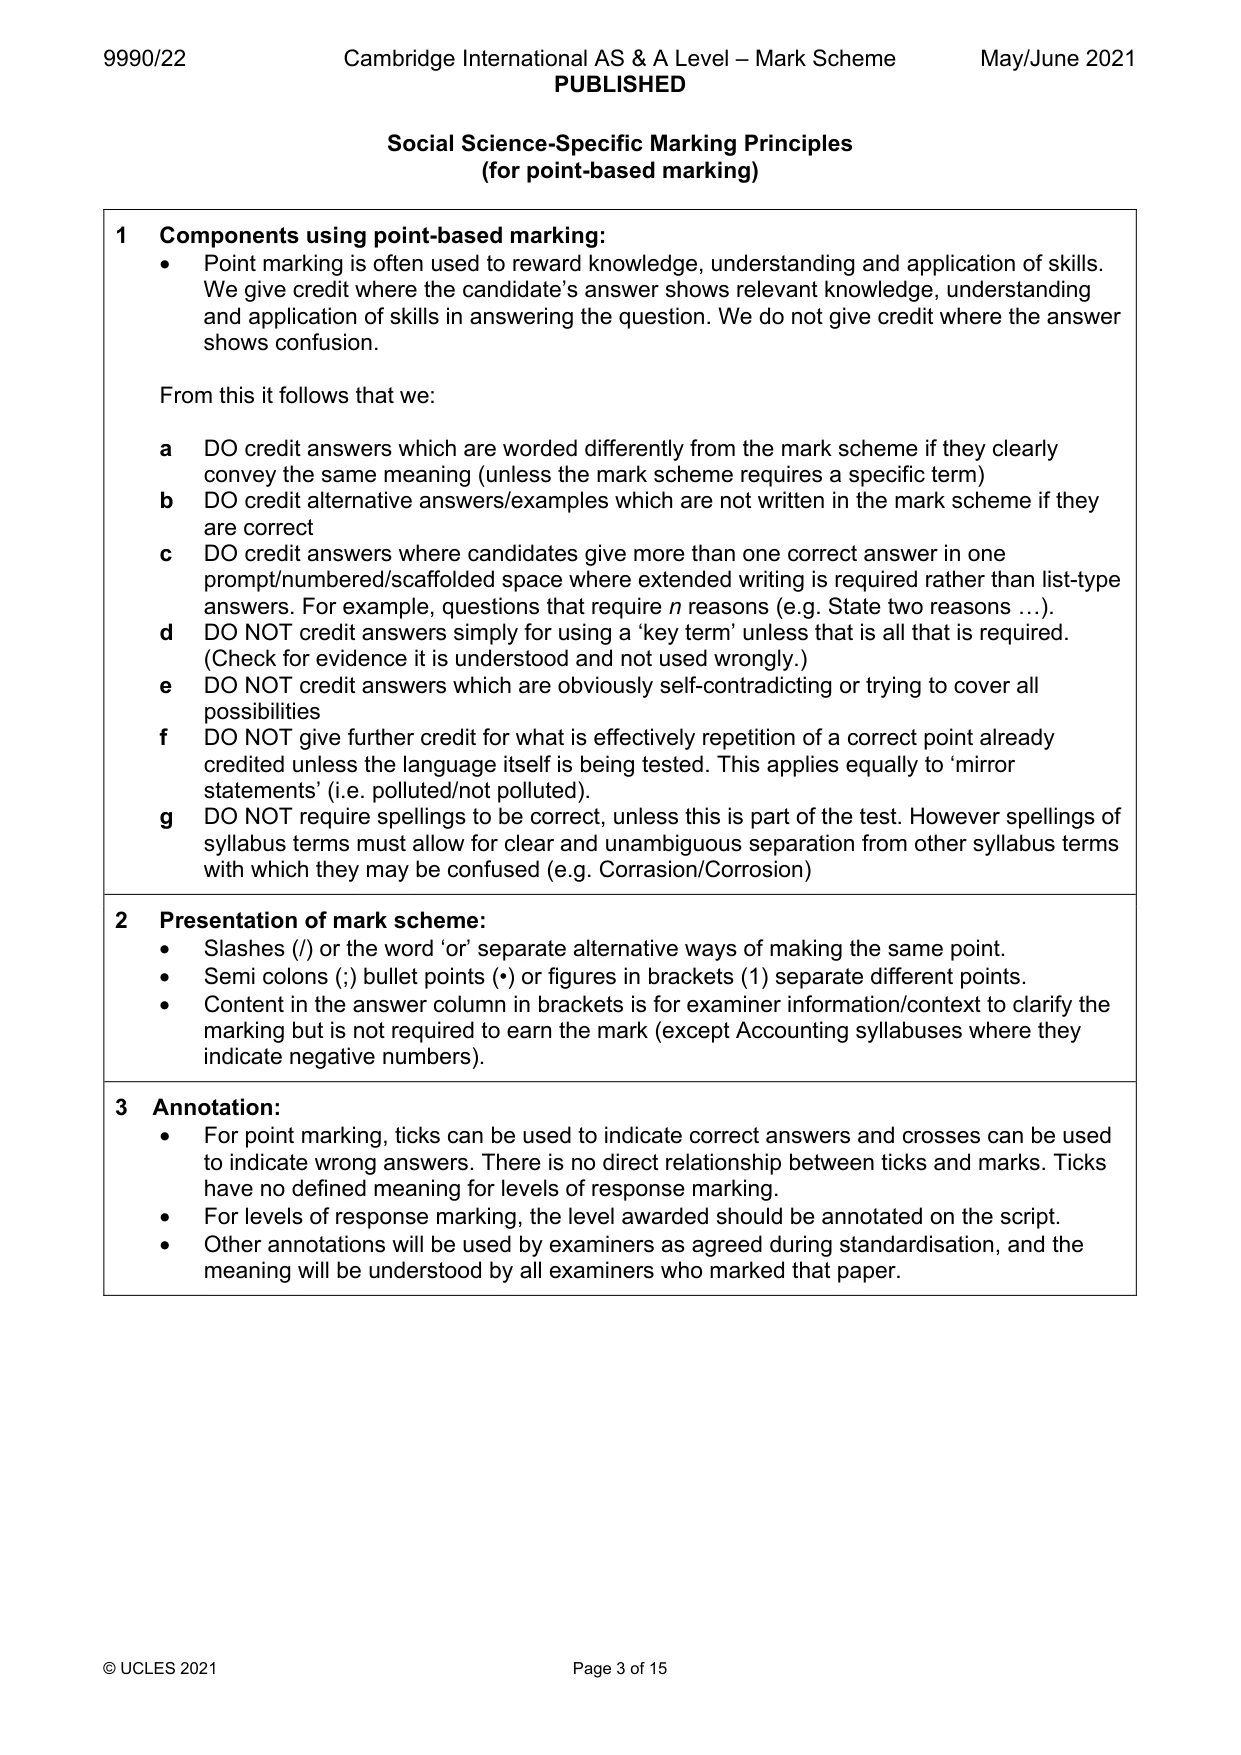
Mark scheme: Question Answer Marks 1(a) State what is meant by an ‘open question’. 1 1 mark for definition (questionnaire, interview or test) items that produce qualitative data; Questions allowing participants give answers in full / detailed / in depth; Questions with (no categories or choices so participants have) freedom to express themselves / answer in their own words; Questions that ask ‘describe…’ = 1 Questions that (ask participants to) ‘explain why’ = 1 An open question is not closed = 0 A question without fixed choices = 0 A question without fixed choices that asks participants to describe = 1 1(b) Outline one open question from the study by Dement and Kleitman 1 (sleep and dreams). 1 mark for open question or description of nature of question Dement and Kleitman – Asked to describe their dream (into a tape recorder); However (from Dement and Kleitman): Eg ‘Did you have a dream’ is a closed Q; Reporting ‘5 or 15 minutes’ is a closed Q = 0 marks Did you dream? Yes/No? = 0 Did you dream about: animals, people, food? = 0
Q2 · In the study by Baron-Cohen et al
2 In the study by Baron-Cohen et al. (eyes test), two of the groups of participants used were: • Group 1 – AS/HFA participants • Group 4 – participants from the general population. (a) State two similarities between the participants in Group 1 and Group 4. 1 ................................................................................................................................................ ................................................................................................................................................... 2 ................................................................................................................................................ ................................................................................................................................................... [2] (b) State one difference between how Group 1 and Group 4 were selected, other than being diagnosed with AS/HFA. ................................................................................................................................................... ............................................................................................................................................. [1]
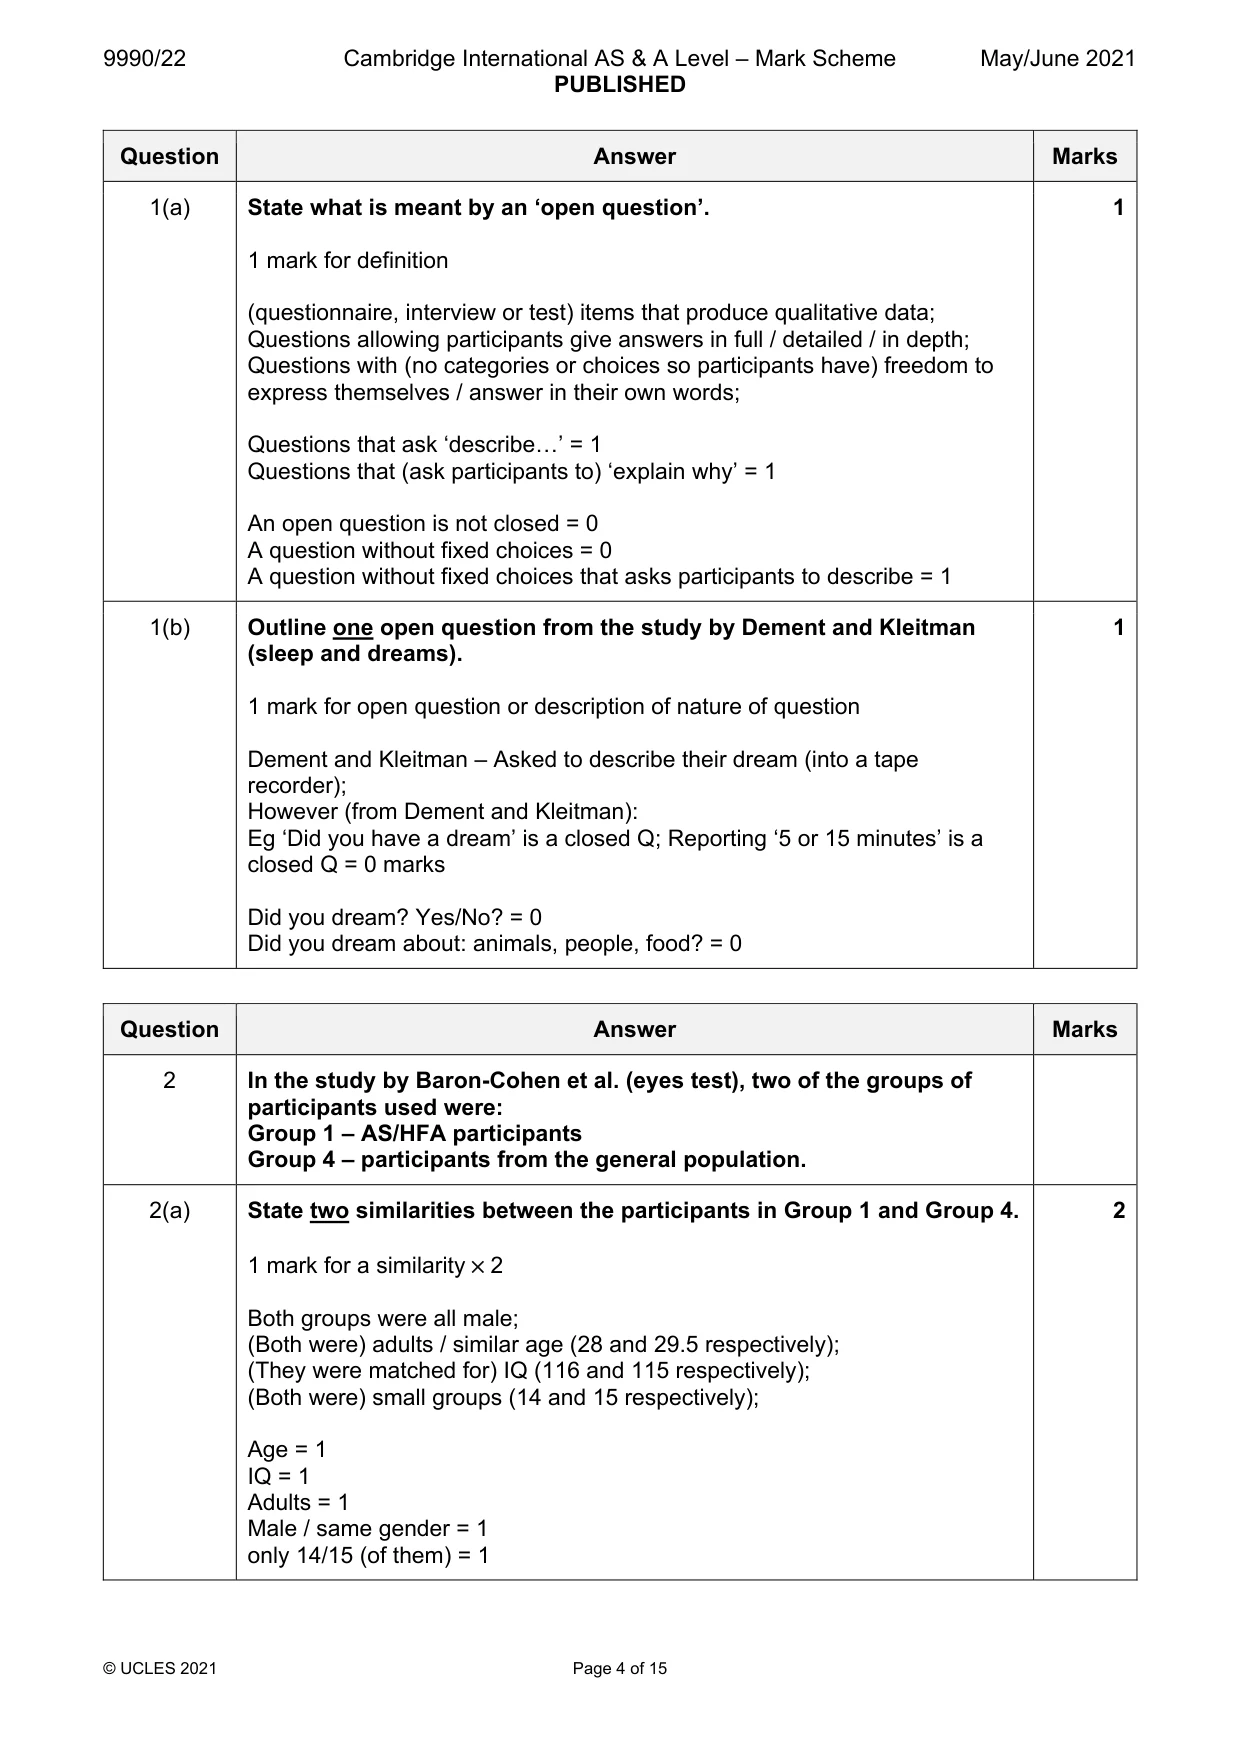
Mark scheme: 2 In the study by Baron-Cohen et al. (eyes test), two of the groups of participants used were: Group 1 – AS/HFA participants Group 4 – participants from the general population. 2(a) State two similarities between the participants in Group 1 and Group 4. 2 1 mark for a similarity × 2 Both groups were all male; (Both were) adults / similar age (28 and 29.5 respectively); (They were matched for) IQ (116 and 115 respectively); (Both were) small groups (14 and 15 respectively); Age = 1 IQ = 1 Adults = 1 Male / same gender = 1 only 14/15 (of them) = 1 2(b) State one difference between how Group 1 and Group 4 were selected, 1 other than being diagnosed with AS/HFA. 1 mark for a difference Group 1 were volunteers or self-selected and Group 4 were randomly selected;
Q3 · The study by Piliavin et al
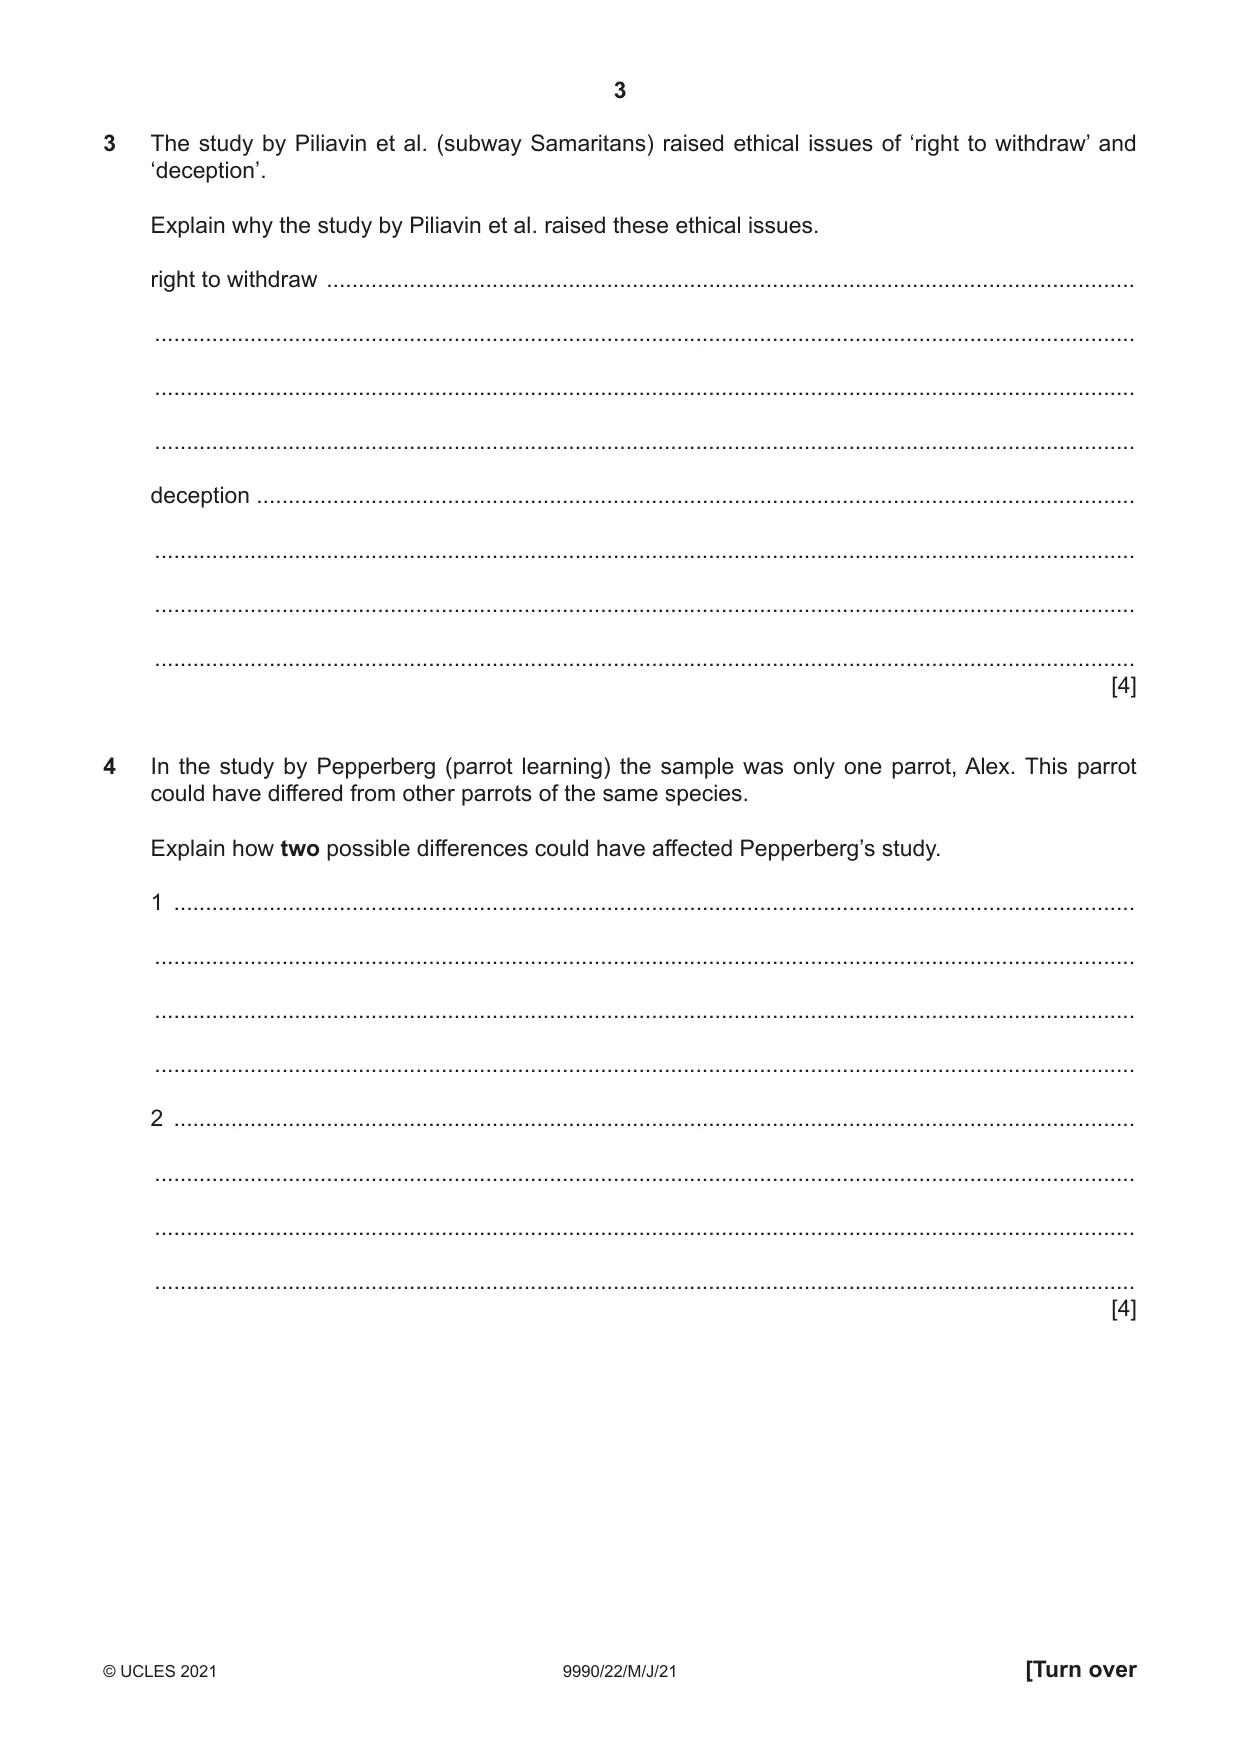
3 The study by Piliavin et al. (subway Samaritans) raised ethical issues of ‘right to withdraw’ and ‘deception’. Explain why the study by Piliavin et al. raised these ethical issues. right to withdraw ............................................................................................................................... .......................................................................................................................................................... .......................................................................................................................................................... .......................................................................................................................................................... deception .......................................................................................................................................... .......................................................................................................................................................... .......................................................................................................................................................... .......................................................................................................................................................... [4]
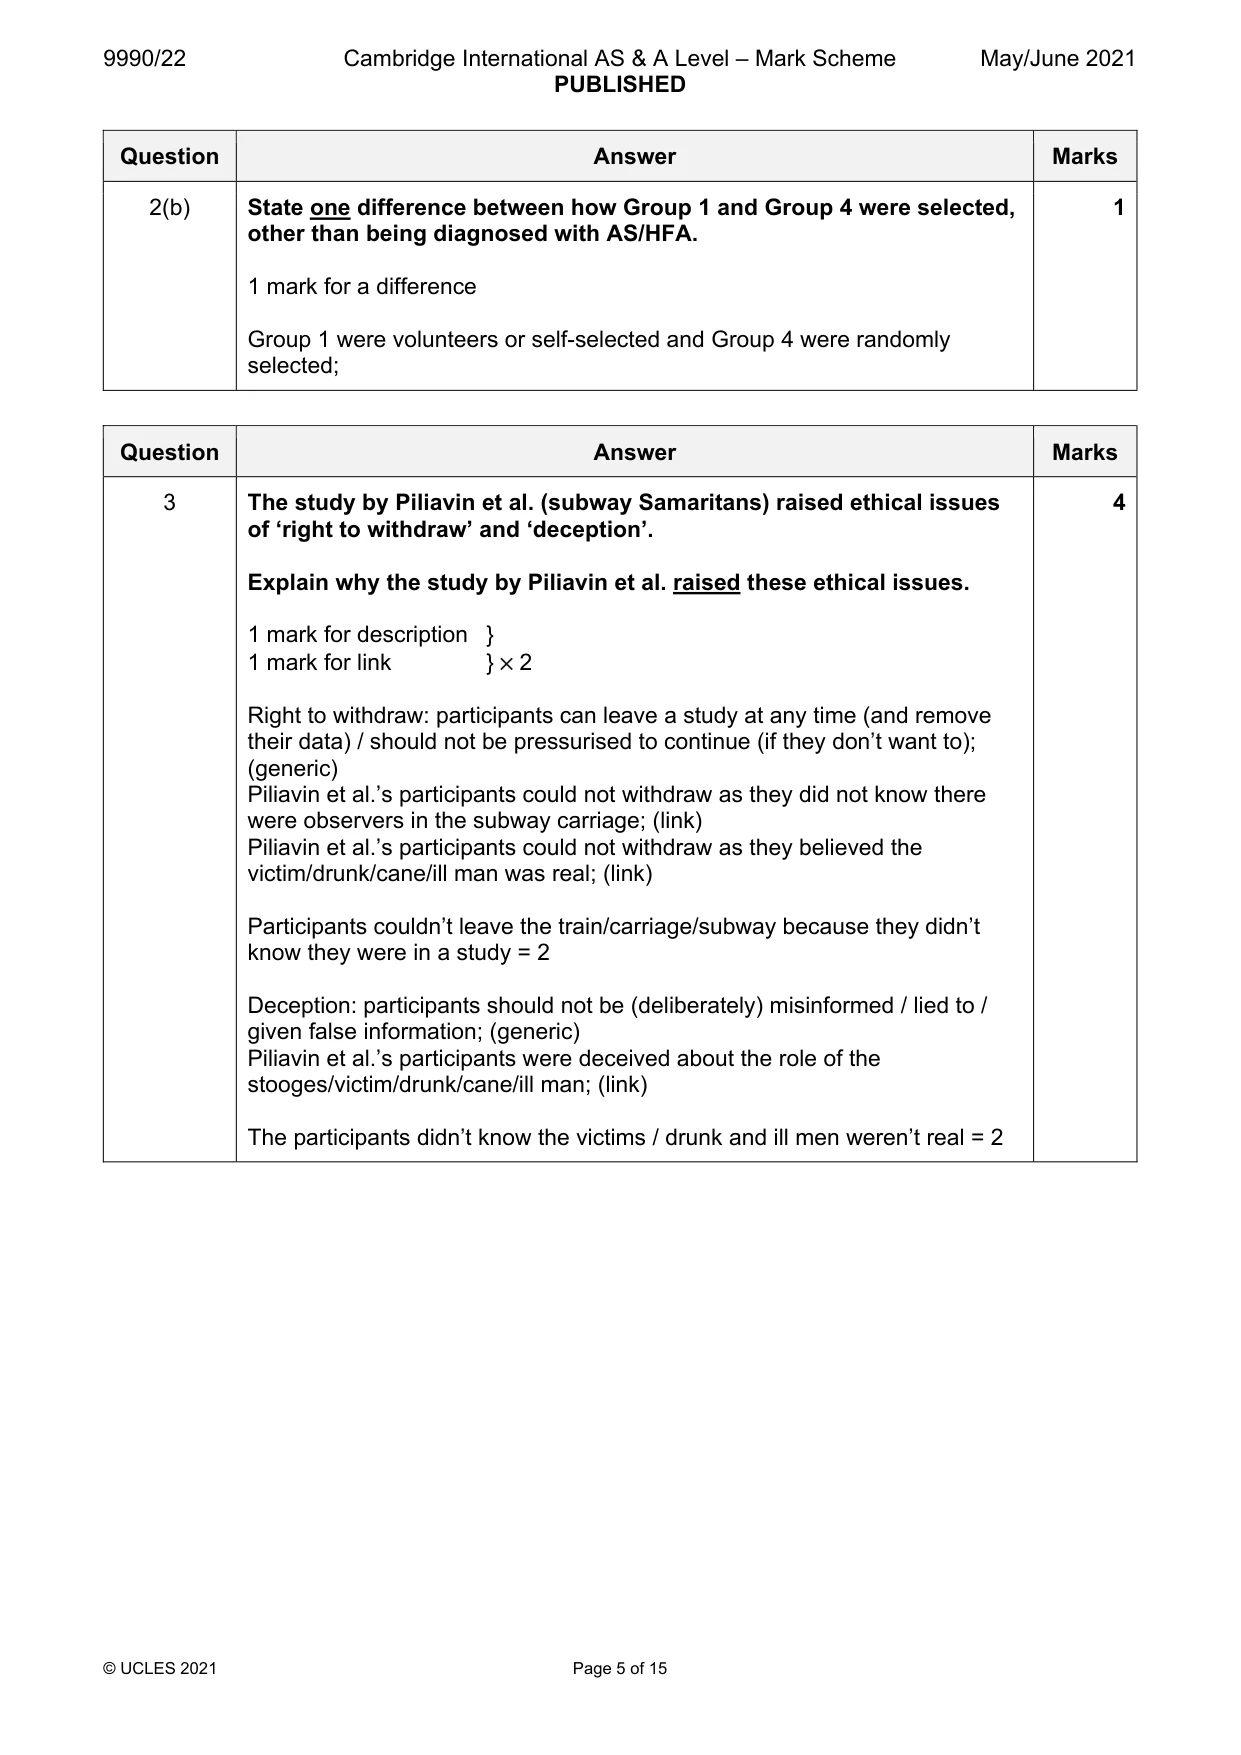
Mark scheme: 3 The study by Piliavin et al. (subway Samaritans) raised ethical issues 4 of ‘right to withdraw’ and ‘deception’. Explain why the study by Piliavin et al. raised these ethical issues. 1 mark for description } 1 mark for link } × 2 Right to withdraw: participants can leave a study at any time (and remove their data) / should not be pressurised to continue (if they don’t want to); (generic) Piliavin et al.’s participants could not withdraw as they did not know there were observers in the subway carriage; (link) Piliavin et al.’s participants could not withdraw as they believed the victim/drunk/cane/ill man was real; (link) Participants couldn’t leave the train/carriage/subway because they didn’t know they were in a study = 2 Deception: participants should not be (deliberately) misinformed / lied to / given false information; (generic) Piliavin et al.’s participants were deceived about the role of the stooges/victim/drunk/cane/ill man; (link) The participants didn’t know the victims / drunk and ill men weren’t real = 2
Q4 · In the study by Pepperberg (parrot learning) the sample was only one parrot, Alex
4 In the study by Pepperberg (parrot learning) the sample was only one parrot, Alex. This parrot could have differed from other parrots of the same species. Explain how two possible differences could have affected Pepperberg’s study. 1 ....................................................................................................................................................... .......................................................................................................................................................... .......................................................................................................................................................... .......................................................................................................................................................... 2 ....................................................................................................................................................... .......................................................................................................................................................... .......................................................................................................................................................... .......................................................................................................................................................... [4]
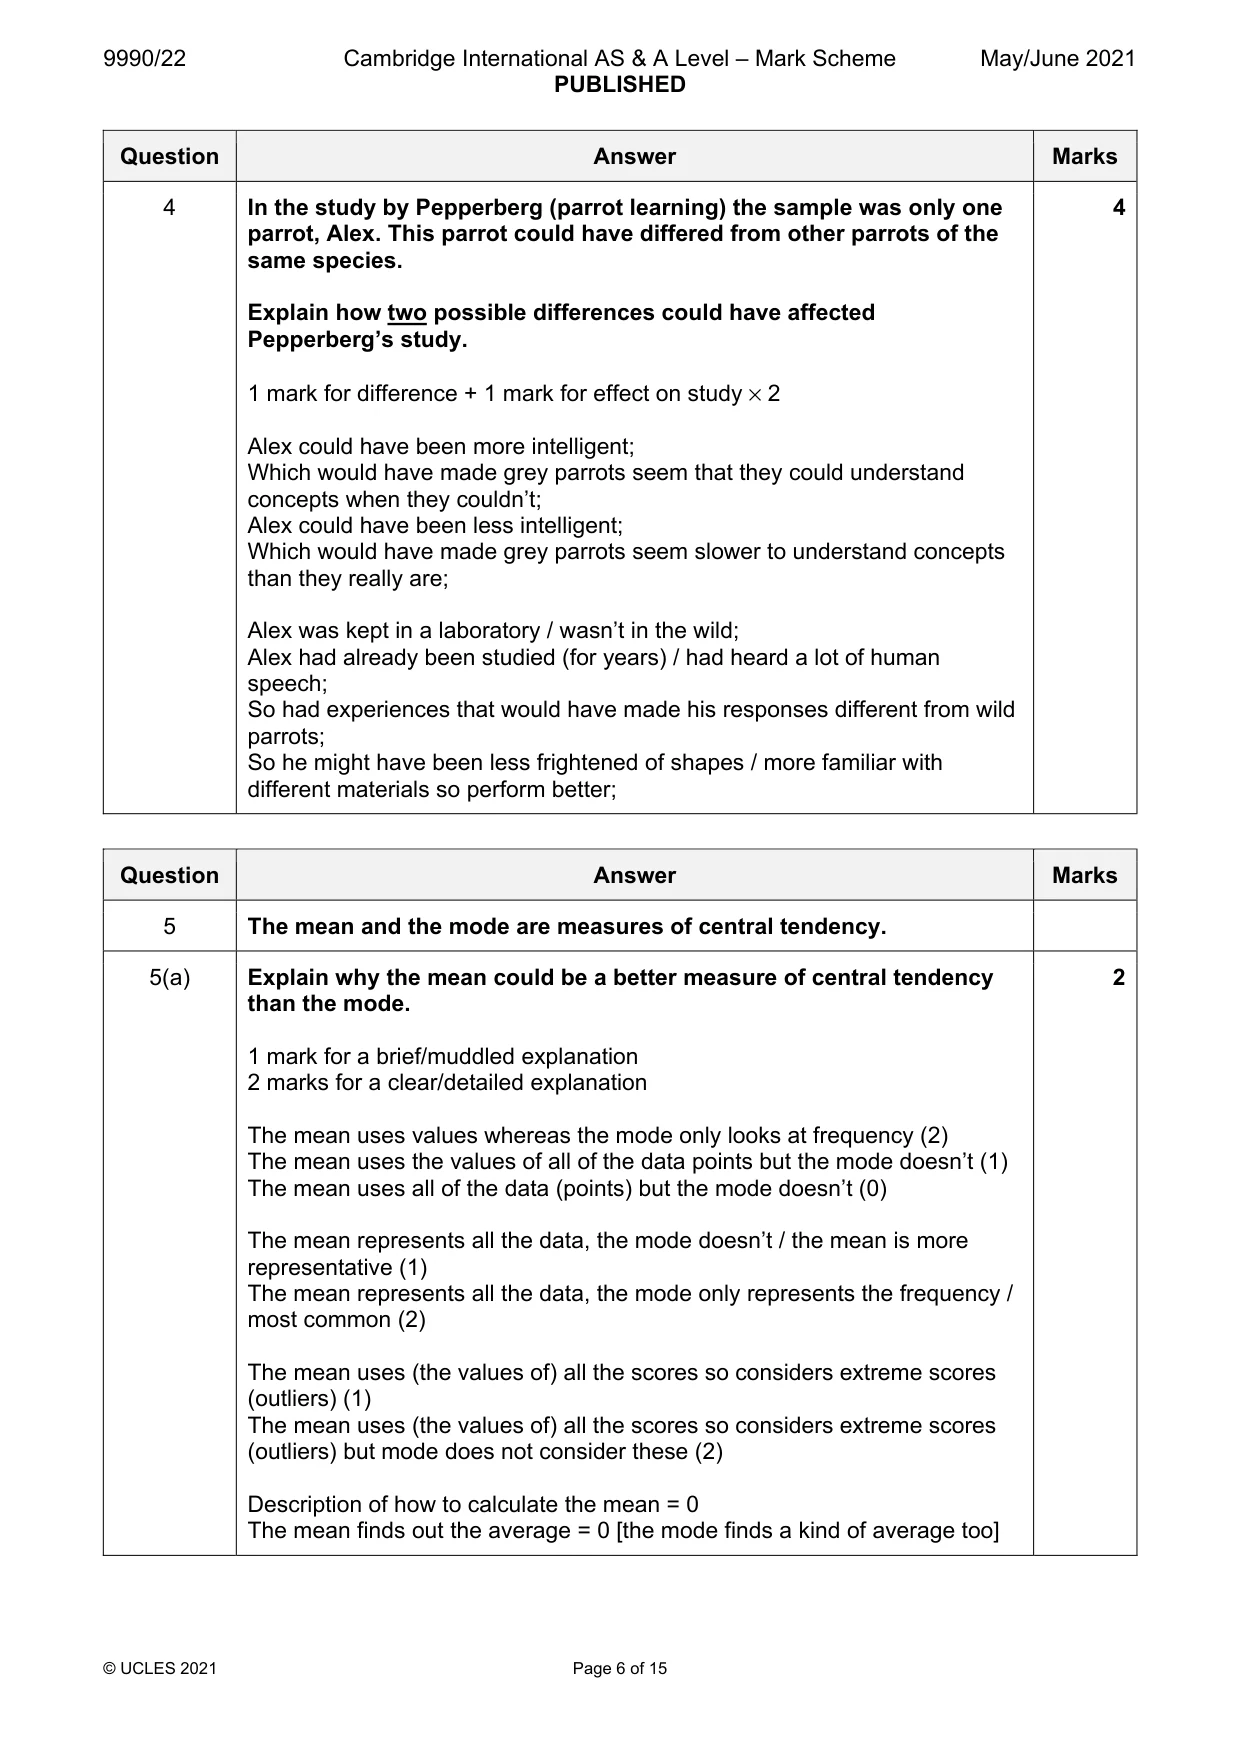
Mark scheme: 4 In the study by Pepperberg (parrot learning) the sample was only one 4 parrot, Alex. This parrot could have differed from other parrots of the same species. Explain how two possible differences could have affected Pepperberg’s study. 1 mark for difference + 1 mark for effect on study × 2 Alex could have been more intelligent; Which would have made grey parrots seem that they could understand concepts when they couldn’t; Alex could have been less intelligent; Which would have made grey parrots seem slower to understand concepts than they really are; Alex was kept in a laboratory / wasn’t in the wild; Alex had already been studied (for years) / had heard a lot of human speech; So had experiences that would have made his responses different from wild parrots; So he might have been less frightened of shapes / more familiar with different materials so perform better;
Q5 · The mean and the mode are measures of central tendency
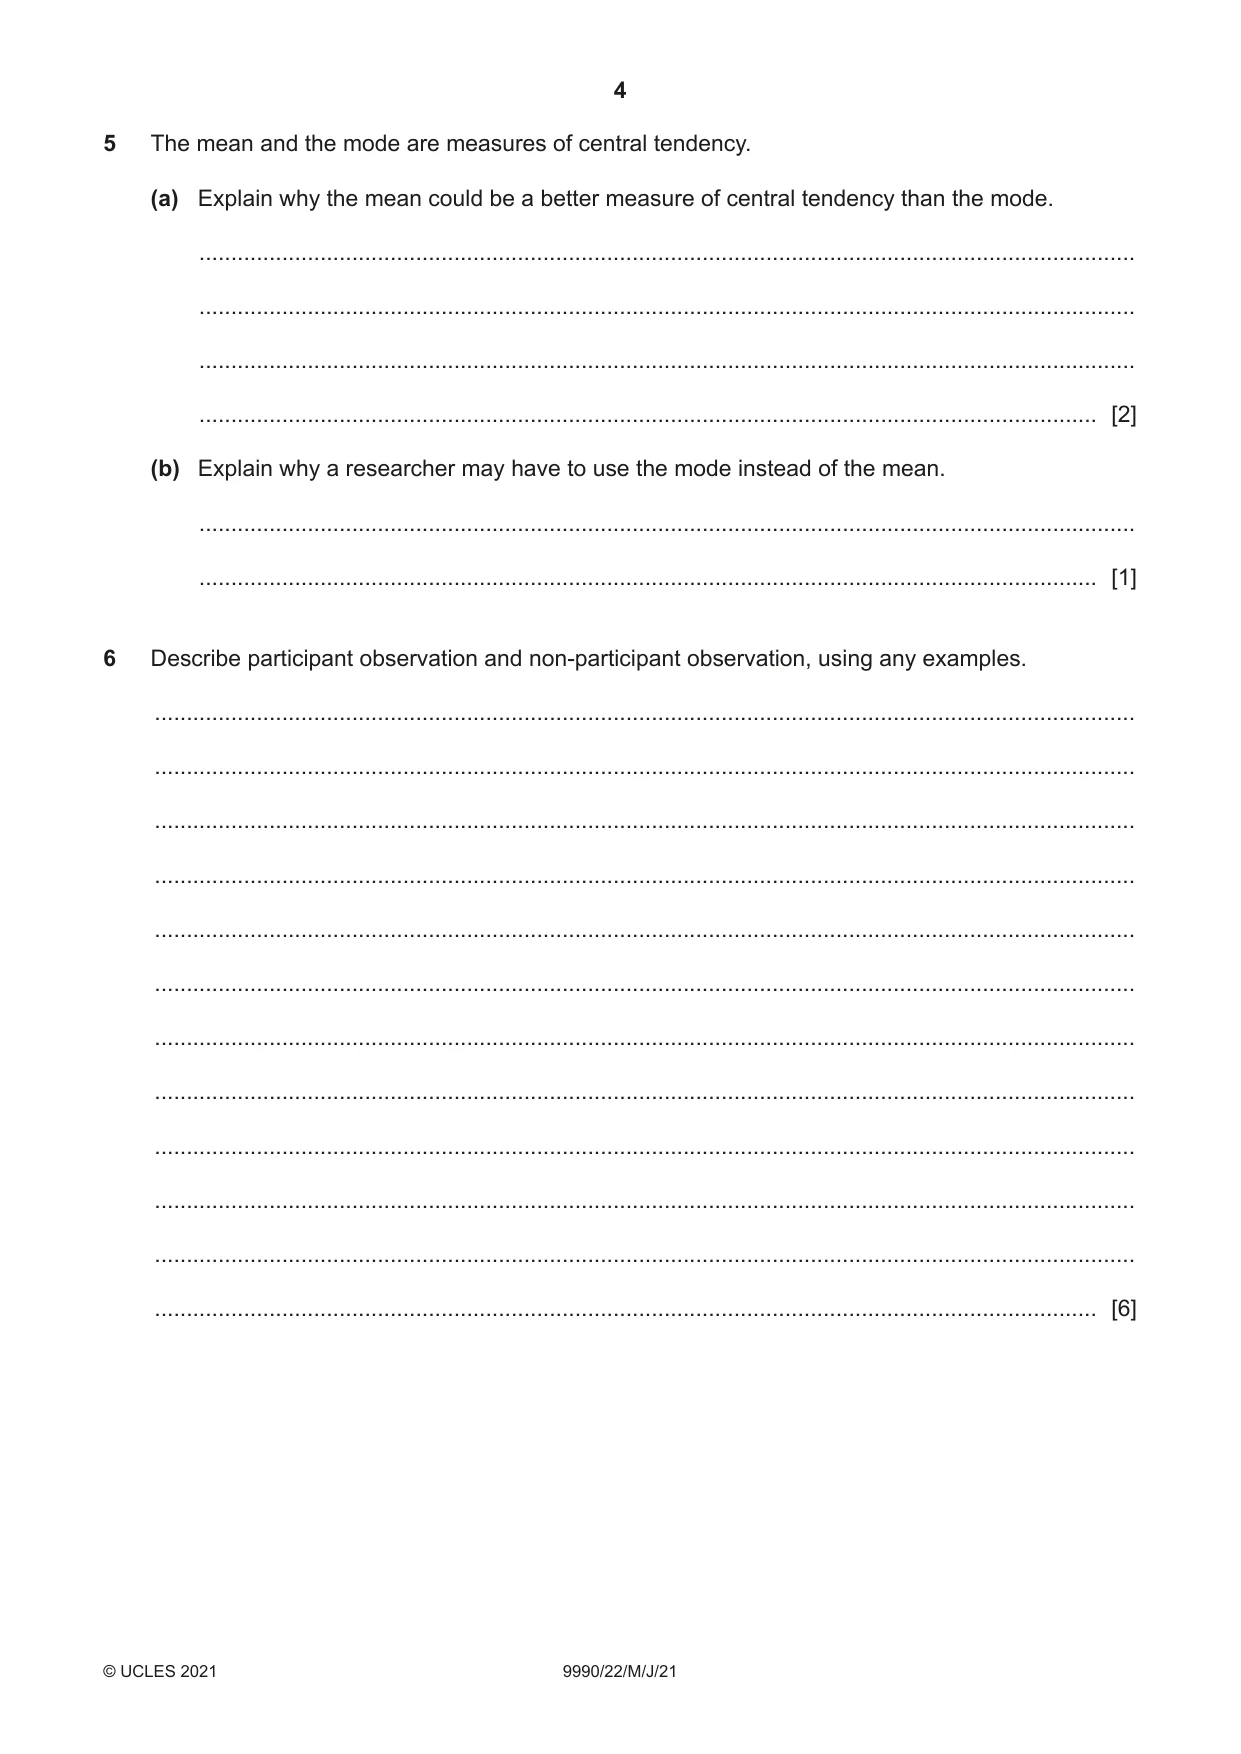
5 The mean and the mode are measures of central tendency. (a) Explain why the mean could be a better measure of central tendency than the mode. ................................................................................................................................................... ................................................................................................................................................... ................................................................................................................................................... ............................................................................................................................................. [2] (b) Explain why a researcher may have to use the mode instead of the mean. ................................................................................................................................................... ............................................................................................................................................. [1]
Mark scheme: 5 The mean and the mode are measures of central tendency. 5(a) Explain why the mean could be a better measure of central tendency 2 than the mode. 1 mark for a brief/muddled explanation 2 marks for a clear/detailed explanation The mean uses values whereas the mode only looks at frequency (2) The mean uses the values of all of the data points but the mode doesn’t (1) The mean uses all of the data (points) but the mode doesn’t (0) The mean represents all the data, the mode doesn’t / the mean is more representative (1) The mean represents all the data, the mode only represents the frequency / most common (2) The mean uses (the values of) all the scores so considers extreme scores (outliers) (1) The mean uses (the values of) all the scores so considers extreme scores (outliers) but mode does not consider these (2) Description of how to calculate the mean = 0 The mean finds out the average = 0 [the mode finds a kind of average too] 5(b) Explain why a researcher may have to use the mode instead of the 1 mean. 1 mark for explanation When data is nominal / is in categories / is only totals / comes from yes or no (closed) questions / not on a continuous scale; To reduce the influence of outliers;
Q6 · Describe participant observation and non-participant observation, using any examples
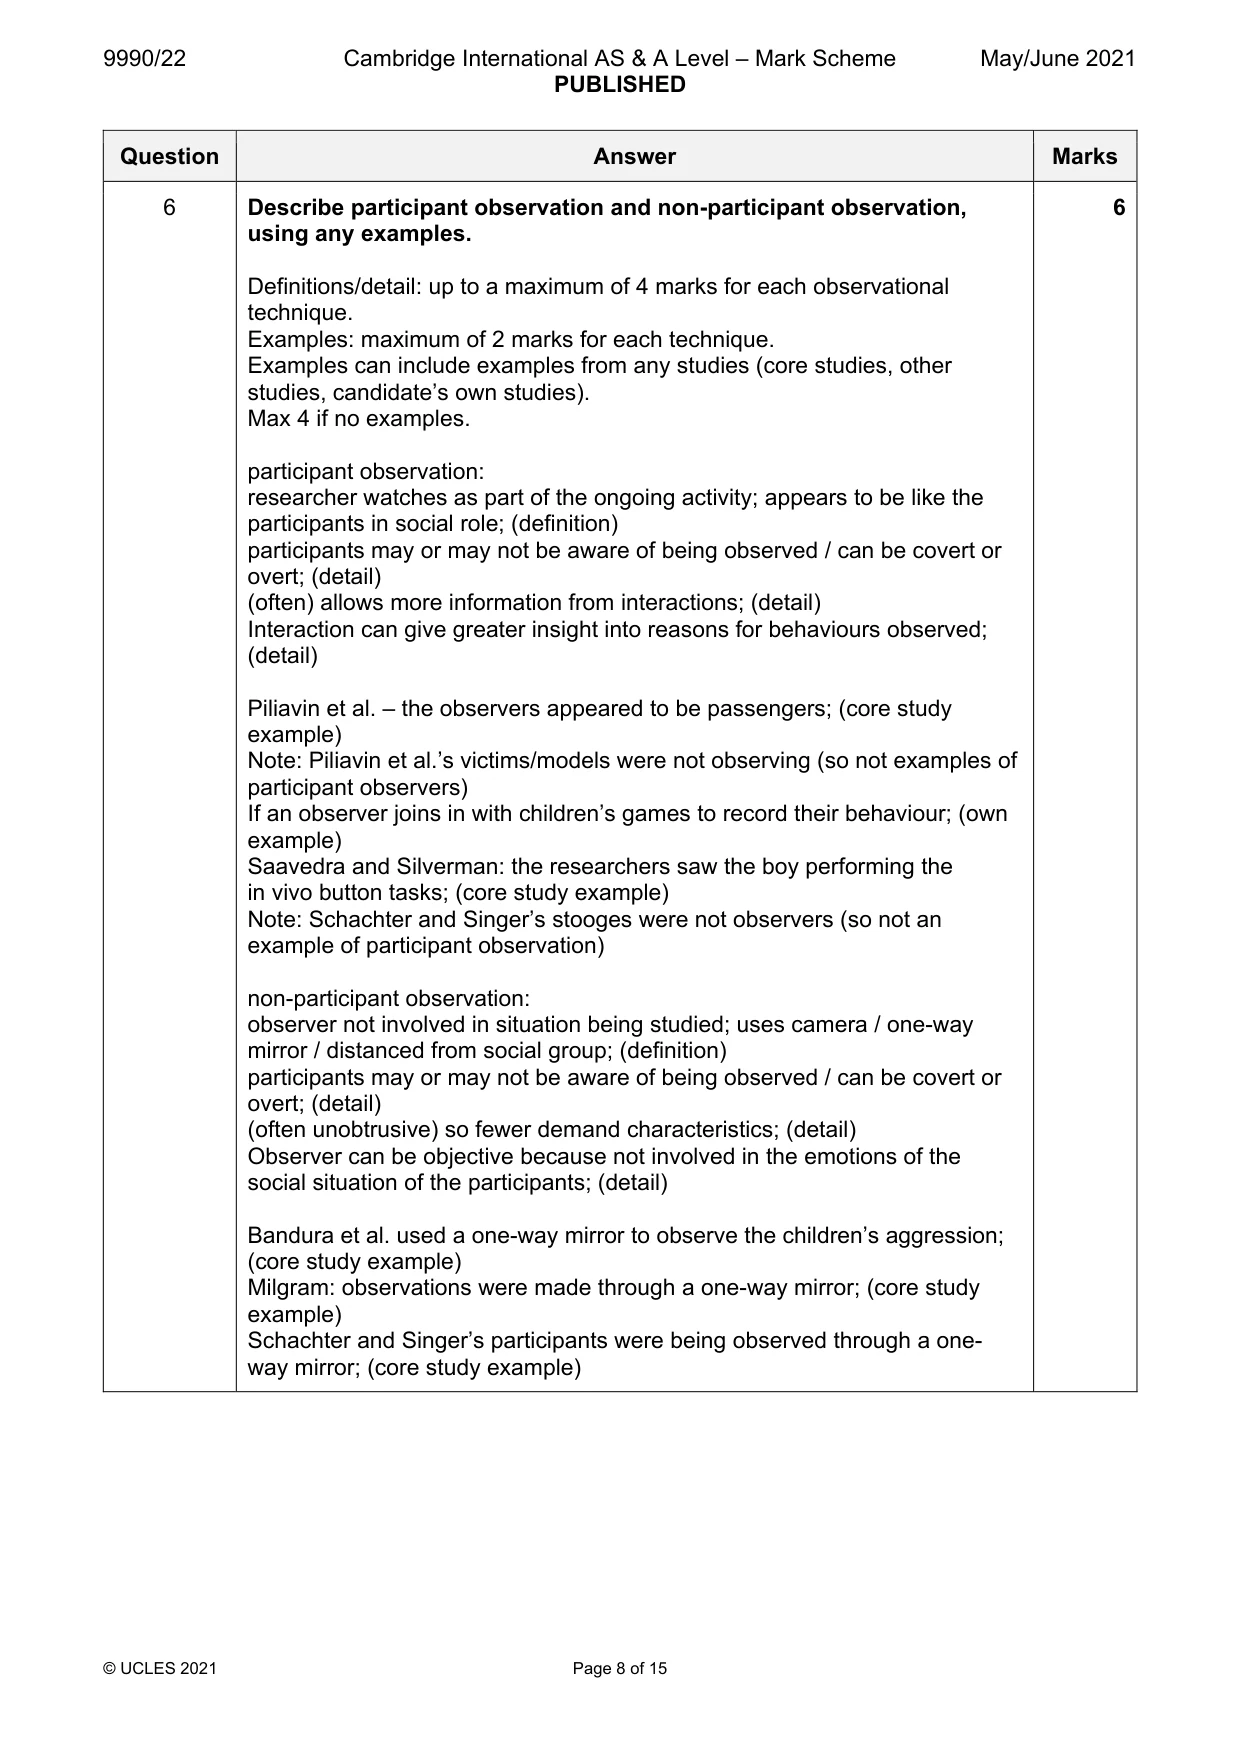
6 Describe participant observation and non-participant observation, using any examples. .......................................................................................................................................................... .......................................................................................................................................................... .......................................................................................................................................................... .......................................................................................................................................................... .......................................................................................................................................................... .......................................................................................................................................................... .......................................................................................................................................................... .......................................................................................................................................................... .......................................................................................................................................................... .......................................................................................................................................................... .......................................................................................................................................................... .................................................................................................................................................... [6]
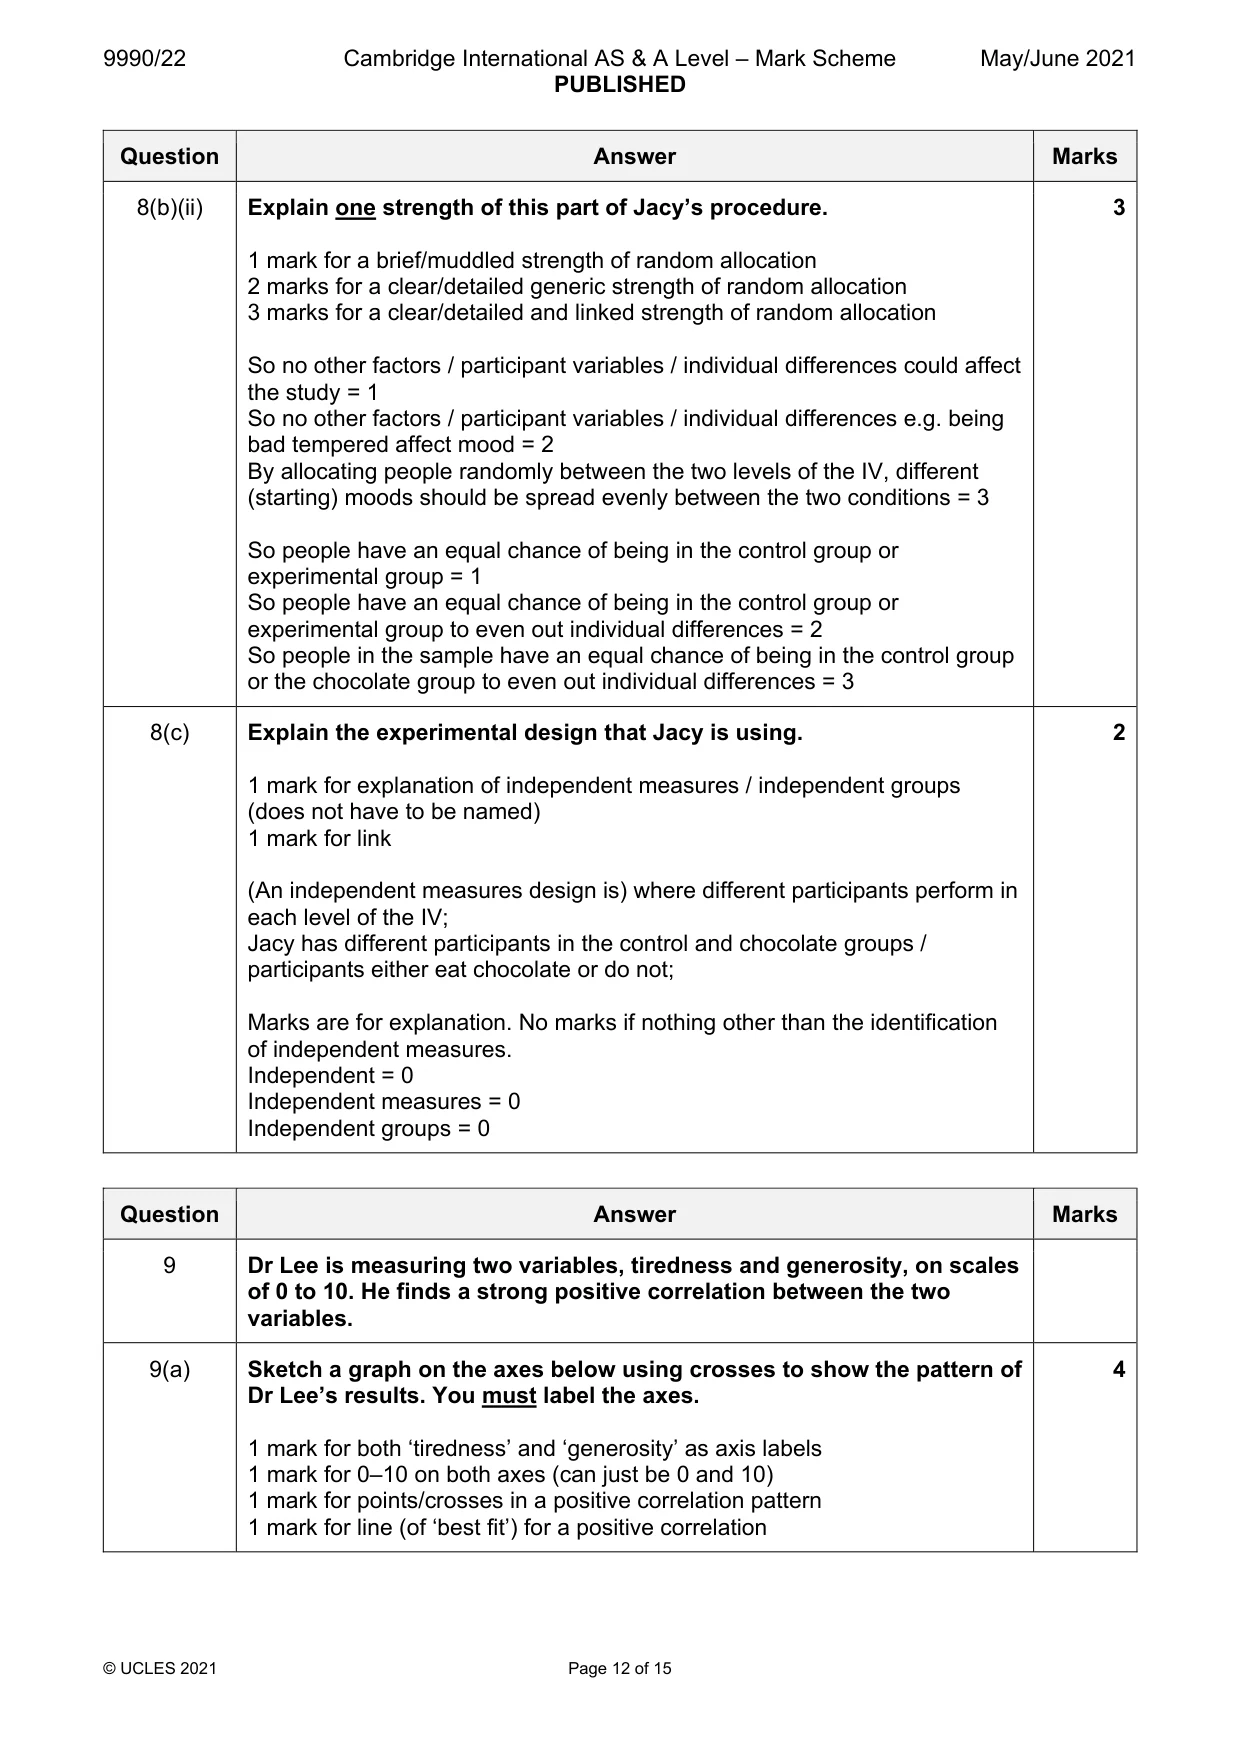
Mark scheme: 6 Describe participant observation and non-participant observation, 6 using any examples. Definitions/detail: up to a maximum of 4 marks for each observational technique. Examples: maximum of 2 marks for each technique. Examples can include examples from any studies (core studies, other studies, candidate’s own studies). Max 4 if no examples. participant observation: researcher watches as part of the ongoing activity; appears to be like the participants in social role; (definition) participants may or may not be aware of being observed / can be covert or overt; (detail) (often) allows more information from interactions; (detail) Interaction can give greater insight into reasons for behaviours observed; (detail) Piliavin et al. – the observers appeared to be passengers; (core study example) Note: Piliavin et al.’s victims/models were not observing (so not examples of participant observers) If an observer joins in with children’s games to record their behaviour; (own example) Saavedra and Silverman: the researchers saw the boy performing the in vivo button tasks; (core study example) Note: Schachter and Singer’s stooges were not observers (so not an example of participant observation) non-participant observation: observer not involved in situation being studied; uses camera / one-way mirror / distanced from social group; (definition) participants may or may not be aware of being observed / can be covert or overt; (detail) (often unobtrusive) so fewer demand characteristics; (detail) Observer can be objective because not involved in the emotions of the social situation of the participants; (detail) Bandura et al. used a one-way mirror to observe the children’s aggression; (core study example) Milgram: observations were made through a one-way mirror; (core study example) Schachter and Singer’s participants were being observed through a one- way mirror; (core study example)
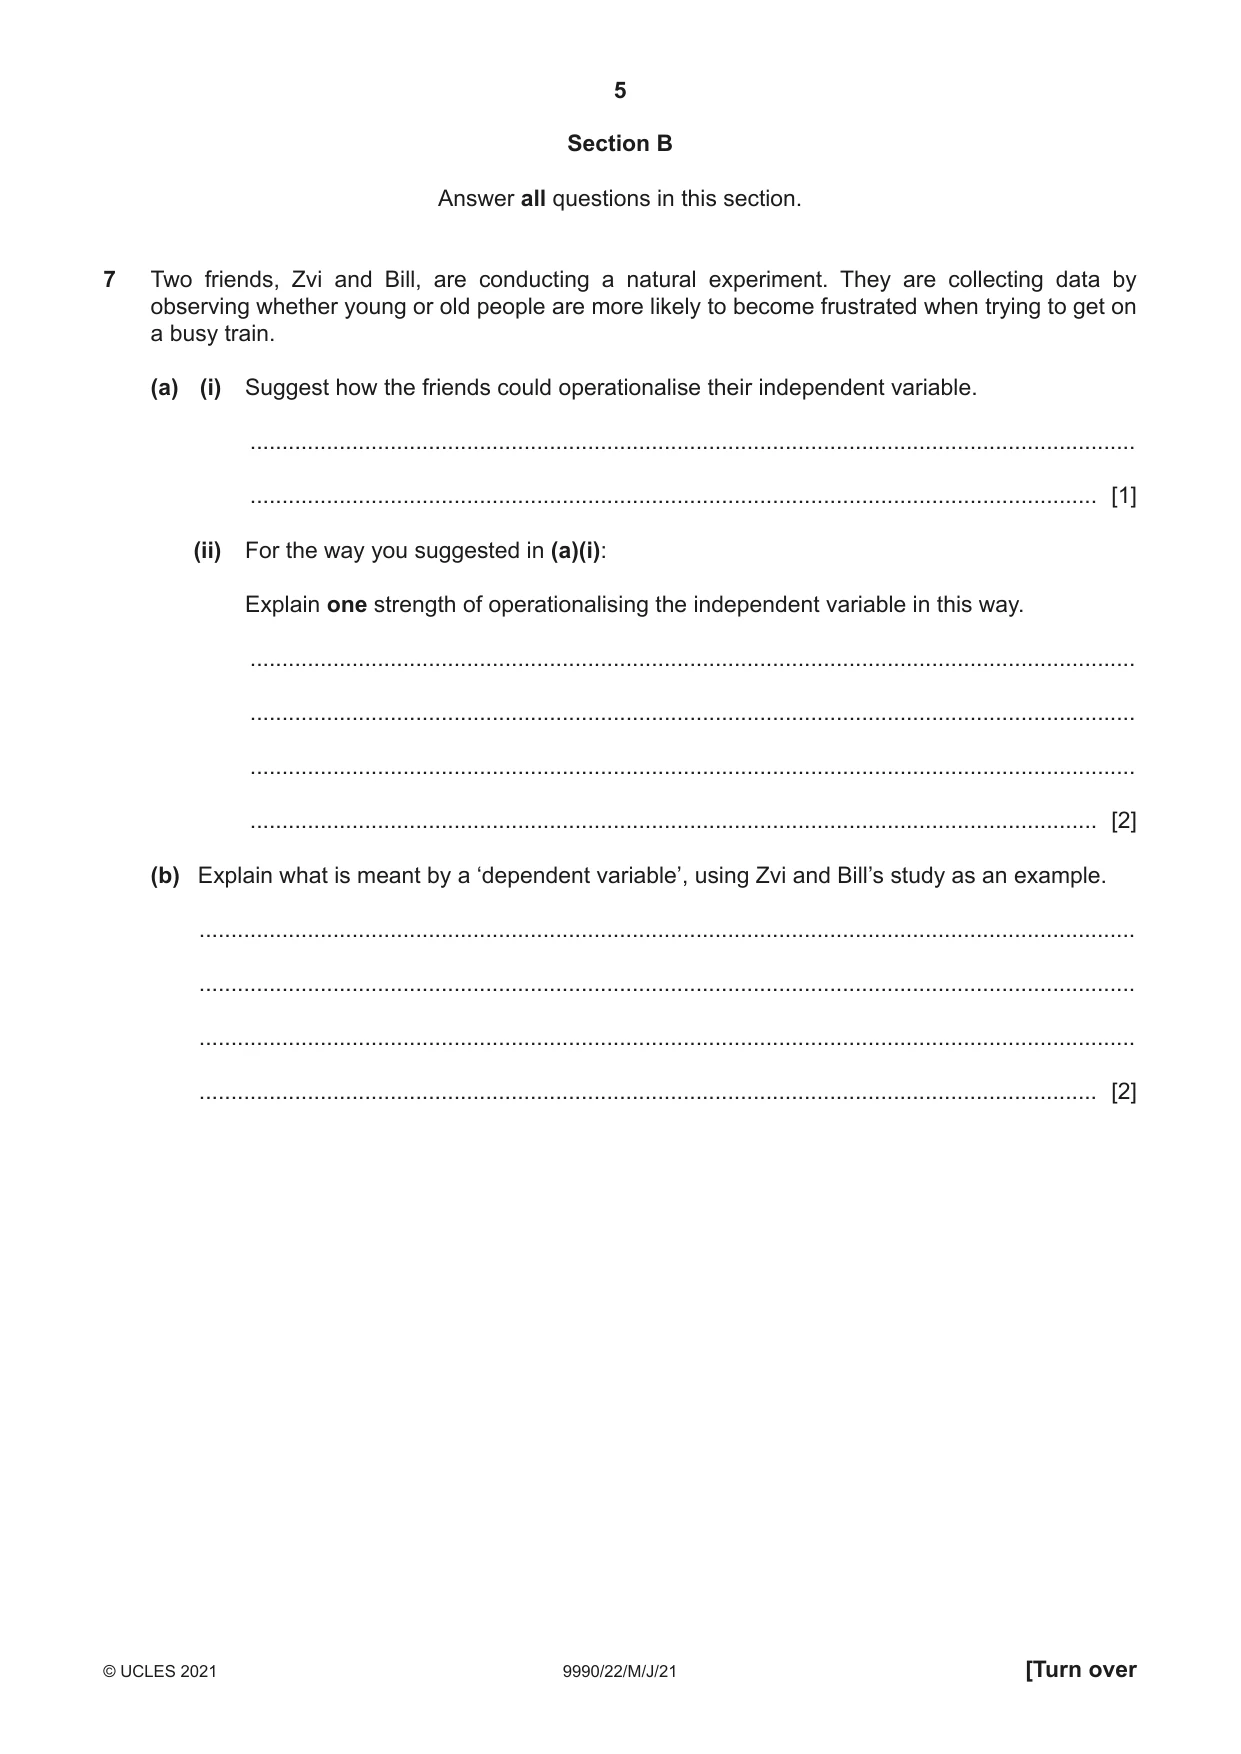
Q7 · Two friends, Zvi and Bill, are conducting a natural experiment
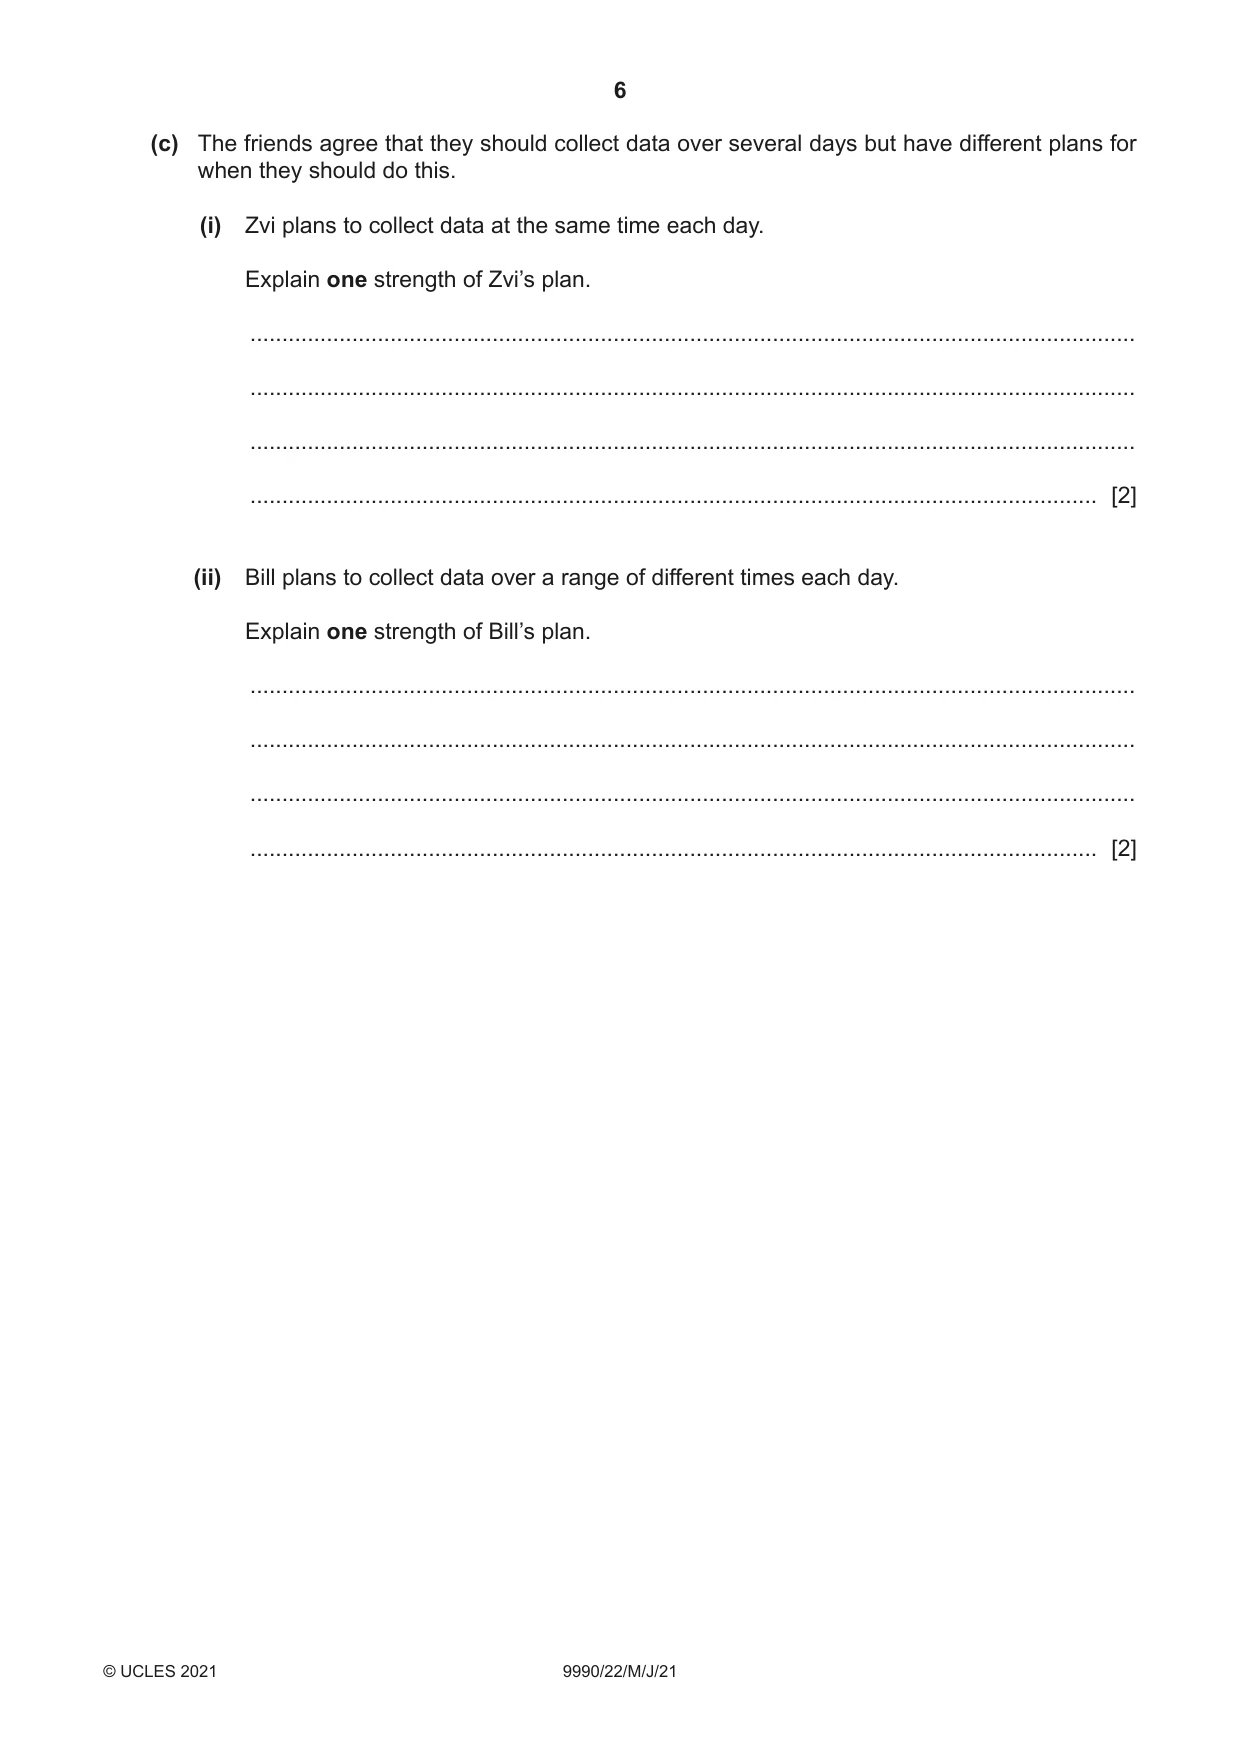
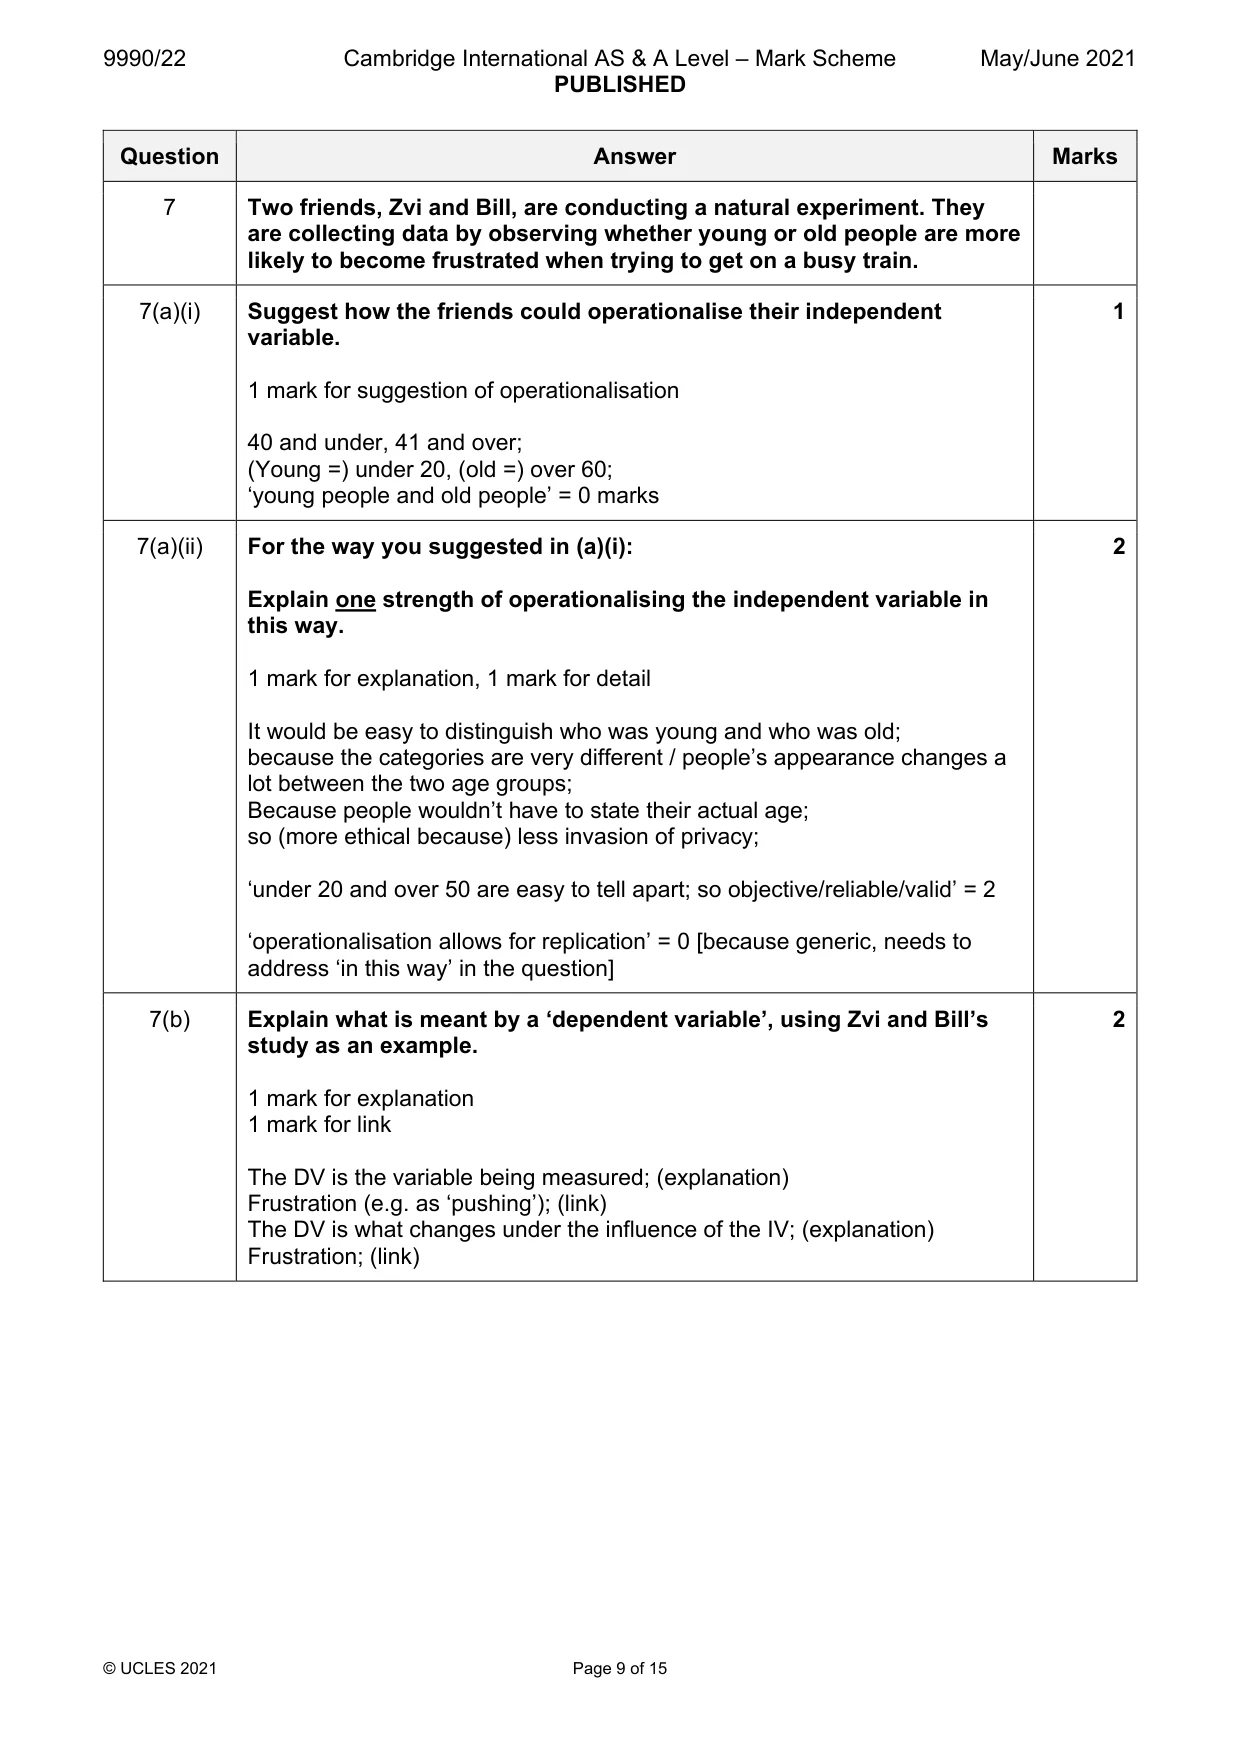
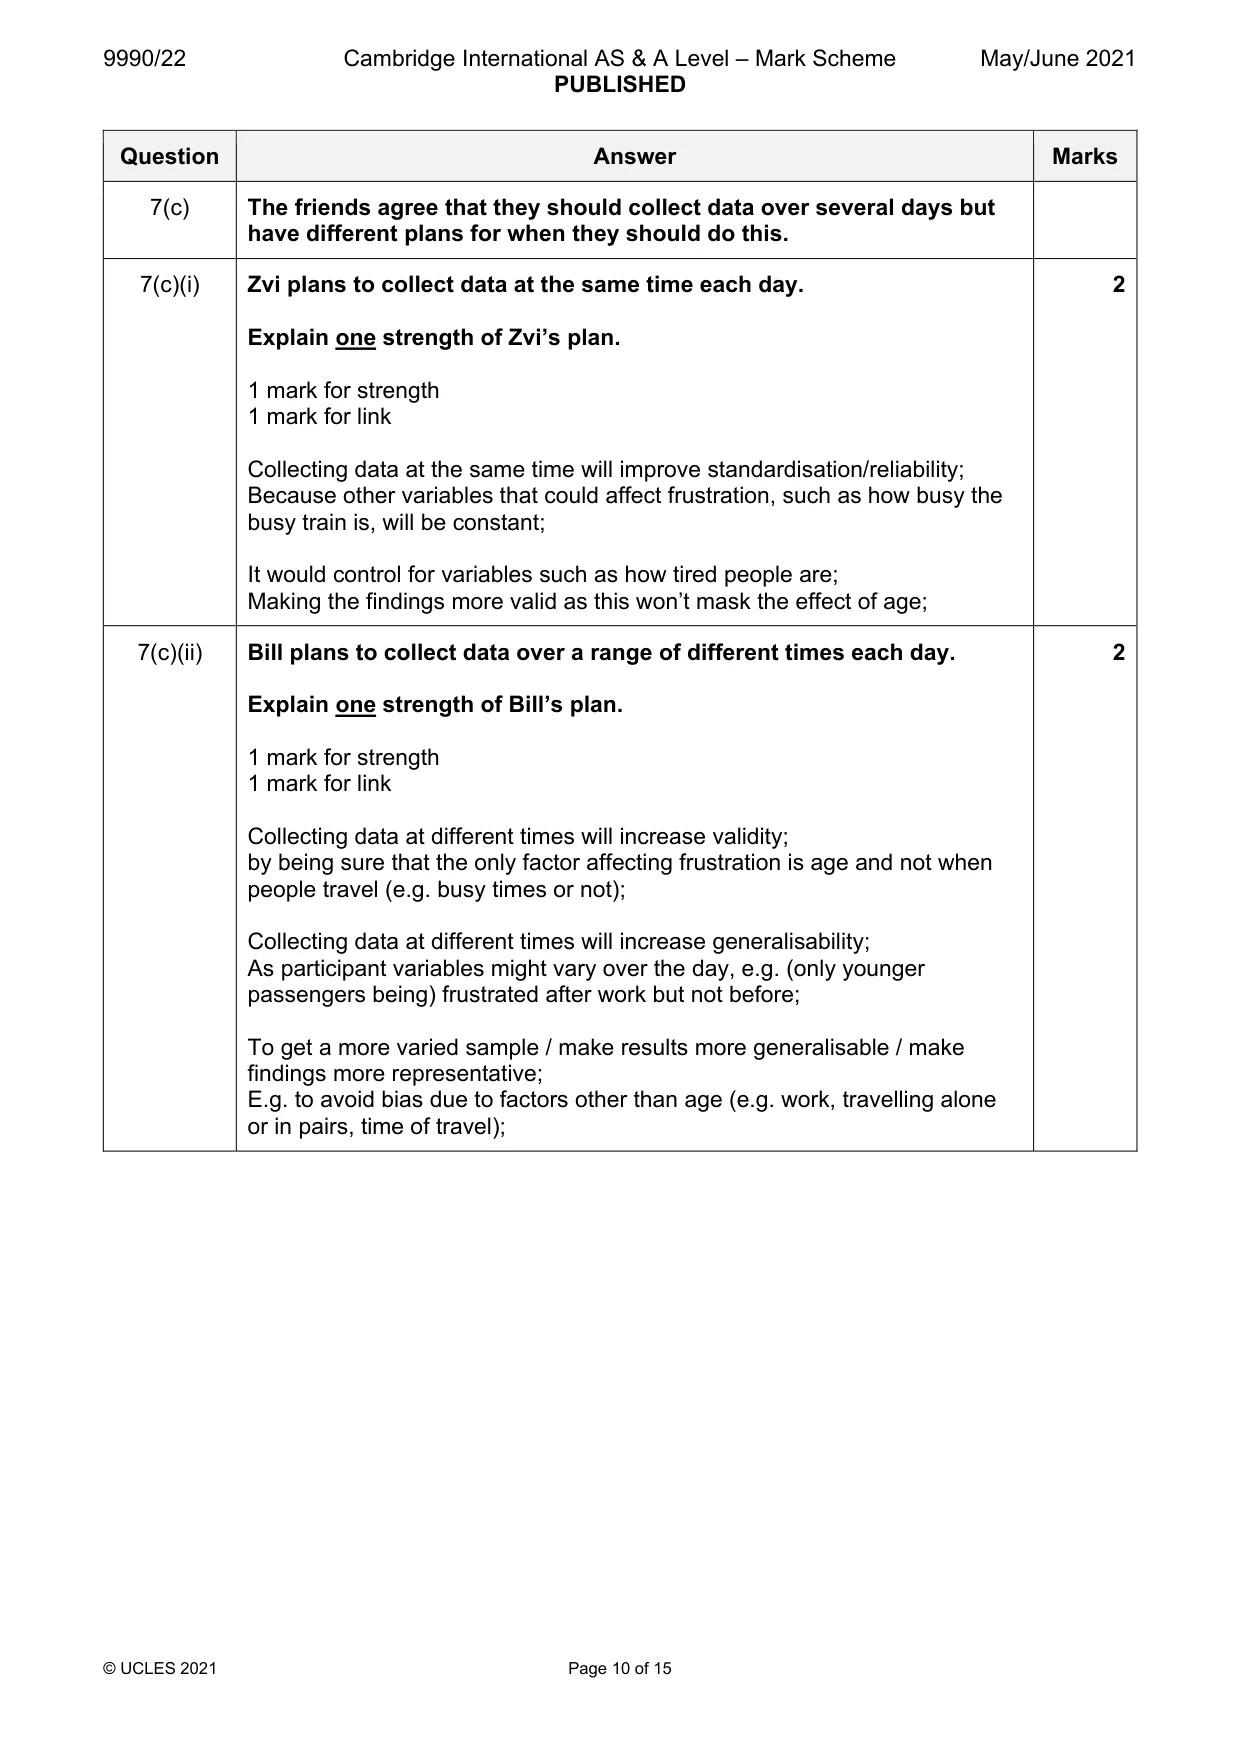
7 Two friends, Zvi and Bill, are conducting a natural experiment. They are collecting data by observing whether young or old people are more likely to become frustrated when trying to get on a busy train. (a) (i) Suggest how the friends could operationalise their independent variable. ........................................................................................................................................... ..................................................................................................................................... [1] (ii) For the way you suggested in (a)(i): Explain one strength of operationalising the independent variable in this way. ........................................................................................................................................... ........................................................................................................................................... ........................................................................................................................................... ..................................................................................................................................... [2] (b) Explain what is meant by a ‘dependent variable’, using Zvi and Bill’s study as an example. ................................................................................................................................................... ................................................................................................................................................... ................................................................................................................................................... ............................................................................................................................................. [2] (c) The friends agree that they should collect data over several days but have different plans for when they should do this. (i) Zvi plans to collect data at the same time each day. Explain one strength of Zvi’s plan. ........................................................................................................................................... ........................................................................................................................................... ........................................................................................................................................... ..................................................................................................................................... [2] (ii) Bill plans to collect data over a range of different times each day. Explain one strength of Bill’s plan. ........................................................................................................................................... ........................................................................................................................................... ........................................................................................................................................... ..................................................................................................................................... [2]
Mark scheme: 7 Two friends, Zvi and Bill, are conducting a natural experiment. They are collecting data by observing whether young or old people are more likely to become frustrated when trying to get on a busy train. 7(a)(i) Suggest how the friends could operationalise their independent 1 variable. 1 mark for suggestion of operationalisation 40 and under, 41 and over; (Young =) under 20, (old =) over 60; ‘young people and old people’ = 0 marks 7(a)(ii) For the way you suggested in (a)(i): 2 Explain one strength of operationalising the independent variable in this way. 1 mark for explanation, 1 mark for detail It would be easy to distinguish who was young and who was old; because the categories are very different / people’s appearance changes a lot between the two age groups; Because people wouldn’t have to state their actual age; so (more ethical because) less invasion of privacy; ‘under 20 and over 50 are easy to tell apart; so objective/reliable/valid’ = 2 ‘operationalisation allows for replication’ = 0 [because generic, needs to address ‘in this way’ in the question] 7(b) Explain what is meant by a ‘dependent variable’, using Zvi and Bill’s 2 study as an example. 1 mark for explanation 1 mark for link The DV is the variable being measured; (explanation) Frustration (e.g. as ‘pushing’); (link) The DV is what changes under the influence of the IV; (explanation) Frustration; (link) 7(c) The friends agree that they should collect data over several days but have different plans for when they should do this. 7(c)(i) Zvi plans to collect data at the same time each day. 2 Explain one strength of Zvi’s plan. 1 mark for strength 1 mark for link Collecting data at the same time will improve standardisation/reliability; Because other variables that could affect frustration, such as how busy the busy train is, will be constant; It would control for variables such as how tired people are; Making the findings more valid as this won’t mask the effect of age; 7(c)(ii) Bill plans to collect data over a range of different times each day. 2 Explain one strength of Bill’s plan. 1 mark for strength 1 mark for link Collecting data at different times will increase validity; by being sure that the only factor affecting frustration is age and not when people travel (e.g. busy times or not); Collecting data at different times will increase generalisability; As participant variables might vary over the day, e.g. (only younger passengers being) frustrated after work but not before; To get a more varied sample / make results more generalisable / make findings more representative; E.g. to avoid bias due to factors other than age (e.g. work, travelling alone or in pairs, time of travel);
Q8 · Jacy is conducting a laboratory experiment to investigate the effect of eating chocolate…
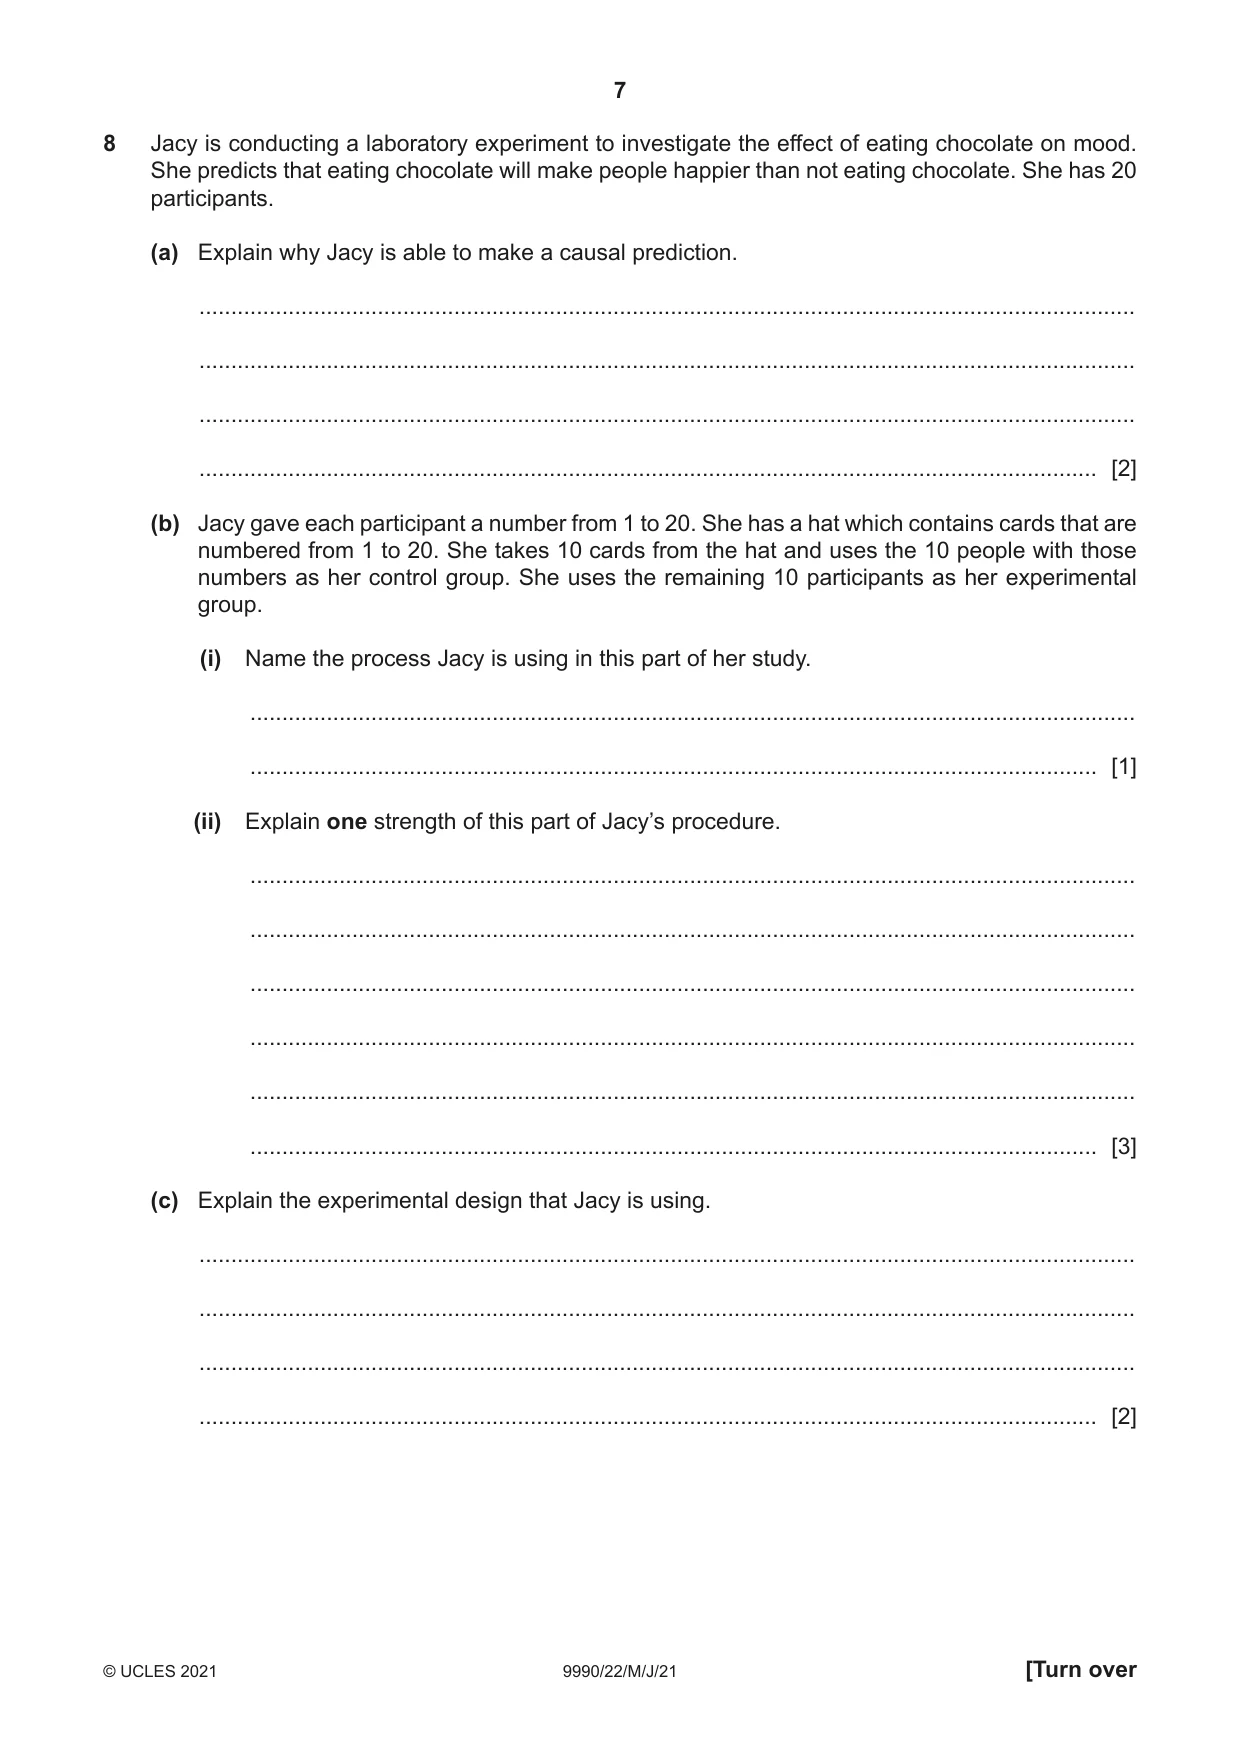
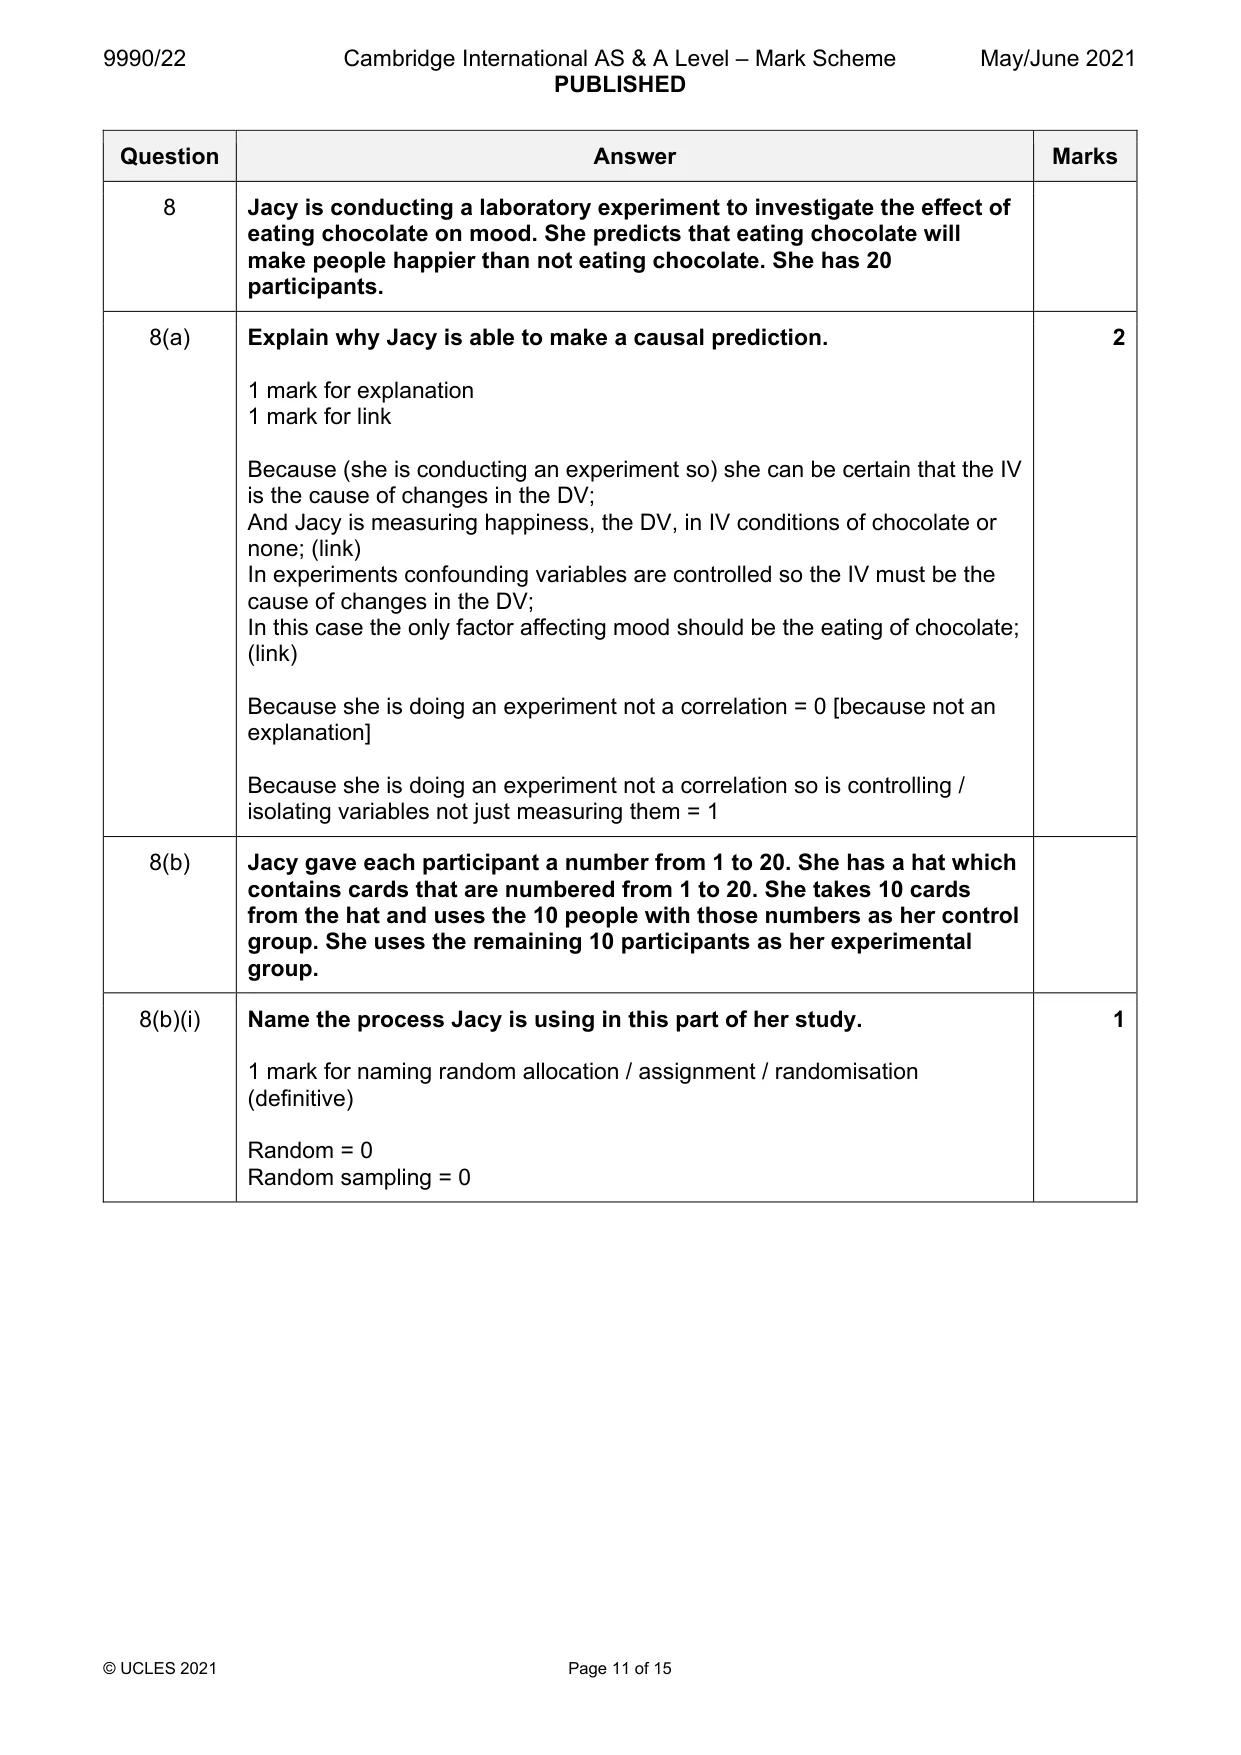
8 Jacy is conducting a laboratory experiment to investigate the effect of eating chocolate on mood. She predicts that eating chocolate will make people happier than not eating chocolate. She has 20 participants. (a) Explain why Jacy is able to make a causal prediction. ................................................................................................................................................... ................................................................................................................................................... ................................................................................................................................................... ............................................................................................................................................. [2] (b) Jacy gave each participant a number from 1 to 20. She has a hat which contains cards that are numbered from 1 to 20. She takes 10 cards from the hat and uses the 10 people with those numbers as her control group. She uses the remaining 10 participants as her experimental group. (i) Name the process Jacy is using in this part of her study. ........................................................................................................................................... ..................................................................................................................................... [1] (ii) Explain one strength of this part of Jacy’s procedure. ........................................................................................................................................... ........................................................................................................................................... ........................................................................................................................................... ........................................................................................................................................... ........................................................................................................................................... ..................................................................................................................................... [3] (c) Explain the experimental design that Jacy is using. ................................................................................................................................................... ................................................................................................................................................... ................................................................................................................................................... ............................................................................................................................................. [2]
Mark scheme: 8 Jacy is conducting a laboratory experiment to investigate the effect of eating chocolate on mood. She predicts that eating chocolate will make people happier than not eating chocolate. She has 20 participants. 8(a) Explain why Jacy is able to make a causal prediction. 2 1 mark for explanation 1 mark for link Because (she is conducting an experiment so) she can be certain that the IV is the cause of changes in the DV; And Jacy is measuring happiness, the DV, in IV conditions of chocolate or none; (link) In experiments confounding variables are controlled so the IV must be the cause of changes in the DV; In this case the only factor affecting mood should be the eating of chocolate; (link) Because she is doing an experiment not a correlation = 0 [because not an explanation] Because she is doing an experiment not a correlation so is controlling / isolating variables not just measuring them = 1 8(b) Jacy gave each participant a number from 1 to 20. She has a hat which contains cards that are numbered from 1 to 20. She takes 10 cards from the hat and uses the 10 people with those numbers as her control group. She uses the remaining 10 participants as her experimental group. 8(b)(i) Name the process Jacy is using in this part of her study. 1 1 mark for naming random allocation / assignment / randomisation (definitive) Random = 0 Random sampling = 0 8(b)(ii) Explain one strength of this part of Jacy’s procedure. 3 1 mark for a brief/muddled strength of random allocation 2 marks for a clear/detailed generic strength of random allocation 3 marks for a clear/detailed and linked strength of random allocation So no other factors / participant variables / individual differences could affect the study = 1 So no other factors / participant variables / individual differences e.g. being bad tempered affect mood = 2 By allocating people randomly between the two levels of the IV, different (starting) moods should be spread evenly between the two conditions = 3 So people have an equal chance of being in the control group or experimental group = 1 So people have an equal chance of being in the control group or experimental group to even out individual differences = 2 So people in the sample have an equal chance of being in the control group or the chocolate group to even out individual differences = 3 8(c) Explain the experimental design that Jacy is using. 2 1 mark for explanation of independent measures / independent groups (does not have to be named) 1 mark for link (An independent measures design is) where different participants perform in each level of the IV; Jacy has different participants in the control and chocolate groups / participants either eat chocolate or do not; Marks are for explanation. No marks if nothing other than the identification of independent measures. Independent = 0 Independent measures = 0 Independent groups = 0
Q9 · Dr Lee is measuring two variables, tiredness and generosity, on scales of 0 to 10
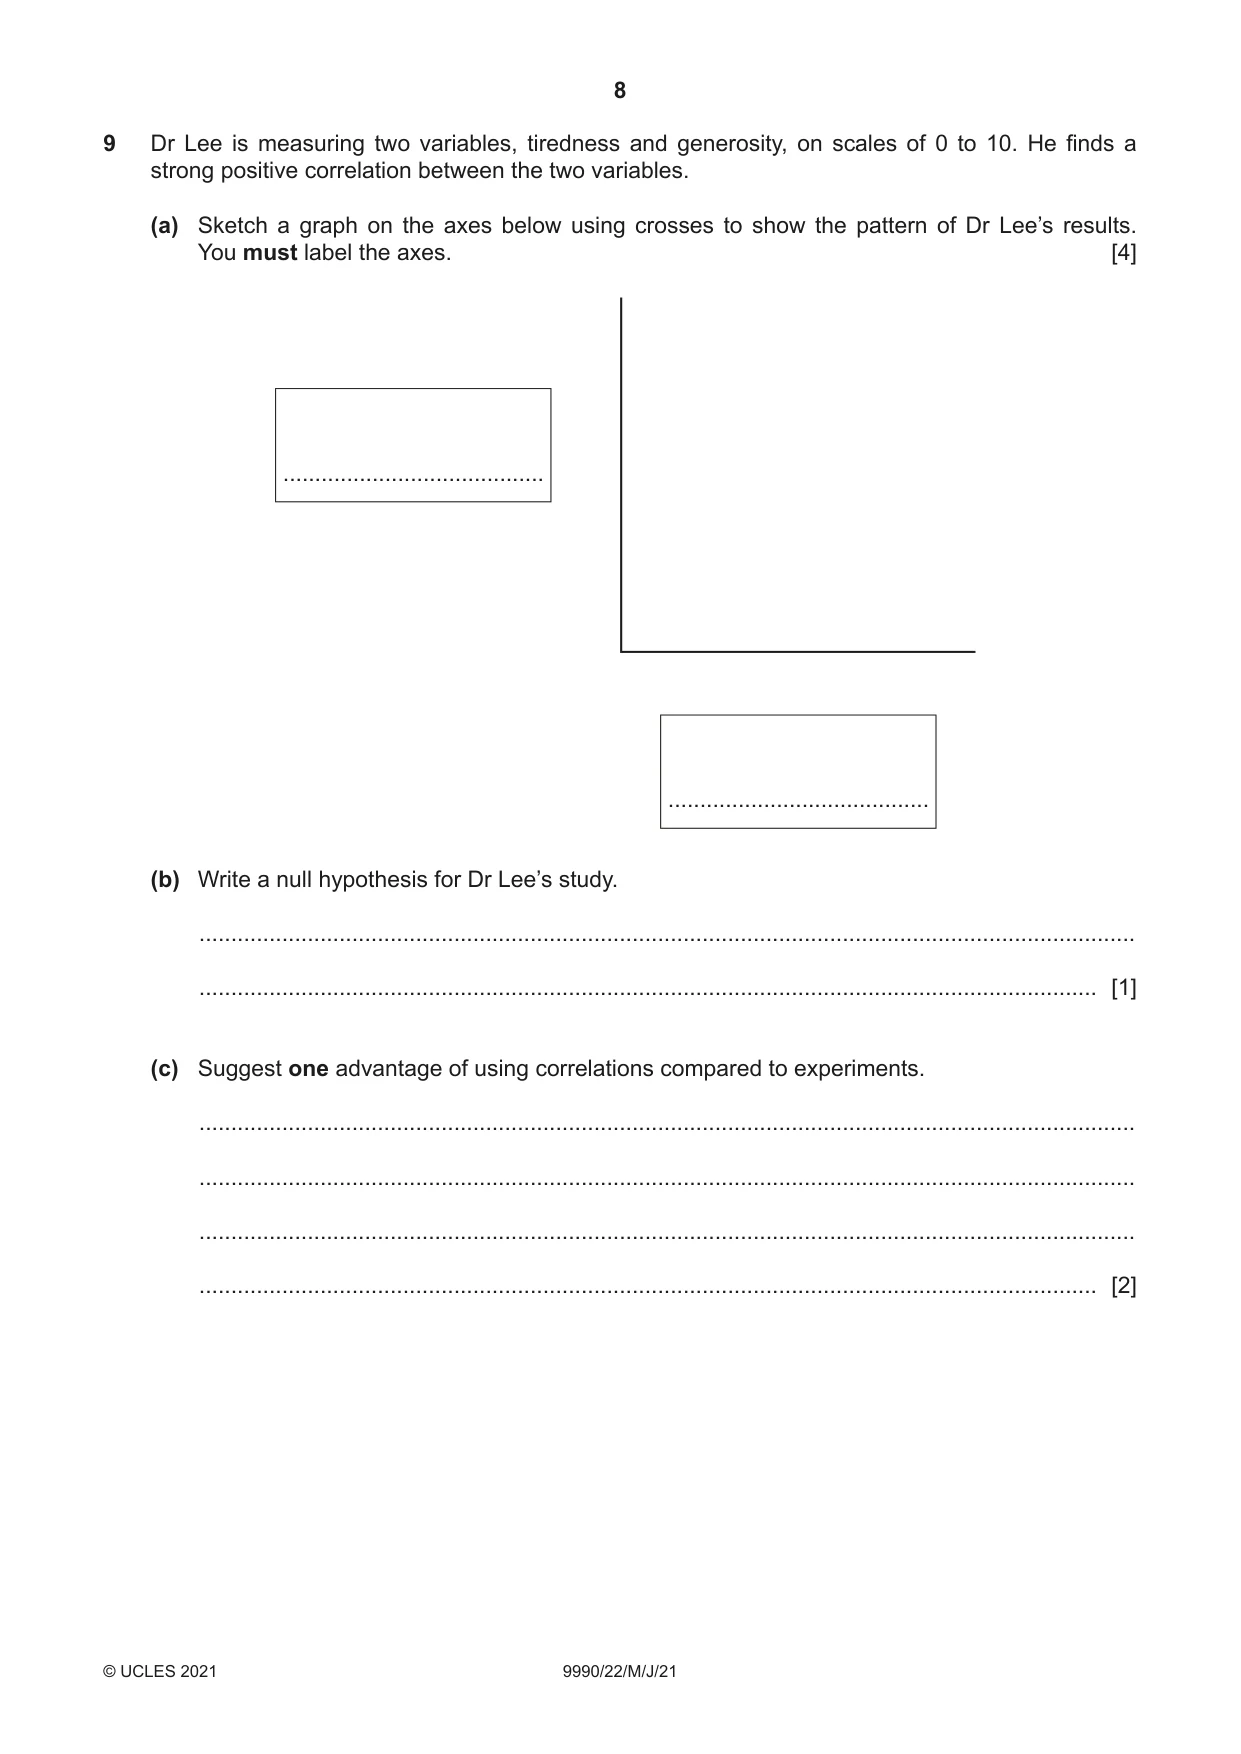
9 Dr Lee is measuring two variables, tiredness and generosity, on scales of 0 to 10. He finds a strong positive correlation between the two variables. (a) Sketch a graph on the axes below using crosses to show the pattern of Dr Lee’s results. You must label the axes. [4] ......................................... ......................................... (b) Write a null hypothesis for Dr Lee’s study. ................................................................................................................................................... ............................................................................................................................................. [1] (c) Suggest one advantage of using correlations compared to experiments. ................................................................................................................................................... ................................................................................................................................................... ................................................................................................................................................... ............................................................................................................................................. [2] Section C Answer all questions in this section.
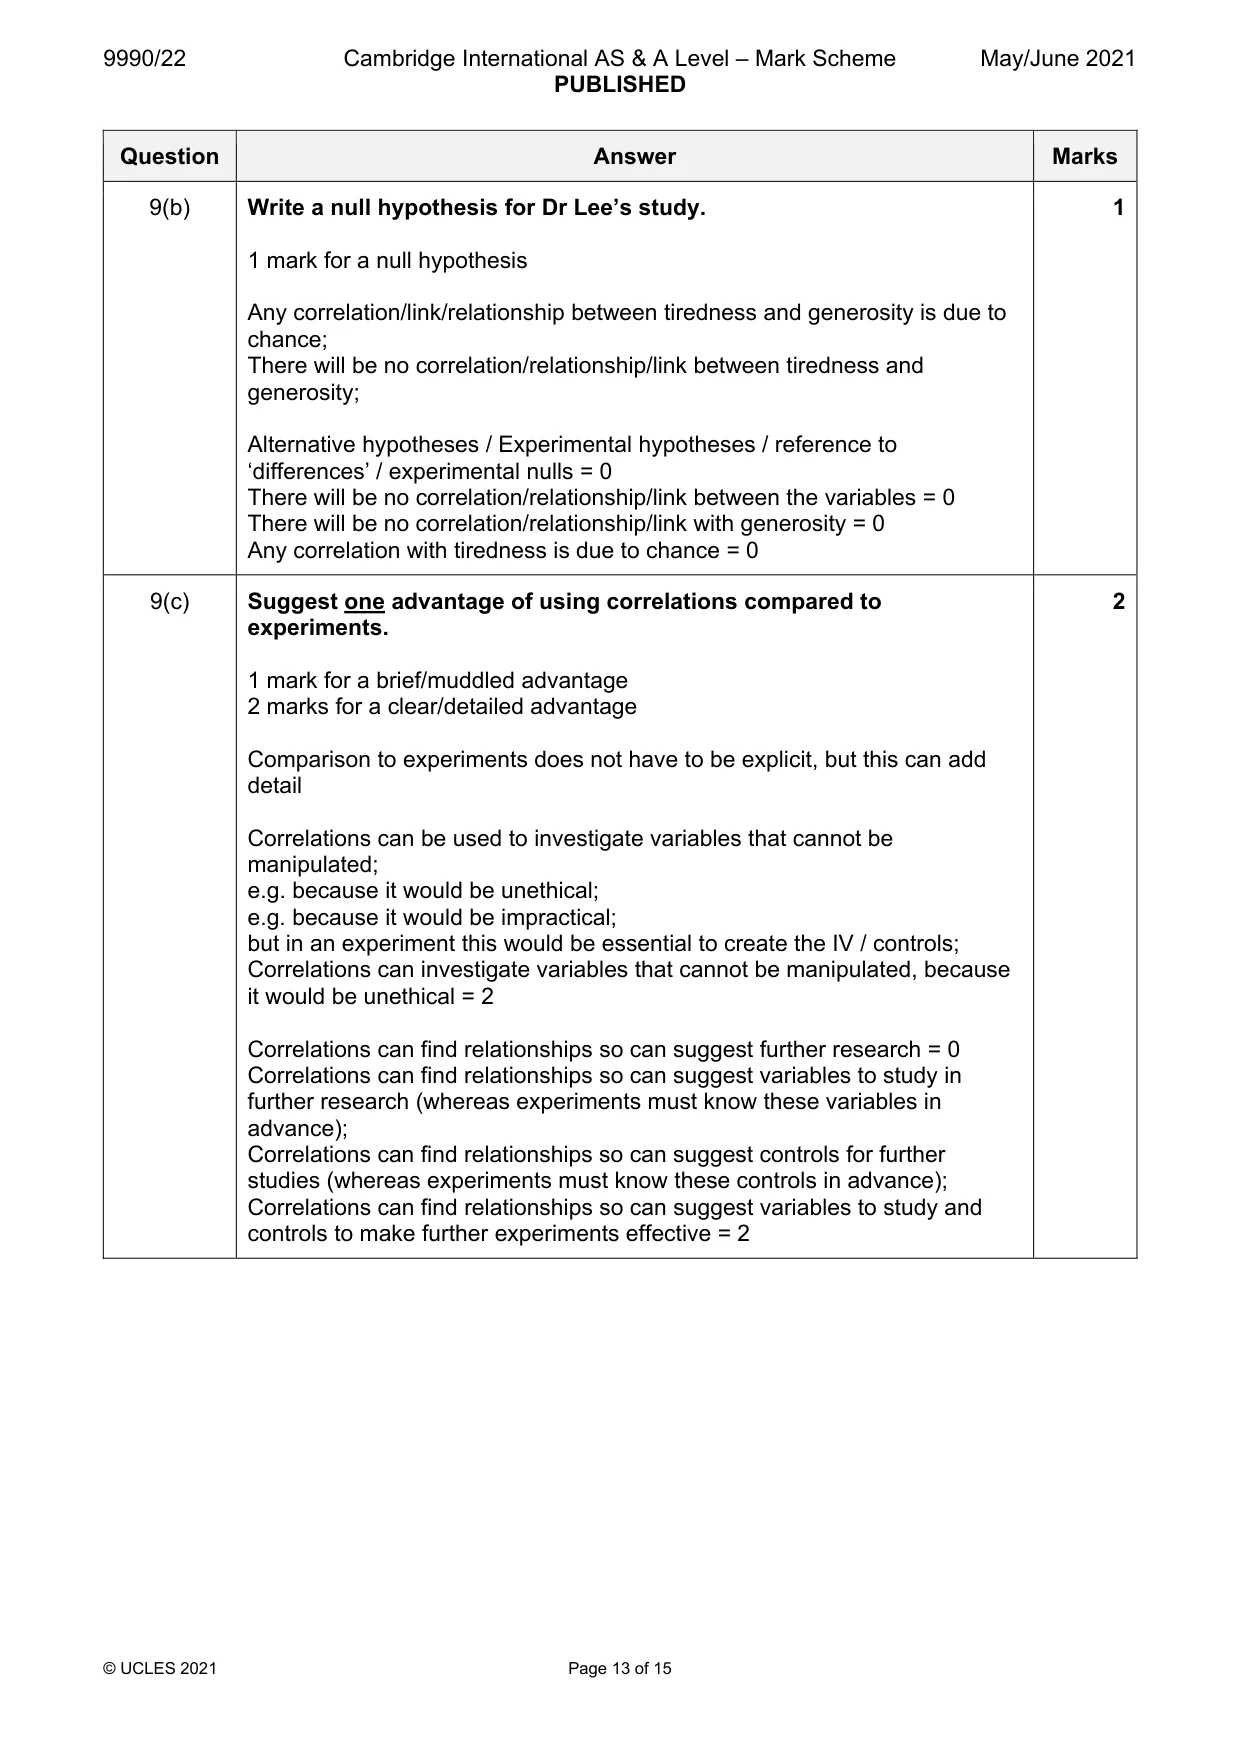
Mark scheme: 9 Dr Lee is measuring two variables, tiredness and generosity, on scales of 0 to 10. He finds a strong positive correlation between the two variables. 9(a) Sketch a graph on the axes below using crosses to show the pattern of 4 Dr Lee’s results. You must label the axes. 1 mark for both ‘tiredness’ and ‘generosity’ as axis labels 1 mark for 0–10 on both axes (can just be 0 and 10) 1 mark for points/crosses in a positive correlation pattern 1 mark for line (of ‘best fit’) for a positive correlation 9(b) Write a null hypothesis for Dr Lee’s study. 1 1 mark for a null hypothesis Any correlation/link/relationship between tiredness and generosity is due to chance; There will be no correlation/relationship/link between tiredness and generosity; Alternative hypotheses / Experimental hypotheses / reference to ‘differences’ / experimental nulls = 0 There will be no correlation/relationship/link between the variables = 0 There will be no correlation/relationship/link with generosity = 0 Any correlation with tiredness is due to chance = 0 9(c) Suggest one advantage of using correlations compared to 2 experiments. 1 mark for a brief/muddled advantage 2 marks for a clear/detailed advantage Comparison to experiments does not have to be explicit, but this can add detail Correlations can be used to investigate variables that cannot be manipulated; e.g. because it would be unethical; e.g. because it would be impractical; but in an experiment this would be essential to create the IV / controls; Correlations can investigate variables that cannot be manipulated, because it would be unethical = 2 Correlations can find relationships so can suggest further research = 0 Correlations can find relationships so can suggest variables to study in further research (whereas experiments must know these variables in advance); Correlations can find relationships so can suggest controls for further studies (whereas experiments must know these controls in advance); Correlations can find relationships so can suggest variables to study and controls to make further experiments effective = 2
Q10 · Seth is planning a case study to investigate the communication and emotion in a family
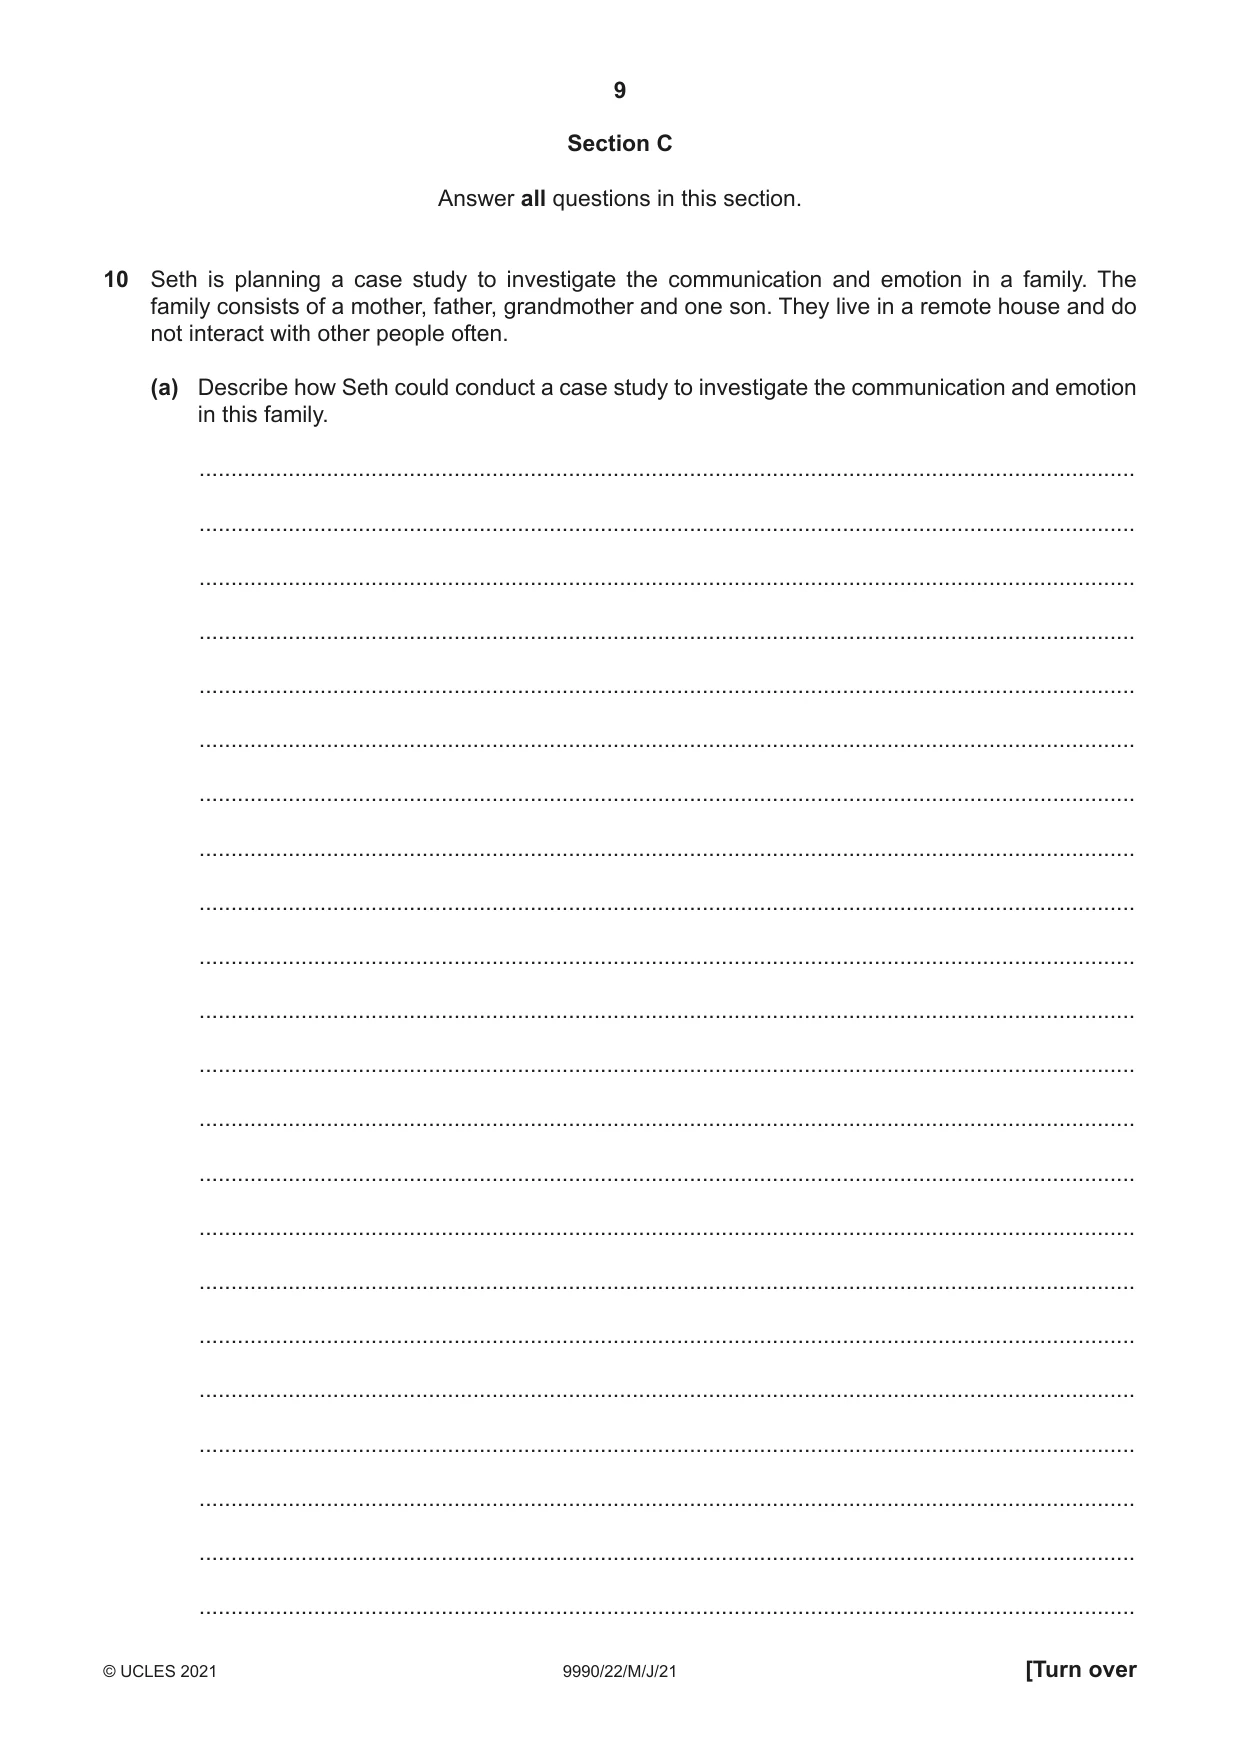
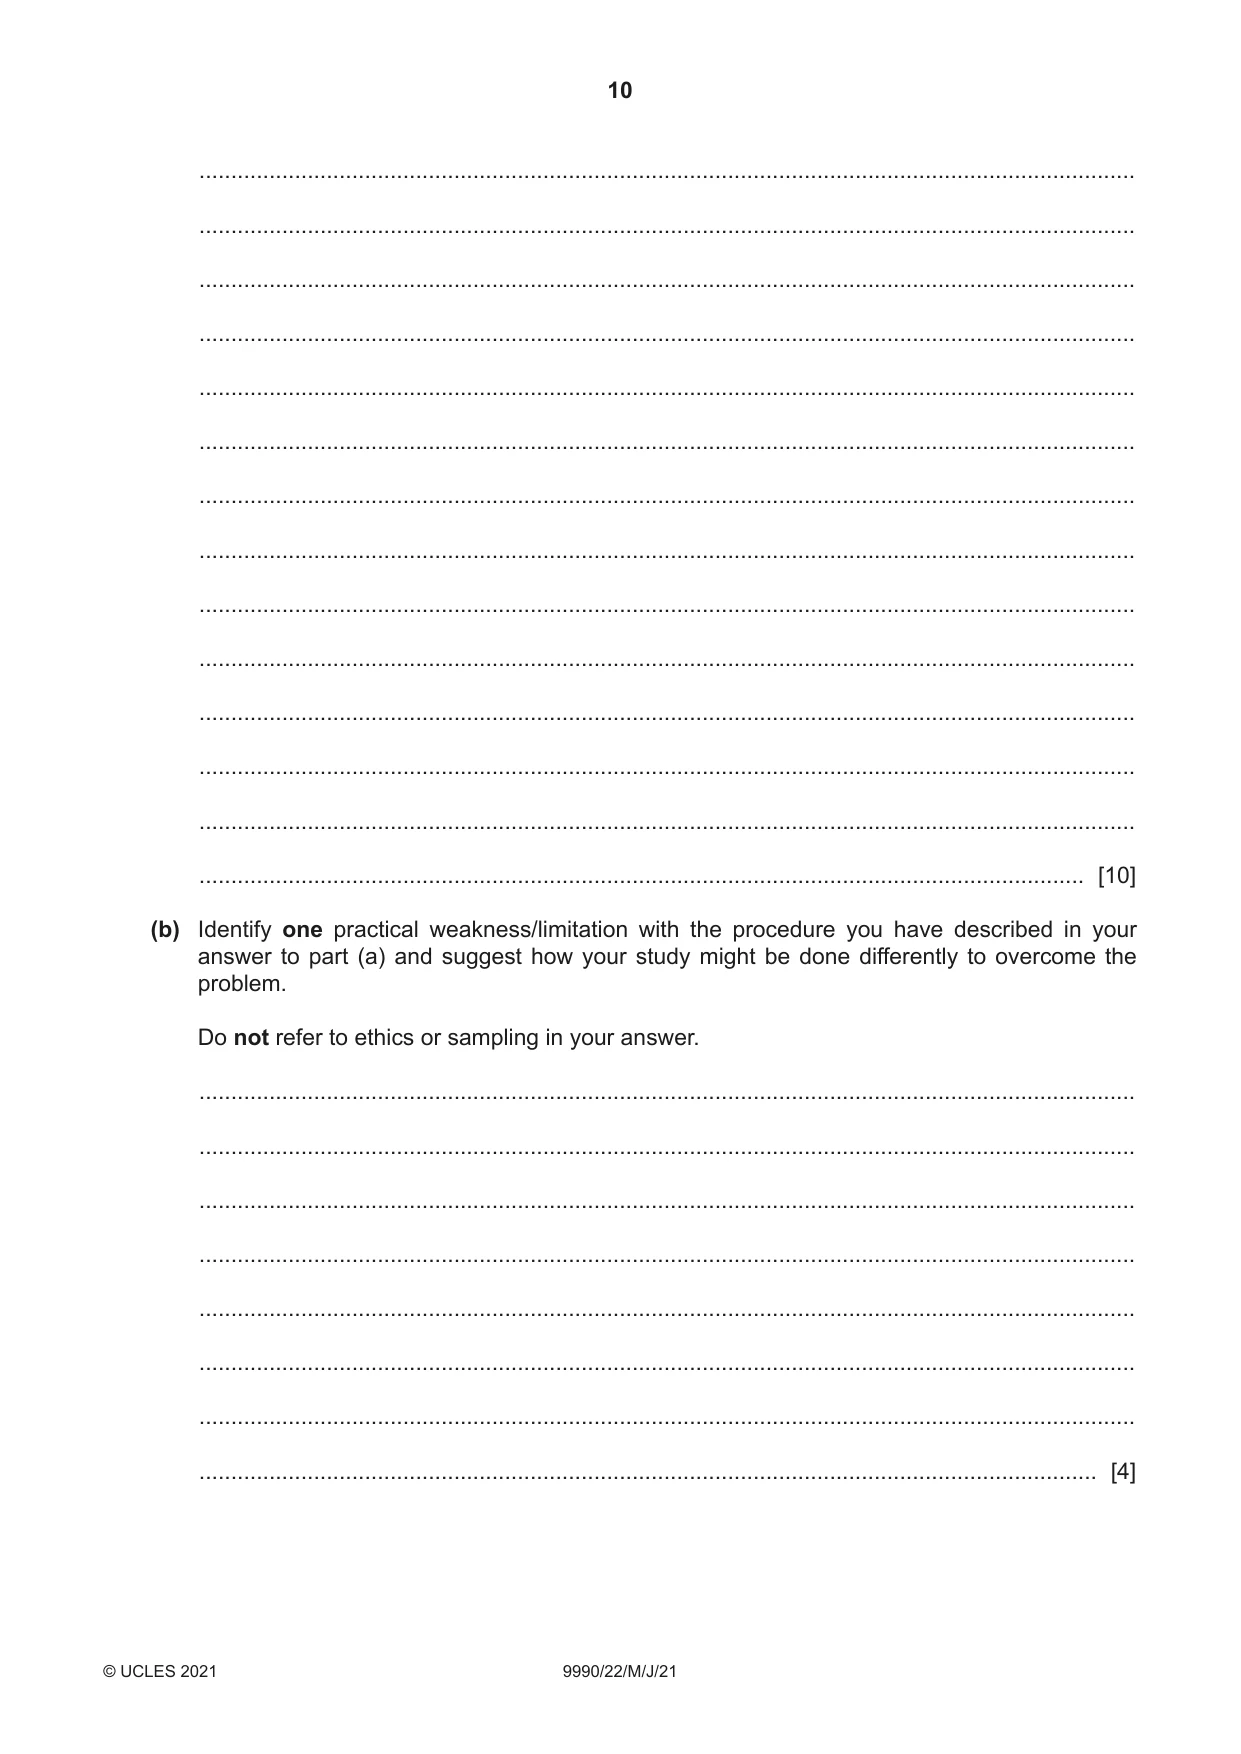
10 Seth is planning a case study to investigate the communication and emotion in a family. The family consists of a mother, father, grandmother and one son. They live in a remote house and do not interact with other people often. (a) Describe how Seth could conduct a case study to investigate the communication and emotion in this family. ................................................................................................................................................... ................................................................................................................................................... ................................................................................................................................................... ................................................................................................................................................... ................................................................................................................................................... ................................................................................................................................................... ................................................................................................................................................... ................................................................................................................................................... ................................................................................................................................................... ................................................................................................................................................... ................................................................................................................................................... ................................................................................................................................................... ................................................................................................................................................... ................................................................................................................................................... ................................................................................................................................................... ................................................................................................................................................... ................................................................................................................................................... ................................................................................................................................................... ................................................................................................................................................... ................................................................................................................................................... ................................................................................................................................................... ................................................................................................................................................... ................................................................................................................................................... ................................................................................................................................................... ................................................................................................................................................... ................................................................................................................................................... ................................................................................................................................................... ................................................................................................................................................... ................................................................................................................................................... ................................................................................................................................................... ................................................................................................................................................... ................................................................................................................................................... ................................................................................................................................................... ................................................................................................................................................... ................................................................................................................................................... ........................................................................................................................................... [10] (b) Identify one practical weakness/limitation with the procedure you have described in your answer to part (a) and suggest how your study might be done differently to overcome the problem. Do not refer to ethics or sampling in your answer. ................................................................................................................................................... ................................................................................................................................................... ................................................................................................................................................... ................................................................................................................................................... ................................................................................................................................................... ................................................................................................................................................... ................................................................................................................................................... ............................................................................................................................................. [4]
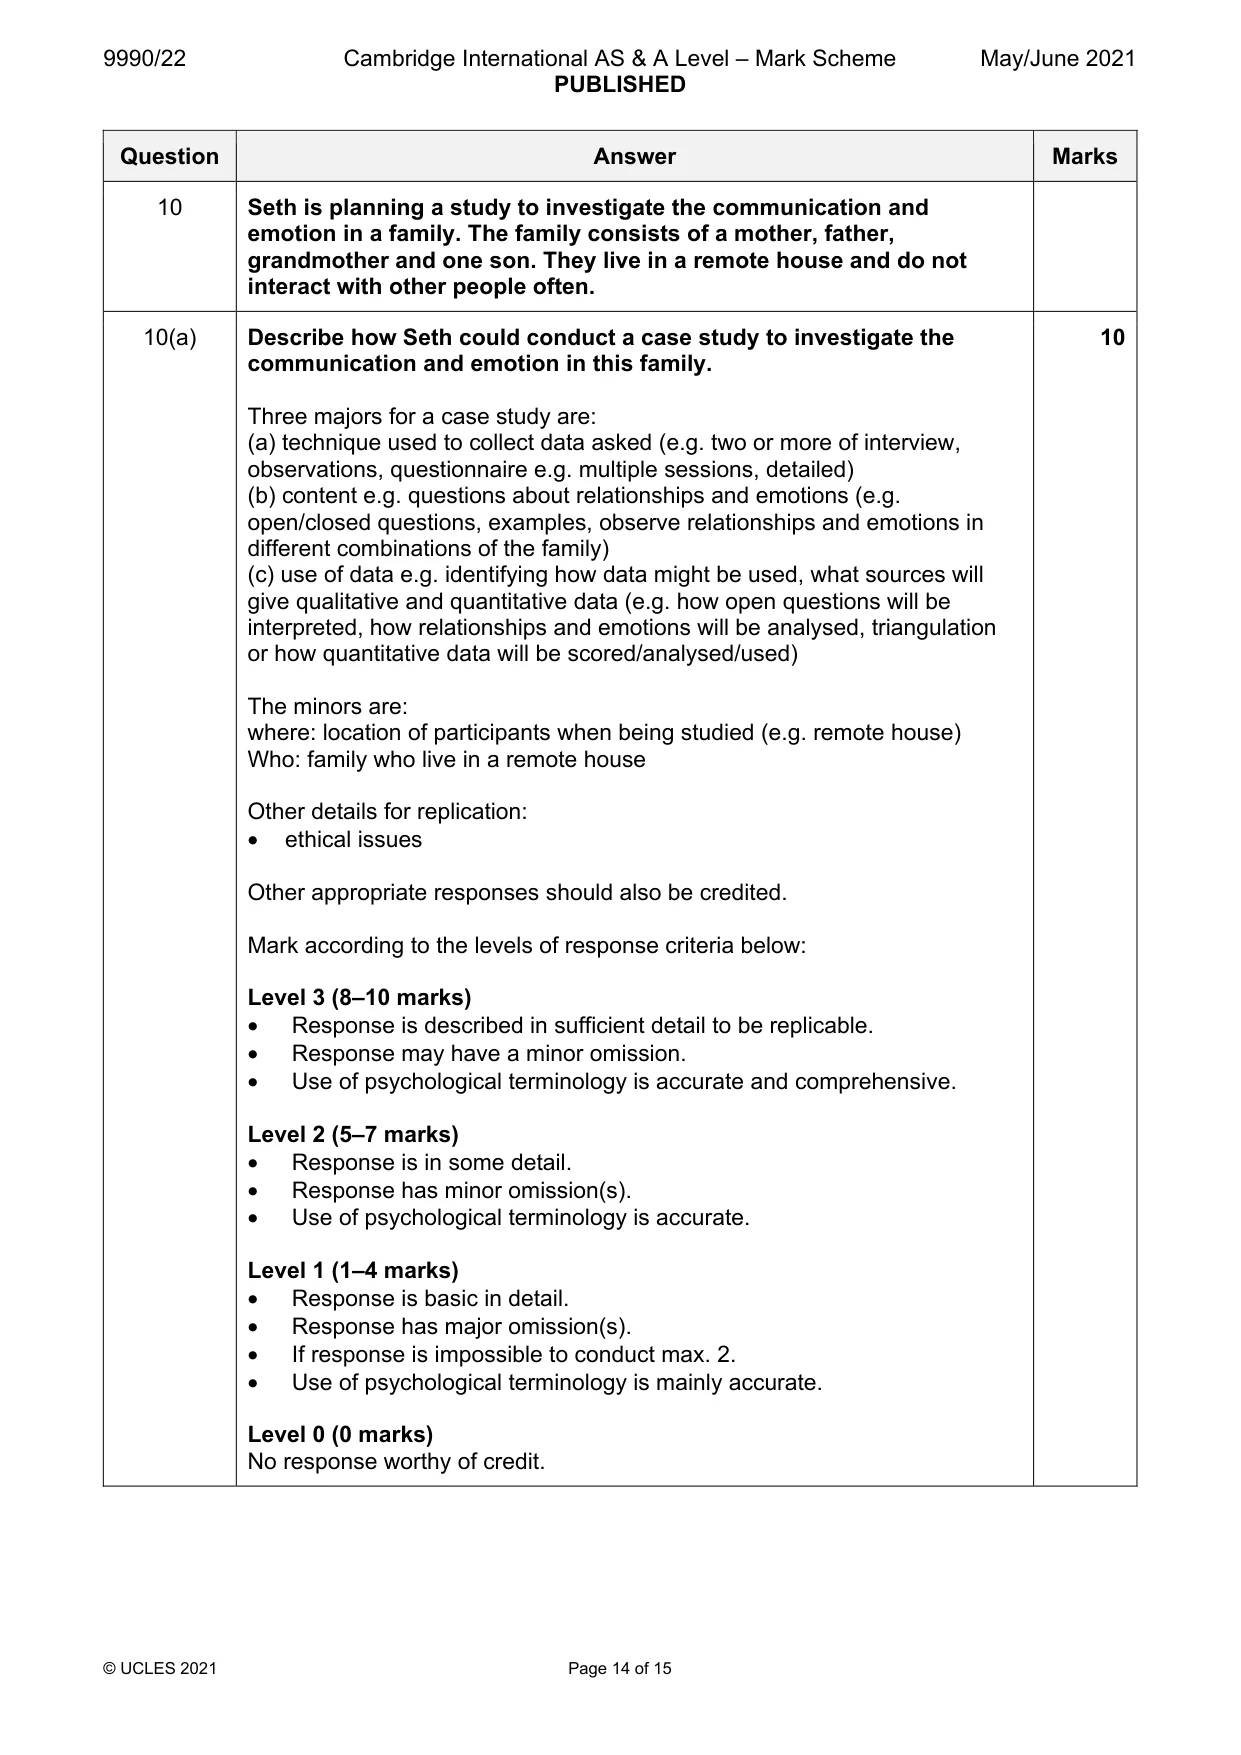
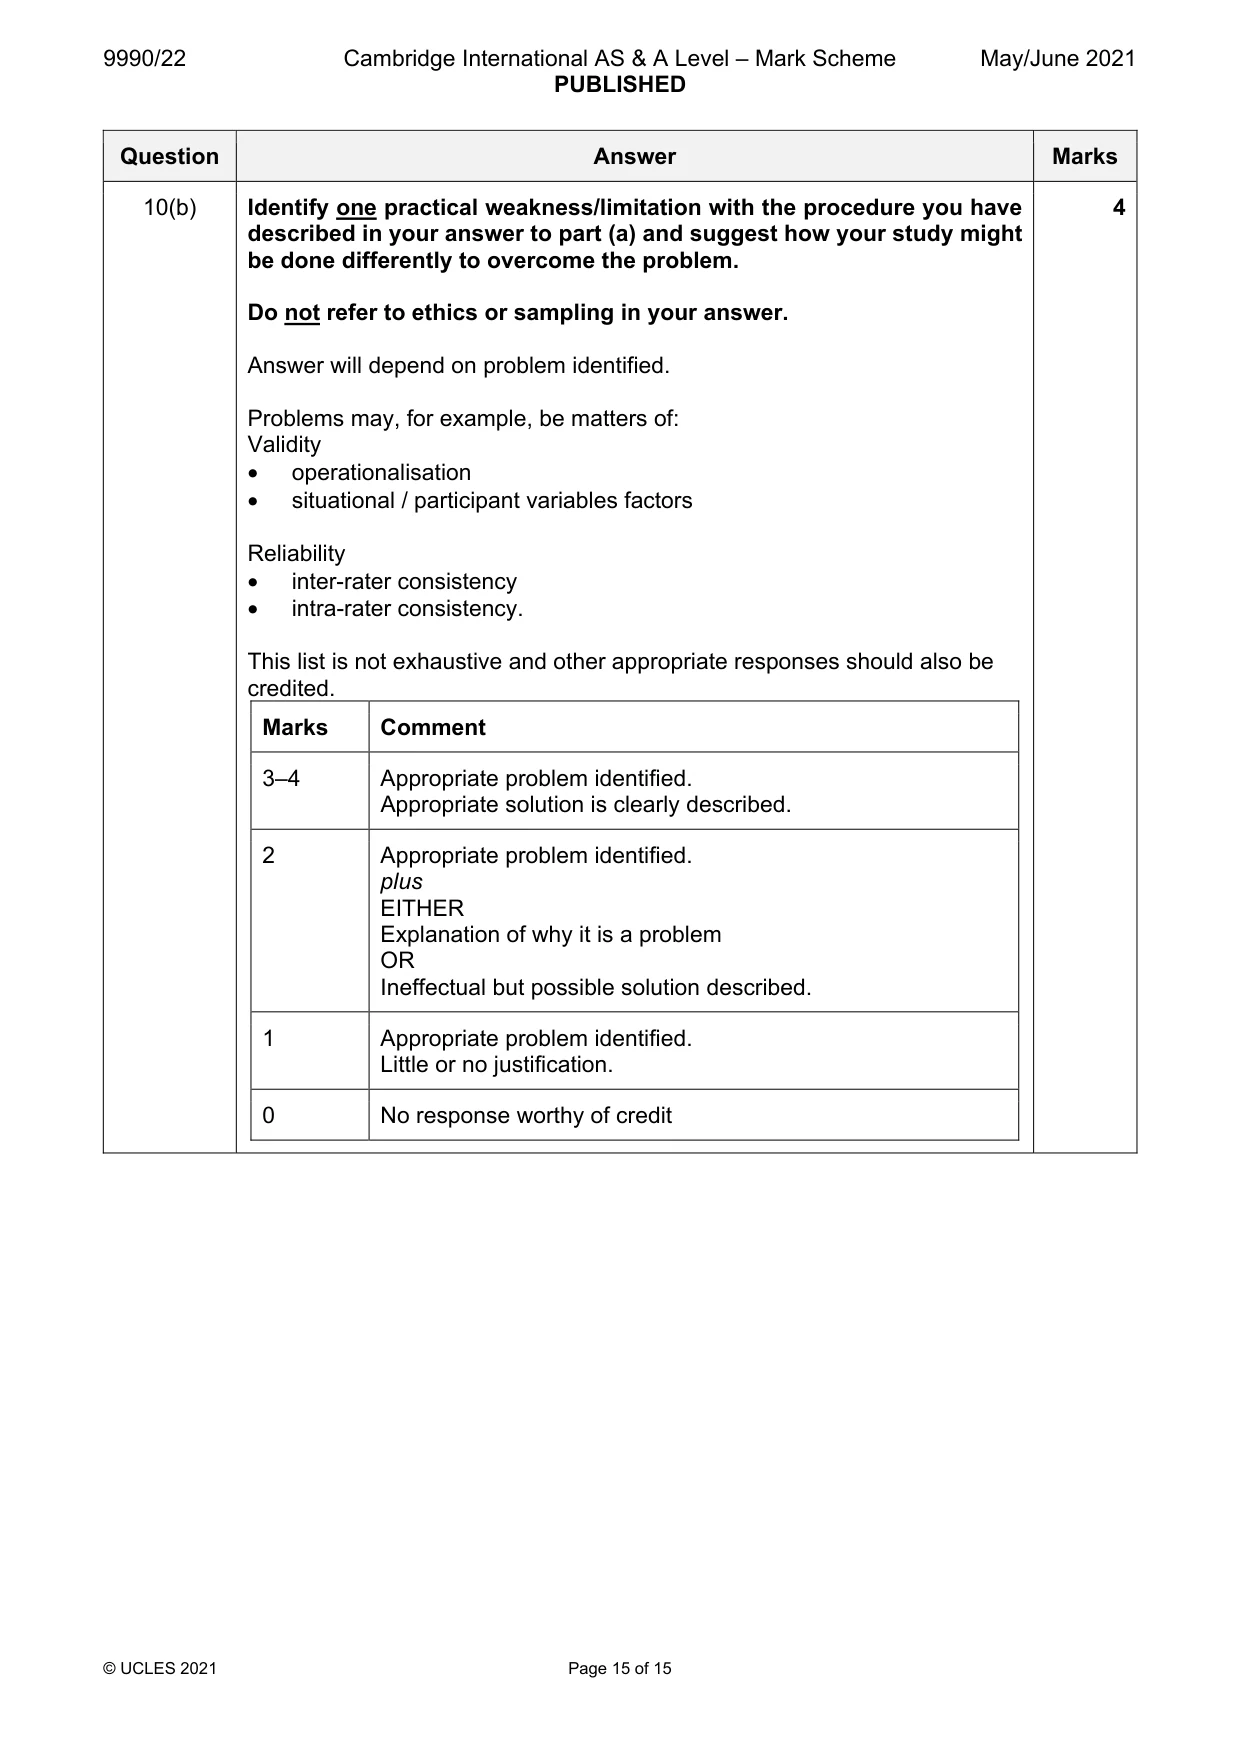
Mark scheme: 10 Seth is planning a study to investigate the communication and emotion in a family. The family consists of a mother, father, grandmother and one son. They live in a remote house and do not interact with other people often. 10(a) Describe how Seth could conduct a case study to investigate the 10 communication and emotion in this family. Three majors for a case study are: (a) technique used to collect data asked (e.g. two or more of interview, observations, questionnaire e.g. multiple sessions, detailed) (b) content e.g. questions about relationships and emotions (e.g. open/closed questions, examples, observe relationships and emotions in different combinations of the family) (c) use of data e.g. identifying how data might be used, what sources will give qualitative and quantitative data (e.g. how open questions will be interpreted, how relationships and emotions will be analysed, triangulation or how quantitative data will be scored/analysed/used) The minors are: where: location of participants when being studied (e.g. remote house) Who: family who live in a remote house Other details for replication: • ethical issues Other appropriate responses should also be credited. Mark according to the levels of response criteria below: Level 3 (8–10 marks) • Response is described in sufficient detail to be replicable. • Response may have a minor omission. • Use of psychological terminology is accurate and comprehensive. Level 2 (5–7 marks) • Response is in some detail. • Response has minor omission(s). • Use of psychological terminology is accurate. Level 1 (1–4 marks) • Response is basic in detail. • Response has major omission(s). • If response is impossible to conduct max. 2. • Use of psychological terminology is mainly accurate. Level 0 (0 marks) No response worthy of credit. 10(b) Identify one practical weakness/limitation with the procedure you have 4 described in your answer to part (a) and suggest how your study might be done differently to overcome the problem. Do not refer to ethics or sampling in your answer. Answer will depend on problem identified. Problems may, for example, be matters of: Validity • operationalisation • situational / participant variables factors Reliability • inter-rater consistency • intra-rater consistency. This list is not exhaustive and other appropriate responses should also be credited. Marks Comment 3–4 Appropriate problem identified. Appropriate solution is clearly described. 2 Appropriate problem identified. plus EITHER Explanation of why it is a problem OR Ineffectual but possible solution described. 1 Appropriate problem identified. Little or no justification. 0 No response worthy of credit
What was in this paper
The subtopics covered by these 10 questions, and how many questions each got. Open one in a new tab to see every Cambridge question on it.
What you needed in this session
Cambridge’s own grade thresholds for 2021 May/June, Paper 2 · Variant 2. A higher threshold means an easier paper — the bar moves with how the cohort did.