Questions as text
Q1 · Use band theory to explain why, unlike a copper wire, the resistance of an intrinsic… 9702/42 Feb/March 2017
11 Use band theory to explain why, unlike a copper wire, the resistance of an intrinsic semiconductor decreases with an increase of temperature. … … … … … … … … … … … … [5] [Total: 5]
5 marks
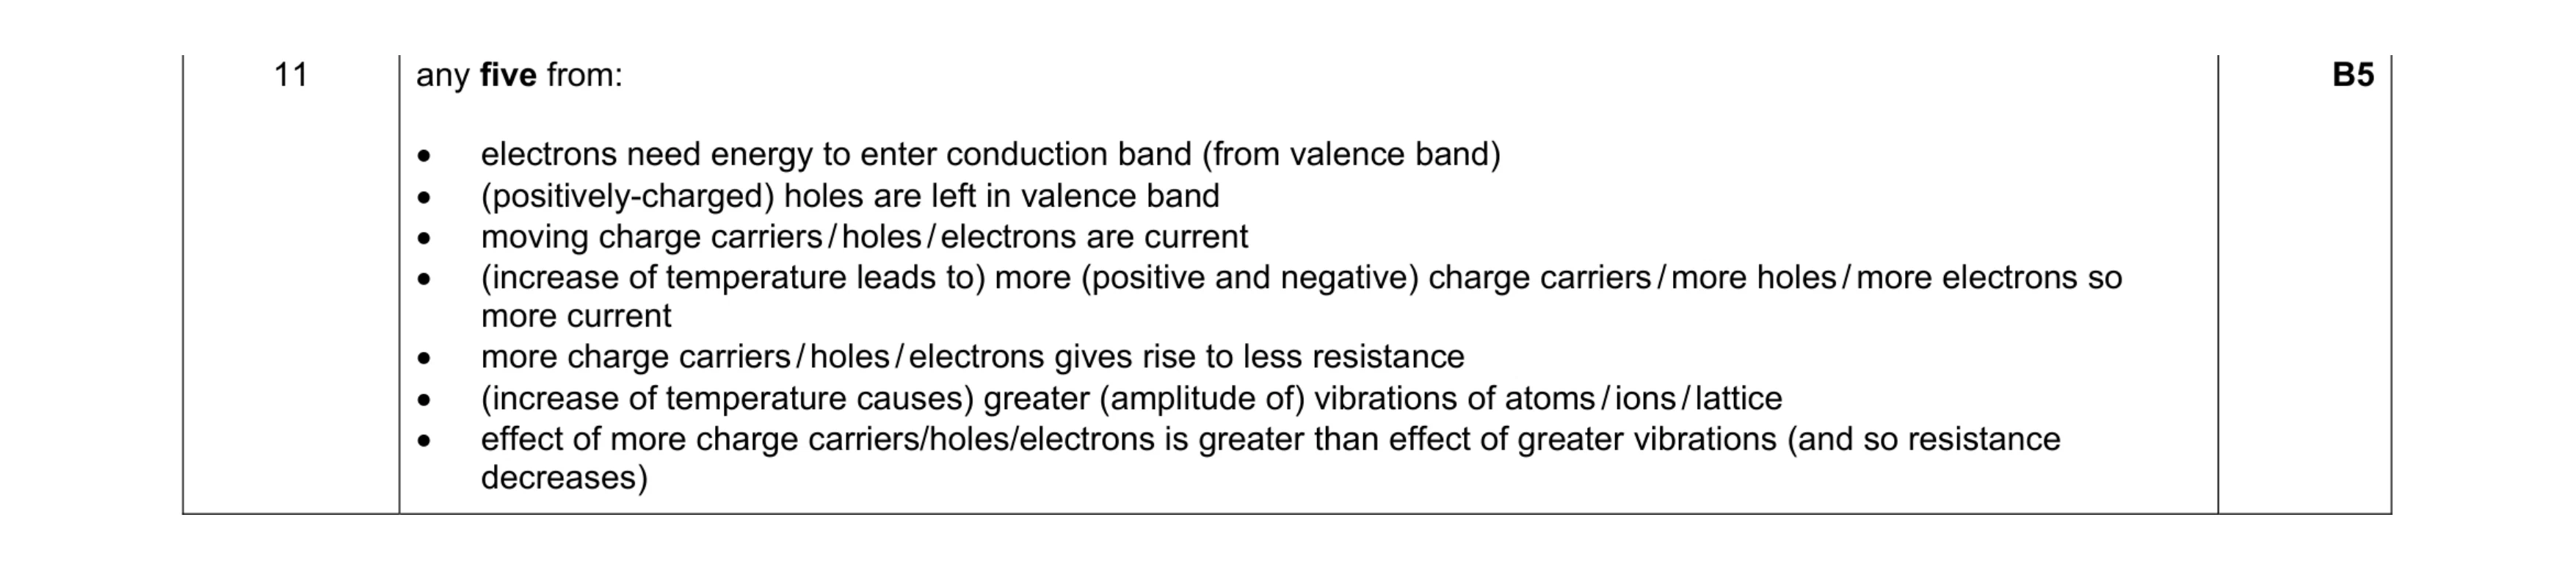
Mark scheme: 11 any five from: • electrons need energy to enter conduction band (from valence band) • (positively-charged) holes are left in valence band • moving charge carriers / holes / electrons are current • (increase of temperature leads to) more (positive and negative) charge carriers / more holes / more electrons so more current • more charge carriers / holes / electrons gives rise to less resistance • (increase of temperature causes) greater (amplitude of) vibrations of atoms / ions / lattice • effect of more charge carriers/holes/electrons is greater than effect of greater vibrations (and so resistance decreases) B5
This question in 9702/42 Feb/March 2017
Q2 · Some electron energy bands in a solid are shown in Fig 9702/42 Feb/March 2018
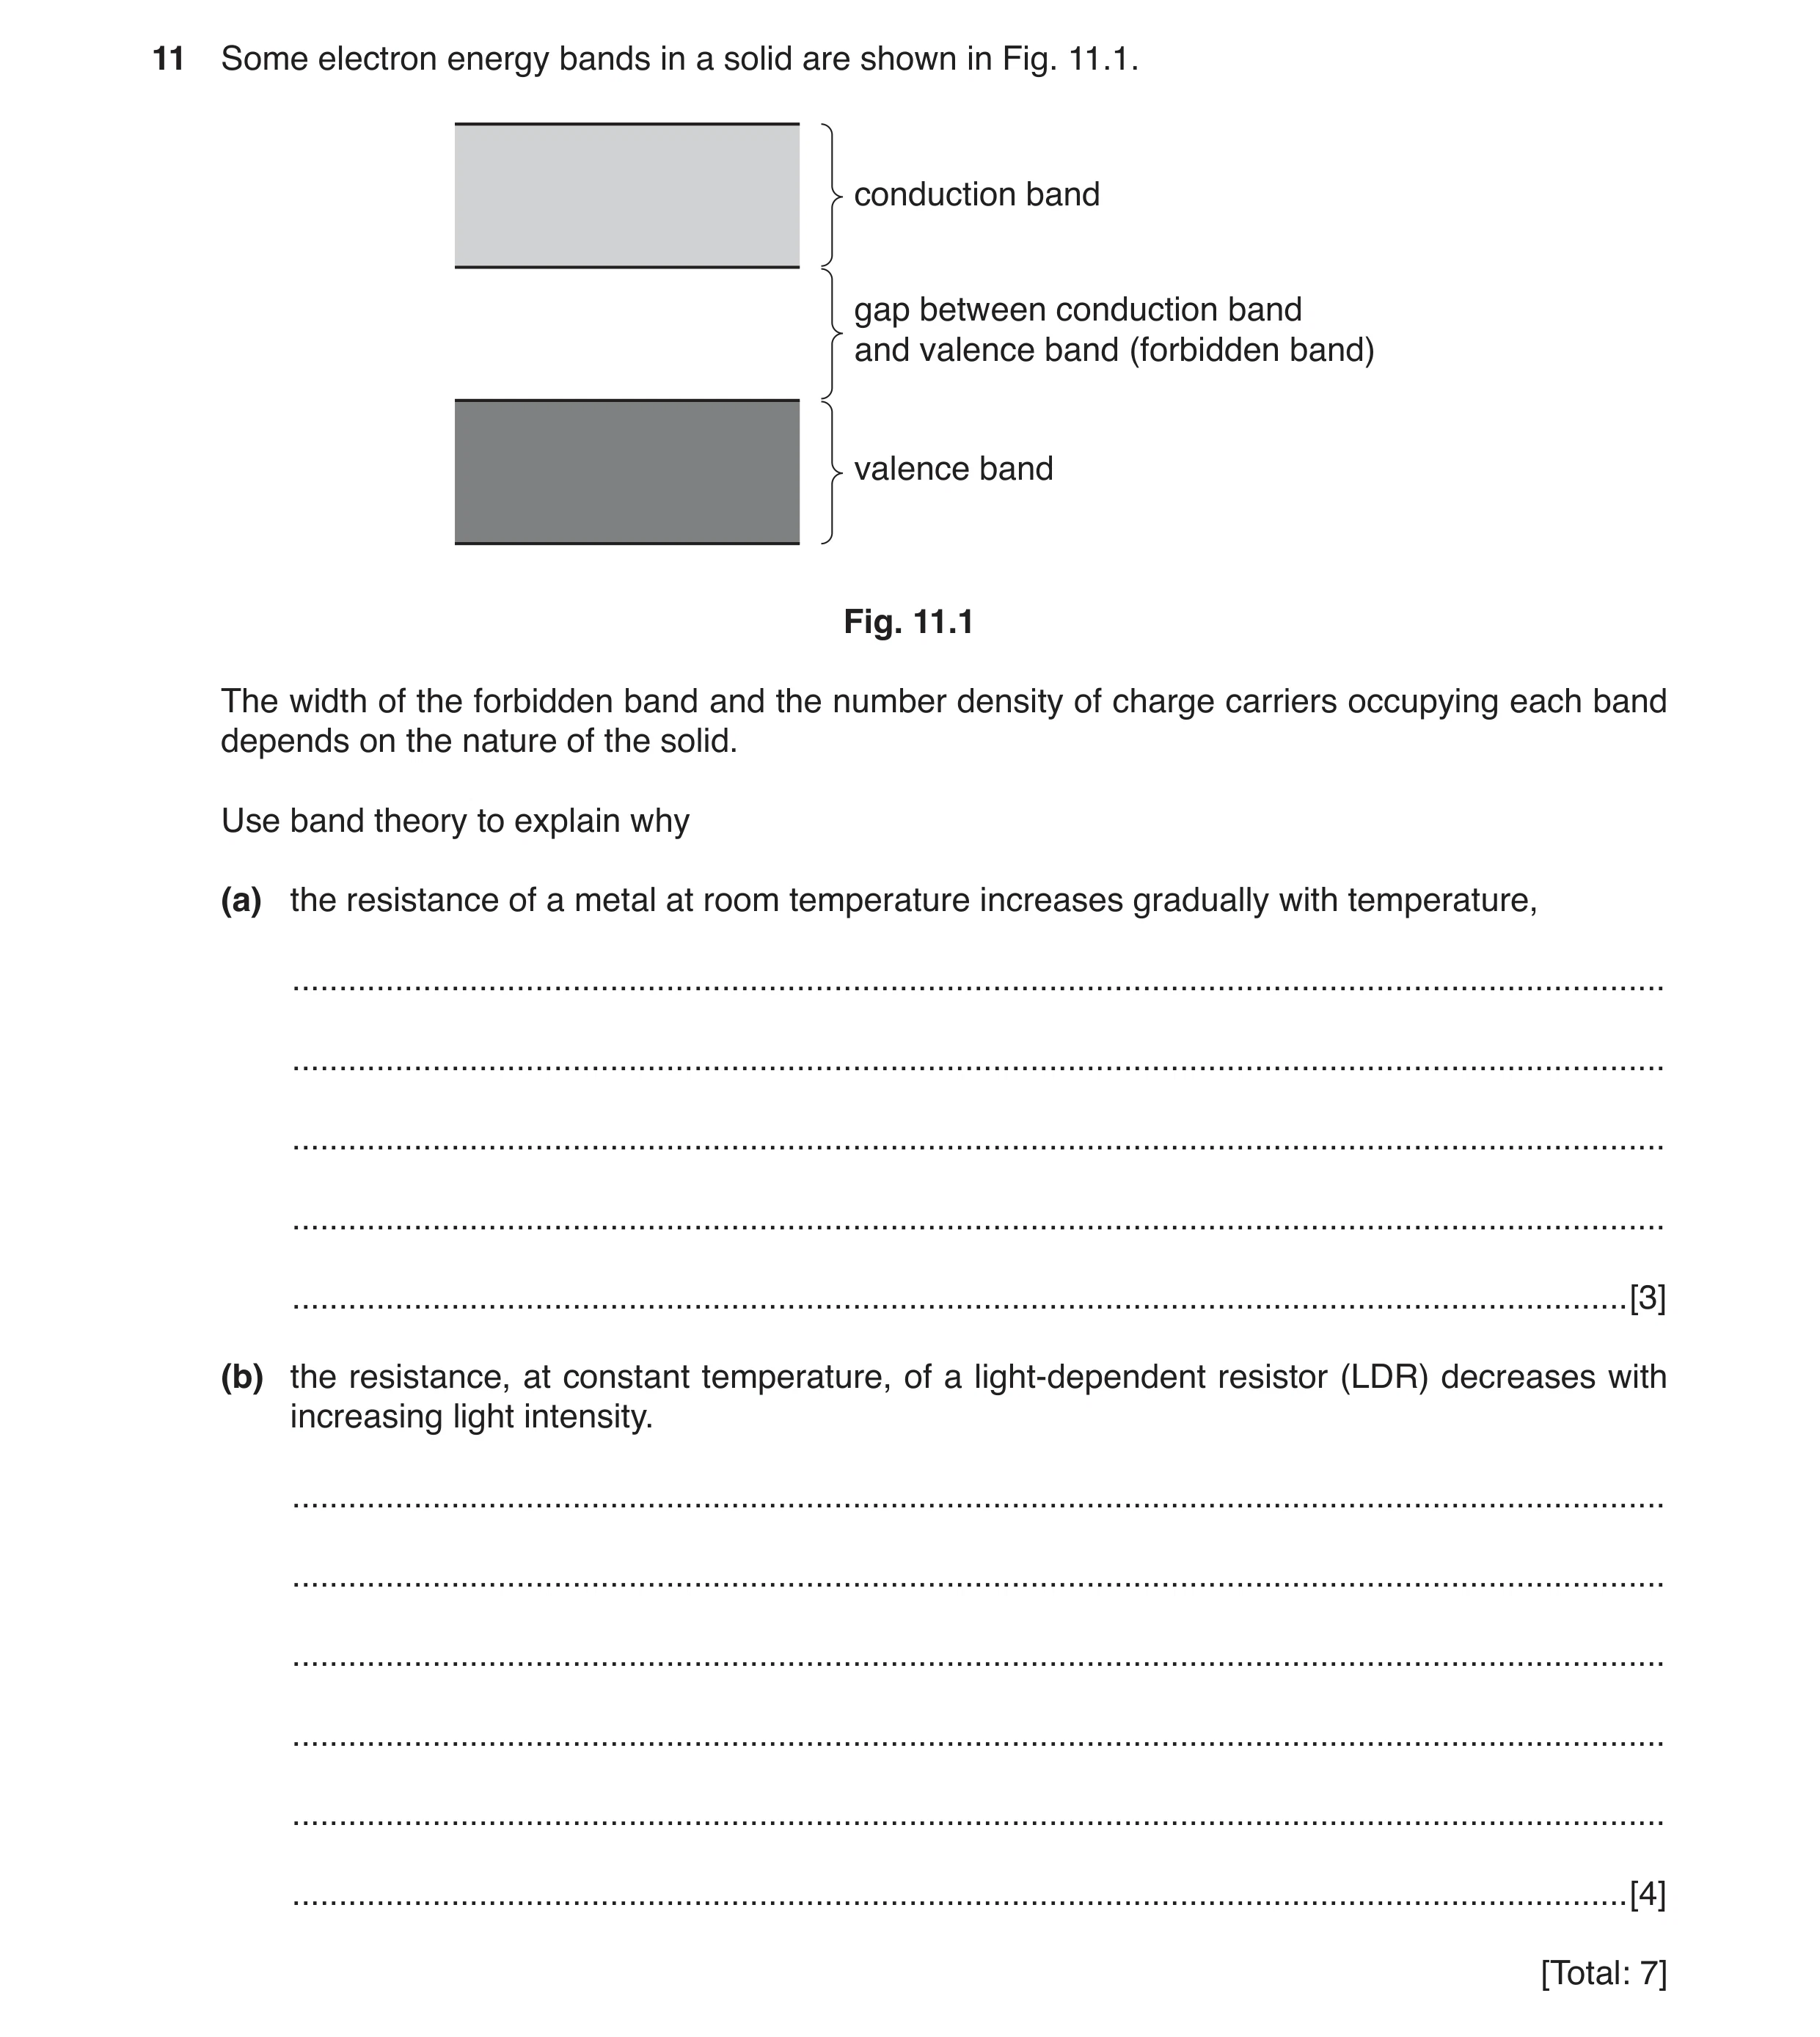
11 Some electron energy bands in a solid are shown in Fig. 11.1. conduction band gap between conduction band and valence band (forbidden band) valence band Fig. 11.1 The width of the forbidden band and the number density of charge carriers occupying each band depends on the nature of the solid. Use band theory to explain why (a) the resistance of a metal at room temperature increases gradually with temperature, … … … … … [3] (b) the resistance, at constant temperature, of a light-dependent resistor (LDR) decreases with increasing light intensity. … … … … … … [4] [Total: 7]
7 marks
Mark scheme: 11(a) no forbidden band / valence and conduction bands overlap B1 no change in number of charge carriers (as temperature rises) B1 increased lattice vibrations so resistance increases B1 11(b) photons captured / absorbed by electrons in valence band B1 electrons promoted to conduction band B1 leaving holes in the valence band B1 more holes and / or electrons so resistance decreases B1
This question in 9702/42 Feb/March 2018
Q3 · Use band theory to explain why the resistance of an intrinsic semiconductor decreases as… 9702/42 May/June 2019
7 (a) Use band theory to explain why the resistance of an intrinsic semiconductor decreases as its temperature rises. … … … … … … … … [5] (b) The variation with temperature t of the resistance R of a thermistor is shown in Fig. 7.1. 3.5 3.0 R / kΩ 2.5 2.0 1.5 1.0 0 5 10 15 20 25 30 t / °C Fig. 7.1 The thermistor is connected into the circuit shown in Fig. 7.2. 12.0 kΩ 9.00 V A R B Fig. 7.2 The battery has electromotive force (e.m.f.) 9.00 V and negligible internal resistance. When the temperature of the thermistor is 25 °C, the potential difference between the terminals A and B is 1.00 V. The temperature of the thermistor changes from 25 °C to 10 °C. Determine, to two significant figures, the change in potential difference between A and B. change = … V [3] (c) The temperature of the thermistor in (b) changes from 25 °C to 10 °C at a constant rate. State two reasons why the potential difference between A and B does not change at a constant rate. 1. … … 2. … … [2] [Total: 10]
10 marks
Mark scheme: 7(a) Any five from: • (as temperature rises) energy of electrons increases • electrons (have enough energy to) cross forbidden band • electrons enter conduction band • leaving holes in valence band • both holes and electrons act as charge carriers • more charge carriers results in lower resistance • increased lattice vibrations outweighed by increase in (number of) charge carriers B5 7(b) (at 10 °C resistance is) 2.55 kΩ C1 new potential difference = 9.00 × 2.55 / (2.55 + 12.0) = 1.58 V C1 change in p.d. = 0.58 V A1 7(c) change of resistance with temperature is not linear B1 change in potential with resistance is not linear or potential divider equation is non-linear B1
This question in 9702/42 May/June 2019
Q4 · The upper electron energy bands in an intrinsic semiconductor material are illustrated in… 9702/42 Oct/Nov 2019
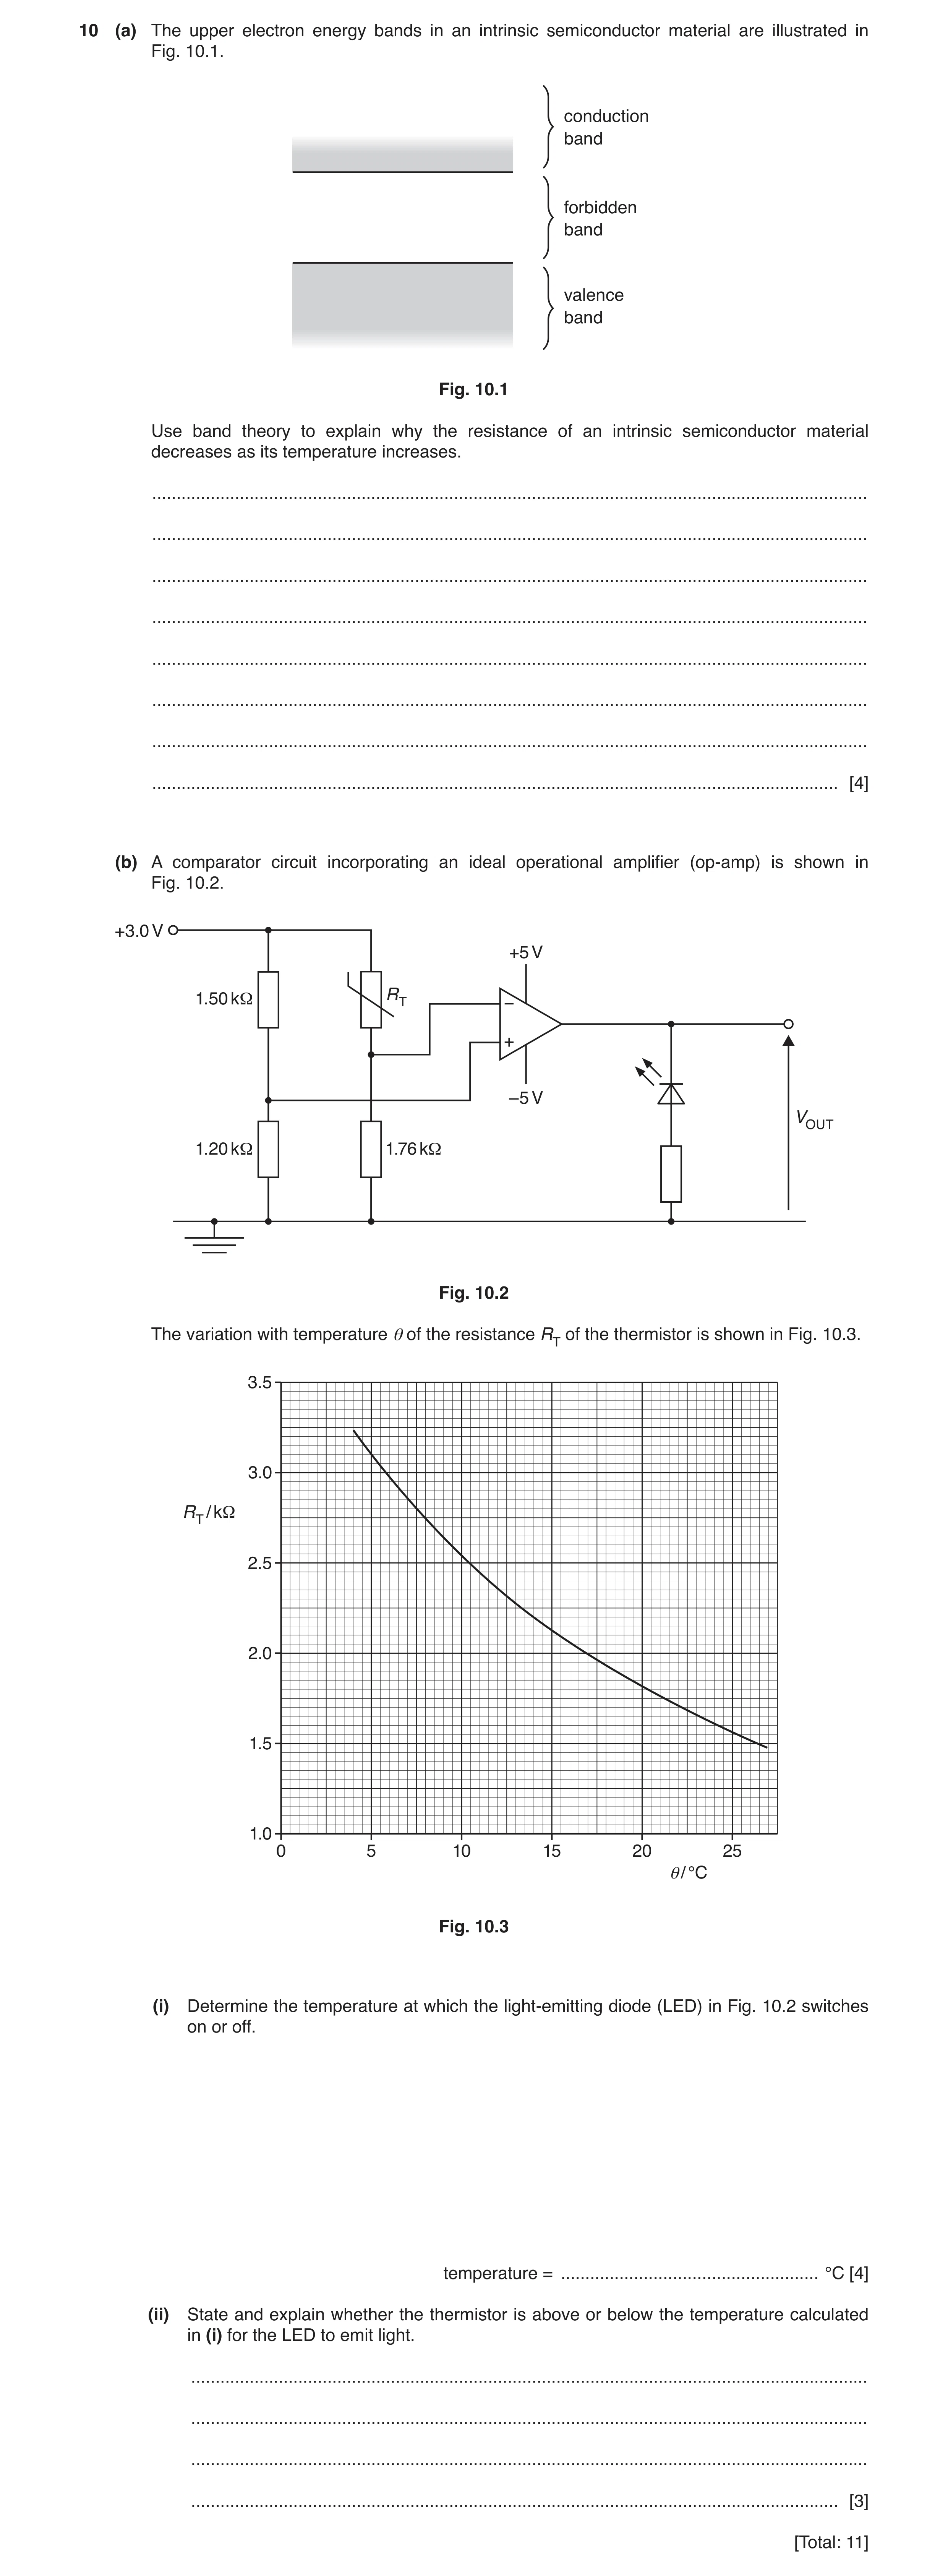
10 (a) The upper electron energy bands in an intrinsic semiconductor material are illustrated in Fig. 10.1. conduction band forbidden band valence band Fig. 10.1 Use band theory to explain why the resistance of an intrinsic semiconductor material decreases as its temperature increases. … … … … … … … … [4] (b) A comparator circuit incorporating an ideal operational amplifier (op-amp) is shown in Fig. 10.2. +3.0 V +5 V 1.50 kΩ RT –5 V VOUT 1.20 kΩ 1.76 kΩ Fig. 10.2 The variation with temperature θ of the resistance RT of the thermistor is shown in Fig. 10.3. 3.5 3.0 RT / kΩ 2.5 2.0 1.5 1.0 0 5 10 15 20 25 θ/ °C Fig. 10.3 (i) Determine the temperature at which the light-emitting diode (LED) in Fig. 10.2 switches on or off. temperature = … °C [4] (ii) State and explain whether the thermistor is above or below the temperature calculated in (i) for the LED to emit light. … … … … [3] [Total: 11]
11 marks
Mark scheme: 10(a) (as temperature rises) electrons in valence band gain energy B1 electrons jump to conduction band B1 holes are left in the valence band B1 increased number (density) of charge carriers causes lower resistance B1 10(b)(i) V– = V+ C1 1.50 / 1.20 = RT / 1.76 C1 RT = 2.2 (kΩ) C1 temperature = 14 °C A1 10(b)(ii) (For LED to conduct,) VOUT must be negative B1 V– > V+ B1 RT must be lower so temperature must be above (b)(i) value B1
This question in 9702/42 Oct/Nov 2019
Question 5 9702/42 Feb/March 2020
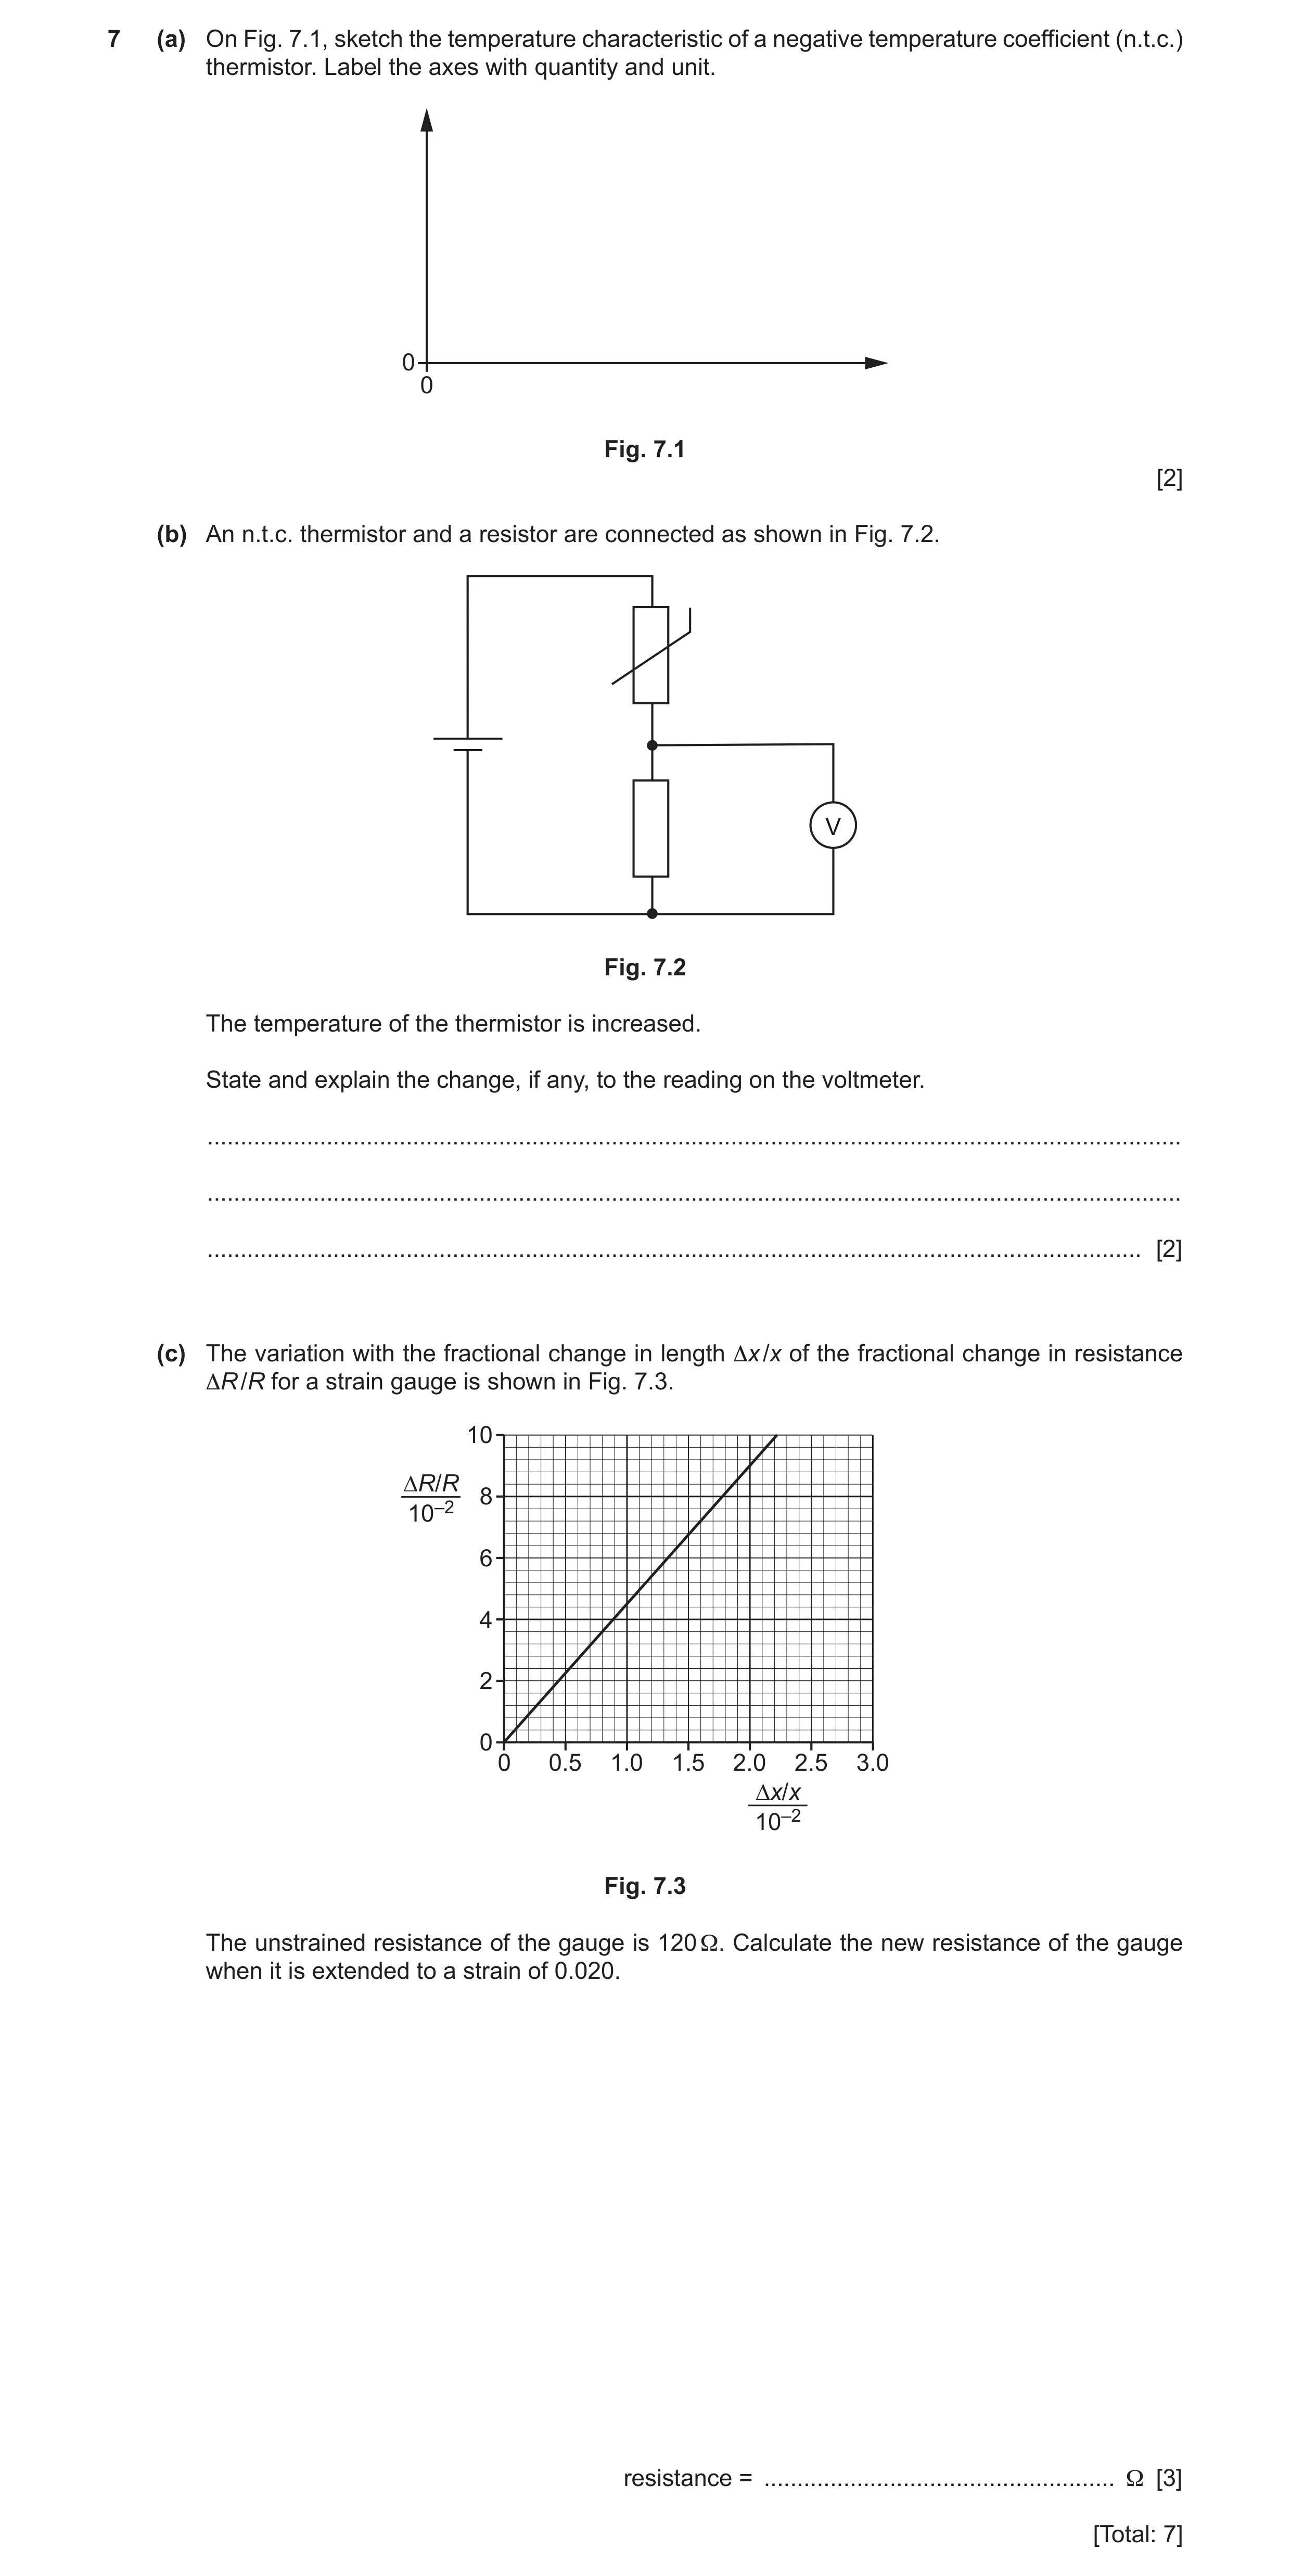
7 (a) On Fig. 7.1, sketch the temperature characteristic of a negative temperature coefficient (n.t.c.) thermistor. Label the axes with quantity and unit. 0 0 Fig. 7.1 [2] (b) An n.t.c. thermistor and a resistor are connected as shown in Fig. 7.2. V Fig. 7.2 The temperature of the thermistor is increased. State and explain the change, if any, to the reading on the voltmeter. … … … [2] (c) The variation with the fractional change in length Δx /x of the fractional change in resistance ΔR /R for a strain gauge is shown in Fig. 7.3. 10 ∆R/R 8 10–2 6 4 2 0 0 0.5 1.0 1.5 2.0 2.5 3.0 ∆x/x 10–2 Fig. 7.3 The unstrained resistance of the gauge is 120 Ω. Calculate the new resistance of the gauge when it is extended to a strain of 0.020. resistance = … Ω [3] [Total: 7]
7 marks
Mark scheme: 7(a) axes labelled with resistance and temperature M0 concave curve not touching temperature axis A1 line with negative gradient throughout A1 7(b) resistance of thermistor decreases B1 total circuit resistance decreases so voltmeter reading increases or current increases so voltmeter reading increases or greater proportion of resistance in fixed resistor so voltmeter reading increases or p.d. across thermistor decreases so voltmeter reading increases B1 7(c) (0.020 strain means) ΔR / R = 0.090 C1 ΔR = 0.090 × 120 = 10.8 Ω C1 resistance = 120 + 10.8 = 130 Ω A1
This question in 9702/42 Feb/March 2020
Q6 · White light passes through a cloud of cool low-pressure gas, as illustrated in Fig 9702/41 May/June 2020
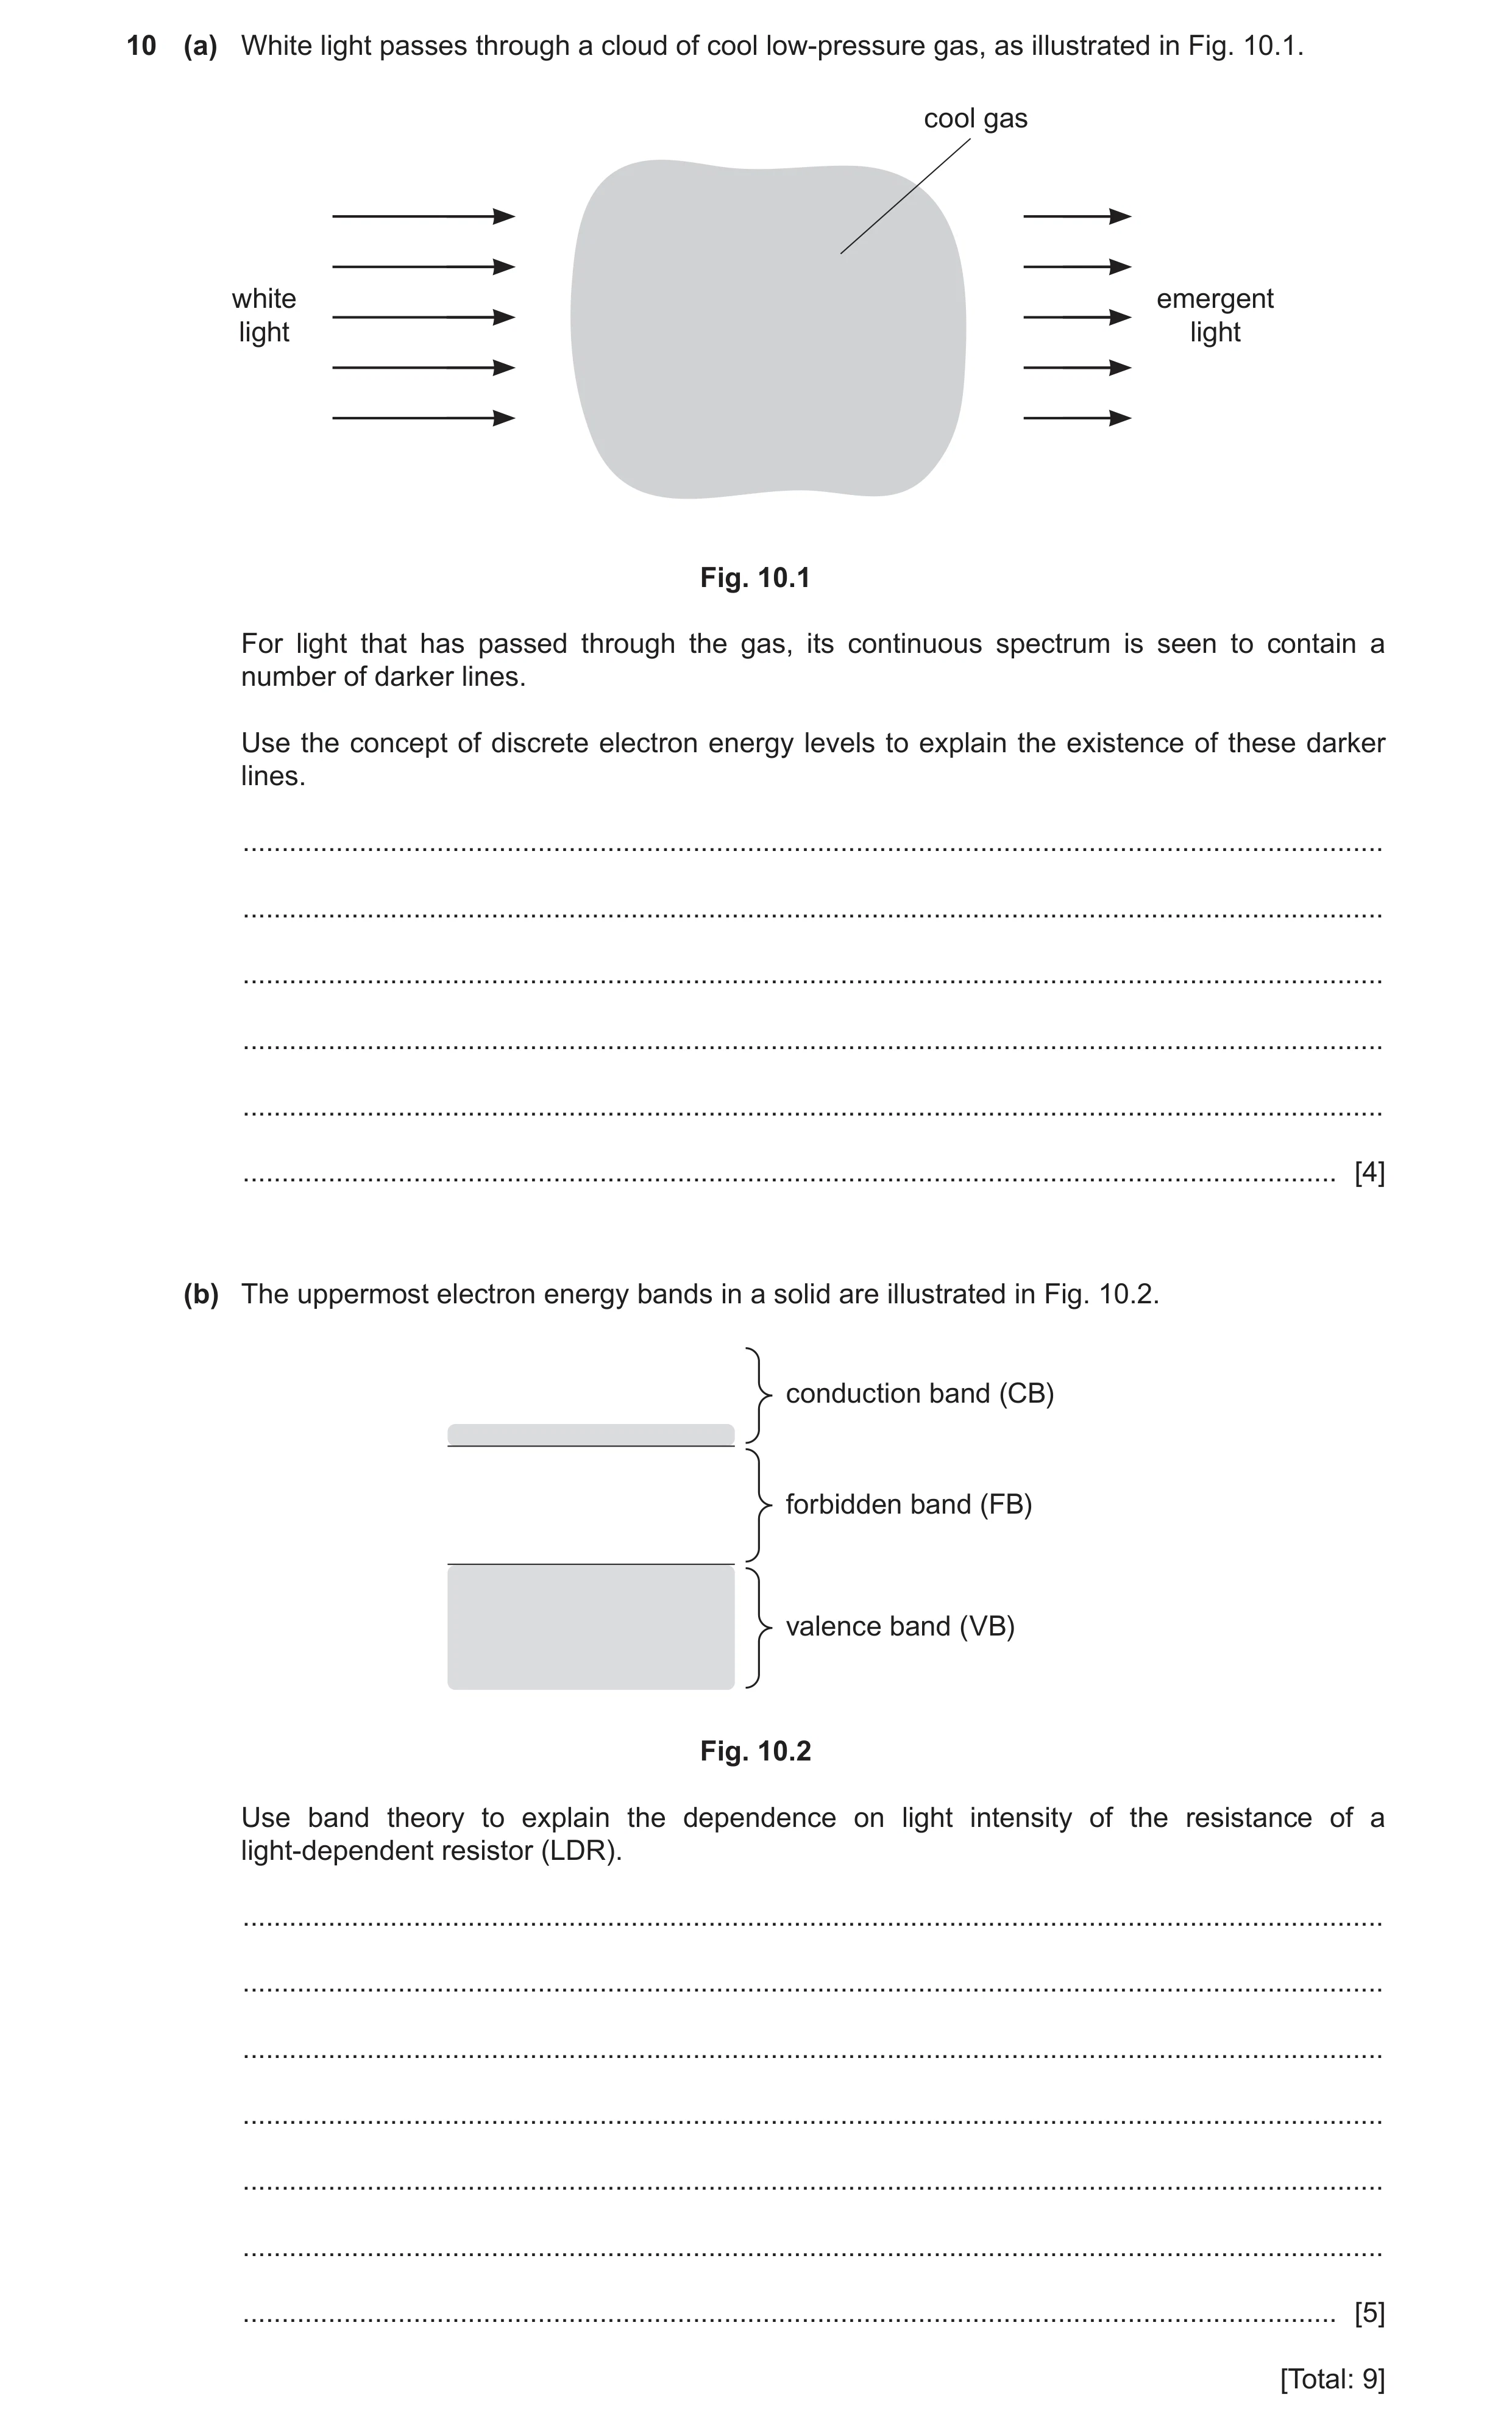
10 (a) White light passes through a cloud of cool low-pressure gas, as illustrated in Fig. 10.1. cool gas white emergent light light Fig. 10.1 For light that has passed through the gas, its continuous spectrum is seen to contain a number of darker lines. Use the concept of discrete electron energy levels to explain the existence of these darker lines. … … … … … … [4] (b) The uppermost electron energy bands in a solid are illustrated in Fig. 10.2. conduction band (CB) forbidden band (FB) valence band (VB) Fig. 10.2 Use band theory to explain the dependence on light intensity of the resistance of a light-dependent resistor (LDR). … … … … … … … [5] [Total: 9]
9 marks
Mark scheme: 10(a) • photon gives energy to electron (in an inner shell) or electron (in an inner shell) absorbs a photon • electron moves (from lower) to higher energy level • energy (of photon) is equal to difference in energy levels • electron de-excites giving off photon (of same energy) • photons emitted in all directions Any four points, 1 mark each B4 10(b) (in light) photons gives energy to electrons in VB or (in light) electrons in VB absorb photons B1 electron crosses FB/jumps to CB B1 (positive) holes left/created in VB B1 low intensity: few electrons in CB/most electrons in VB or high intensity: more photons so more electrons in CB or electron-hole pairs are charge carriers B1 more charge carriers results in lower resistance B1
This question in 9702/41 May/June 2020
Q7 · The uppermost energy bands in a solid are known as the valence band (VB), the forbidden… 9702/42 May/June 2020
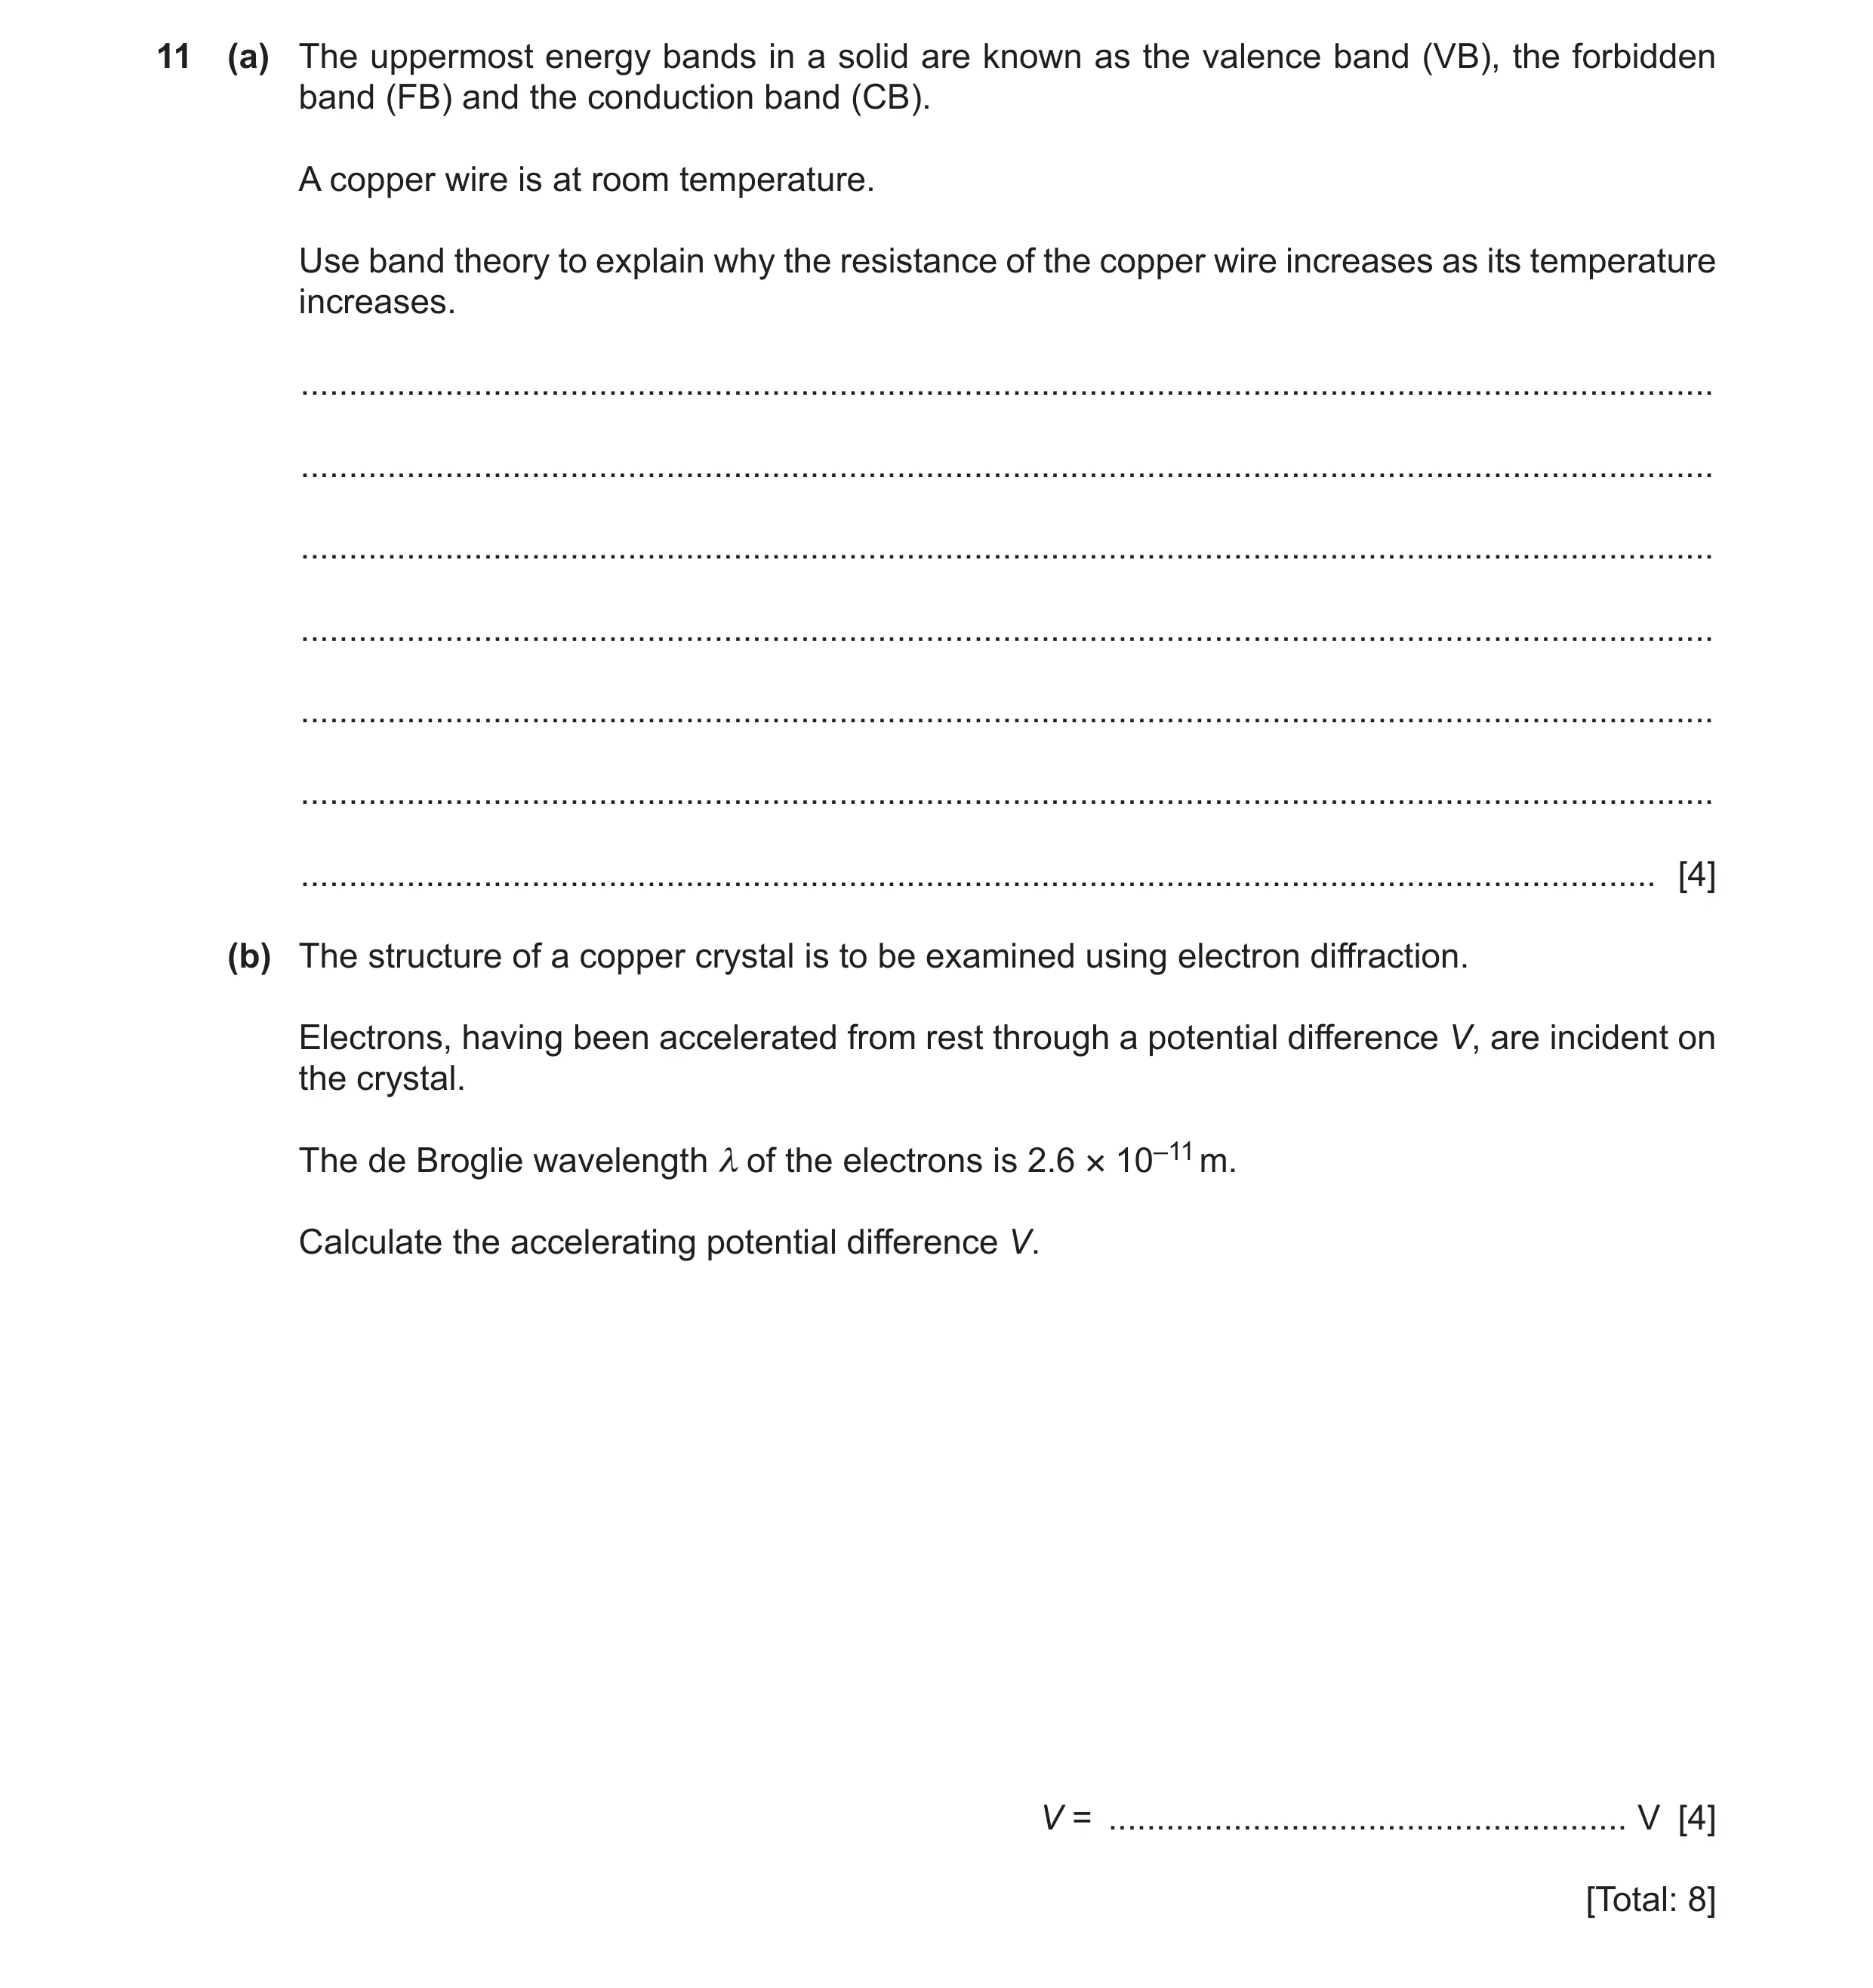
11 (a) The uppermost energy bands in a solid are known as the valence band (VB), the forbidden band (FB) and the conduction band (CB). A copper wire is at room temperature. Use band theory to explain why the resistance of the copper wire increases as its temperature increases. … … … … … … … [4] (b) The structure of a copper crystal is to be examined using electron diffraction. Electrons, having been accelerated from rest through a potential difference V, are incident on the crystal. The de Broglie wavelength λ of the electrons is 2.6 × 10⁻¹¹ m. Calculate the accelerating potential difference V. V = … V [4] [Total: 8]
8 marks
Mark scheme: 11(a) conduction band and valence band overlap B1 number (density) of charge carriers does not vary B1 increase in temperature gives rise to increased lattice vibrations B1 (lattice) vibrations hinder movement of charge carriers so resistance increases B1 11(b) mv = h / λ C1 v = (6.63 × 10⁻³⁴) / [(2.6 × 10–11) × (9.11 × 10–31)] ( = 2.80 × 10⁷ m s–1) C1 qV = ½mv2 C1 V = [9.11 × 10–31 × (2.80 × 107)2] / [2 × 1.60 × 10–19] = 2.2 × 10³ V A1
This question in 9702/42 May/June 2020
Q8 · White light passes through a cloud of cool low-pressure gas, as illustrated in Fig 9702/43 May/June 2020
10 (a) White light passes through a cloud of cool low-pressure gas, as illustrated in Fig. 10.1. cool gas white emergent light light Fig. 10.1 For light that has passed through the gas, its continuous spectrum is seen to contain a number of darker lines. Use the concept of discrete electron energy levels to explain the existence of these darker lines. … … … … … … [4] (b) The uppermost electron energy bands in a solid are illustrated in Fig. 10.2. conduction band (CB) forbidden band (FB) valence band (VB) Fig. 10.2 Use band theory to explain the dependence on light intensity of the resistance of a light-dependent resistor (LDR). … … … … … … … [5] [Total: 9]
9 marks
Mark scheme: 10(a) • photon gives energy to electron (in an inner shell) or electron (in an inner shell) absorbs a photon • electron moves (from lower) to higher energy level • energy (of photon) is equal to difference in energy levels • electron de-excites giving off photon (of same energy) • photons emitted in all directions Any four points, 1 mark each B4 10(b) (in light) photons gives energy to electrons in VB or (in light) electrons in VB absorb photons B1 electron crosses FB/jumps to CB B1 (positive) holes left/created in VB B1 low intensity: few electrons in CB/most electrons in VB or high intensity: more photons so more electrons in CB or electron-hole pairs are charge carriers B1 more charge carriers results in lower resistance B1
This question in 9702/43 May/June 2020
Q9 · State the magnitude and unit of absolute zero on the thermodynamic temperature scale 9702/41 May/June 2024
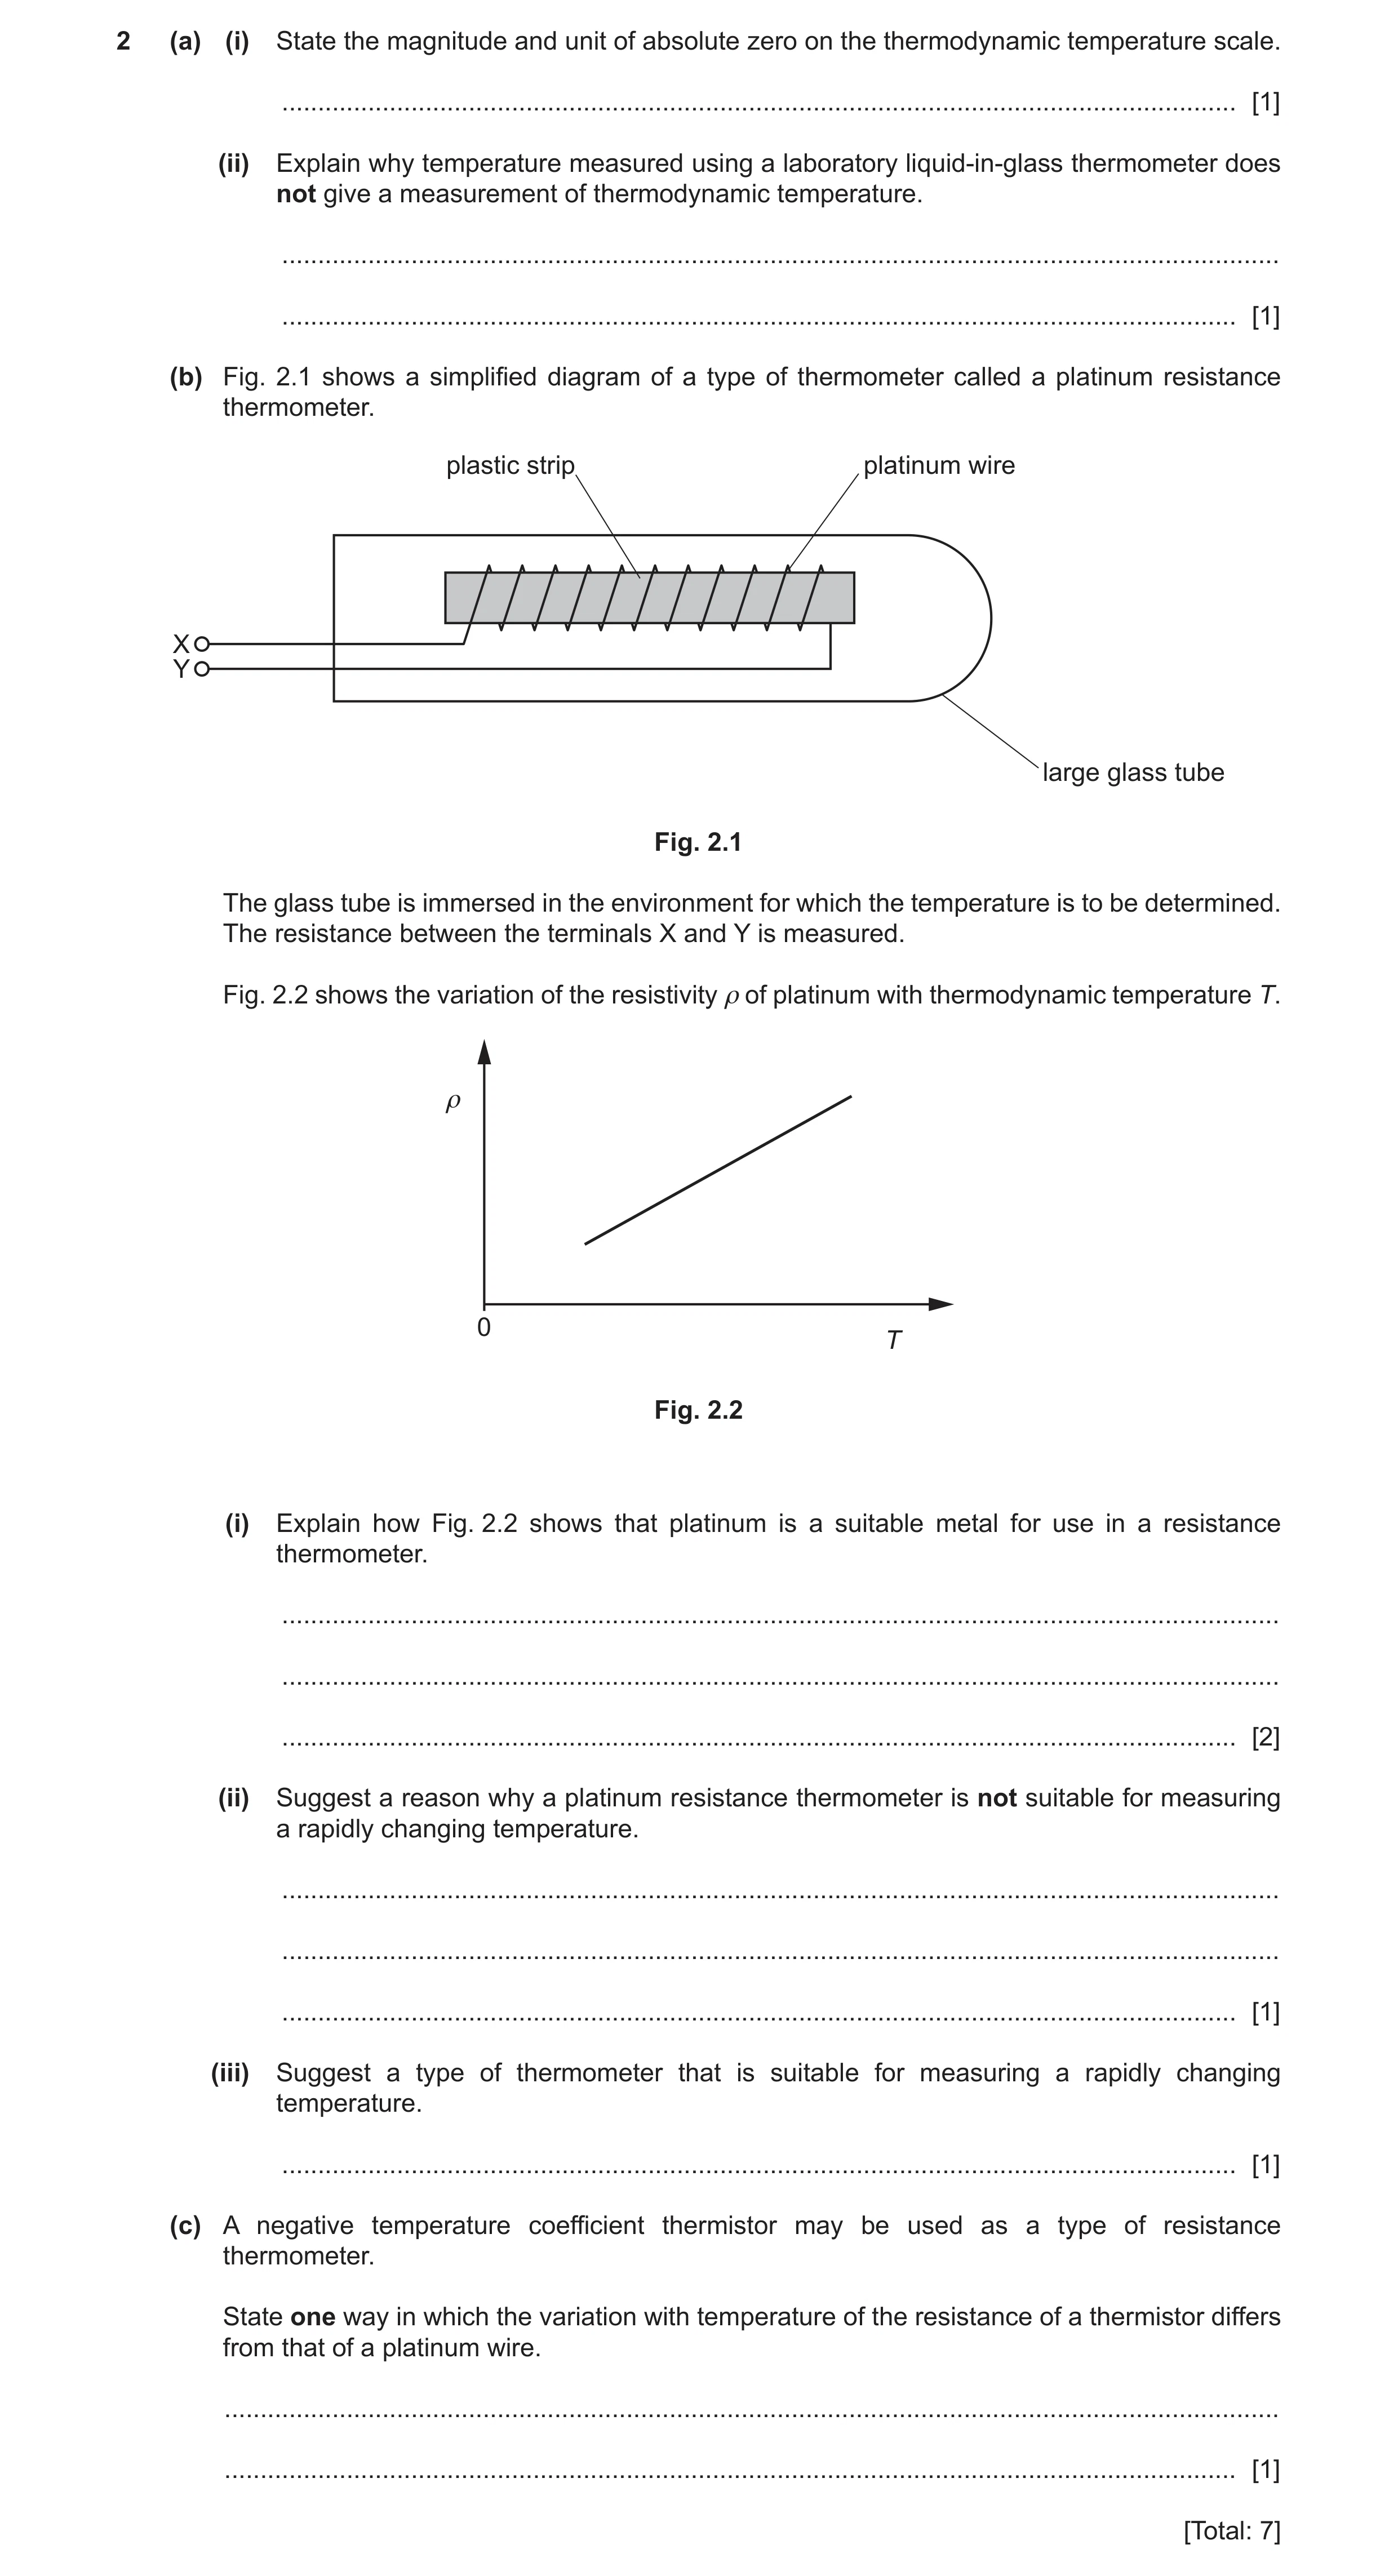
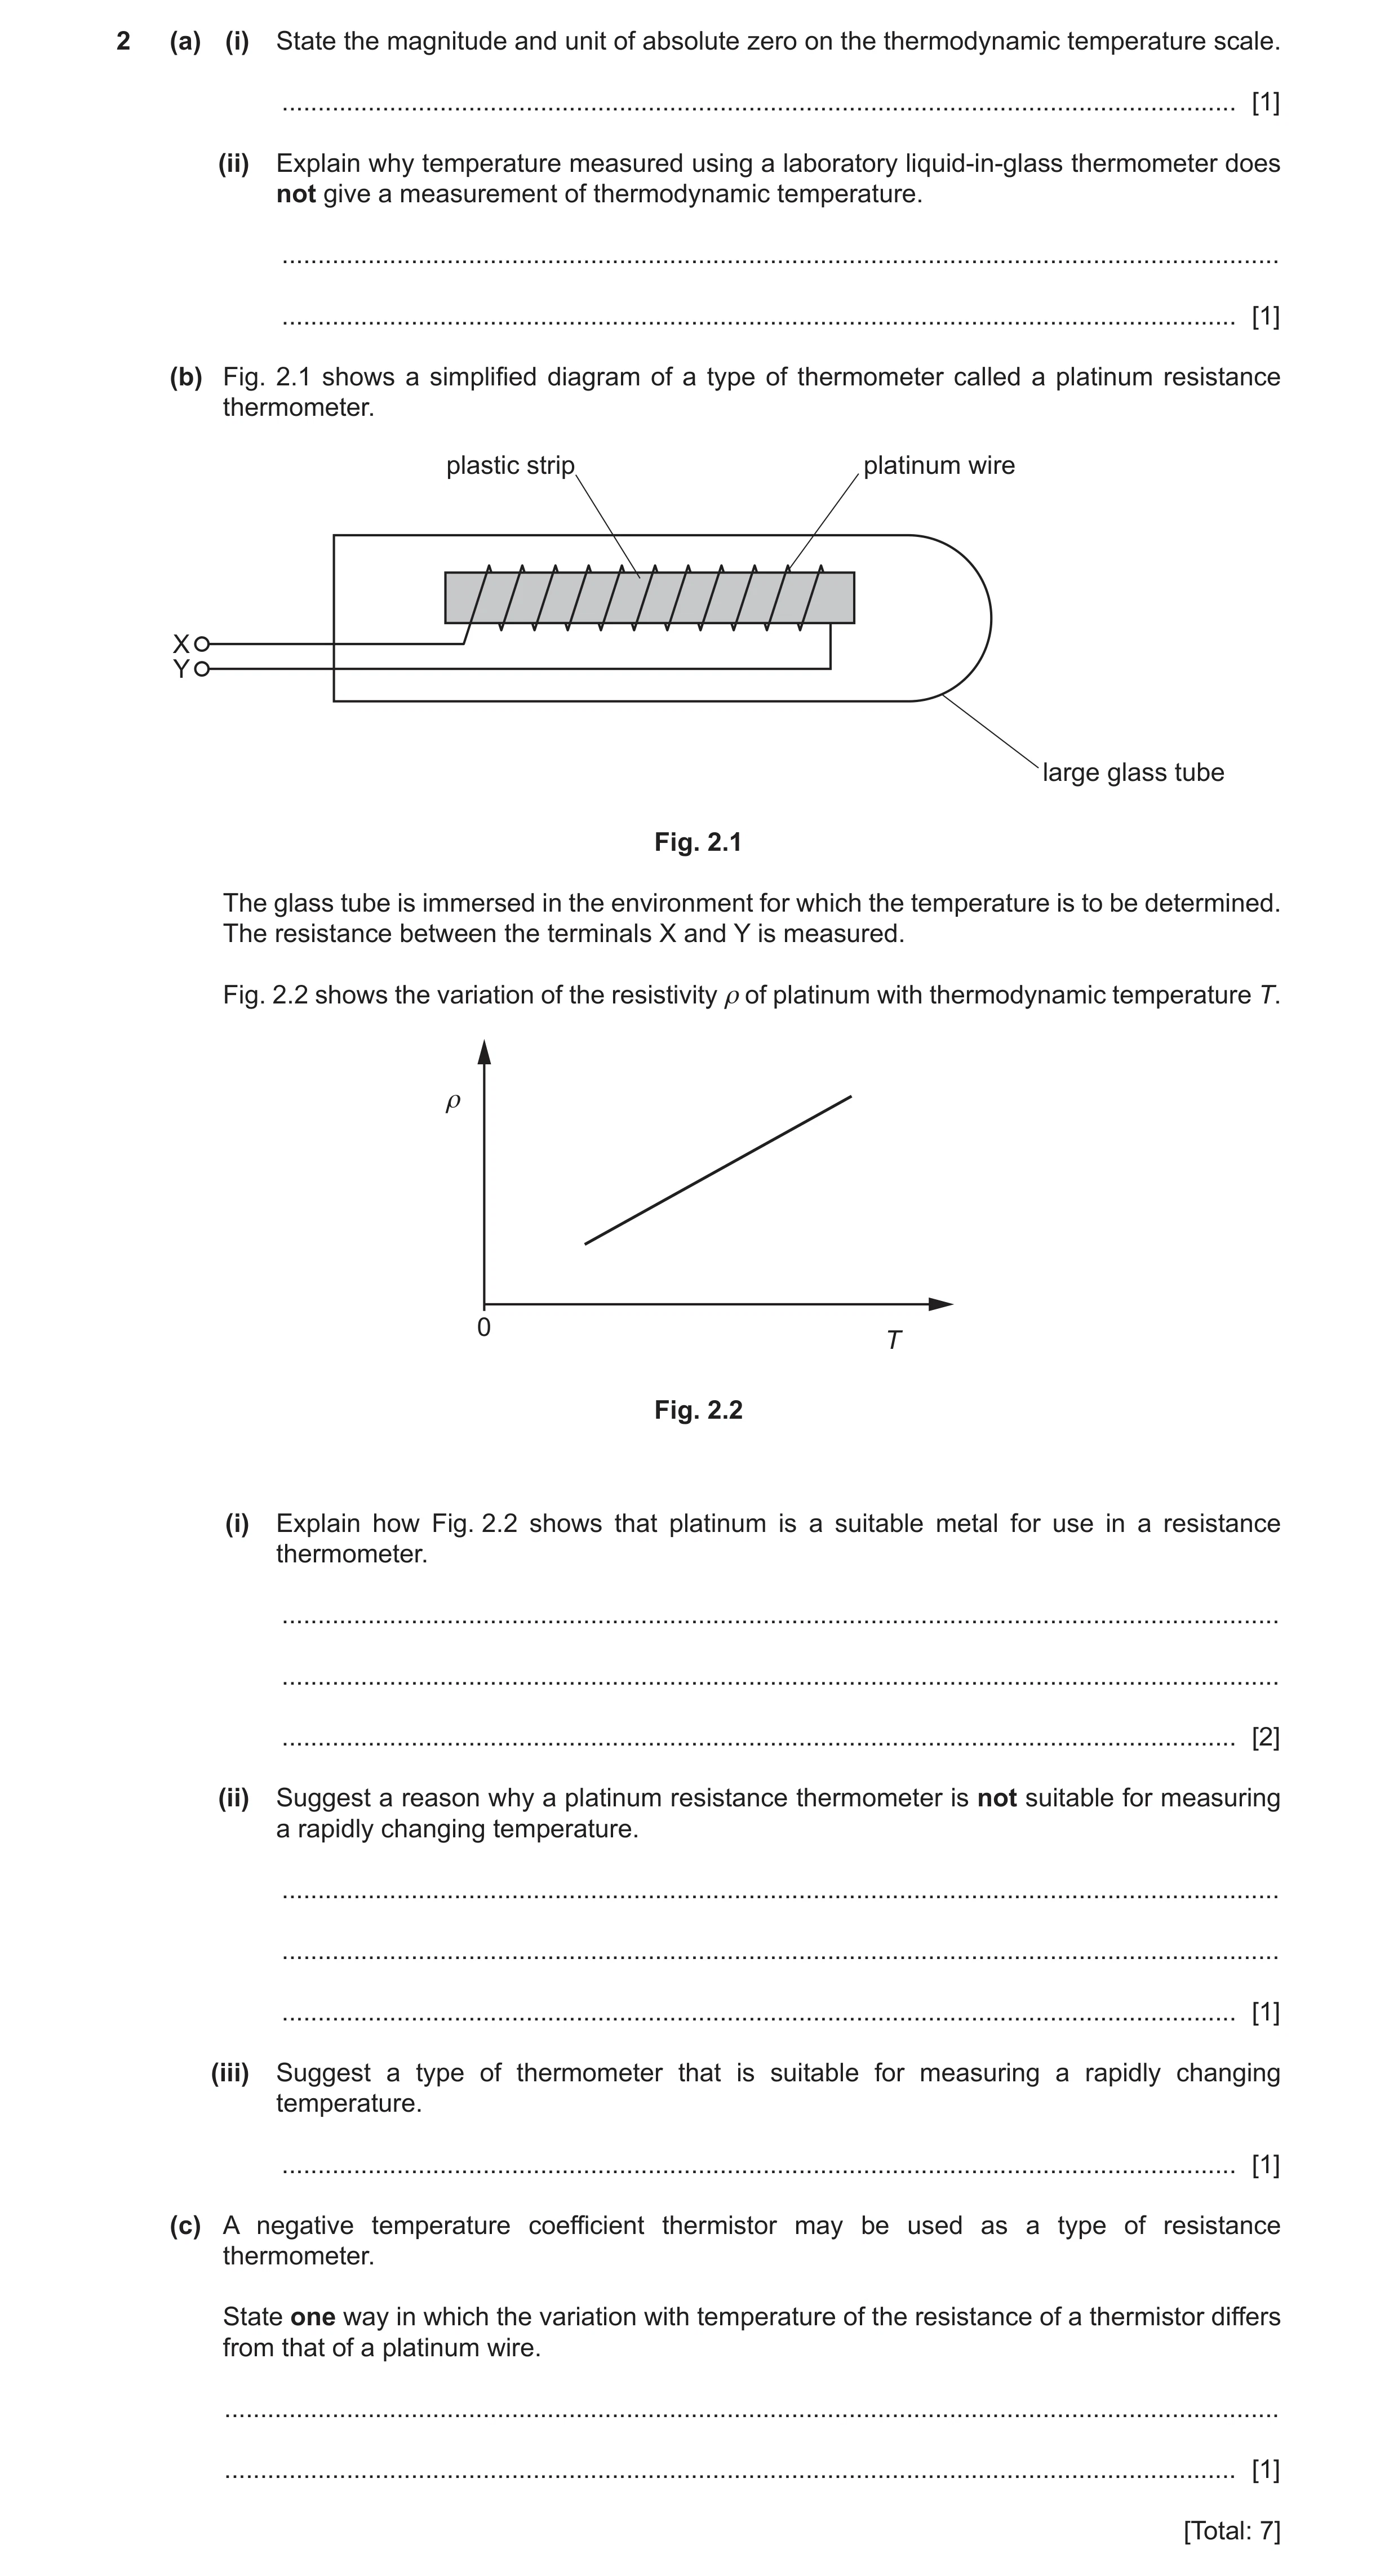
2 (a) (i) State the magnitude and unit of absolute zero on the thermodynamic temperature scale. … [1] (ii) Explain why temperature measured using a laboratory liquid-in-glass thermometer does not give a measurement of thermodynamic temperature. … … [1] (b) Fig. 2.1 shows a simplified diagram of a type of thermometer called a platinum resistance thermometer. plastic strip platinum wire X Y large glass tube Fig. 2.1 The glass tube is immersed in the environment for which the temperature is to be determined. The resistance between the terminals X and Y is measured. Fig. 2.2 shows the variation of the resistivity ρ of platinum with thermodynamic temperature T. ρ 0 T Fig. 2.2 (i) Explain how Fig. 2.2 shows that platinum is a suitable metal for use in a resistance thermometer. … … … [2] (ii) Suggest a reason why a platinum resistance thermometer is not suitable for measuring a rapidly changing temperature. … … … [1] (iii) Suggest a type of thermometer that is suitable for measuring a rapidly changing temperature. … [1] (c) A negative temperature coefficient thermistor may be used as a type of resistance thermometer. State one way in which the variation with temperature of the resistance of a thermistor differs from that of a platinum wire. … … [1] [Total: 7]
7 marks
Mark scheme: 2(a)(i) 0 K B1 2(a)(ii) (measurement) depends on properties of the liquid B1 2(b)(i) resistivity varies with temperature variation with temperature is linear unique value of resistivity for each (different value of) temperature Any two points, 1 mark each B2 2(b)(ii) thermometer has high heat capacity/specific heat capacity or energy transfer needed for thermometer to reach correct temperature or thermometer takes time to reach the correct temperature B1 2(b)(iii) thermocouple B1 2(c) (variation is) inverse or (variation is) non-linear B1
This question in 9702/41 May/June 2024
Q10 · State the magnitude and unit of absolute zero on the thermodynamic temperature scale 9702/43 May/June 2024
2 (a) (i) State the magnitude and unit of absolute zero on the thermodynamic temperature scale. … [1] (ii) Explain why temperature measured using a laboratory liquid-in-glass thermometer does not give a measurement of thermodynamic temperature. … … [1] (b) Fig. 2.1 shows a simplified diagram of a type of thermometer called a platinum resistance thermometer. plastic strip platinum wire X Y large glass tube Fig. 2.1 The glass tube is immersed in the environment for which the temperature is to be determined. The resistance between the terminals X and Y is measured. Fig. 2.2 shows the variation of the resistivity ρ of platinum with thermodynamic temperature T. ρ 0 T Fig. 2.2 (i) Explain how Fig. 2.2 shows that platinum is a suitable metal for use in a resistance thermometer. … … … [2] (ii) Suggest a reason why a platinum resistance thermometer is not suitable for measuring a rapidly changing temperature. … … … [1] (iii) Suggest a type of thermometer that is suitable for measuring a rapidly changing temperature. … [1] (c) A negative temperature coefficient thermistor may be used as a type of resistance thermometer. State one way in which the variation with temperature of the resistance of a thermistor differs from that of a platinum wire. … … [1] [Total: 7]
7 marks
Mark scheme: 2(a)(i) 0 K B1 2(a)(ii) (measurement) depends on properties of the liquid B1 2(b)(i) resistivity varies with temperature variation with temperature is linear unique value of resistivity for each (different value of) temperature Any two points, 1 mark each B2 2(b)(ii) thermometer has high heat capacity/specific heat capacity or energy transfer needed for thermometer to reach correct temperature or thermometer takes time to reach the correct temperature B1 2(b)(iii) thermocouple B1 2(c) (variation is) inverse or (variation is) non-linear B1
This question in 9702/43 May/June 2024
Q11 · A circuit that rectifies an alternating input voltage VIN and produces an output voltage… 9702/43 May/June 2025
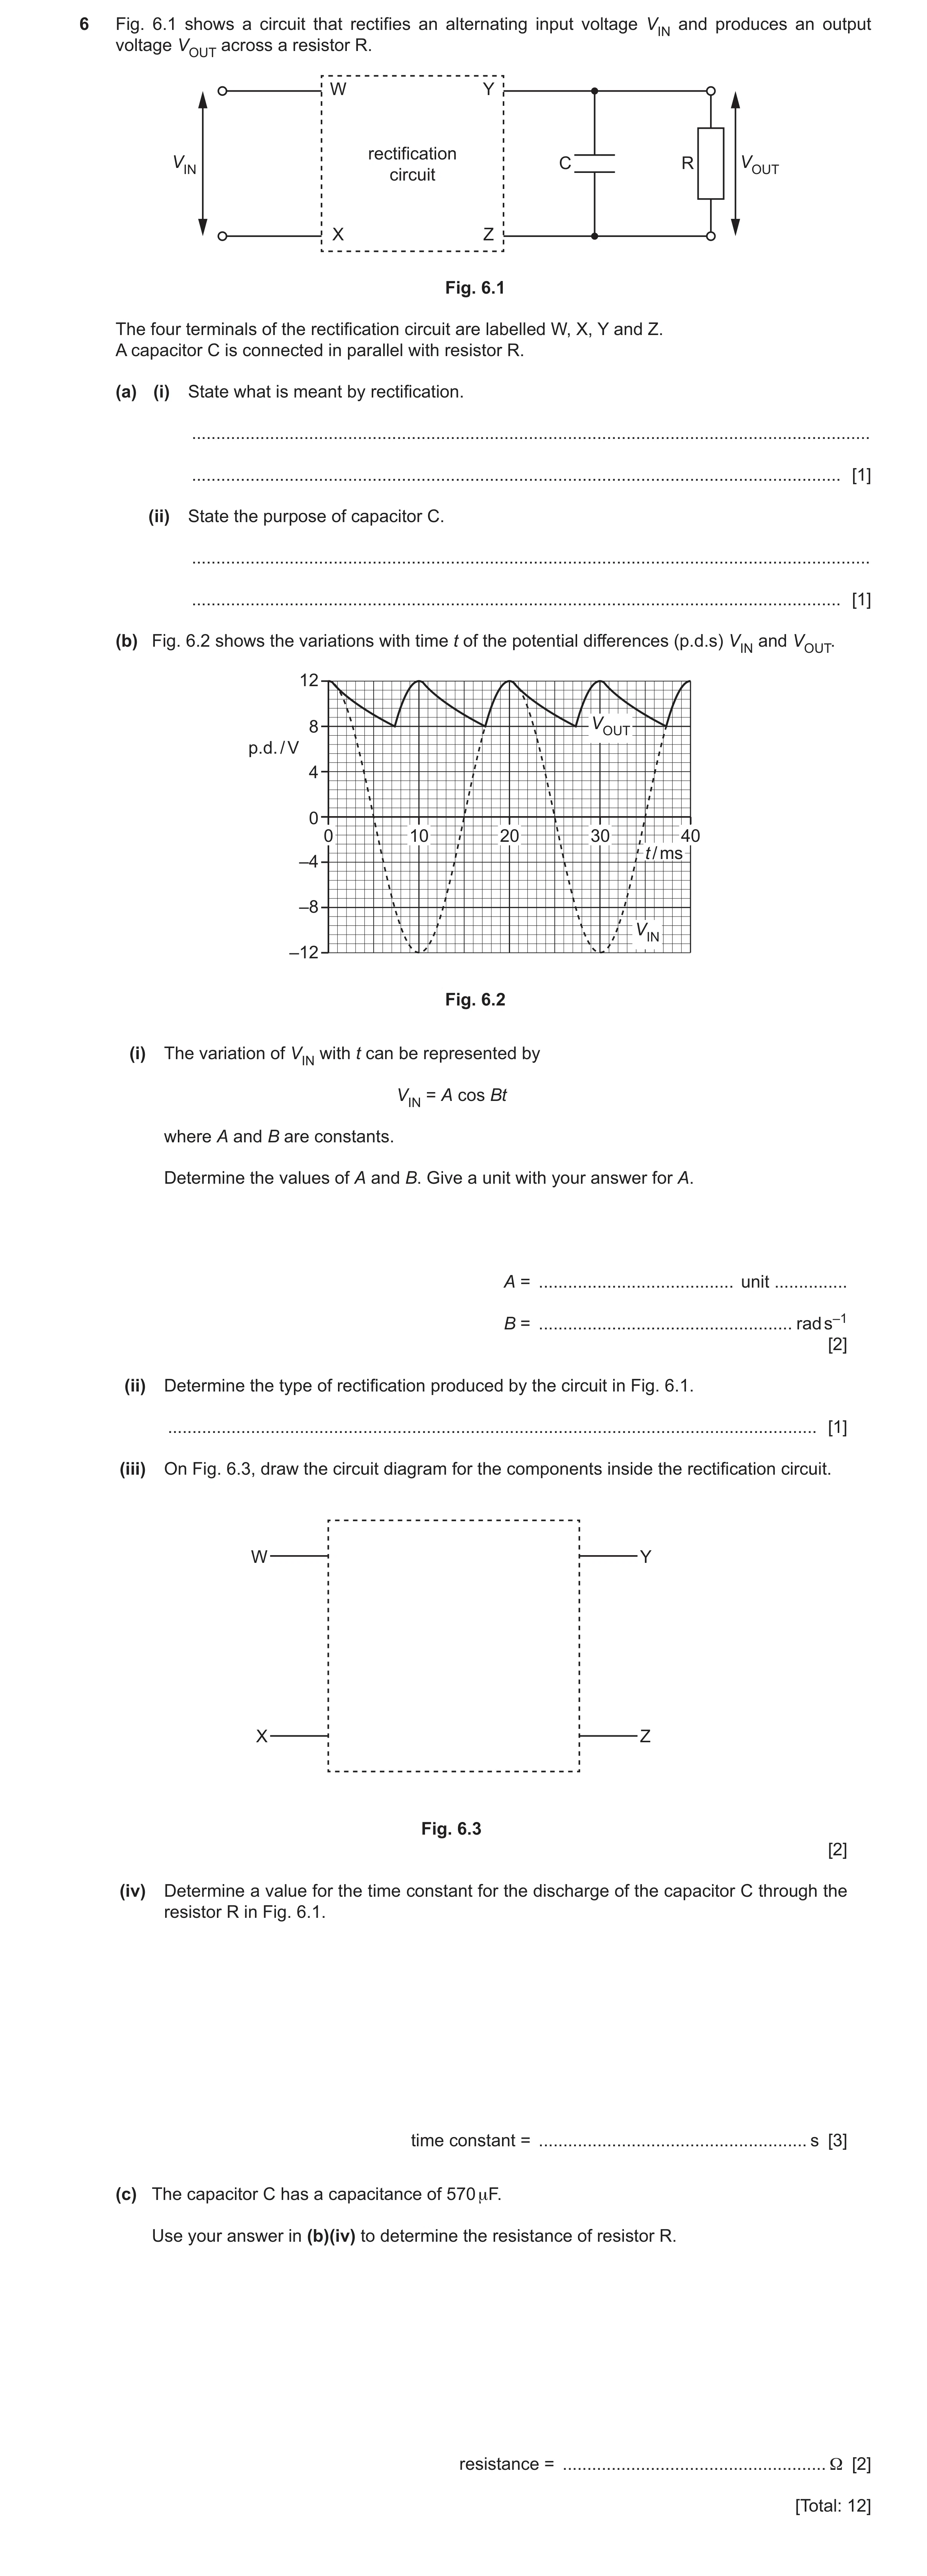
6 Fig. 6.1 shows a circuit that rectifies an alternating input voltage VIN and produces an output voltage VOUT across a resistor R. W Y rectification VIN C R VOUT circuit X Z Fig. 6.1 The four terminals of the rectification circuit are labelled W, X, Y and Z. A capacitor C is connected in parallel with resistor R. (a) (i) State what is meant by rectification. … … [1] (ii) State the purpose of capacitor C. … … [1] (b) Fig. 6.2 shows the variations with time t of the potential differences (p.d.s) VIN and VOUT. 12 8 VOUT p.d. / V 4 0 0 10 20 30 40 t / ms –4 –8 VIN –12 Fig. 6.2 (i) The variation of VIN with t can be represented by VIN = A cos Bt where A and B are constants. Determine the values of A and B. Give a unit with your answer for A. A = … unit … B = … rad s–1 [2] (ii) Determine the type of rectification produced by the circuit in Fig. 6.1. … [1] (iii) On Fig. 6.3, draw the circuit diagram for the components inside the rectification circuit. W Y X Z Fig. 6.3 [2] (iv) Determine a value for the time constant for the discharge of the capacitor C through the resistor R in Fig. 6.1. time constant = … s [3] (c) The capacitor C has a capacitance of 570 μF. Use your answer in (b)(iv) to determine the resistance of resistor R. resistance = … Ω [2] [Total: 12]
12 marks
Mark scheme: 6(a)(i) conversion from a.c. to d.c. B1 6(a)(ii) smoothing B1 6(b)(i) A = 12 V A1 B = 2 / (20 × 10–3) A1 = 310 rad s–1 6(b)(ii) full-wave (rectification) B1 6(b)(iii) four diodes shown, with correct circuit symbols B1 four diodes correctly connected to form a bridge rectifier B1 6(b)(iv) V = V0 exp (–t / ) C1 or V = V0 exp (–t / RC) and = RC 8.0 = 12 exp (– 7.3 × 10⁻³ / ) C1 = 0.018 s A1 6(c) time constant = RC C1 R = (0.018 / 570 × 10–6) A1 = 32
This question in 9702/43 May/June 2025
 1 / 16
 2 / 16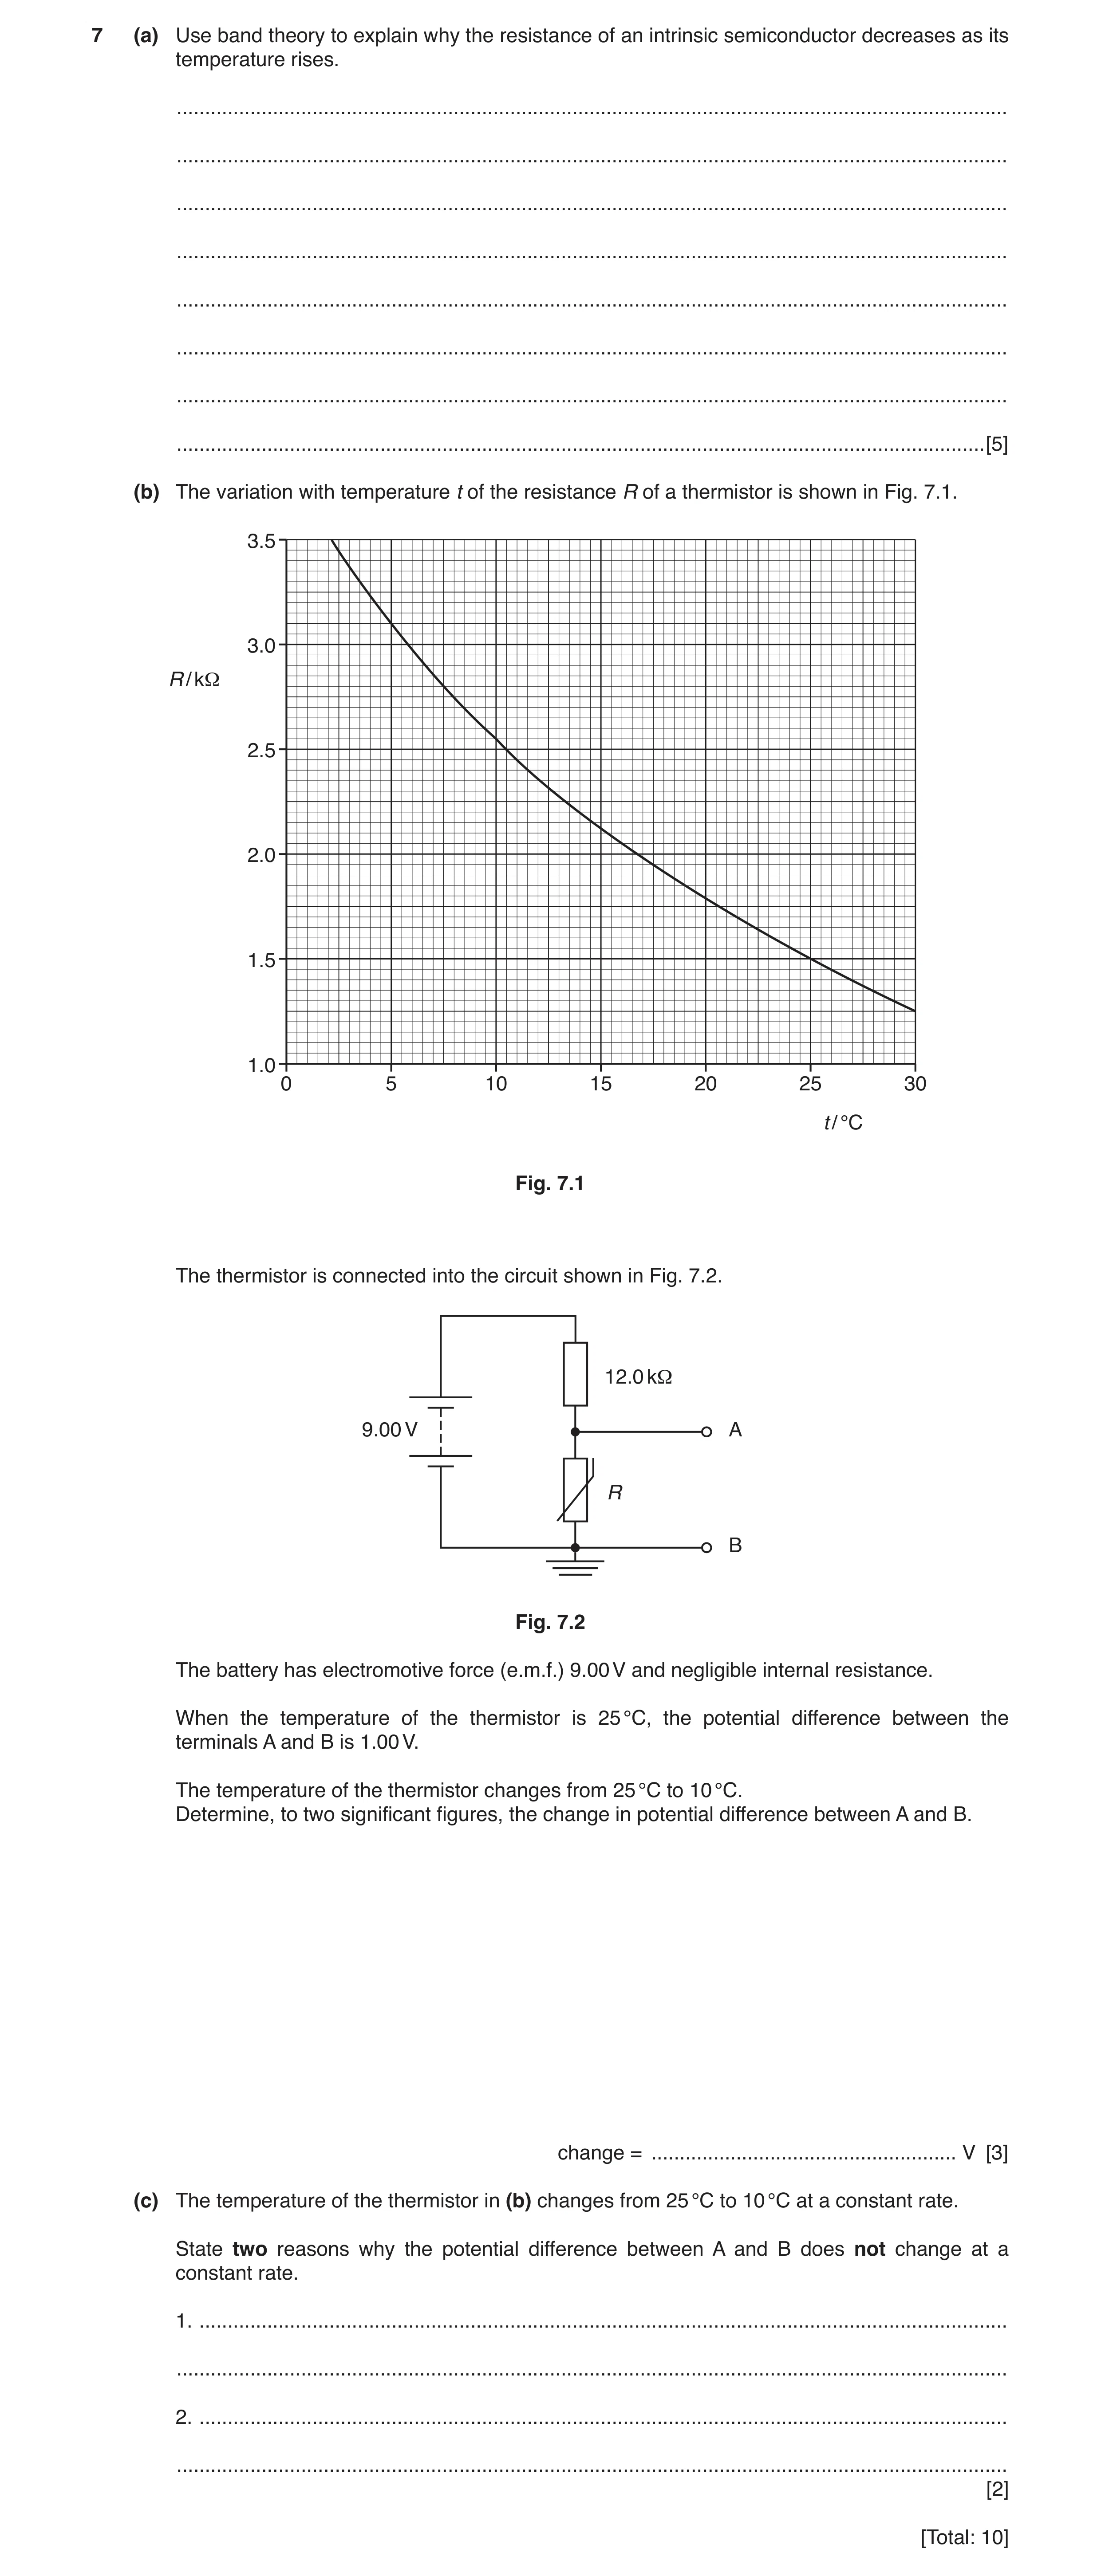
 10 / 16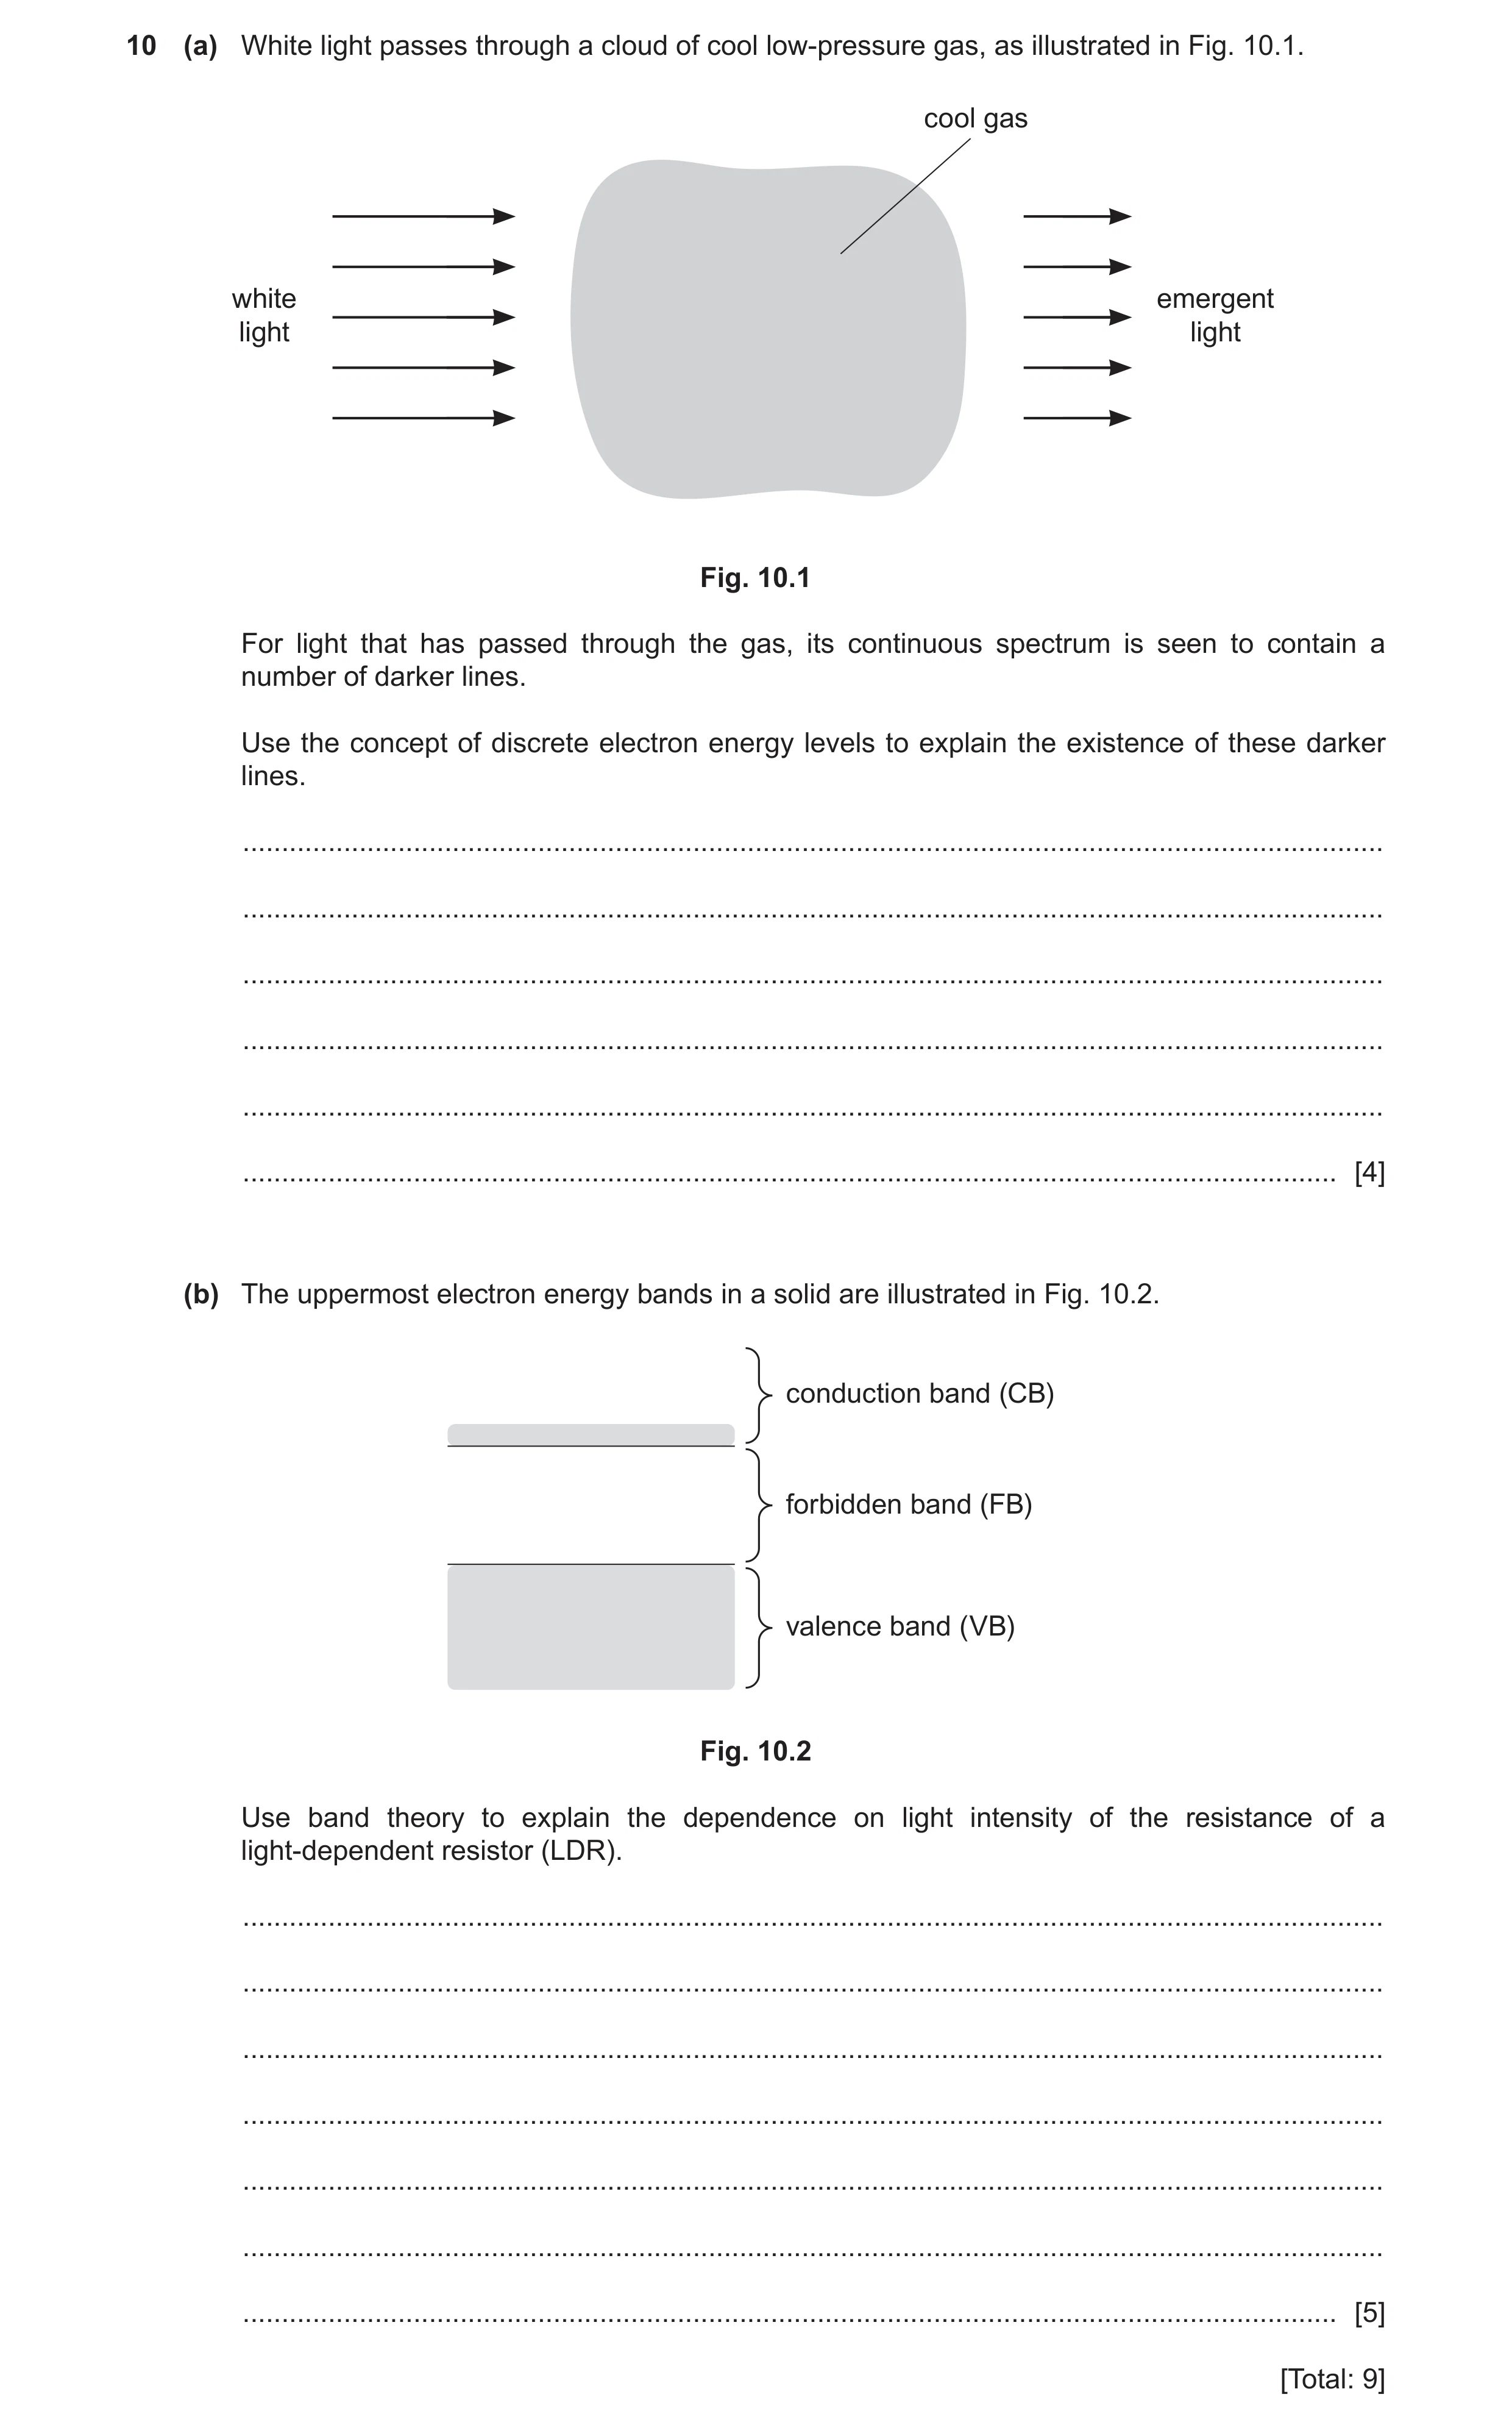
 5
5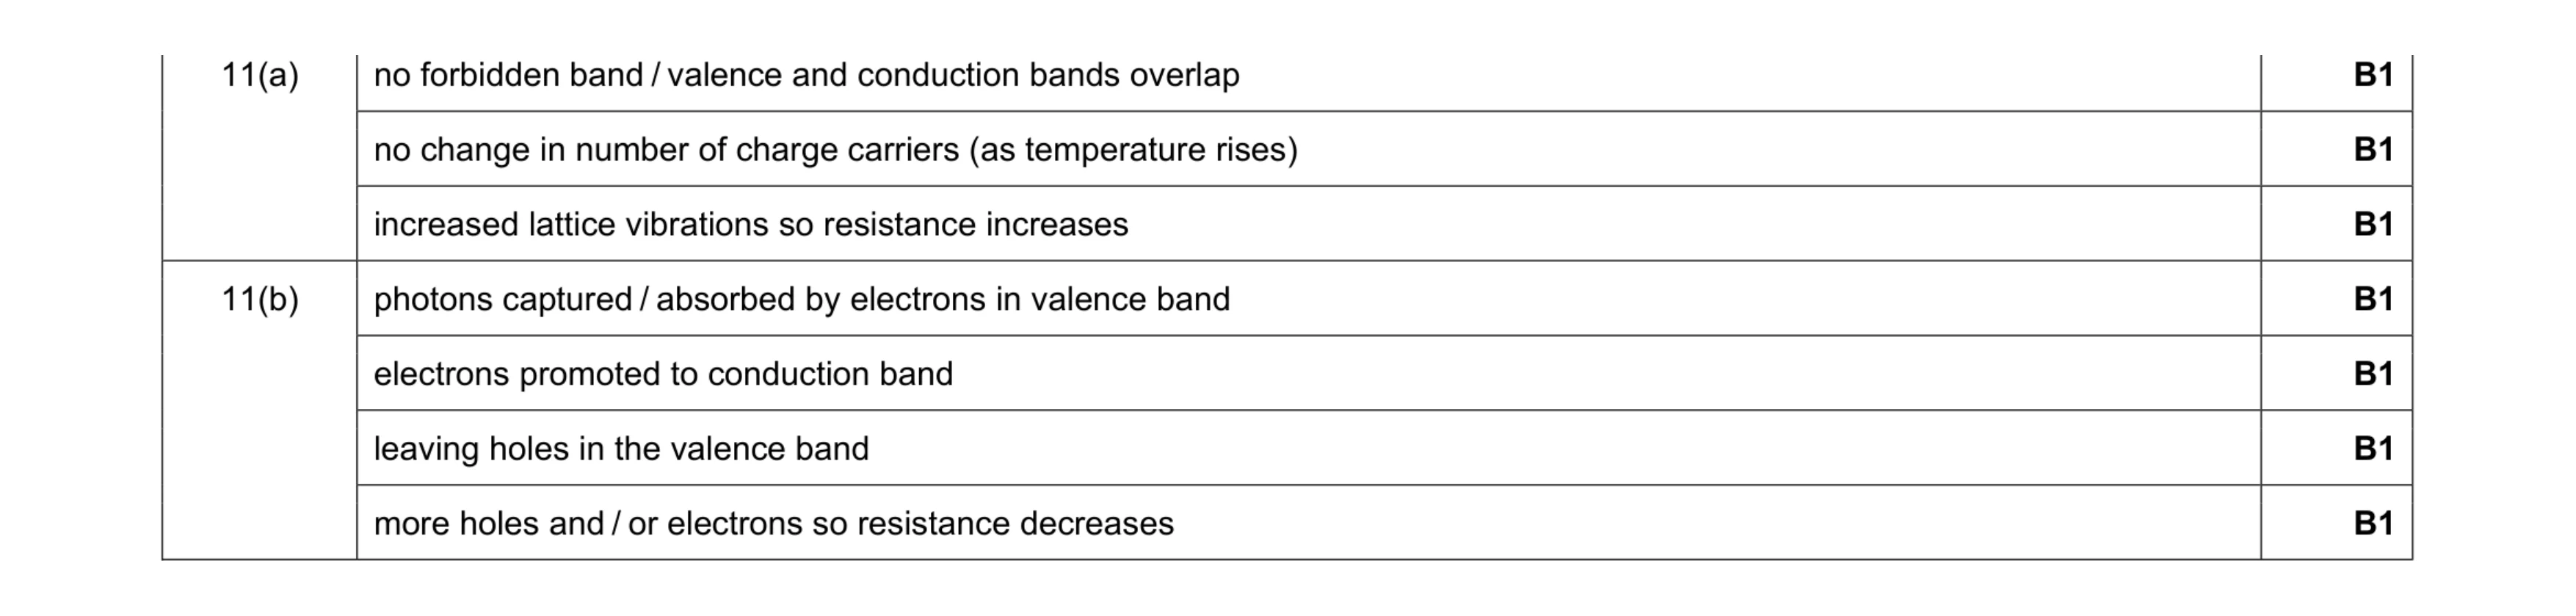 7
7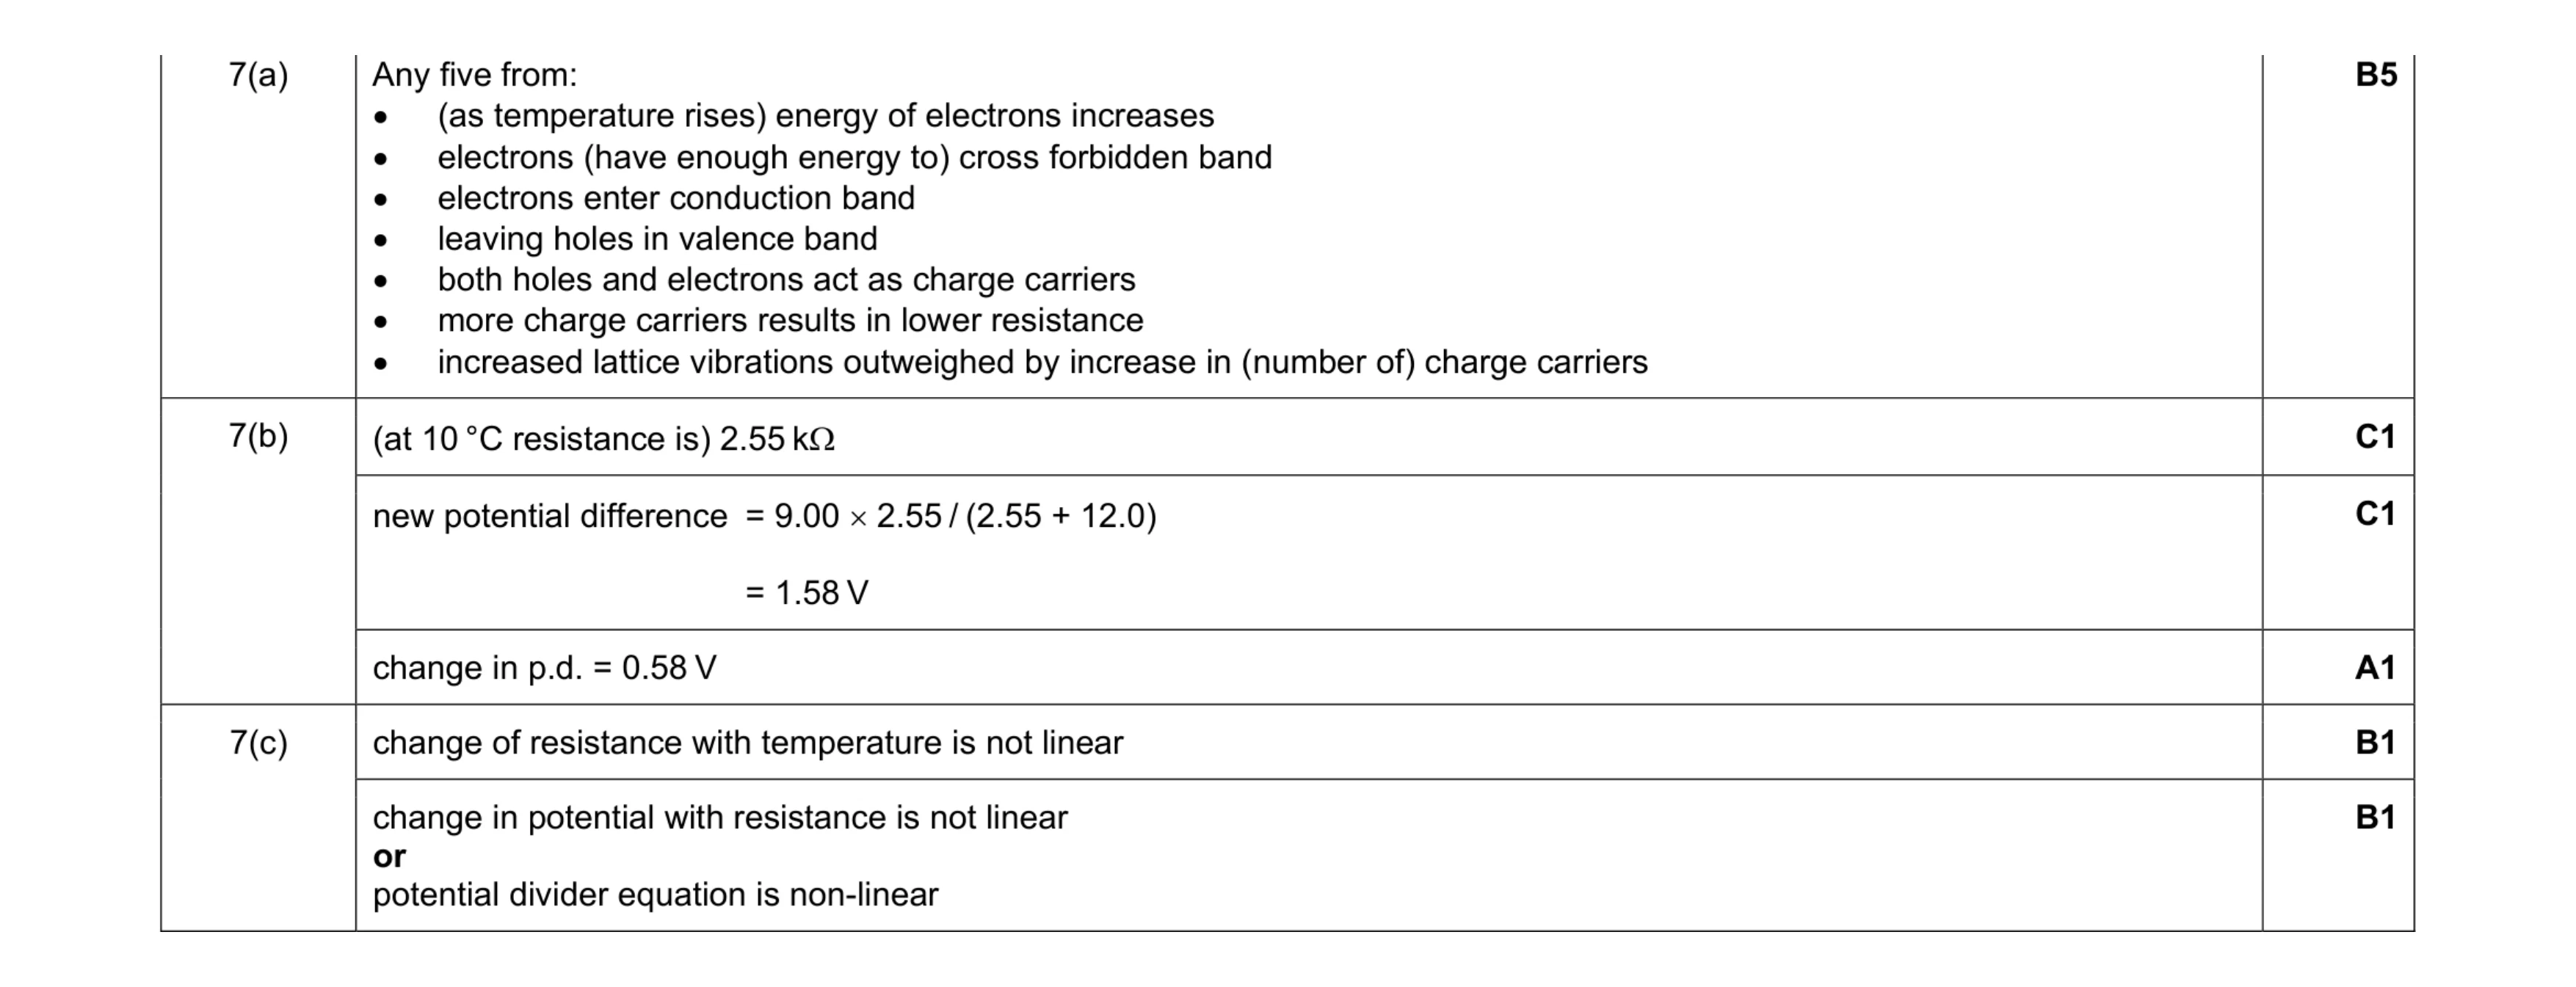 10
10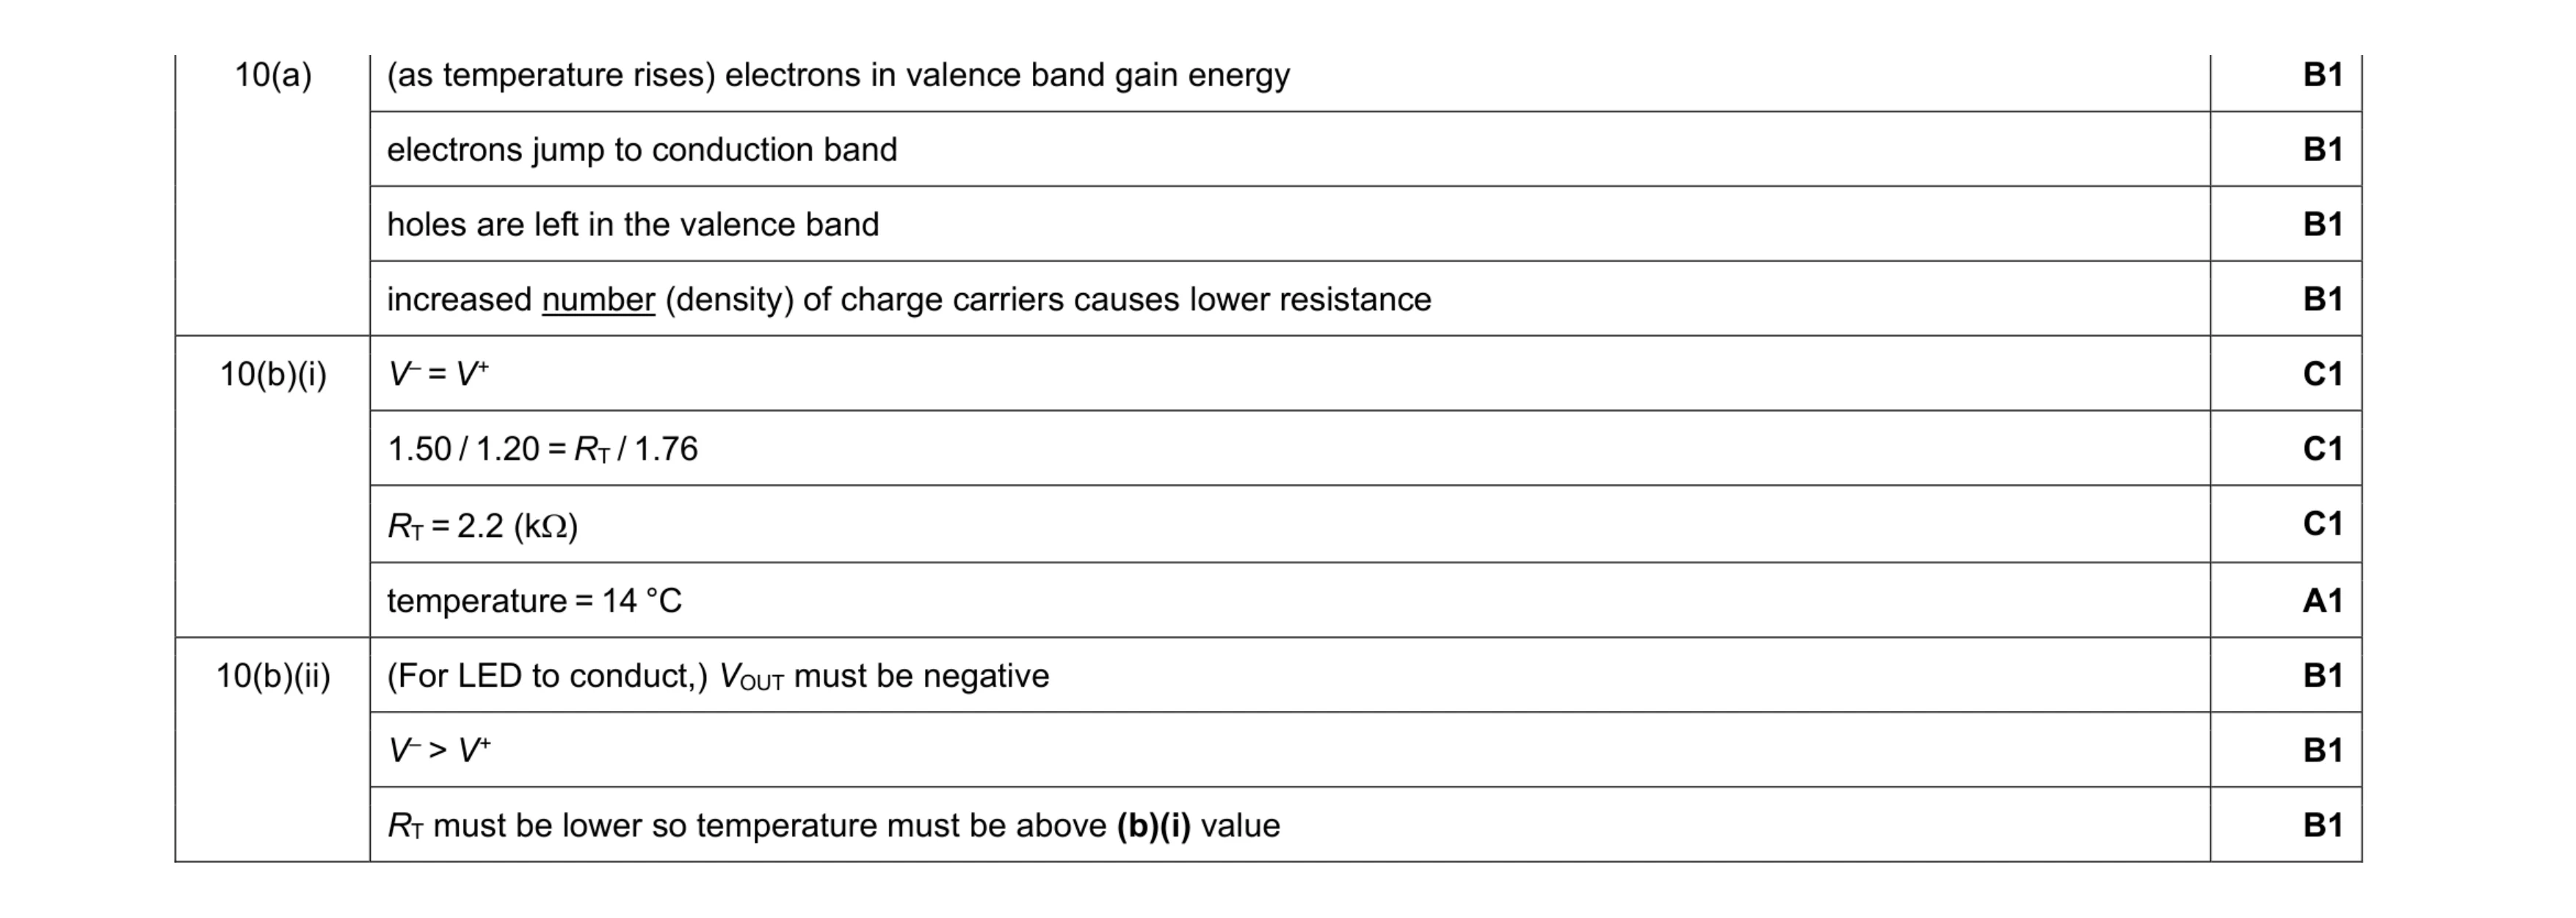 11
11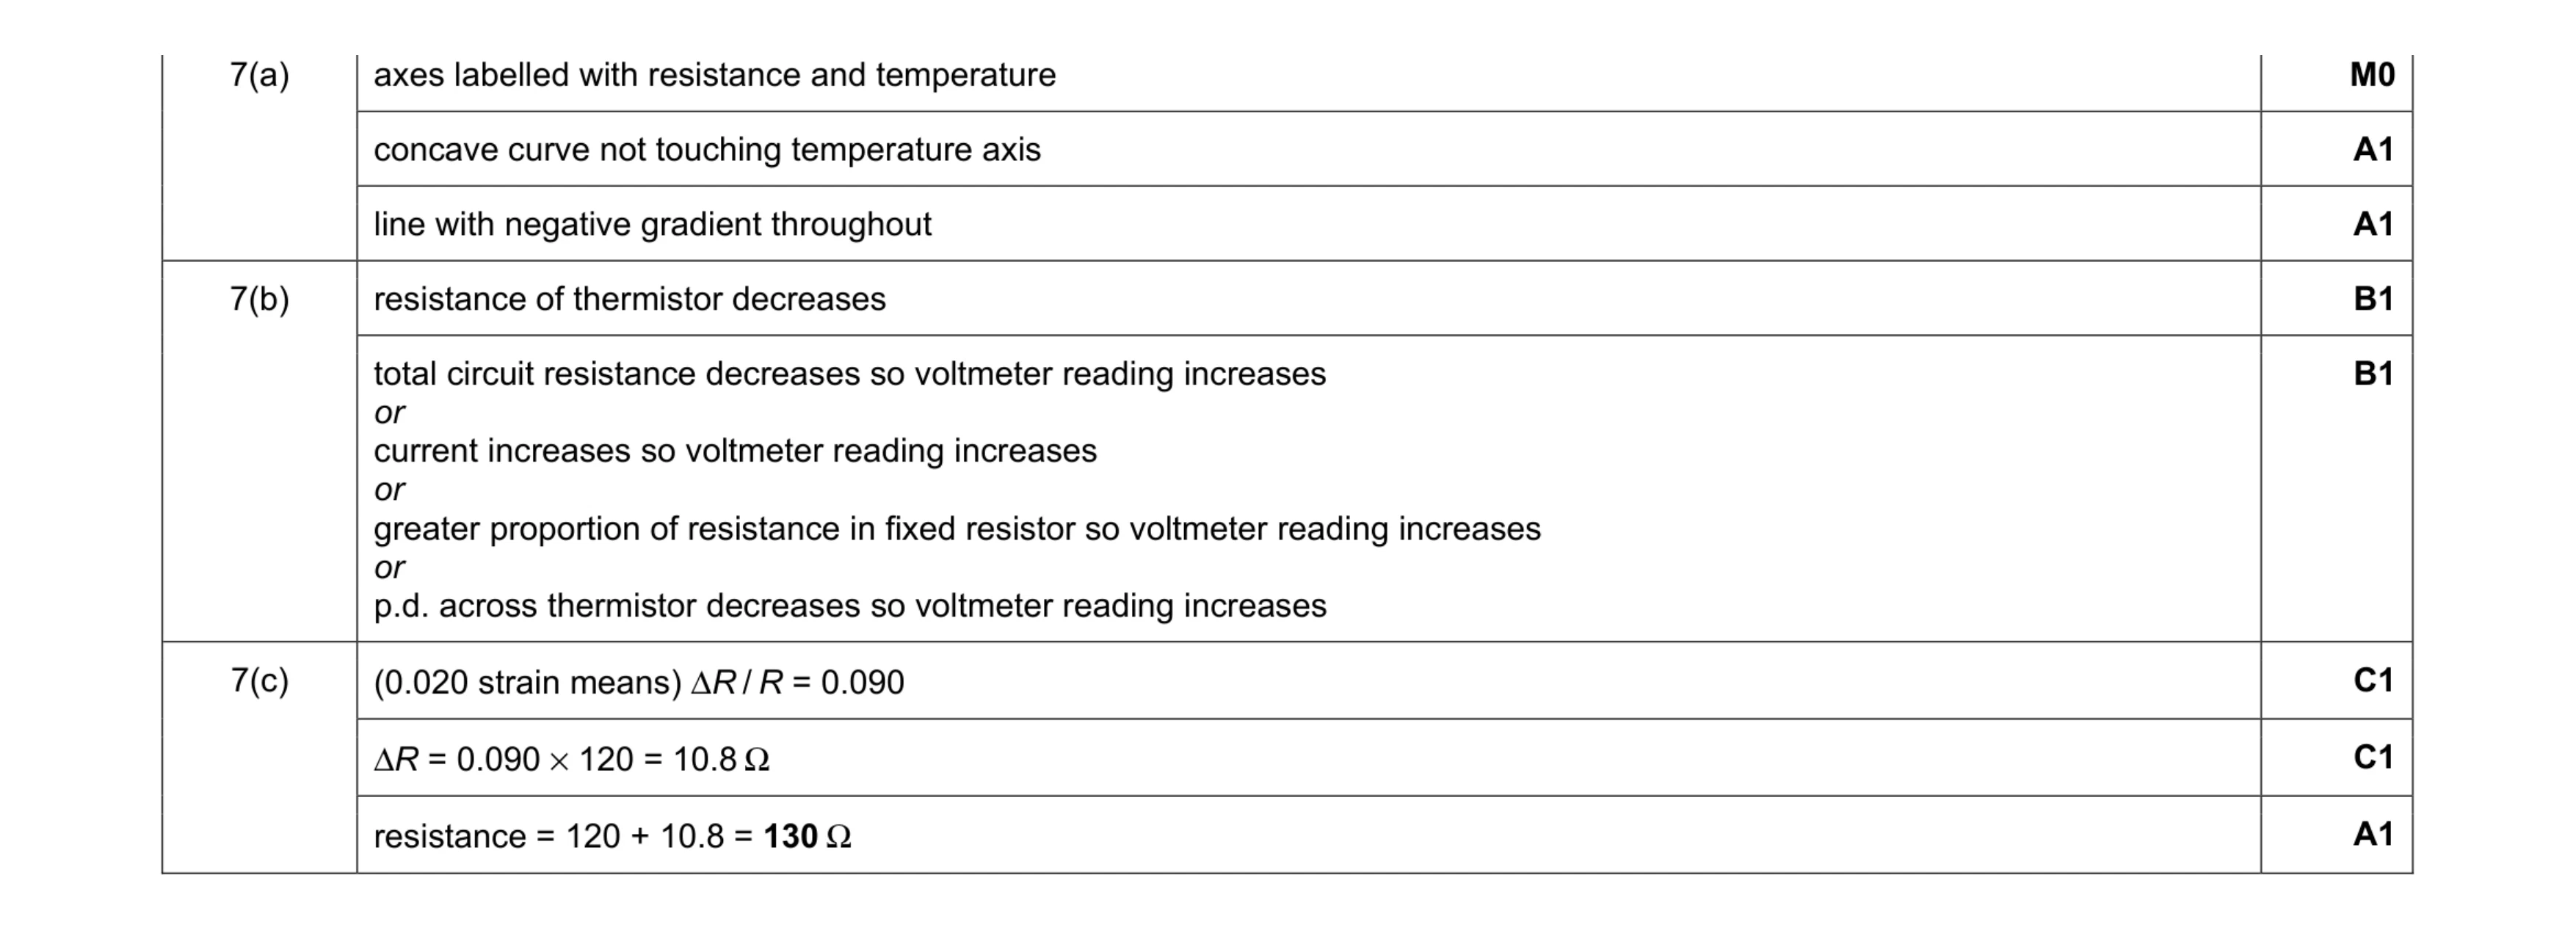 7
7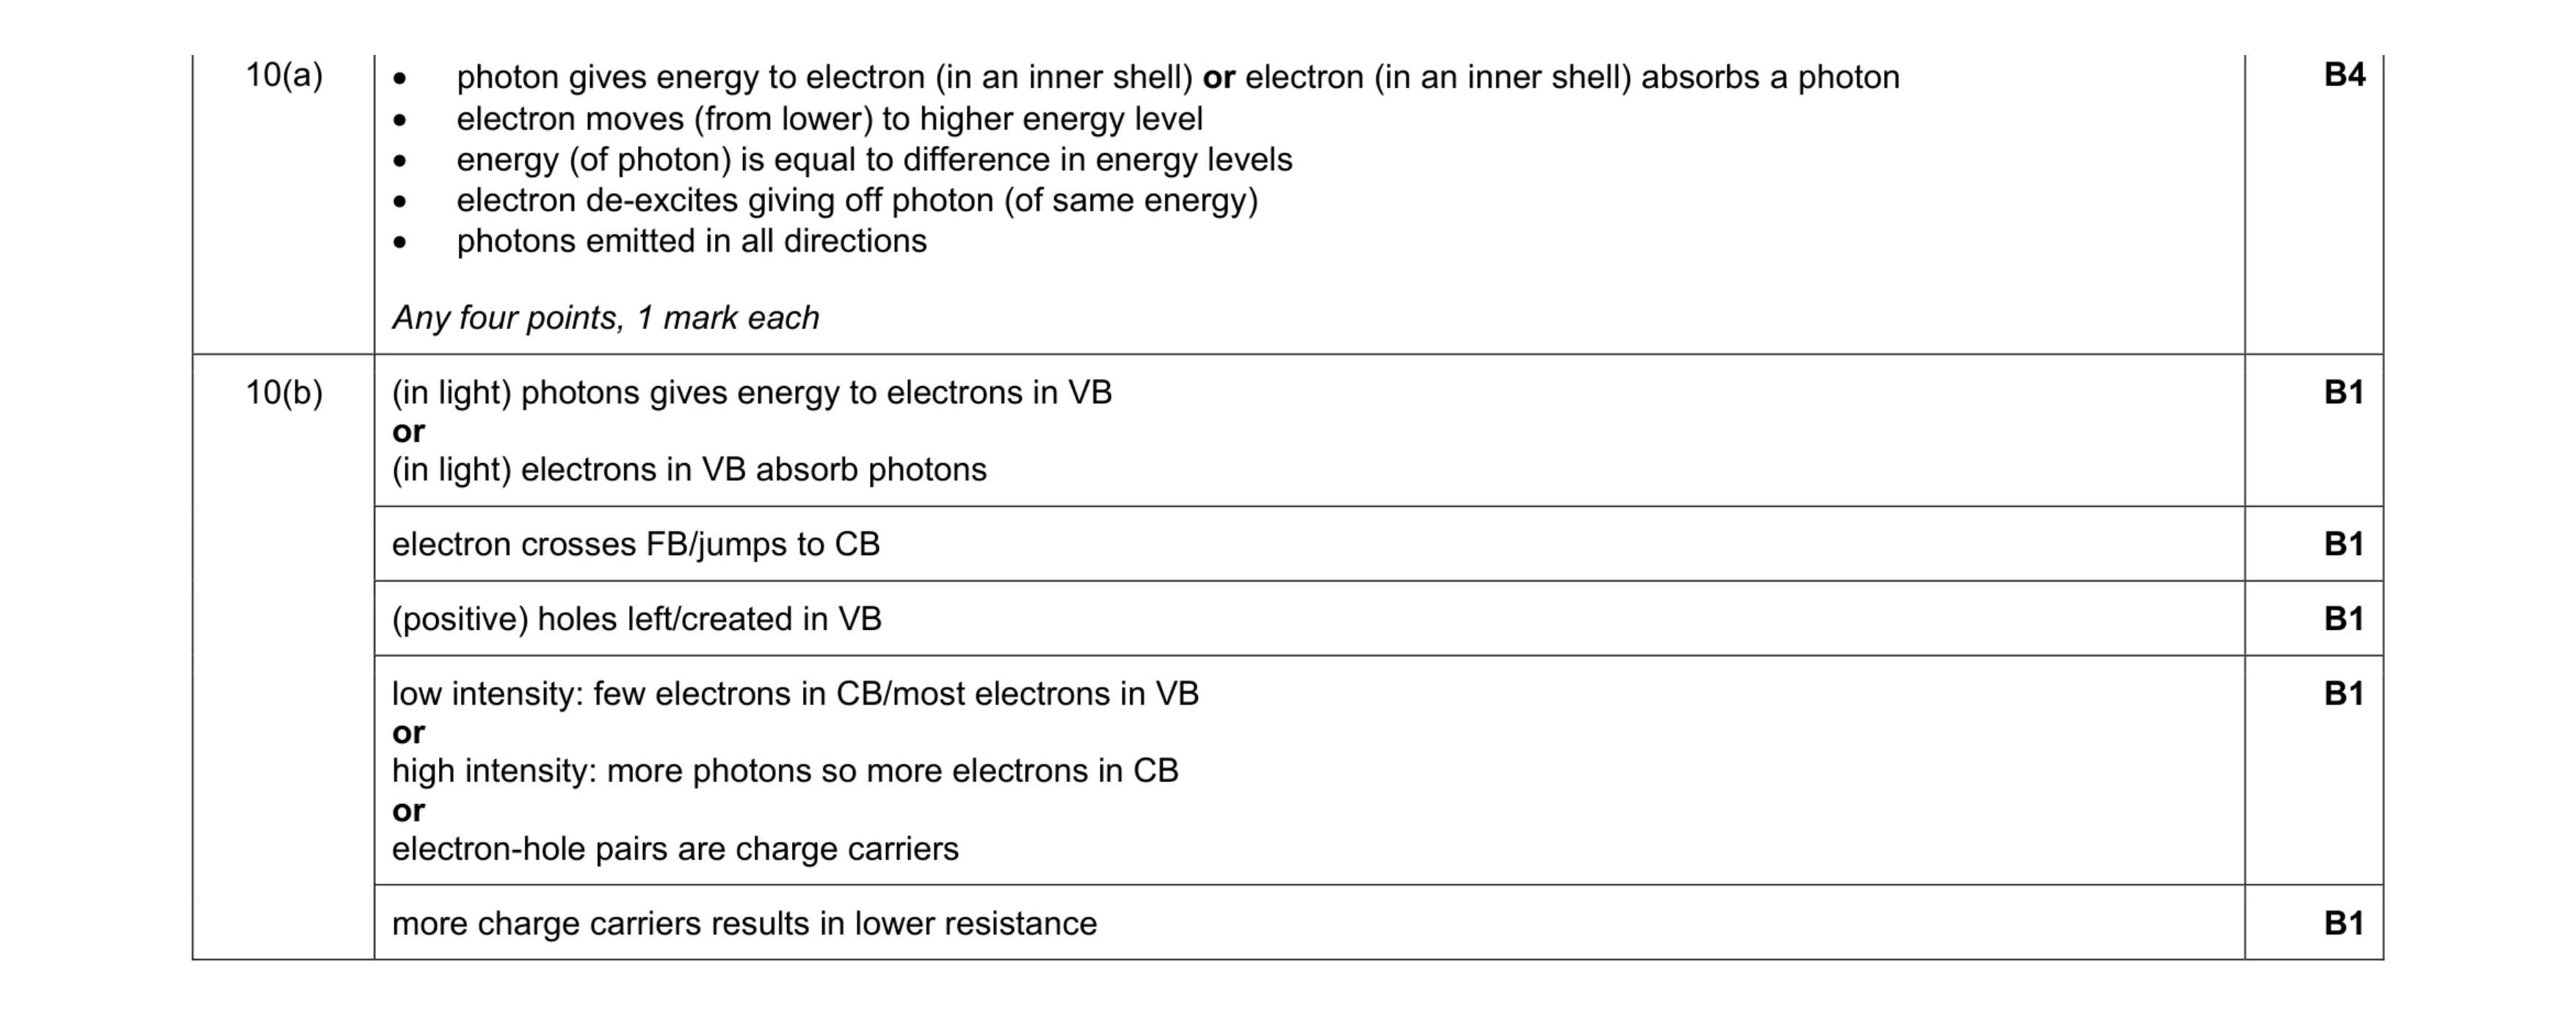 9
9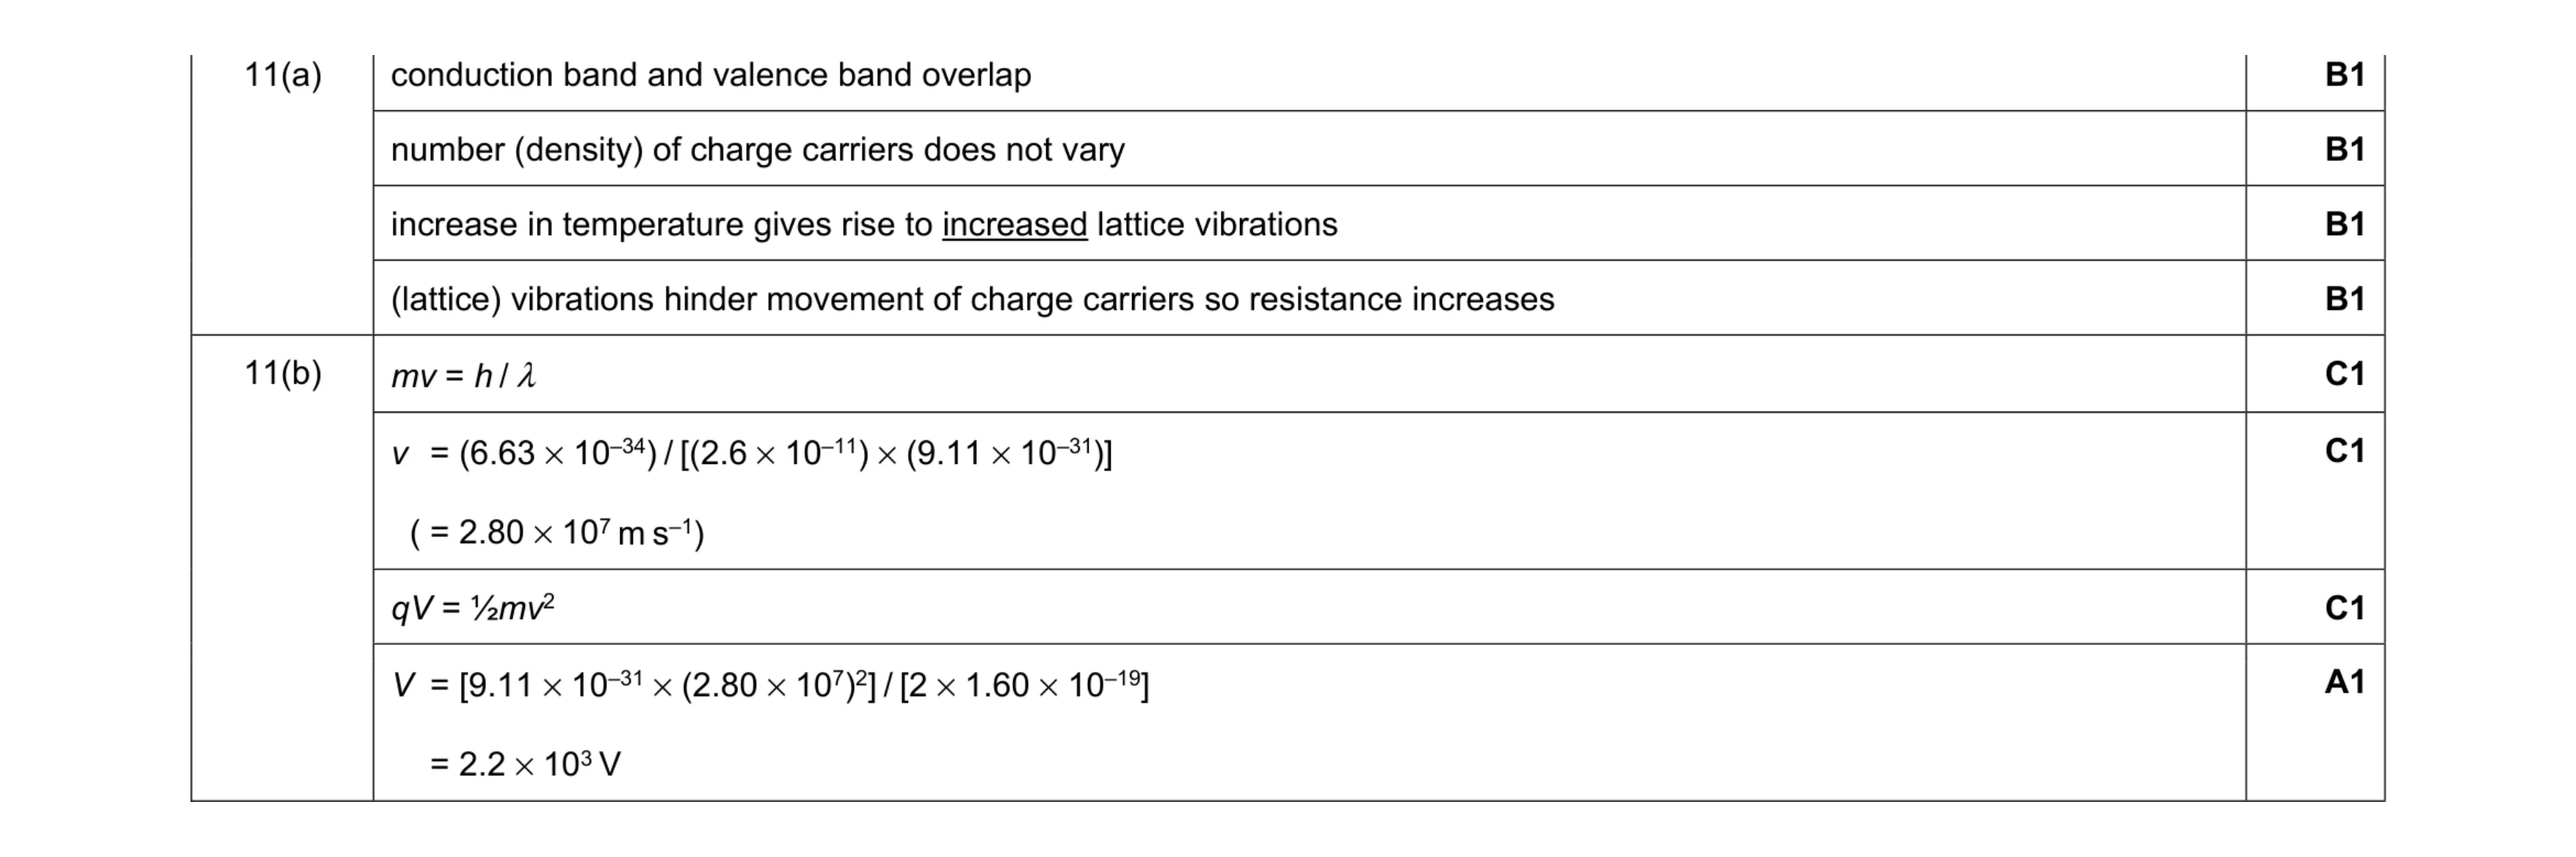 8
8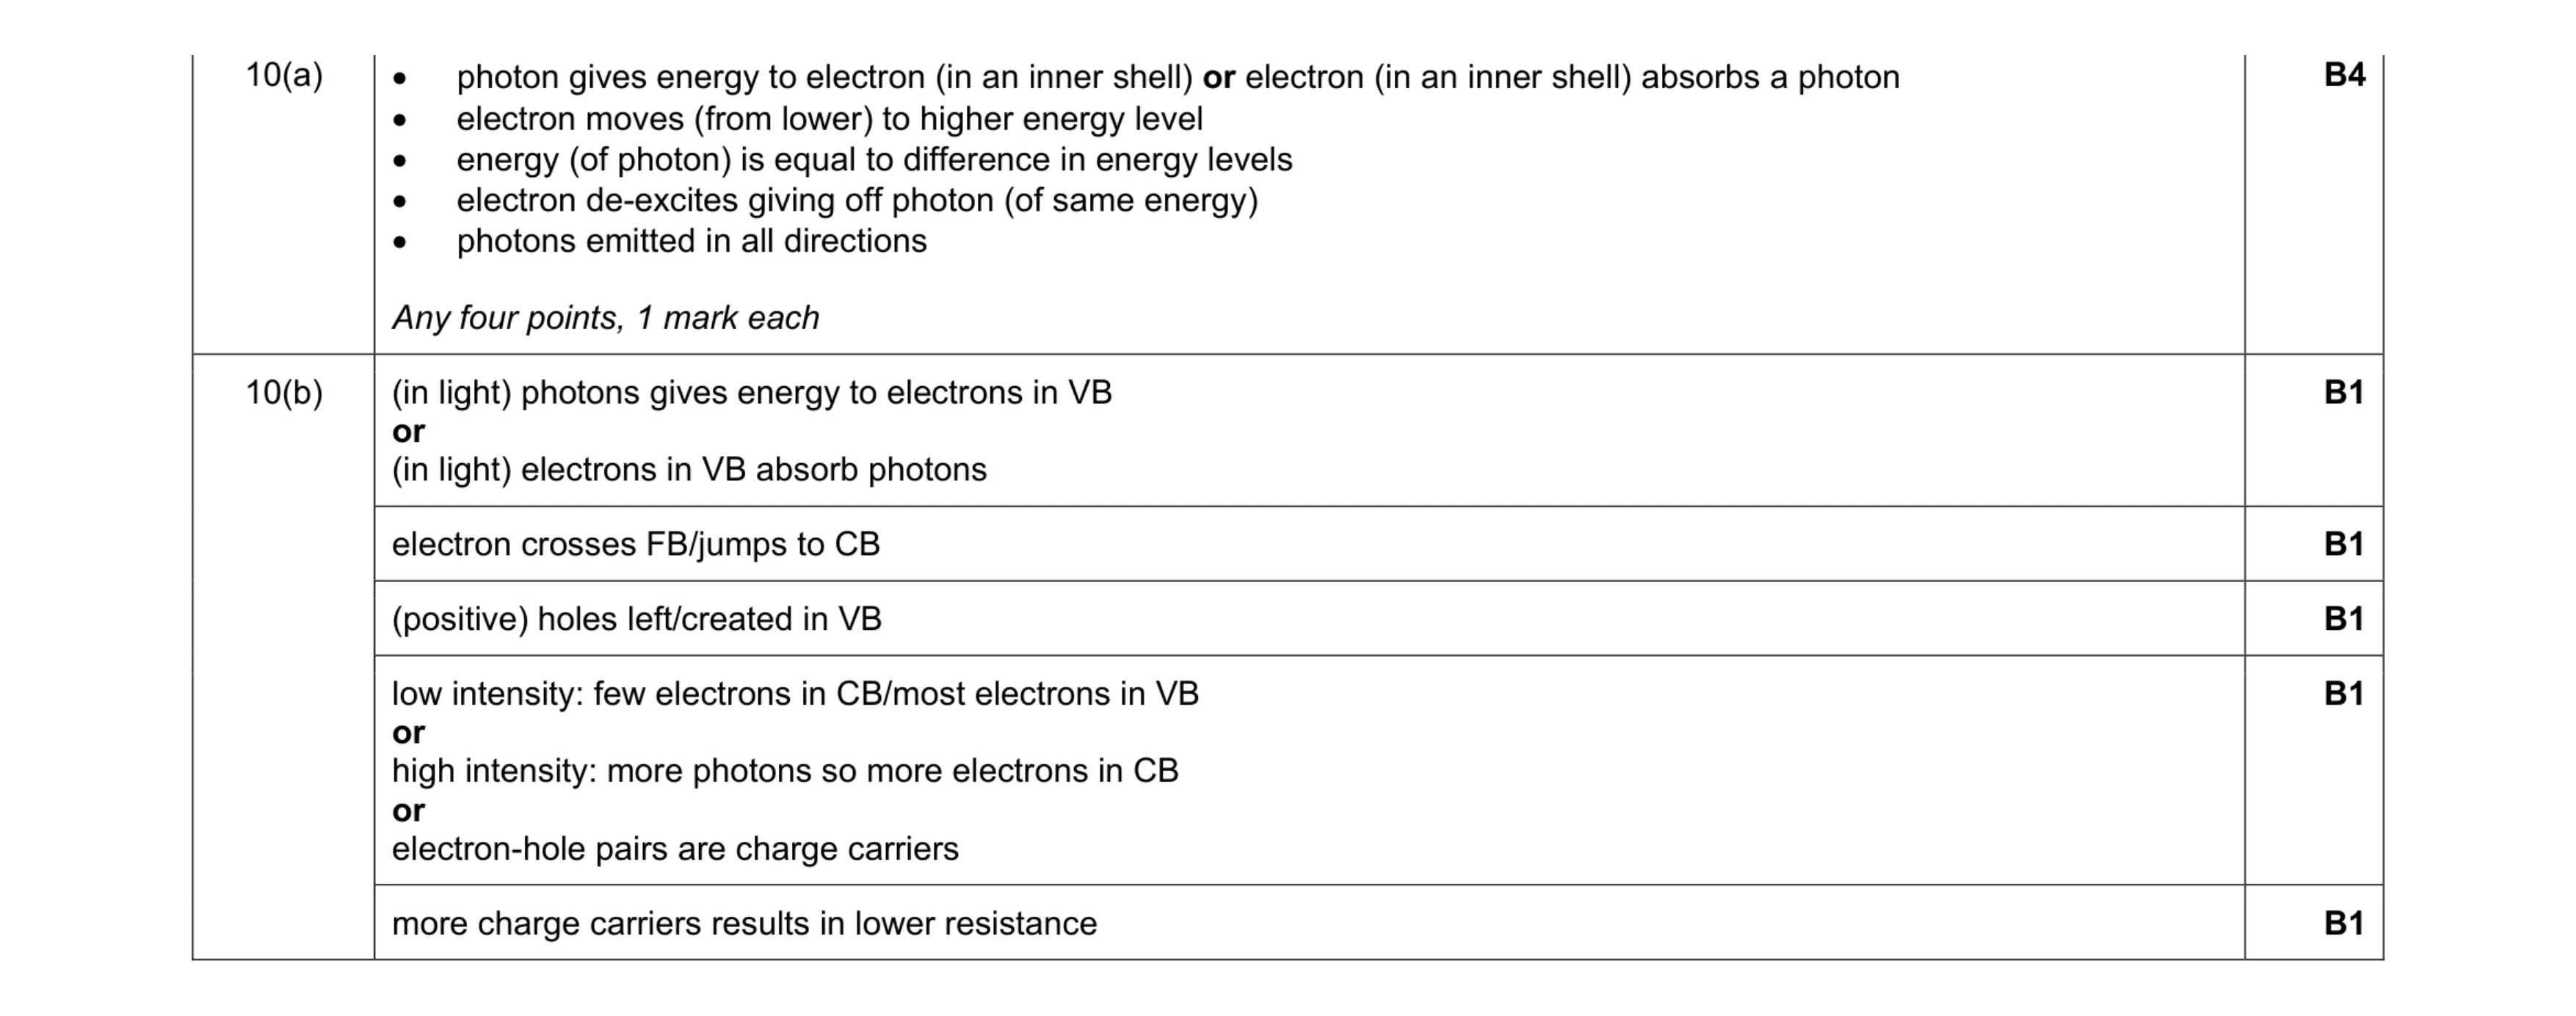 9
9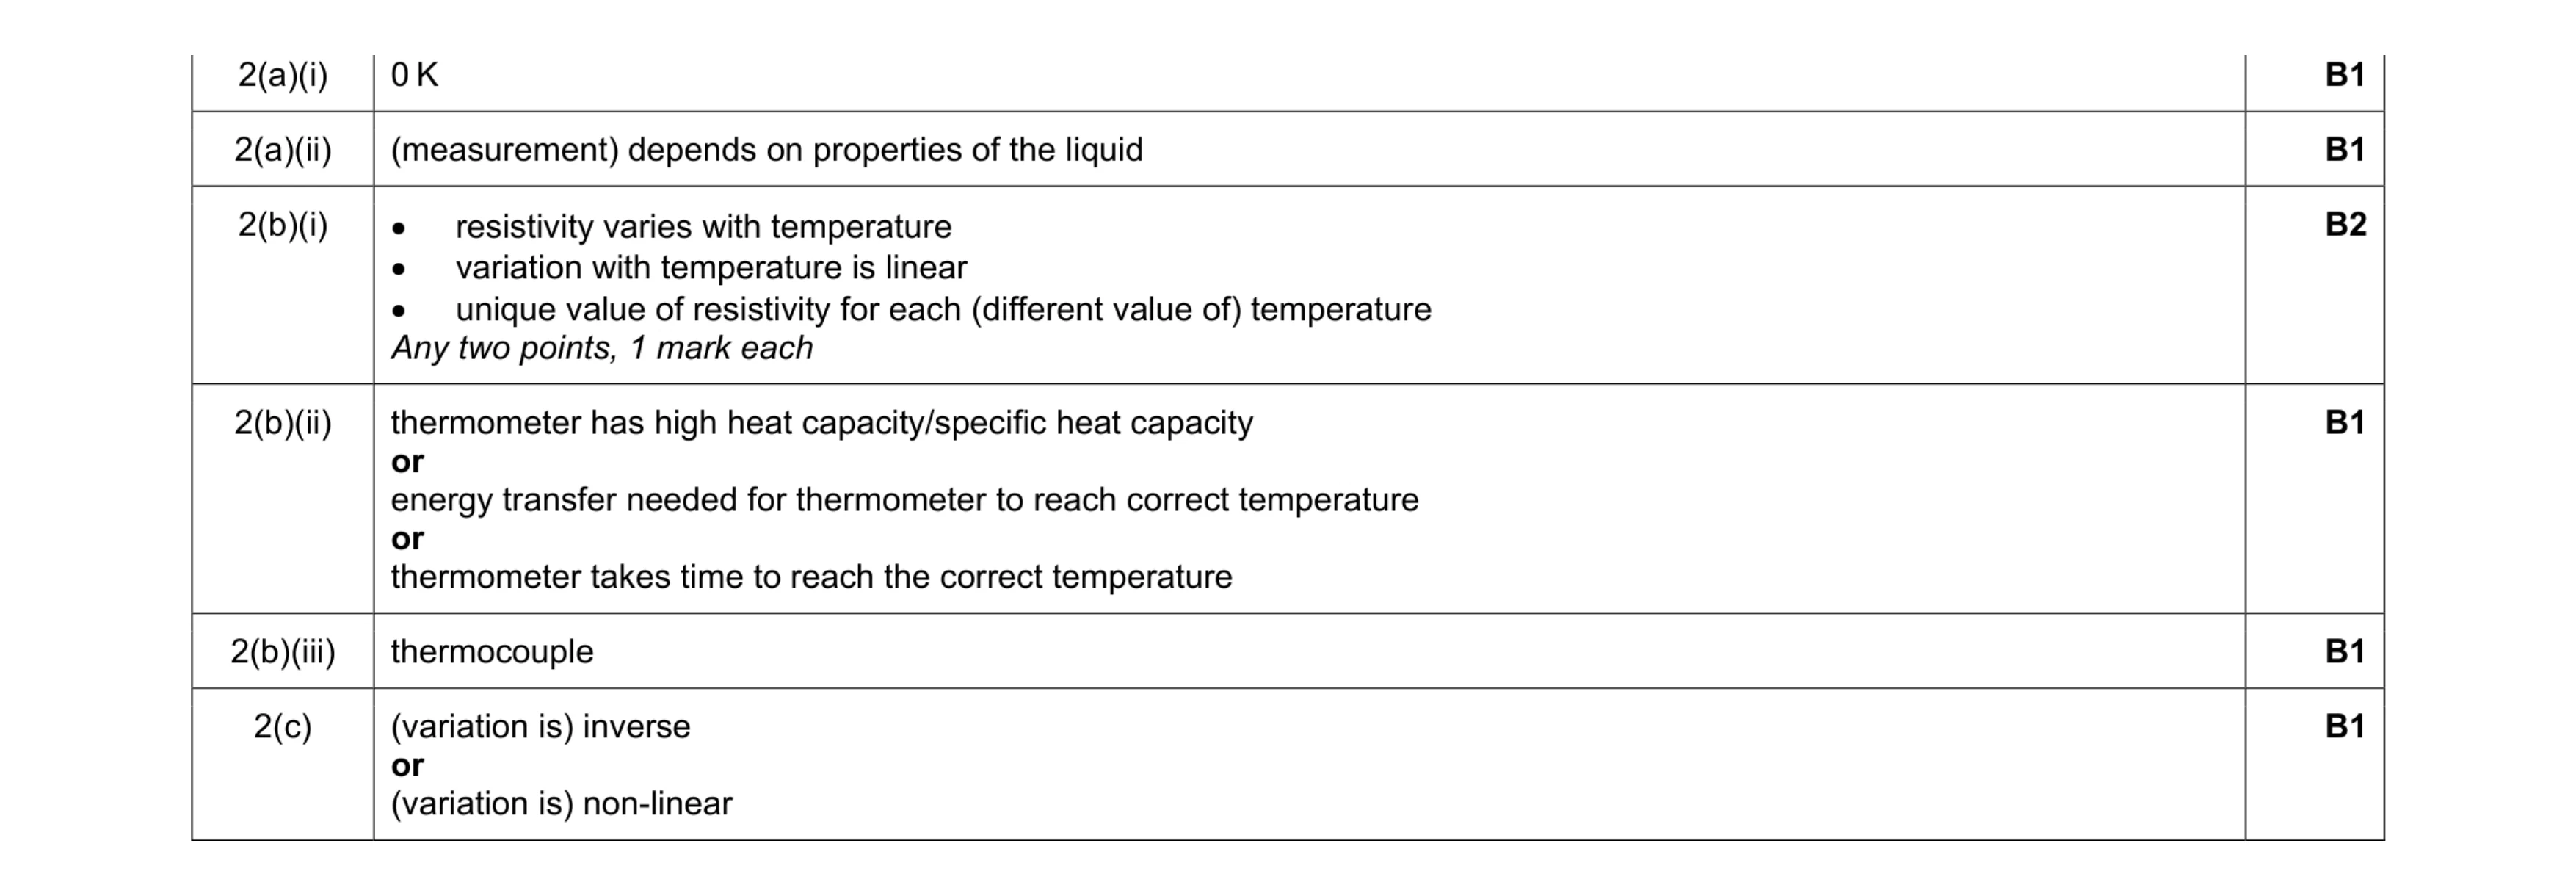 7
7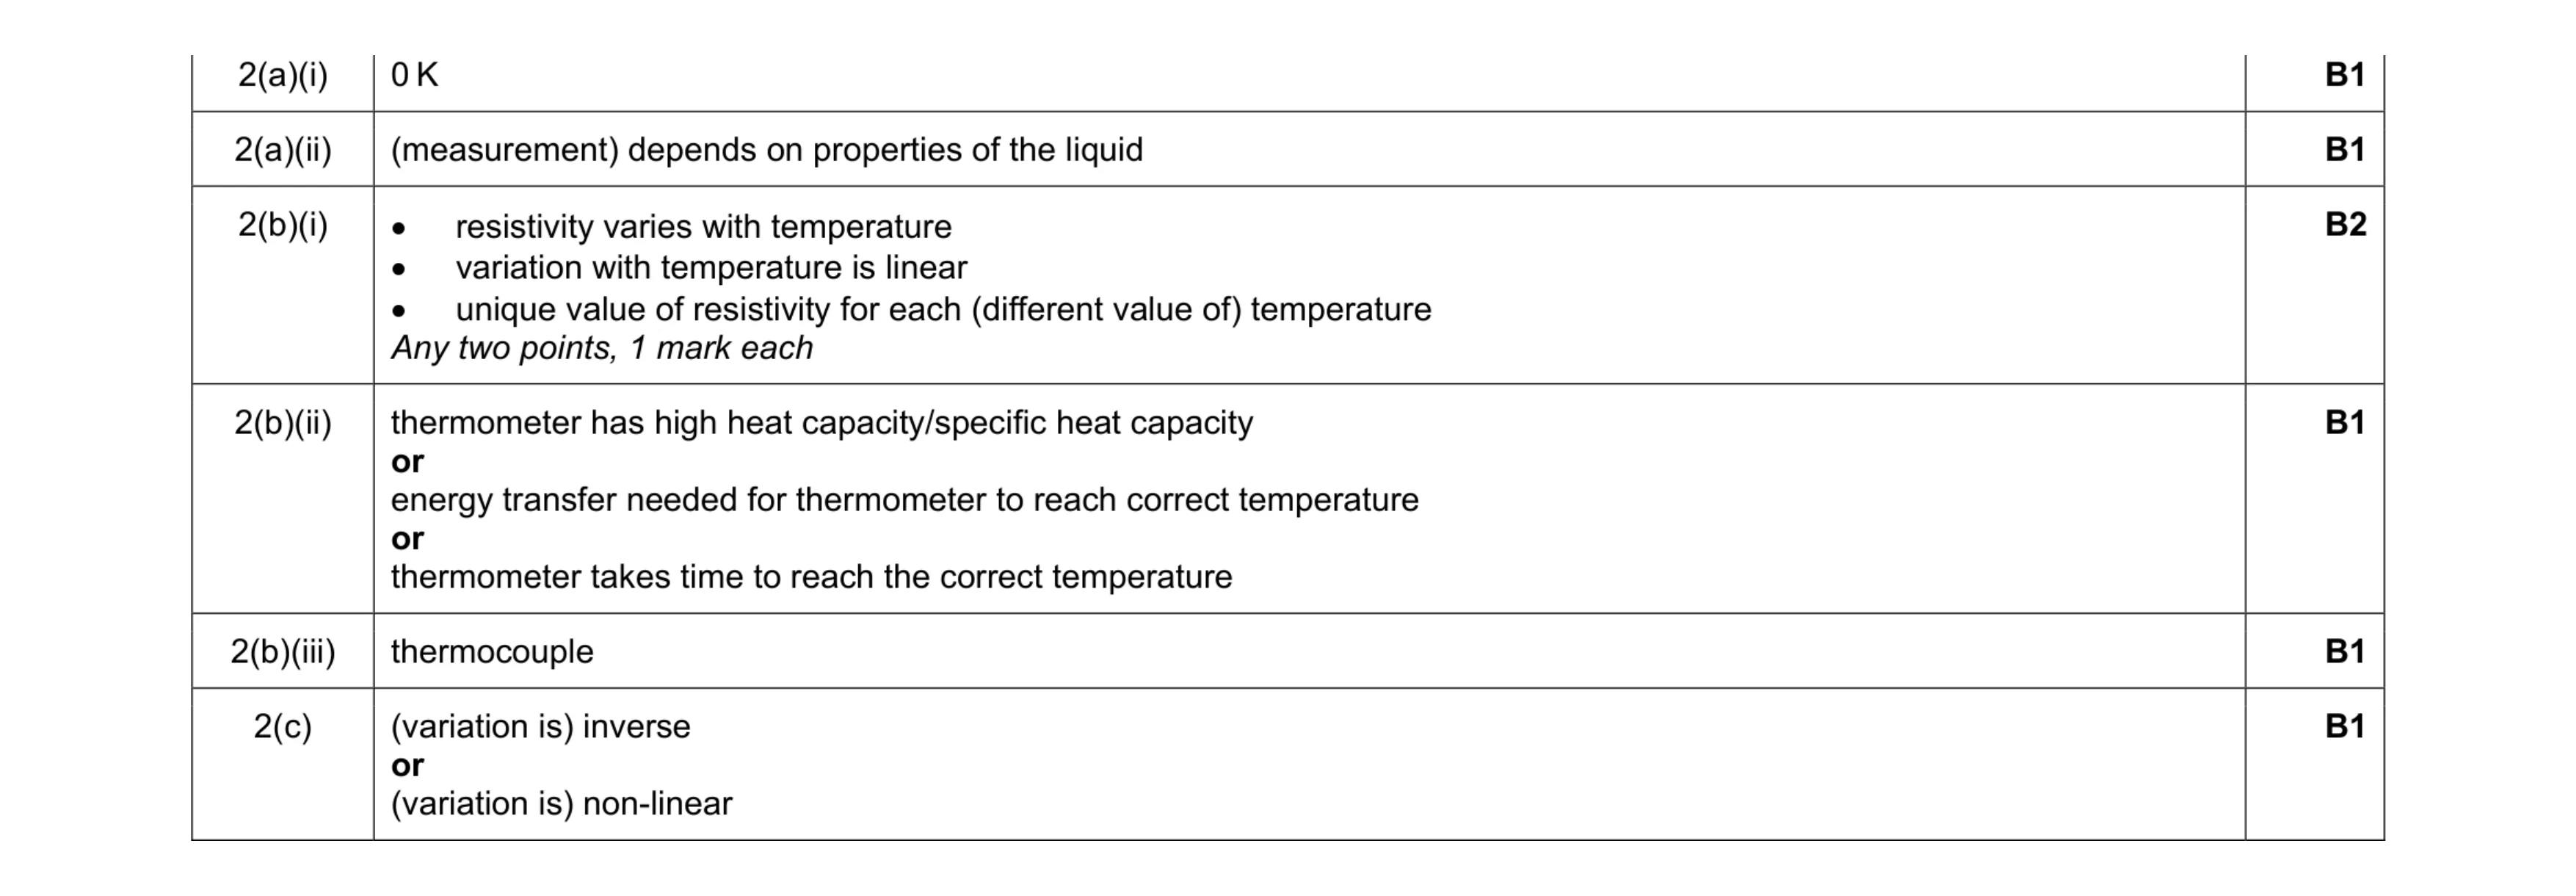 7
7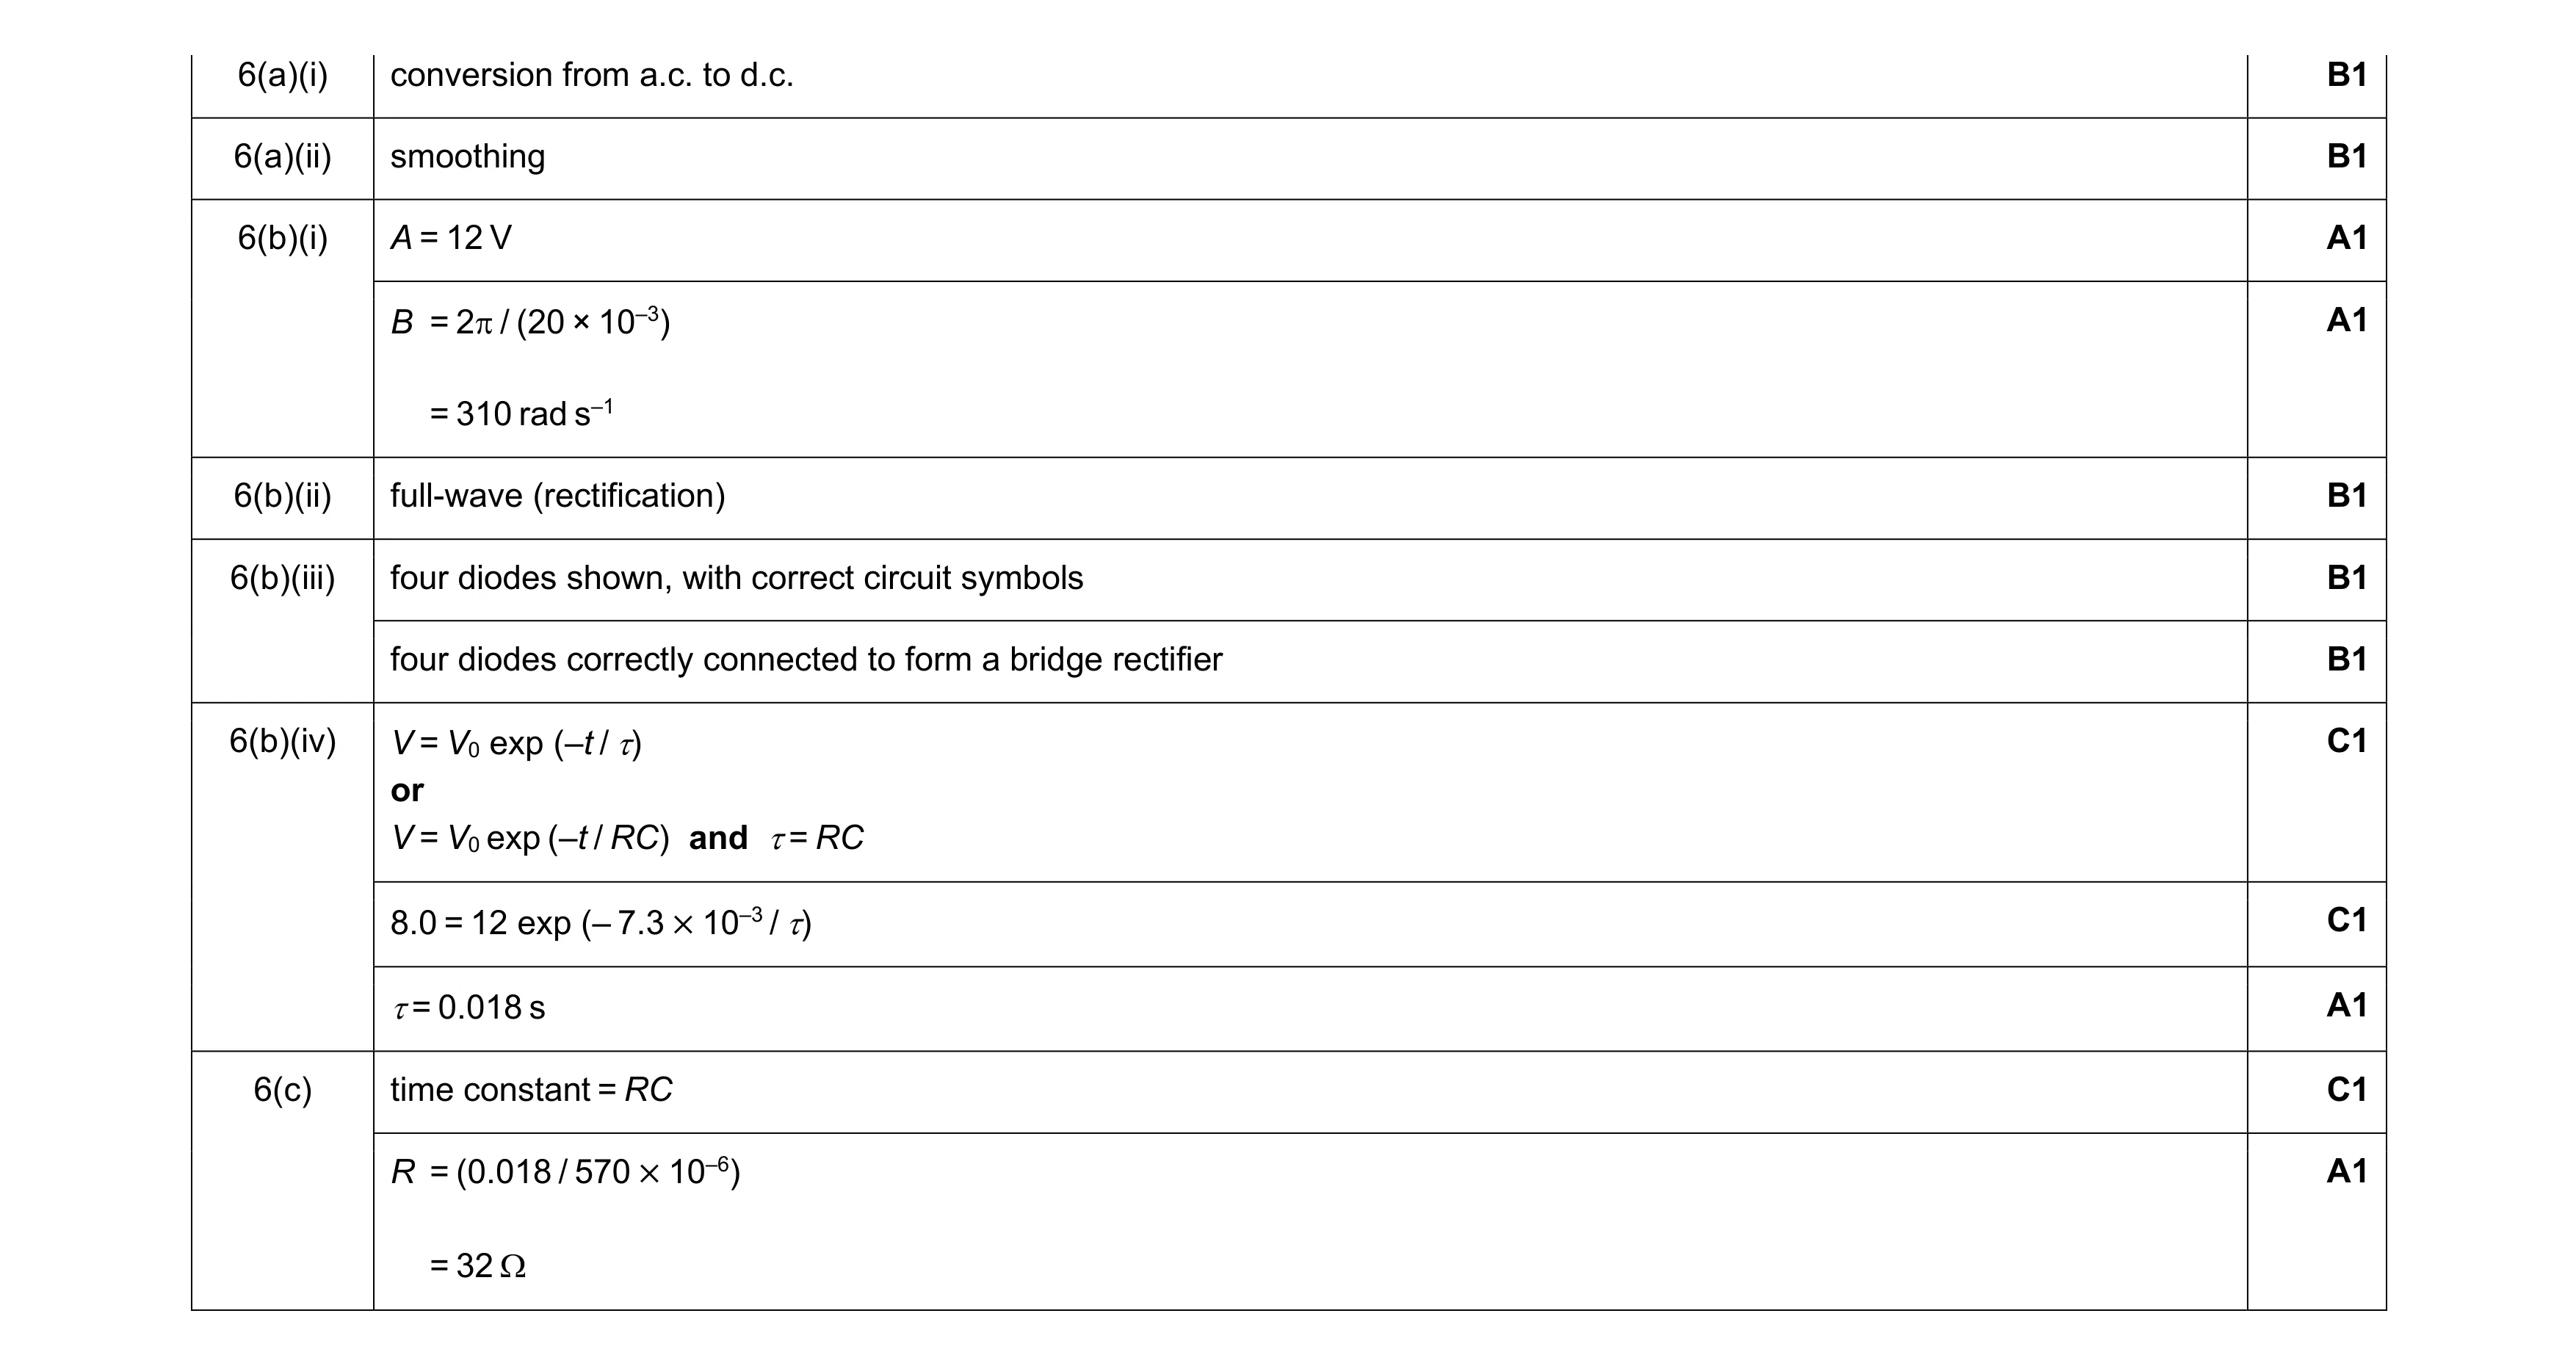 12
12