Questions as text
Q1 · Explain the main principles behind the use of nuclear magnetic resonance imaging (NMRI)… 9702/41 May/June 2017
8 Explain the main principles behind the use of nuclear magnetic resonance imaging (NMRI) to obtain information about internal body structures. … … … … … … … … … … … … … … [8] [Total: 8]
8 marks
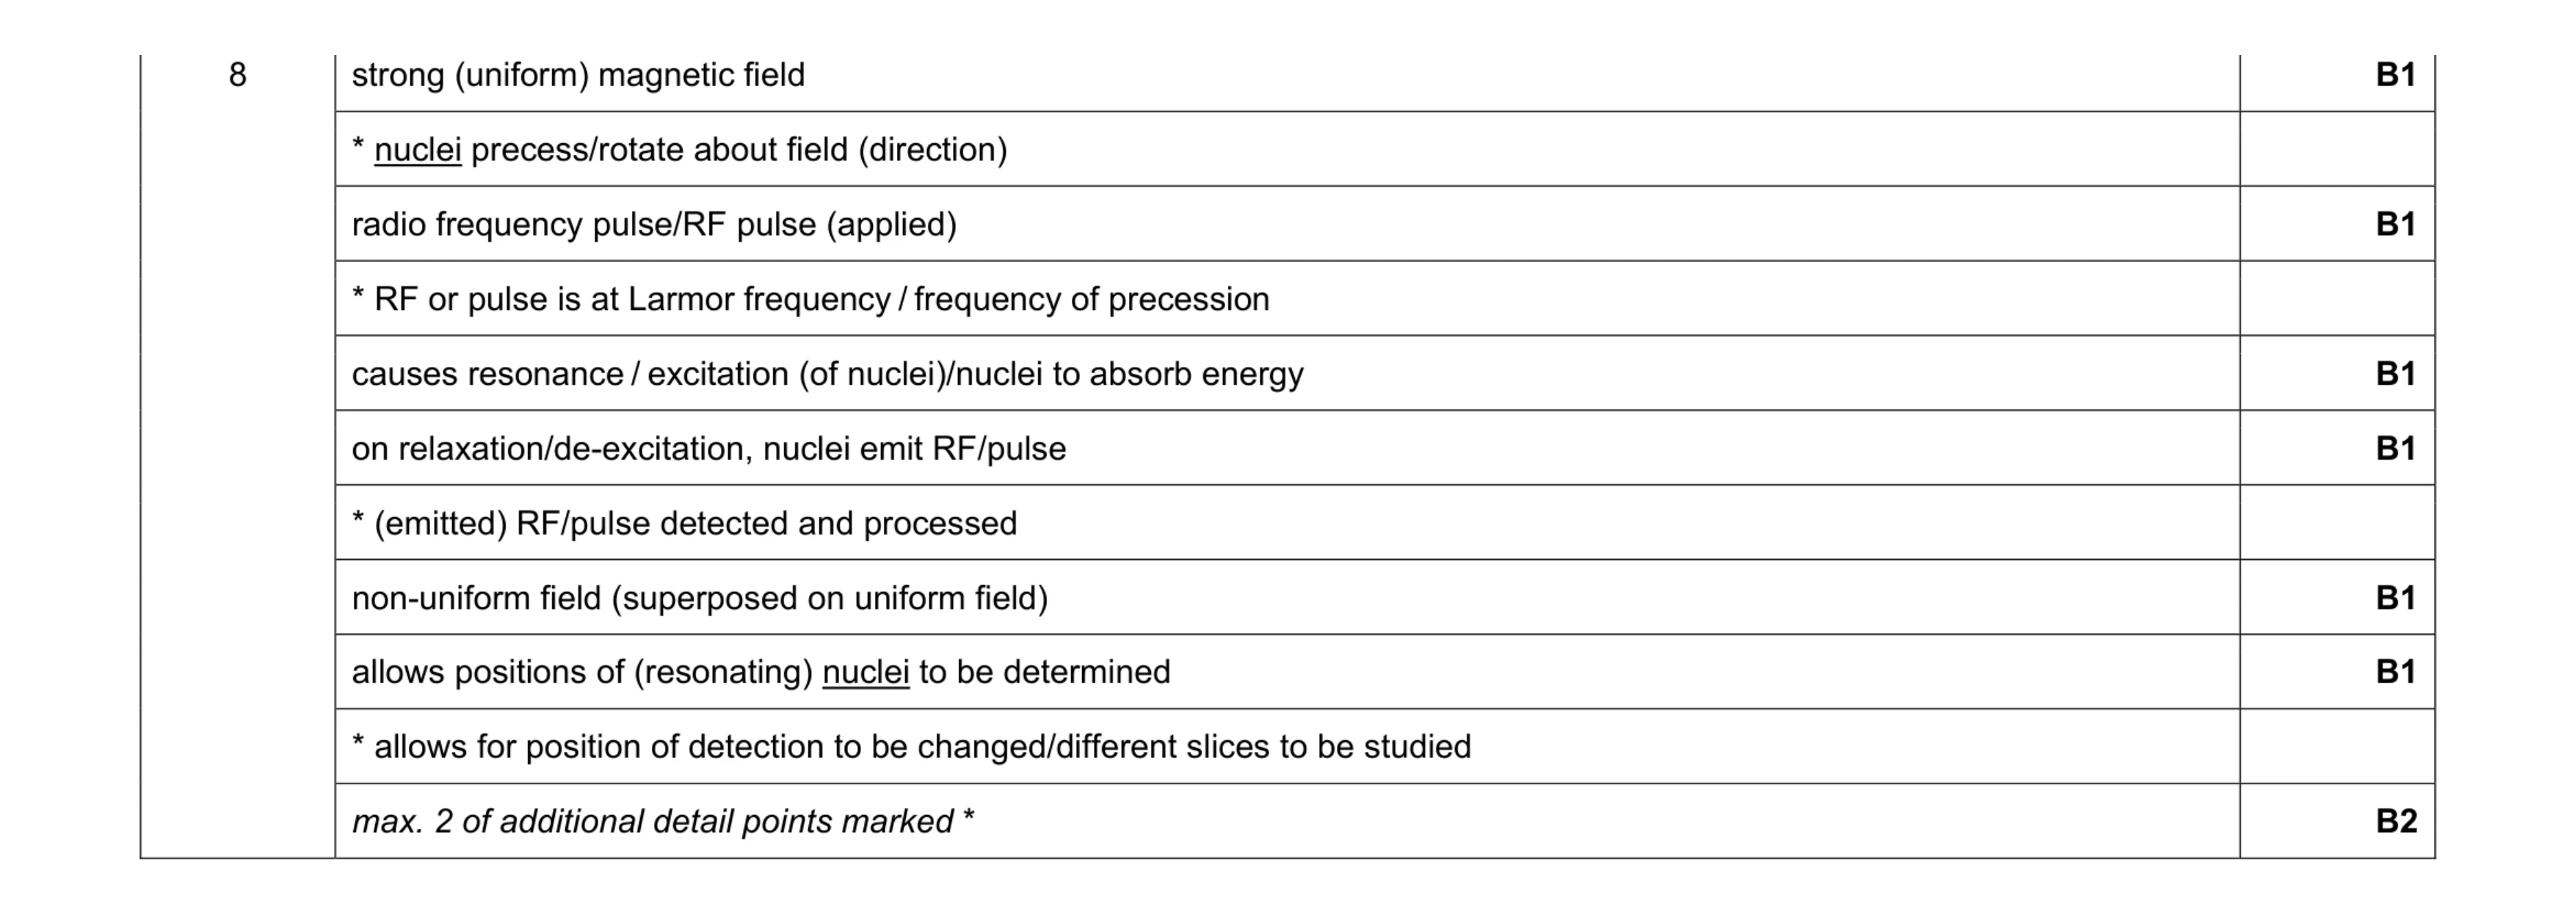
Mark scheme: 8 strong (uniform) magnetic field B1 * nuclei precess/rotate about field (direction) radio frequency pulse/RF pulse (applied) B1 * RF or pulse is at Larmor frequency / frequency of precession causes resonance / excitation (of nuclei)/nuclei to absorb energy B1 on relaxation/de-excitation, nuclei emit RF/pulse B1 * (emitted) RF/pulse detected and processed non-uniform field (superposed on uniform field) B1 allows positions of (resonating) nuclei to be determined B1 * allows for position of detection to be changed/different slices to be studied max. 2 of additional detail points marked * B2
This question in 9702/41 May/June 2017
Q2 · Explain the main principles behind the use of nuclear magnetic resonance imaging (NMRI)… 9702/43 May/June 2017
8 Explain the main principles behind the use of nuclear magnetic resonance imaging (NMRI) to obtain information about internal body structures. … … … … … … … … … … … … … … [8] [Total: 8]
8 marks
Mark scheme: 8 strong (uniform) magnetic field B1 * nuclei precess/rotate about field (direction) radio frequency pulse/RF pulse (applied) B1 * RF or pulse is at Larmor frequency / frequency of precession causes resonance / excitation (of nuclei)/nuclei to absorb energy B1 on relaxation/de-excitation, nuclei emit RF/pulse B1 * (emitted) RF/pulse detected and processed non-uniform field (superposed on uniform field) B1 allows positions of (resonating) nuclei to be determined B1 * allows for position of detection to be changed/different slices to be studied max. 2 of additional detail points marked * B2
This question in 9702/43 May/June 2017
Q3 · The root-mean-square (r.m.s.) value of the voltage of a sinusoidal alternating supply is… 9702/42 Oct/Nov 2018
10 (a) The root-mean-square (r.m.s.) value of the voltage of a sinusoidal alternating supply is 9.9 V. The frequency of the supply is 50 Hz. Derive an expression for the variation with time t (in second) of the potential difference V (in volt) of the supply. V = … [2] (b) Explain the function of the non-uniform magnetic field superposed on the large constant magnetic field in diagnosis using magnetic resonance imaging (NMRI). … … … … … … … [3] (c) A parallel beam of X-rays of intensity I0 is incident normally on some soft tissue and bone, as illustrated in Fig. 10.1. 0.40 cm incident transmitted intensity I0 bone intensity I soft tissue 1.8 cm Fig. 10.1 The bone is 0.40 cm thick and the total thickness of the bone and the soft tissue is 1.8 cm. The intensity of the transmitted beam is I. Data for the linear attenuation (absorption) coefficient μ of bone and of soft tissue are given in Fig. 10.2. μ/ cm–1 bone 2.9 soft tissue 0.92 Fig. 10.2 Calculate, in dB, the ratio transmitted intensity I . incident intensity I0 ratio = … dB [4]
9 marks
Mark scheme: 10(a) and ω = 2πf = 2π × 50 (= 314 rad s–1) C1 V = 14 sin 314t A1 10(b) enables (resonating) nuclei to be located B1 resonant frequency depends on magnetic field strength B1 Any one from: • non-uniform field is (accurately) calibrated • (non-uniform) field may be varied to enable detection in different positions • unique (magnetic) field strength/frequency at each point B1 10(c) I = I0 exp(–µx) C1 I = I0 [exp(–µx)bone × exp(–µx)soft tissue] I = I0 [exp(–2.9 × 0.40) × exp(–0.92 × 1.4)] C1 I / I0 = 0.0865 C1 ratio / dB = 10 lg 0.0865 = –11 dB A1
This question in 9702/42 Oct/Nov 2018
Q4 · Two long straight wires P and Q are parallel to each other, as shown in Fig 9702/42 Feb/March 2021
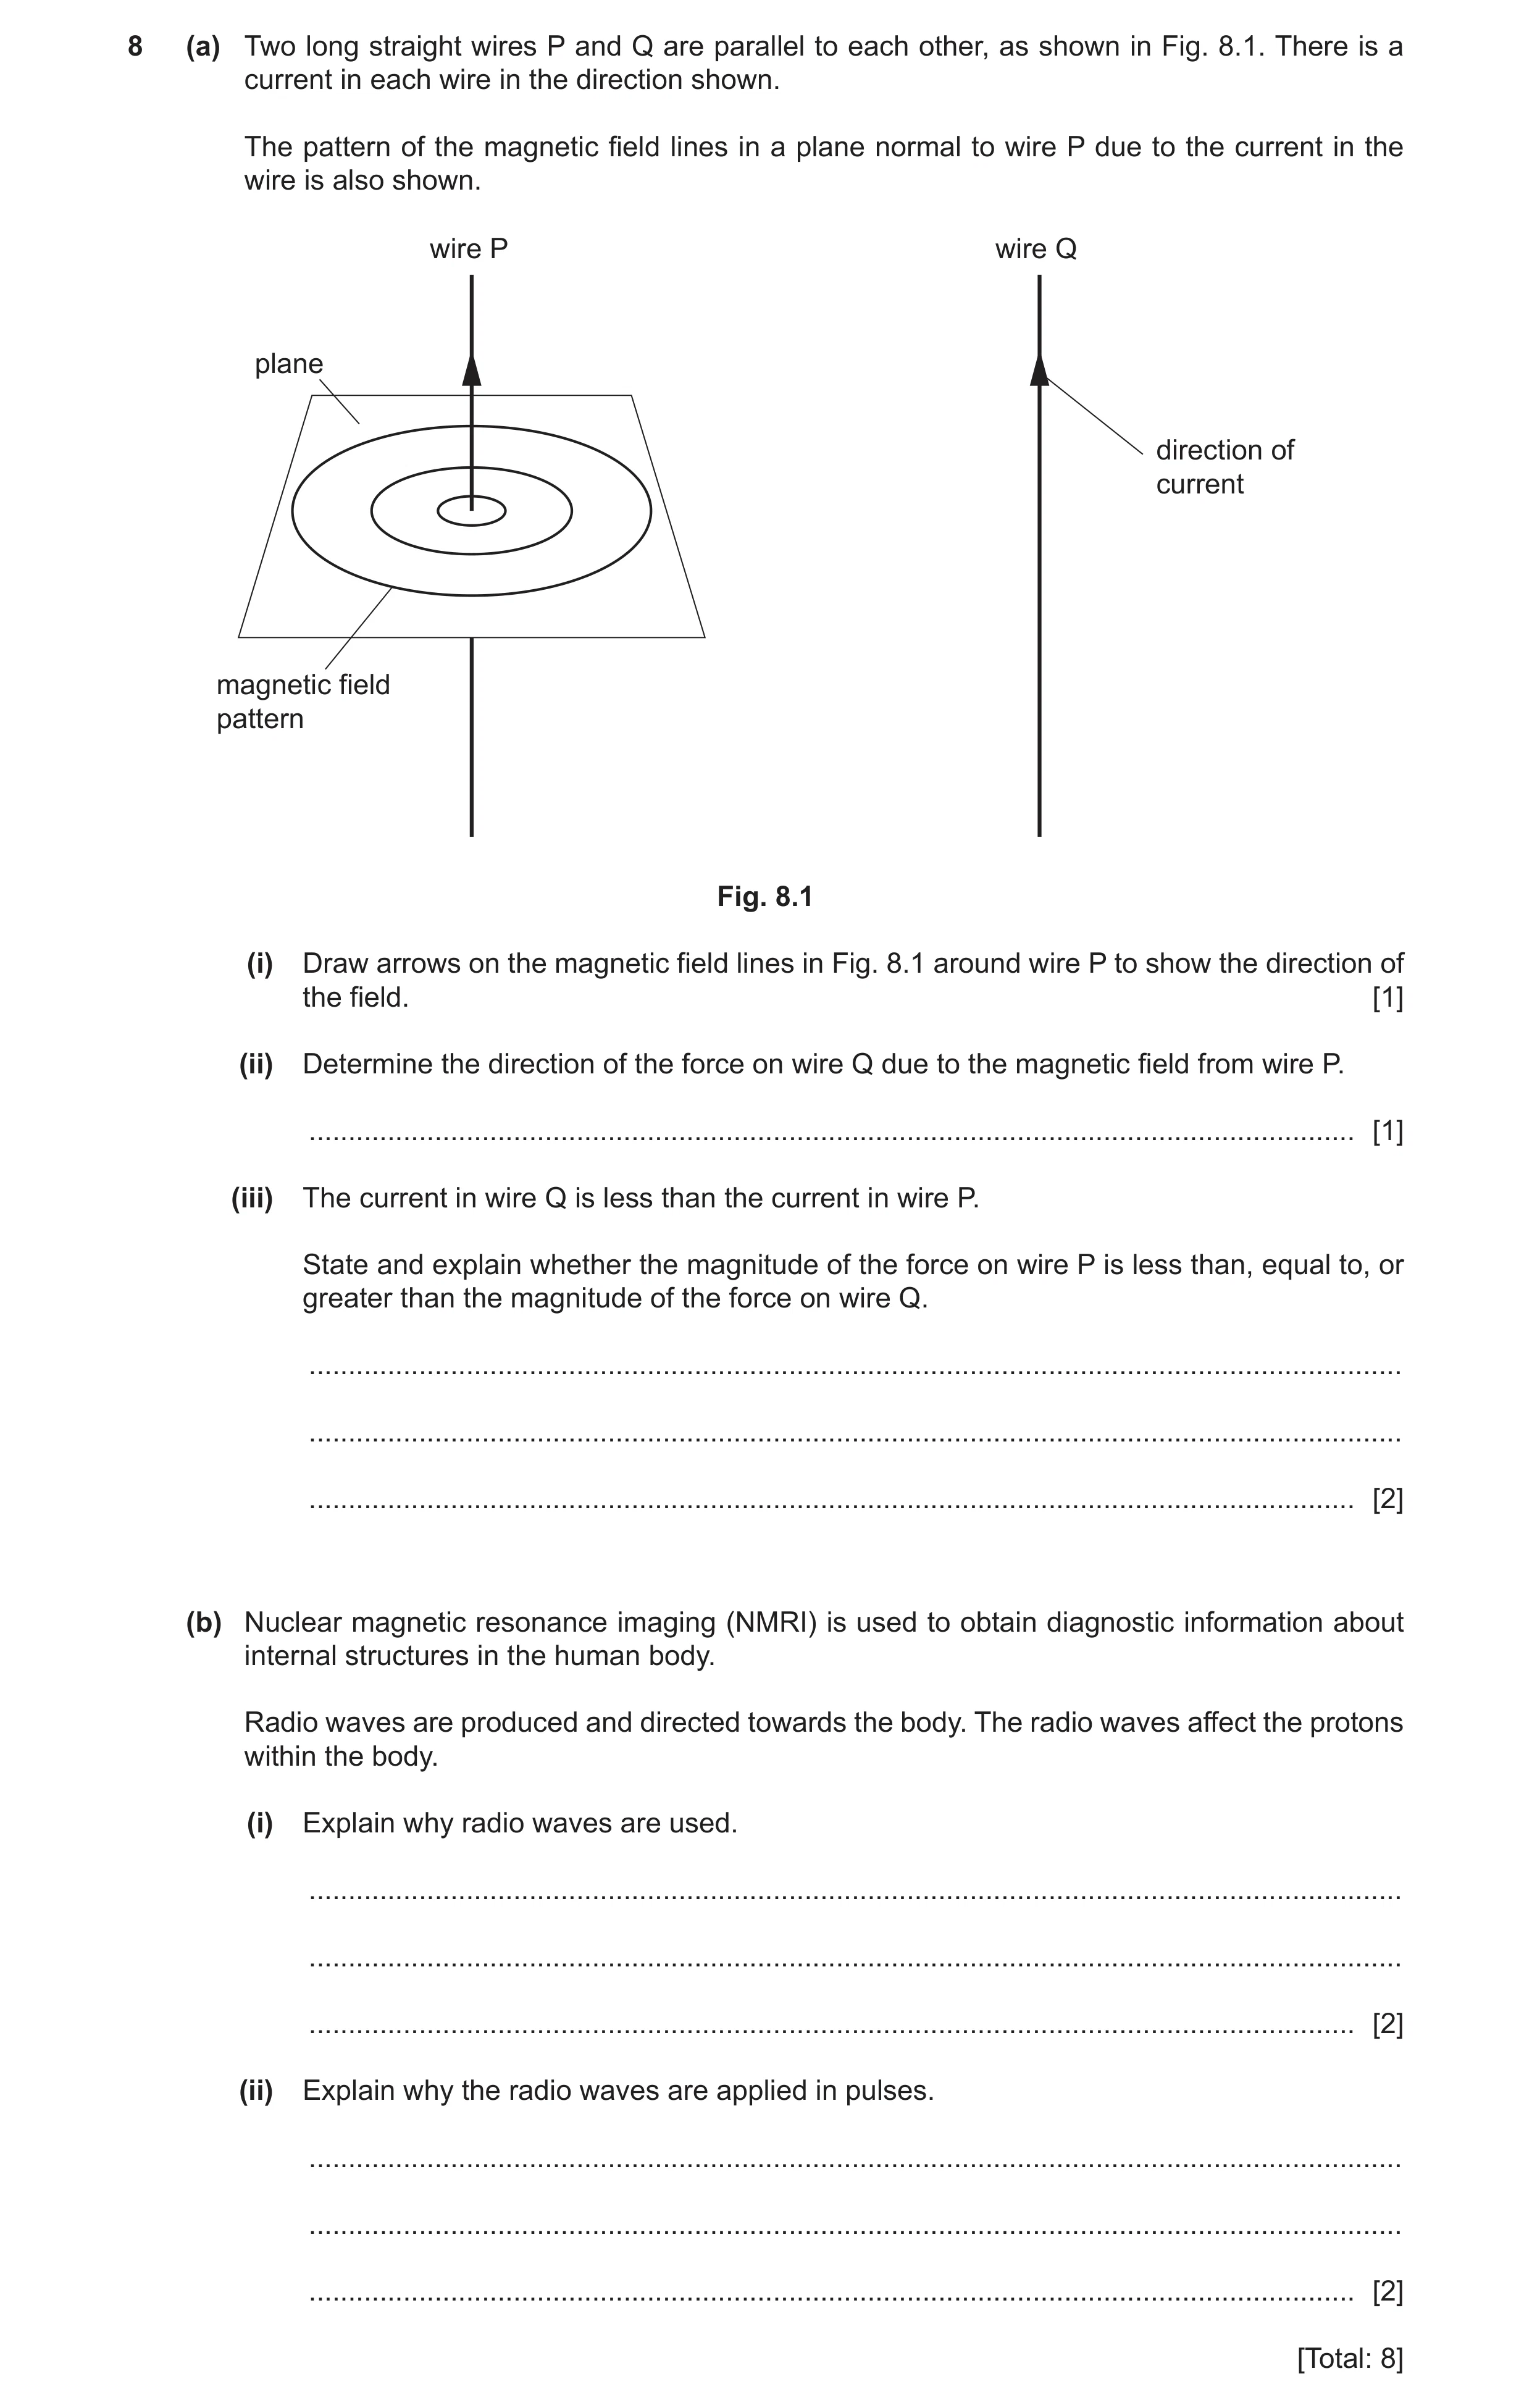
8 (a) Two long straight wires P and Q are parallel to each other, as shown in Fig. 8.1. There is a current in each wire in the direction shown. The pattern of the magnetic field lines in a plane normal to wire P due to the current in the wire is also shown. wire P wire Q plane direction of current magnetic field pattern Fig. 8.1 (i) Draw arrows on the magnetic field lines in Fig. 8.1 around wire P to show the direction of the field. [1] (ii) Determine the direction of the force on wire Q due to the magnetic field from wire P. … [1] (iii) The current in wire Q is less than the current in wire P. State and explain whether the magnitude of the force on wire P is less than, equal to, or greater than the magnitude of the force on wire Q. … … … [2] (b) Nuclear magnetic resonance imaging (NMRI) is used to obtain diagnostic information about internal structures in the human body. Radio waves are produced and directed towards the body. The radio waves affect the protons within the body. (i) Explain why radio waves are used. … … … [2] (ii) Explain why the radio waves are applied in pulses. … … … [2] [Total: 8]
8 marks
Mark scheme: 8(a)(i) at least one anticlockwise arrow and no clockwise arrows B1 8(a)(ii) (force is to the) left B1 8(a)(iii) force is the same B1 Newton’s third law (of motion) or force depends on the product of the two currents B1 Question Answer Marks 8(b)(i) frequency of radio waves is equal to natural frequency of protons B1 resonance of protons occurs / protons absorb energy B1 8(b)(ii) in between pulses / when pulse stops B1 Any 1 from: • protons de-excite • protons emit r.f. pulses • emitted (r.f.) pulse (from proton) detected B1
This question in 9702/42 Feb/March 2021
Q5 · Positron emission tomography (PET scanning) obtains diagnostic information from a person 9702/42 Feb/March 2022
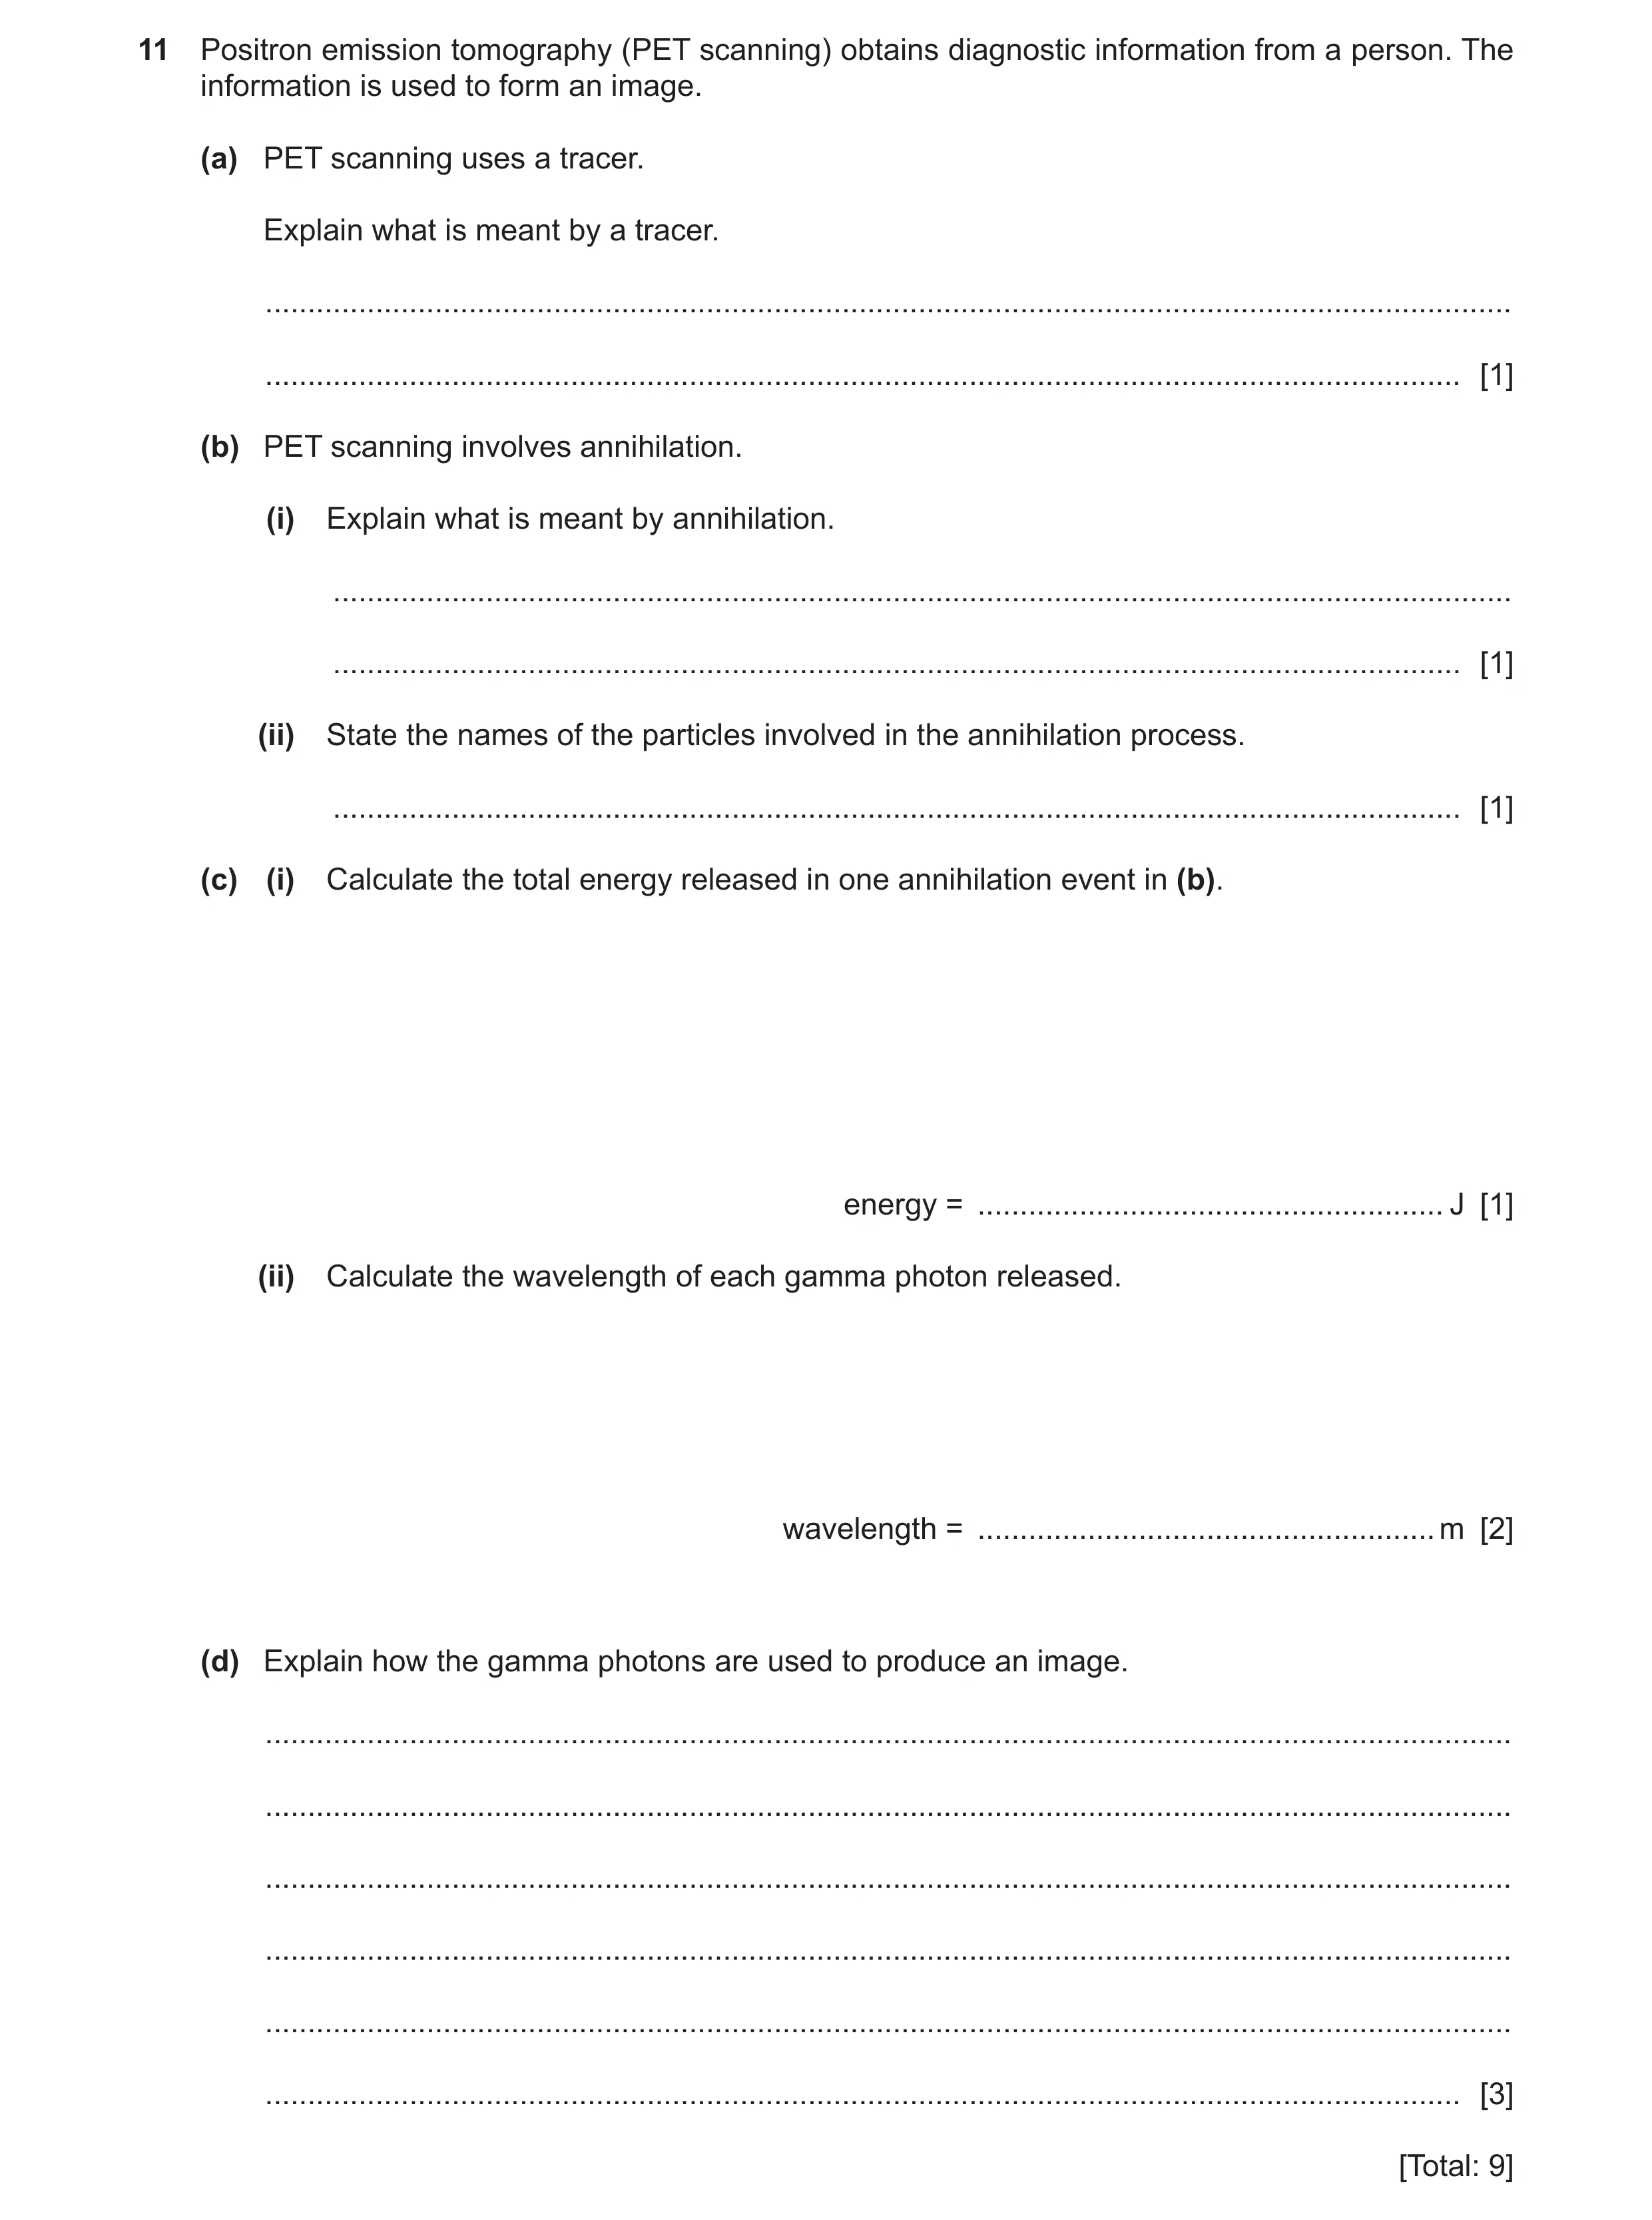
11 Positron emission tomography (PET scanning) obtains diagnostic information from a person. The information is used to form an image. (a) PET scanning uses a tracer. Explain what is meant by a tracer. … … [1] (b) PET scanning involves annihilation. (i) Explain what is meant by annihilation. … … [1] (ii) State the names of the particles involved in the annihilation process. … [1] (c) (i) Calculate the total energy released in one annihilation event in (b). energy = … J [1] (ii) Calculate the wavelength of each gamma photon released. wavelength = … m [2] (d) Explain how the gamma photons are used to produce an image. … … … … … … [3] [Total: 9]
9 marks
Mark scheme: 11(a) substance containing radioactive nuclei that is absorbed by the tissue being studied B1 11(b)(i) a particle interacting with its antiparticle so that mass is converted into energy B1 11(b)(ii) electron(s) and positron(s) B1 11(c)(i) 2 E = 2mc 31 82 = 2 9.11 10 3.00 10 − − × × × × 13 = 1.64 10 J − × A1 Question Answer Marks 11(c)(ii) 2hc = E λ 34 8 13 2 6.63 10 3.00 10 = 1.64 10 − − × × × × × C1 12 = 2.43 10 m − × A1 11(d) Any 3 from: • the two gamma photons travel in opposite directions • gamma photons detected (outside body / by detectors) • gamma photons arrive (at detector) at different times • determine location of production (of gamma) • image of tracer concentration in tissue produced B3
This question in 9702/42 Feb/March 2022
Q6 · Explain how X-rays are produced for use in medical diagnosis 9702/41 May/June 2022
9 (a) (i) Explain how X-rays are produced for use in medical diagnosis. … … … … [3] (ii) State why X-ray images are taken of multiple sections of the body during computed tomography (CT) scanning. … … [1] (b) An X-ray image is taken of the structure shown in Fig. 9.1. 2.4 cm soft tissue bone Q incident detected X-rays X-rays P 5.6 cm Fig. 9.1 The linear attenuation coefficient of bone is 3.4 cm–1. The linear attenuation coefficient of soft tissue is 0.89 cm–1. The incident X-rays are parallel and have a uniform intensity I0 across the structure. Determine, in terms of I0, the intensity of the detected X-rays from: (i) point P detected intensity = … I0 [2] (ii) point Q. detected intensity = … I0 [2] (c) Explain, with reference to your answers in (b), whether the X-ray image of the structure in Fig. 9.1 has good contrast. … … … [1] [Total: 9]
9 marks
Mark scheme: 9(a)(i) electrons are accelerated (by an applied p.d.) B1 electrons hit target B1 X-rays produced when electrons decelerate B1 9(a)(ii) images of the multiple sections are combined to create a 3-D image B1 9(b)(i) I = I0 exp (– μx) C1 = I0 exp (– 0.89 5.6) = 0.0068 I0 A1 9(b)(ii) I = I0 exp (– 2.4 3.4) exp (– 0.89 3.2) C1 = 1.7 10–5 I0 A1 9(c) comparison of intensities or values in (b) leading to conclusion consistent with these values B1
This question in 9702/41 May/June 2022
Q7 · Explain how X-rays are produced for use in medical diagnosis 9702/43 May/June 2022
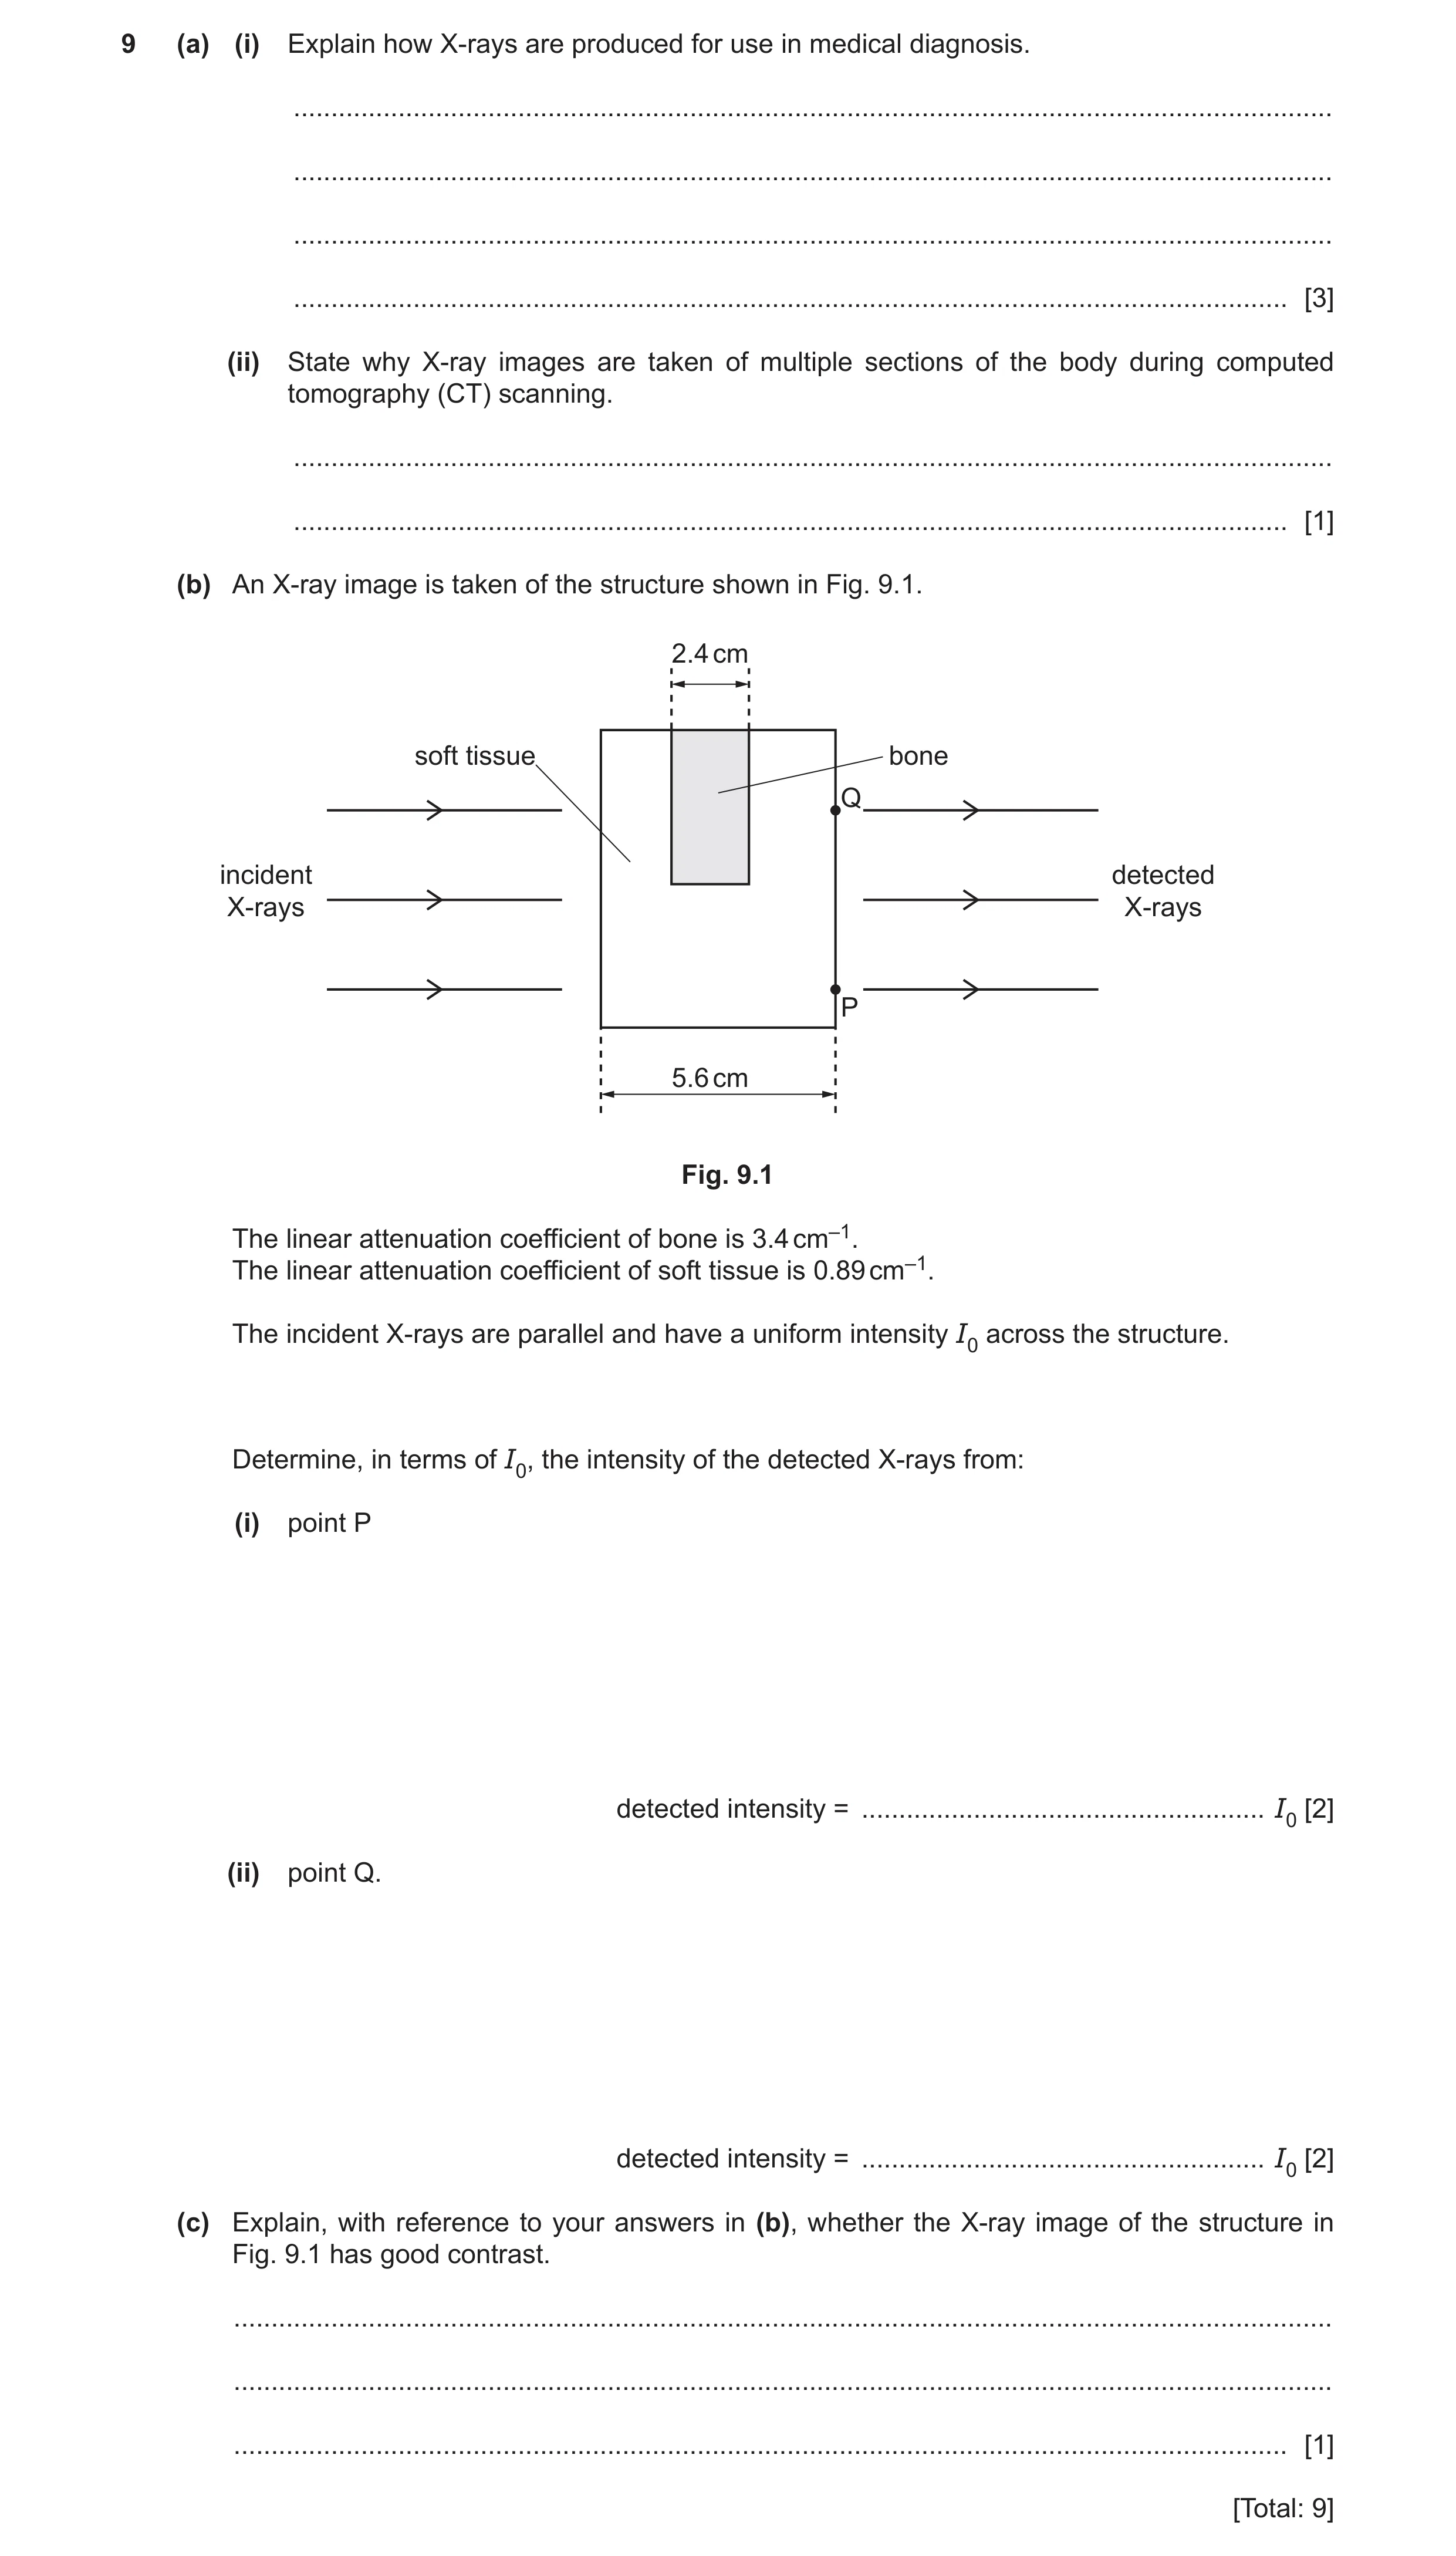
9 (a) (i) Explain how X-rays are produced for use in medical diagnosis. … … … … [3] (ii) State why X-ray images are taken of multiple sections of the body during computed tomography (CT) scanning. … … [1] (b) An X-ray image is taken of the structure shown in Fig. 9.1. 2.4 cm soft tissue bone Q incident detected X-rays X-rays P 5.6 cm Fig. 9.1 The linear attenuation coefficient of bone is 3.4 cm–1. The linear attenuation coefficient of soft tissue is 0.89 cm–1. The incident X-rays are parallel and have a uniform intensity I0 across the structure. Determine, in terms of I0, the intensity of the detected X-rays from: (i) point P detected intensity = … I0 [2] (ii) point Q. detected intensity = … I0 [2] (c) Explain, with reference to your answers in (b), whether the X-ray image of the structure in Fig. 9.1 has good contrast. … … … [1] [Total: 9]
9 marks
Mark scheme: 9(a)(i) electrons are accelerated (by an applied p.d.) B1 electrons hit target B1 X-rays produced when electrons decelerate B1 9(a)(ii) images of the multiple sections are combined to create a 3-D image B1 9(b)(i) I = I0 exp (– μx) C1 = I0 exp (– 0.89 5.6) = 0.0068 I0 A1 9(b)(ii) I = I0 exp (– 2.4 3.4) exp (– 0.89 3.2) C1 = 1.7 10–5 I0 A1 9(c) comparison of intensities or values in (b) leading to conclusion consistent with these values B1
This question in 9702/43 May/June 2022
Q8 · Positron emission tomography (PET scanning) involves the detection of gamma-radiation in… 9702/42 Oct/Nov 2022
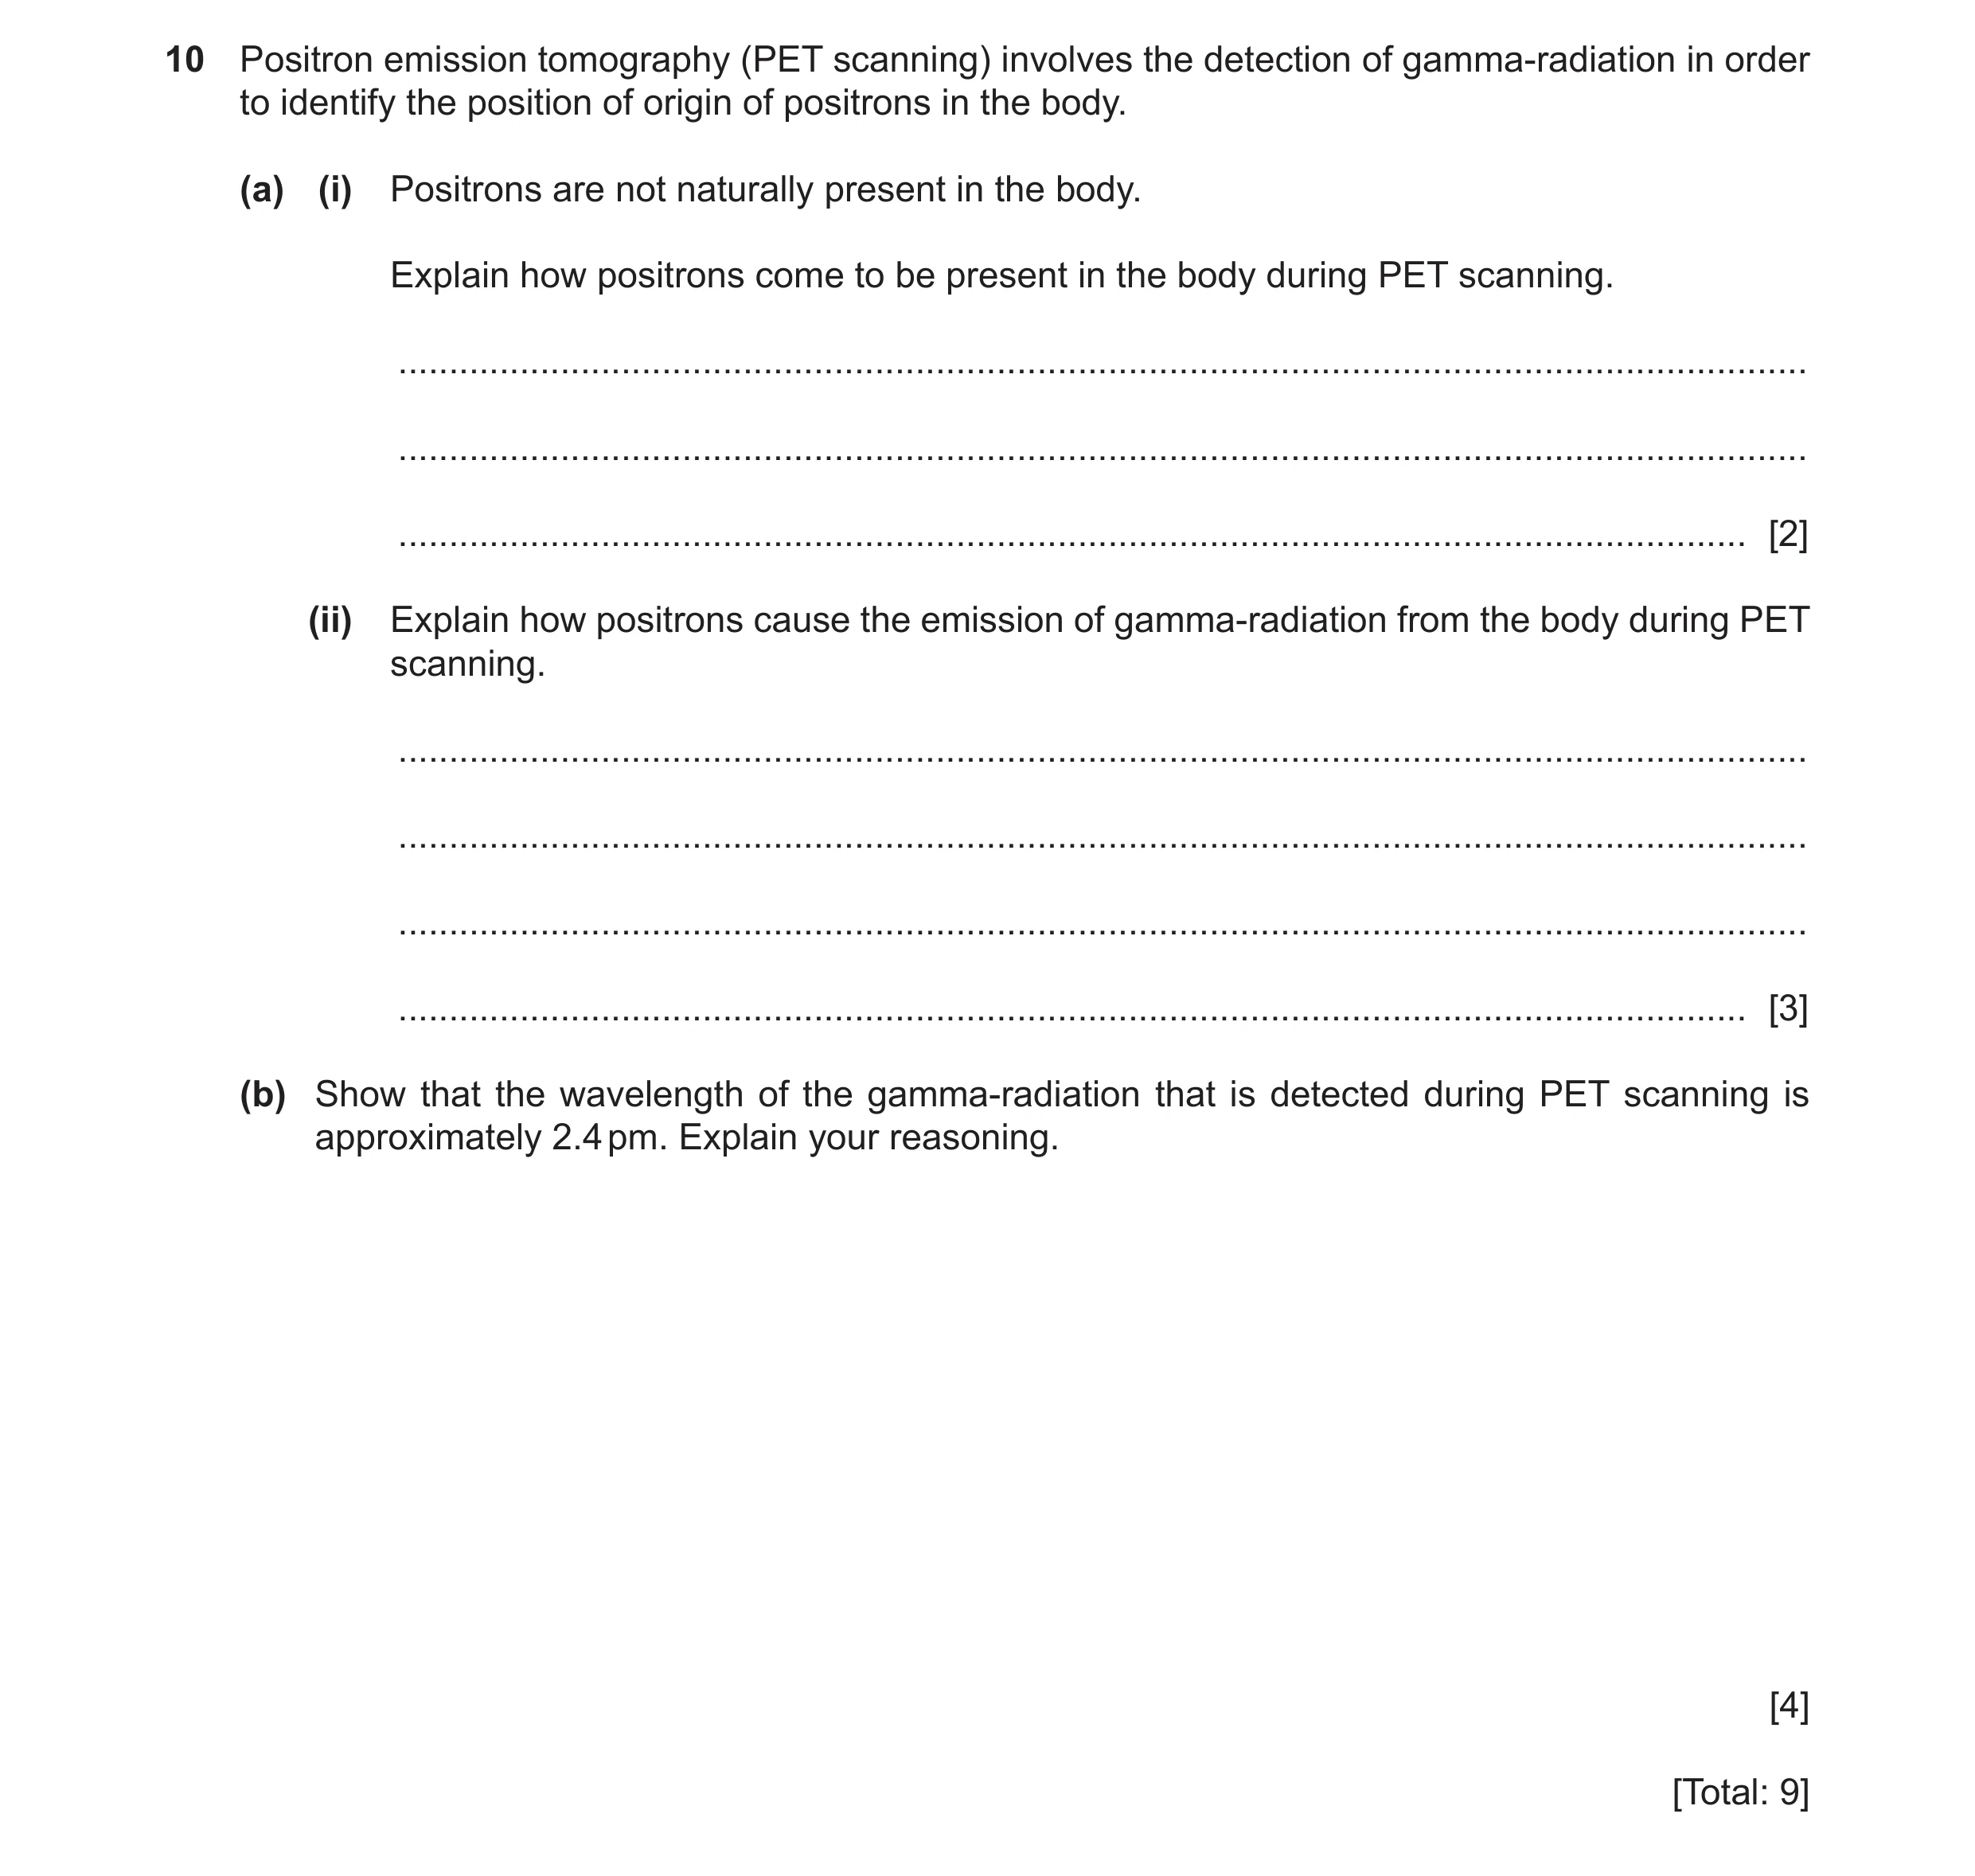
10 Positron emission tomography (PET scanning) involves the detection of gamma-radiation in order to identify the position of origin of positrons in the body. (a) (i) Positrons are not naturally present in the body. Explain how positrons come to be present in the body during PET scanning. … … … [2] (ii) Explain how positrons cause the emission of gamma-radiation from the body during PET scanning. … … … … [3] (b) Show that the wavelength of the gamma-radiation that is detected during PET scanning is approximately 2.4 pm. Explain your reasoning. [4] [Total: 9]
9 marks
Mark scheme: 10(a)(i) introduction of tracer (into the body) M1 containing a + emitter A1 10(a)(ii) positron interacts with electron B1 (pair) annihilation occurs B1 mass of particles converted into gamma photons B1 10(b) (annihilation of electron and positron) produces two photons B1 E = ()mc2 B1 E = hf and f = c / B1 or E = hc / = {[2] 6.63 10–34 3.00 108} / {[2] 9.11 10–31 (3.00 108)2} B1 = 2.4(3) 10–12 m or 2.4(3) pm (full substitution and answer with unit needed)
This question in 9702/42 Oct/Nov 2022
Q9 · Fluorine-18 (189F) is a radioactive nuclide that is used as a tracer in positron emission… 9702/42 Oct/Nov 2023
9 Fluorine-18 (189F) is a radioactive nuclide that is used as a tracer in positron emission tomography (PET scanning). Fluorine-18 decays to a nuclide of oxygen (O) according to 189F QP X + R8O. (a) (i) State what is meant by a tracer. … … [1] (ii) State the symbol of the particle that is represented by X and the values of P, Q and R. X: … P: … Q: … R: … [2] (b) (i) Explain how the radioactive decay of fluorine-18 results in the emission from the body of the gamma-ray photons that are detected during a PET scan. … … … … [2] (ii) Explain how the detection of the gamma-ray photons is used to produce an image of the tissue being examined. … … … … [2] (c) The half-life of fluorine-18 is T. A patient is injected with amount of substance n of fluorine-18. (i) Determine an expression for the initial value R0 of the rate R of production of gamma-ray photons by the tracer, in terms of n, T and the Avogadro constant NA. R0 = … [3] (ii) On Fig. 9.1, sketch the variation with time t of R. R0 R 0 0 T t Fig. 9.1 [2] [Total: 12]
12 marks
Mark scheme: 9(a)(i) material introduced into the body B1 and (position in body) can be detected or absorbed by the tissue (being studied) 9(a)(ii) X = + or e+ and P = 1 B1 Q = 0 and R = 18 B1 9(b)(i) positrons (emitted in the decay) and electrons annihilate B1 mass of particles becomes energy of gamma photons B1 9(b)(ii) arrival times of photons are processed B1 image built up of tracer concentration in the tissue B1 9(c)(i) A = N and = ln 2 / T C1 N = n NA C1 2 photons produced from each decay, so R0 = 2 n NA A1 R0 = (2 ln 2) nNA / T (allow 0.693 for ln 2) 9(c)(ii) sketch: exponential decay curve from t = 0 to t = 2T, starting at (0, R0) and with a negative gradient of continuously B1 decreasing magnitude line with negative gradient passing through (T, R0 / 2) and (2T, R0 / 4) B1
This question in 9702/42 Oct/Nov 2023
Q10 · Polonium‑193 (19384Po) is an unstable nuclide 9702/42 Feb/March 2025
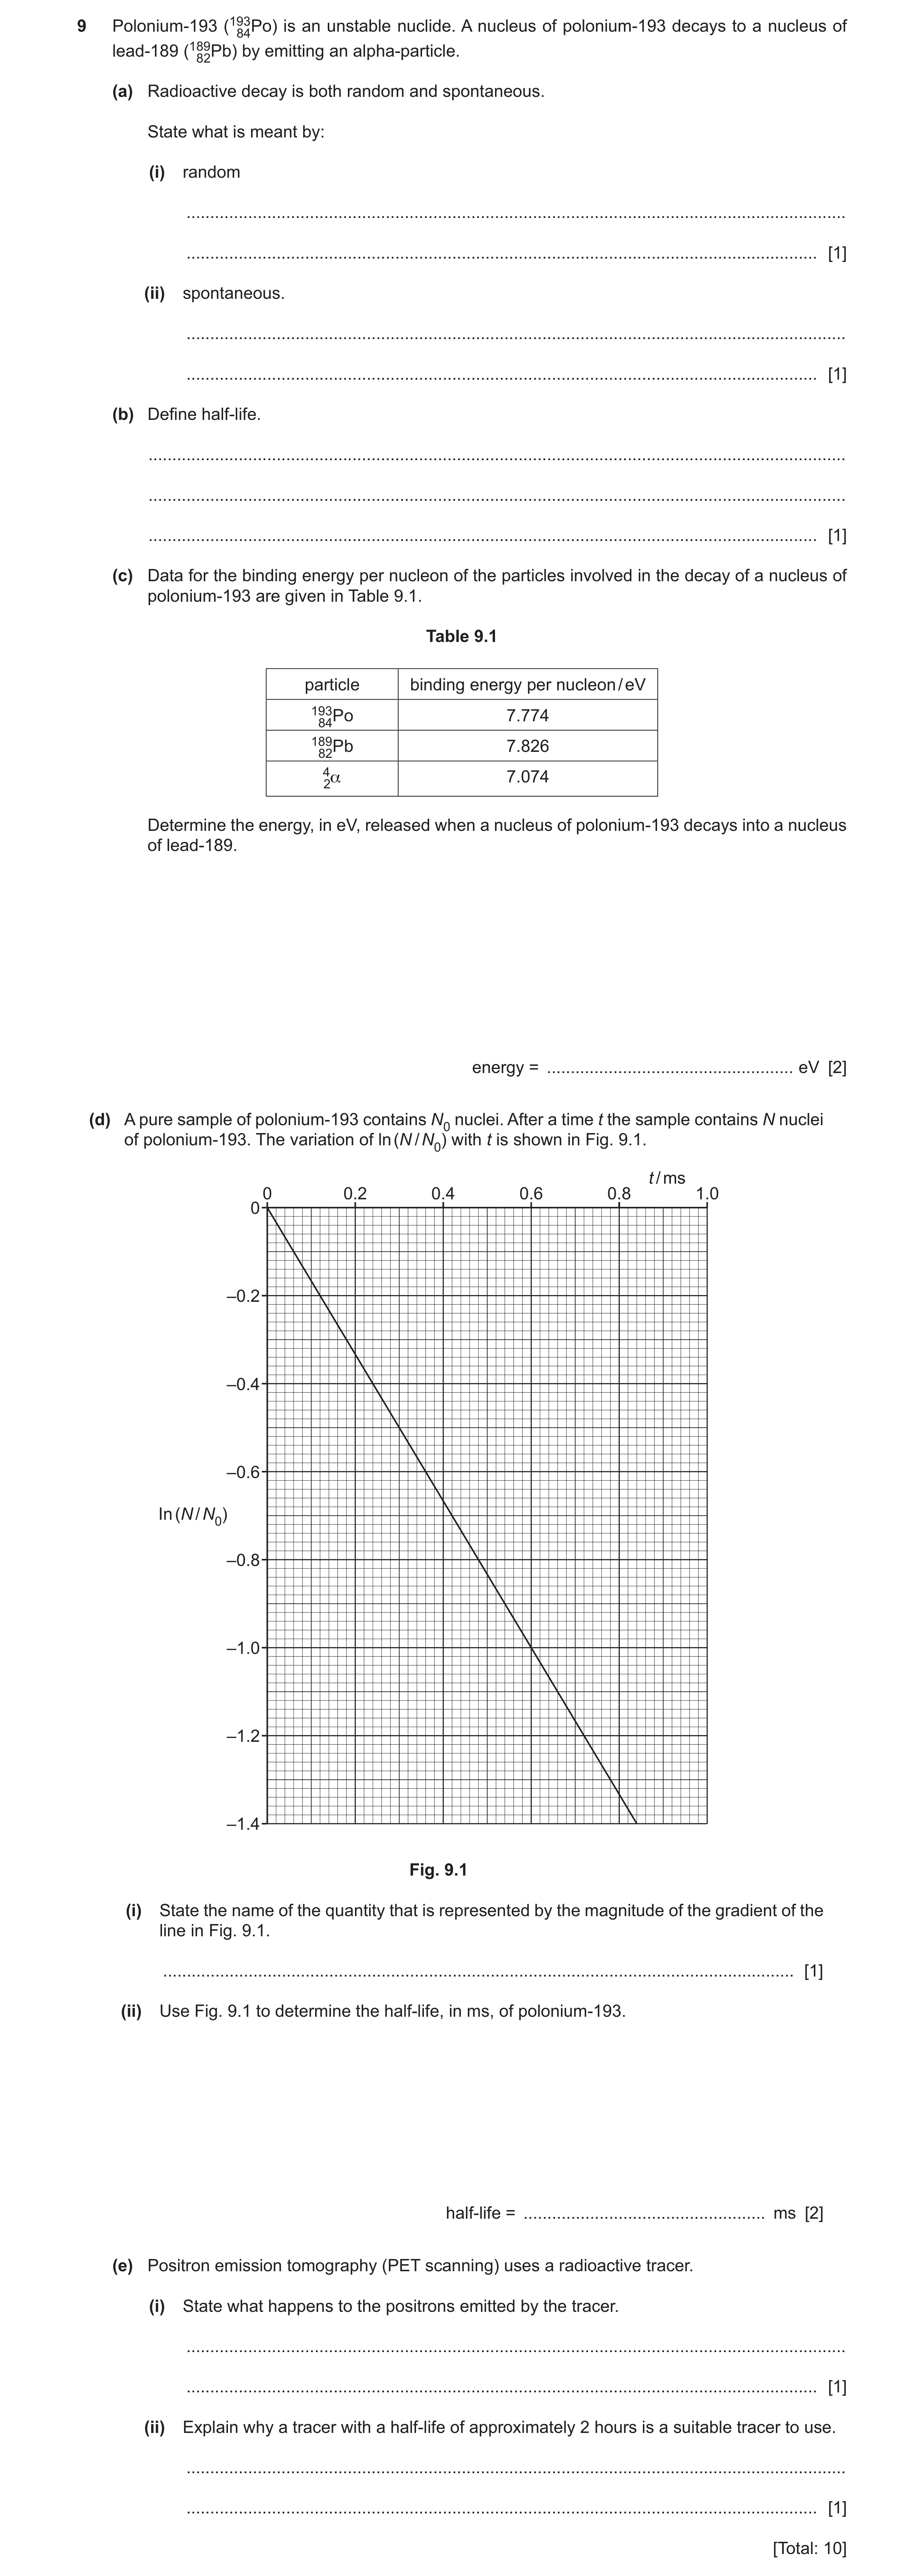
9 Polonium‑193 (19384Po) is an unstable nuclide. A nucleus of polonium‑193 decays to a nucleus of lead‑189 (18982Pb) by emitting an alpha‑particle. (a) Radioactive decay is both random and spontaneous. State what is meant by: (i) random … … [1] (ii) spontaneous. … … [1] (b) Define half‑life. … … … [1] (c) Data for the binding energy per nucleon of the particles involved in the decay of a nucleus of polonium‑193 are given in Table 9.1. Table 9.1 particle binding energy per nucleon / eV 19384Po 7.774 18982Pb 7.826 4α 7.074 2 Determine the energy, in eV, released when a nucleus of polonium‑193 decays into a nucleus of lead‑189. energy = … eV [2] (d) A pure sample of polonium‑193 contains N0 nuclei. After a time t the sample contains N nuclei of polonium‑193. The variation of ln (N / N0) with t is shown in Fig. 9.1. t / ms 0 0.2 0.4 0.6 0.8 1.0 0 –0.2 –0.4 –0.6 In (N / N0) –0.8 –1.0 –1.2 –1.4 Fig. 9.1 (i) State the name of the quantity that is represented by the magnitude of the gradient of the line in Fig. 9.1. … [1] (ii) Use Fig. 9.1 to determine the half‑life, in ms, of polonium‑193. half‑life = … ms [2] (e) Positron emission tomography (PET scanning) uses a radioactive tracer. (i) State what happens to the positrons emitted by the tracer. … … [1] (ii) Explain why a tracer with a half‑life of approximately 2 hours is a suitable tracer to use. … … [1] [Total: 10]
10 marks
Mark scheme: 9(a)(i) either: cannot predict when a (particular) nucleus will decay B1 or: cannot predict which nucleus will decay next 9(a)(ii) not affected by external / environmental factors B1 9(b) time for activity to halve B1 9(c) energy = (189 7.826) + (4 7.074) – (193 7.774) C1 = 7.03 eV A1 9(d)(i) decay constant A1 9(d)(ii) decay constant / magnitude of gradient = 1.4 / 0.84 C1 half-life = ln2 / (1.4 / 0.84) A1 = 0.42 ms 9(e)(i) positrons collide with electrons and annihilate B1 9(e)(ii) long enough to have time to conduct investigation, not so long as to cause patient unnecessary exposure to radiation B1
This question in 9702/42 Feb/March 2025
Q11 · State what is meant by contrast in an X-ray image 9702/42 Oct/Nov 2025
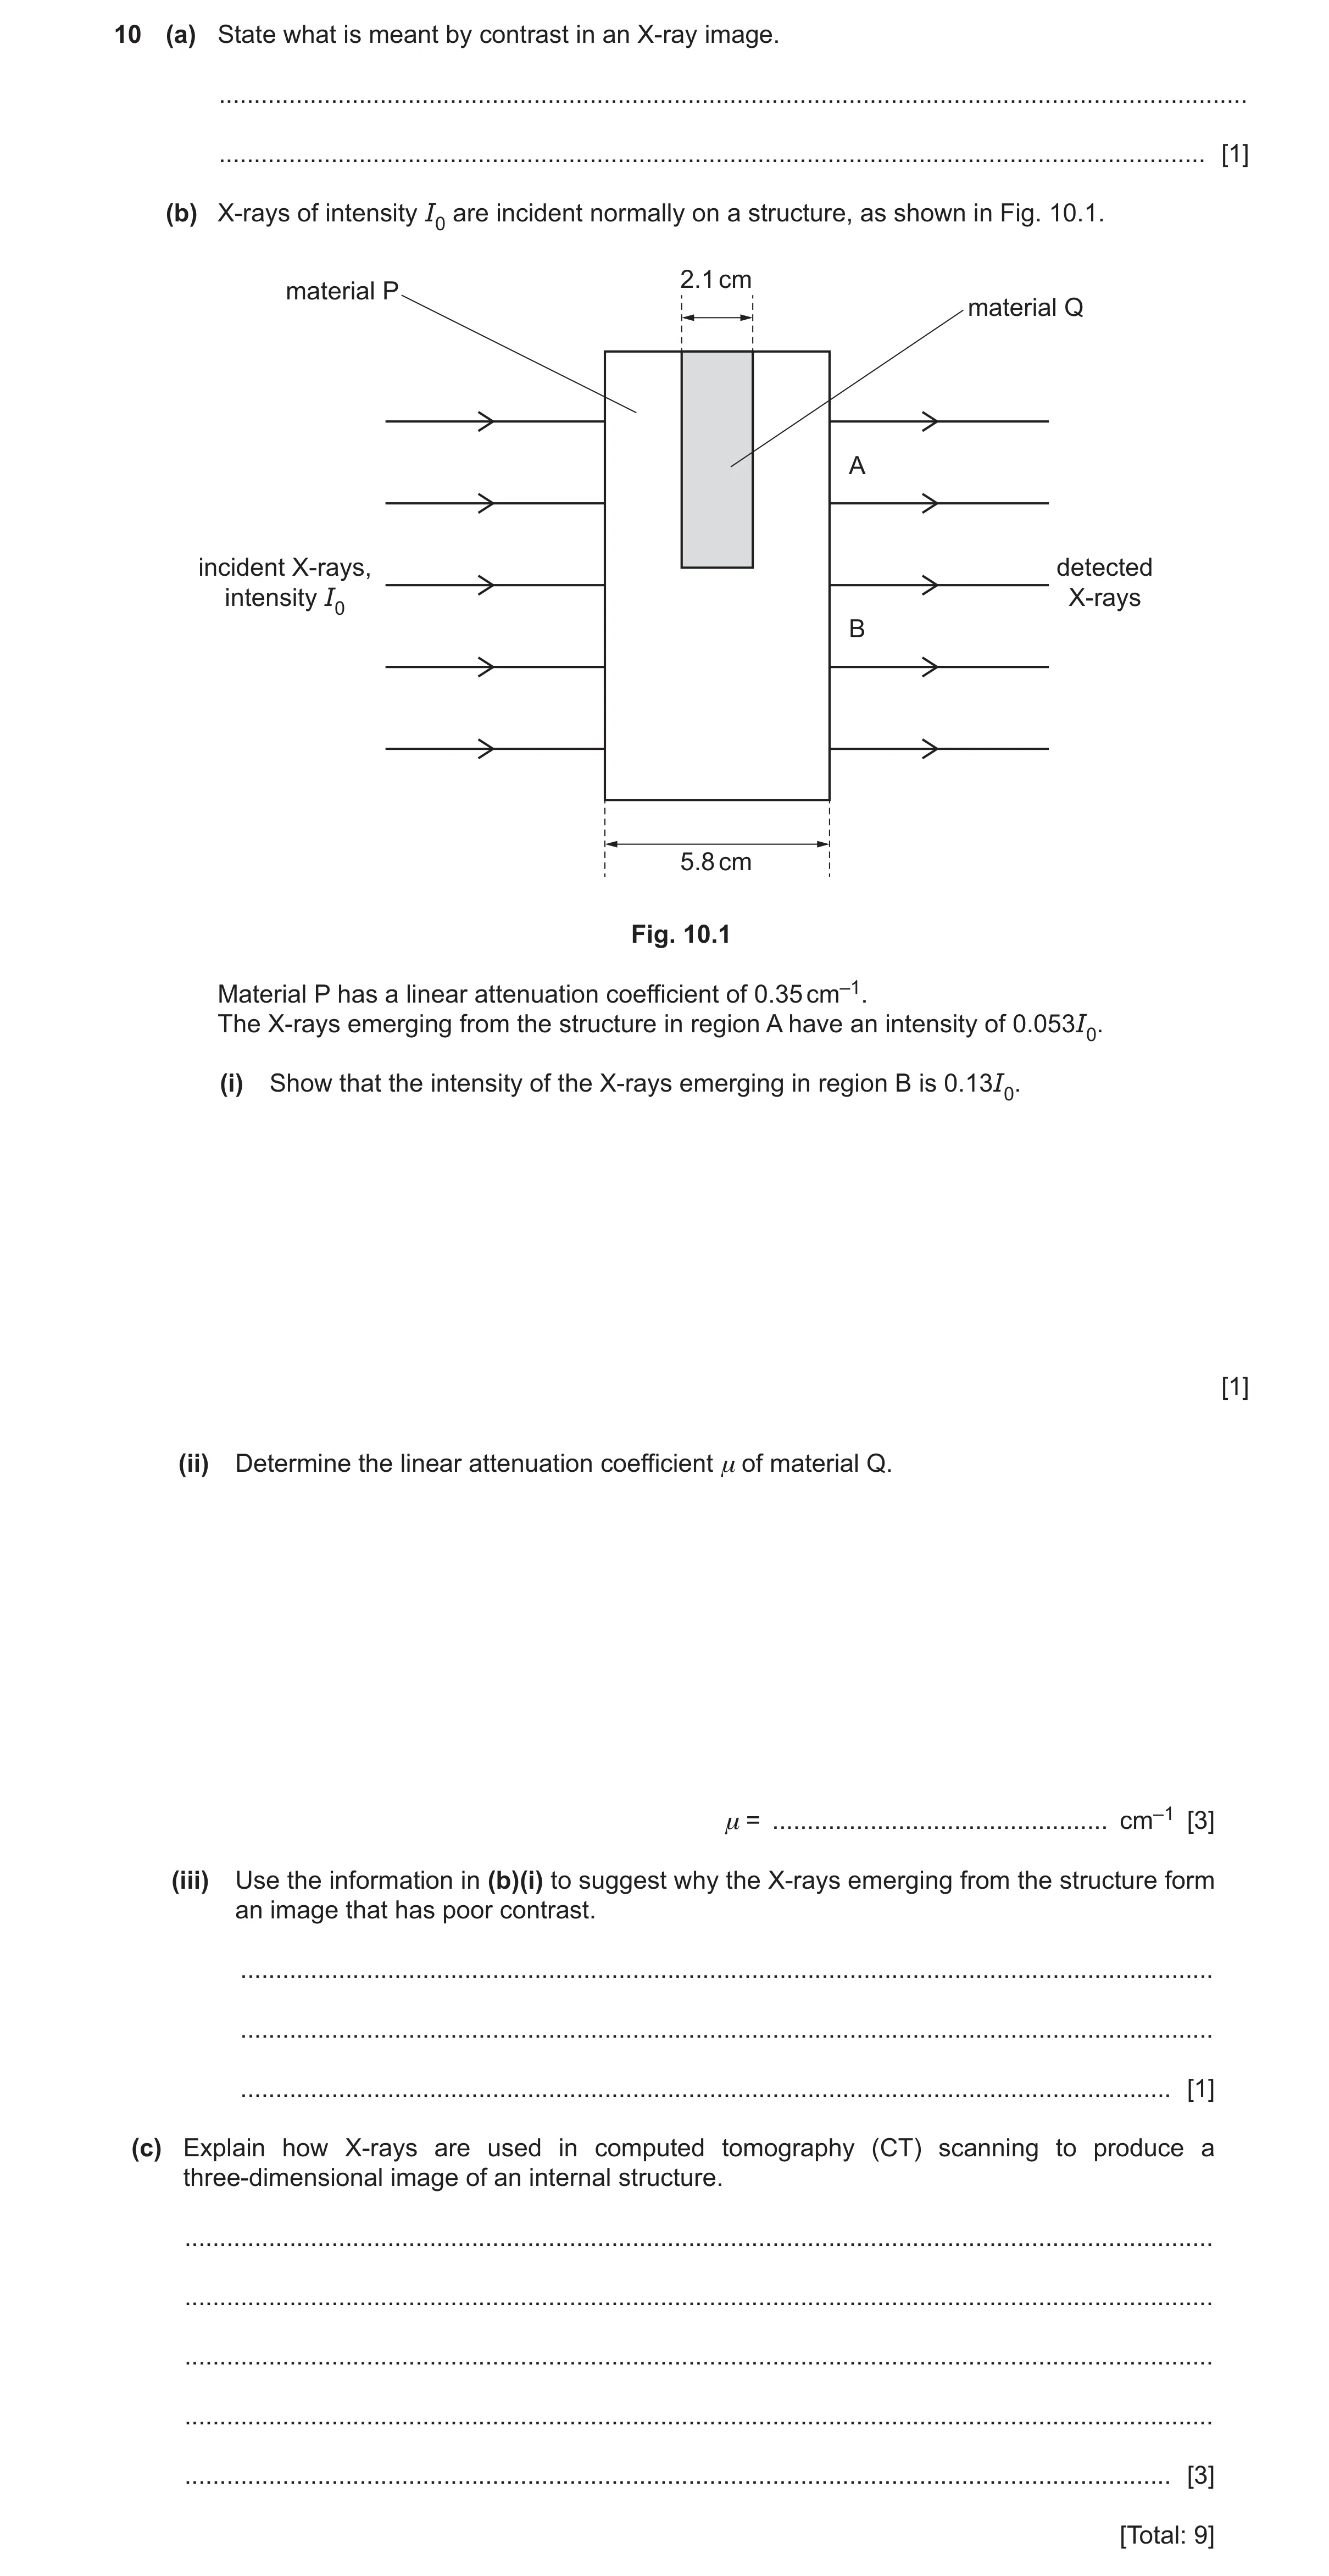
10 (a) State what is meant by contrast in an X-ray image. … … [1] (b) X-rays of intensity I0 are incident normally on a structure, as shown in Fig. 10.1. 2.1 cm material P material Q A incident X-rays, detected intensity I0 X-rays B 5.8 cm Fig. 10.1 Material P has a linear attenuation coefficient of 0.35 cm–1. The X-rays emerging from the structure in region A have an intensity of 0.053I0. (i) Show that the intensity of the X-rays emerging in region B is 0.13I0. [1] (ii) Determine the linear attenuation coefficient μ of material Q. μ = … cm–1 [3] (iii) Use the information in (b)(i) to suggest why the X-rays emerging from the structure form an image that has poor contrast. … … … [1] (c) Explain how X-rays are used in computed tomography (CT) scanning to produce a three-dimensional image of an internal structure. … … … … … [3] [Total: 9]
9 marks
Mark scheme: 10(a) difference in degrees of blackening B1 10(b)(i) I = I0 exp (–x) A1 = I0 exp (– 5.8 0.35) = 0.13 I0 10(b)(ii) use of exp {–(0.35 3.7)} factor C1 0.053I0 = I0 exp {–[(0.35 3.7) + 2.1]} C1 = 0.78 cm–1 A1 10(b)(iii) factor of only 2.5 between the (detected) intensities (so not good contrast) B1 10(c) (structure) scanned in (thin) sections B1 (many) scans (of each section) taken from different angles B1 scanning repeated for all sections and (data) compiled (to form 3D image) B1
This question in 9702/42 Oct/Nov 2025
Q12 · Oxygen-15 (158O) is radioactive and has a half-life of 2.04 minutes 9702/44 Oct/Nov 2025
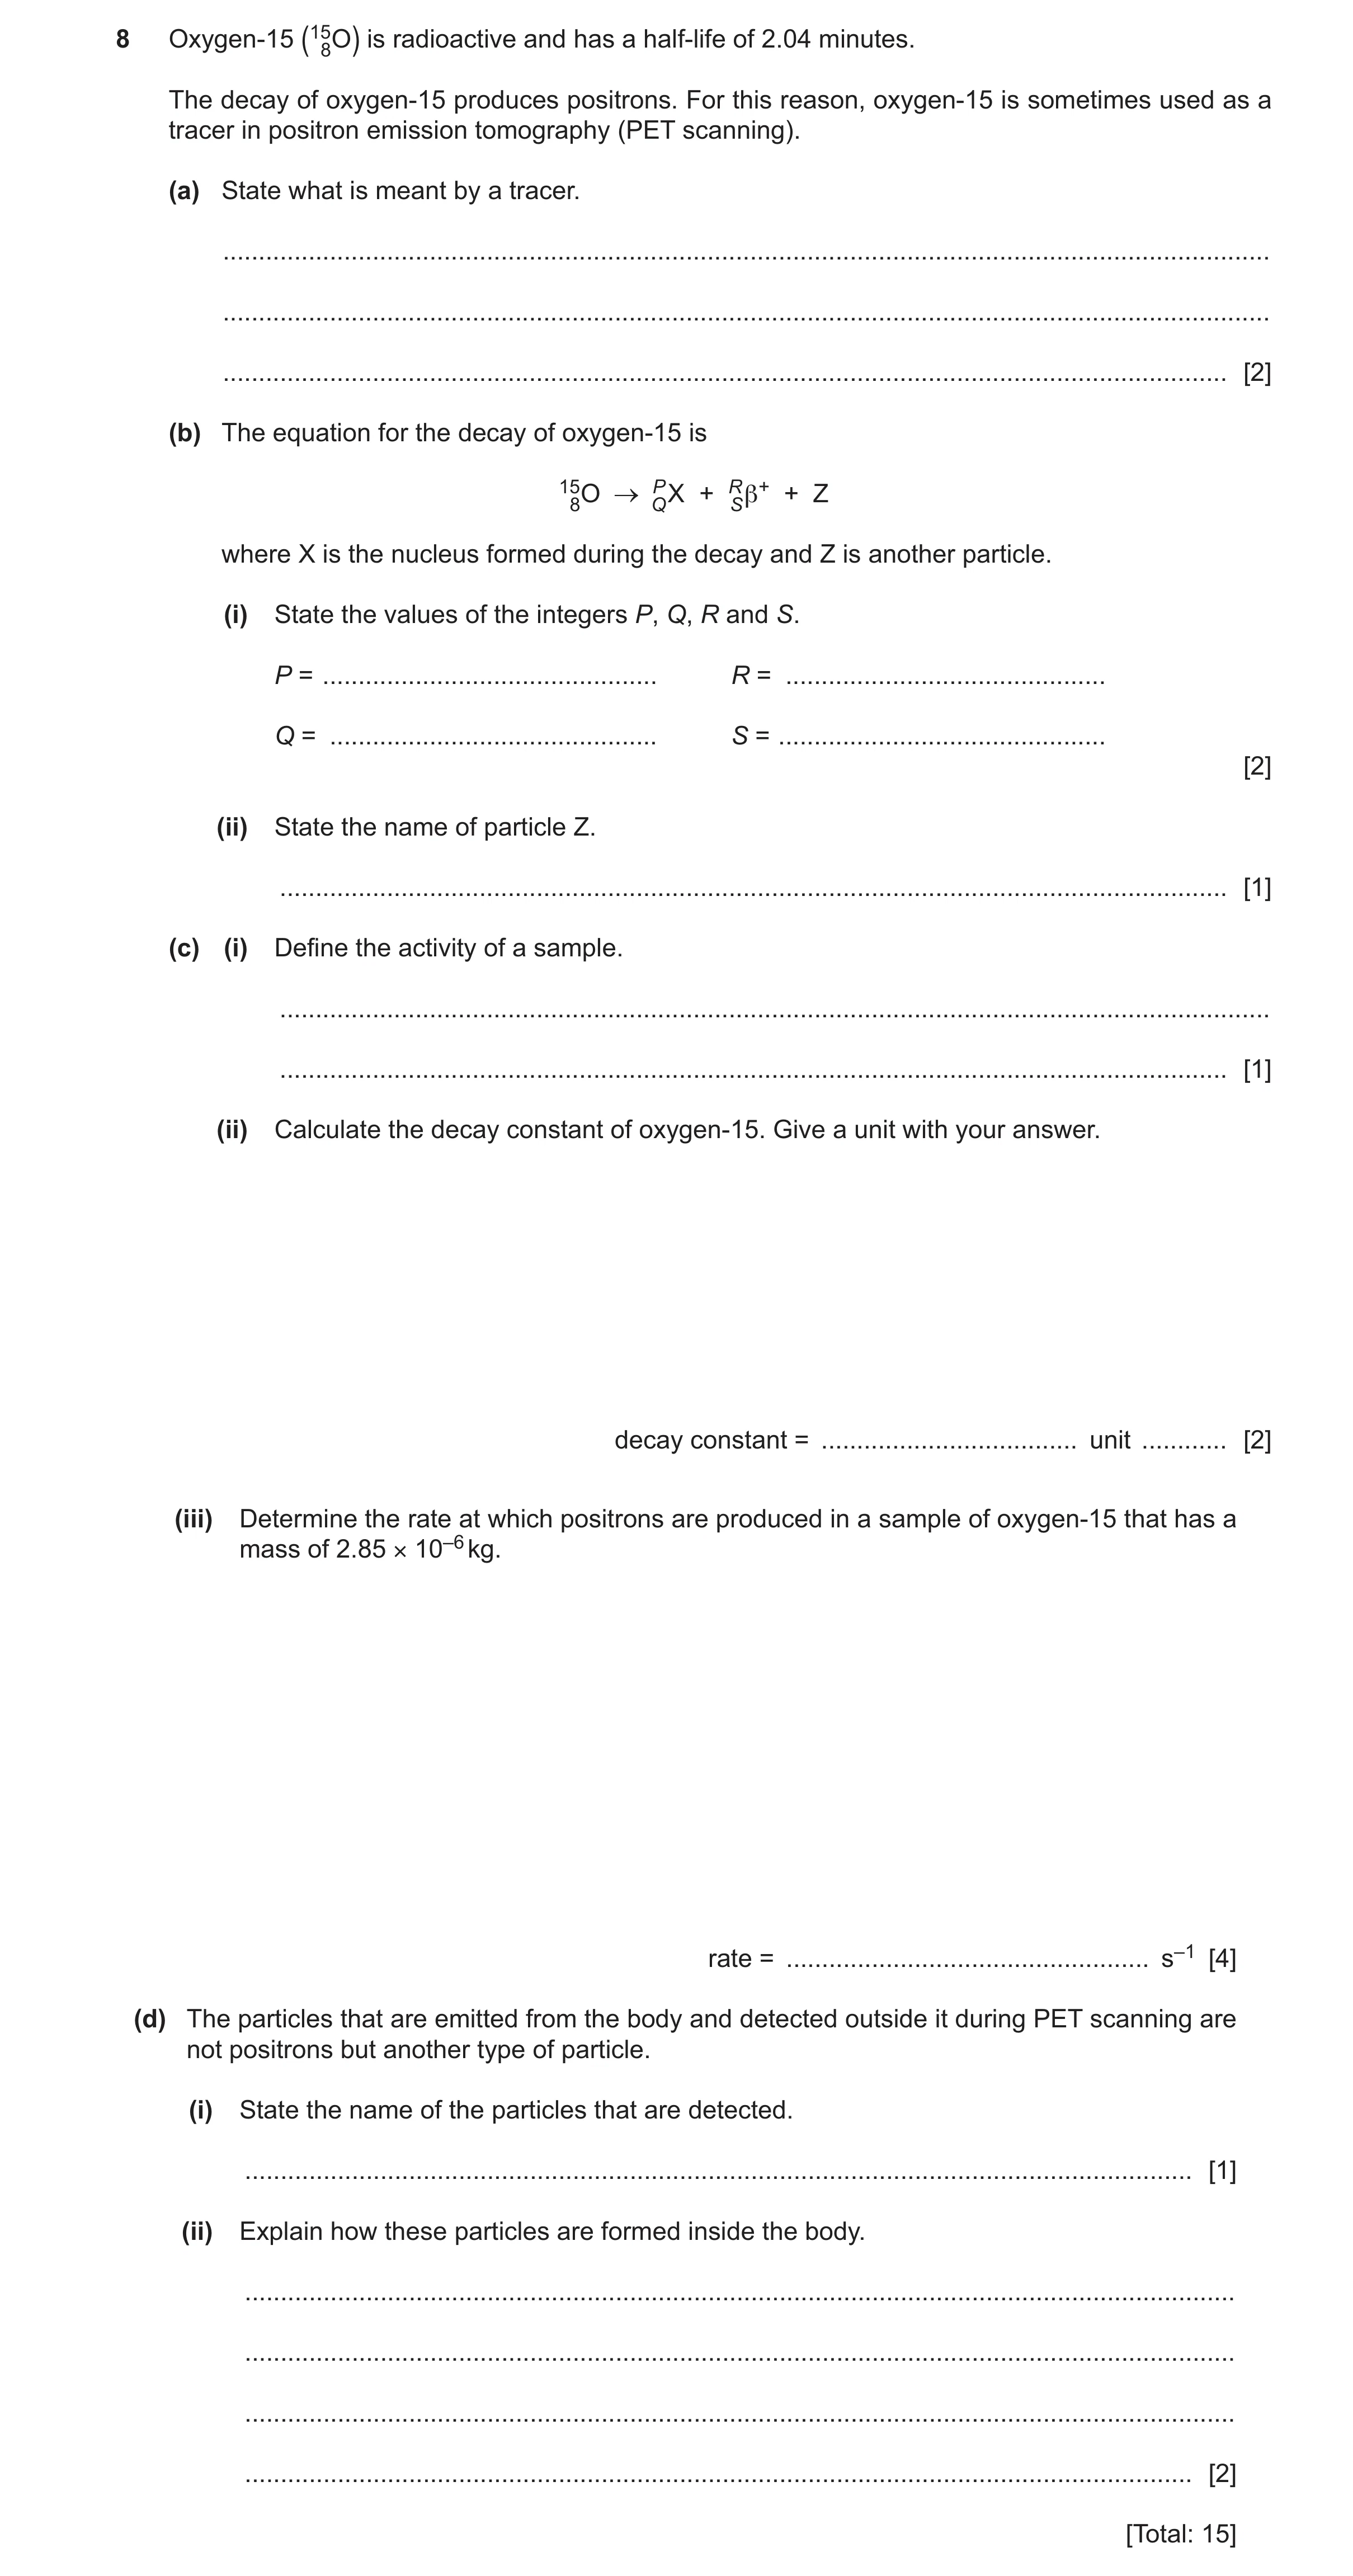
8 Oxygen-15 (158O) is radioactive and has a half-life of 2.04 minutes. The decay of oxygen-15 produces positrons. For this reason, oxygen-15 is sometimes used as a tracer in positron emission tomography (PET scanning). (a) State what is meant by a tracer. … … … [2] (b) The equation for the decay of oxygen-15 is 158O Q XP + RS β+ + Z where X is the nucleus formed during the decay and Z is another particle. (i) State the values of the integers P, Q, R and S. P = … R = … Q = … S = … [2] (ii) State the name of particle Z. … [1] (c) (i) Define the activity of a sample. … … [1] (ii) Calculate the decay constant of oxygen-15. Give a unit with your answer. decay constant = … unit … [2] (iii) Determine the rate at which positrons are produced in a sample of oxygen-15 that has a mass of 2.85 × 10⁻⁶ kg. rate = … s–1 [4] (d) The particles that are emitted from the body and detected outside it during PET scanning are not positrons but another type of particle. (i) State the name of the particles that are detected. … [1] (ii) Explain how these particles are formed inside the body. … … … … [2] [Total: 15]
15 marks
Mark scheme: 8(a) (radioactive) substance introduced into the body B1 substance absorbed by the tissues being studied B1 8(b)(i) P = 15 and R = 0 A1 Q = 7 and S = (+)1 A1 8(b)(ii) (electron) neutrino B1 8(c)(i) number of nuclear disintegrations per unit time B1 8(c)(ii) decay constant = ln 2 / (2.04 60) C1 = 5.66 10–3 s–1 A1 8(c)(iii) N = (2.85 10–6) / (15 1.66 10–27) C1 A = N C1 rate = (5.66 10–3) (2.85 10–6) / (15 1.66 10–27) C1 = 6.48 1017 s–1 A1 8(d)(i) gamma photons B1 8(d)(ii) positron collides with electron (in body) B1 annihilation results in their masses becoming photon energy B1
This question in 9702/44 Oct/Nov 2025
 1 / 16
 2 / 16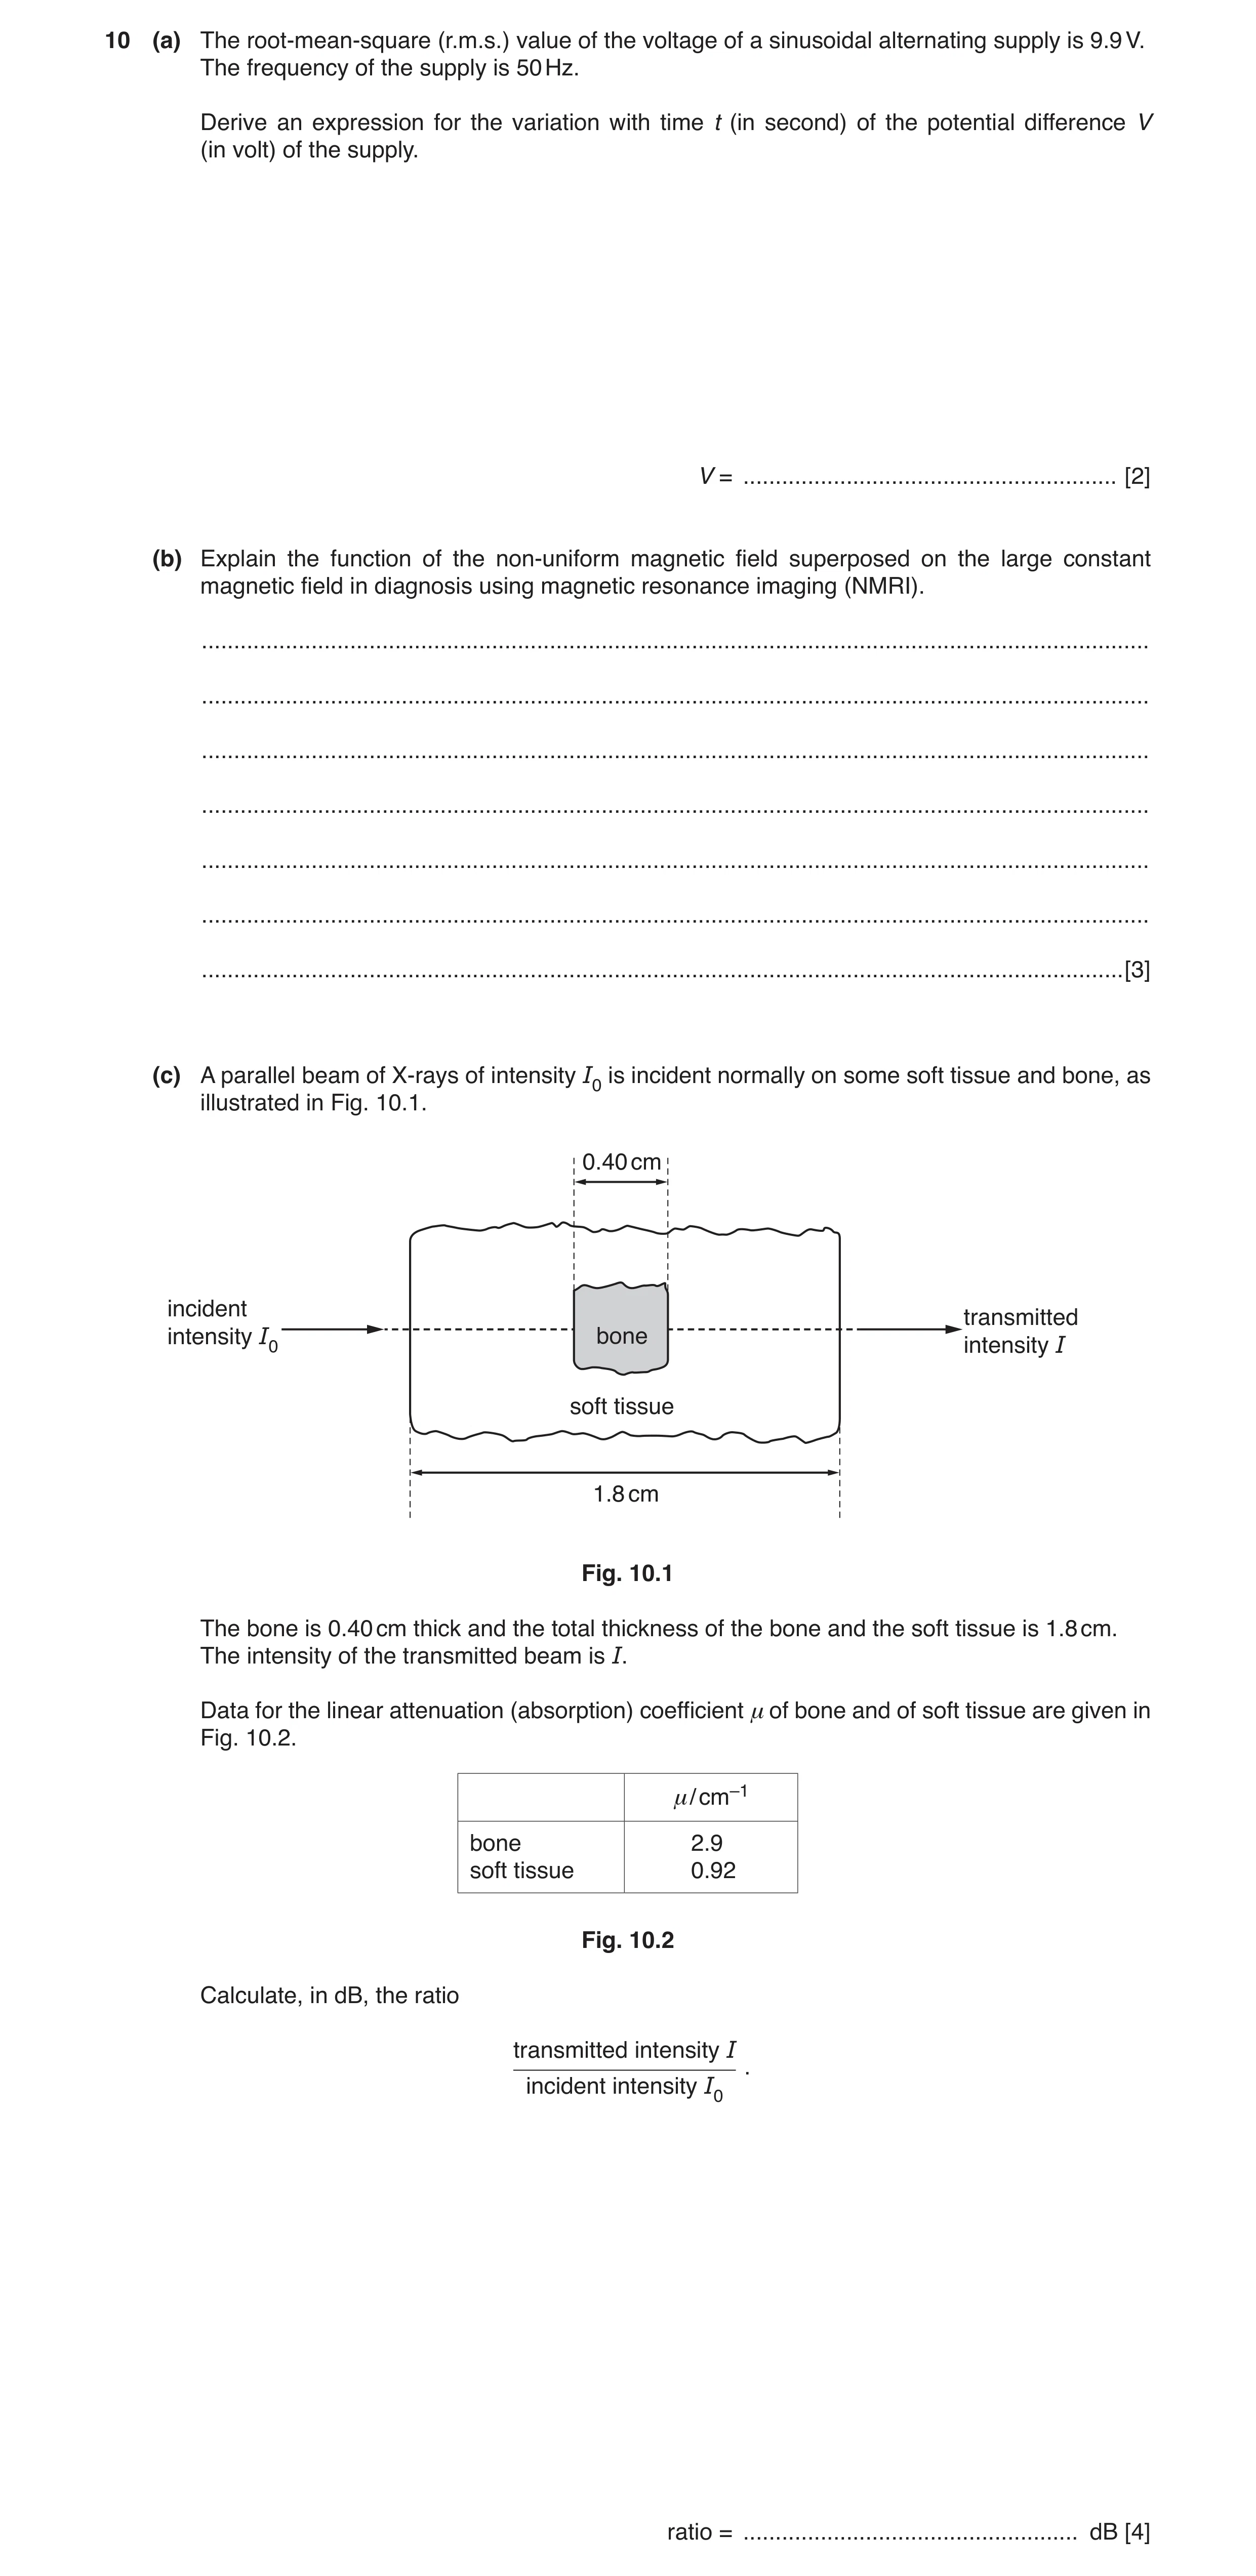
 6 / 16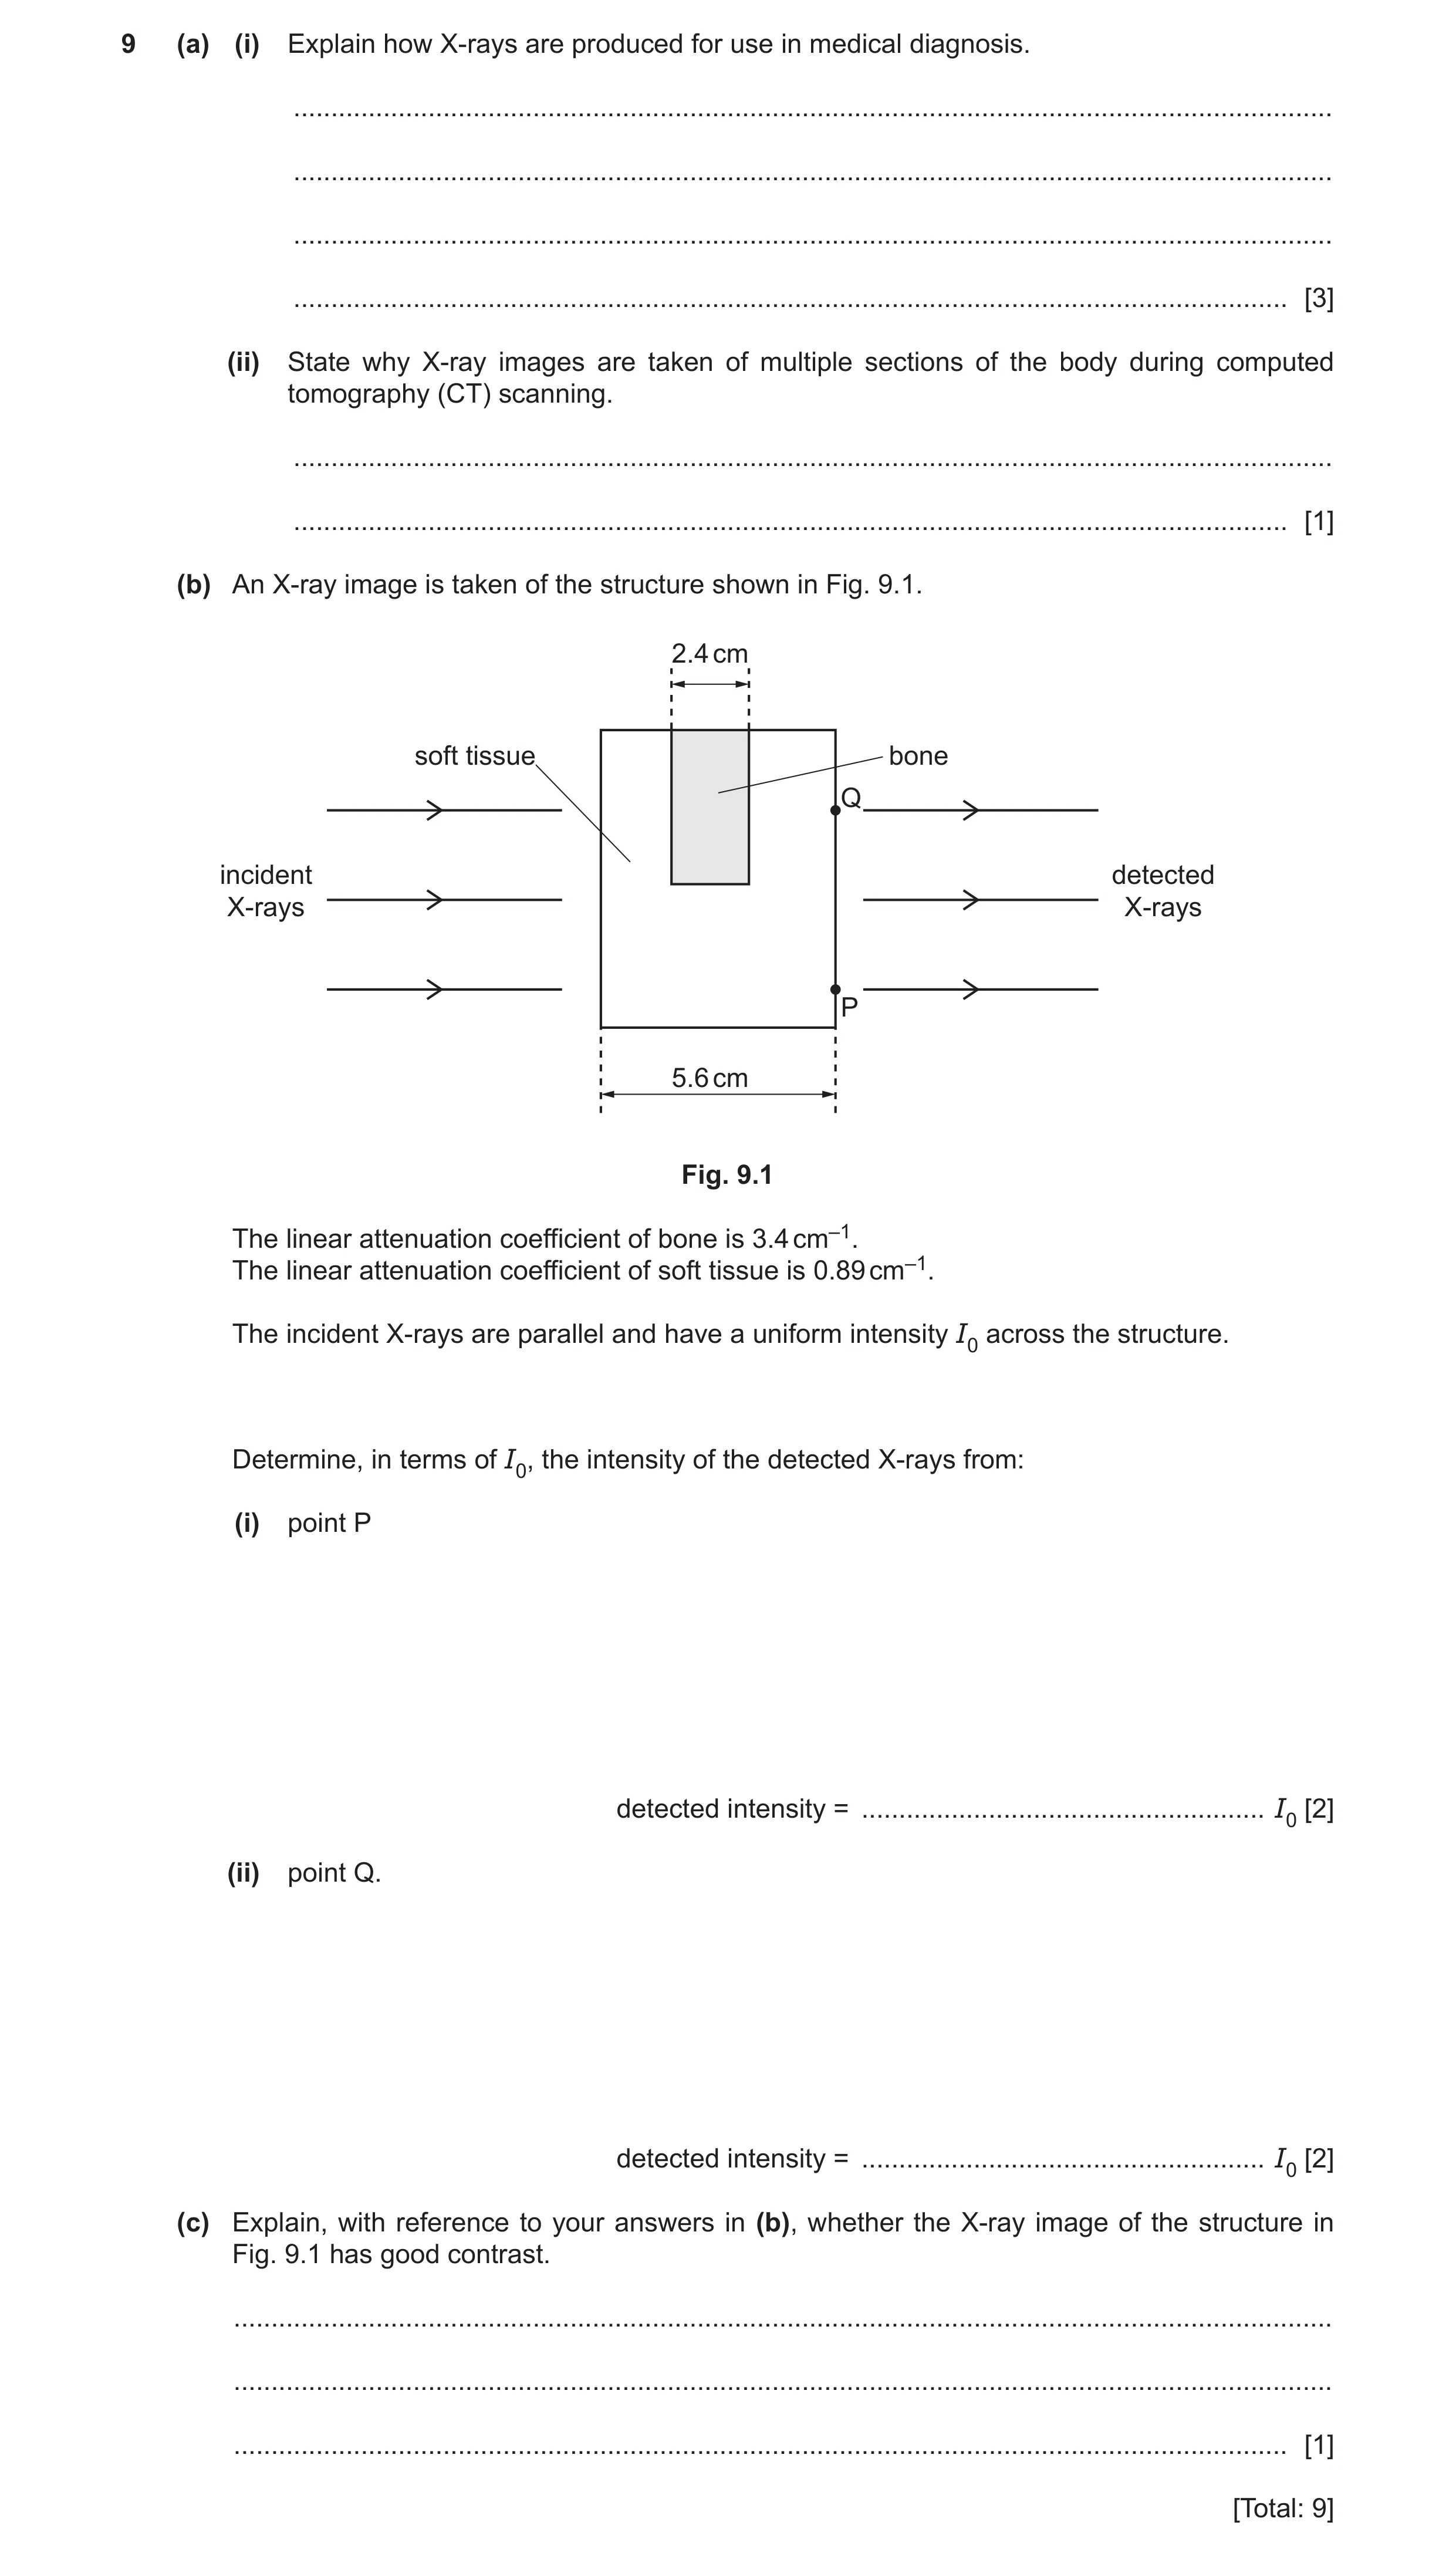
 10 / 16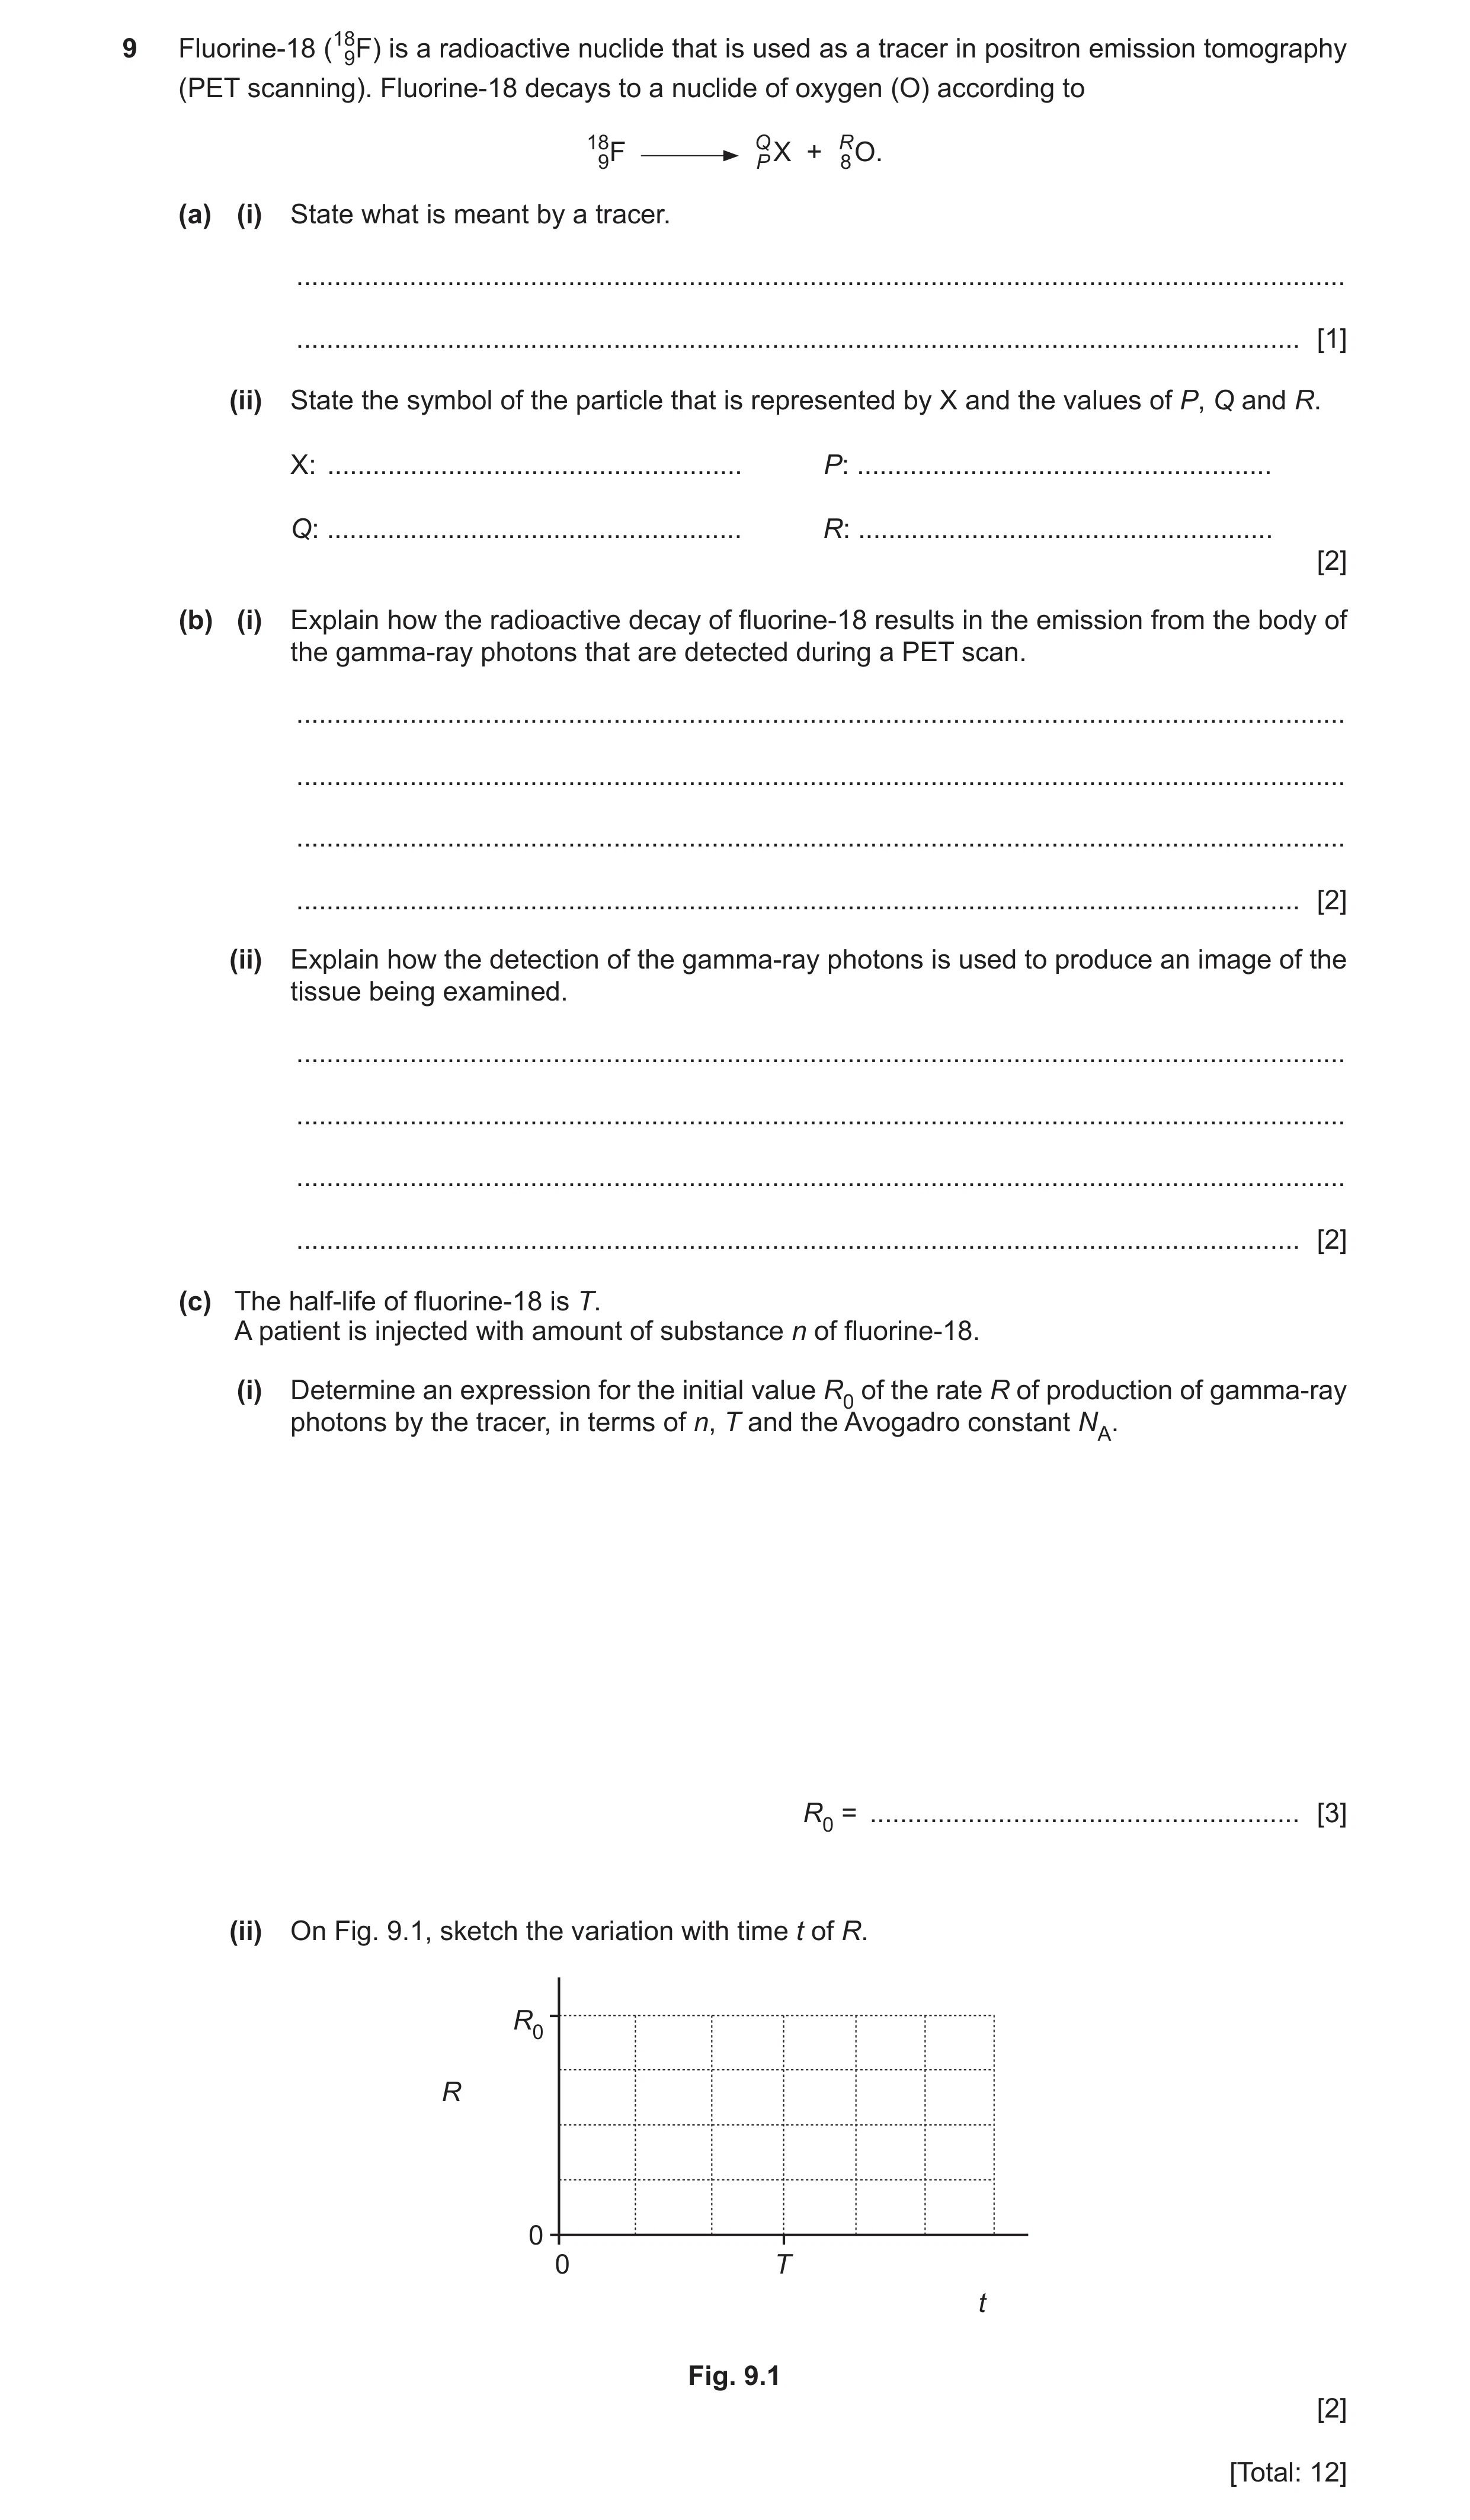
 8
8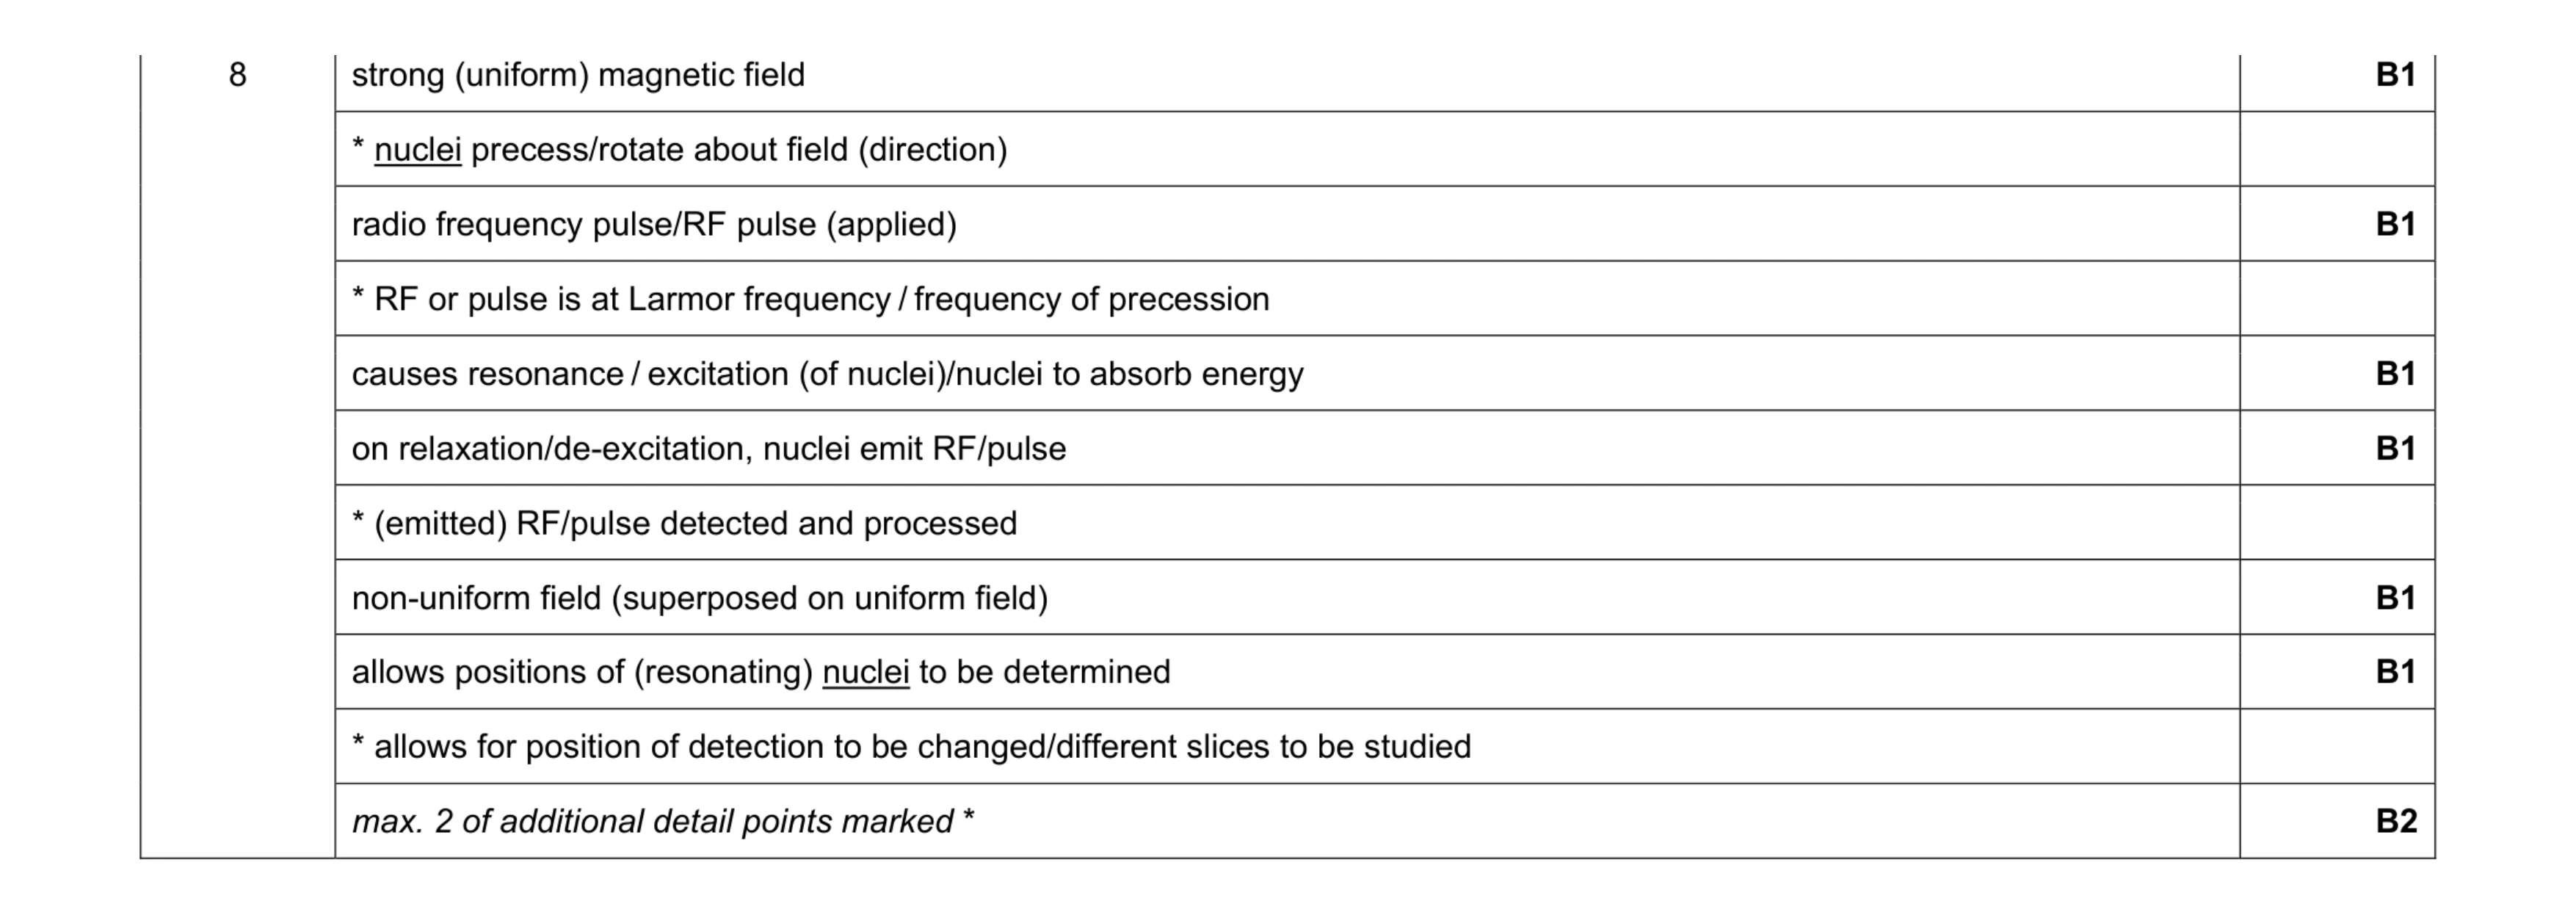 8
8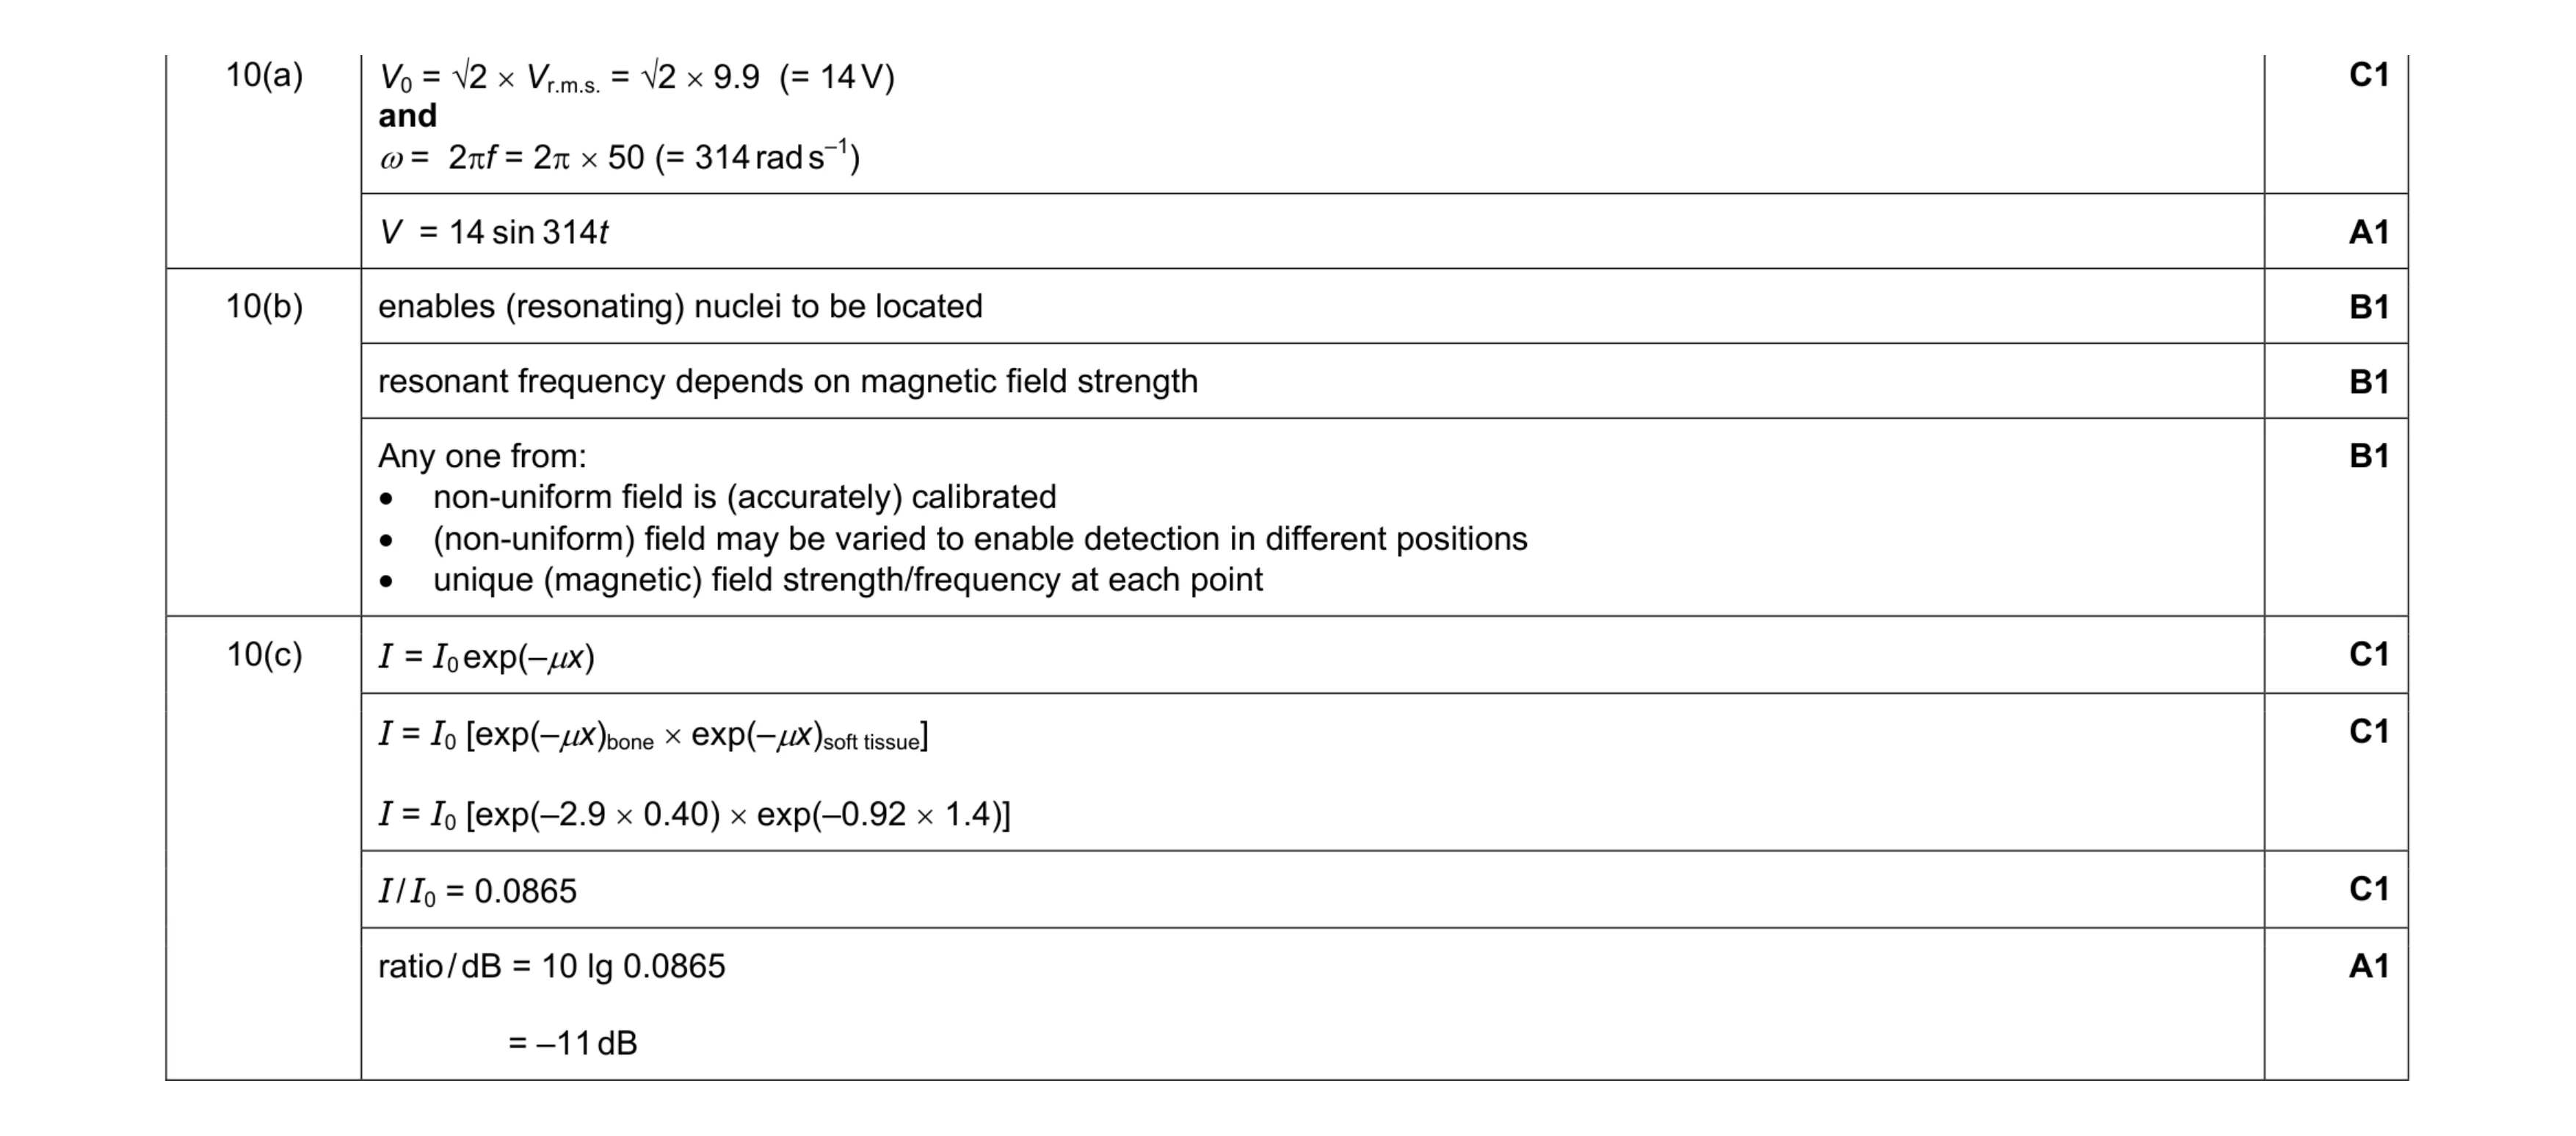 9
9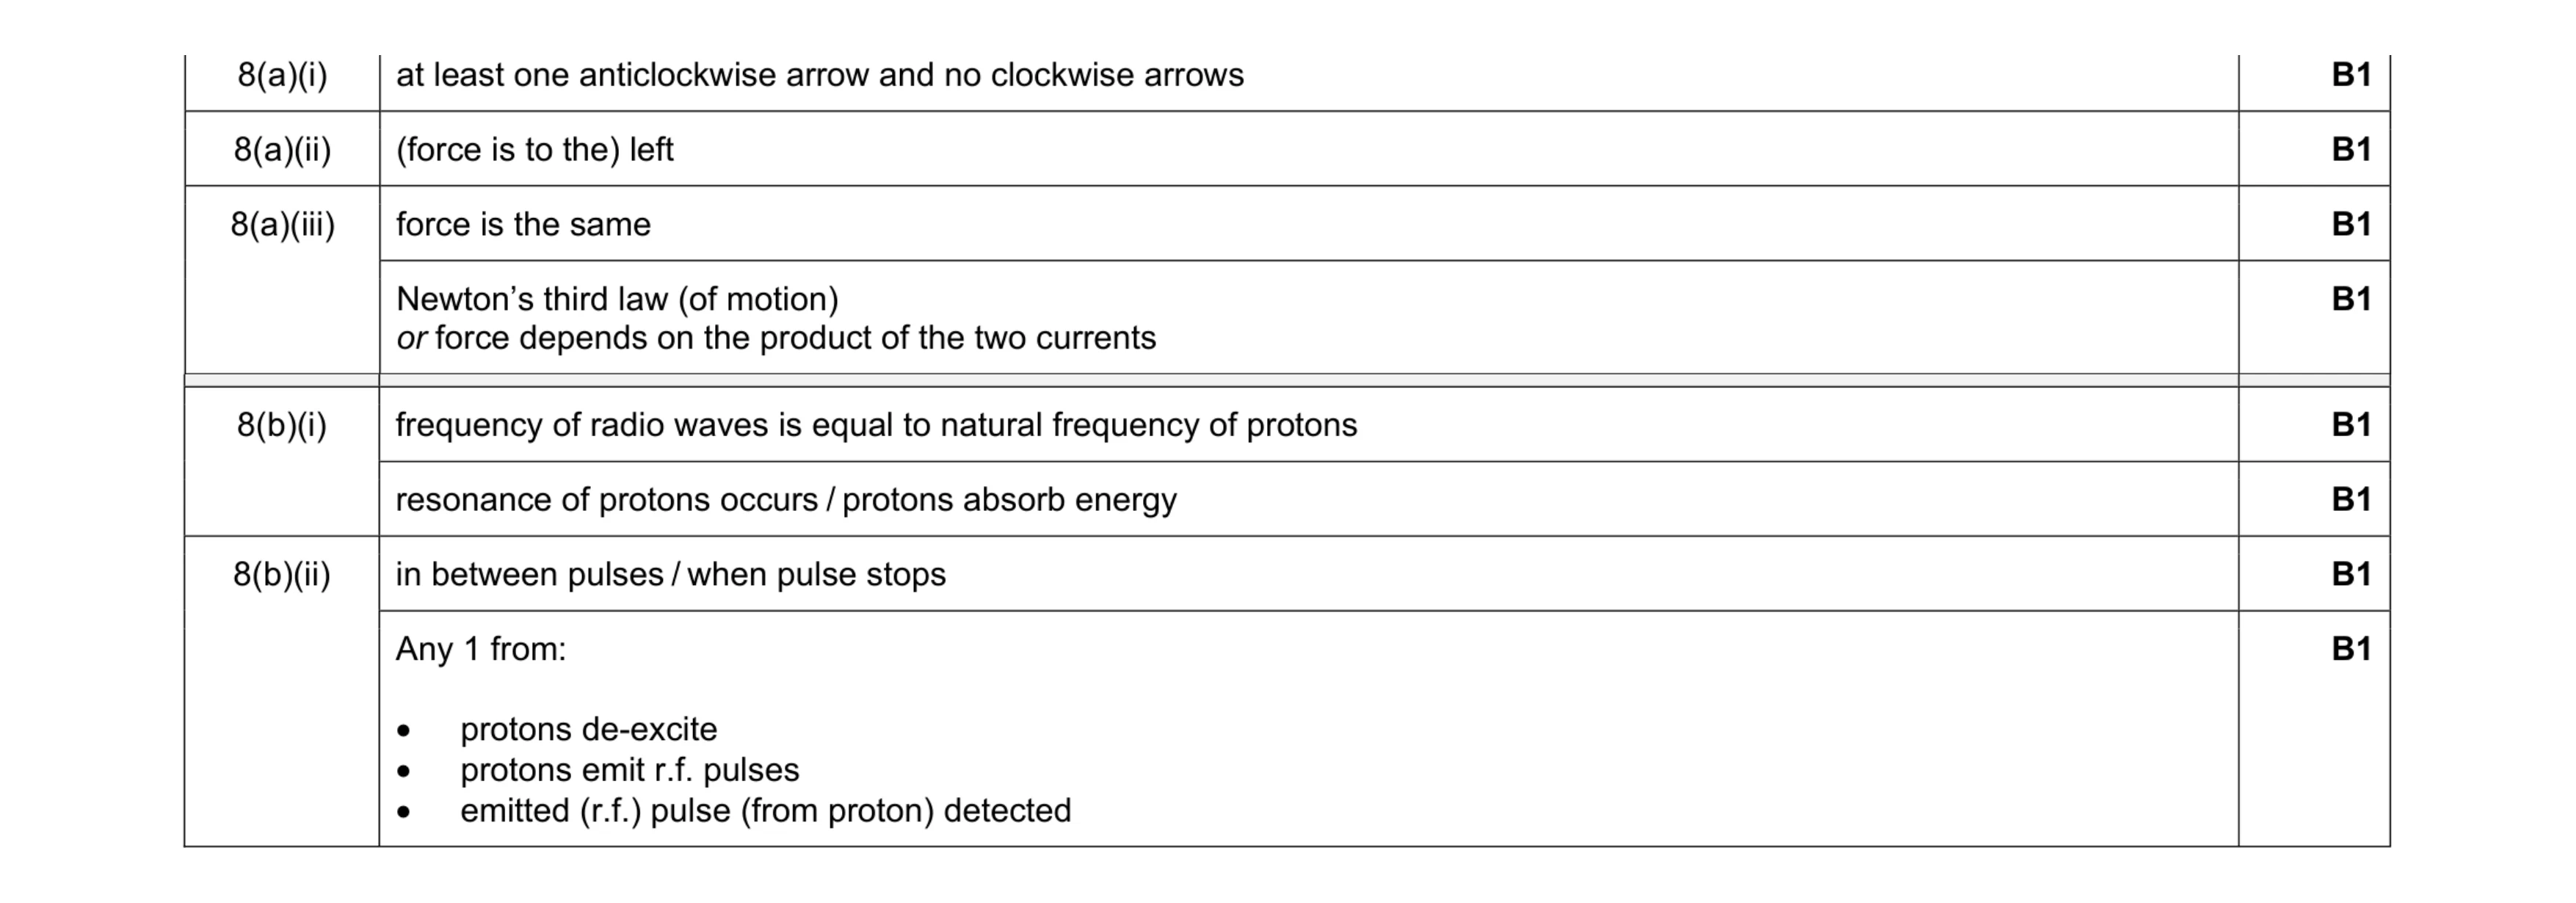 8
8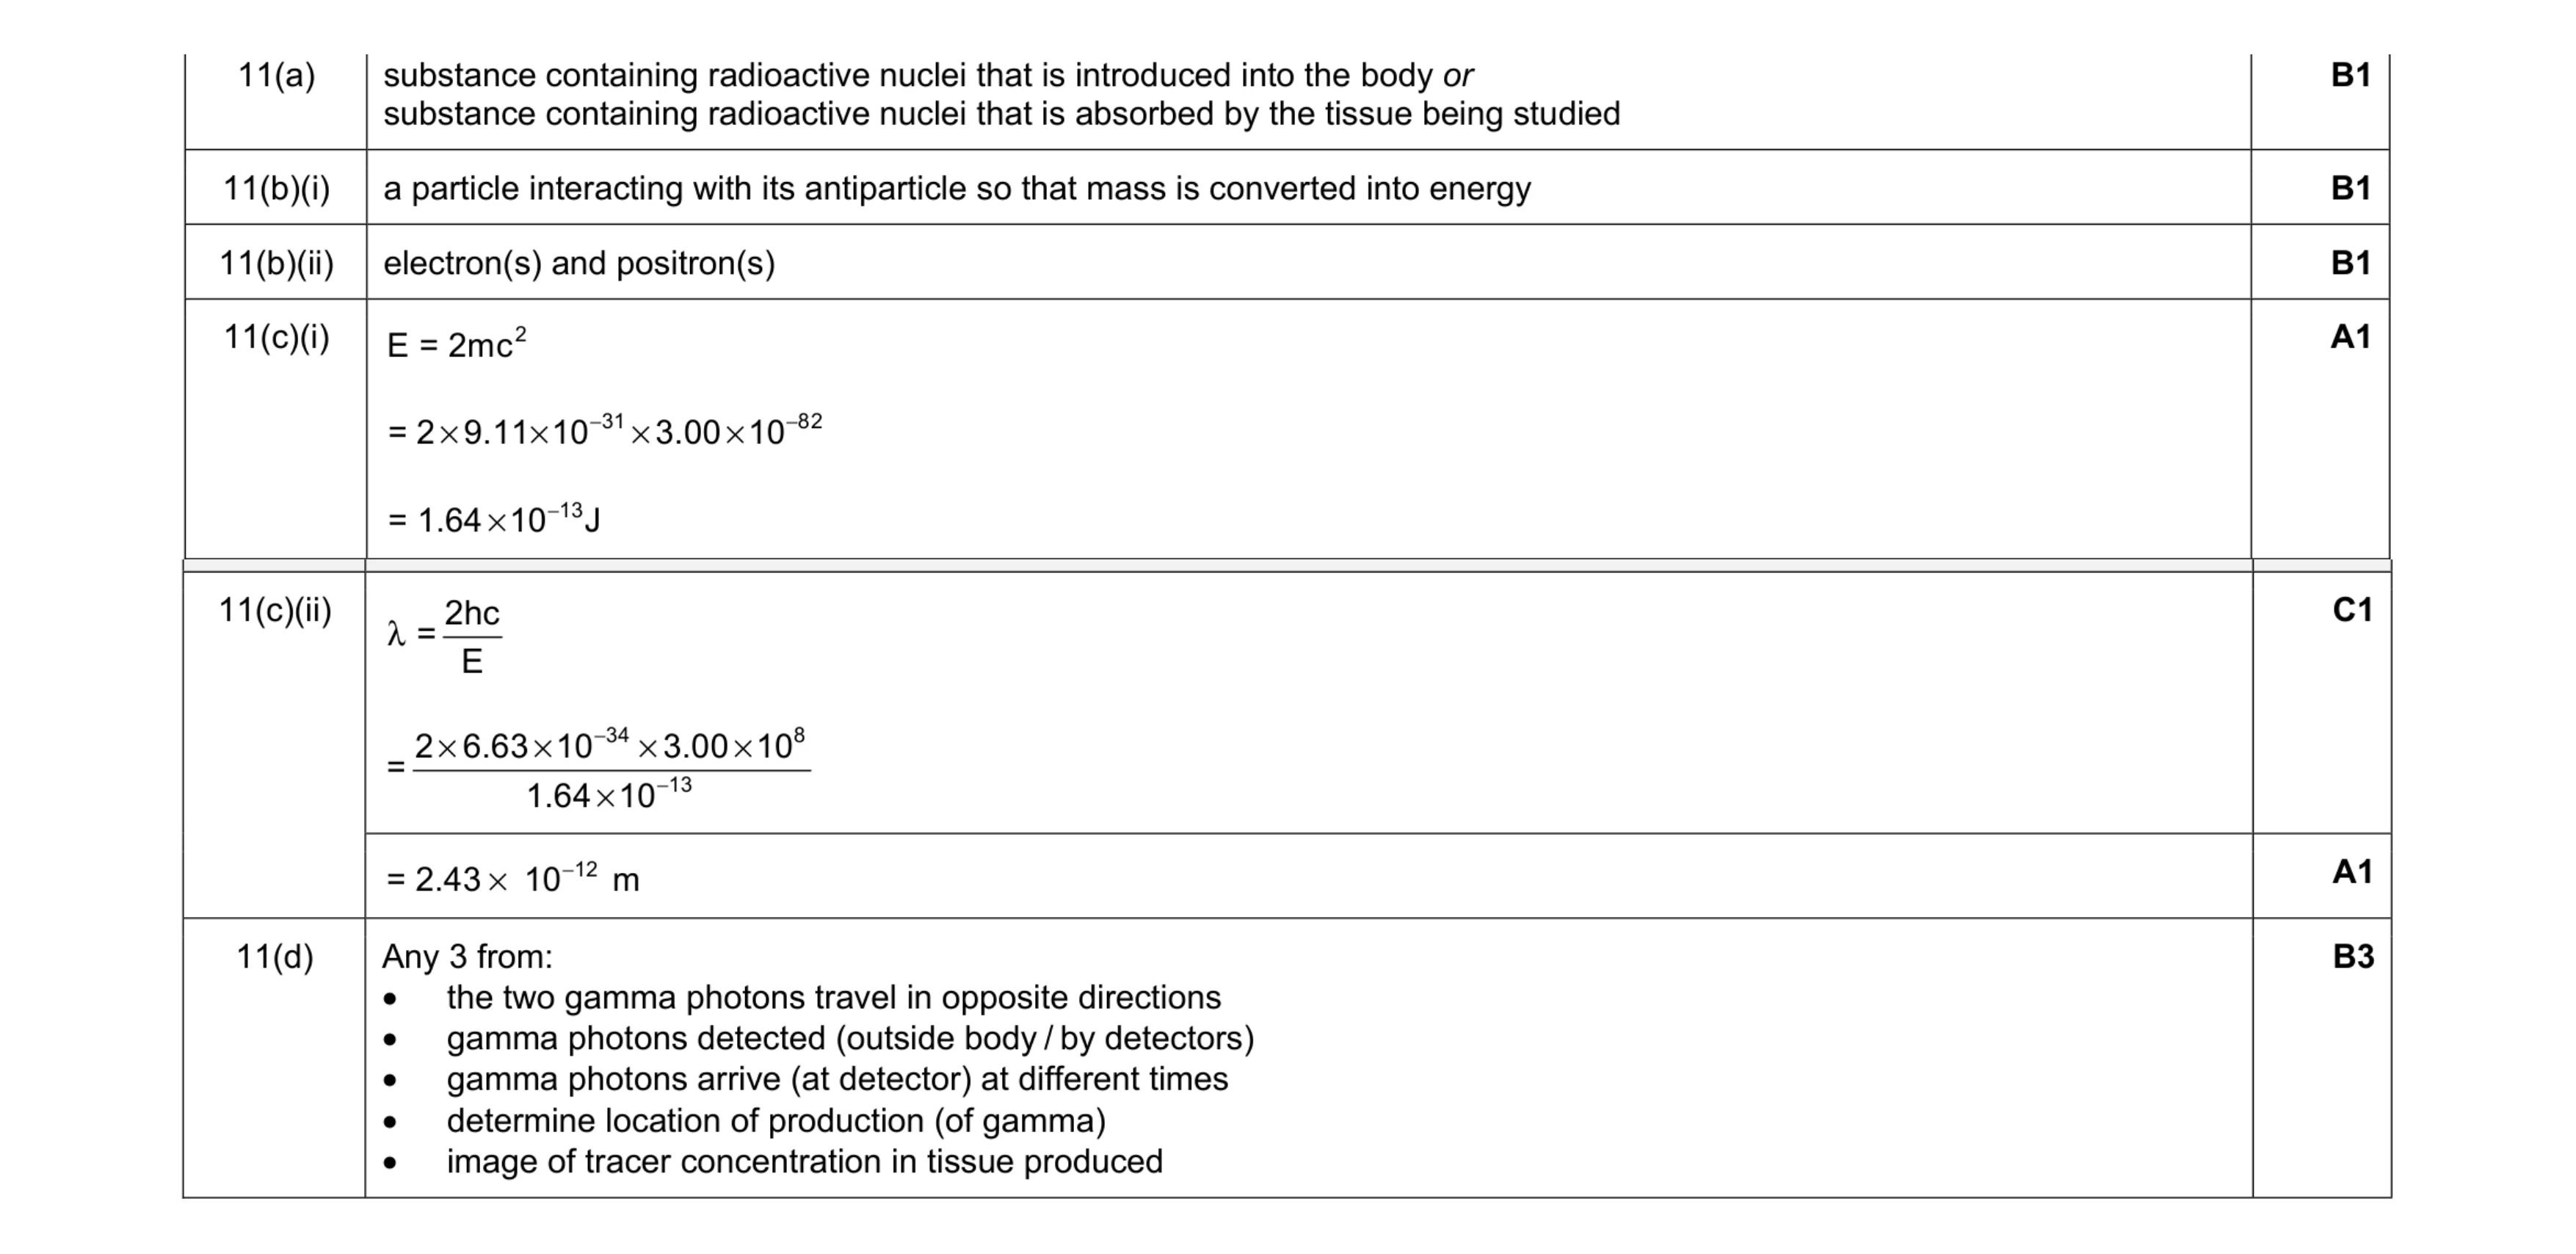 9
9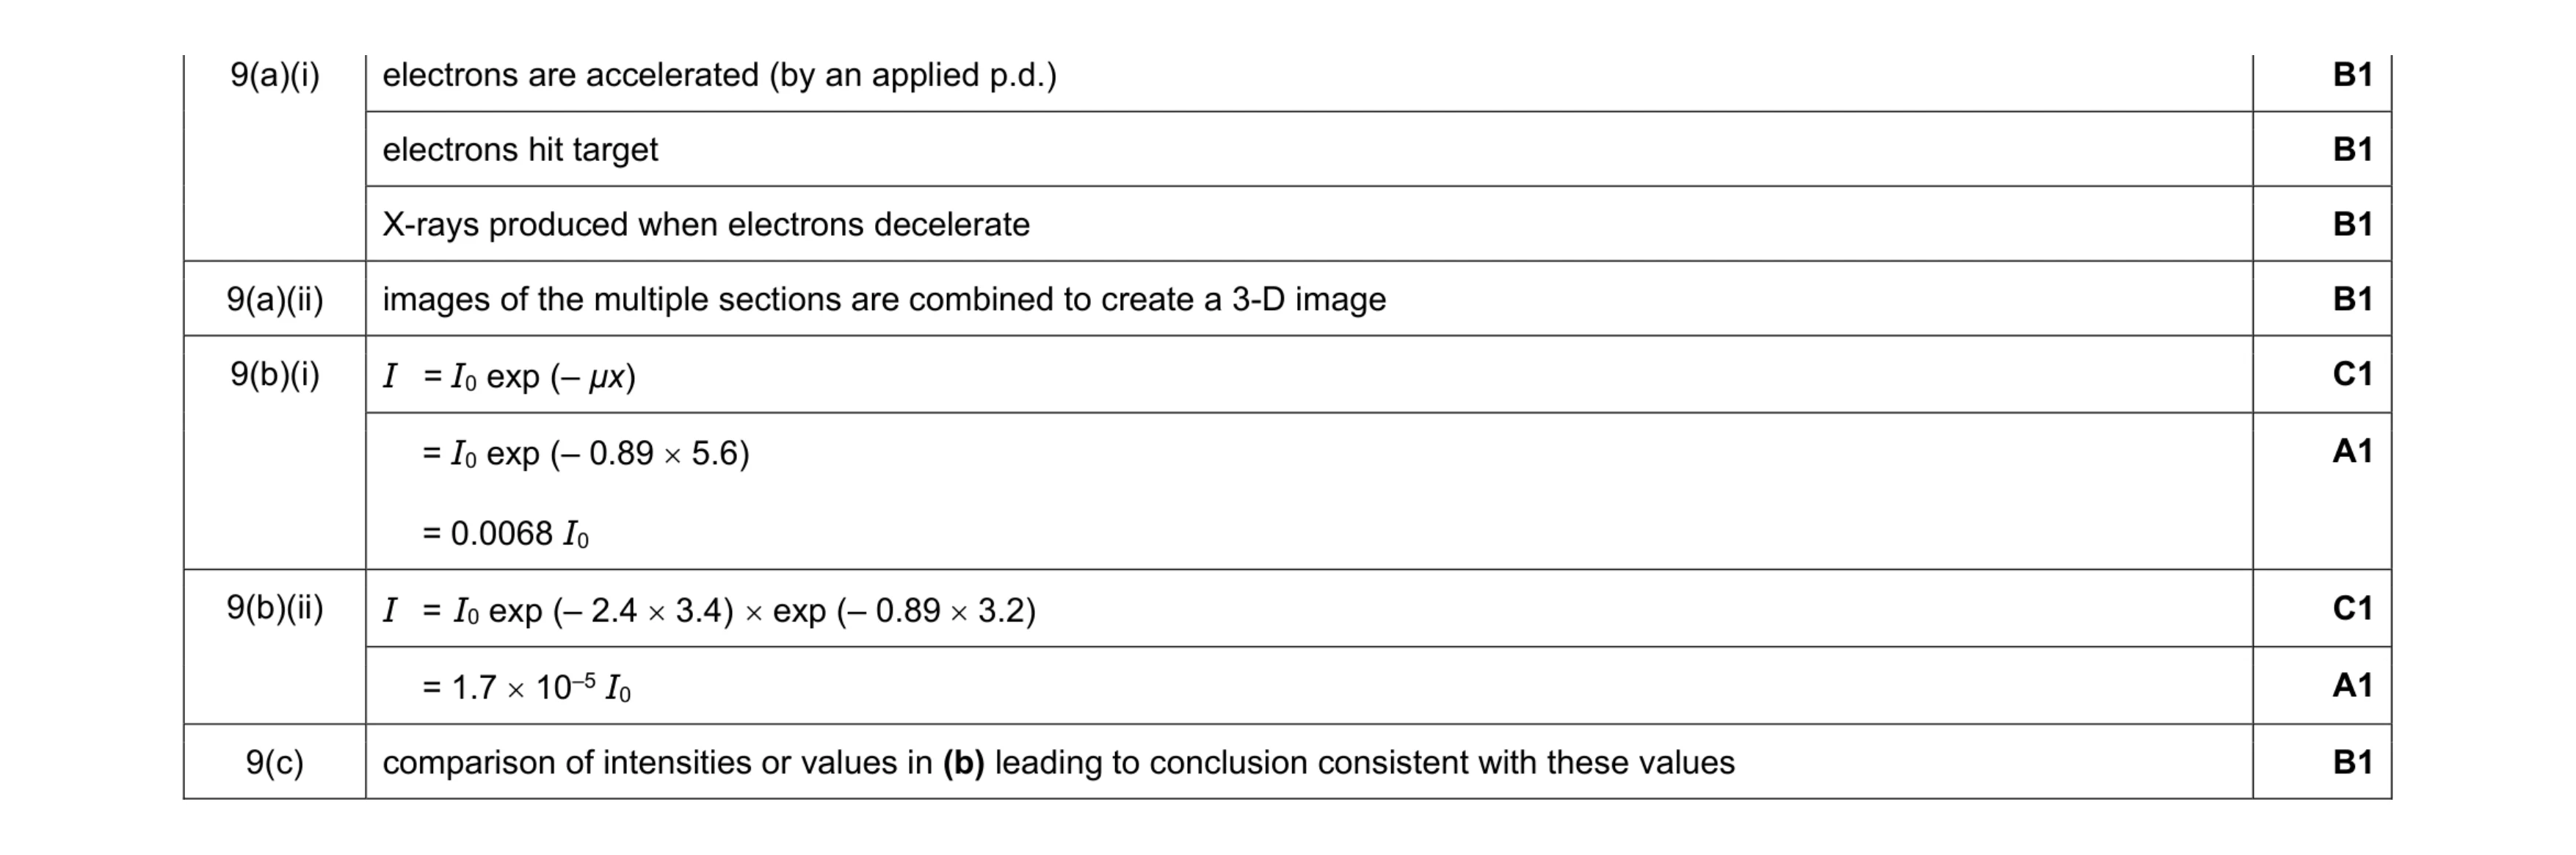 9
9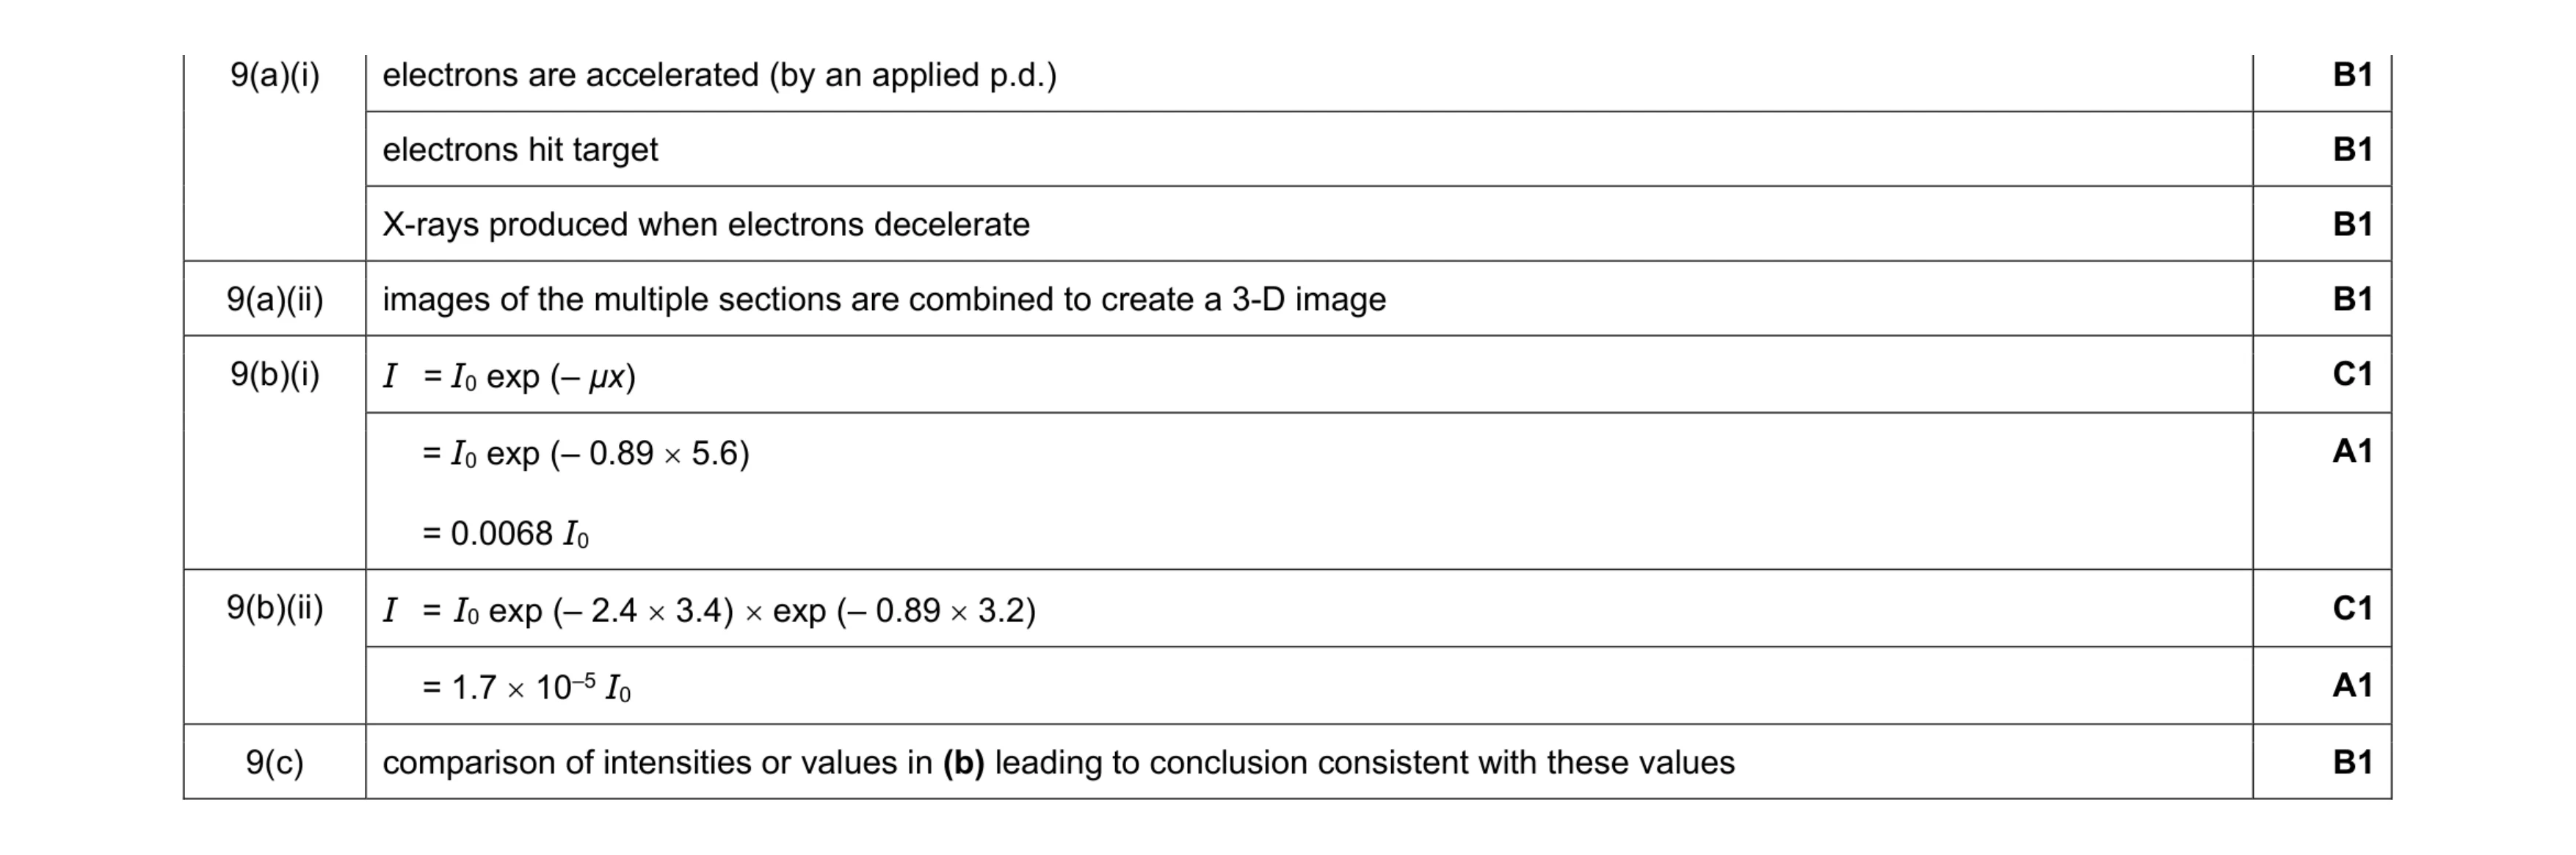 9
9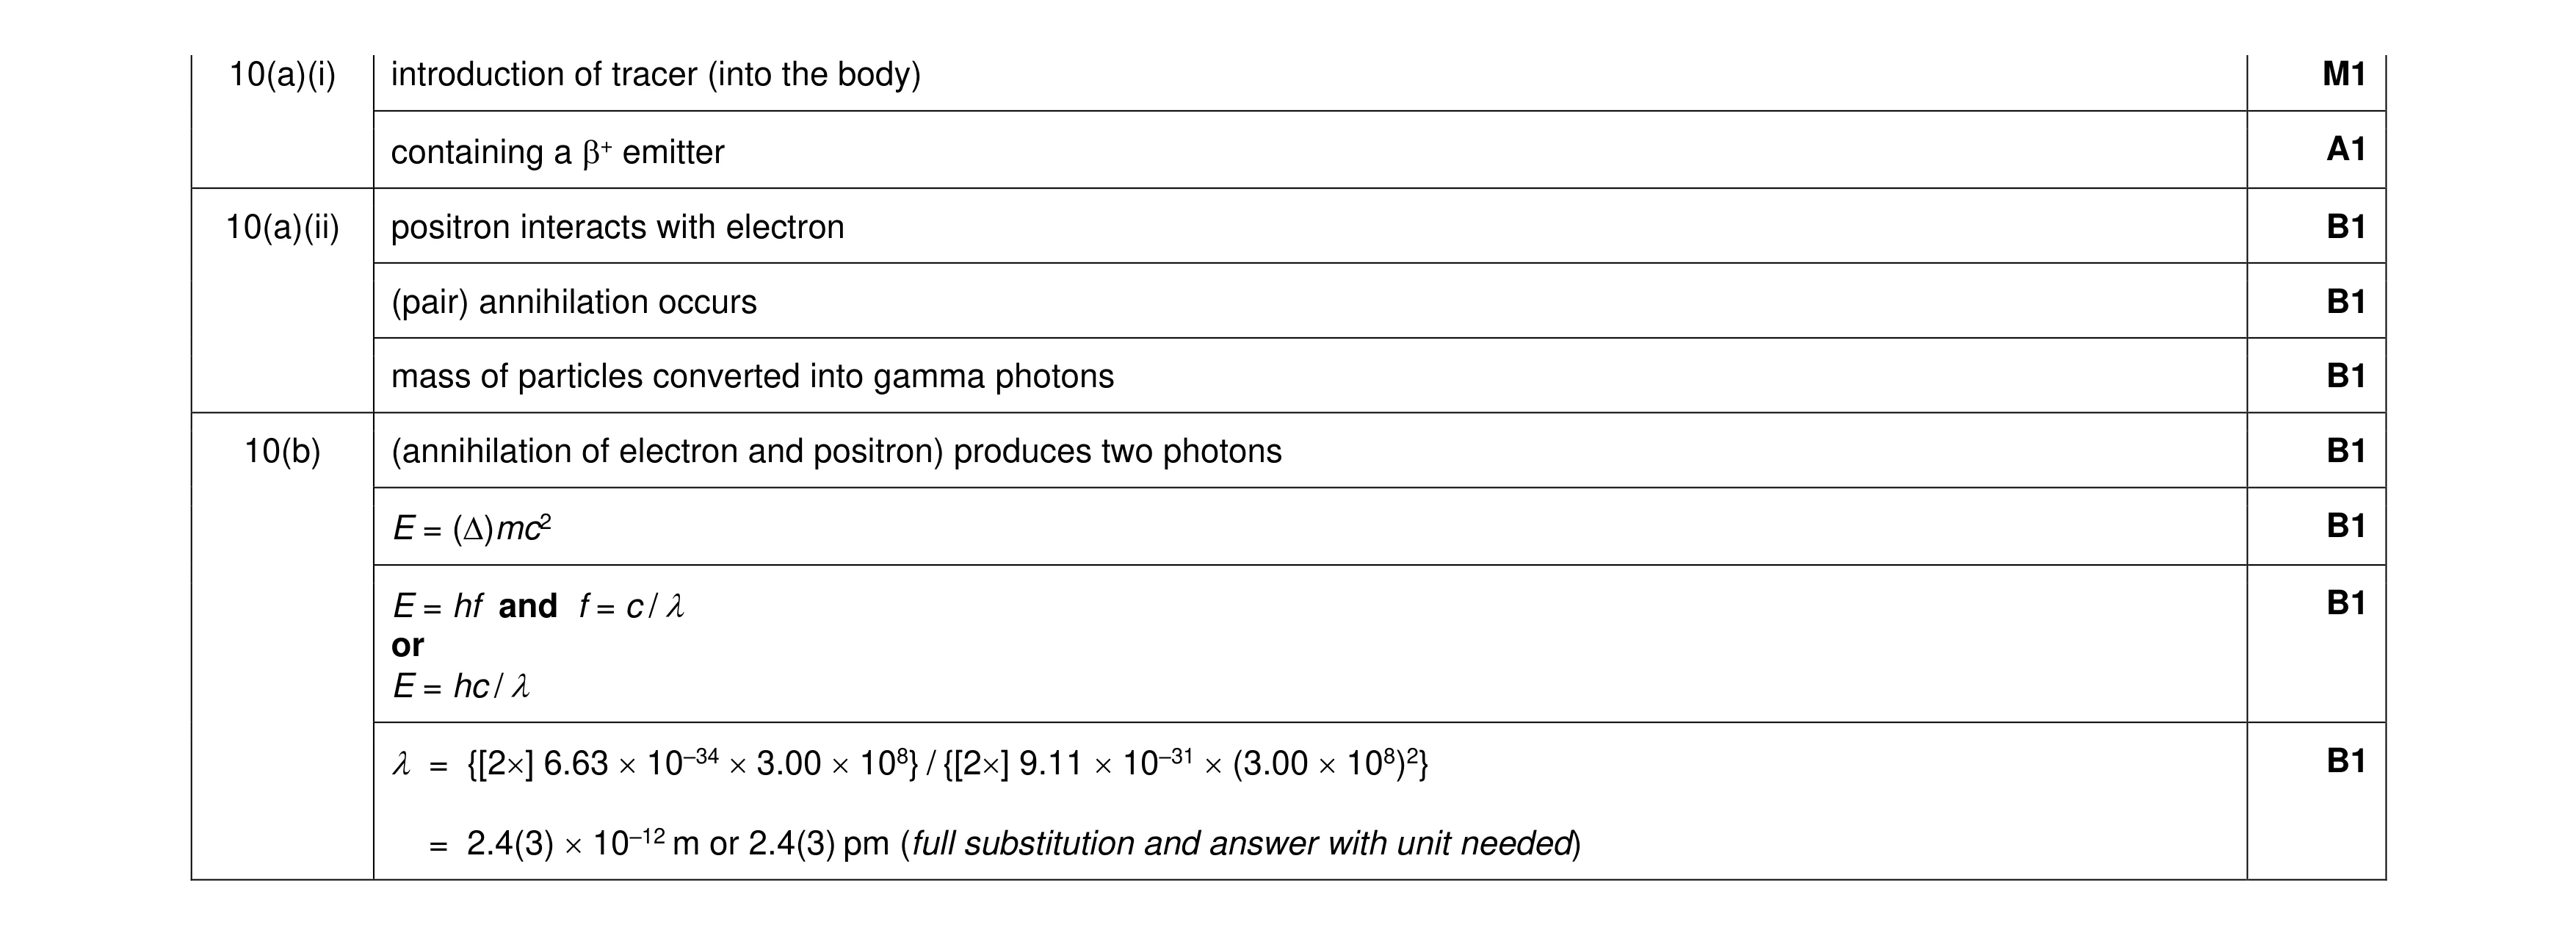 9
9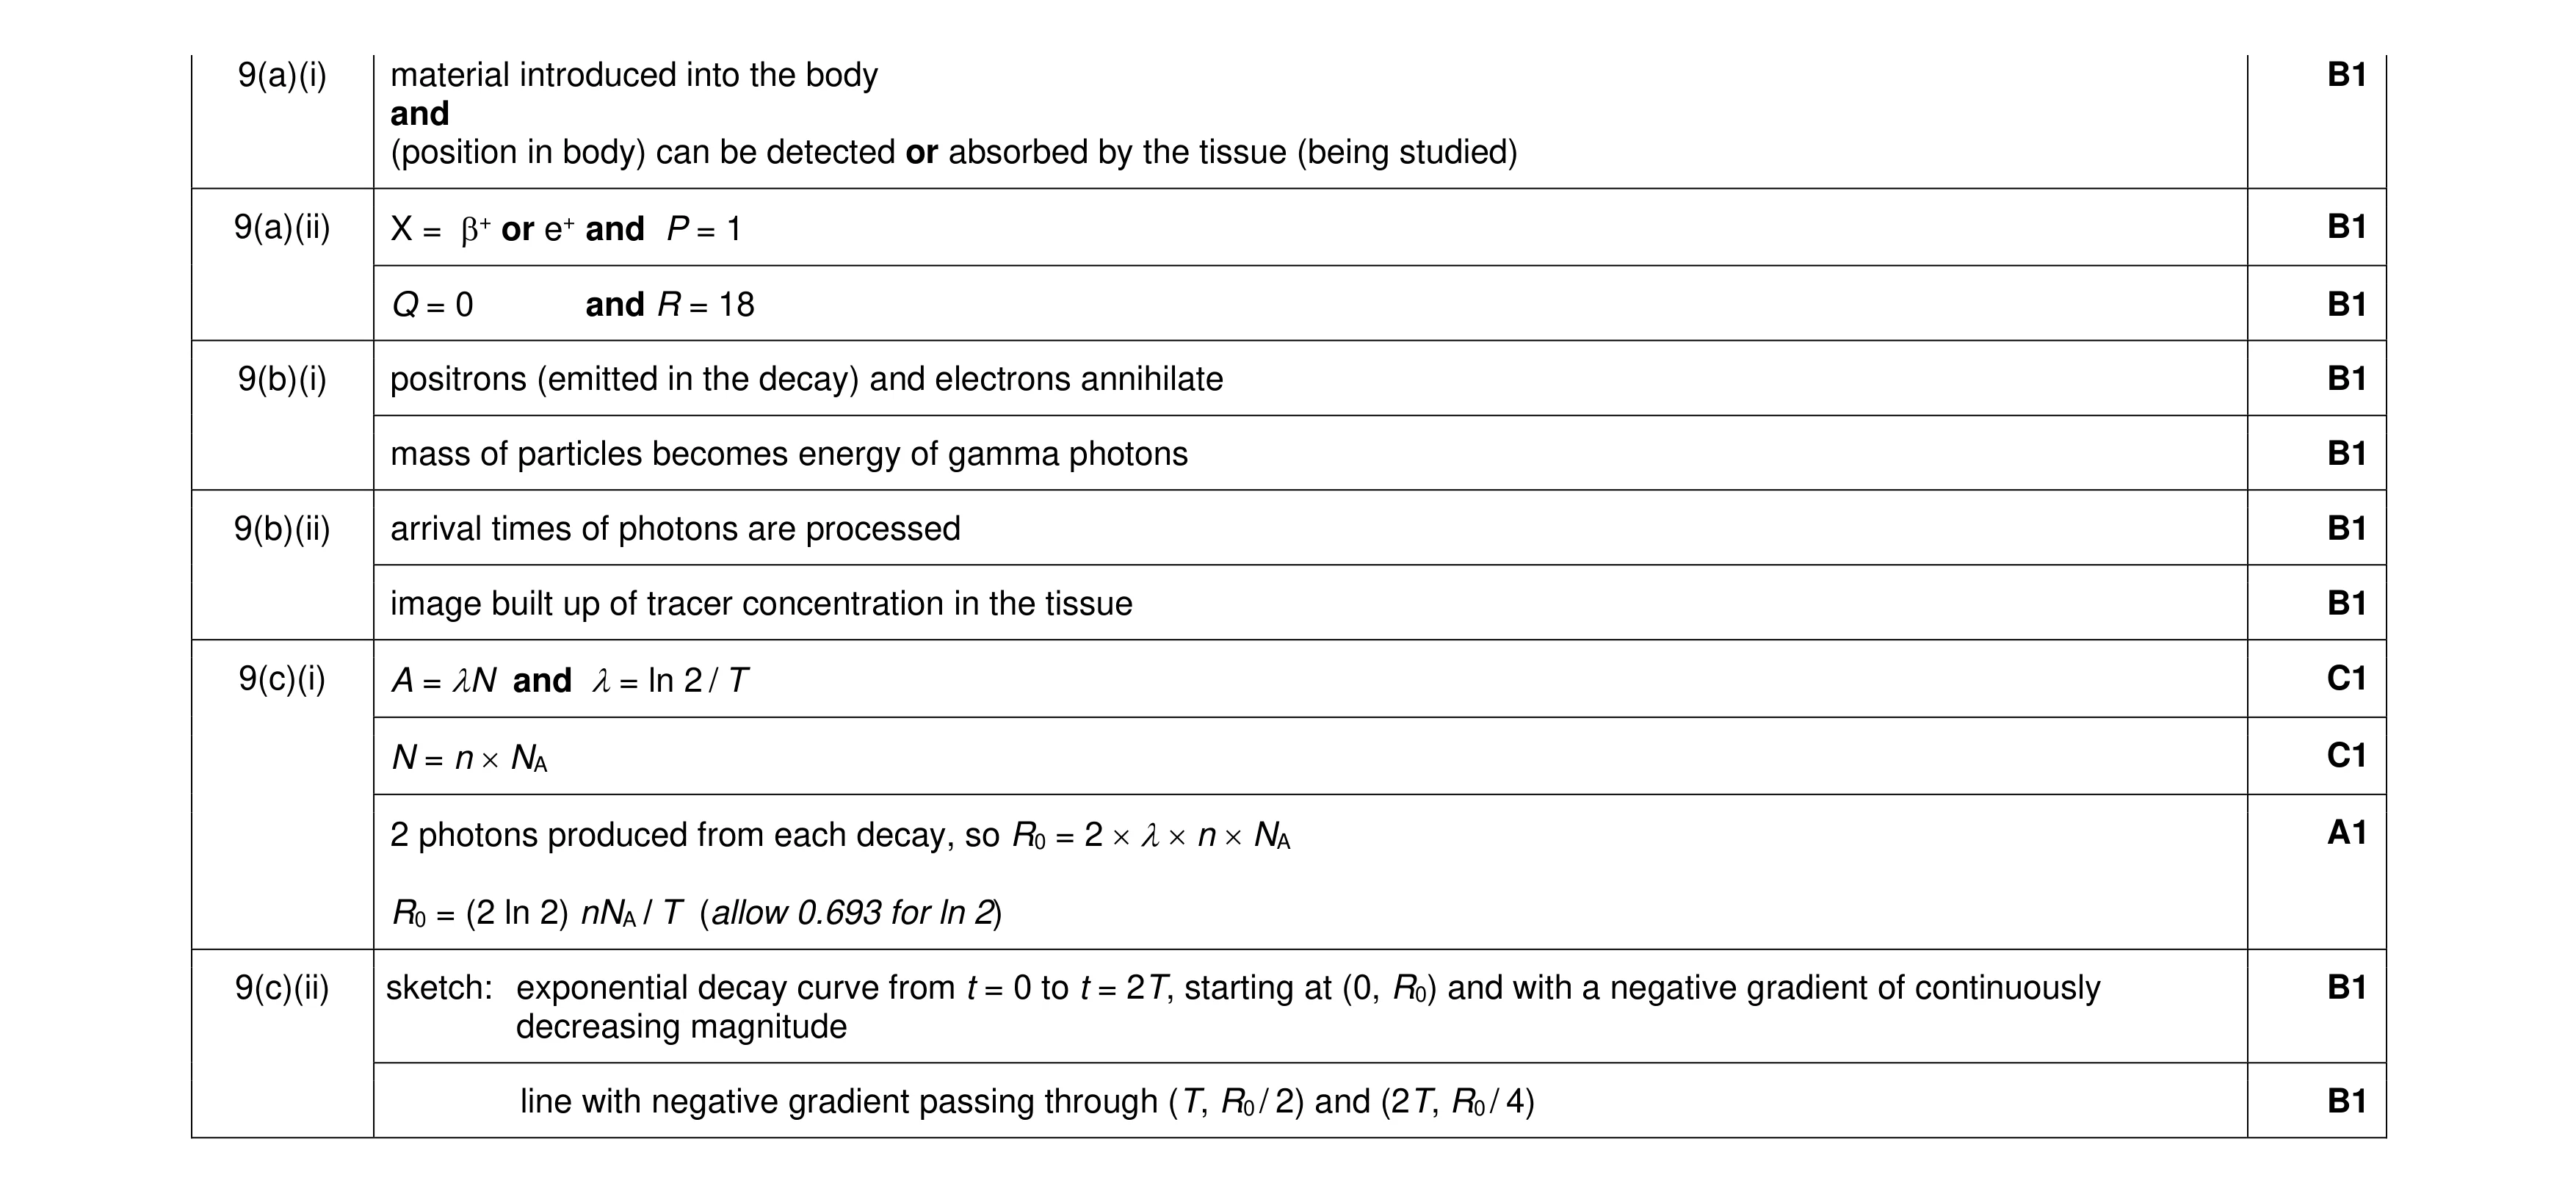 12
12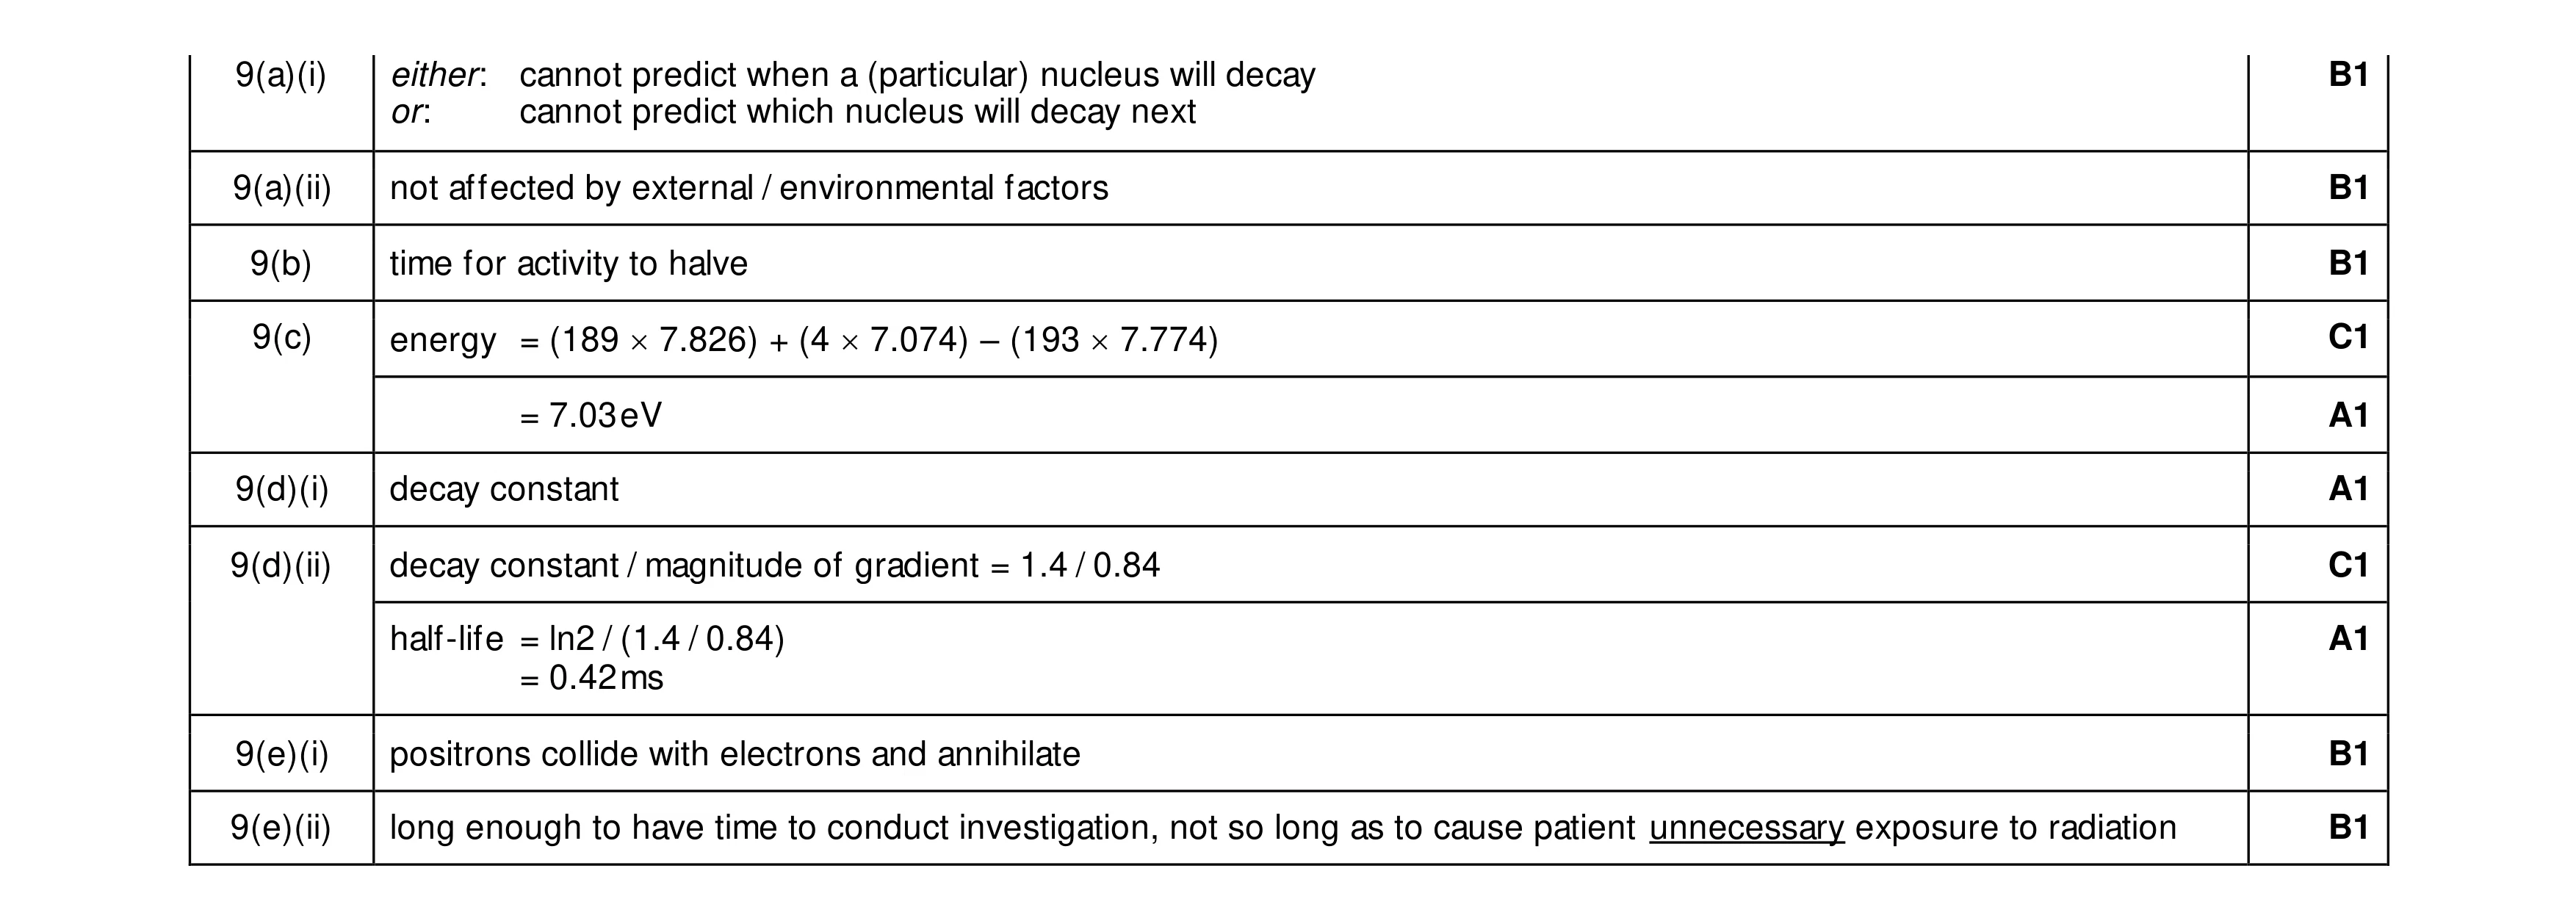 10
10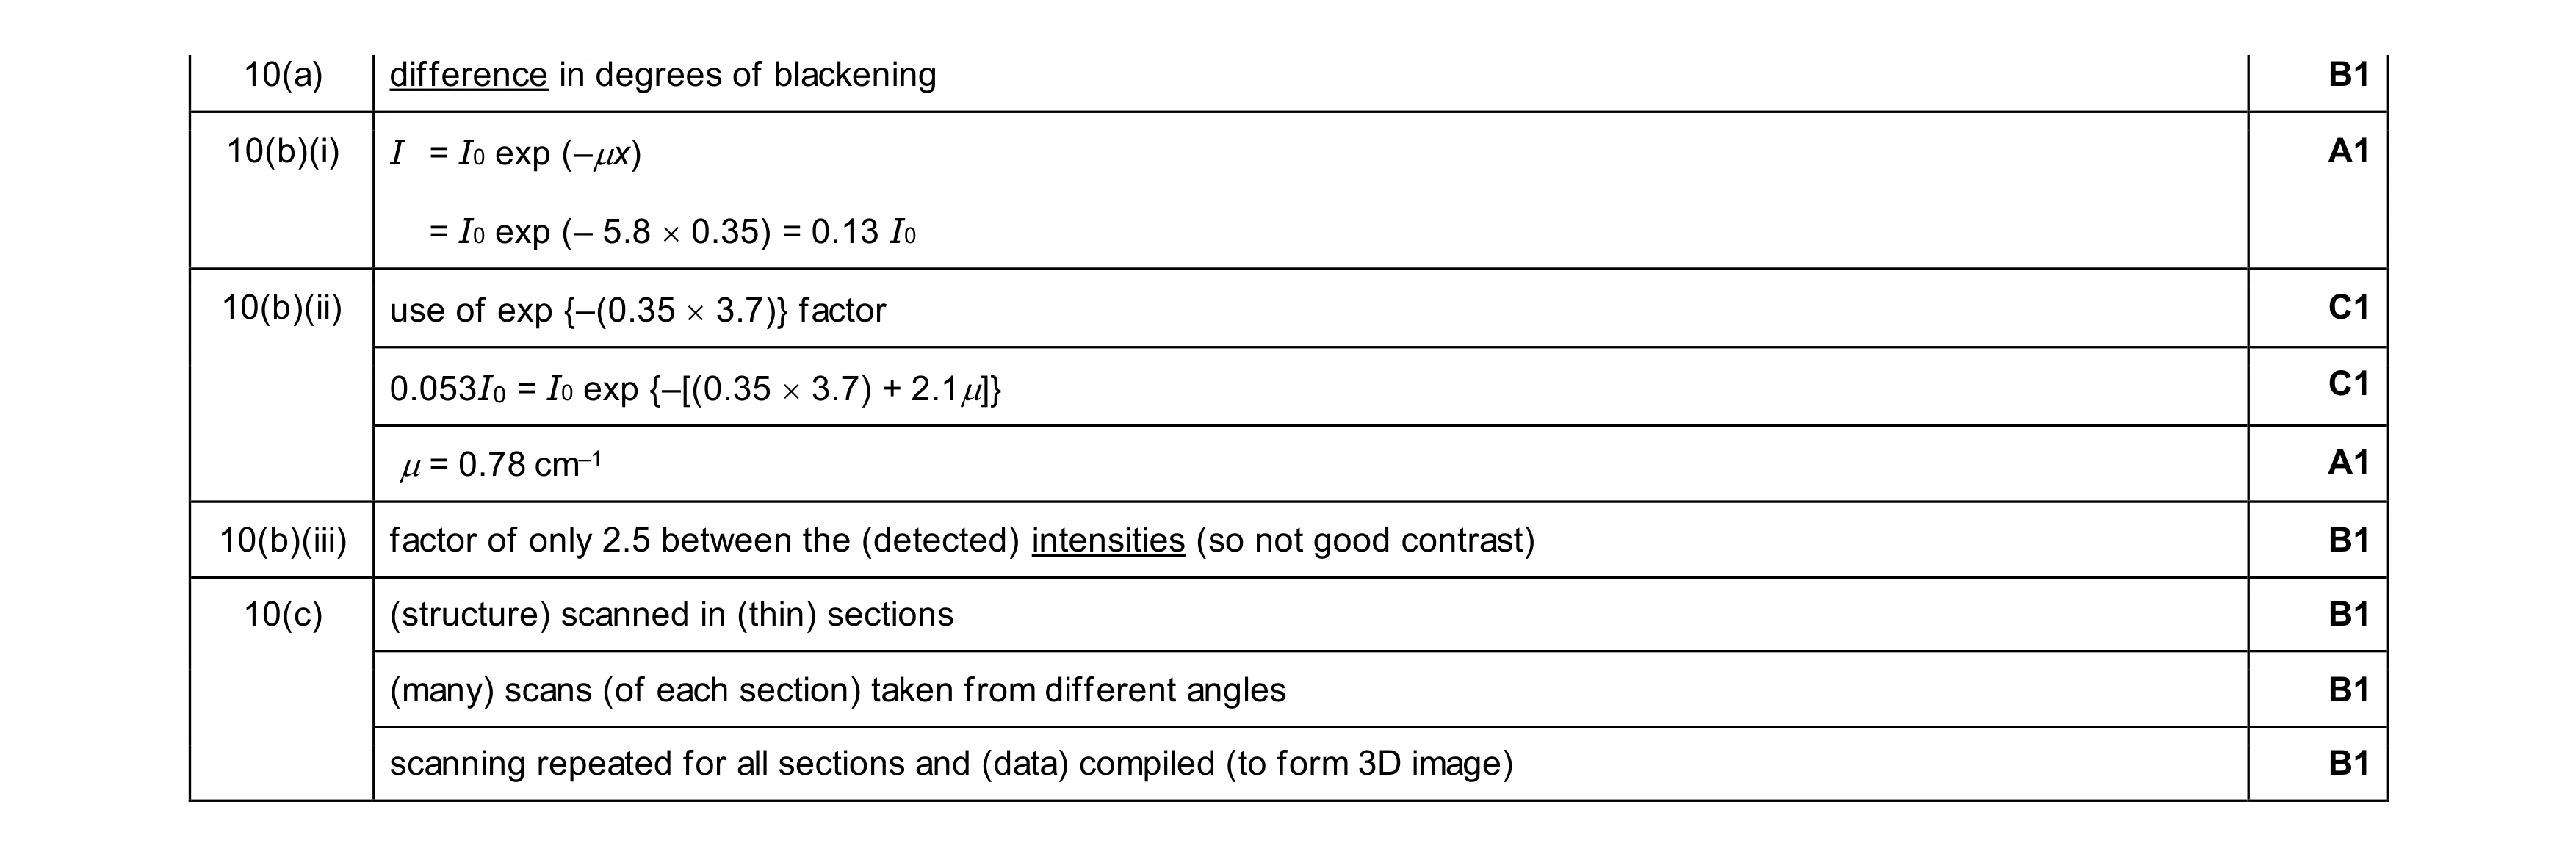 9
9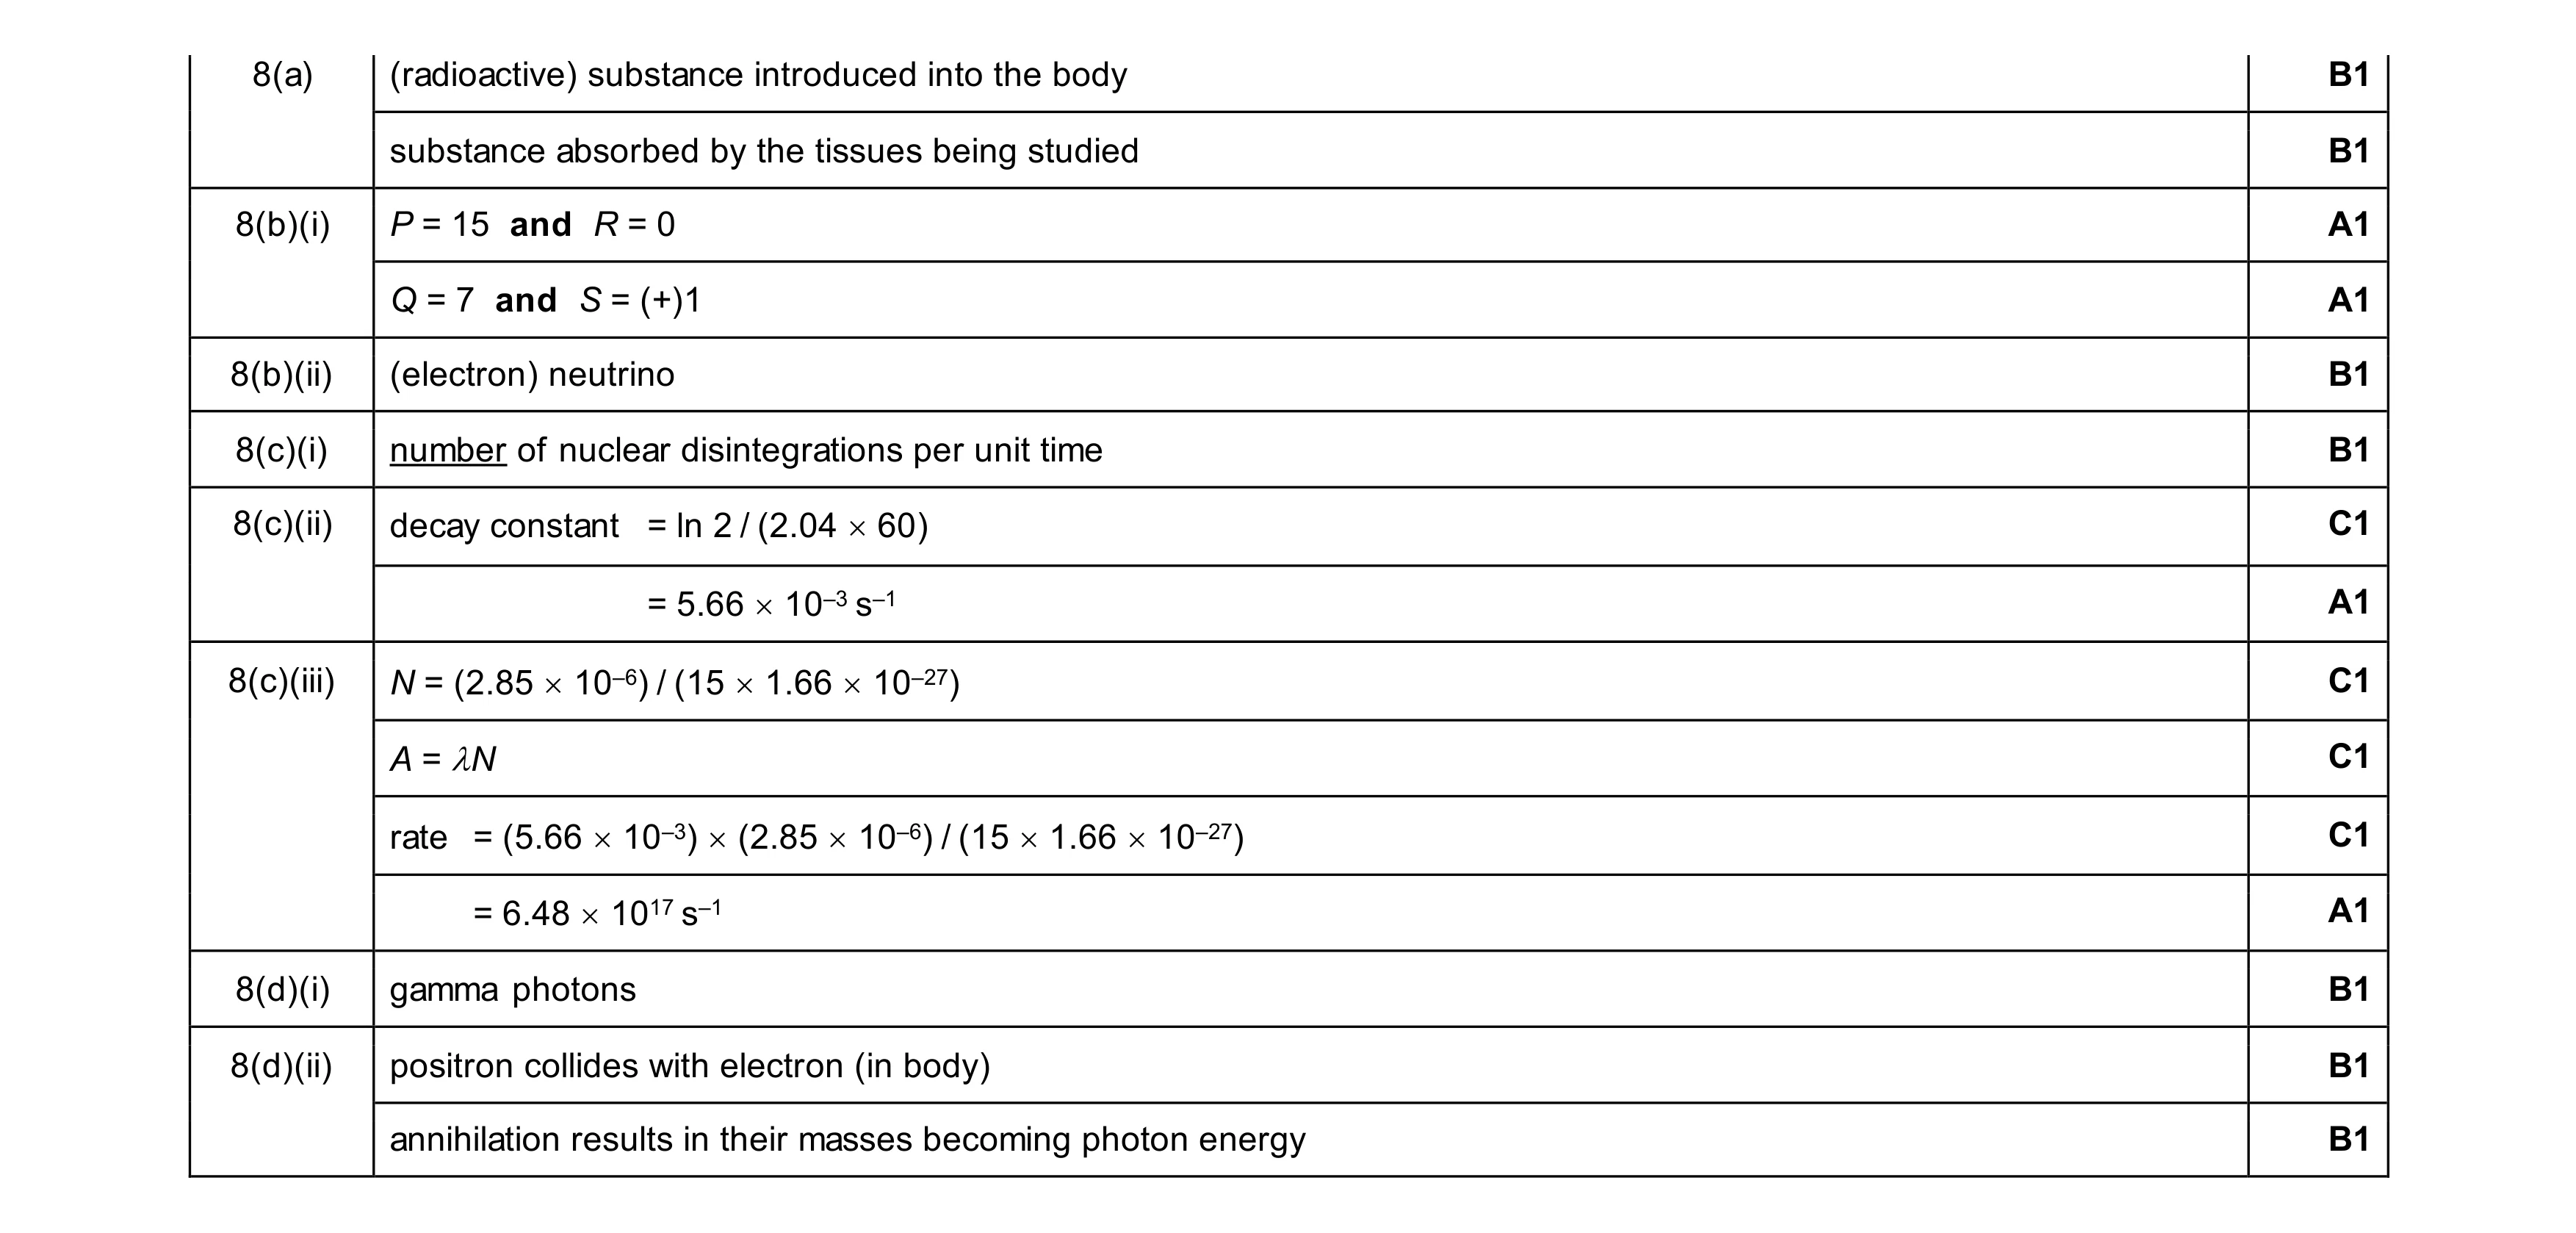 15
15