Cambridge A Level Physics 9702 — 2022 May/June Paper 4 · Variant 3
9702/43/M/J/22 · 10 questions · 100 marks · ≈113 min
The question paper and its mark scheme, free to read here and free to download. This is Cambridge’s own paper, exactly as it was sat.
Question paper24 pages


Mark scheme16 pages
Answers below. Sit the paper first if you are practising.

Questions as text
Q1 · State Newton’s law of gravitation
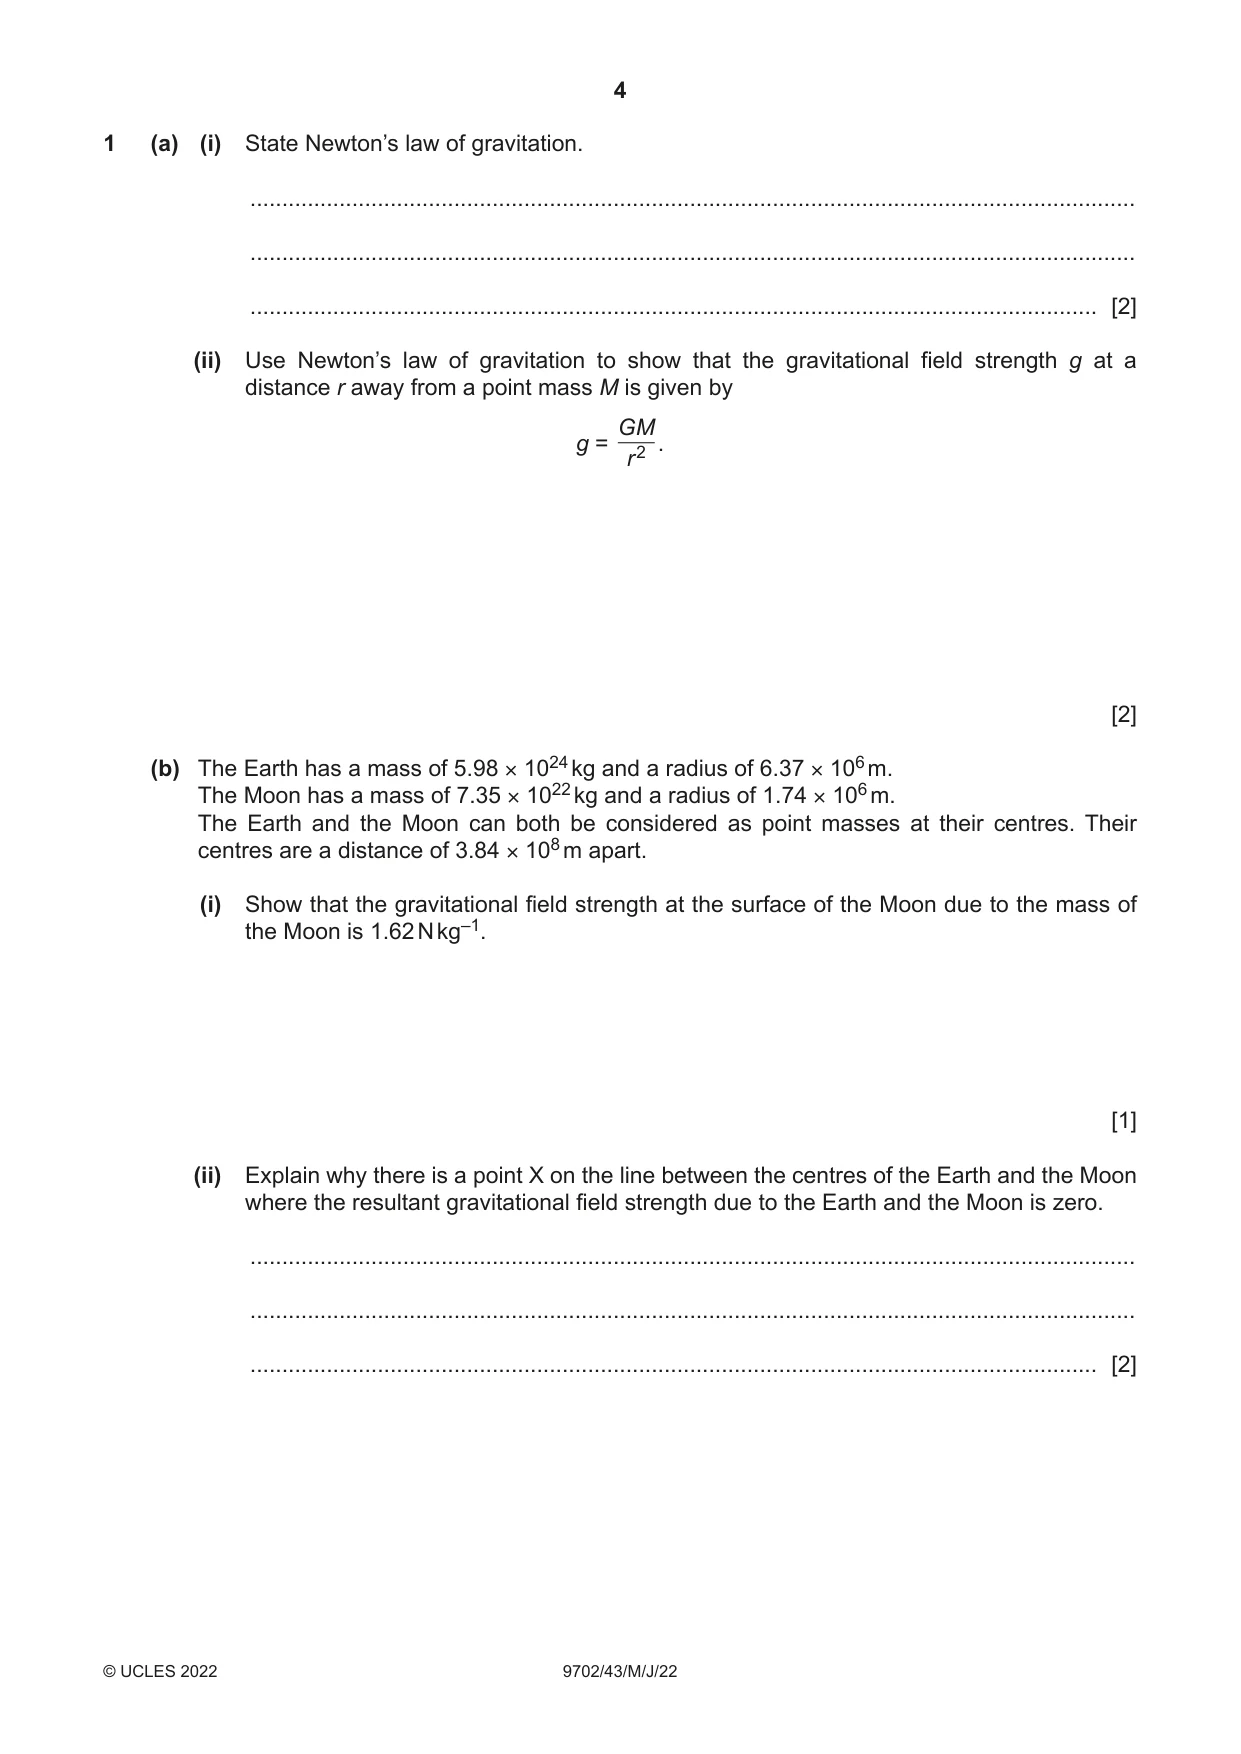
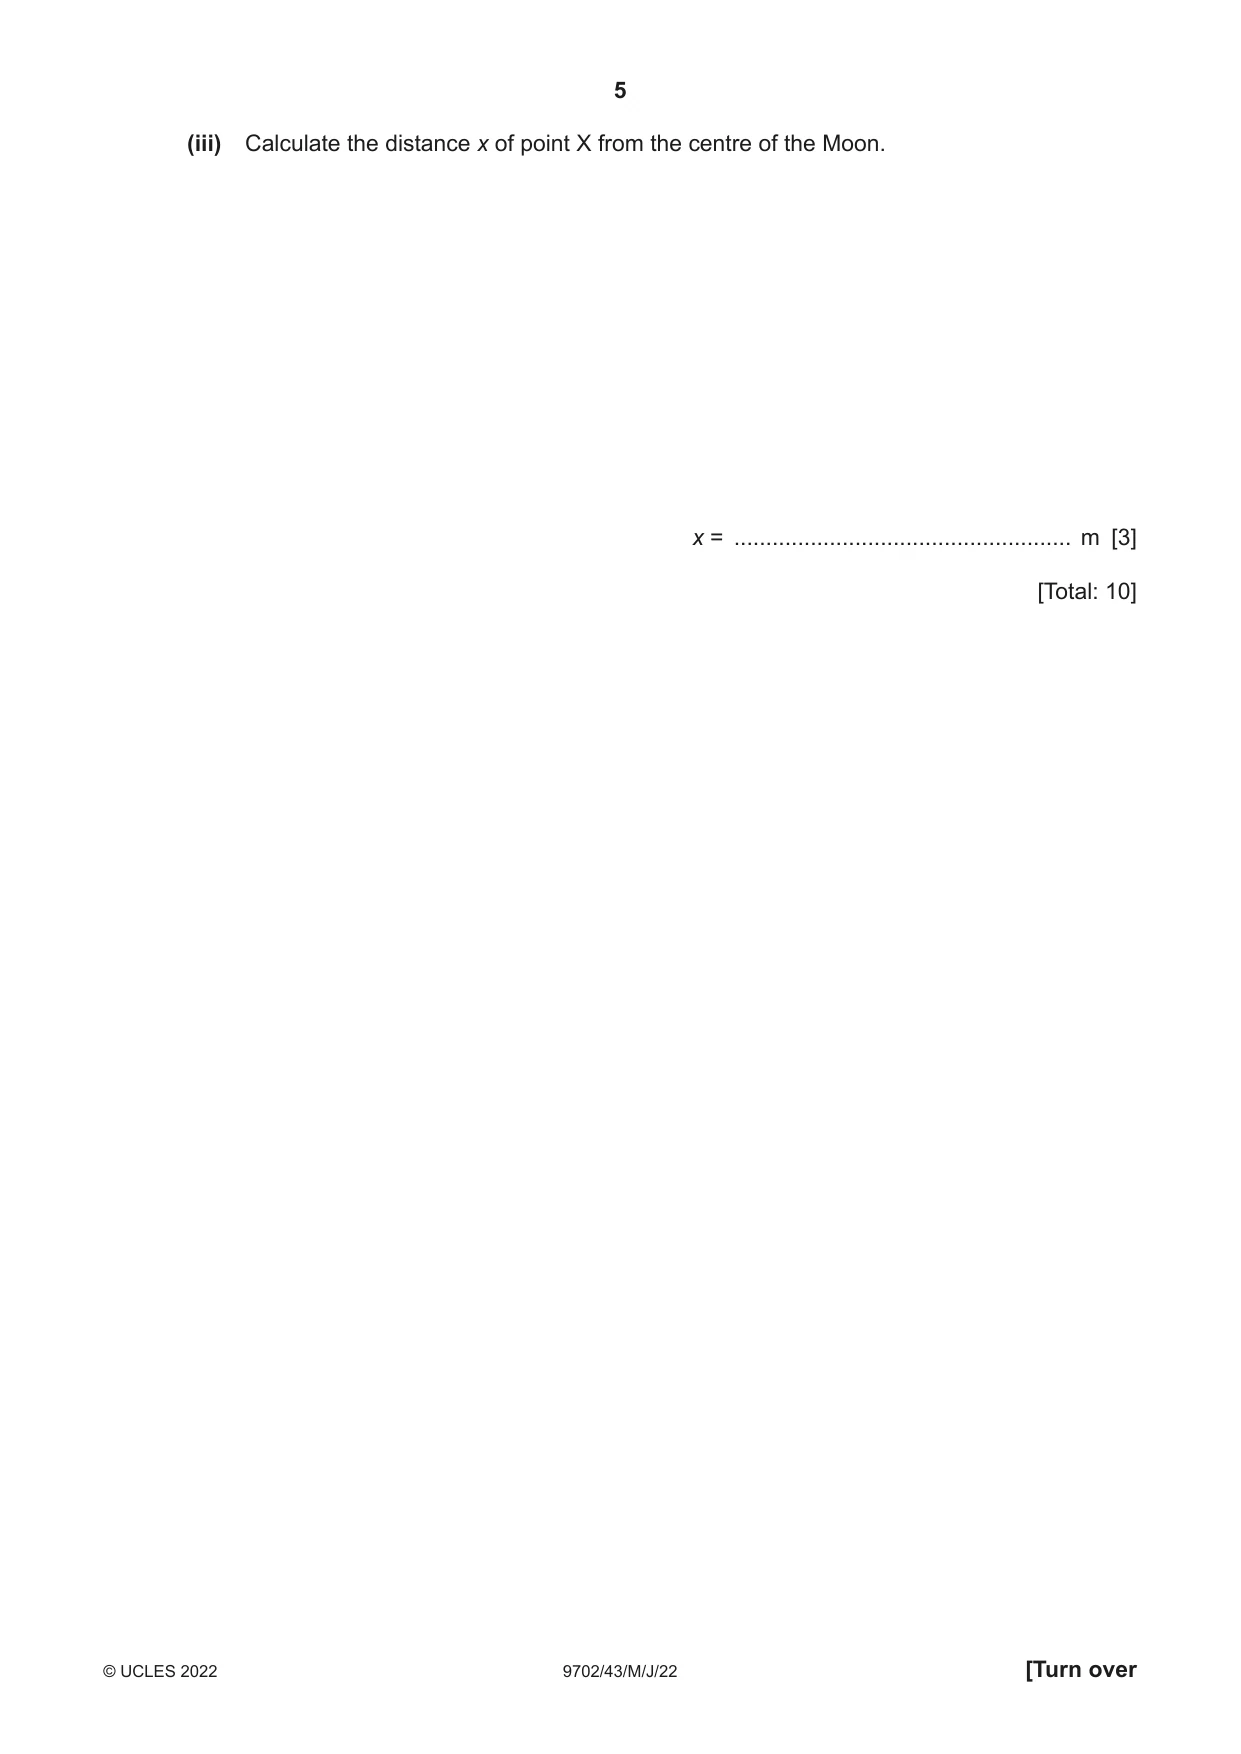
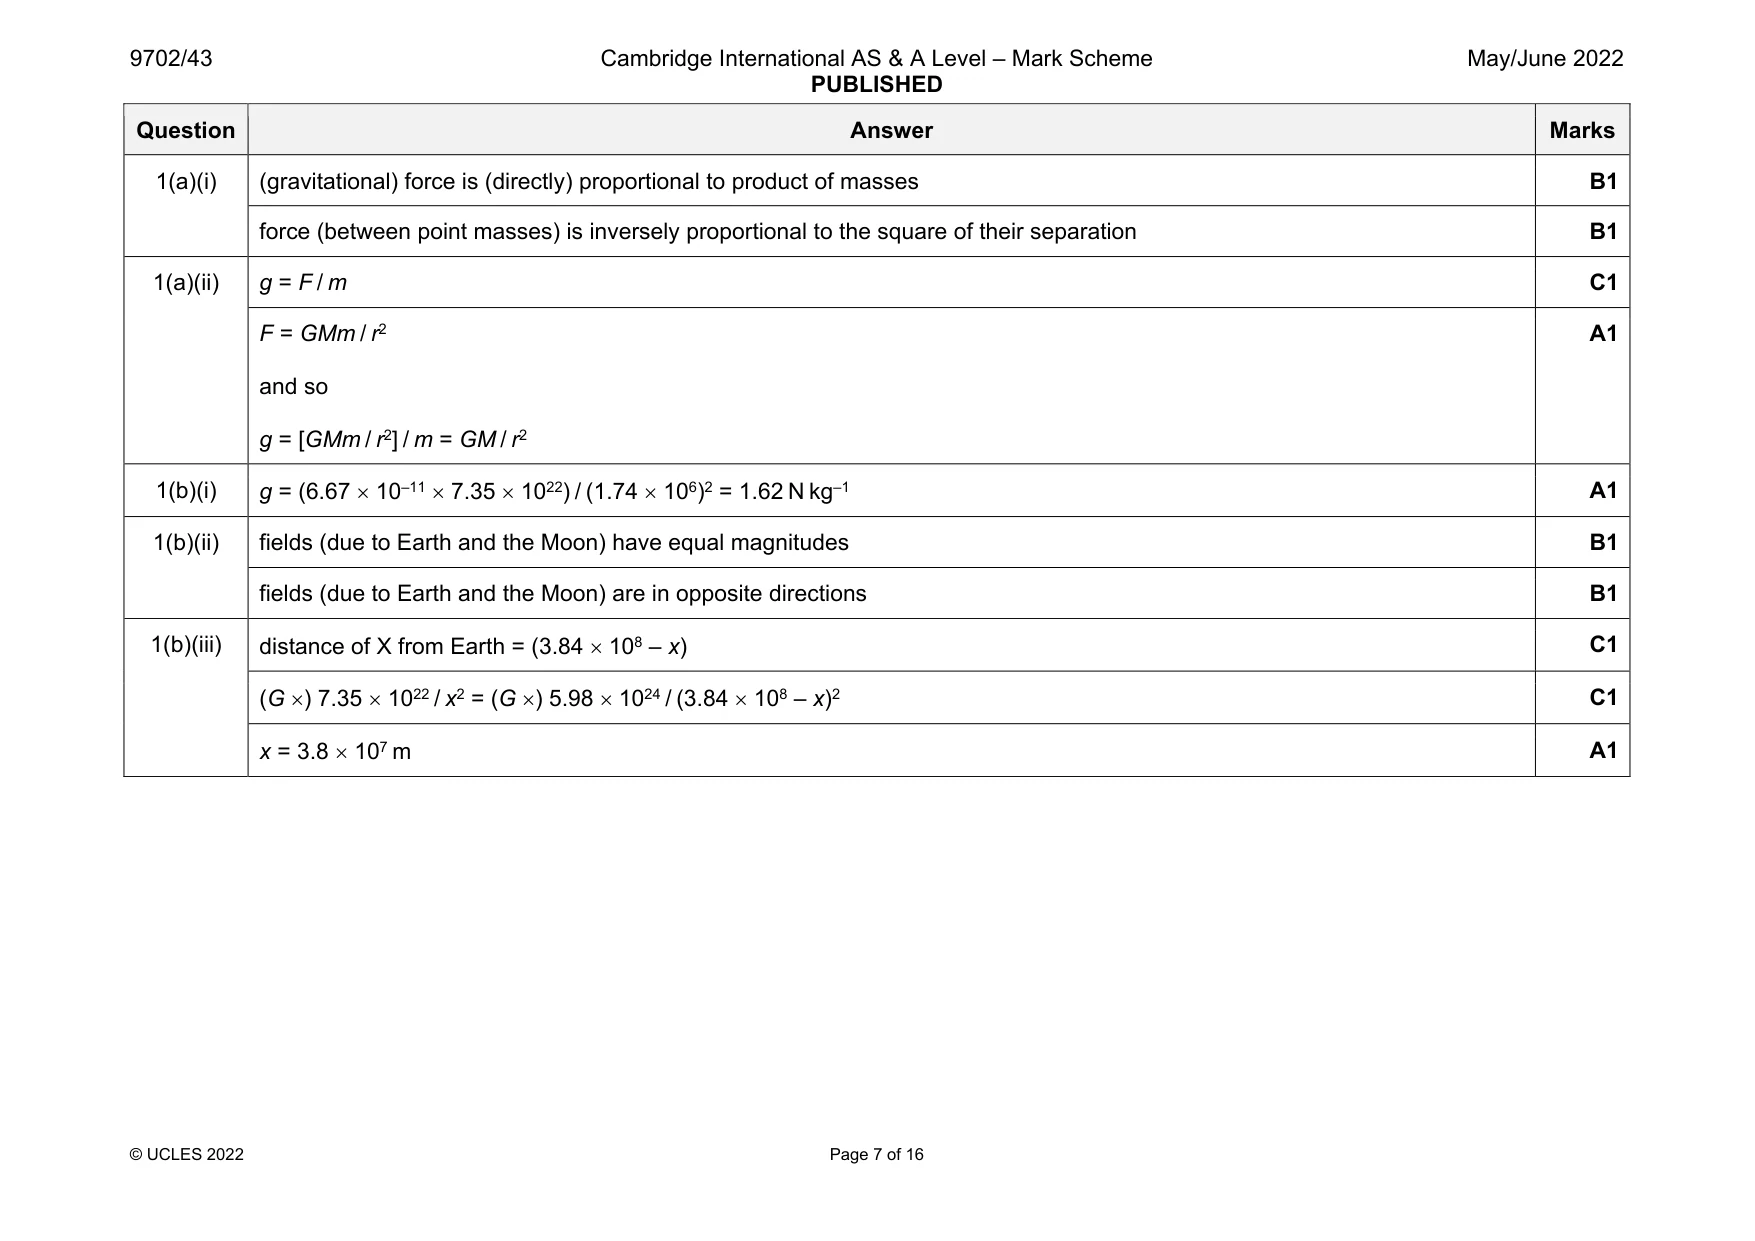
1 (a) (i) State Newton’s law of gravitation. ........................................................................................................................................... ........................................................................................................................................... ..................................................................................................................................... [2] (ii) Use Newton’s law of gravitation to show that the gravitational field strength g at a distance r away from a point mass M is given by GM g = . r 2 [2] (b) The Earth has a mass of 5.98 × 1024 kg and a radius of 6.37 × 10⁶ m. The Moon has a mass of 7.35 × 10²² kg and a radius of 1.74 × 10⁶ m. The Earth and the Moon can both be considered as point masses at their centres. Their centres are a distance of 3.84 × 10⁸ m apart. (i) Show that the gravitational field strength at the surface of the Moon due to the mass of the Moon is 1.62 N kg–1. [1] (ii) Explain why there is a point X on the line between the centres of the Earth and the Moon where the resultant gravitational field strength due to the Earth and the Moon is zero. ........................................................................................................................................... ........................................................................................................................................... ..................................................................................................................................... [2] (iii) Calculate the distance x of point X from the centre of the Moon. x = ..................................................... m [3] [Total: 10]
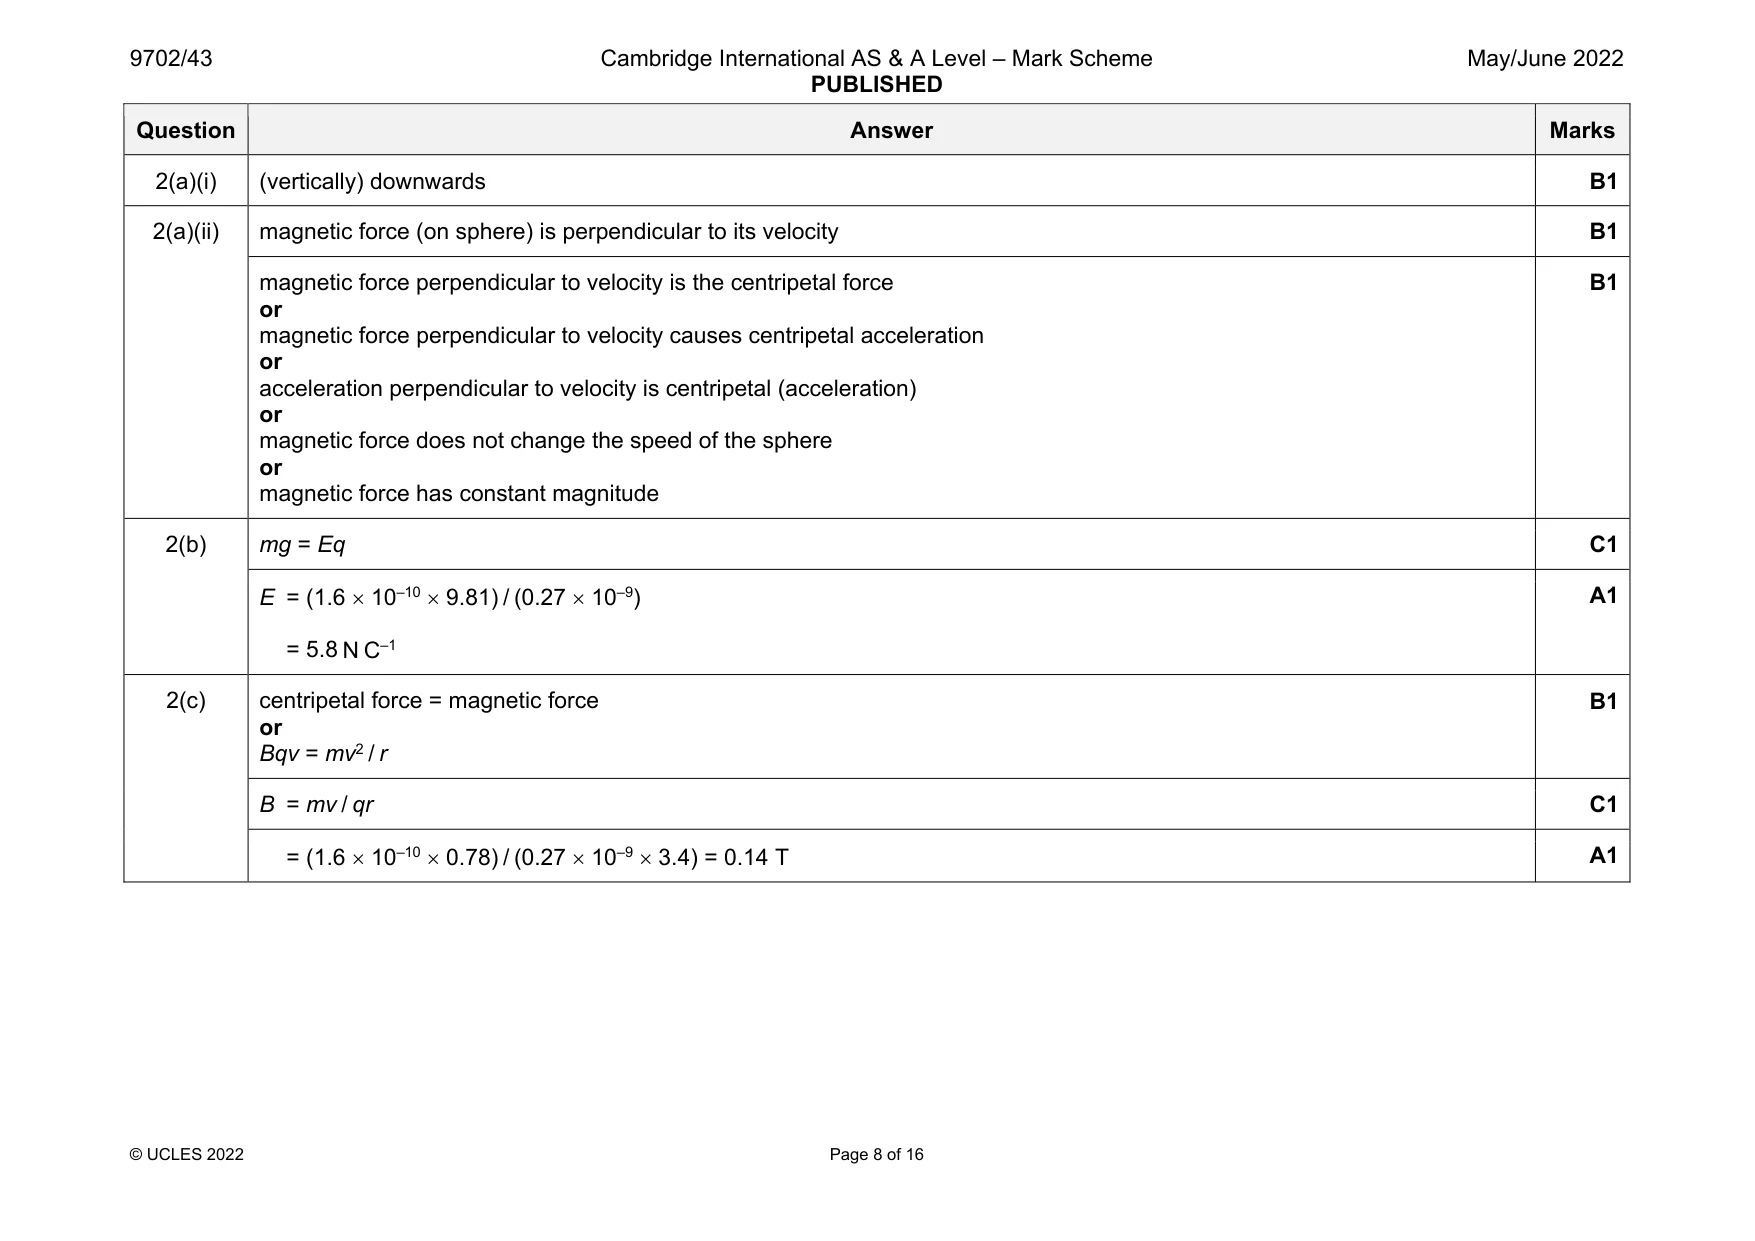
Mark scheme: 1(a)(i) (gravitational) force is (directly) proportional to product of masses B1 force (between point masses) is inversely proportional to the square of their separation B1 1(a)(ii) g = F / m C1 F = GMm / r2 and so g = [GMm / r2] / m = GM / r2 A1 1(b)(i) g = (6.67 10–11 7.35 1022) / (1.74 106)2 = 1.62 N kg–1 A1 1(b)(ii) fields (due to Earth and the Moon) have equal magnitudes B1 fields (due to Earth and the Moon) are in opposite directions B1 1(b)(iii) distance of X from Earth = (3.84 108 – x) C1 (G ) 7.35 1022 / x2 = (G ) 5.98 1024 / (3.84 108 – x)2 C1 x = 3.8 107 m A1
Q2 · A sphere of mass 1.6 × 10⁻¹⁰ kg has a charge of +0.27 nC
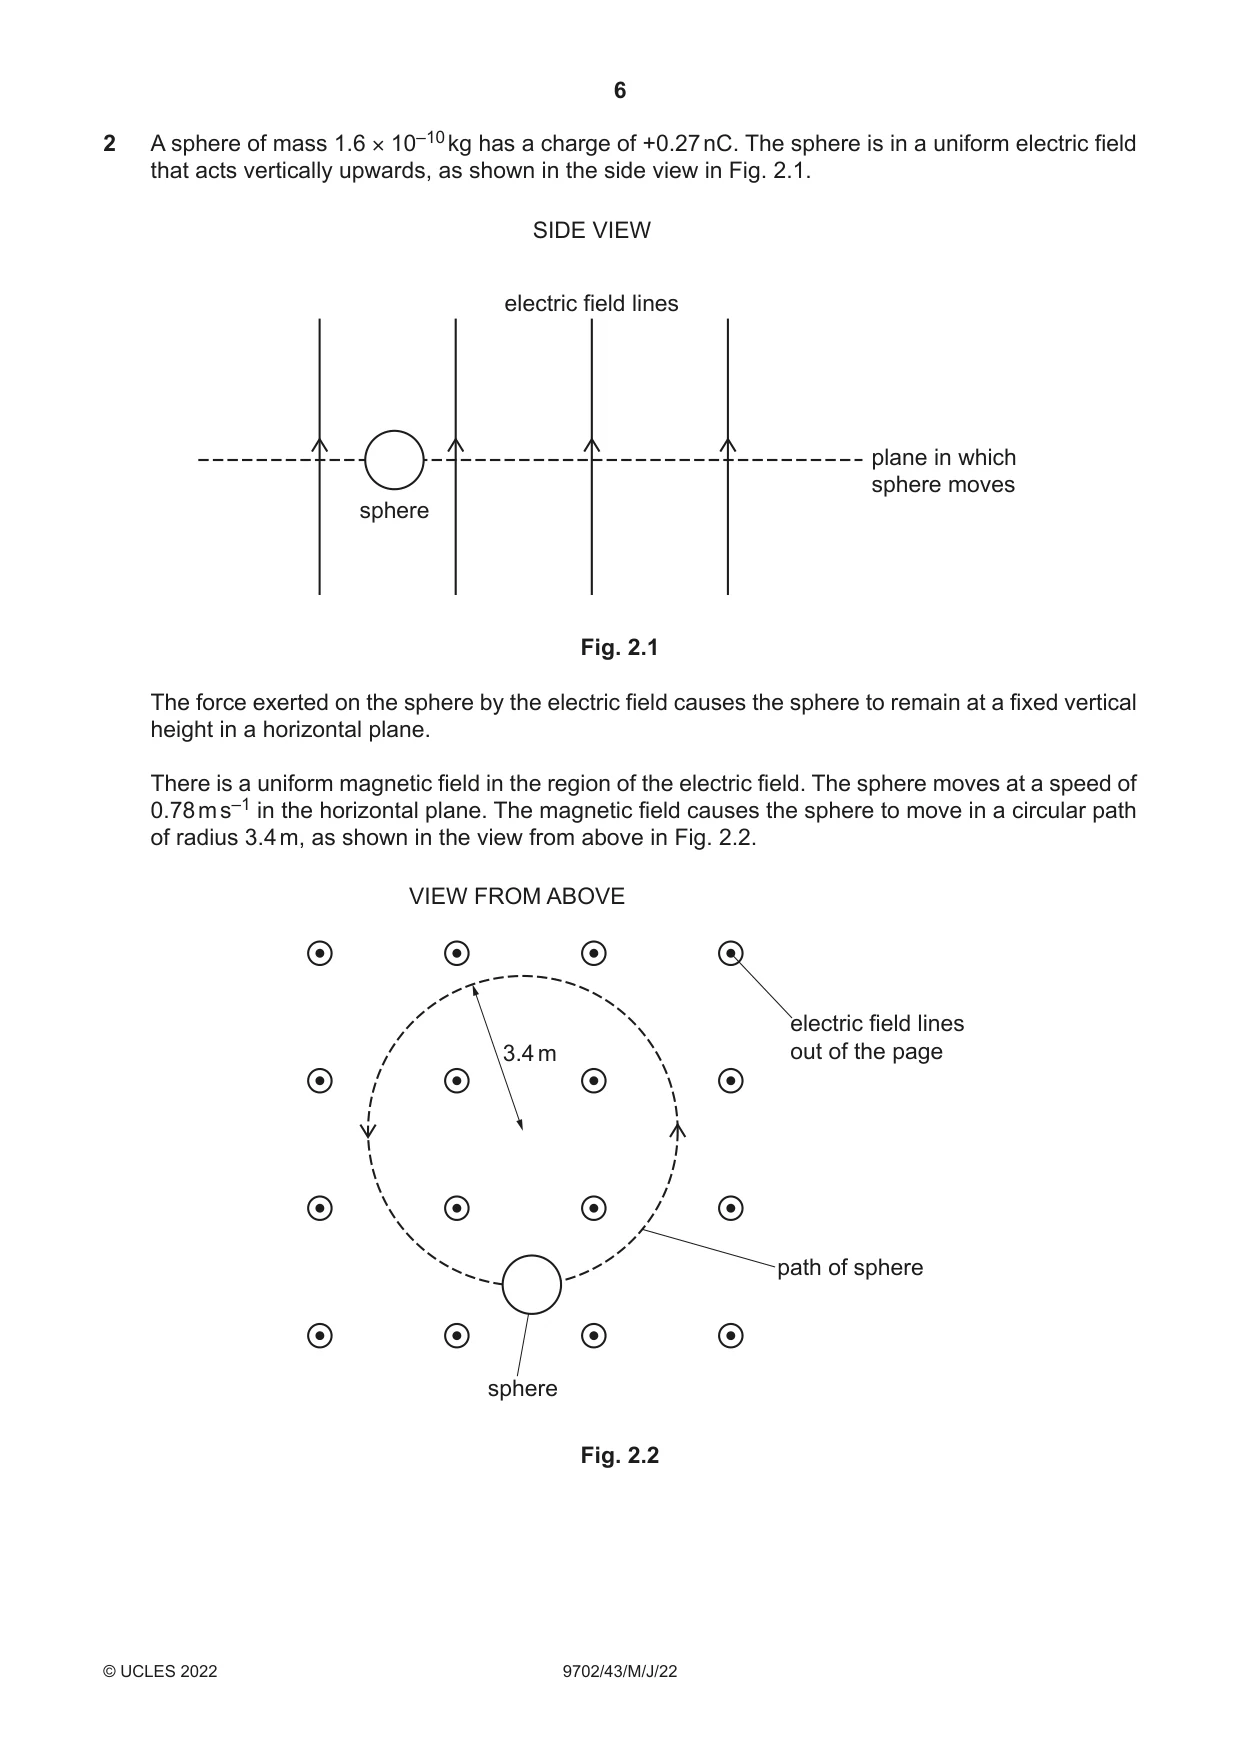
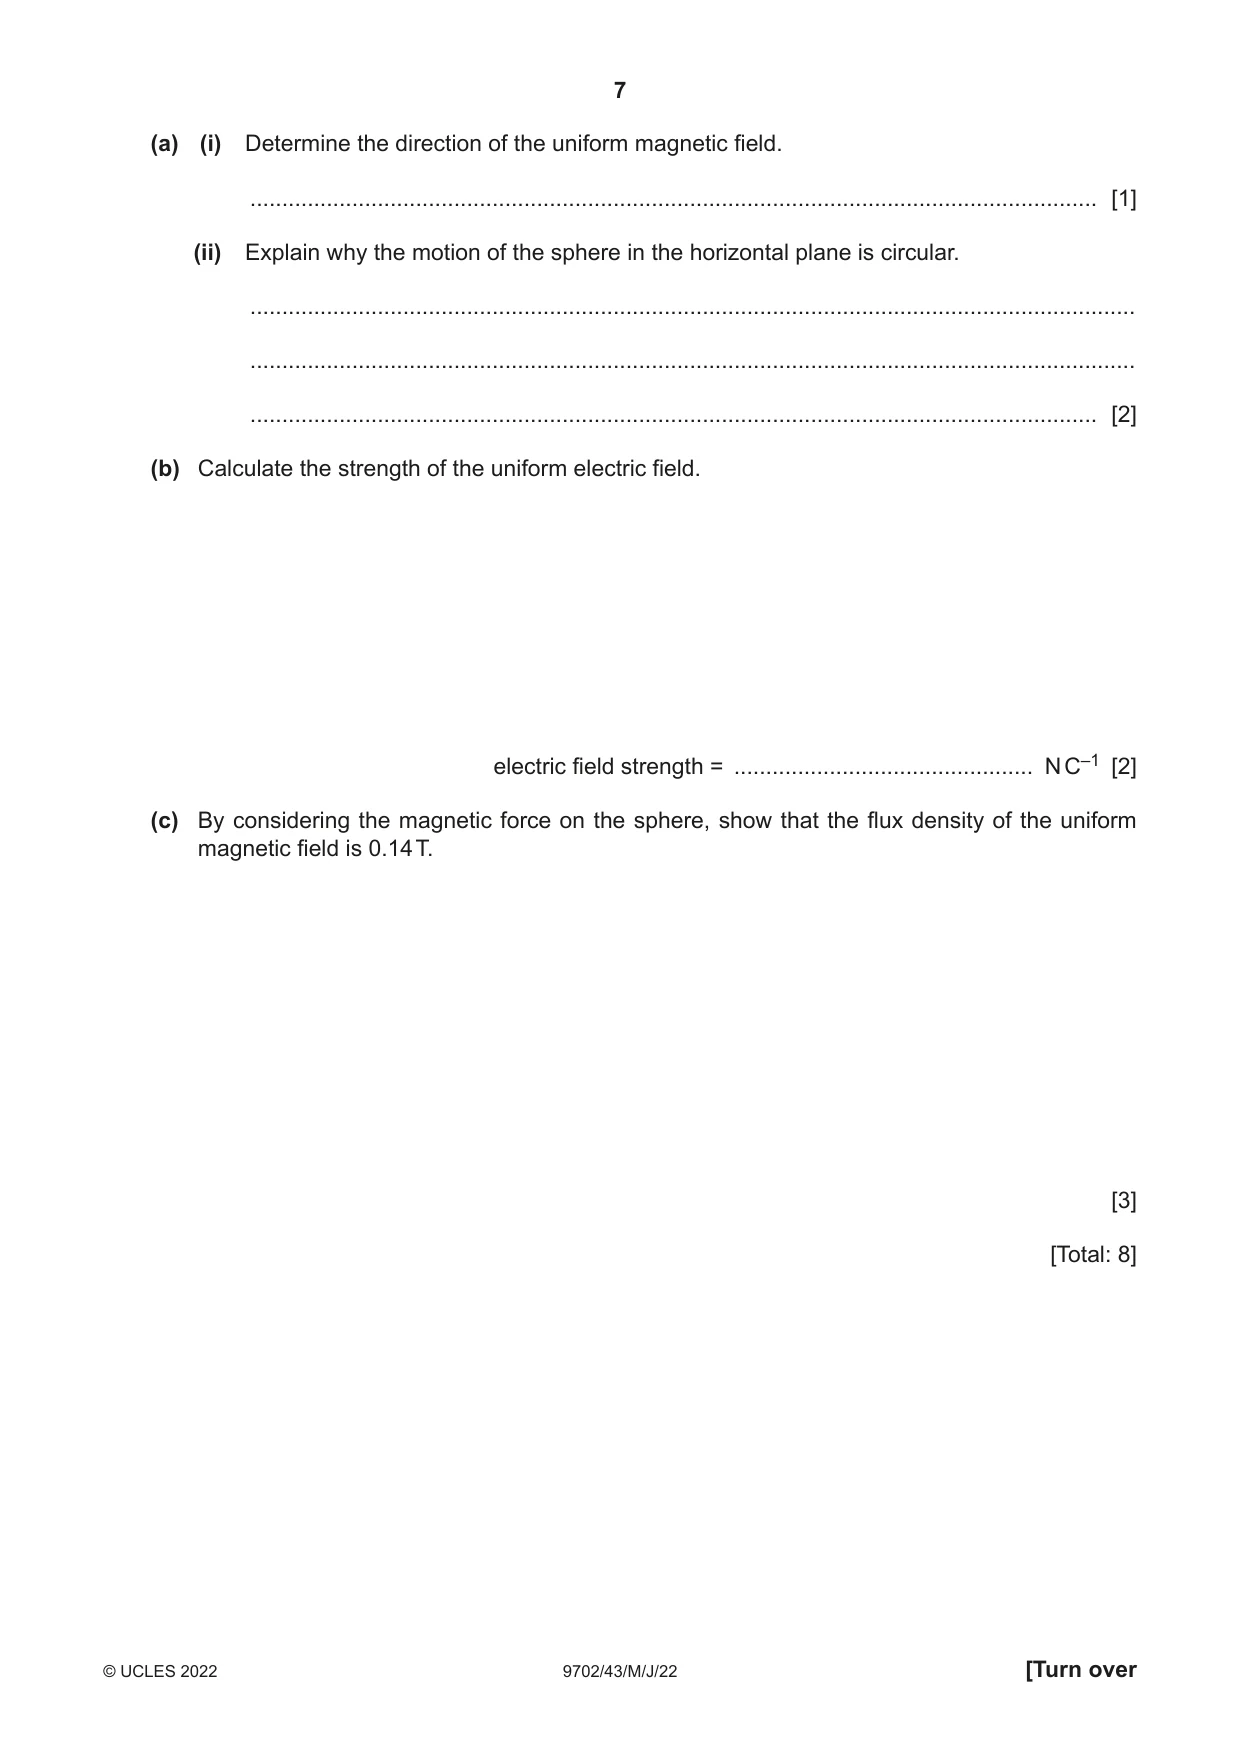
2 A sphere of mass 1.6 × 10⁻¹⁰ kg has a charge of +0.27 nC. The sphere is in a uniform electric field that acts vertically upwards, as shown in the side view in Fig. 2.1. SIDE VIEW electric field lines plane in which sphere moves sphere Fig. 2.1 The force exerted on the sphere by the electric field causes the sphere to remain at a fixed vertical height in a horizontal plane. There is a uniform magnetic field in the region of the electric field. The sphere moves at a speed of 0.78 m s–1 in the horizontal plane. The magnetic field causes the sphere to move in a circular path of radius 3.4 m, as shown in the view from above in Fig. 2.2. VIEW FROM ABOVE electric field lines 3.4 m out of the page path of sphere sphere Fig. 2.2 (a) (i) Determine the direction of the uniform magnetic field. ..................................................................................................................................... [1] (ii) Explain why the motion of the sphere in the horizontal plane is circular. ........................................................................................................................................... ........................................................................................................................................... ..................................................................................................................................... [2] (b) Calculate the strength of the uniform electric field. electric field strength = ............................................... N C–1 [2] (c) By considering the magnetic force on the sphere, show that the flux density of the uniform magnetic field is 0.14 T. [3] [Total: 8]
Mark scheme: 2(a)(i) (vertically) downwards B1 2(a)(ii) magnetic force (on sphere) is perpendicular to its velocity B1 magnetic force perpendicular to velocity is the centripetal force or magnetic force perpendicular to velocity causes centripetal acceleration or acceleration perpendicular to velocity is centripetal (acceleration) or magnetic force does not change the speed of the sphere or magnetic force has constant magnitude B1 2(b) mg = Eq C1 E = (1.6 10–10 9.81) / (0.27 10–9) = 5.8 N C–1 A1 2(c) centripetal force = magnetic force or Bqv = mv2 / r B1 B = mv / qr C1 = (1.6 10–10 0.78) / (0.27 10–9 3.4) = 0.14 T A1
Q3 · A fixed mass of an ideal gas is initially at a temperature of 17 °C
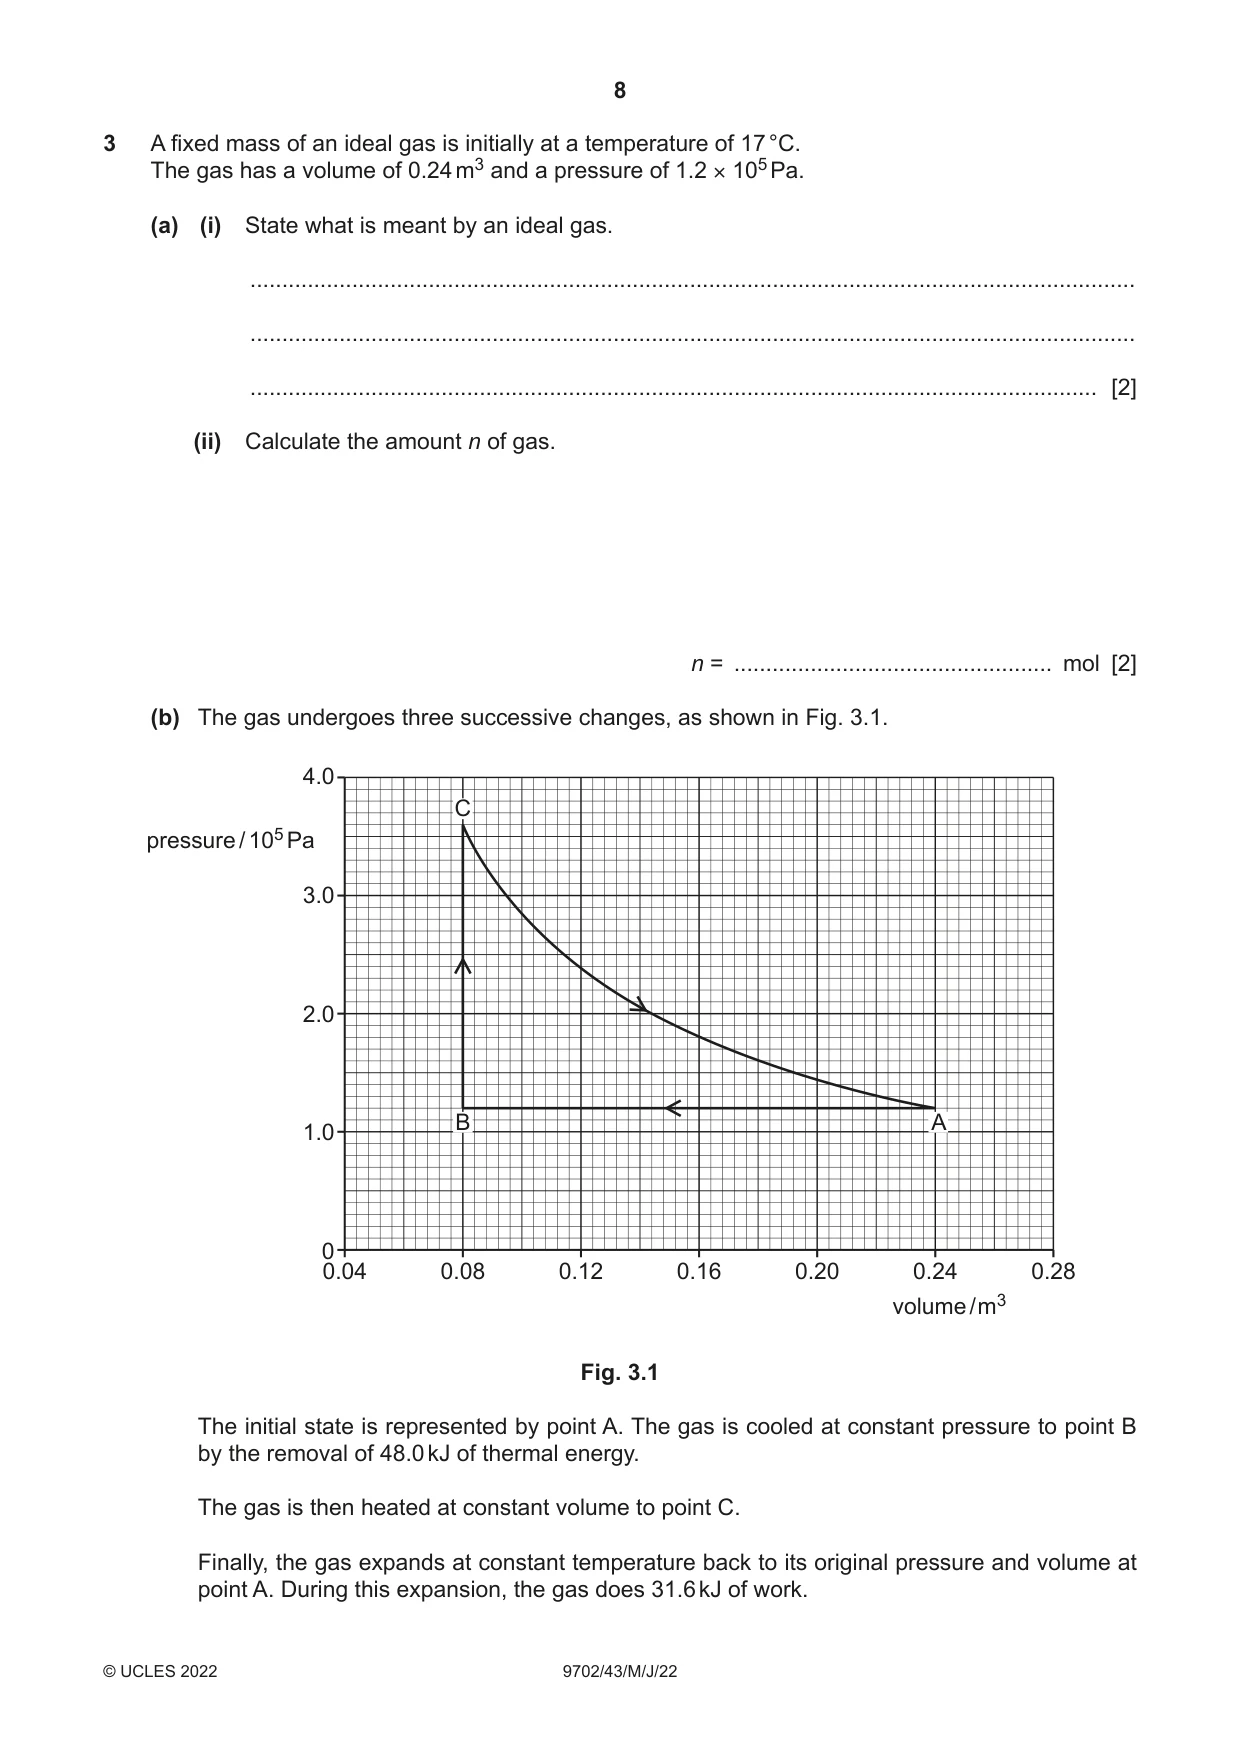
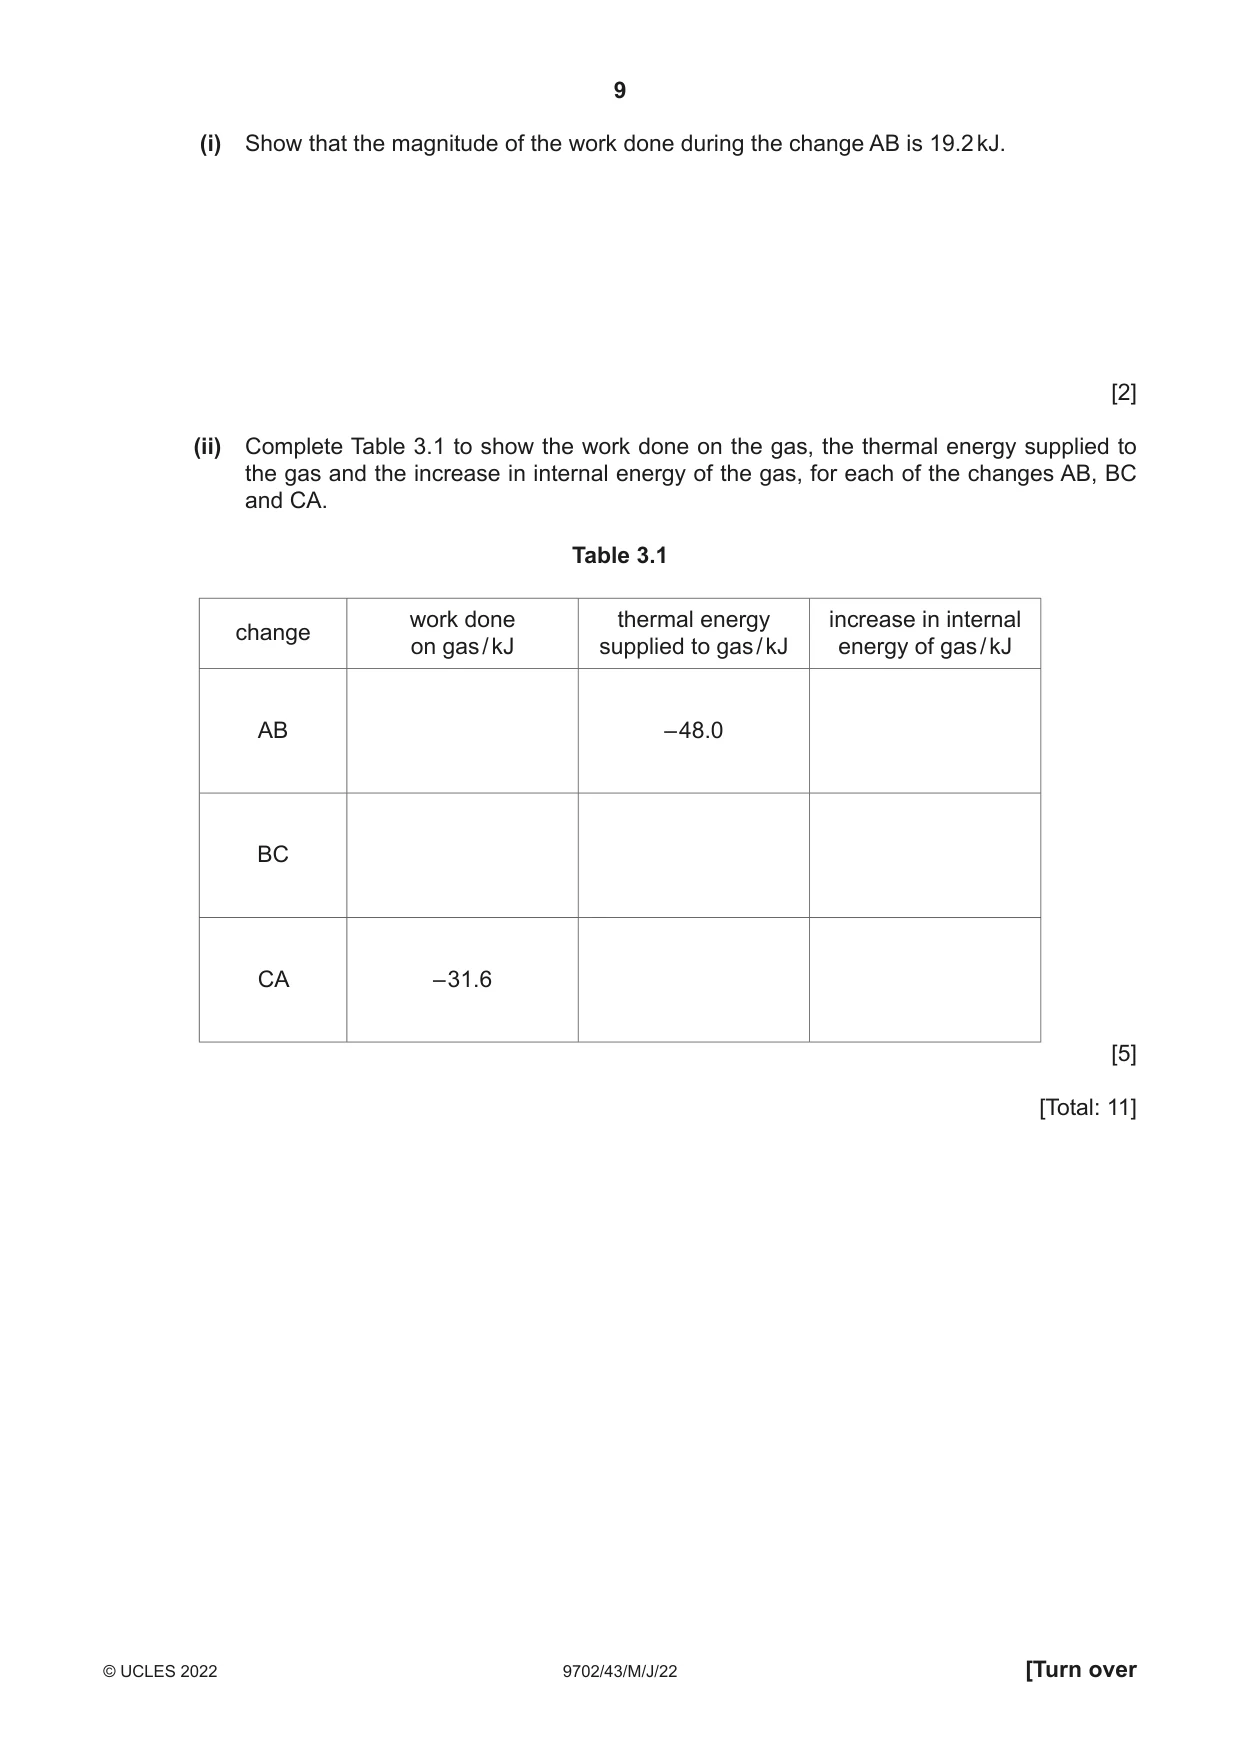
3 A fixed mass of an ideal gas is initially at a temperature of 17 °C. The gas has a volume of 0.24 m3 and a pressure of 1.2 × 10⁵ Pa. (a) (i) State what is meant by an ideal gas. ........................................................................................................................................... ........................................................................................................................................... ..................................................................................................................................... [2] (ii) Calculate the amount n of gas. n = .................................................. mol [2] (b) The gas undergoes three successive changes, as shown in Fig. 3.1. 4.0 C pressure / 105 Pa 3.0 2.0 B A 1.0 0 0.04 0.08 0.12 0.16 0.20 0.24 0.28 volume / m3 Fig. 3.1 The initial state is represented by point A. The gas is cooled at constant pressure to point B by the removal of 48.0 kJ of thermal energy. The gas is then heated at constant volume to point C. Finally, the gas expands at constant temperature back to its original pressure and volume at point A. During this expansion, the gas does 31.6 kJ of work. (i) Show that the magnitude of the work done during the change AB is 19.2 kJ. [2] (ii) Complete Table 3.1 to show the work done on the gas, the thermal energy supplied to the gas and the increase in internal energy of the gas, for each of the changes AB, BC and CA. Table 3.1 work done thermal energy increase in internal change on gas / kJ supplied to gas / kJ energy of gas / kJ AB – 48.0 BC CA – 31.6 [5] [Total: 11]
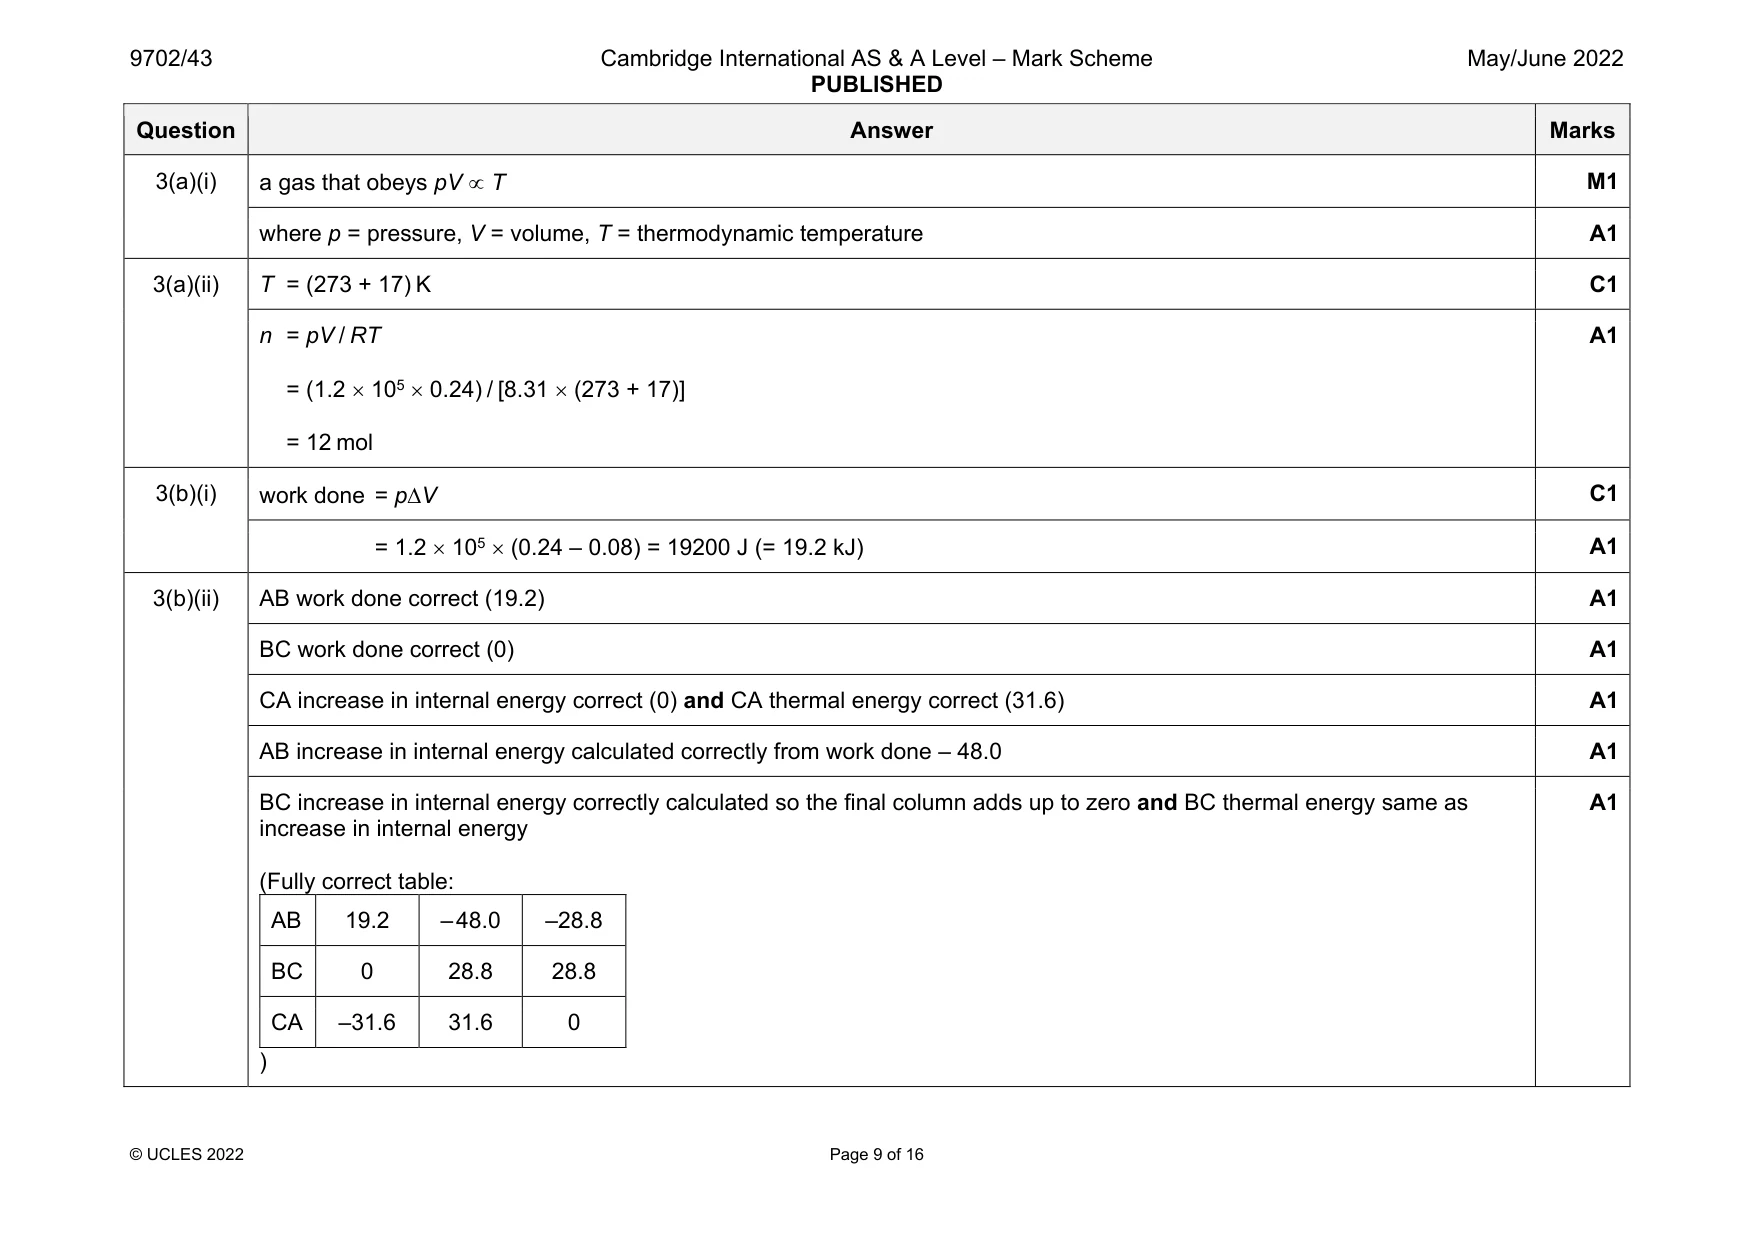
Mark scheme: 3(a)(i) M1 where p = pressure, V = volume, T = thermodynamic temperature A1 3(a)(ii) T = (273 + 17) K C1 n = pV / RT = (1.2 105 0.24) / [8.31 (273 + 17)] = 12 mol A1 3(b)(i) work done = pV C1 = 1.2 105 (0.24 – 0.08) = 19200 J (= 19.2 kJ) A1 3(b)(ii) AB work done correct (19.2) A1 BC work done correct (0) A1 CA increase in internal energy correct (0) and CA thermal energy correct (31.6) A1 AB increase in internal energy calculated correctly from work done – 48.0 A1 BC increase in internal energy correctly calculated so the final column adds up to zero and BC thermal energy same as increase in internal energy (Fully correct table: AB 19.2 – 48.0 –28.8 BC 0 28.8 28.8 CA –31.6 31.6 0 ) A1
Q4 · A pendulum consists of a bob (small metal sphere) attached to the end of a piece of string
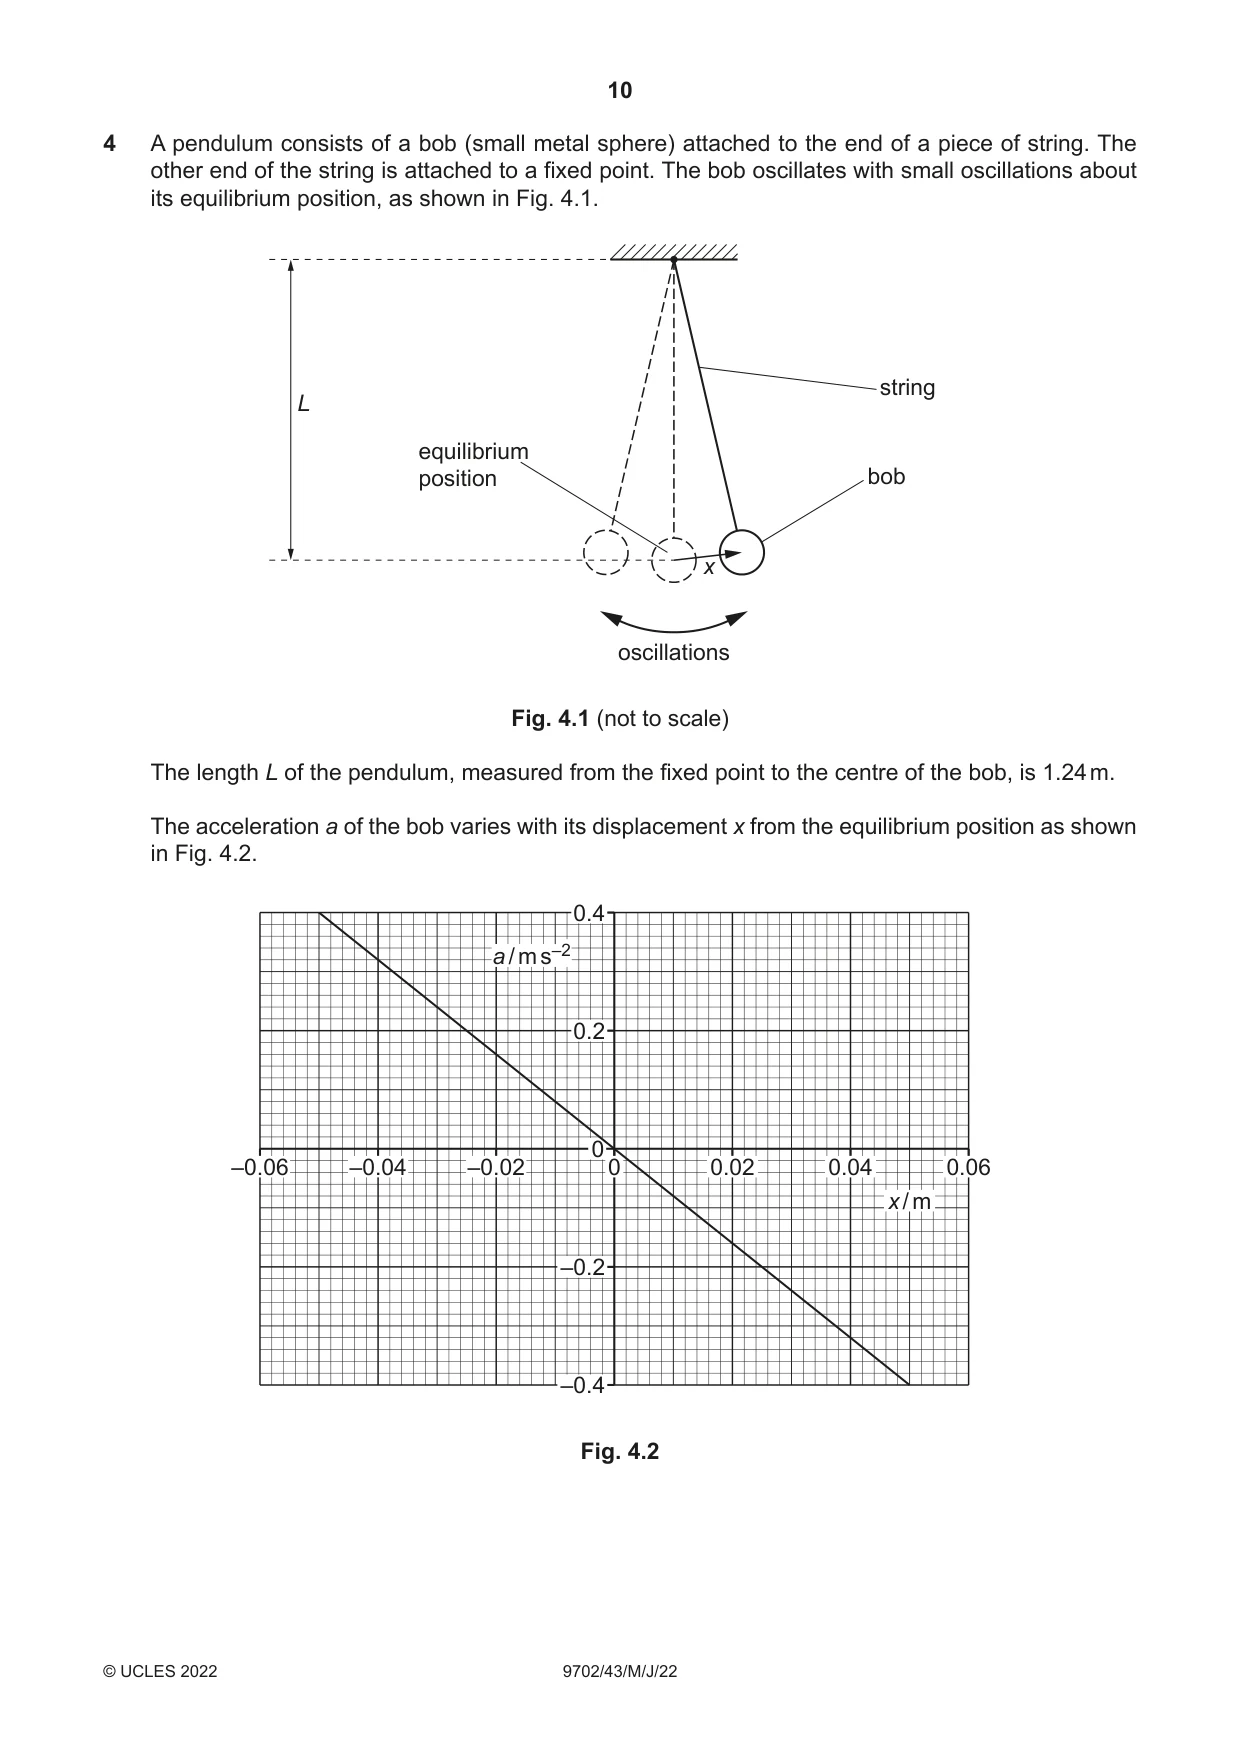
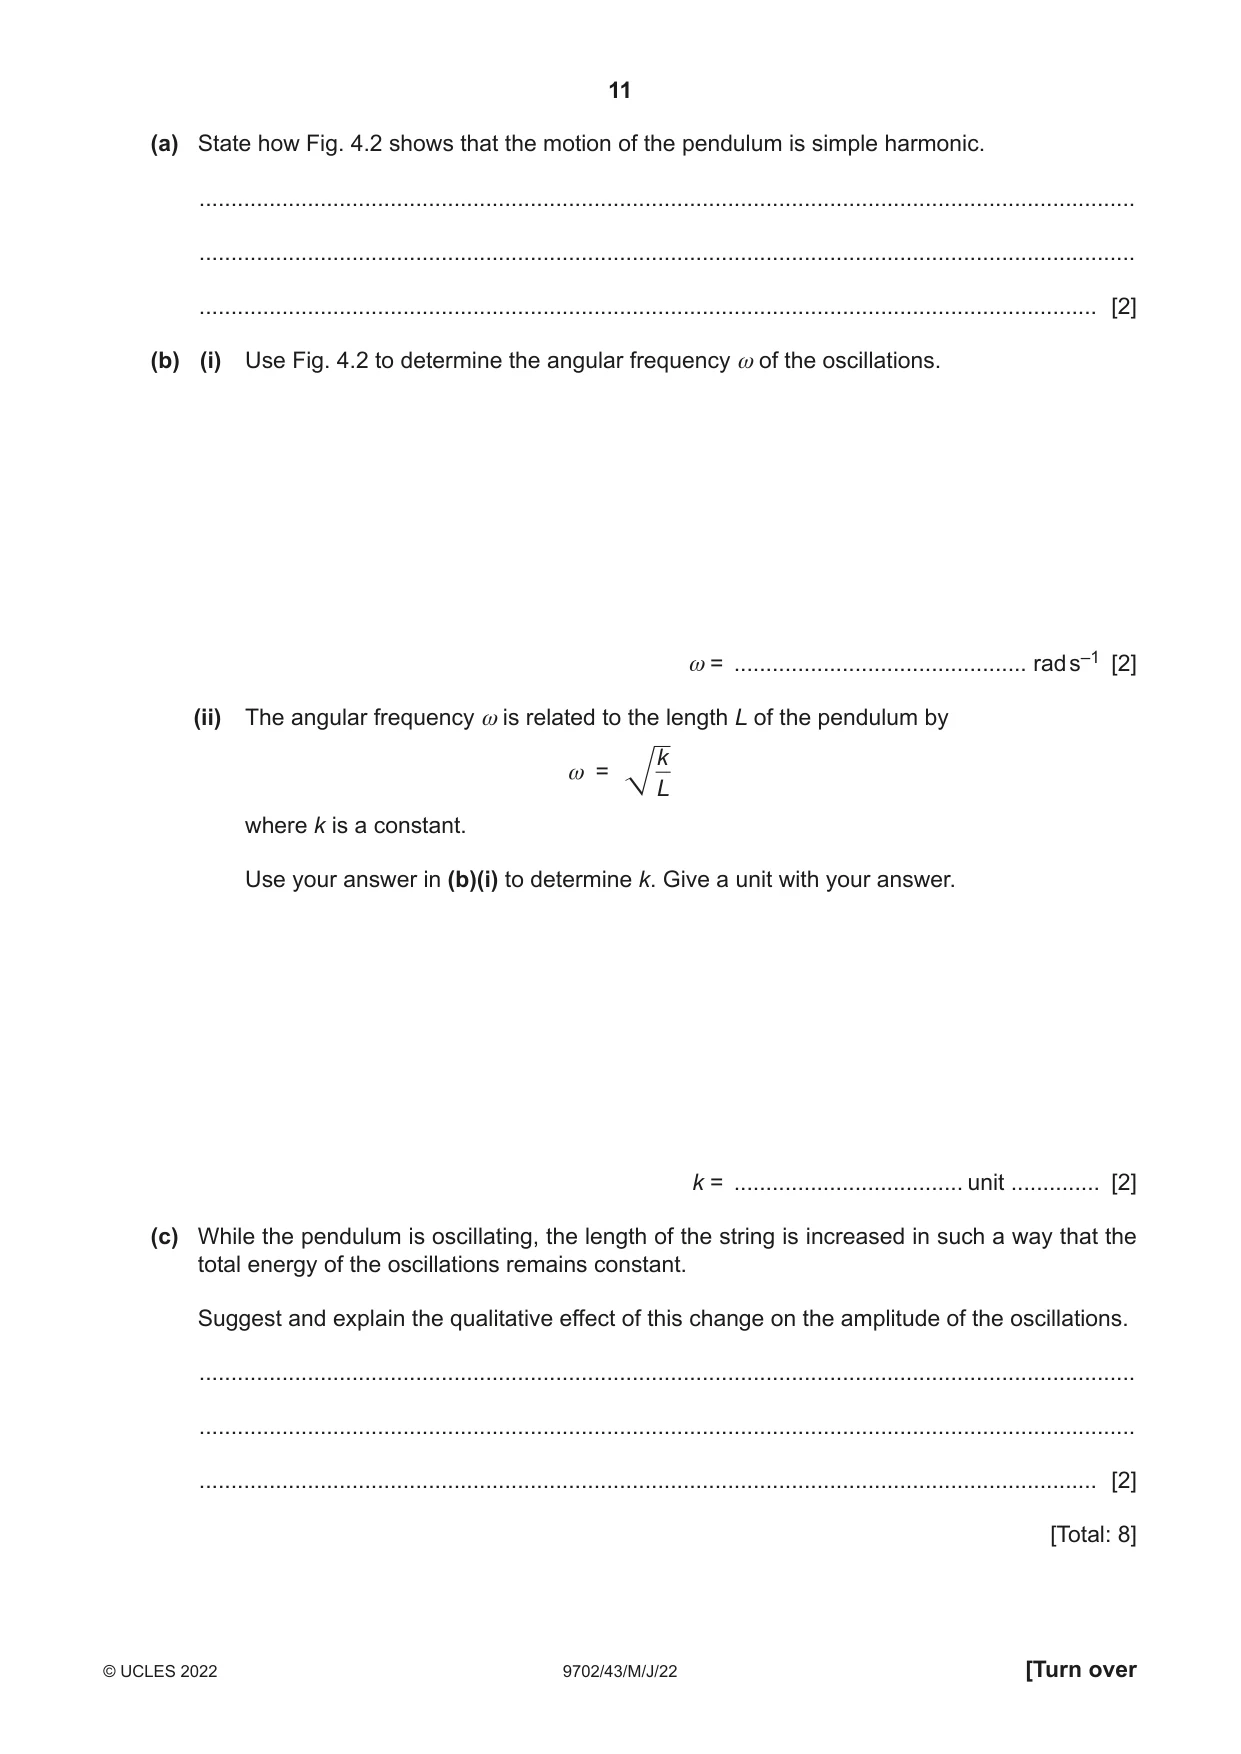
4 A pendulum consists of a bob (small metal sphere) attached to the end of a piece of string. The other end of the string is attached to a fixed point. The bob oscillates with small oscillations about its equilibrium position, as shown in Fig. 4.1. string L equilibrium position bob x oscillations Fig. 4.1 (not to scale) The length L of the pendulum, measured from the fixed point to the centre of the bob, is 1.24 m. The acceleration a of the bob varies with its displacement x from the equilibrium position as shown in Fig. 4.2. 0.4 a / m s–2 0.2 0 –0.06 –0.04 –0.02 0 0.02 0.04 0.06 x / m –0.2 –0.4 Fig. 4.2 (a) State how Fig. 4.2 shows that the motion of the pendulum is simple harmonic. ................................................................................................................................................... ................................................................................................................................................... ............................................................................................................................................. [2] (b) (i) Use Fig. 4.2 to determine the angular frequency ω of the oscillations. ω = .............................................. rad s–1 [2] (ii) The angular frequency ω is related to the length L of the pendulum by k ω = L where k is a constant. Use your answer in (b)(i) to determine k. Give a unit with your answer. k = .................................... unit .............. [2] (c) While the pendulum is oscillating, the length of the string is increased in such a way that the total energy of the oscillations remains constant. Suggest and explain the qualitative effect of this change on the amplitude of the oscillations. ................................................................................................................................................... ................................................................................................................................................... ............................................................................................................................................. [2] [Total: 8]
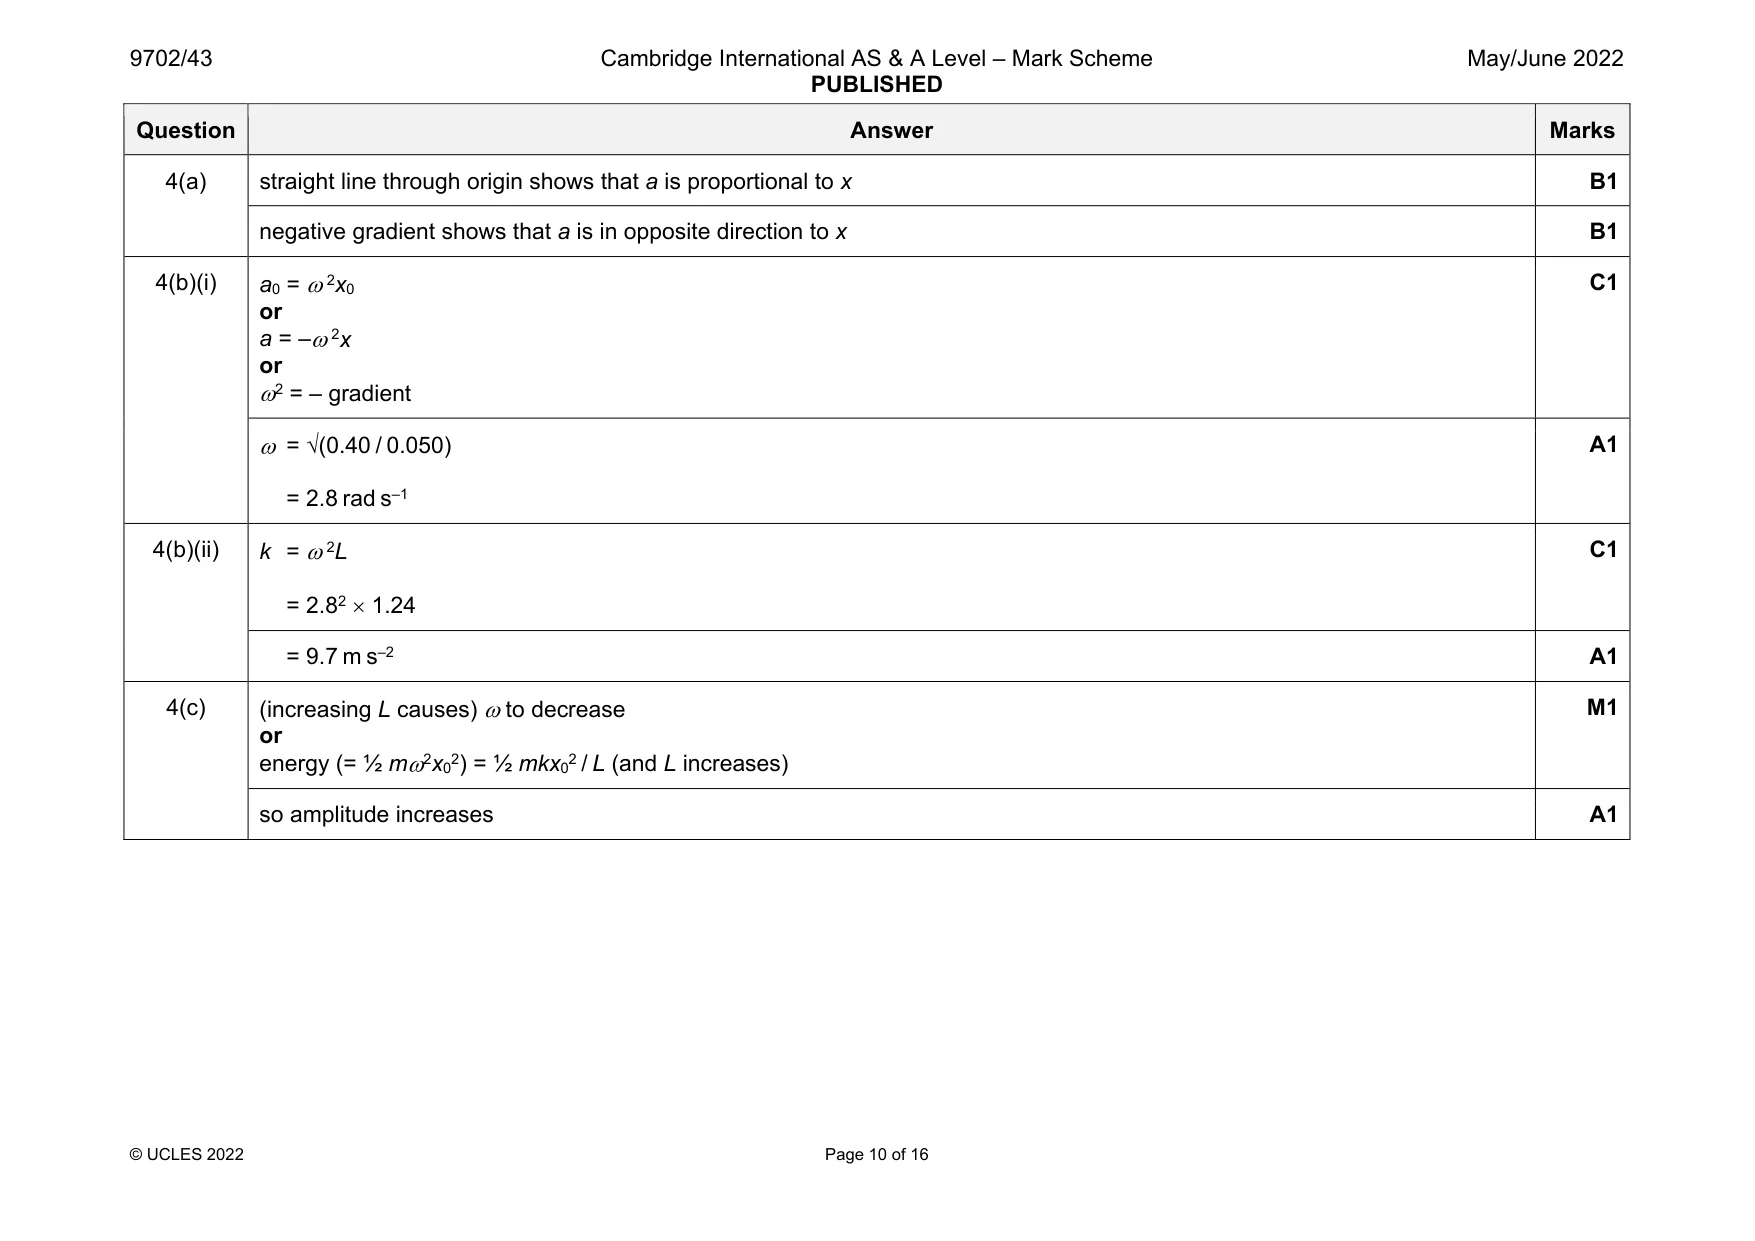
Mark scheme: 4(a) straight line through origin shows that a is proportional to x B1 negative gradient shows that a is in opposite direction to x B1 4(b)(i) a0 = 2x0 or a = – 2x or 2 = – gradient C1 = (0.40 / 0.050) = 2.8 rad s–1 A1 4(b)(ii) k = 2L = 2.82 1.24 C1 = 9.7 m s–2 A1 4(c) (increasing L causes) to decrease or energy (= ½ m2x02) = ½ mkx02 / L (and L increases) M1 so amplitude increases A1
Q5 · Four diodes and a load resistor of resistance 1.2 kΩ, connected in a circuit that is used…
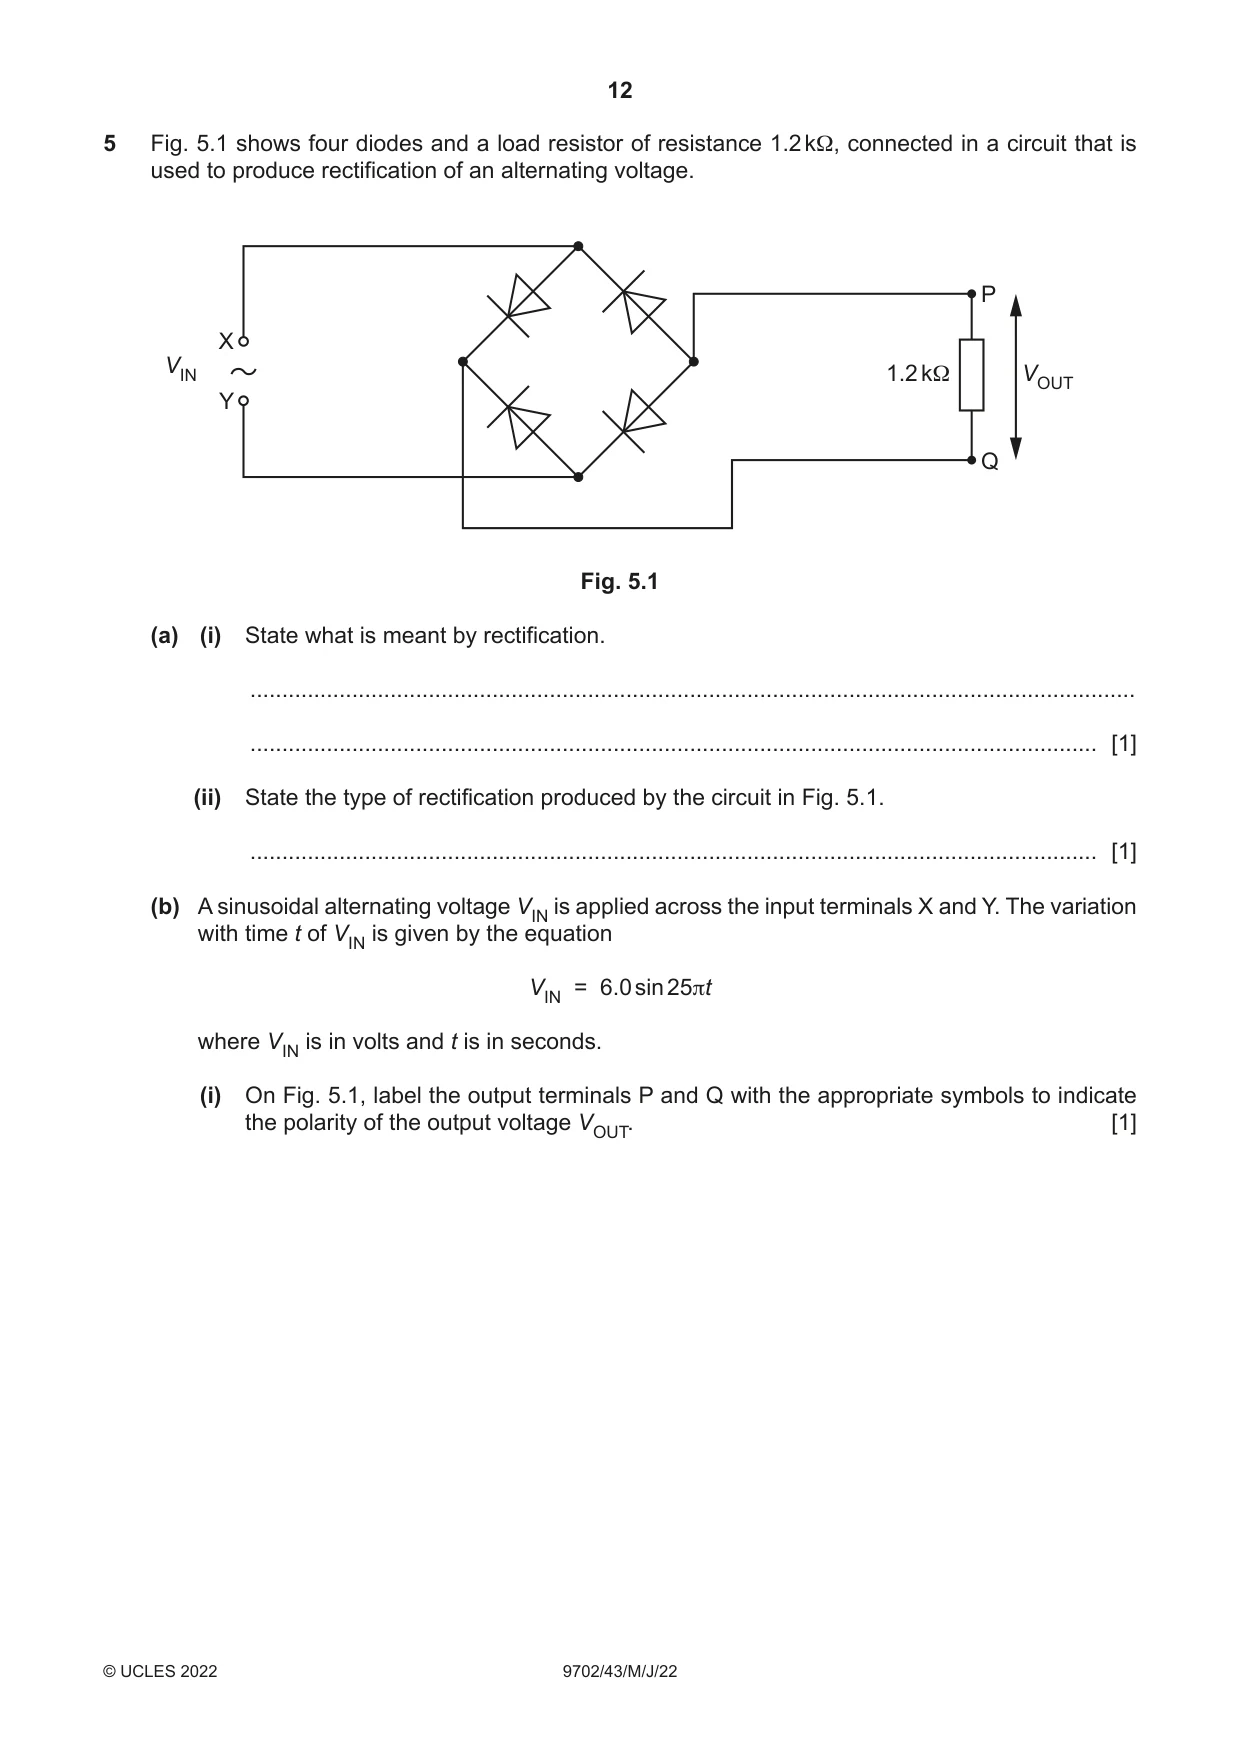
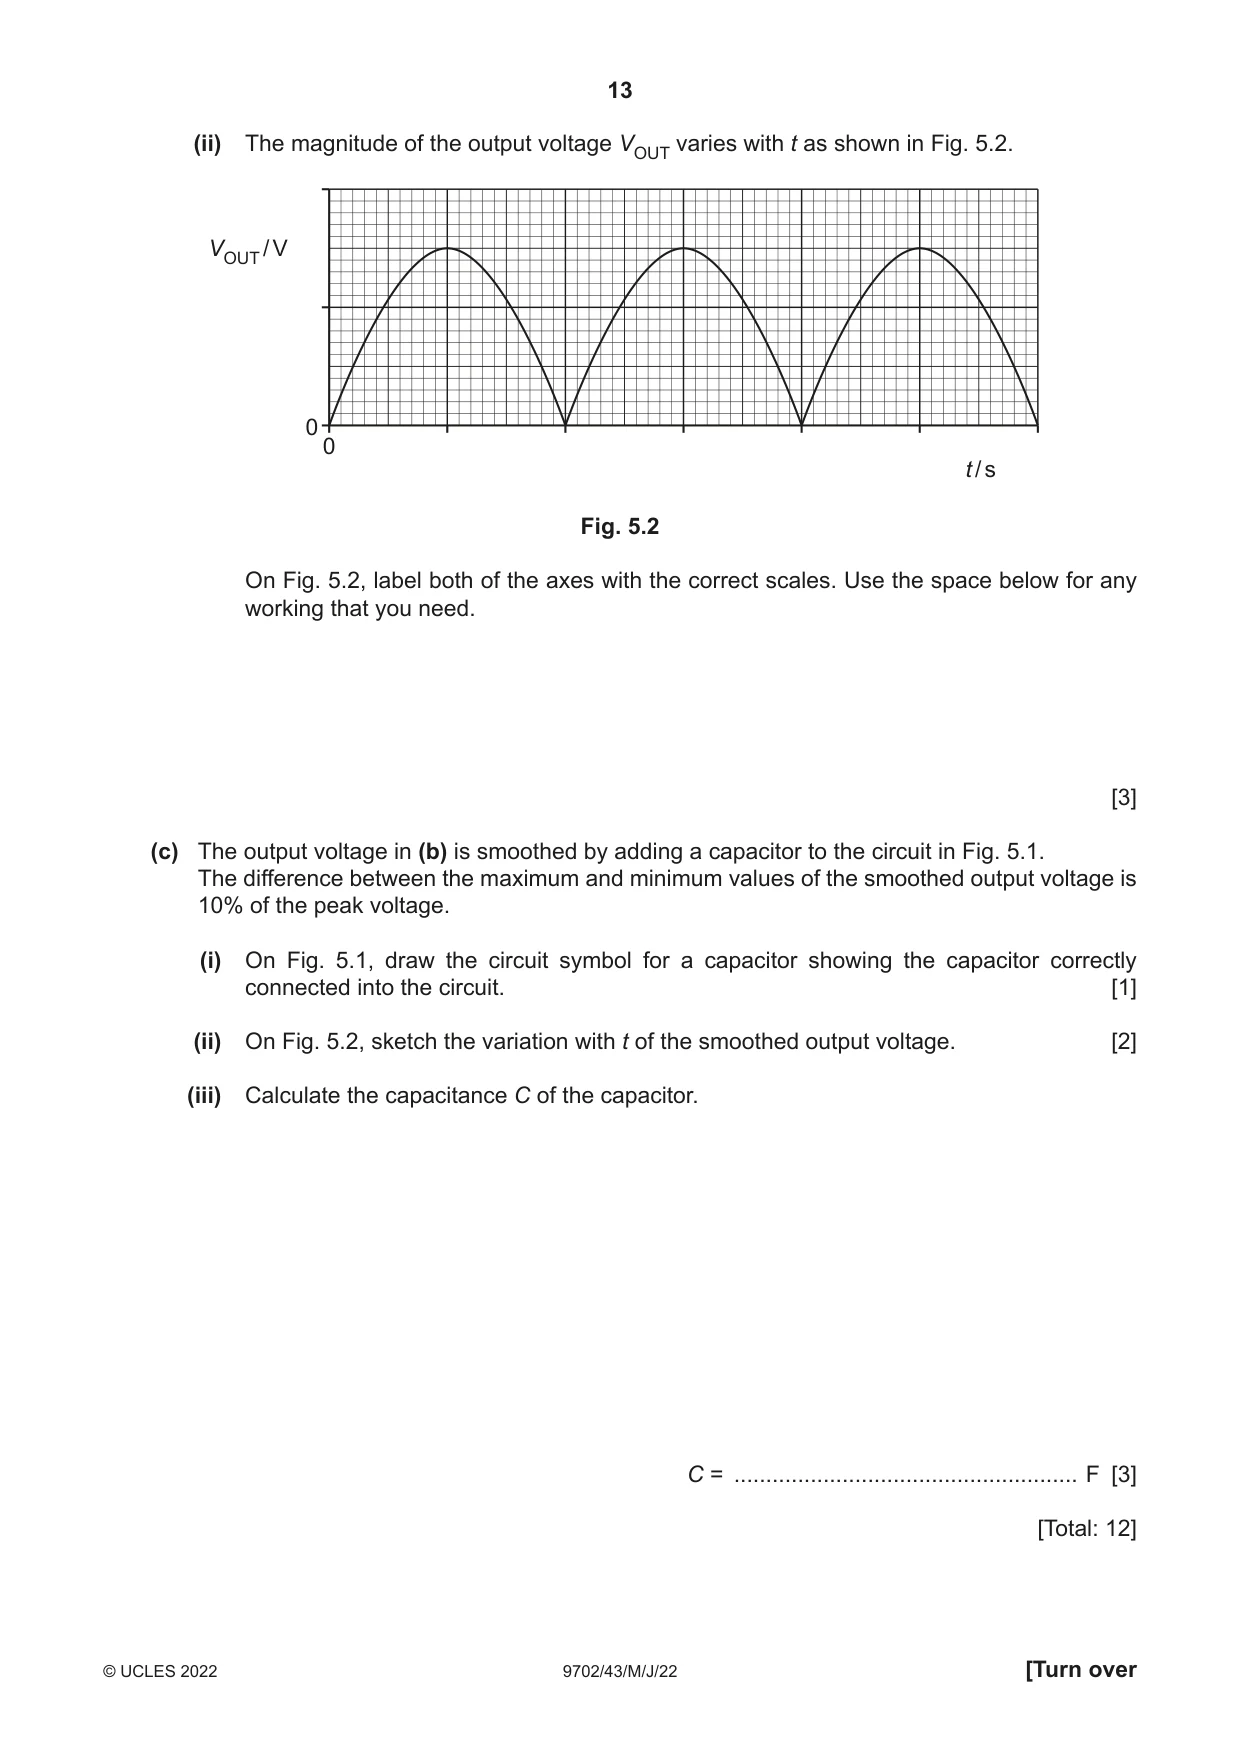
5 Fig. 5.1 shows four diodes and a load resistor of resistance 1.2 kΩ, connected in a circuit that is used to produce rectification of an alternating voltage. P X VIN 1.2 kΩ VOUT Y Q Fig. 5.1 (a) (i) State what is meant by rectification. ........................................................................................................................................... ..................................................................................................................................... [1] (ii) State the type of rectification produced by the circuit in Fig. 5.1. ..................................................................................................................................... [1] (b) A sinusoidal alternating voltage VIN is applied across the input terminals X and Y. The variation with time t of VIN is given by the equation VIN = 6.0 sin 25πt where VIN is in volts and t is in seconds. (i) On Fig. 5.1, label the output terminals P and Q with the appropriate symbols to indicate the polarity of the output voltage VOUT. [1] (ii) The magnitude of the output voltage VOUT varies with t as shown in Fig. 5.2. VOUT / V 0 0 t / s Fig. 5.2 On Fig. 5.2, label both of the axes with the correct scales. Use the space below for any working that you need. [3] (c) The output voltage in (b) is smoothed by adding a capacitor to the circuit in Fig. 5.1. The difference between the maximum and minimum values of the smoothed output voltage is 10% of the peak voltage. (i) On Fig. 5.1, draw the circuit symbol for a capacitor showing the capacitor correctly connected into the circuit. [1] (ii) On Fig. 5.2, sketch the variation with t of the smoothed output voltage. [2] (iii) Calculate the capacitance C of the capacitor. C = ...................................................... F [3] [Total: 12]
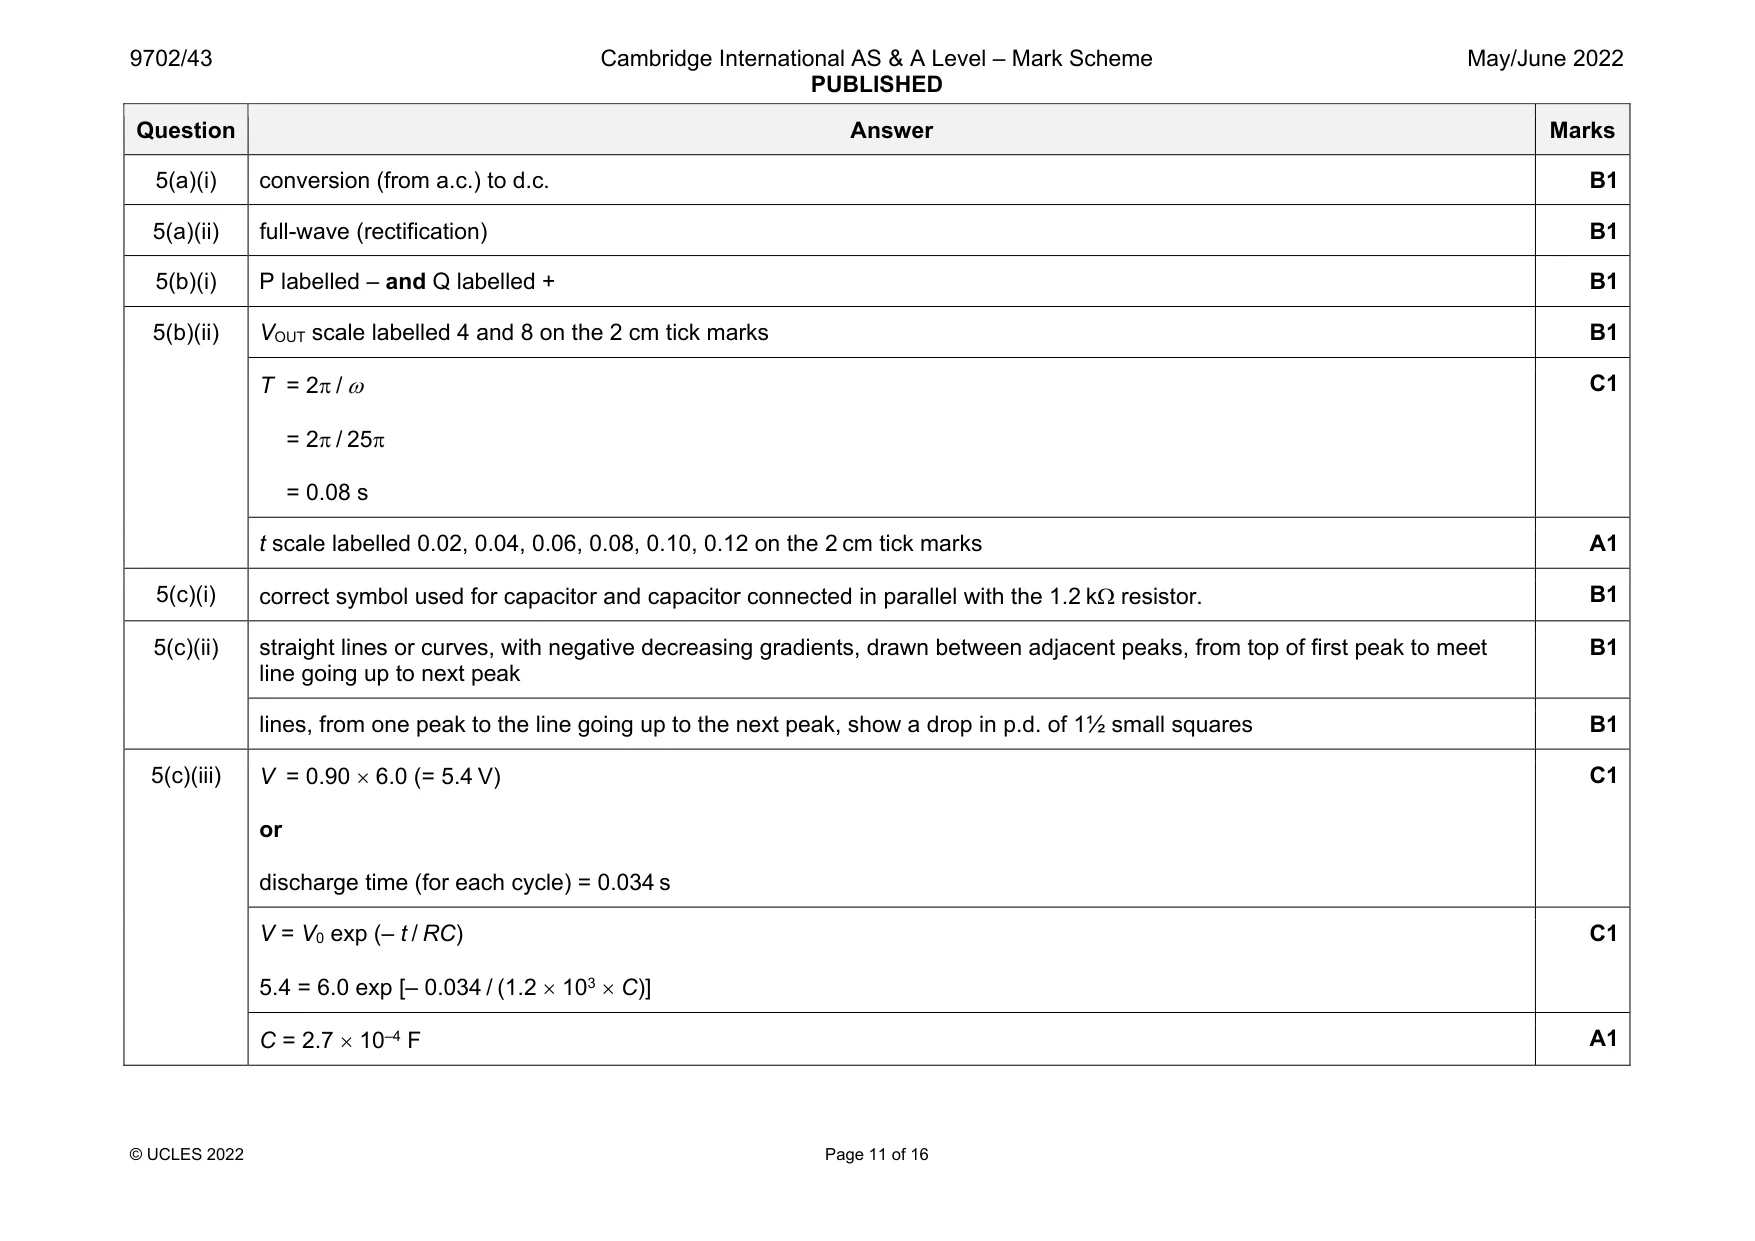
Mark scheme: 5(a)(i) conversion (from a.c.) to d.c. B1 5(a)(ii) full-wave (rectification) B1 5(b)(i) P labelled – and Q labelled + B1 5(b)(ii) VOUT scale labelled 4 and 8 on the 2 cm tick marks B1 T = 2 / = 2 / 25 = 0.08 s C1 t scale labelled 0.02, 0.04, 0.06, 0.08, 0.10, 0.12 on the 2 cm tick marks A1 5(c)(i) correct symbol used for capacitor and capacitor connected in parallel with the 1.2 k resistor. B1 5(c)(ii) straight lines or curves, with negative decreasing gradients, drawn between adjacent peaks, from top of first peak to meet line going up to next peak B1 lines, from one peak to the line going up to the next peak, show a drop in p.d. of 1½ small squares B1 5(c)(iii) V = 0.90 6.0 (= 5.4 V) or discharge time (for each cycle) = 0.034 s C1 V = V0 exp (– t / RC) 5.4 = 6.0 exp [– 0.034 / (1.2 103 C)] C1 C = 2.7 10–4 F A1
Question 6
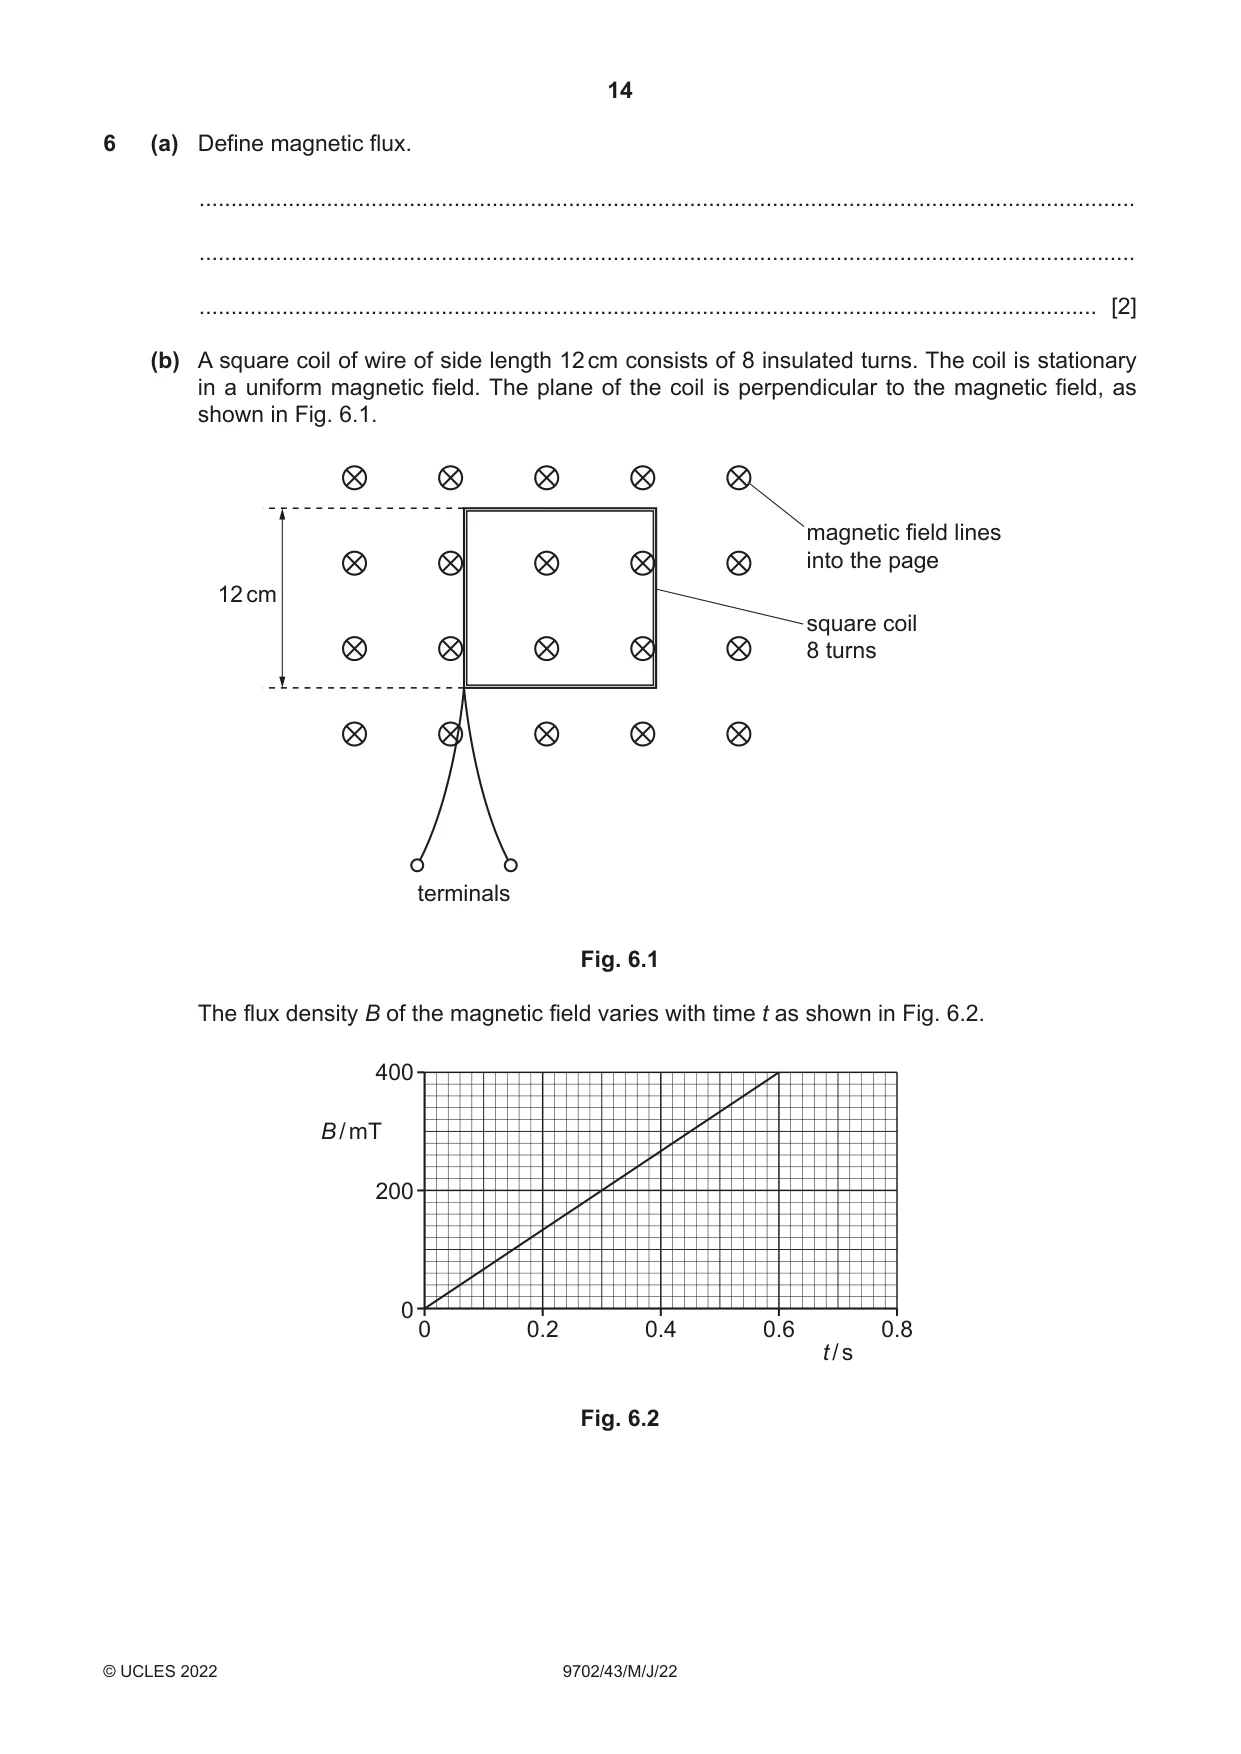
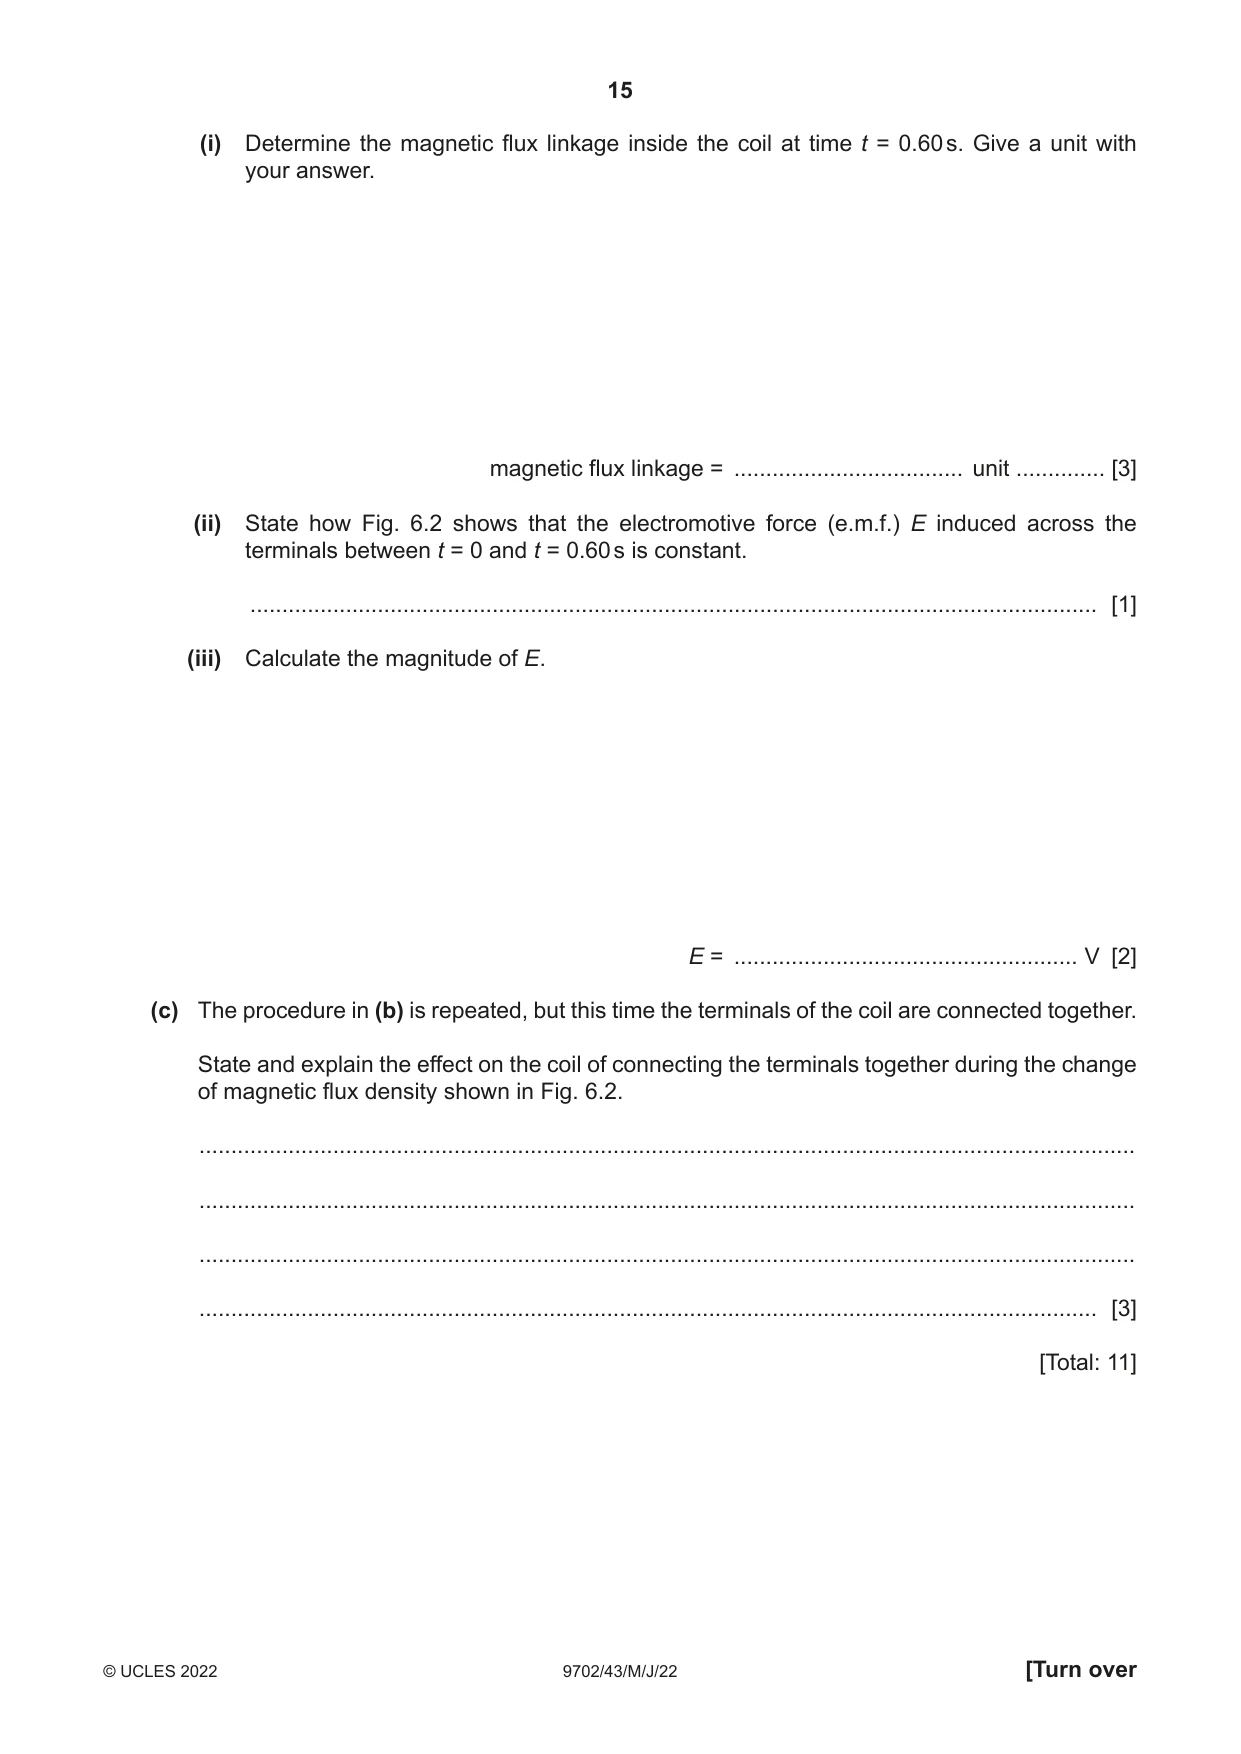
6 (a) Define magnetic flux. ................................................................................................................................................... ................................................................................................................................................... ............................................................................................................................................. [2] (b) A square coil of wire of side length 12 cm consists of 8 insulated turns. The coil is stationary in a uniform magnetic field. The plane of the coil is perpendicular to the magnetic field, as shown in Fig. 6.1. magnetic field lines into the page 12 cm square coil 8 turns terminals Fig. 6.1 The flux density B of the magnetic field varies with time t as shown in Fig. 6.2. 400 B / mT 200 0 0 0.2 0.4 0.6 0.8 t / s Fig. 6.2 (i) Determine the magnetic flux linkage inside the coil at time t = 0.60 s. Give a unit with your answer. magnetic flux linkage = .................................... unit .............. [3] (ii) State how Fig. 6.2 shows that the electromotive force (e.m.f.) E induced across the terminals between t = 0 and t = 0.60 s is constant. ..................................................................................................................................... [1] (iii) Calculate the magnitude of E. E = ...................................................... V [2] (c) The procedure in (b) is repeated, but this time the terminals of the coil are connected together. State and explain the effect on the coil of connecting the terminals together during the change of magnetic flux density shown in Fig. 6.2. ................................................................................................................................................... ................................................................................................................................................... ................................................................................................................................................... ............................................................................................................................................. [3] [Total: 11]
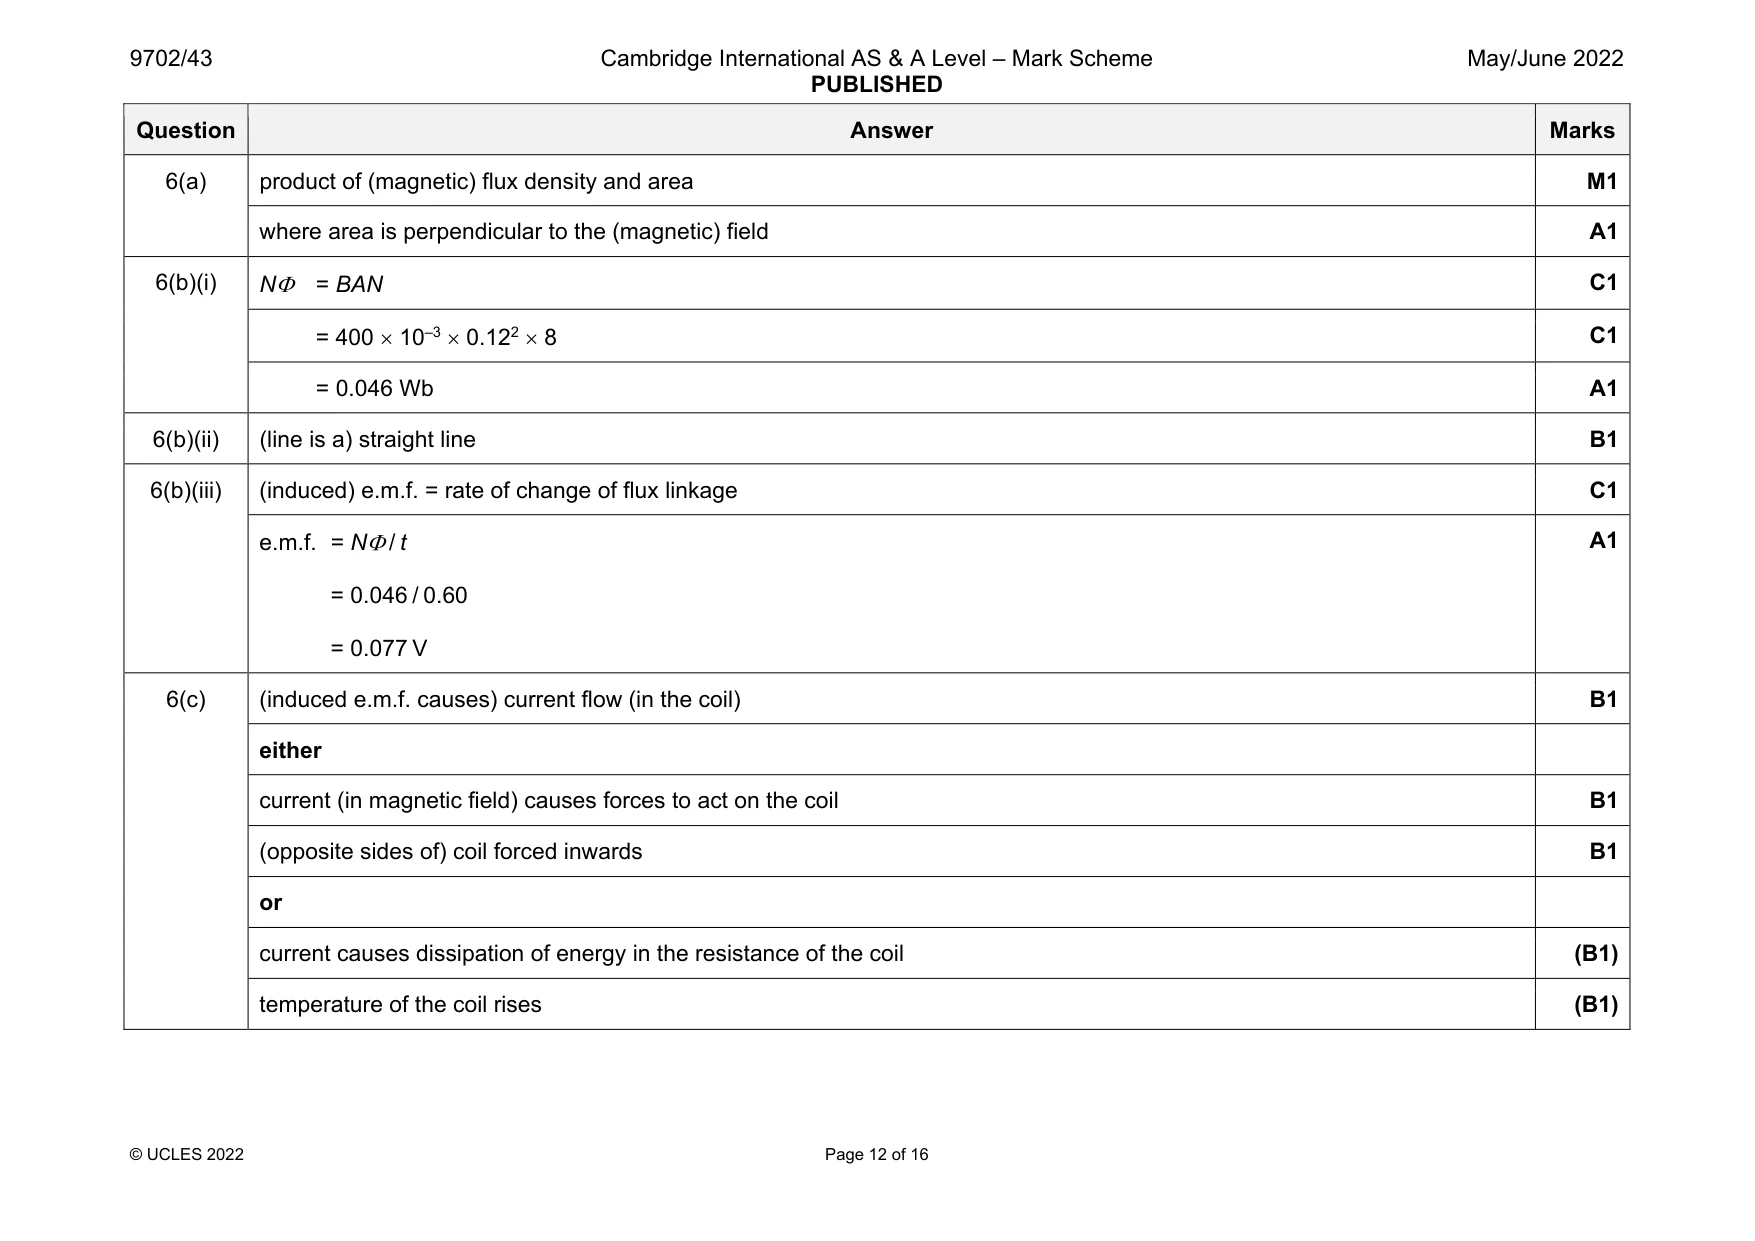
Mark scheme: 6(a) product of (magnetic) flux density and area M1 where area is perpendicular to the (magnetic) field A1 6(b)(i) N = BAN C1 = 400 10–3 0.122 8 C1 = 0.046 Wb A1 6(b)(ii) (line is a) straight line B1 6(b)(iii) (induced) e.m.f. = rate of change of flux linkage C1 e.m.f. = N / t = 0.046 / 0.60 = 0.077 V A1 6(c) (induced e.m.f. causes) current flow (in the coil) B1 either current (in magnetic field) causes forces to act on the coil B1 (opposite sides of) coil forced inwards B1 or current causes dissipation of energy in the resistance of the coil (B1) temperature of the coil rises (B1)
Q7 · State what is meant by a photon
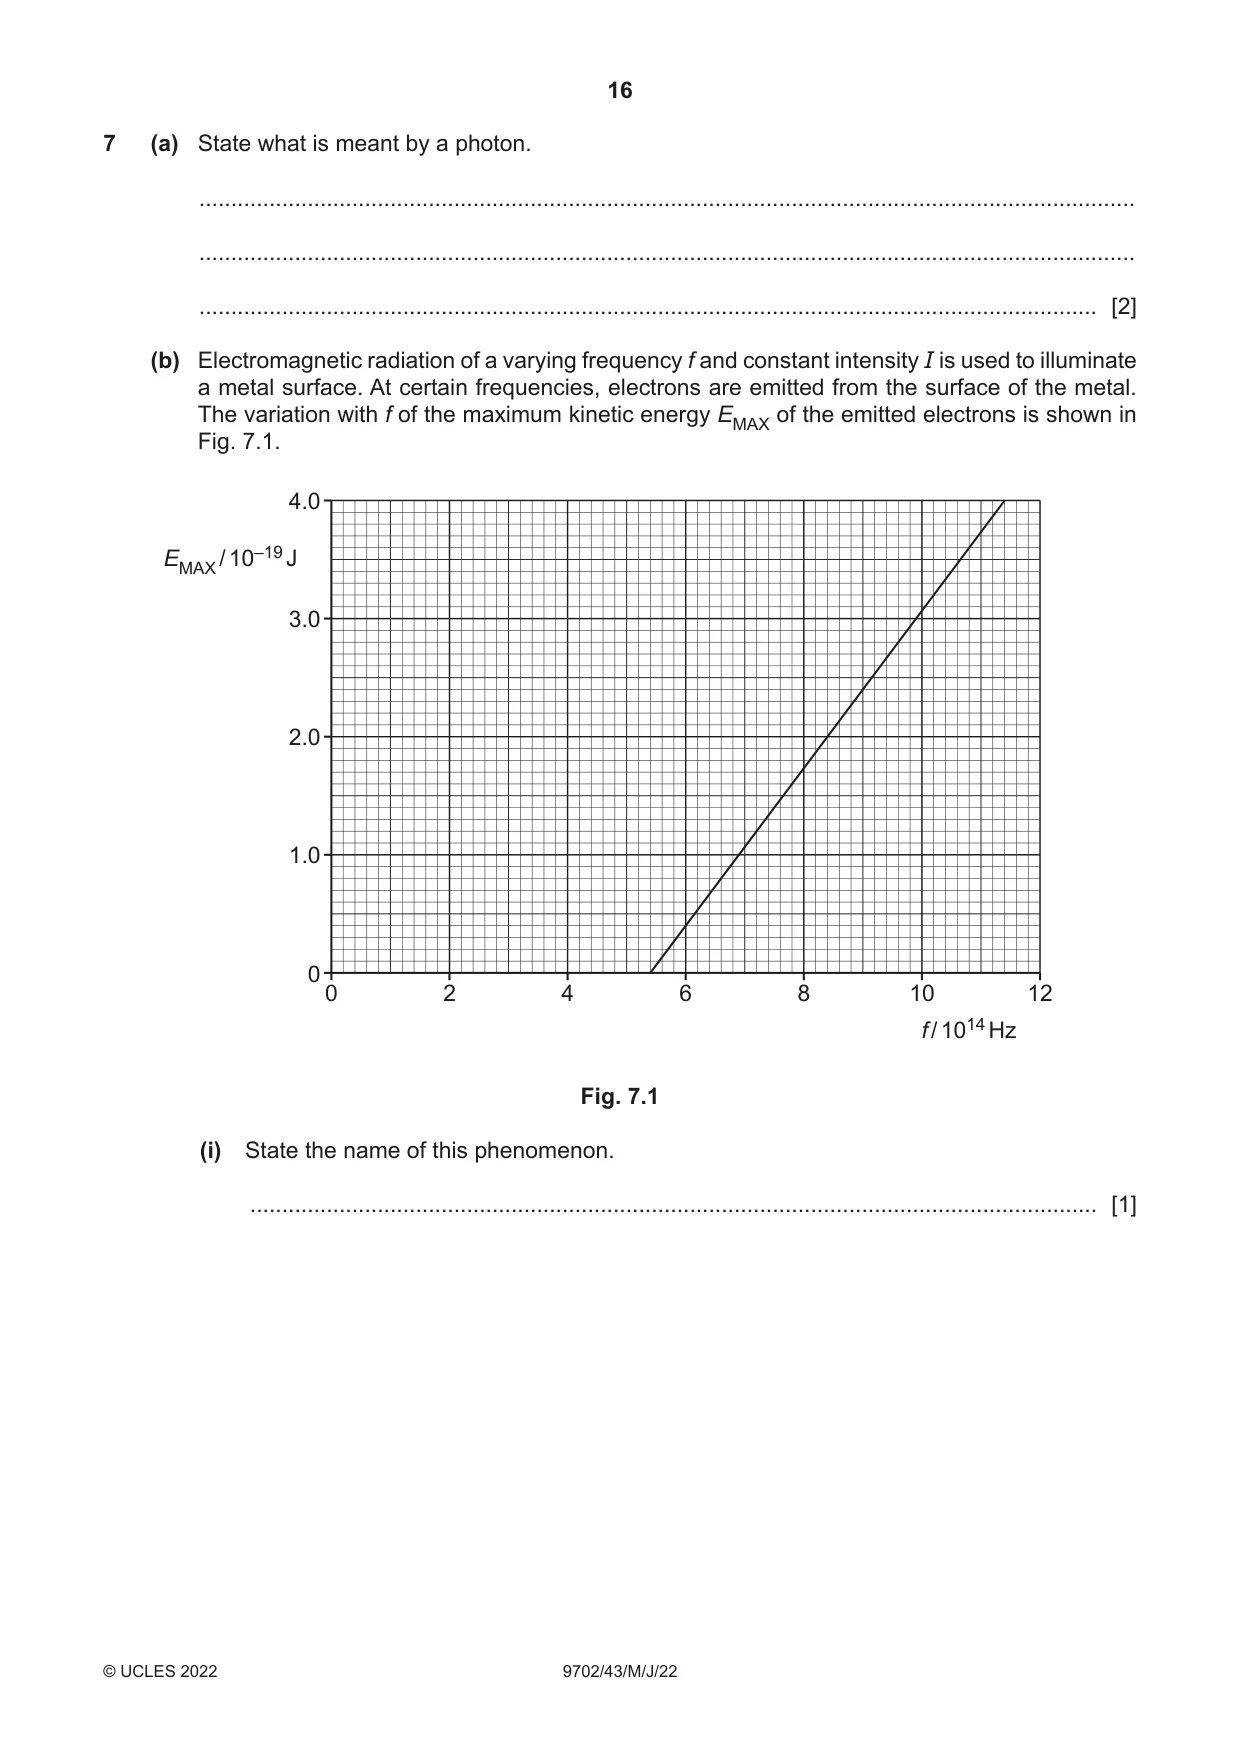
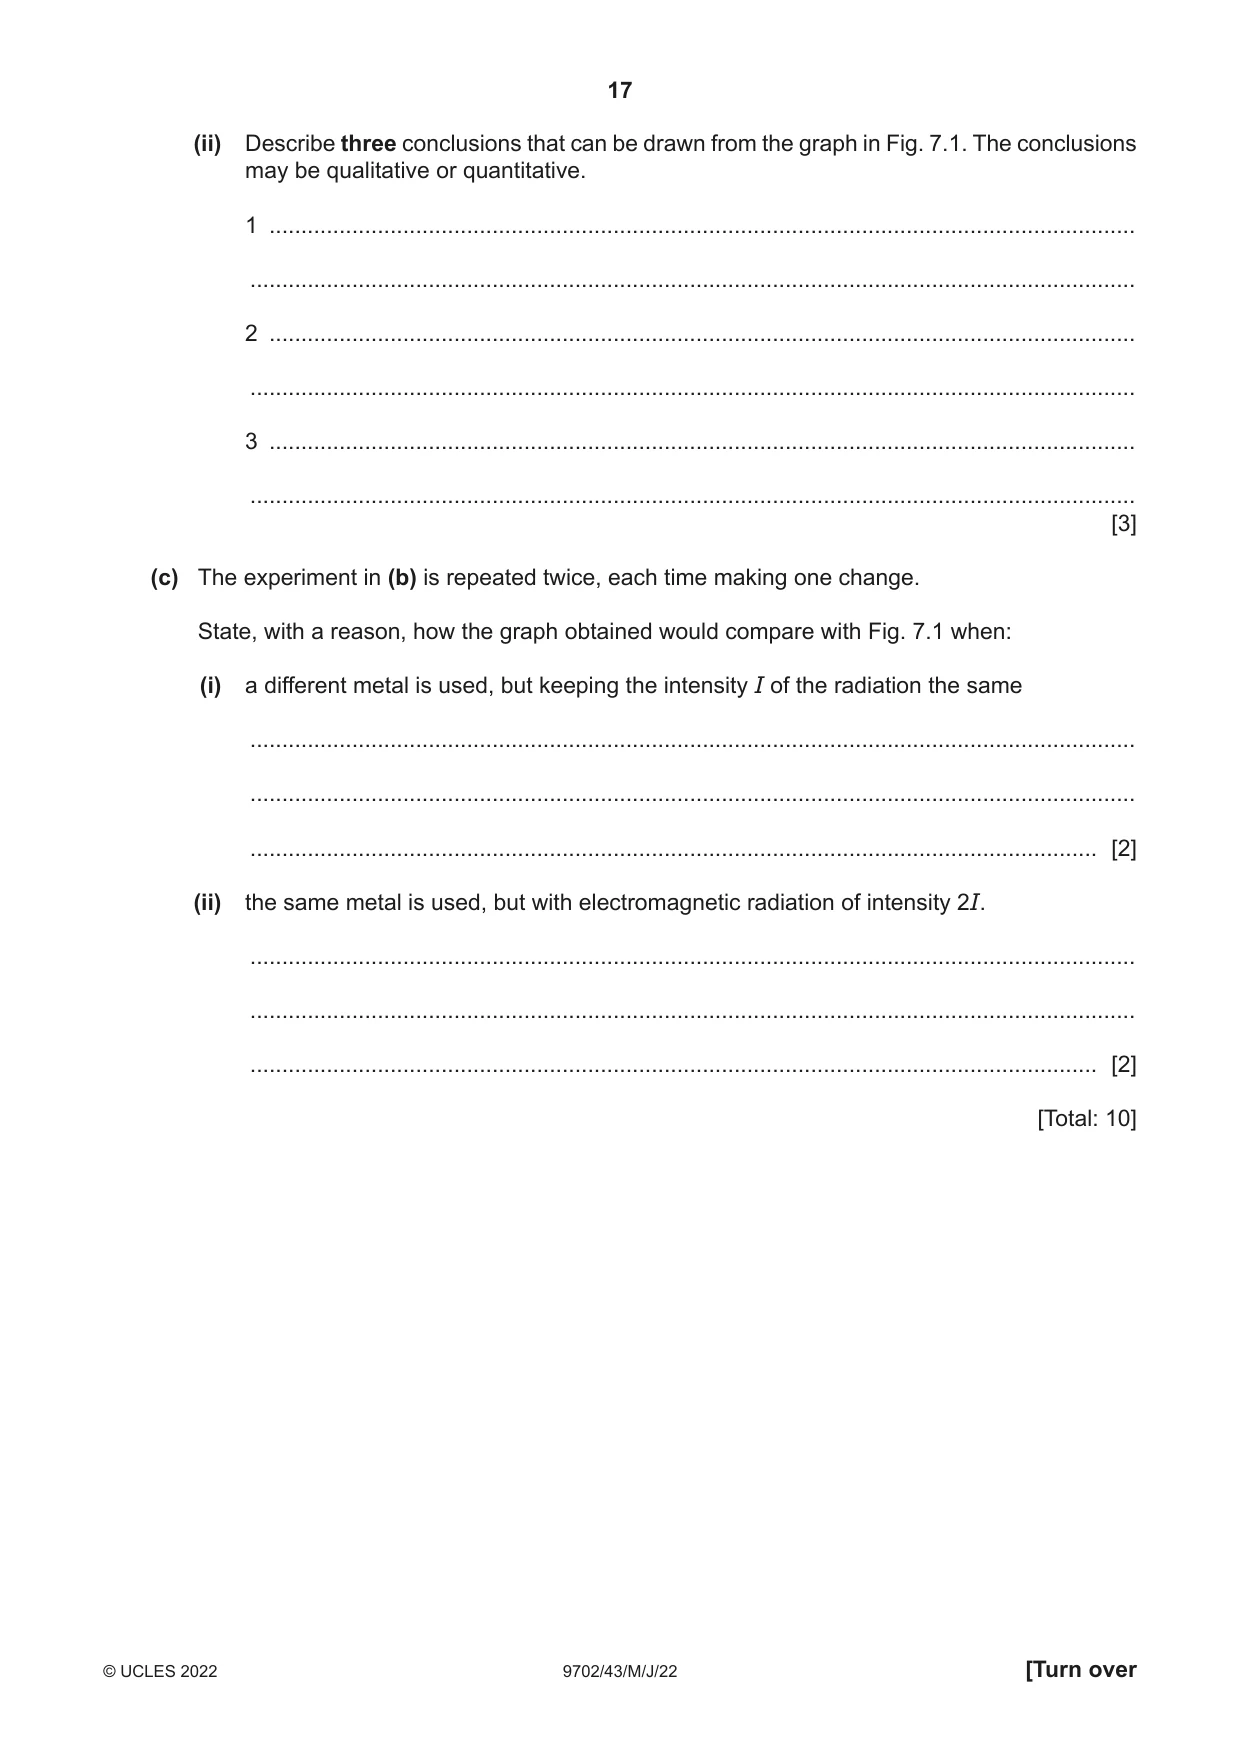
7 (a) State what is meant by a photon. ................................................................................................................................................... ................................................................................................................................................... ............................................................................................................................................. [2] (b) Electromagnetic radiation of a varying frequency f and constant intensity I is used to illuminate a metal surface. At certain frequencies, electrons are emitted from the surface of the metal. The variation with f of the maximum kinetic energy EMAX of the emitted electrons is shown in Fig. 7.1. 4.0 EMAX / 10–19 J 3.0 2.0 1.0 0 0 2 4 6 8 10 12 f / 1014 Hz Fig. 7.1 (i) State the name of this phenomenon. ..................................................................................................................................... [1] (ii) Describe three conclusions that can be drawn from the graph in Fig. 7.1. The conclusions may be qualitative or quantitative. 1 ........................................................................................................................................ ........................................................................................................................................... 2 ........................................................................................................................................ ........................................................................................................................................... 3 ........................................................................................................................................ ........................................................................................................................................... [3] (c) The experiment in (b) is repeated twice, each time making one change. State, with a reason, how the graph obtained would compare with Fig. 7.1 when: (i) a different metal is used, but keeping the intensity I of the radiation the same ........................................................................................................................................... ........................................................................................................................................... ..................................................................................................................................... [2] (ii) the same metal is used, but with electromagnetic radiation of intensity 2I. ........................................................................................................................................... ........................................................................................................................................... ..................................................................................................................................... [2] [Total: 10]
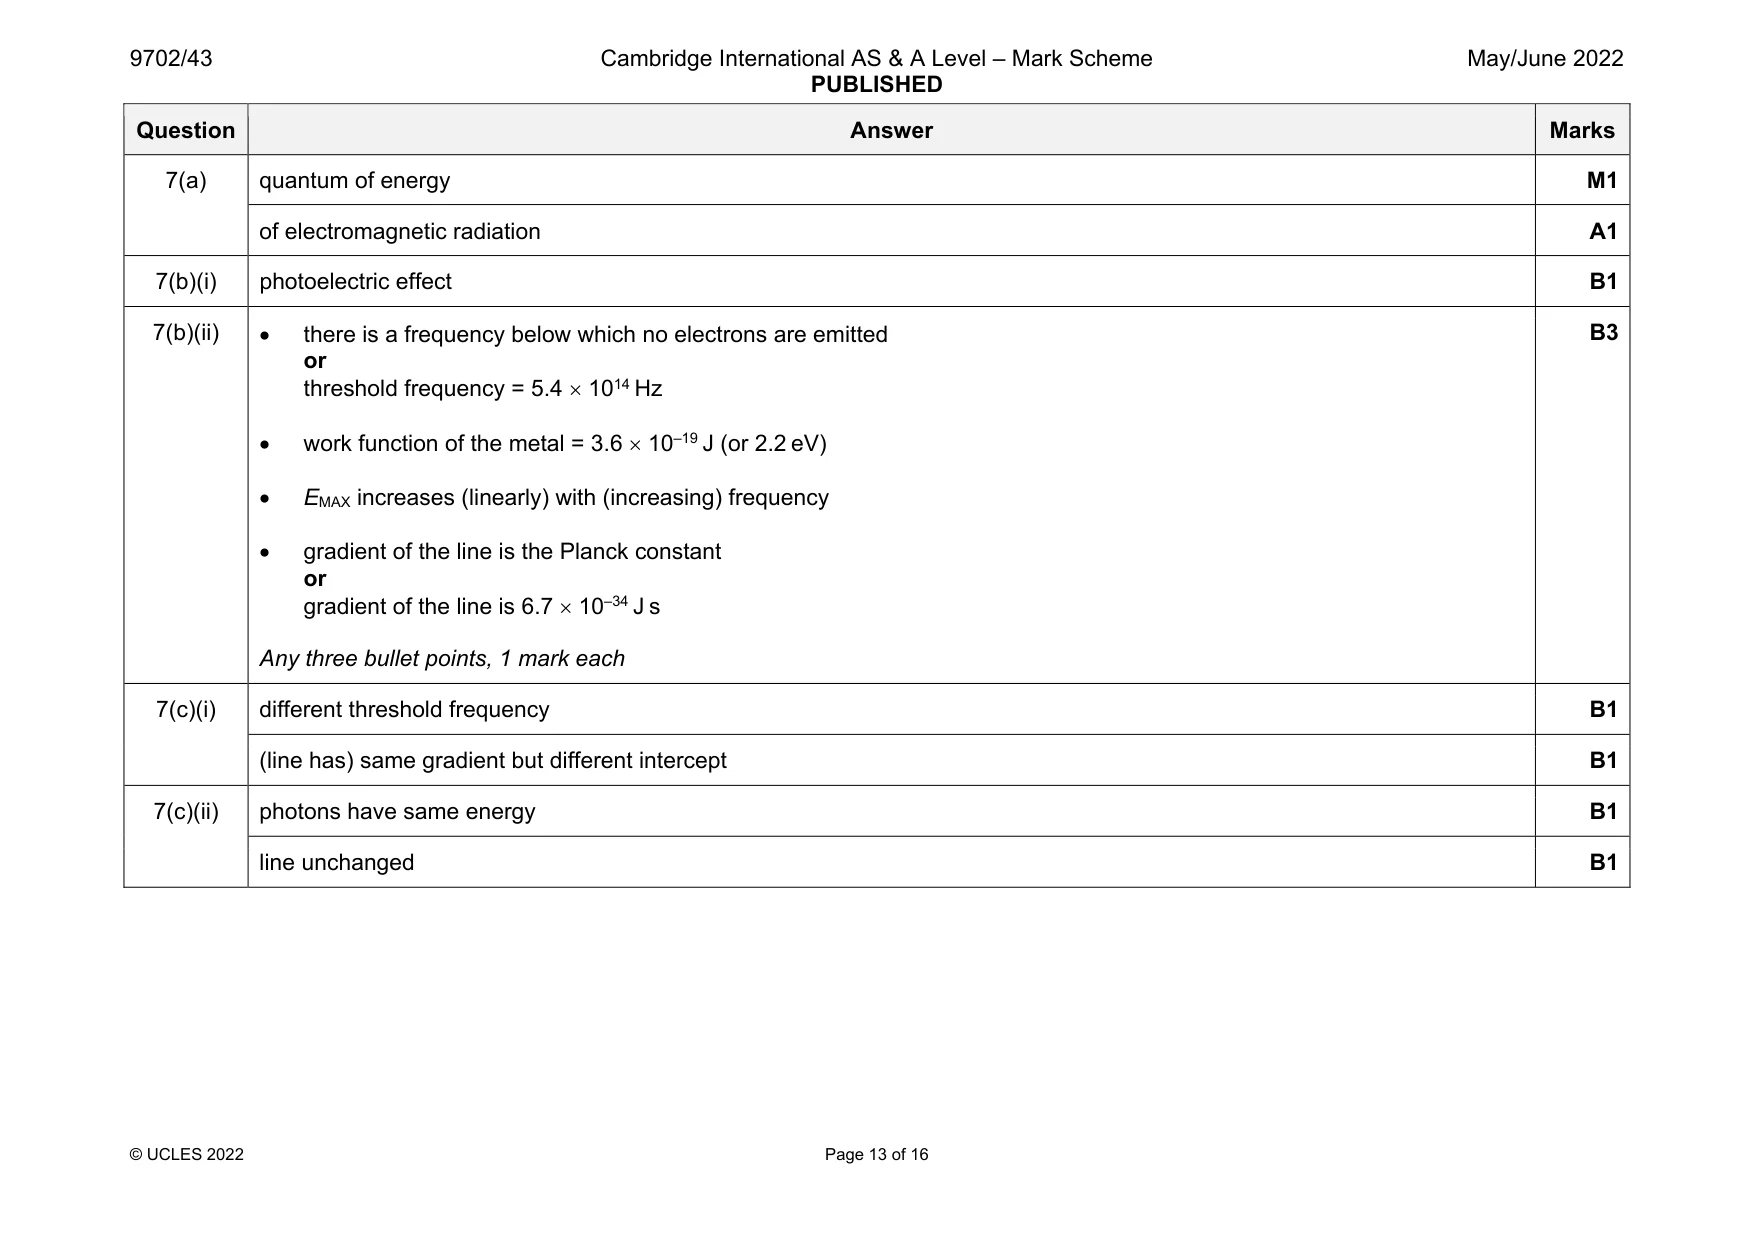
Mark scheme: 7(a) quantum of energy M1 of electromagnetic radiation A1 7(b)(i) photoelectric effect B1 7(b)(ii) there is a frequency below which no electrons are emitted or threshold frequency = 5.4 1014 Hz work function of the metal = 3.6 10–19 J (or 2.2 eV) EMAX increases (linearly) with (increasing) frequency gradient of the line is the Planck constant or gradient of the line is 6.7 10–34 J s Any three bullet points, 1 mark each B3 7(c)(i) different threshold frequency B1 (line has) same gradient but different intercept B1 7(c)(ii) photons have same energy B1 line unchanged B1
Q8 · State what is meant by nuclear binding energy
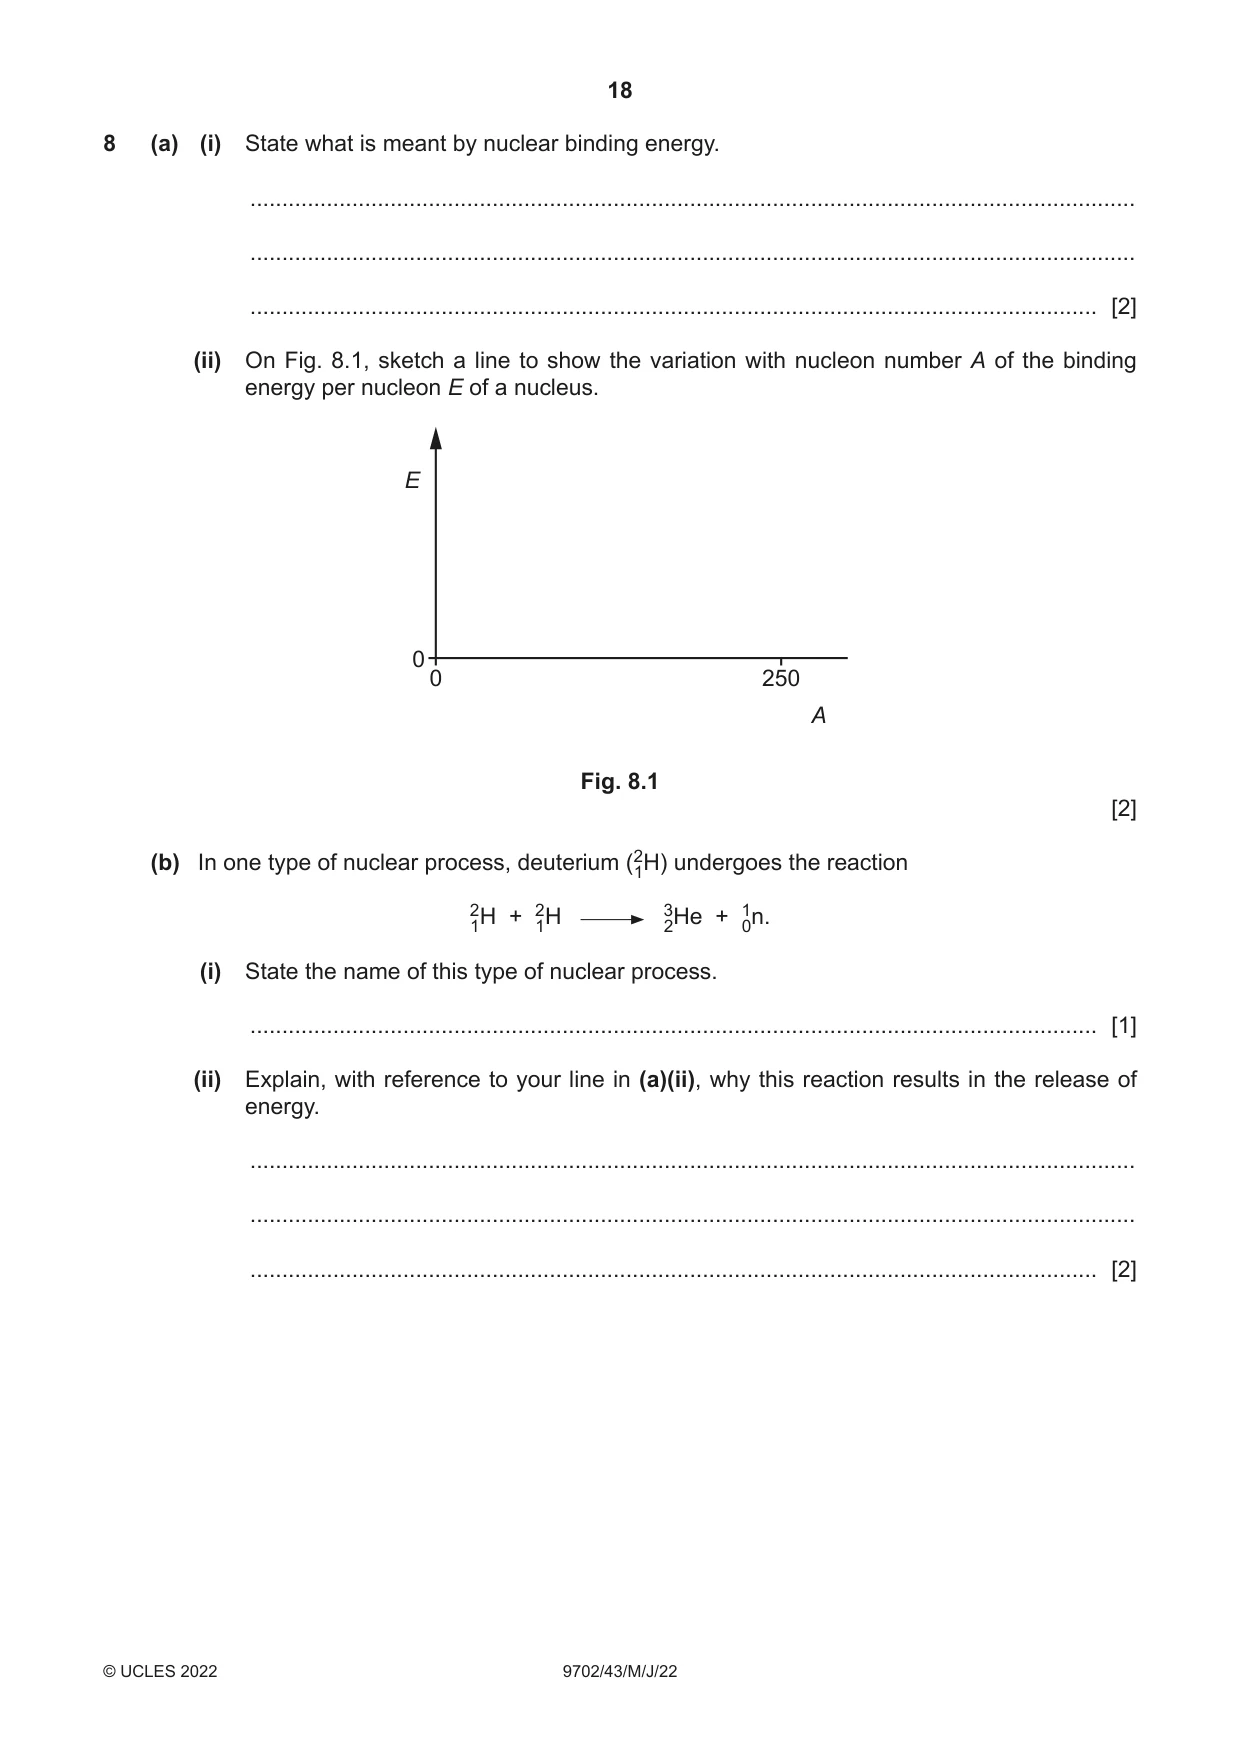
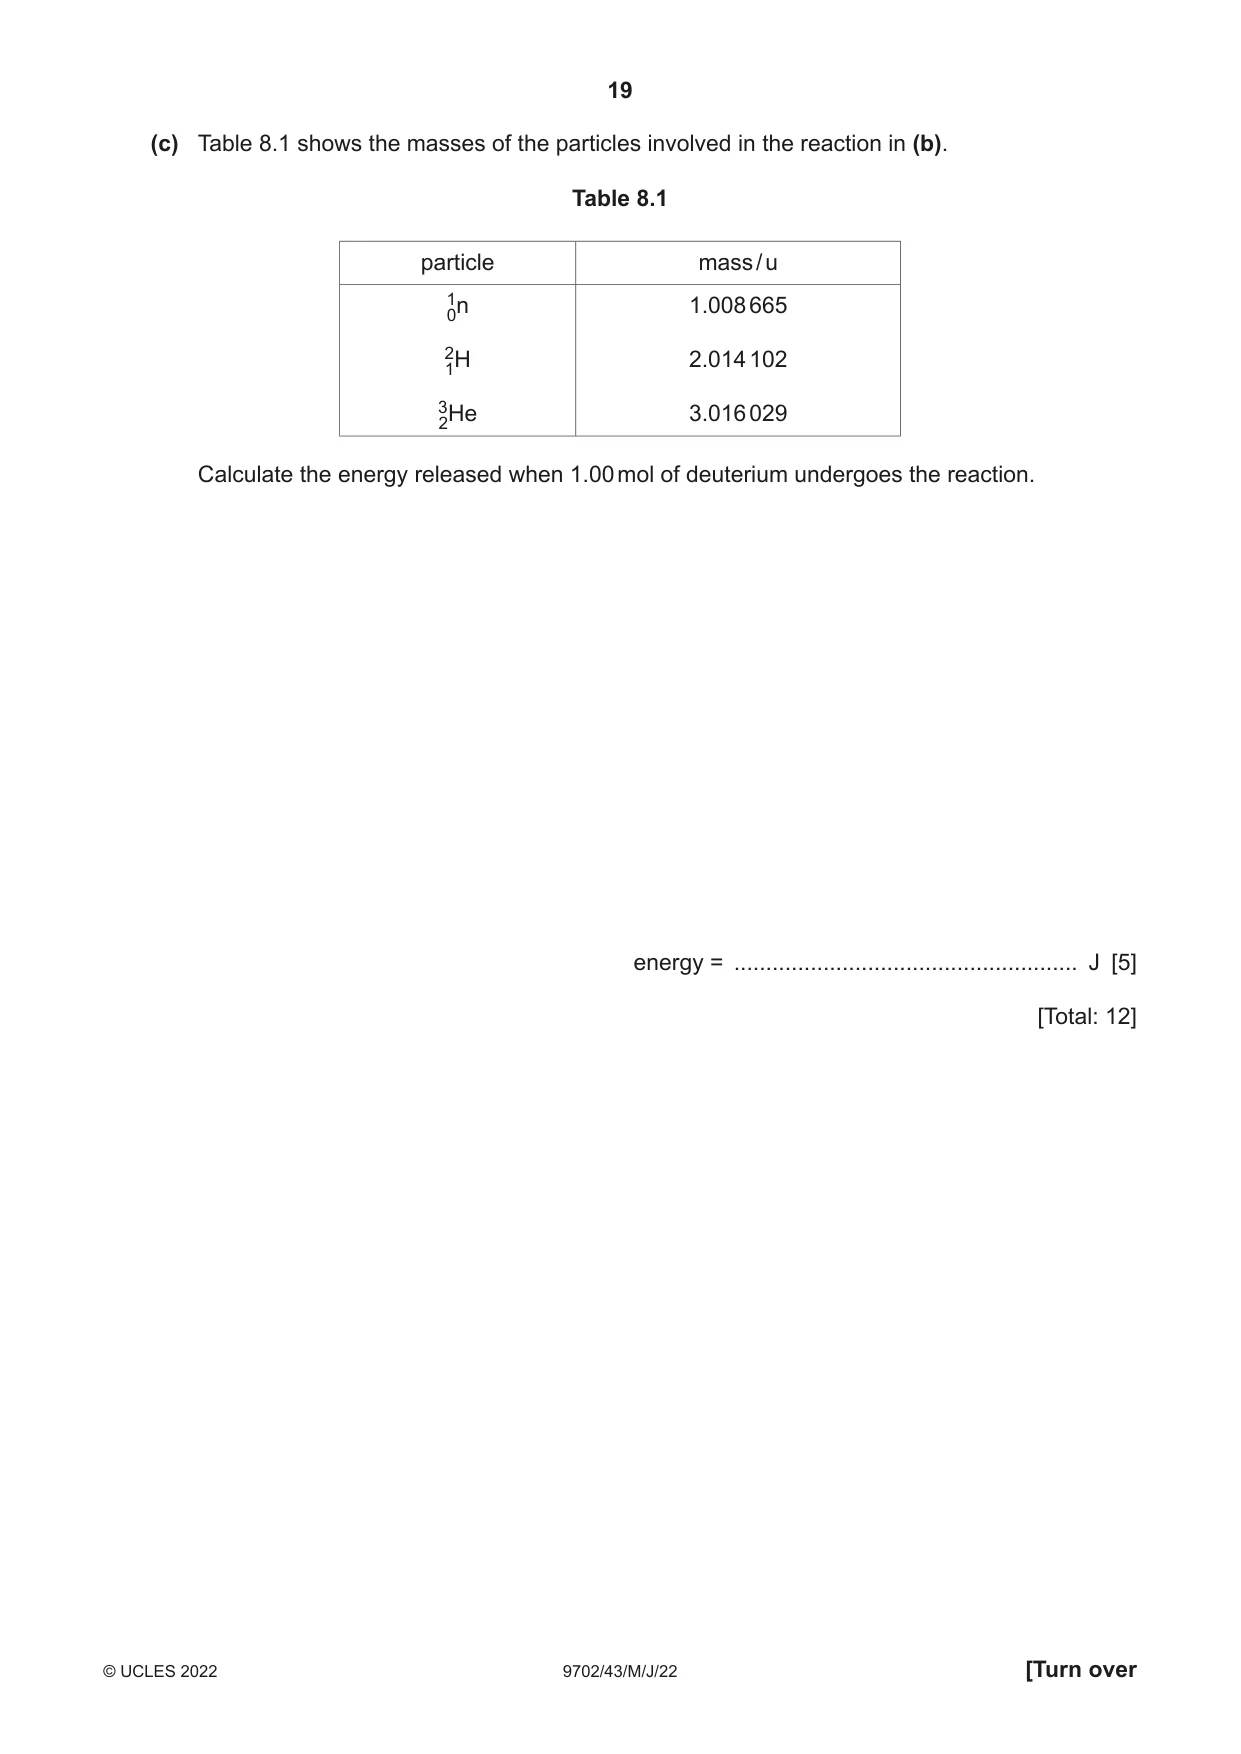
8 (a) (i) State what is meant by nuclear binding energy. ........................................................................................................................................... ........................................................................................................................................... ..................................................................................................................................... [2] (ii) On Fig. 8.1, sketch a line to show the variation with nucleon number A of the binding energy per nucleon E of a nucleus. E 0 0 250 A Fig. 8.1 [2] (b) In one type of nuclear process, deuterium (21H) undergoes the reaction 21H + 21H 32He + 10n. (i) State the name of this type of nuclear process. ..................................................................................................................................... [1] (ii) Explain, with reference to your line in (a)(ii), why this reaction results in the release of energy. ........................................................................................................................................... ........................................................................................................................................... ..................................................................................................................................... [2] (c) Table 8.1 shows the masses of the particles involved in the reaction in (b). Table 8.1 particle mass / u 10n 1.008 665 21H 2.014 102 32He 3.016 029 Calculate the energy released when 1.00 mol of deuterium undergoes the reaction. energy = ...................................................... J [5] [Total: 12]
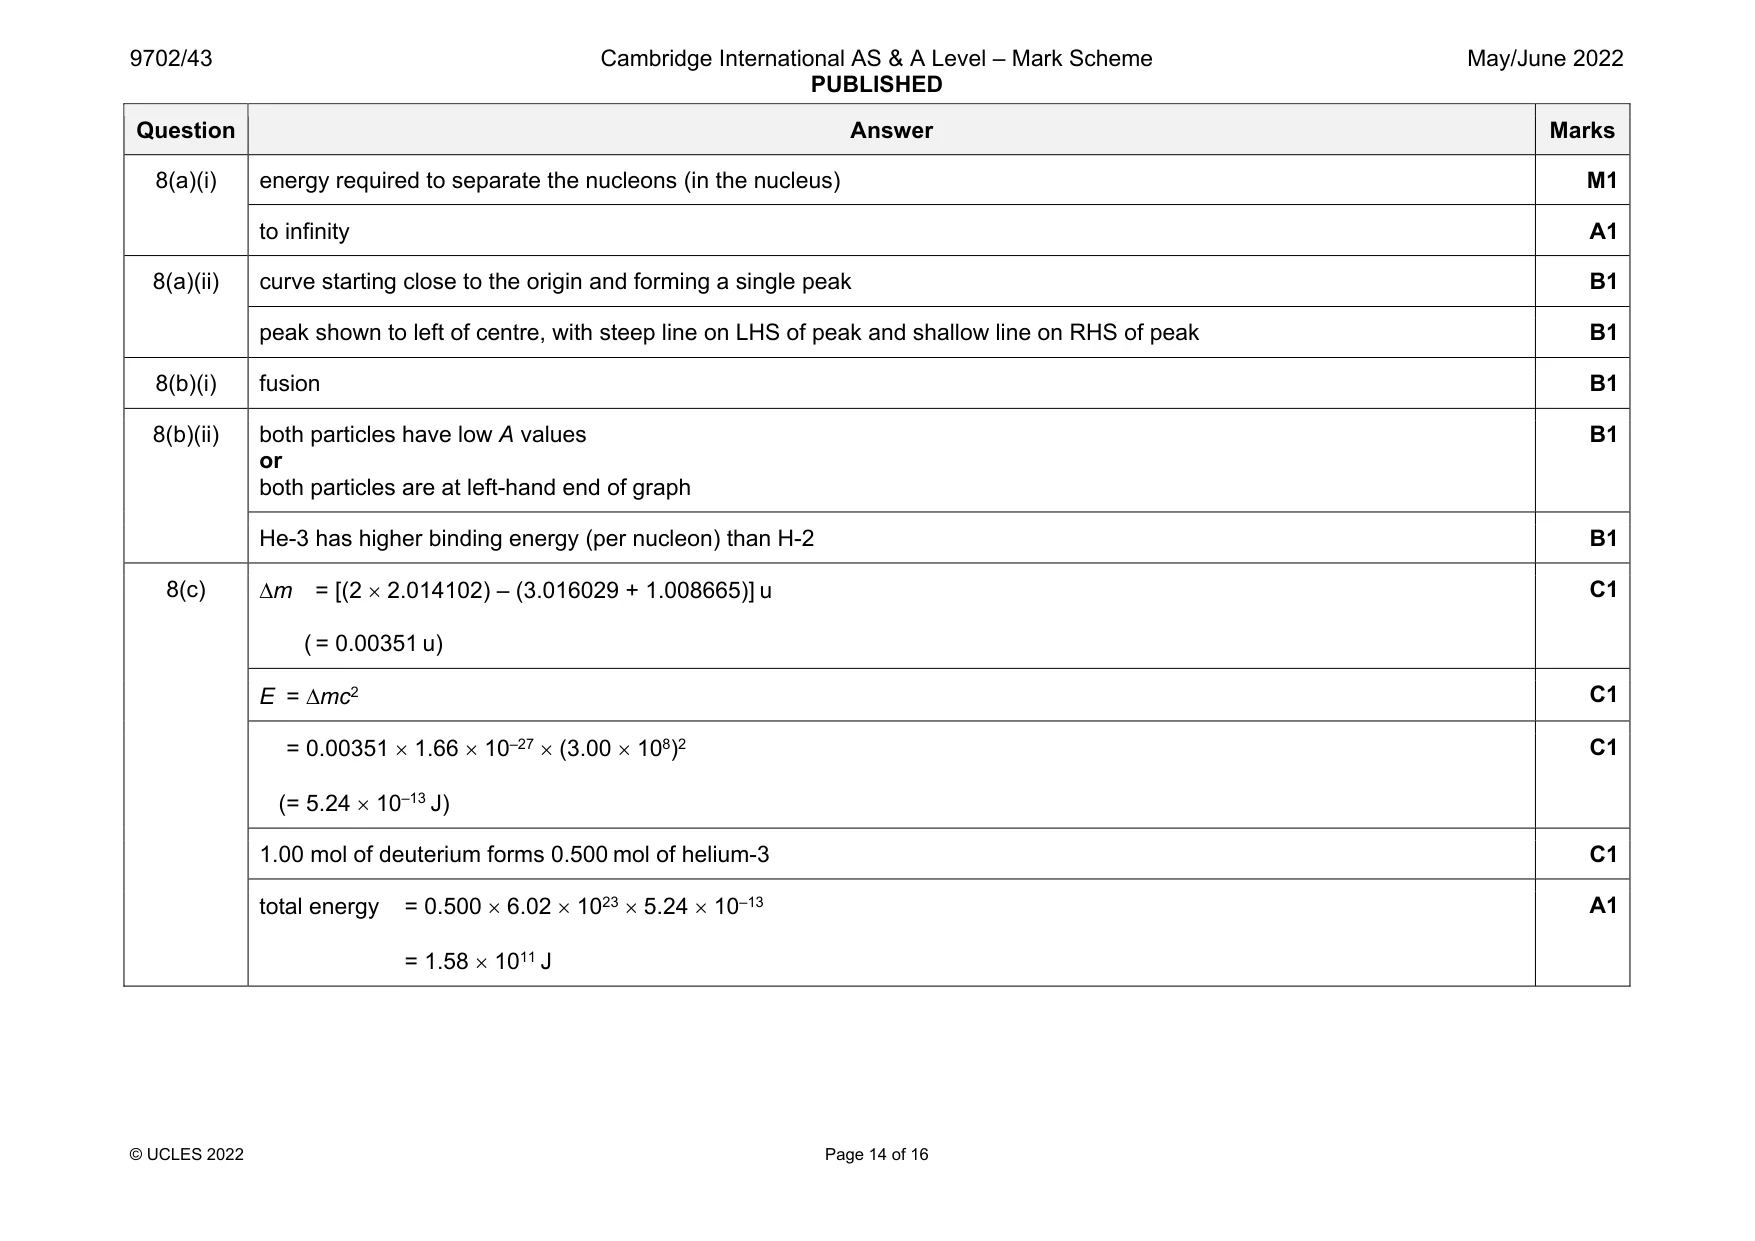
Mark scheme: 8(a)(i) energy required to separate the nucleons (in the nucleus) M1 to infinity A1 8(a)(ii) curve starting close to the origin and forming a single peak B1 peak shown to left of centre, with steep line on LHS of peak and shallow line on RHS of peak B1 8(b)(i) fusion B1 8(b)(ii) both particles have low A values or both particles are at left-hand end of graph B1 He-3 has higher binding energy (per nucleon) than H-2 B1 8(c) m = [(2 2.014102) – (3.016029 + 1.008665)] u ( = 0.00351 u) C1 E = mc2 C1 = 0.00351 1.66 10–27 (3.00 108)2 ( = 5.24 10–13 J) C1 1.00 mol of deuterium forms 0.500 mol of helium-3 C1 total energy = 0.500 6.02 1023 5.24 10–13 = 1.58 1011 J A1
Q9 · Explain how X-rays are produced for use in medical diagnosis
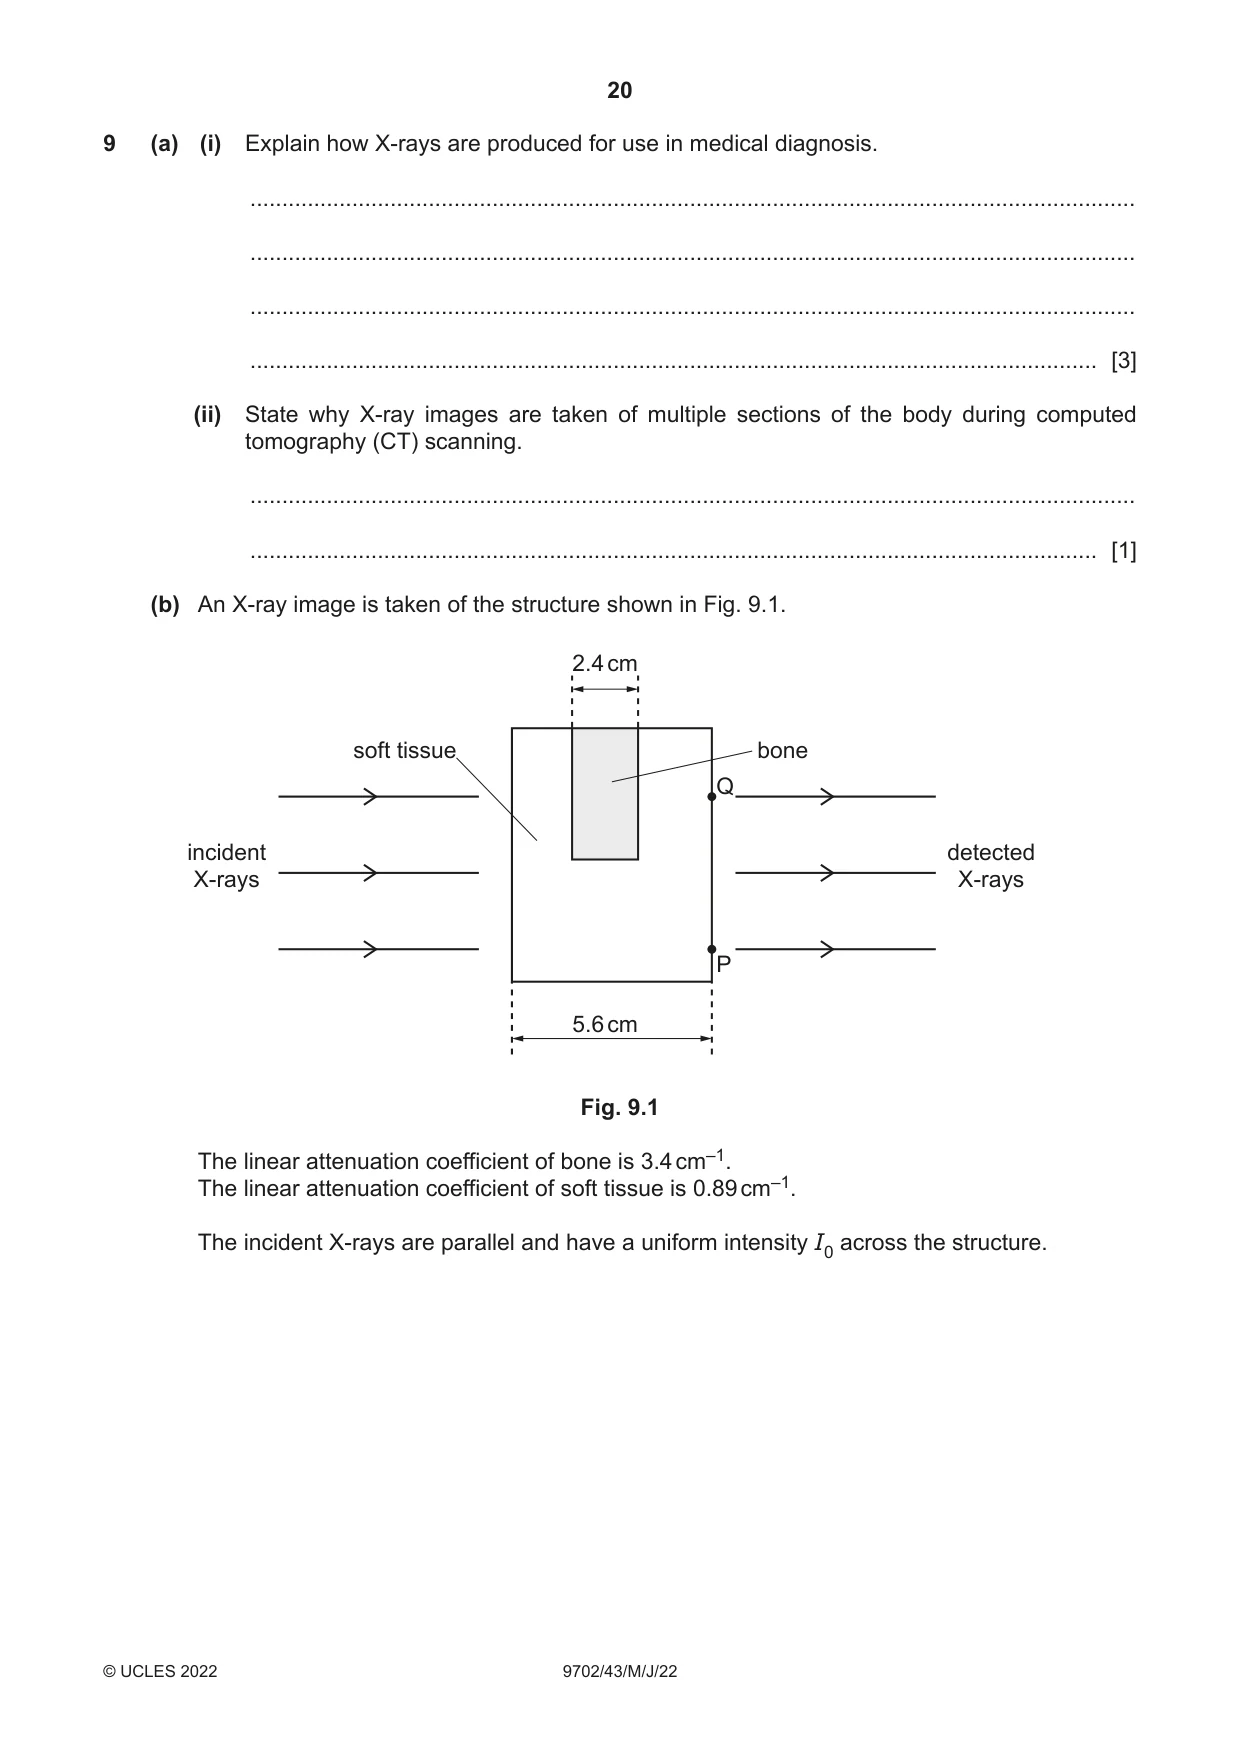
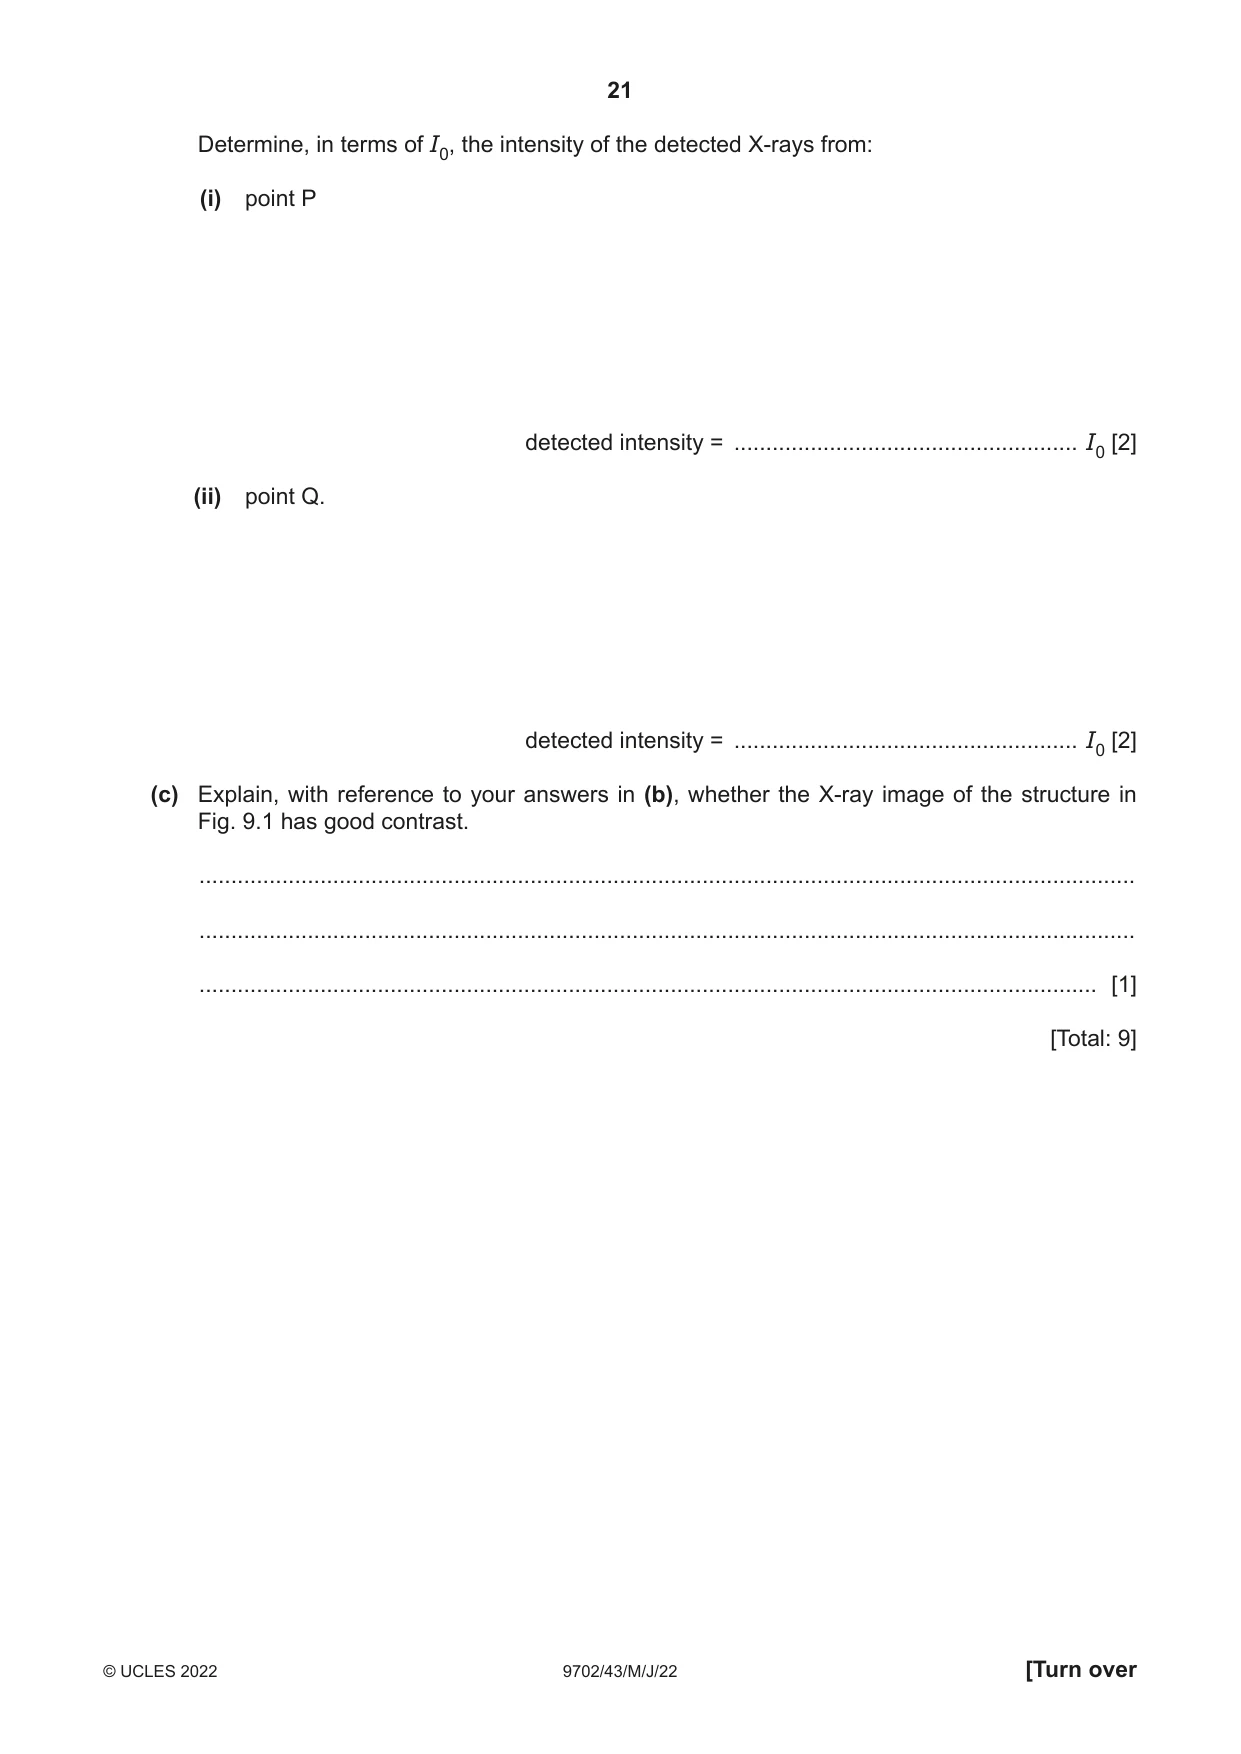
9 (a) (i) Explain how X-rays are produced for use in medical diagnosis. ........................................................................................................................................... ........................................................................................................................................... ........................................................................................................................................... ..................................................................................................................................... [3] (ii) State why X-ray images are taken of multiple sections of the body during computed tomography (CT) scanning. ........................................................................................................................................... ..................................................................................................................................... [1] (b) An X-ray image is taken of the structure shown in Fig. 9.1. 2.4 cm soft tissue bone Q incident detected X-rays X-rays P 5.6 cm Fig. 9.1 The linear attenuation coefficient of bone is 3.4 cm–1. The linear attenuation coefficient of soft tissue is 0.89 cm–1. The incident X-rays are parallel and have a uniform intensity I0 across the structure. Determine, in terms of I0, the intensity of the detected X-rays from: (i) point P detected intensity = ...................................................... I0 [2] (ii) point Q. detected intensity = ...................................................... I0 [2] (c) Explain, with reference to your answers in (b), whether the X-ray image of the structure in Fig. 9.1 has good contrast. ................................................................................................................................................... ................................................................................................................................................... ............................................................................................................................................. [1] [Total: 9]
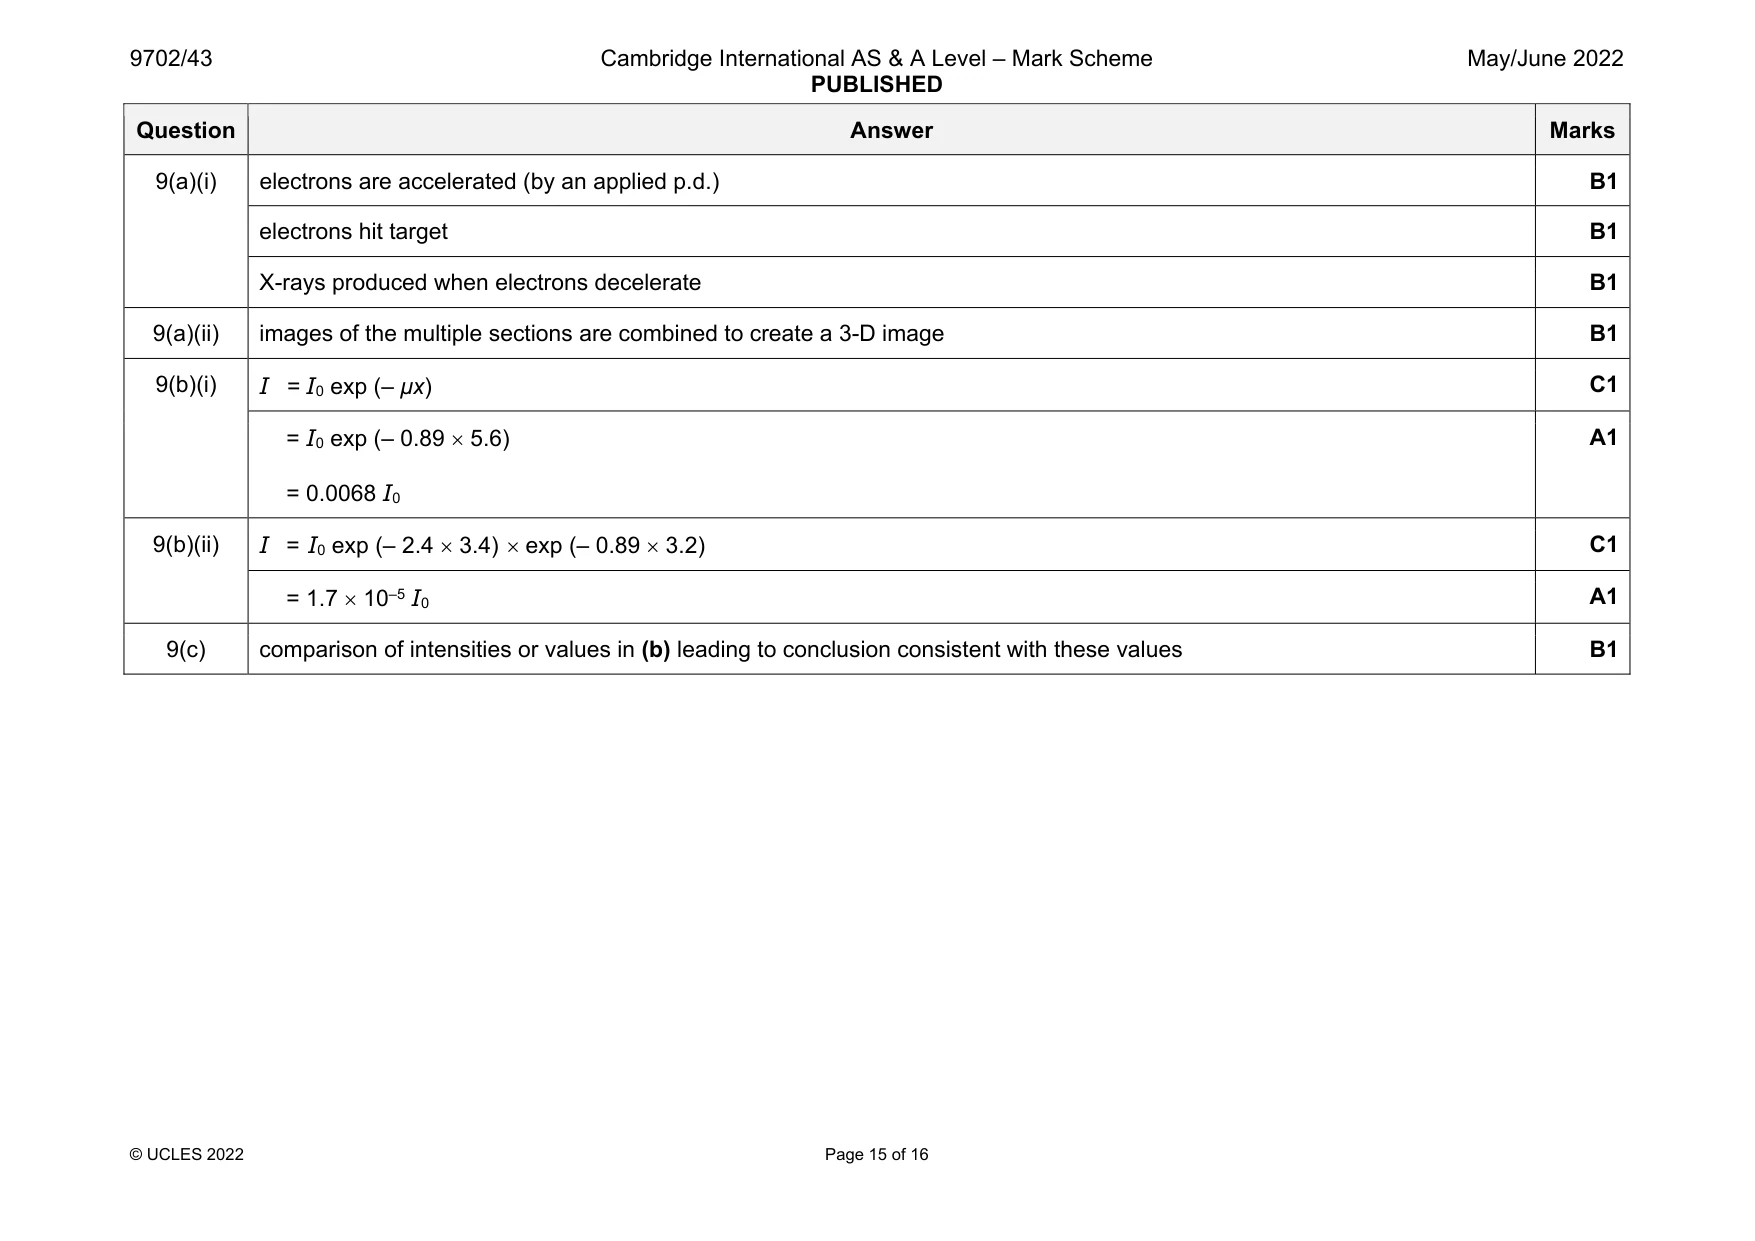
Mark scheme: 9(a)(i) electrons are accelerated (by an applied p.d.) B1 electrons hit target B1 X-rays produced when electrons decelerate B1 9(a)(ii) images of the multiple sections are combined to create a 3-D image B1 9(b)(i) I = I0 exp (– μx) C1 = I0 exp (– 0.89 5.6) = 0.0068 I0 A1 9(b)(ii) I = I0 exp (– 2.4 3.4) exp (– 0.89 3.2) C1 = 1.7 10–5 I0 A1 9(c) comparison of intensities or values in (b) leading to conclusion consistent with these values B1
Q10 · State Wien’s displacement law
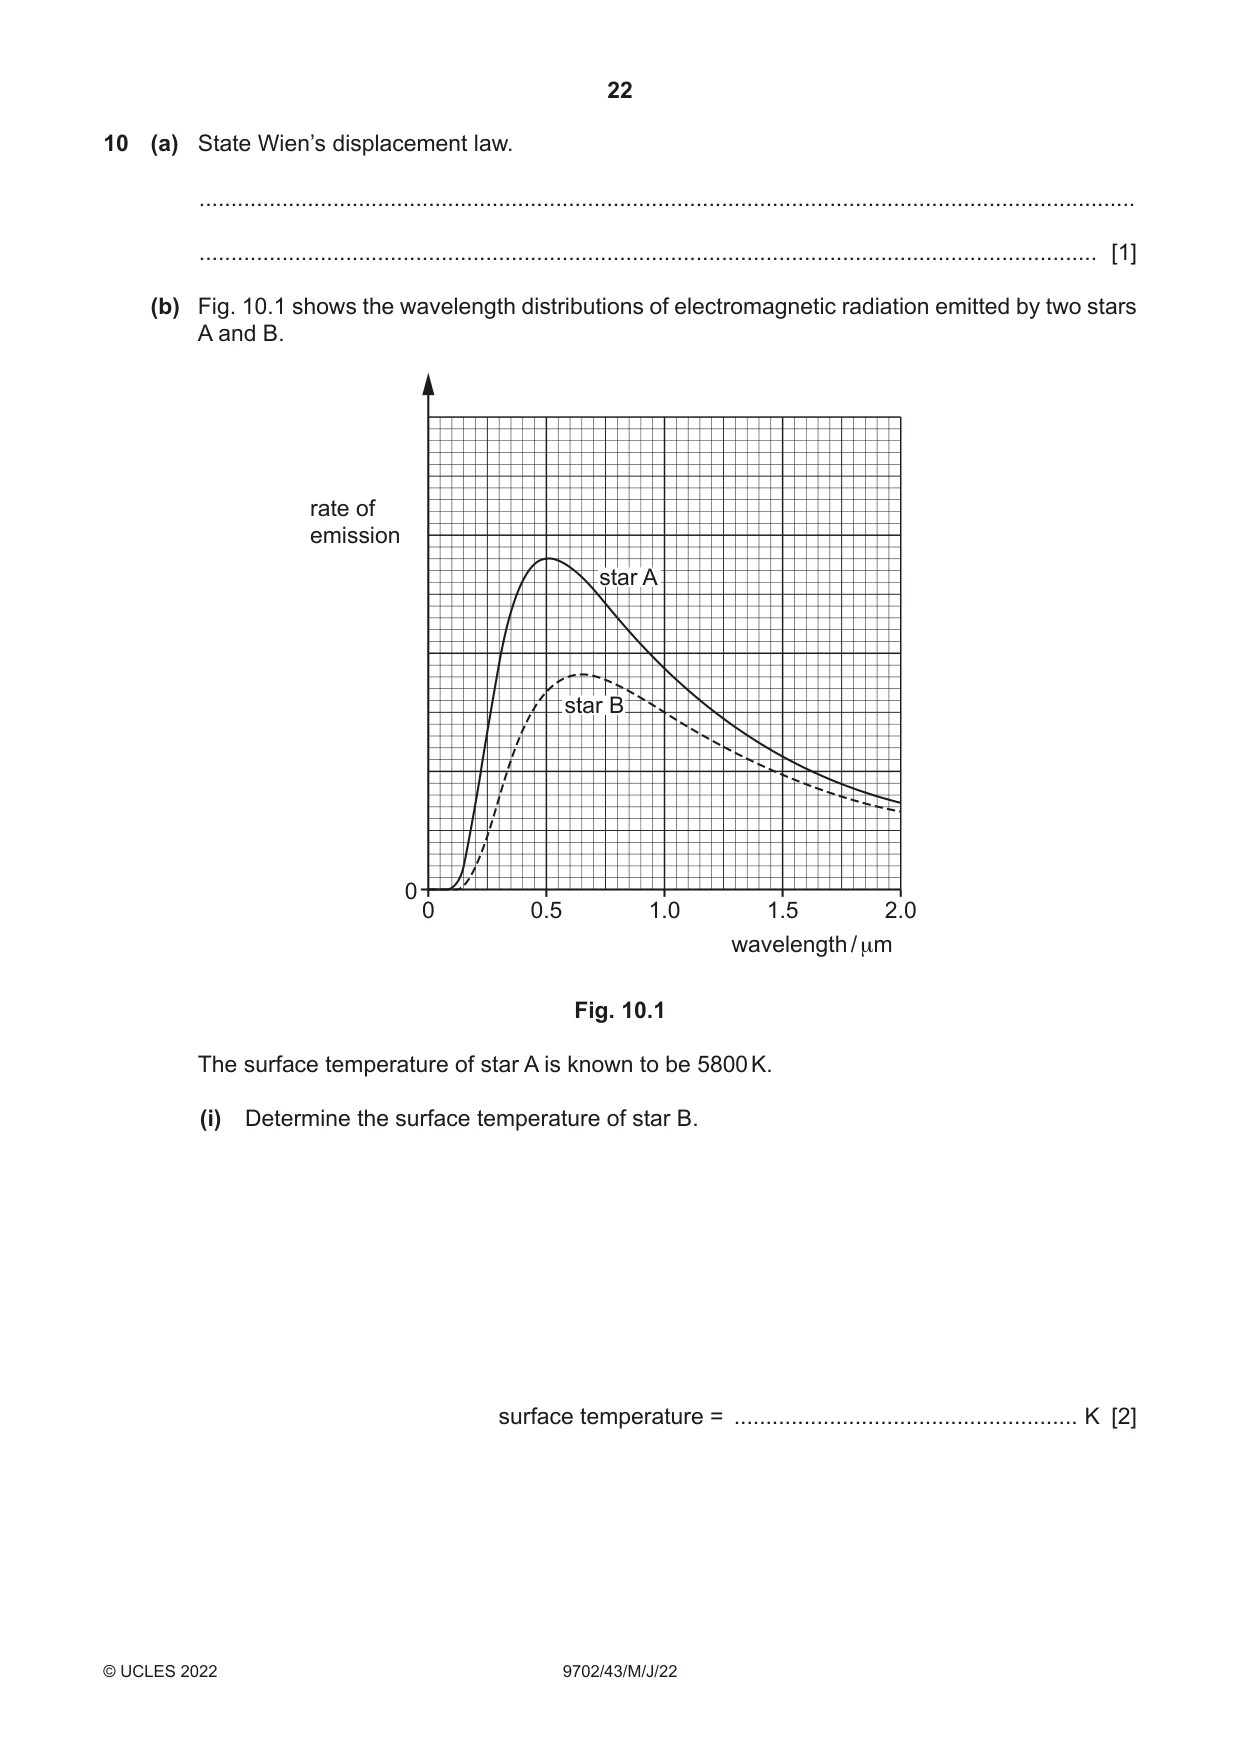
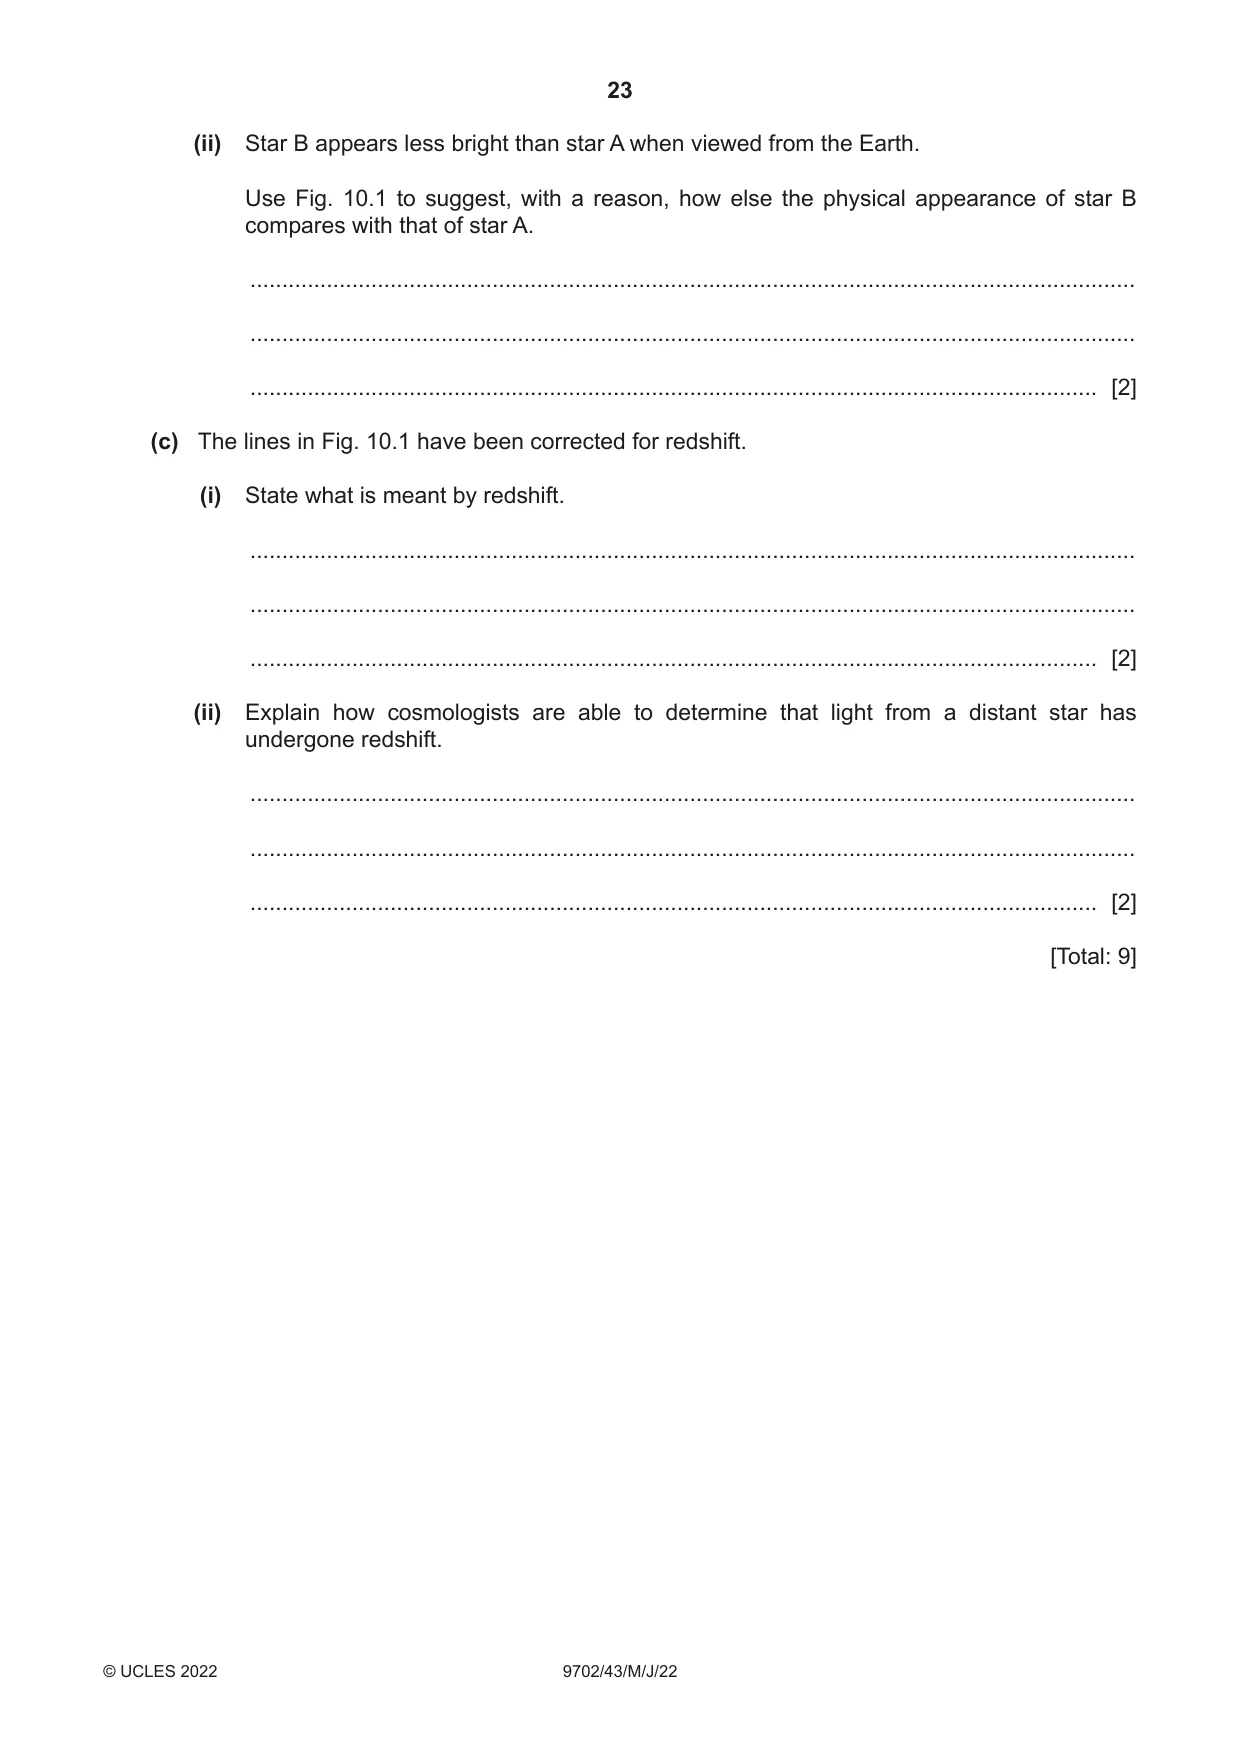
10 (a) State Wien’s displacement law. ................................................................................................................................................... ............................................................................................................................................. [1] (b) Fig. 10.1 shows the wavelength distributions of electromagnetic radiation emitted by two stars A and B. rate of emission star A star B 0 0 0.5 1.0 1.5 2.0 wavelength / μm Fig. 10.1 The surface temperature of star A is known to be 5800 K. (i) Determine the surface temperature of star B. surface temperature = ...................................................... K [2] (ii) Star B appears less bright than star A when viewed from the Earth. Use Fig. 10.1 to suggest, with a reason, how else the physical appearance of star B compares with that of star A. ........................................................................................................................................... ........................................................................................................................................... ..................................................................................................................................... [2] (c) The lines in Fig. 10.1 have been corrected for redshift. (i) State what is meant by redshift. ........................................................................................................................................... ........................................................................................................................................... ..................................................................................................................................... [2] (ii) Explain how cosmologists are able to determine that light from a distant star has undergone redshift. ........................................................................................................................................... ........................................................................................................................................... ..................................................................................................................................... [2] [Total: 9]
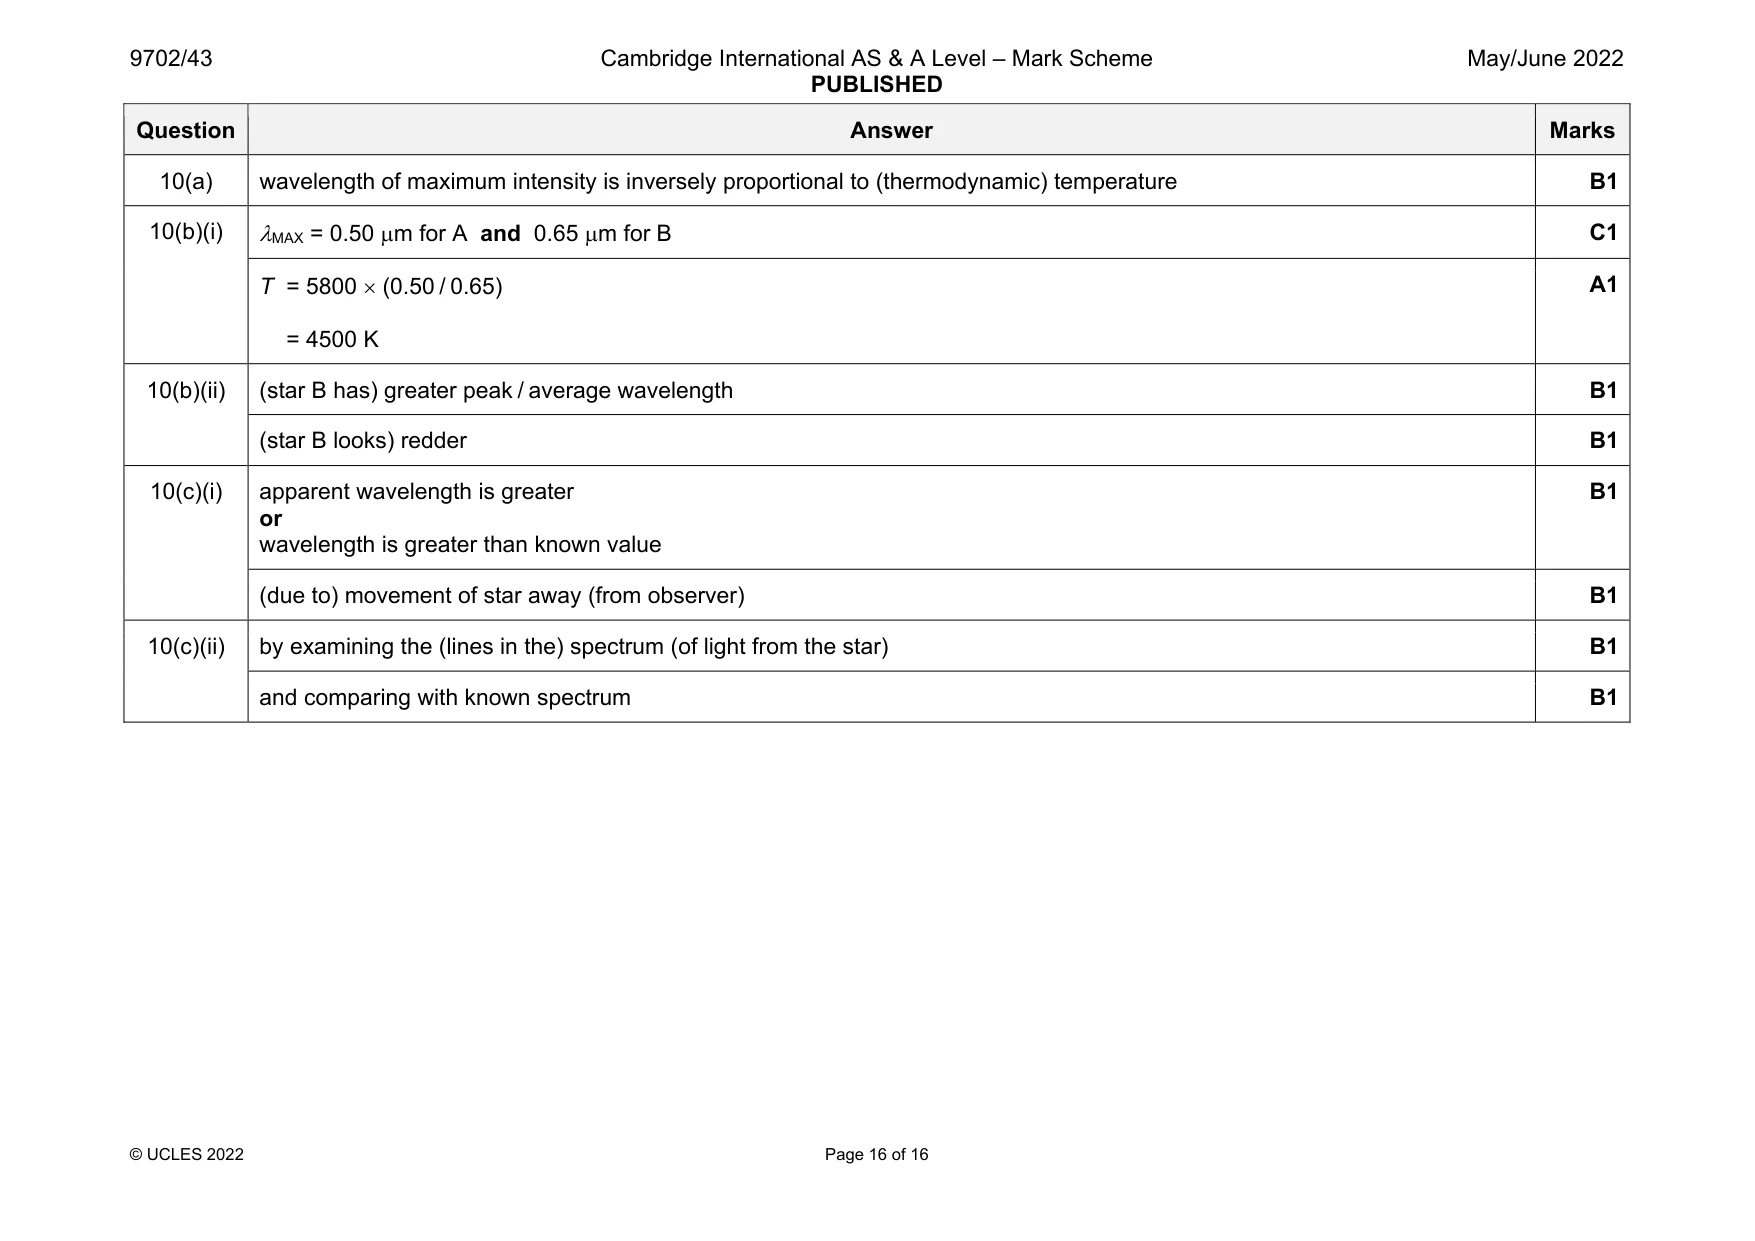
Mark scheme: 10(a) wavelength of maximum intensity is inversely proportional to (thermodynamic) temperature B1 10(b)(i) MAX = 0.50 m for A and 0.65 m for B C1 T = 5800 (0.50 / 0.65) = 4500 K A1 10(b)(ii) (star B has) greater peak / average wavelength B1 (star B looks) redder B1 10(c)(i) apparent wavelength is greater or wavelength is greater than known value B1 (due to) movement of star away (from observer) B1 10(c)(ii) by examining the (lines in the) spectrum (of light from the star) B1 and comparing with known spectrum B1
What was in this paper
The subtopics covered by these 10 questions, and how many questions each got. Open one in a new tab to see every Cambridge question on it.
What you needed in this session
Cambridge’s own grade thresholds for 2022 May/June, Paper 4 · Variant 3. A higher threshold means an easier paper — the bar moves with how the cohort did.