Questions as text
Q1 · The concentration of dissolved oxygen in sea water is affected by a number of different… 9693/21 Oct/Nov 2017
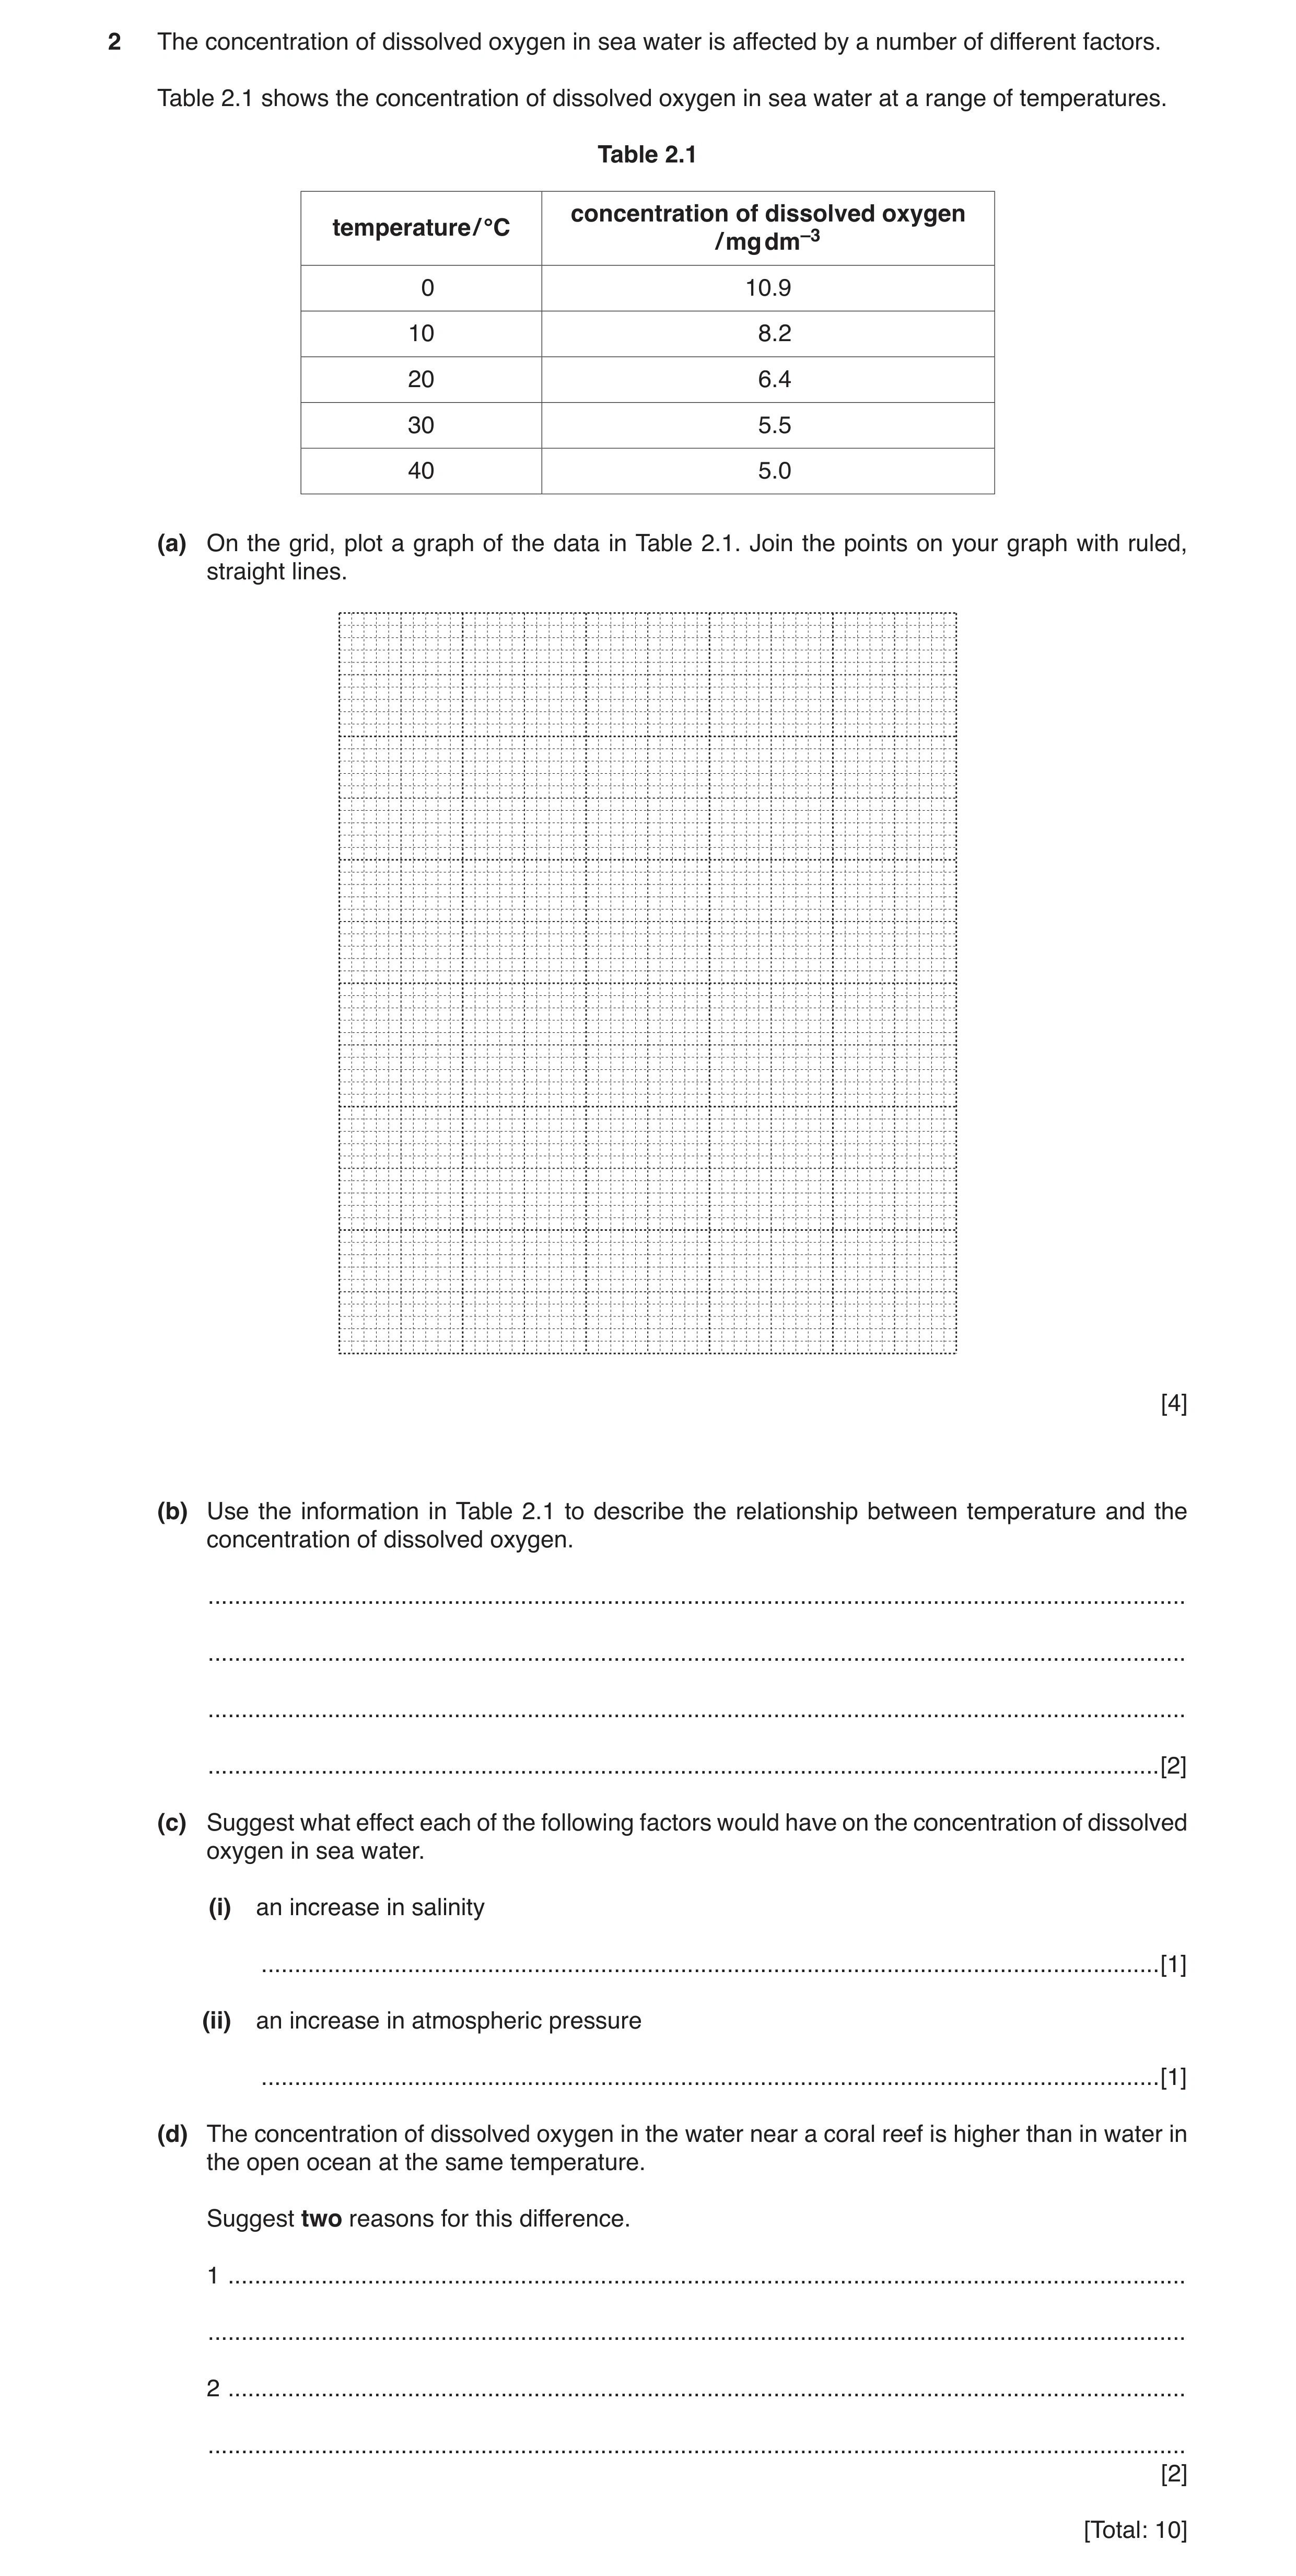
2 The concentration of dissolved oxygen in sea water is affected by a number of different factors. Table 2.1 shows the concentration of dissolved oxygen in sea water at a range of temperatures. Table 2.1 concentration of dissolved oxygen temperature / °C / mg dm–3 0 10.9 10 8.2 20 6.4 30 5.5 40 5.0 (a) On the grid, plot a graph of the data in Table 2.1. Join the points on your graph with ruled, straight lines. [4] (b) Use the information in Table 2.1 to describe the relationship between temperature and the concentration of dissolved oxygen. … … … … [2] (c) Suggest what effect each of the following factors would have on the concentration of dissolved oxygen in sea water. (i) an increase in salinity … [1] (ii) an increase in atmospheric pressure … [1] (d) The concentration of dissolved oxygen in the water near a coral reef is higher than in water in the open ocean at the same temperature. Suggest two reasons for this difference. 1 … … 2 … … [2] [Total: 10]
10 marks
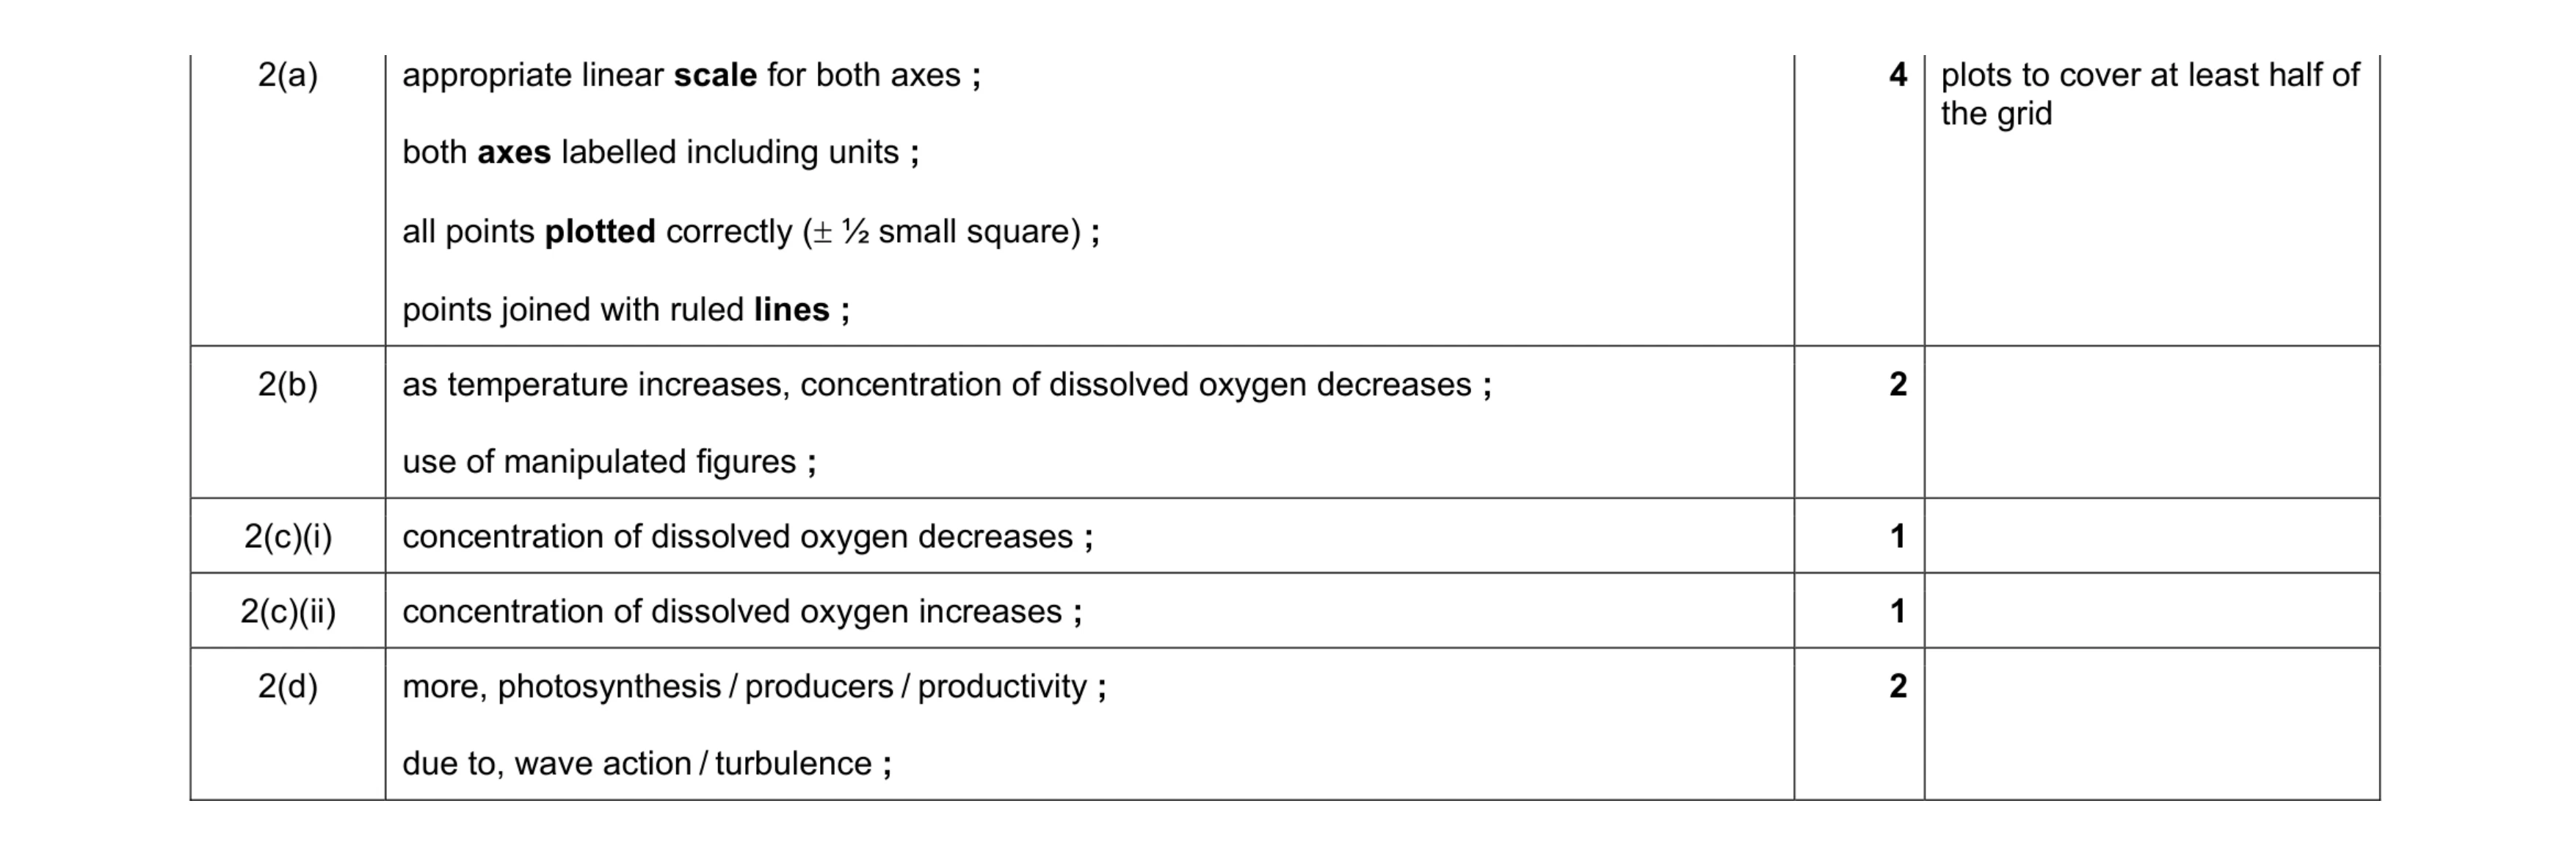
Mark scheme: 2(a) appropriate linear scale for both axes ; both axes labelled including units ; all points plotted correctly (± ½ small square) ; points joined with ruled lines ; 4 the grid 2(b) as temperature increases, concentration of dissolved oxygen decreases ; use of manipulated figures ; 2 2(c)(i) concentration of dissolved oxygen decreases ; 1 2(c)(ii) concentration of dissolved oxygen increases ; 1 2(d) more, photosynthesis / producers / productivity ; due to, wave action / turbulence ; 2
This question in 9693/21 Oct/Nov 2017
Q2 · The mean salinity of sea water is about 35 parts per thousand (‰) 9693/21 Oct/Nov 2017
4 (a) The mean salinity of sea water is about 35 parts per thousand (‰). The salinity in a tropical lagoon was measured and found to be 37 ‰ and the salinity in an estuary was found to be 20 ‰. Suggest explanations for these differences in salinity. … … … … … … [3] (b) Describe what is meant by the Coriolis effect and how it affects ocean currents. … … … … … [2] (c) Explain how temperature and wind produce ocean currents and upwelling. … … … … … … … … … … [5] (d) The surface layer of the sea contains a reservoir of dissolved nutrients. With reference to named examples, discuss how these nutrients may be lost from the surface layer. … … … … … … … … … … … … [5] [Total: 15]
15 marks
Mark scheme: 4(a) any 3 of: increased evaporation in lagoon ; due to high temperature ; increasing concentration of salt which increases salinity ; idea of, dilution of sea water in an estuary / decrease in concentration of salt ; by fresh water from, rivers / run off, decreases salinity ; 3 4(b) any 2 of: force caused by rotation of the Earth ; idea of deflection of, ocean currents / cyclones / wind direction ; ref. to different direction of spin in northern and southern hemisphere / wind or currents have spiral patterns away from the equator ; 2 Question Answer Marks Guidance 4(c) any 5 of: decrease in temperature of water at surface ; (leads to upwelling) increase in density ; cold / more dense, water sinks ; replaced by water moving up from below / AW ; ref. to convection ; surface currents are driven by the wind ; surface water moved away from coasts ; ref. to (wind driven) currents deflected by underwater ridges causing them to move upwards ; ref. to global conveyer belt / deep water currents, being temperature driven / start at the poles ; 5 Question Answer Marks Guidance 4(d) any 5 of: 1 carbon / carbon dioxide, used to synthesise organic compounds / absorbed by producers / for photosynthesis ; 2 magnesium for chlorophyll ; 3 phosphorus for, DNA / bones ; 4 nitrogen for, amino acids / proteins / DNA ; 5 calcium for, bones / teeth / skeleton ; 6 nutrients are incorporated into food chains ; 7 (loss by) harvesting ; 8 (loss by) dead organisms / faeces, sinking to sea floor ; 9 (loss by) incorporation into coral reefs ; 5
This question in 9693/21 Oct/Nov 2017
Q3 · Explain the effect of volcanic activity on the chemical composition of sea water 9693/22 May/June 2019
3 (a) Explain the effect of volcanic activity on the chemical composition of sea water. … … … … … … … … … … [5] (b) Describe and explain the effects of evaporation and precipitation on the salinity of sea water. … … … … … … … … [4] (c) Explain how the concentration of dissolved oxygen varies with depth in the open ocean. … … … … … … … … … … … … [6] [Total: 15]
15 marks
Mark scheme: 3(a) any five from: 1 idea of, (named) salt / (named) mineral input from volcanoes (increases) salinity ; 2 volcanic gases contain, carbon dioxide / sulfur dioxide / hydrogen sulfide / hydrogen chloride ; 3 gases dissolve / (atmospheric) dissolution ; 4 carried into sea water in rain water / reference to hydrological cycle ; 5 (ions) enter water directly through underwater volcano / hydrothermal vent ; 6 idea of, (sea) water becomes more acidic / decreased pH ; 7 gases are less soluble in hot water ; 8 idea of, a lot of volcanic ash would raise pH ; 5 I mixing 3(b) any four from evaporation increases salinity ; evaporation removes water (leaves salt behind) ; ref. shallow seas / coastal ; direct precipitation adds (fresh) water / (fresh)-water run-off / melting glaciers (from precipitation) ; lowers salinity ; 4 effect is greater in shallow seas / along coastline 3(c) any six from high(est) at surface ; due to turbulence ; lots of producers / primary productivity (in surface layers) ; photosynthesis (releases oxygen) ; decrease with increasing depth (to oxygen minimum layer) ; lots of respiration vs photosynthesis ; usually at 500 m (allow 100 to 1000 m) ; at greater depths starts to increase ; lack of food – less respiration ; increase solubility with lower temperatures ; increasing pressure increases solubility ; 6
This question in 9693/22 May/June 2019
Q4 · Explain the effect of volcanic activity on the chemical composition of sea water 9693/23 May/June 2019
3 (a) Explain the effect of volcanic activity on the chemical composition of sea water. … … … … … … … … … … [5] (b) Describe and explain the effects of evaporation and precipitation on the salinity of sea water. … … … … … … … … [4] (c) Explain how the concentration of dissolved oxygen varies with depth in the open ocean. … … … … … … … … … … … … [6] [Total: 15]
15 marks
Mark scheme: 3(a) any five from: 1 idea of, (named) salt / (named) mineral input from volcanoes (increases) salinity ; 2 volcanic gases contain, carbon dioxide / sulfur dioxide / hydrogen sulfide / hydrogen chloride ; 3 gases dissolve / (atmospheric) dissolution ; 4 carried into sea water in rain water / reference to hydrological cycle ; 5 (ions) enter water directly through underwater volcano / hydrothermal vent ; 6 idea of, (sea) water becomes more acidic / decreased pH ; 7 gases are less soluble in hot water ; 8 idea of, a lot of volcanic ash would raise pH ; 5 I mixing 3(b) any four from evaporation increases salinity ; evaporation removes water (leaves salt behind) ; ref. shallow seas / coastal ; direct precipitation adds (fresh) water / (fresh)-water run-off / melting glaciers (from precipitation) ; lowers salinity ; 4 effect is greater in shallow seas / along coastline 3(c) any six from high(est) at surface ; due to turbulence ; lots of producers / primary productivity (in surface layers) ; photosynthesis (releases oxygen) ; decrease with increasing depth (to oxygen minimum layer) ; lots of respiration vs photosynthesis ; usually at 500 m (allow 100 to 1000 m) ; at greater depths starts to increase ; lack of food – less respiration ; increase solubility with lower temperatures ; increasing pressure increases solubility ; 6
This question in 9693/23 May/June 2019
Q5 · A student investigates the properties of water of different salinities 9693/21 May/June 2022
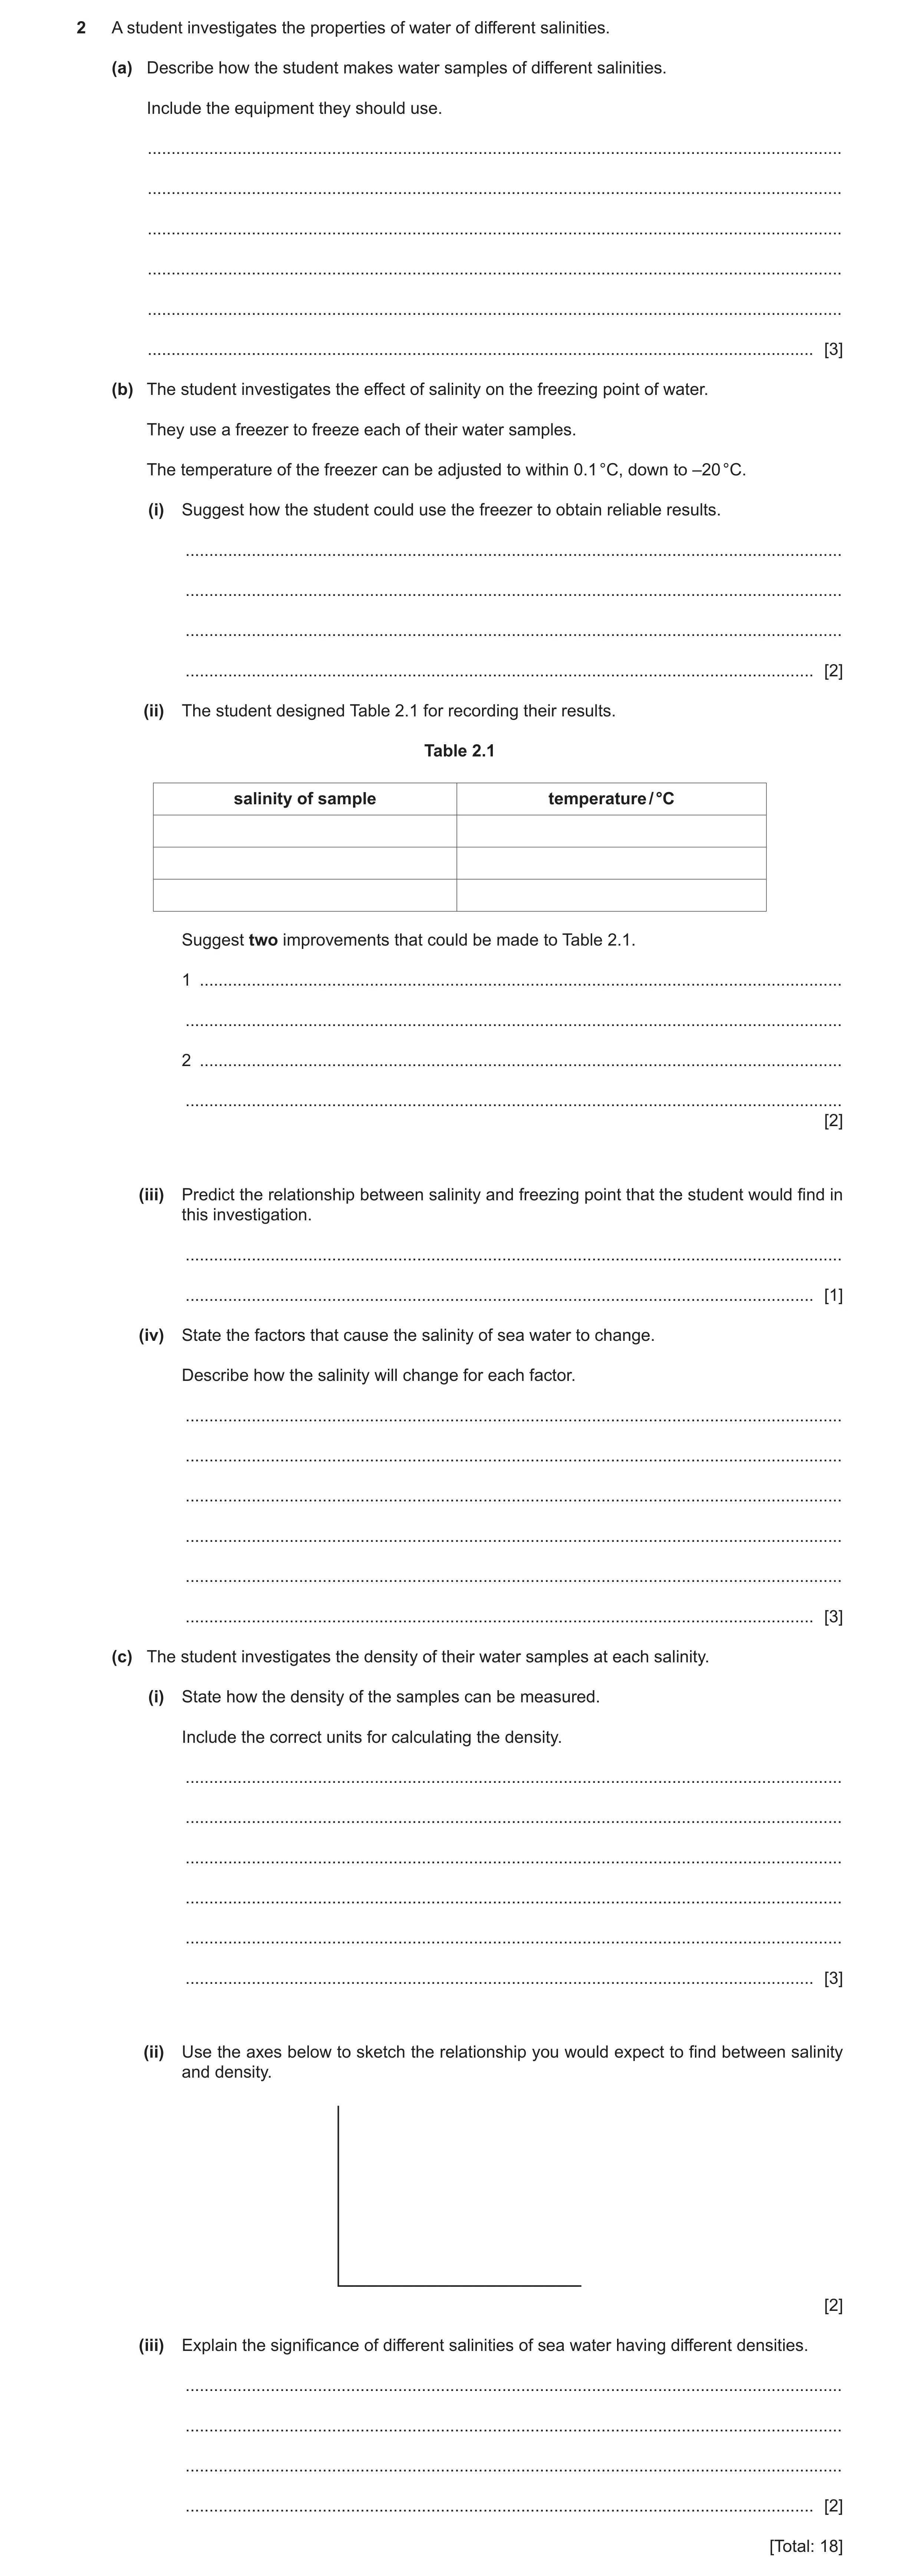
2 A student investigates the properties of water of different salinities. (a) Describe how the student makes water samples of different salinities. Include the equipment they should use. … … … … … … [3] (b) The student investigates the effect of salinity on the freezing point of water. They use a freezer to freeze each of their water samples. The temperature of the freezer can be adjusted to within 0.1 °C, down to –20 °C. (i) Suggest how the student could use the freezer to obtain reliable results. … … … … [2] (ii) The student designed Table 2.1 for recording their results. Table 2.1 salinity of sample temperature / °C Suggest two improvements that could be made to Table 2.1. 1 … … 2 … … [2] (iii) Predict the relationship between salinity and freezing point that the student would find in this investigation. … … [1] (iv) State the factors that cause the salinity of sea water to change. Describe how the salinity will change for each factor. … … … … … … [3] (c) The student investigates the density of their water samples at each salinity. (i) State how the density of the samples can be measured. Include the correct units for calculating the density. … … … … … … [3] (ii) Use the axes below to sketch the relationship you would expect to find between salinity and density. [2] (iii) Explain the significance of different salinities of sea water having different densities. … … … … [2] [Total: 18]
18 marks
Mark scheme: 2(a) any 3 from: different masses of salt (weighed) ; using balance / weighing scales ; volume of water measured / stated ; using measuring cylinder ; salt (fully) dissolved in water ; OR determine salinity of (sea) water sample / use sample of saturated solution of saline ; measure volume of, sea water / saline ; using measuring cylinder ; diluting with known volume of fresh water ; Question Answer Marks 2(b)(i) any 2 from: freezer initially set at higher temperature / suggested temp, e.g. –1°C ; water samples given time to freeze / suitable suggested time, e.g. two hours ; (if freezing all samples at the same temperature) record time taken to freeze (different) samples / record temperature at which each sample freezes ; temperature gradually reduced ; reference to control variables, e.g. same volume ; use of data loggers ; repeating two more times (for reliability) ; 2 2(b)(ii) any 2 from: ref. to lack units for salinity ; ref. to ‘temperature’ being unspecific, e.g. should be ‘freezing point of sample’ / freezing temperature ; ref. to lack of repeated results / add more trials / add more samples ; 2 2(b)(iii) the greater the salinity the lower the freezing point / lower the salinity the higher the freezing point ; 1 2(b)(iv) any 3 from: precipitation will decrease (salinity) ; melting of sea ice will decrease (salinity) / freezing of sea ice will increase (salinity); run-off will decrease (salinity) / glaciers melting ; evaporation will increase (salinity) ; water from hydrothermal vents will increase (salinity) ; upwelling will increase salinity ; 3 2(c)(i) measure the mass and volume OR use the mass and volume of the water sample ; divide mass by volume ; units are, kg / m3 / kg m –3 3 2(c)(ii) both axes labelled ; any line from bottom left towards top right / bar chart with three or more increasing height bars from left to right; 2 Question Answer Marks 2(c)(iii) more saline water is more dense so will sink (below less saline water) ORA ; PLUS any 1 from: (contributes to) formation of ocean layers ; (contributes to) formation of ocean currents ; ref. to salt water wedges in estuaries ; allows halocline to form ; 2
This question in 9693/21 May/June 2022
Q6 · The salinity at different depths in an estuary 9693/21 Oct/Nov 2022
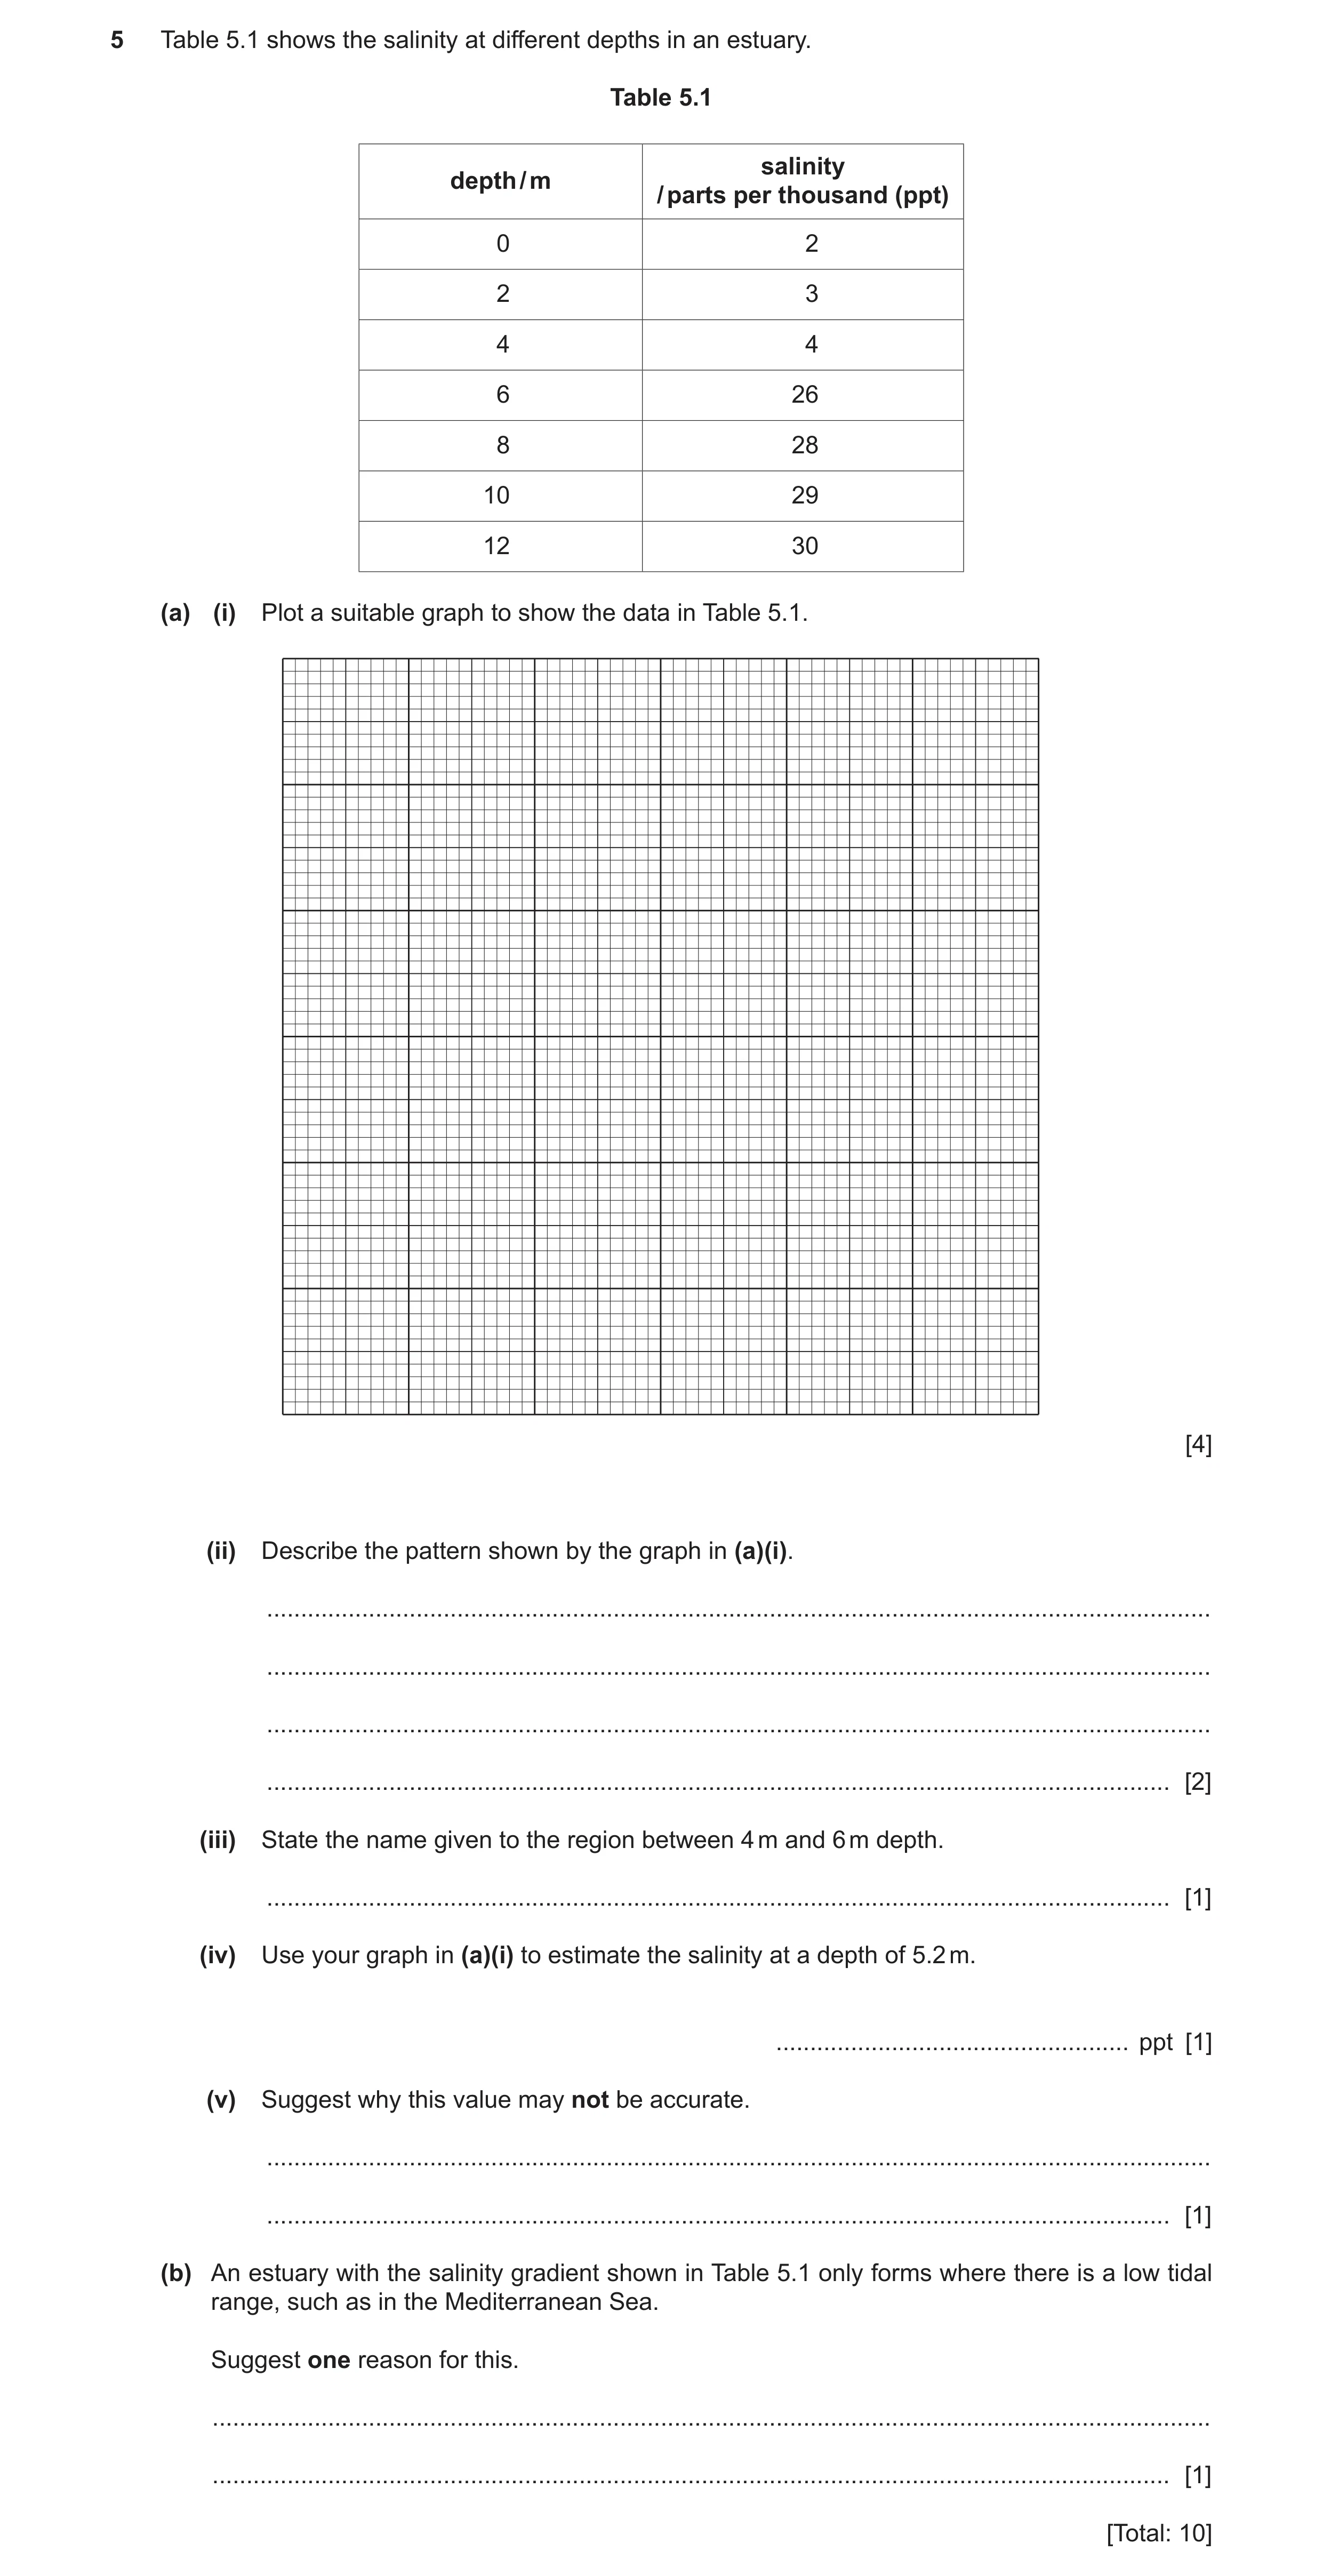
5 Table 5.1 shows the salinity at different depths in an estuary. Table 5.1 salinity depth / m / parts per thousand (ppt) 0 2 2 3 4 4 6 26 8 28 10 29 12 30 (a) (i) Plot a suitable graph to show the data in Table 5.1. [4] (ii) Describe the pattern shown by the graph in (a)(i). … … … … [2] (iii) State the name given to the region between 4 m and 6 m depth. … [1] (iv) Use your graph in (a)(i) to estimate the salinity at a depth of 5.2 m. … ppt [1] (v) Suggest why this value may not be accurate. … … [1] (b) An estuary with the salinity gradient shown in Table 5.1 only forms where there is a low tidal range, such as in the Mediterranean Sea. Suggest one reason for this. … … [1] [Total: 10]
10 marks
Mark scheme: 5(a)(i) axes labelled with units ; 4 appropriate linear scales (plotted data to cover at least half the grid) ; all plots correct ( half small square) ; smooth line (curve) drawn (no sketchiness) ; 5(a)(ii) greater change of salinity between 4 and 6 m ; 2 little change / fairly constant, above 4 m / below 6 m ; 5(a)(iii) halocline ; 1 5(a)(iv) (read off graph) approx. 17 (ppt) ; 1 5(a)(v) large change occurs + insufficient data within that region ; 1 5(b) any 1 from: 1 reduced mixing ; fresh water floats on sea water / ORA ;
This question in 9693/21 Oct/Nov 2022
Q7 · The salinity at different depths in an estuary 9693/22 Oct/Nov 2022
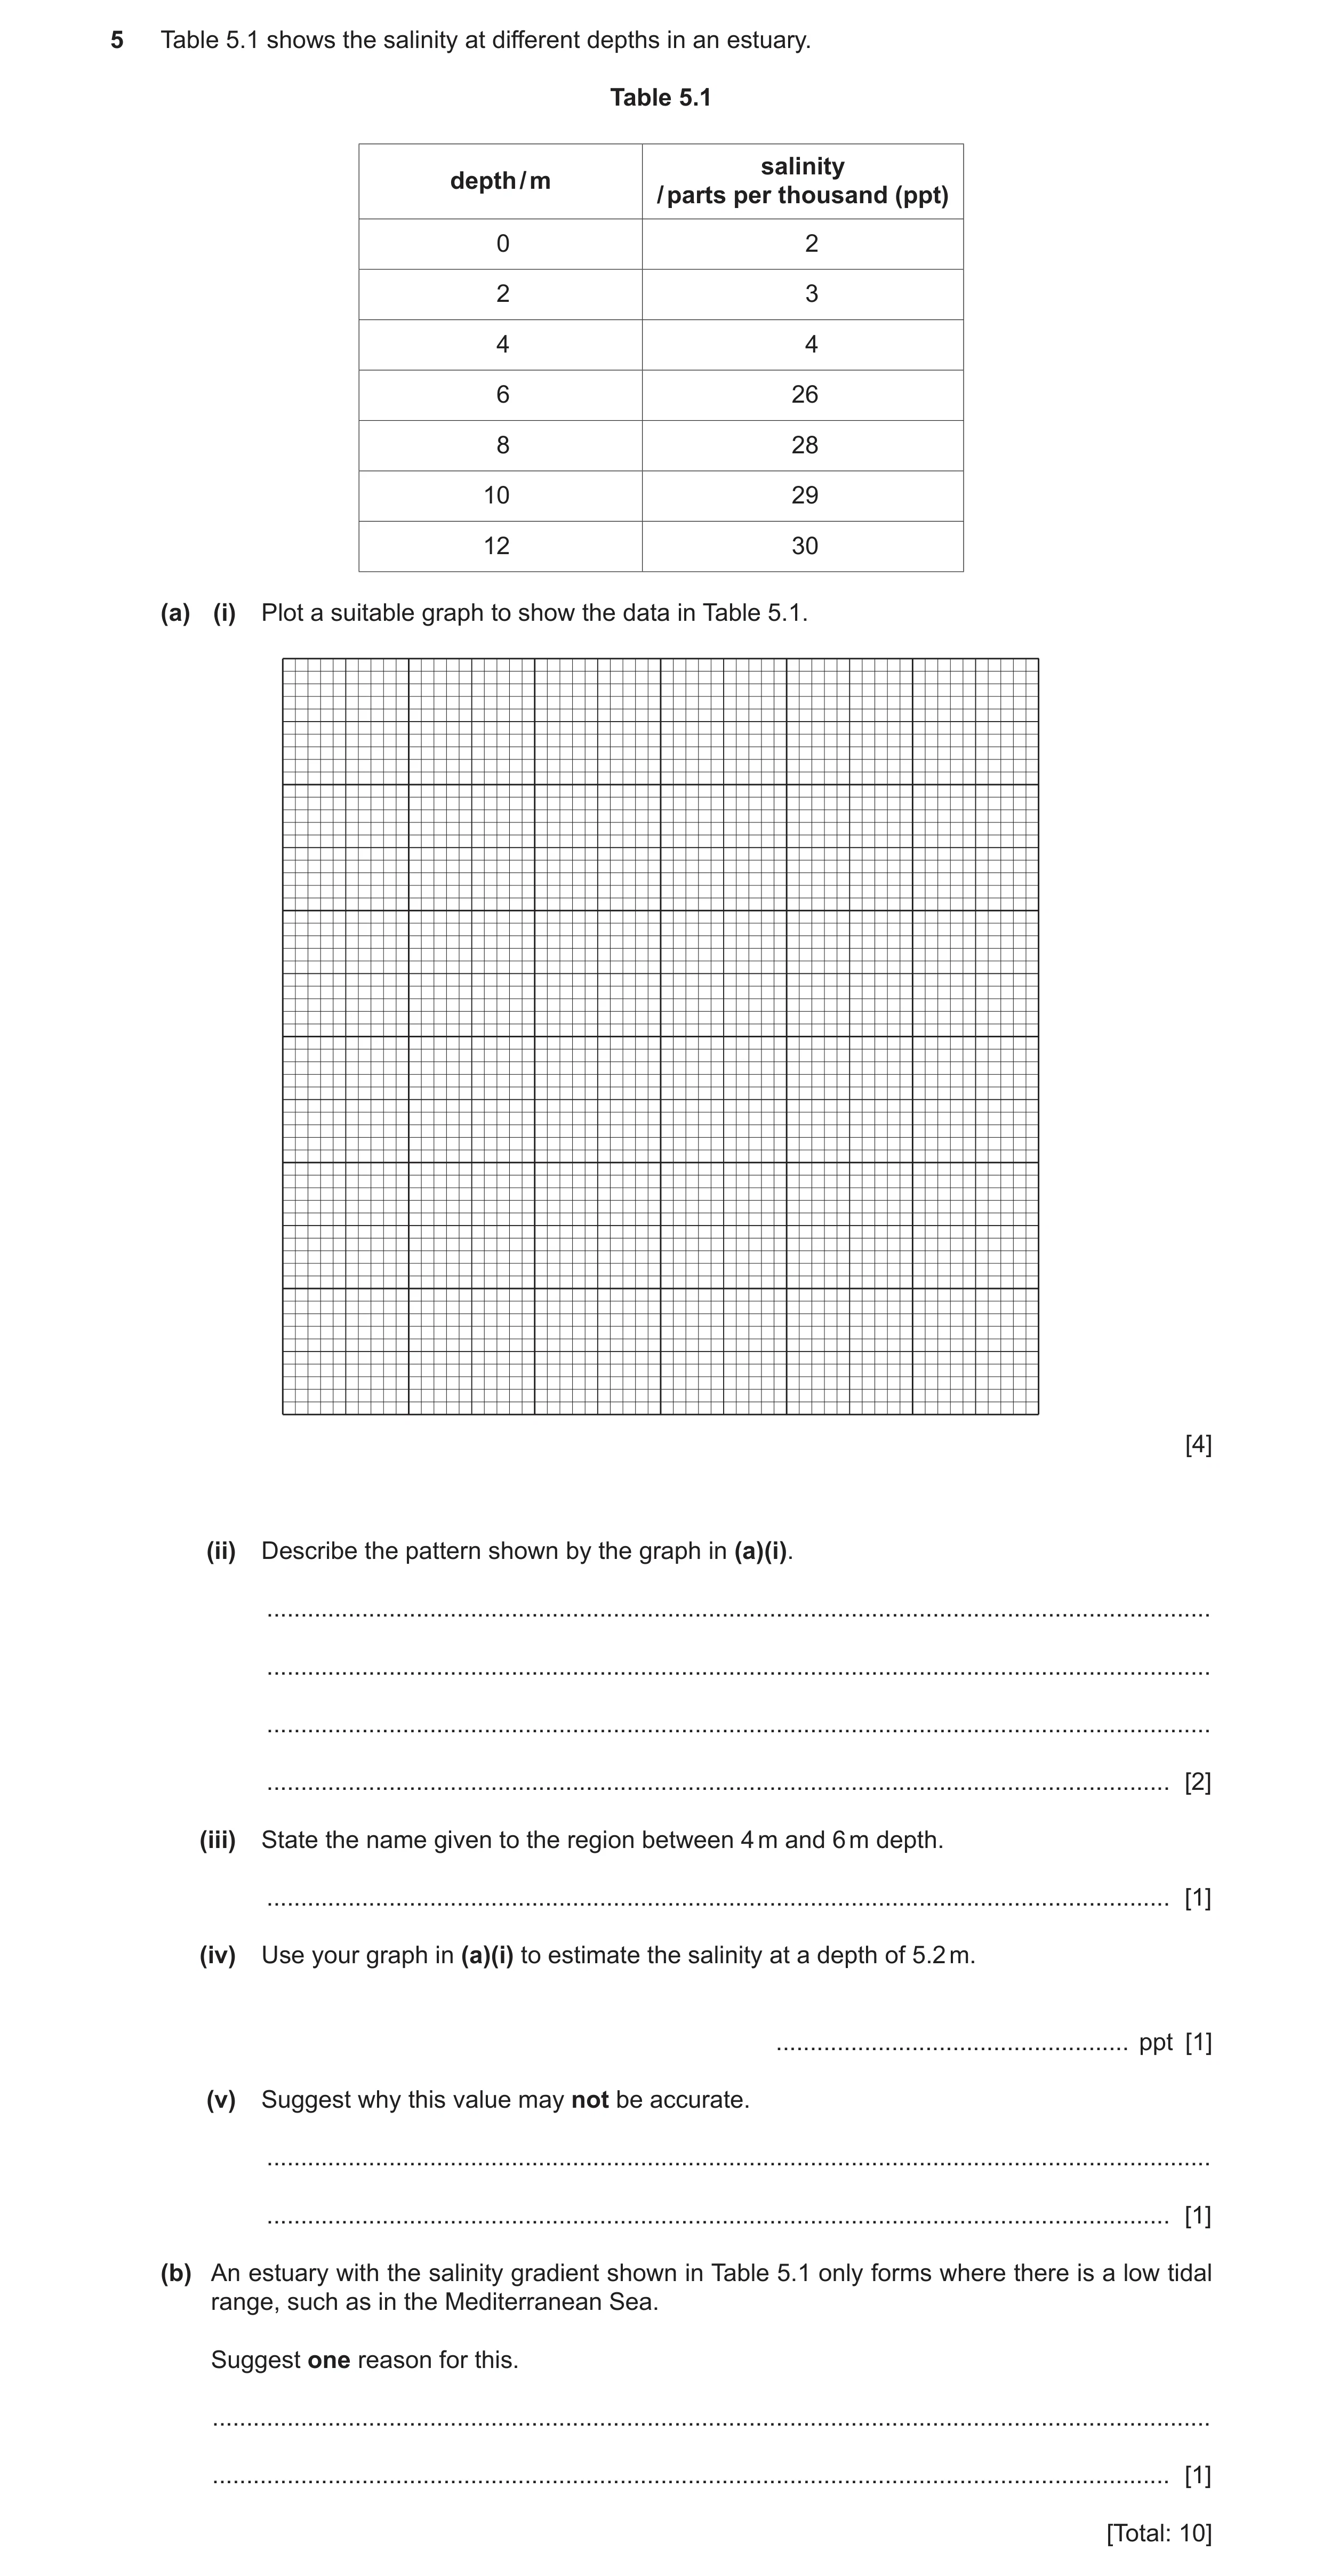
5 Table 5.1 shows the salinity at different depths in an estuary. Table 5.1 salinity depth / m / parts per thousand (ppt) 0 2 2 3 4 4 6 26 8 28 10 29 12 30 (a) (i) Plot a suitable graph to show the data in Table 5.1. [4] (ii) Describe the pattern shown by the graph in (a)(i). … … … … [2] (iii) State the name given to the region between 4 m and 6 m depth. … [1] (iv) Use your graph in (a)(i) to estimate the salinity at a depth of 5.2 m. … ppt [1] (v) Suggest why this value may not be accurate. … … [1] (b) An estuary with the salinity gradient shown in Table 5.1 only forms where there is a low tidal range, such as in the Mediterranean Sea. Suggest one reason for this. … … [1] [Total: 10]
10 marks
Mark scheme: 5(a)(i) axes labelled with units ; 4 appropriate linear scales (plotted data to cover at least half the grid) ; all plots correct ( half small square) ; smooth line (curve) drawn (no sketchiness) ; 5(a)(ii) greater change of salinity between 4 and 6 m ; 2 little change / fairly constant, above 4 m / below 6 m ; 5(a)(iii) halocline ; 1 5(a)(iv) (read off graph) approx. 17 (ppt) ; 1 5(a)(v) large change occurs + insufficient data within that region ; 1 5(b) any 1 from: 1 reduced mixing ; fresh water floats on sea water / ORA ;
This question in 9693/22 Oct/Nov 2022
Q8 · The salinity at different depths in an estuary 9693/23 Oct/Nov 2022
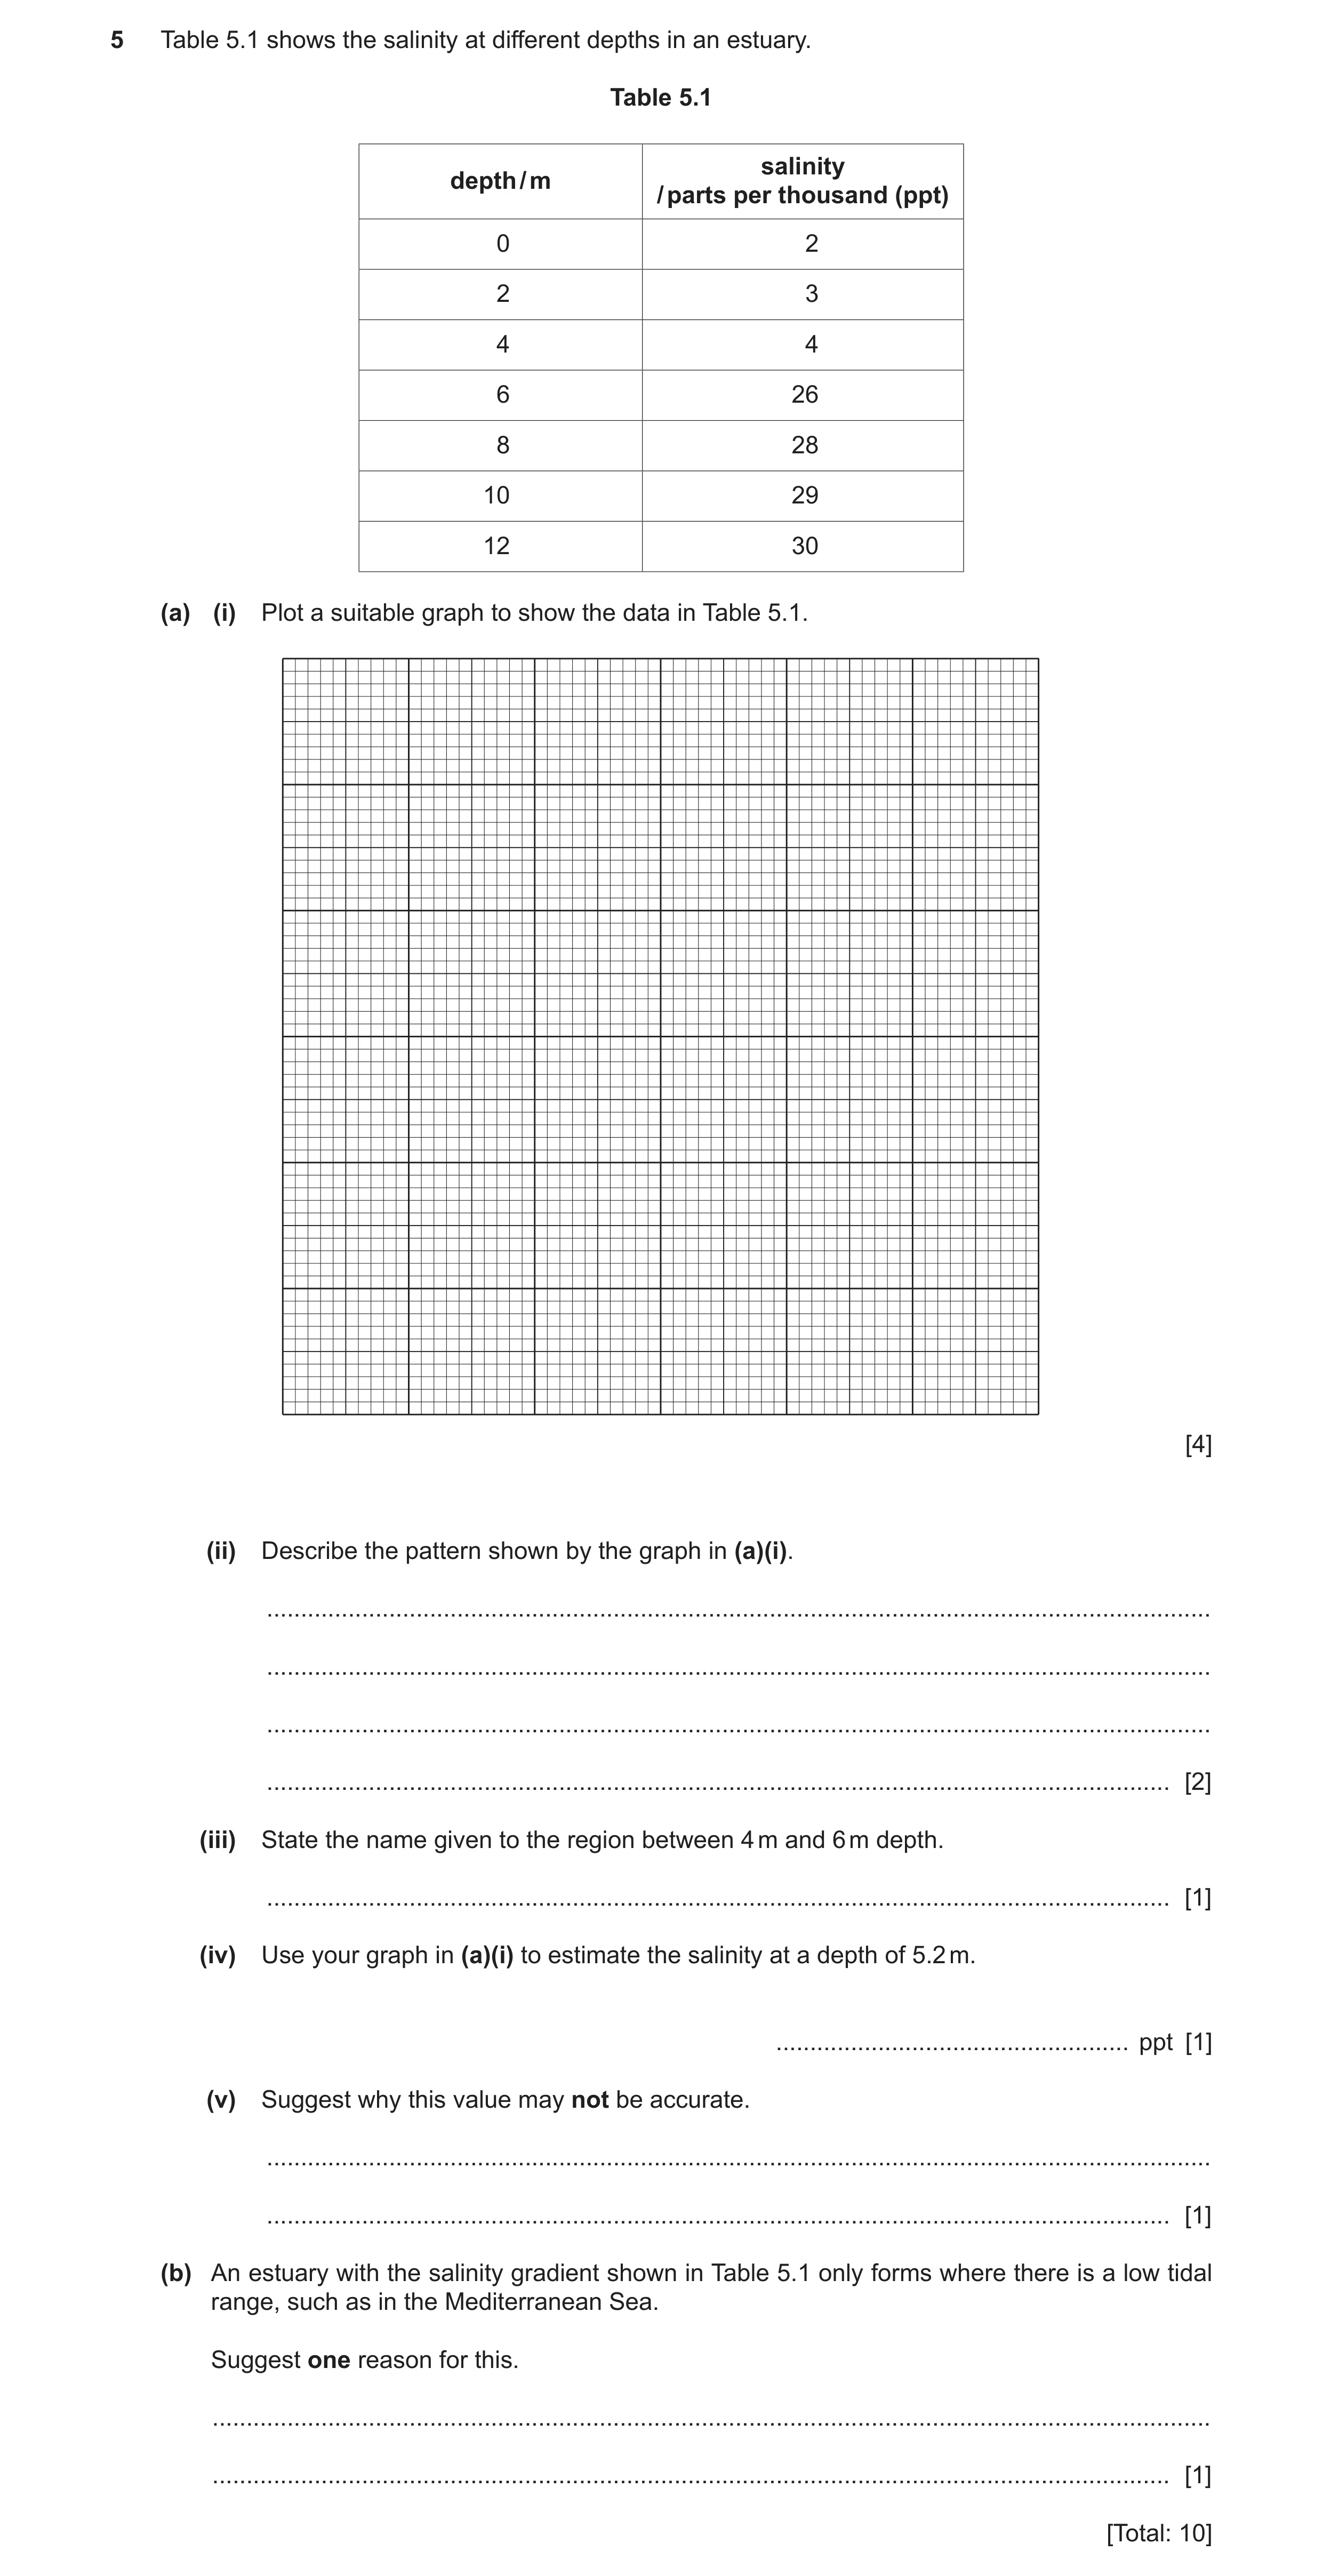
5 Table 5.1 shows the salinity at different depths in an estuary. Table 5.1 salinity depth / m / parts per thousand (ppt) 0 2 2 3 4 4 6 26 8 28 10 29 12 30 (a) (i) Plot a suitable graph to show the data in Table 5.1. [4] (ii) Describe the pattern shown by the graph in (a)(i). … … … … [2] (iii) State the name given to the region between 4 m and 6 m depth. … [1] (iv) Use your graph in (a)(i) to estimate the salinity at a depth of 5.2 m. … ppt [1] (v) Suggest why this value may not be accurate. … … [1] (b) An estuary with the salinity gradient shown in Table 5.1 only forms where there is a low tidal range, such as in the Mediterranean Sea. Suggest one reason for this. … … [1] [Total: 10]
10 marks
Mark scheme: 5(a)(i) axes labelled with units ; 4 appropriate linear scales (plotted data to cover at least half the grid) ; all plots correct ( half small square) ; smooth line (curve) drawn (no sketchiness) ; 5(a)(ii) greater change of salinity between 4 and 6 m ; 2 little change / fairly constant, above 4 m / below 6 m ; 5(a)(iii) halocline ; 1 5(a)(iv) (read off graph) approx. 17 (ppt) ; 1 5(a)(v) large change occurs + insufficient data within that region ; 1 5(b) any 1 from: 1 reduced mixing ; fresh water floats on sea water / ORA ;
This question in 9693/23 Oct/Nov 2022
Q9 · Magnesium sulfate and sodium chloride are examples of solutes 9693/21 May/June 2024
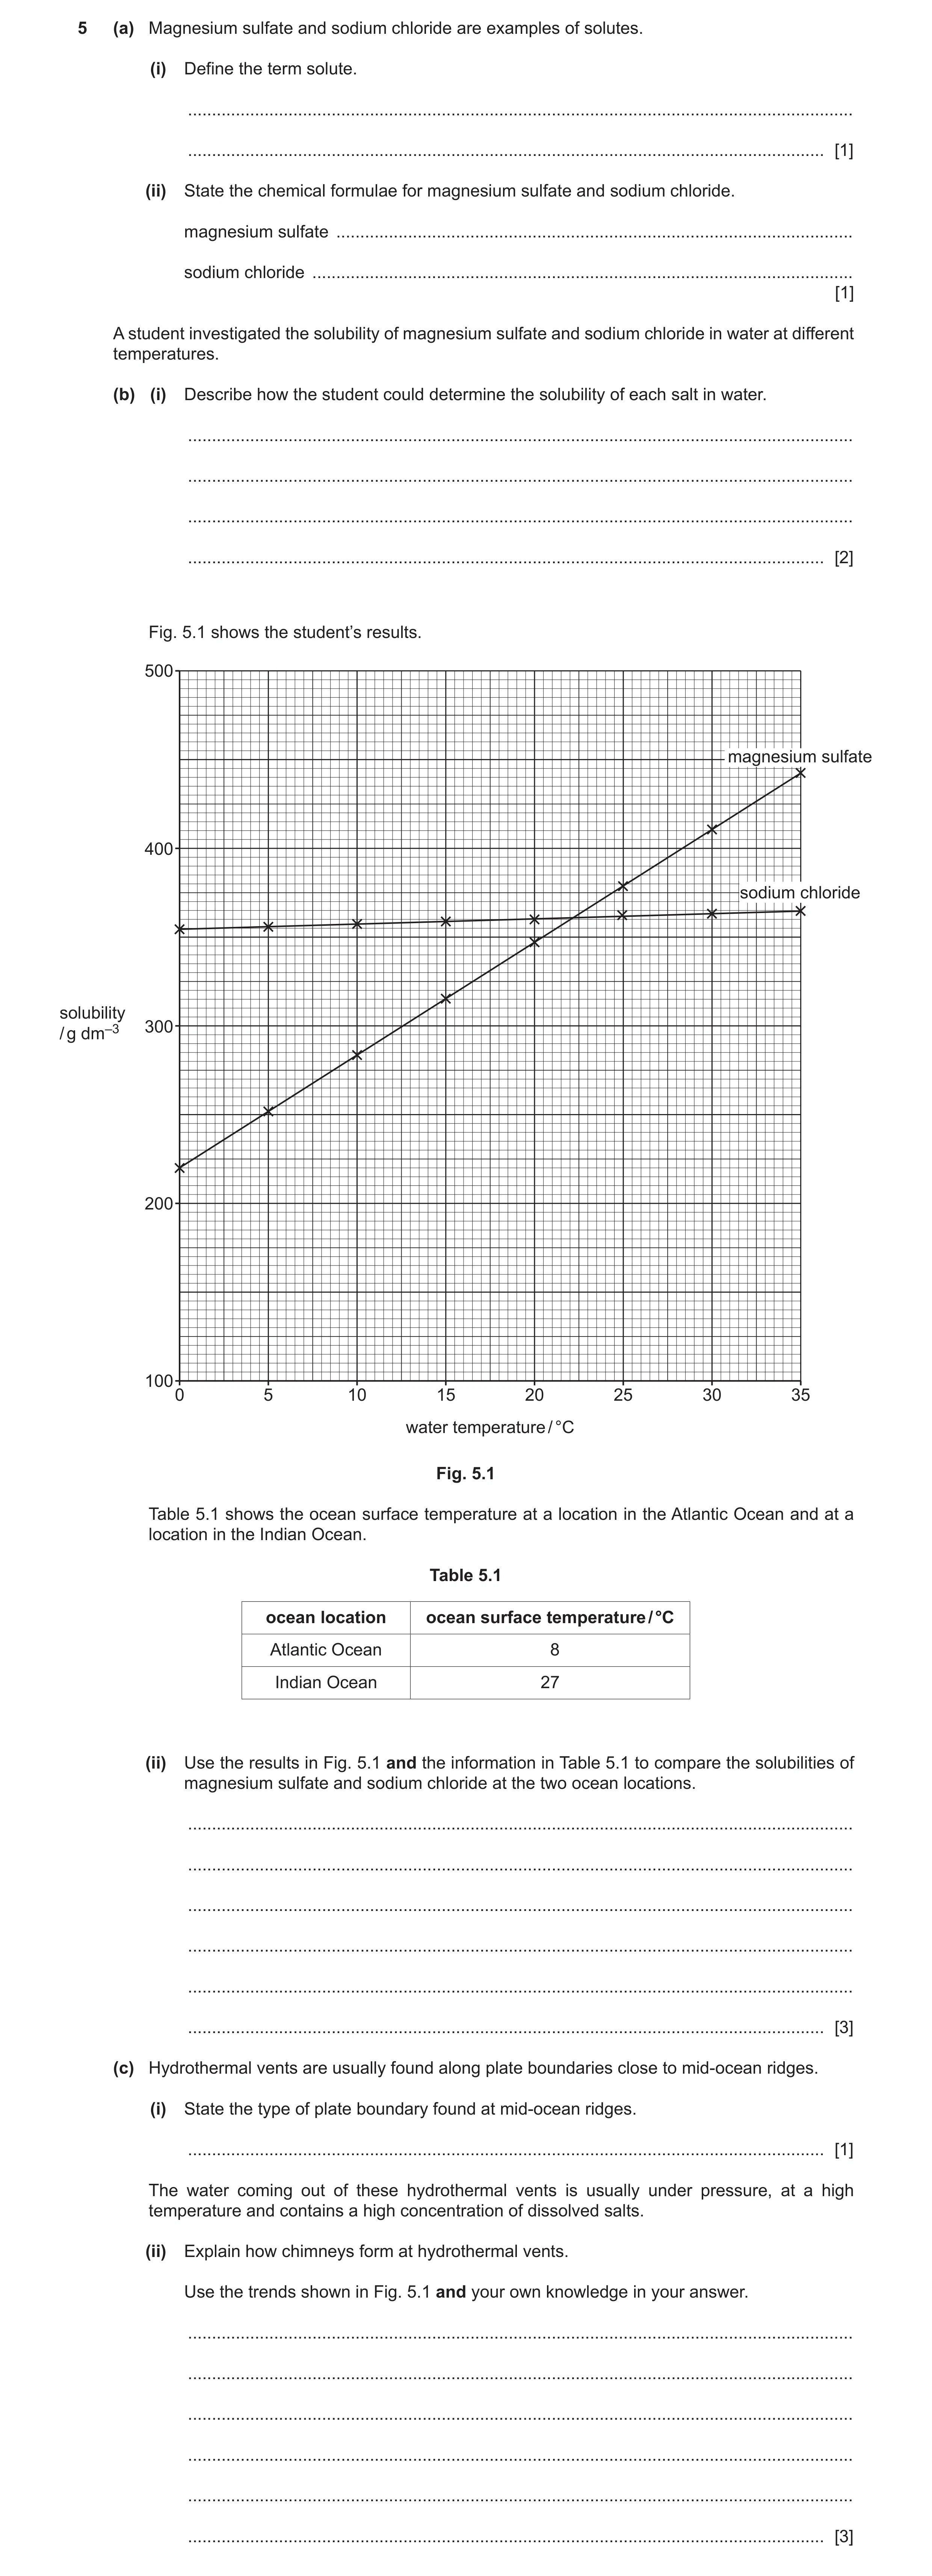
5 (a) Magnesium sulfate and sodium chloride are examples of solutes. (i) Define the term solute. … … [1] (ii) State the chemical formulae for magnesium sulfate and sodium chloride. magnesium sulfate … sodium chloride … [1] A student investigated the solubility of magnesium sulfate and sodium chloride in water at different temperatures. (b) (i) Describe how the student could determine the solubility of each salt in water. … … … … [2] Fig. 5.1 shows the student’s results. 500 magnesium sulfate 400 sodium chloride solubility 300/ g dm–3 200 100 0 5 10 15 20 25 30 35 water temperature / °C Fig. 5.1 Table 5.1 shows the ocean surface temperature at a location in the Atlantic Ocean and at a location in the Indian Ocean. Table 5.1 ocean location ocean surface temperature / °C Atlantic Ocean 8 Indian Ocean 27 (ii) Use the results in Fig. 5.1 and the information in Table 5.1 to compare the solubilities of magnesium sulfate and sodium chloride at the two ocean locations. … … … … … … [3] (c) Hydrothermal vents are usually found along plate boundaries close to mid-ocean ridges. (i) State the type of plate boundary found at mid-ocean ridges. … [1] The water coming out of these hydrothermal vents is usually under pressure, at a high temperature and contains a high concentration of dissolved salts. (ii) Explain how chimneys form at hydrothermal vents. Use the trends shown in Fig. 5.1 and your own knowledge in your answer. … … … … … … [3]
11 marks
Mark scheme: 5(a)(i) a substance / chemical, that dissolves in a solvent ; 1 5(a)(ii) MgSO4 AND NaCl ; 1 5(b)(i) use a known volume of water ; determine mass of salt that dissolves ; 2 Question Answer Marks 5(b)(ii) any 3 from: 1 The Atlantic Ocean is colder than the Indian Ocean ORA ; 2 Magnesium sulphate is more soluble (than sodium chloride), in the Indian Ocean / at 27 °C ORA ; 3 both sodium chloride and magnesium sulphate are more soluble in the Indian ocean / at 27 °C ORA ; 4 Sodium chloride is more soluble than magnesium sulphate, in the Atlantic Ocean / 8 °C ORA ; 5 There is a greater difference in the solubility between magnesium sulphate and sodium chloride in the Atlantic Ocean (compared to the Indian Ocean) ORA ; 6 comparing manipulated data ; ; 3 5(c)(i) divergent / constructive ; 1 5(c)(ii) solubility of, salts / minerals, higher at high temperature / minerals dissolve in the water as it’s heated ; sudden cooling reduces solubility ; idea of cold (water) causing, salts / minerals, deposited / precipitate / build up / settle around the (vent)(to form chimney) ; 3 5(d)(i) 117–55 ; 62 (cm per year) ; 2 5(d)(ii) ppt ; 1 5(d)(iii) 1.8 (ppt) ; 1 5(d)(iv) salinity at 50 °N is lower than 30 °S ORA ; at 50 °N precipitation is (much) greater (than evaporation) ORA for 30 °S OR at 30 °S precipitation is (much) lower (than evaporation) ORA for 50 °N ; 2
This question in 9693/21 May/June 2024
Q10 · A student investigates how salinity affects the freezing point of a solution 9693/21 Oct/Nov 2025
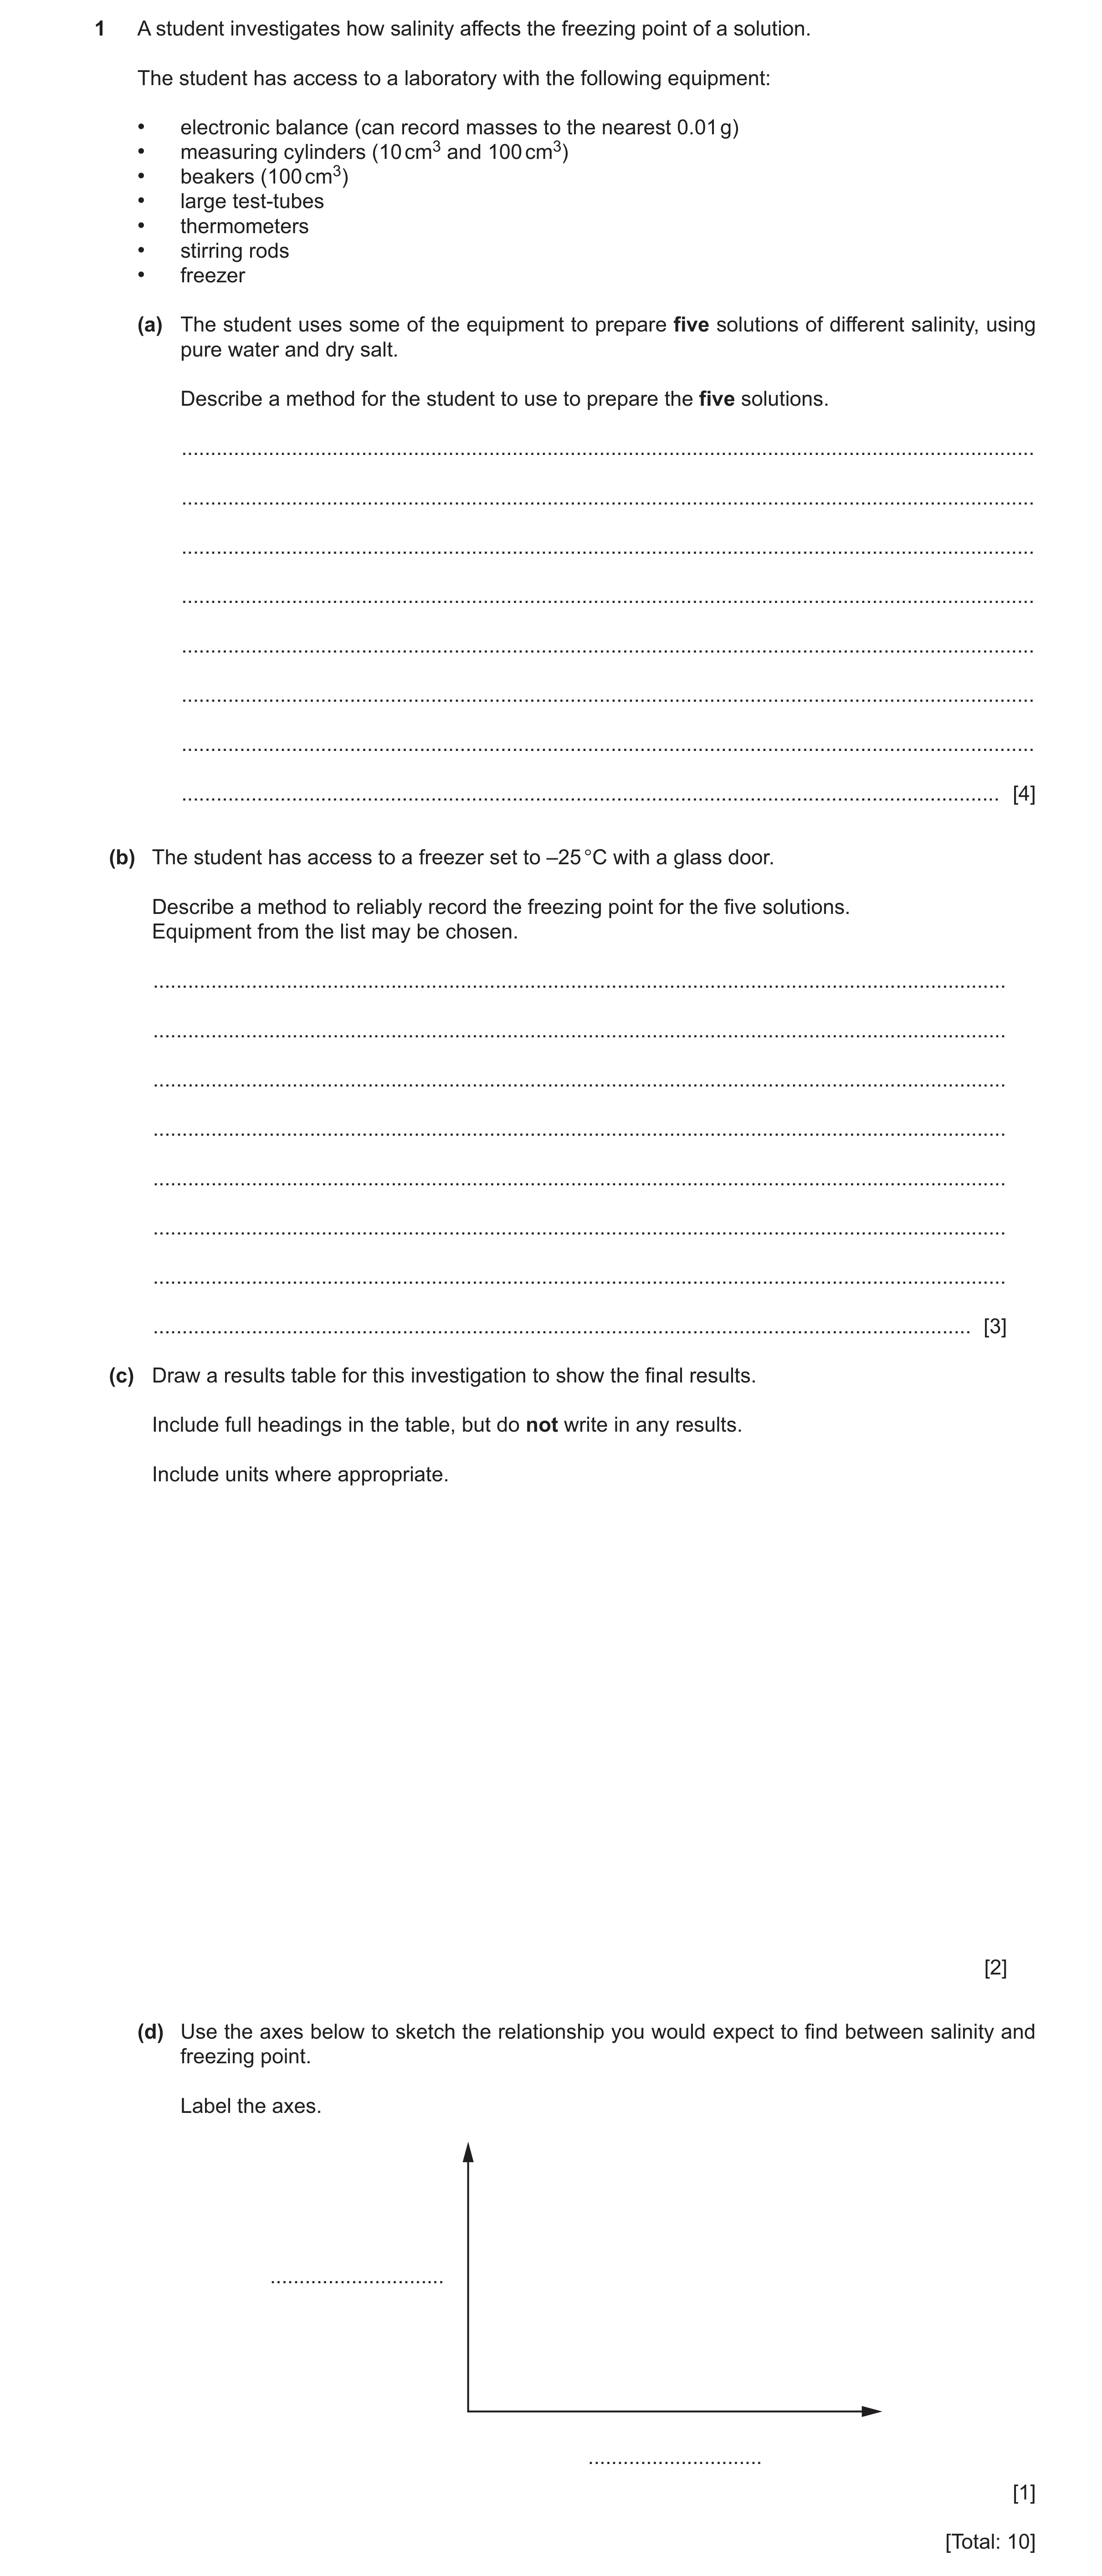
1 A student investigates how salinity affects the freezing point of a solution. The student has access to a laboratory with the following equipment: • electronic balance (can record masses to the nearest 0.01 g) • measuring cylinders (10 cm3 and 100 cm3) • beakers (100 cm3) • large test-tubes • thermometers • stirring rods • freezer (a) The student uses some of the equipment to prepare five solutions of different salinity, using pure water and dry salt. Describe a method for the student to use to prepare the five solutions. … … … … … … … … [4] (b) The student has access to a freezer set to –25 °C with a glass door. Describe a method to reliably record the freezing point for the five solutions. Equipment from the list may be chosen. … … … … … … … … [3] (c) Draw a results table for this investigation to show the final results. Include full headings in the table, but do not write in any results. Include units where appropriate. [2] (d) Use the axes below to sketch the relationship you would expect to find between salinity and freezing point. Label the axes. … … [1] [Total: 10]
10 marks
Mark scheme: Question Answer Marks 1(a) use of (appropriate) measuring cylinder to measure (stated) volume of (pure) water ; 4 use of (electronic) balance to measure (stated) mass of (dry) salt ; description of how to produce different salinities ; mixing / stirring until (fully) dissolved ; 1(b) use of thermometer to, record / measure / observe, freezing point / solution freezing ; 3 idea of repeated measurements for each salinity ; idea of calculate mean from repeats / identify anomalies ; 1(c) usable table with columns or rows, both headings as either column headings or row headings: 2 ‘salinity’ AND ‘freezing, point / temperature (of solution)’ ; salinity / ppt freezing, point or temperature / °C ppt AND °C ; 1(d) both axes labelled (‘salinity’ and ‘freezing point’) 1 + any line from top left towards bottom right / bar chart with three or more decreasing height bars from left to right ;
This question in 9693/21 Oct/Nov 2025
Q11 · A student investigated the effect of salinity on the freezing point of water 9693/22 Oct/Nov 2025
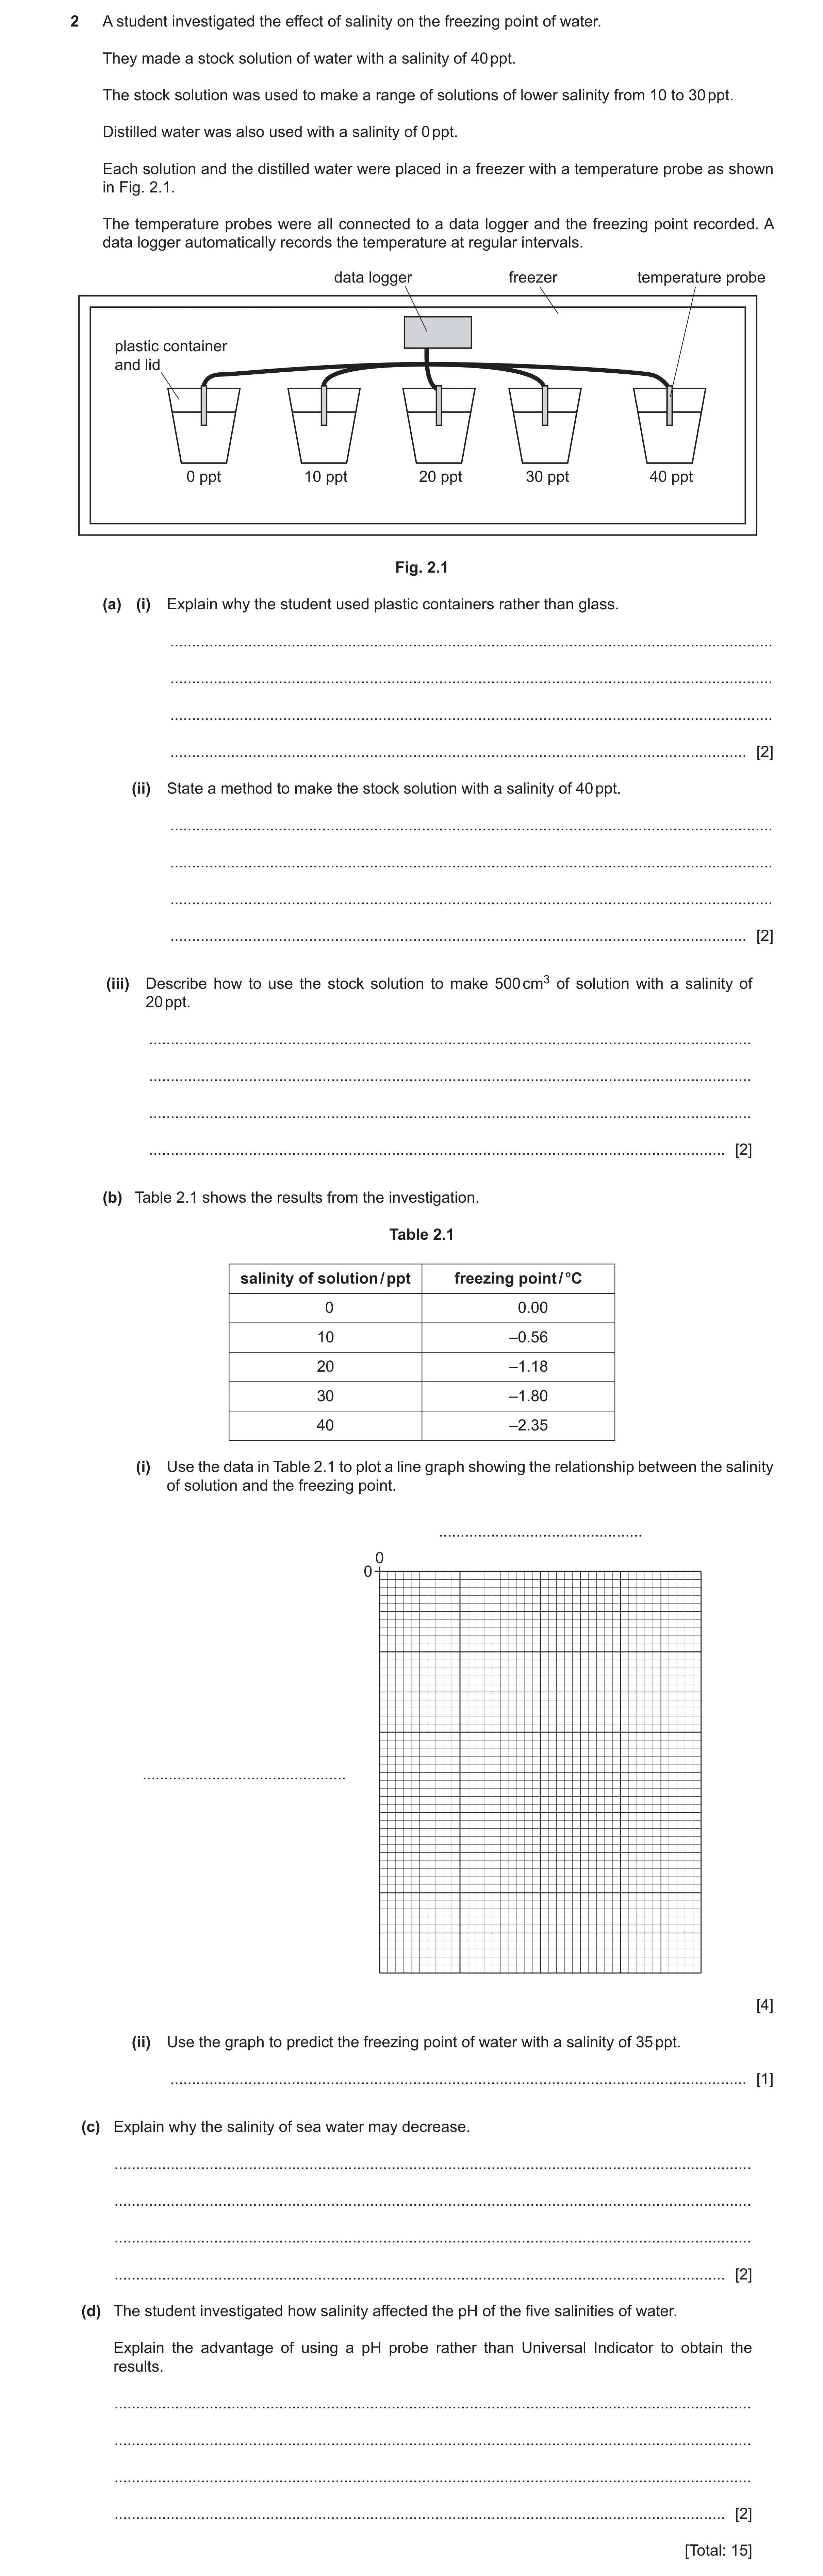
2 A student investigated the effect of salinity on the freezing point of water. They made a stock solution of water with a salinity of 40 ppt. The stock solution was used to make a range of solutions of lower salinity from 10 to 30 ppt. Distilled water was also used with a salinity of 0 ppt. Each solution and the distilled water were placed in a freezer with a temperature probe as shown in Fig. 2.1. The temperature probes were all connected to a data logger and the freezing point recorded. A data logger automatically records the temperature at regular intervals. data logger freezer temperature probe plastic container and lid 0 ppt 10 ppt 20 ppt 30 ppt 40 ppt Fig. 2.1 (a) (i) Explain why the student used plastic containers rather than glass. … … … … [2] (ii) State a method to make the stock solution with a salinity of 40 ppt. … … … … [2] (iii) Describe how to use the stock solution to make 500 cm3 of solution with a salinity of 20 ppt. … … … … [2] (b) Table 2.1 shows the results from the investigation. Table 2.1 salinity of solution / ppt freezing point / °C 0 0.00 10 –0.56 20 –1.18 30 –1.80 40 –2.35 (i) Use the data in Table 2.1 to plot a line graph showing the relationship between the salinity of solution and the freezing point. … 0 0 … [4] (ii) Use the graph to predict the freezing point of water with a salinity of 35 ppt. … [1] (c) Explain why the salinity of sea water may decrease. … … … … [2] (d) The student investigated how salinity affected the pH of the five salinities of water. Explain the advantage of using a pH probe rather than Universal Indicator to obtain the results. … … … … [2] [Total: 15]
15 marks
Mark scheme: 2(a)(i) water expanding as it freezes (due to hydrogen bonding) ; 2 reference to hazard of broken glass / plastic is flexible ; 2(a)(ii) stated mass of salt / sodium chloride ; 2 dissolved in stated volume of water ; 2(a)(iii) add known volume of stock solution to measuring cylinder ; 2 top up with distilled water to correct stated volume ; 2(b)(i) both axes labelled with units ; 4 suitable linear scale ; points, plotted correctly ½ small square (including 0,0) ; suitable line ; 2(b)(ii) correct reading from their plotted graph ; 1 2(c) addition of fresh water ; 2 plus any one from: from precipitation / rain ; from run-off ; 2(d)(i) Universal Indicator is not sensitive enough to distinguish differences ; 2 pH probe is more precise ;
This question in 9693/22 Oct/Nov 2025
Q12 · A student investigated the effect of salinity on the freezing point of water 9693/23 Oct/Nov 2025
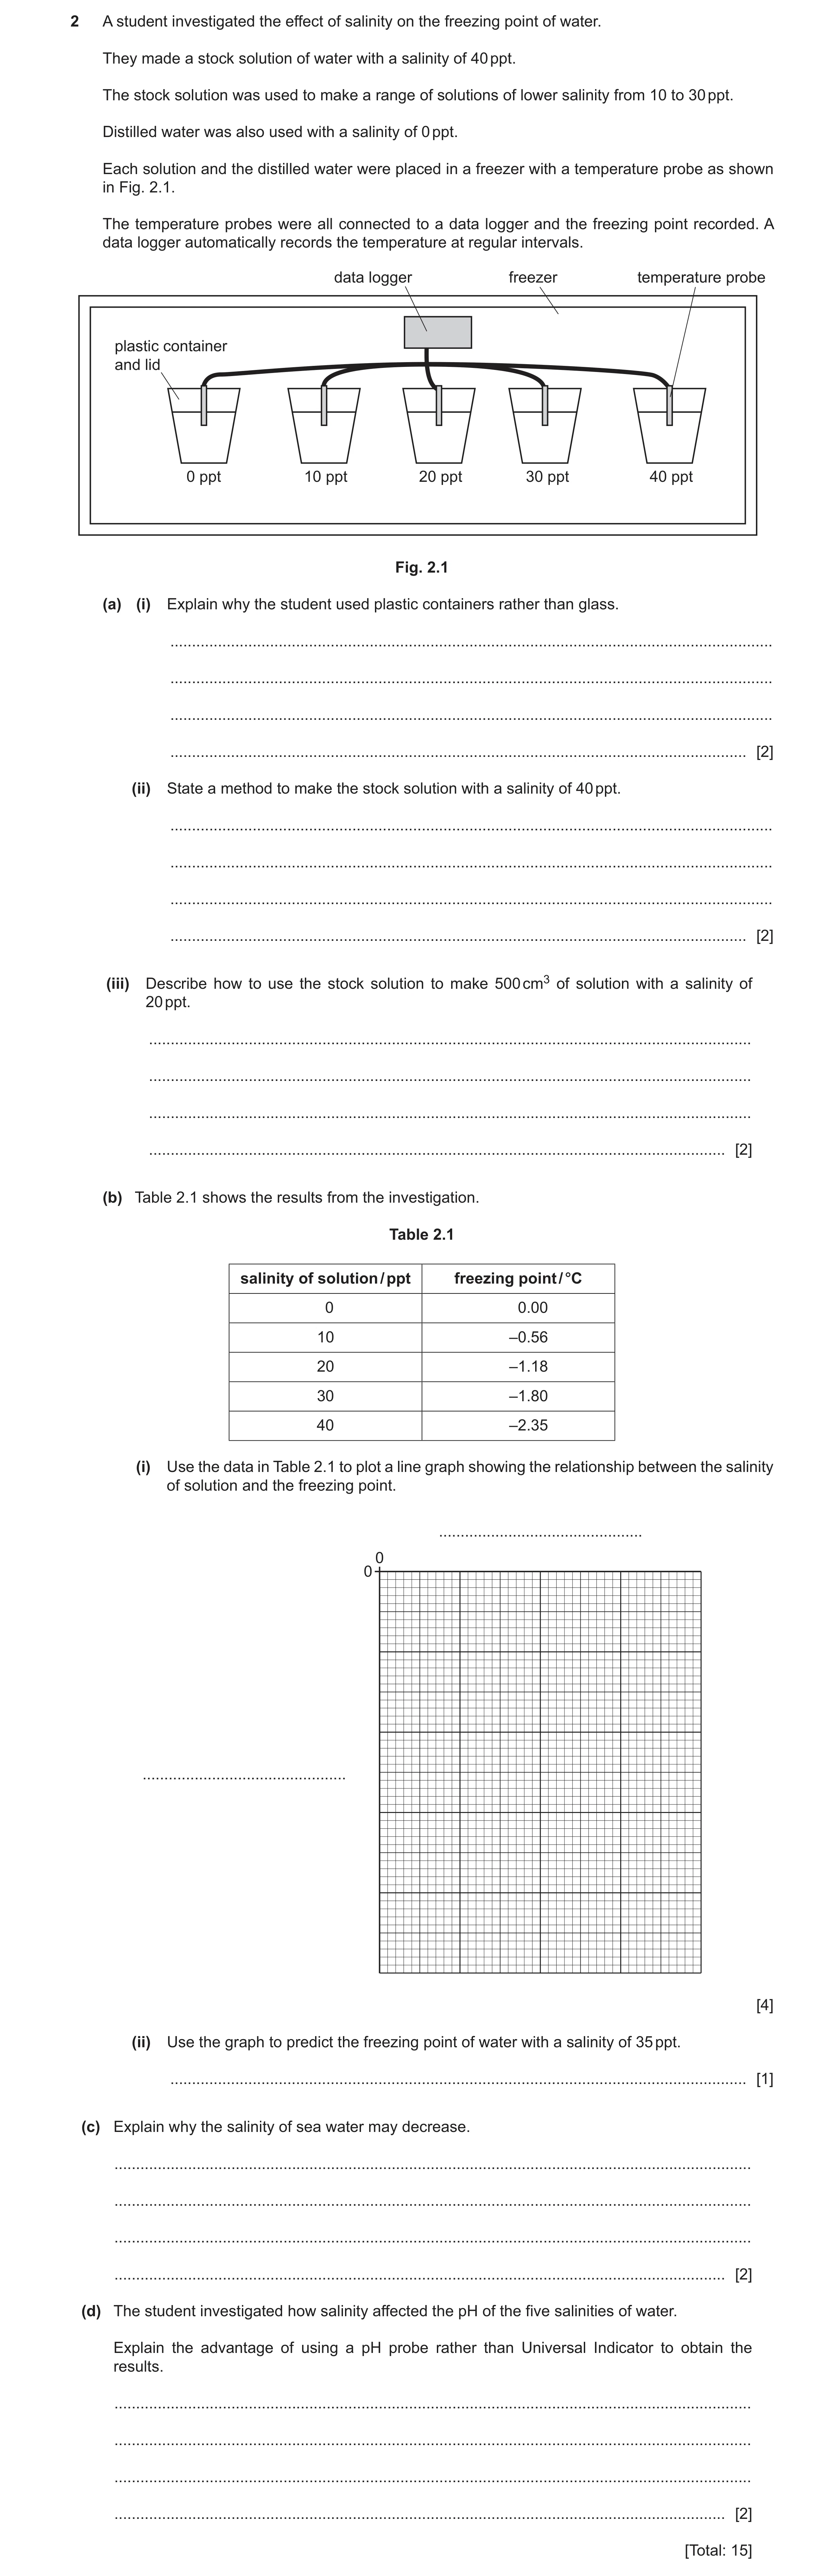
2 A student investigated the effect of salinity on the freezing point of water. They made a stock solution of water with a salinity of 40 ppt. The stock solution was used to make a range of solutions of lower salinity from 10 to 30 ppt. Distilled water was also used with a salinity of 0 ppt. Each solution and the distilled water were placed in a freezer with a temperature probe as shown in Fig. 2.1. The temperature probes were all connected to a data logger and the freezing point recorded. A data logger automatically records the temperature at regular intervals. data logger freezer temperature probe plastic container and lid 0 ppt 10 ppt 20 ppt 30 ppt 40 ppt Fig. 2.1 (a) (i) Explain why the student used plastic containers rather than glass. … … … … [2] (ii) State a method to make the stock solution with a salinity of 40 ppt. … … … … [2] (iii) Describe how to use the stock solution to make 500 cm3 of solution with a salinity of 20 ppt. … … … … [2] (b) Table 2.1 shows the results from the investigation. Table 2.1 salinity of solution / ppt freezing point / °C 0 0.00 10 –0.56 20 –1.18 30 –1.80 40 –2.35 (i) Use the data in Table 2.1 to plot a line graph showing the relationship between the salinity of solution and the freezing point. … 0 0 … [4] (ii) Use the graph to predict the freezing point of water with a salinity of 35 ppt. … [1] (c) Explain why the salinity of sea water may decrease. … … … … [2] (d) The student investigated how salinity affected the pH of the five salinities of water. Explain the advantage of using a pH probe rather than Universal Indicator to obtain the results. … … … … [2] [Total: 15]
15 marks
Mark scheme: 2(a)(i) water expanding as it freezes (due to hydrogen bonding) ; 2 reference to hazard of broken glass / plastic is flexible ; 2(a)(ii) stated mass of salt / sodium chloride ; 2 dissolved in stated volume of water ; 2(a)(iii) add known volume of stock solution to measuring cylinder ; 2 top up with distilled water to correct stated volume ; 2(b)(i) both axes labelled with units ; 4 suitable linear scale ; points, plotted correctly ½ small square (including 0,0) ; suitable line ; 2(b)(ii) correct reading from their plotted graph ; 1 2(c) addition of fresh water ; 2 plus any one from: from precipitation / rain ; from run-off ; 2(d)(i) Universal Indicator is not sensitive enough to distinguish differences ; 2 pH probe is more precise ;
This question in 9693/23 Oct/Nov 2025
 10
10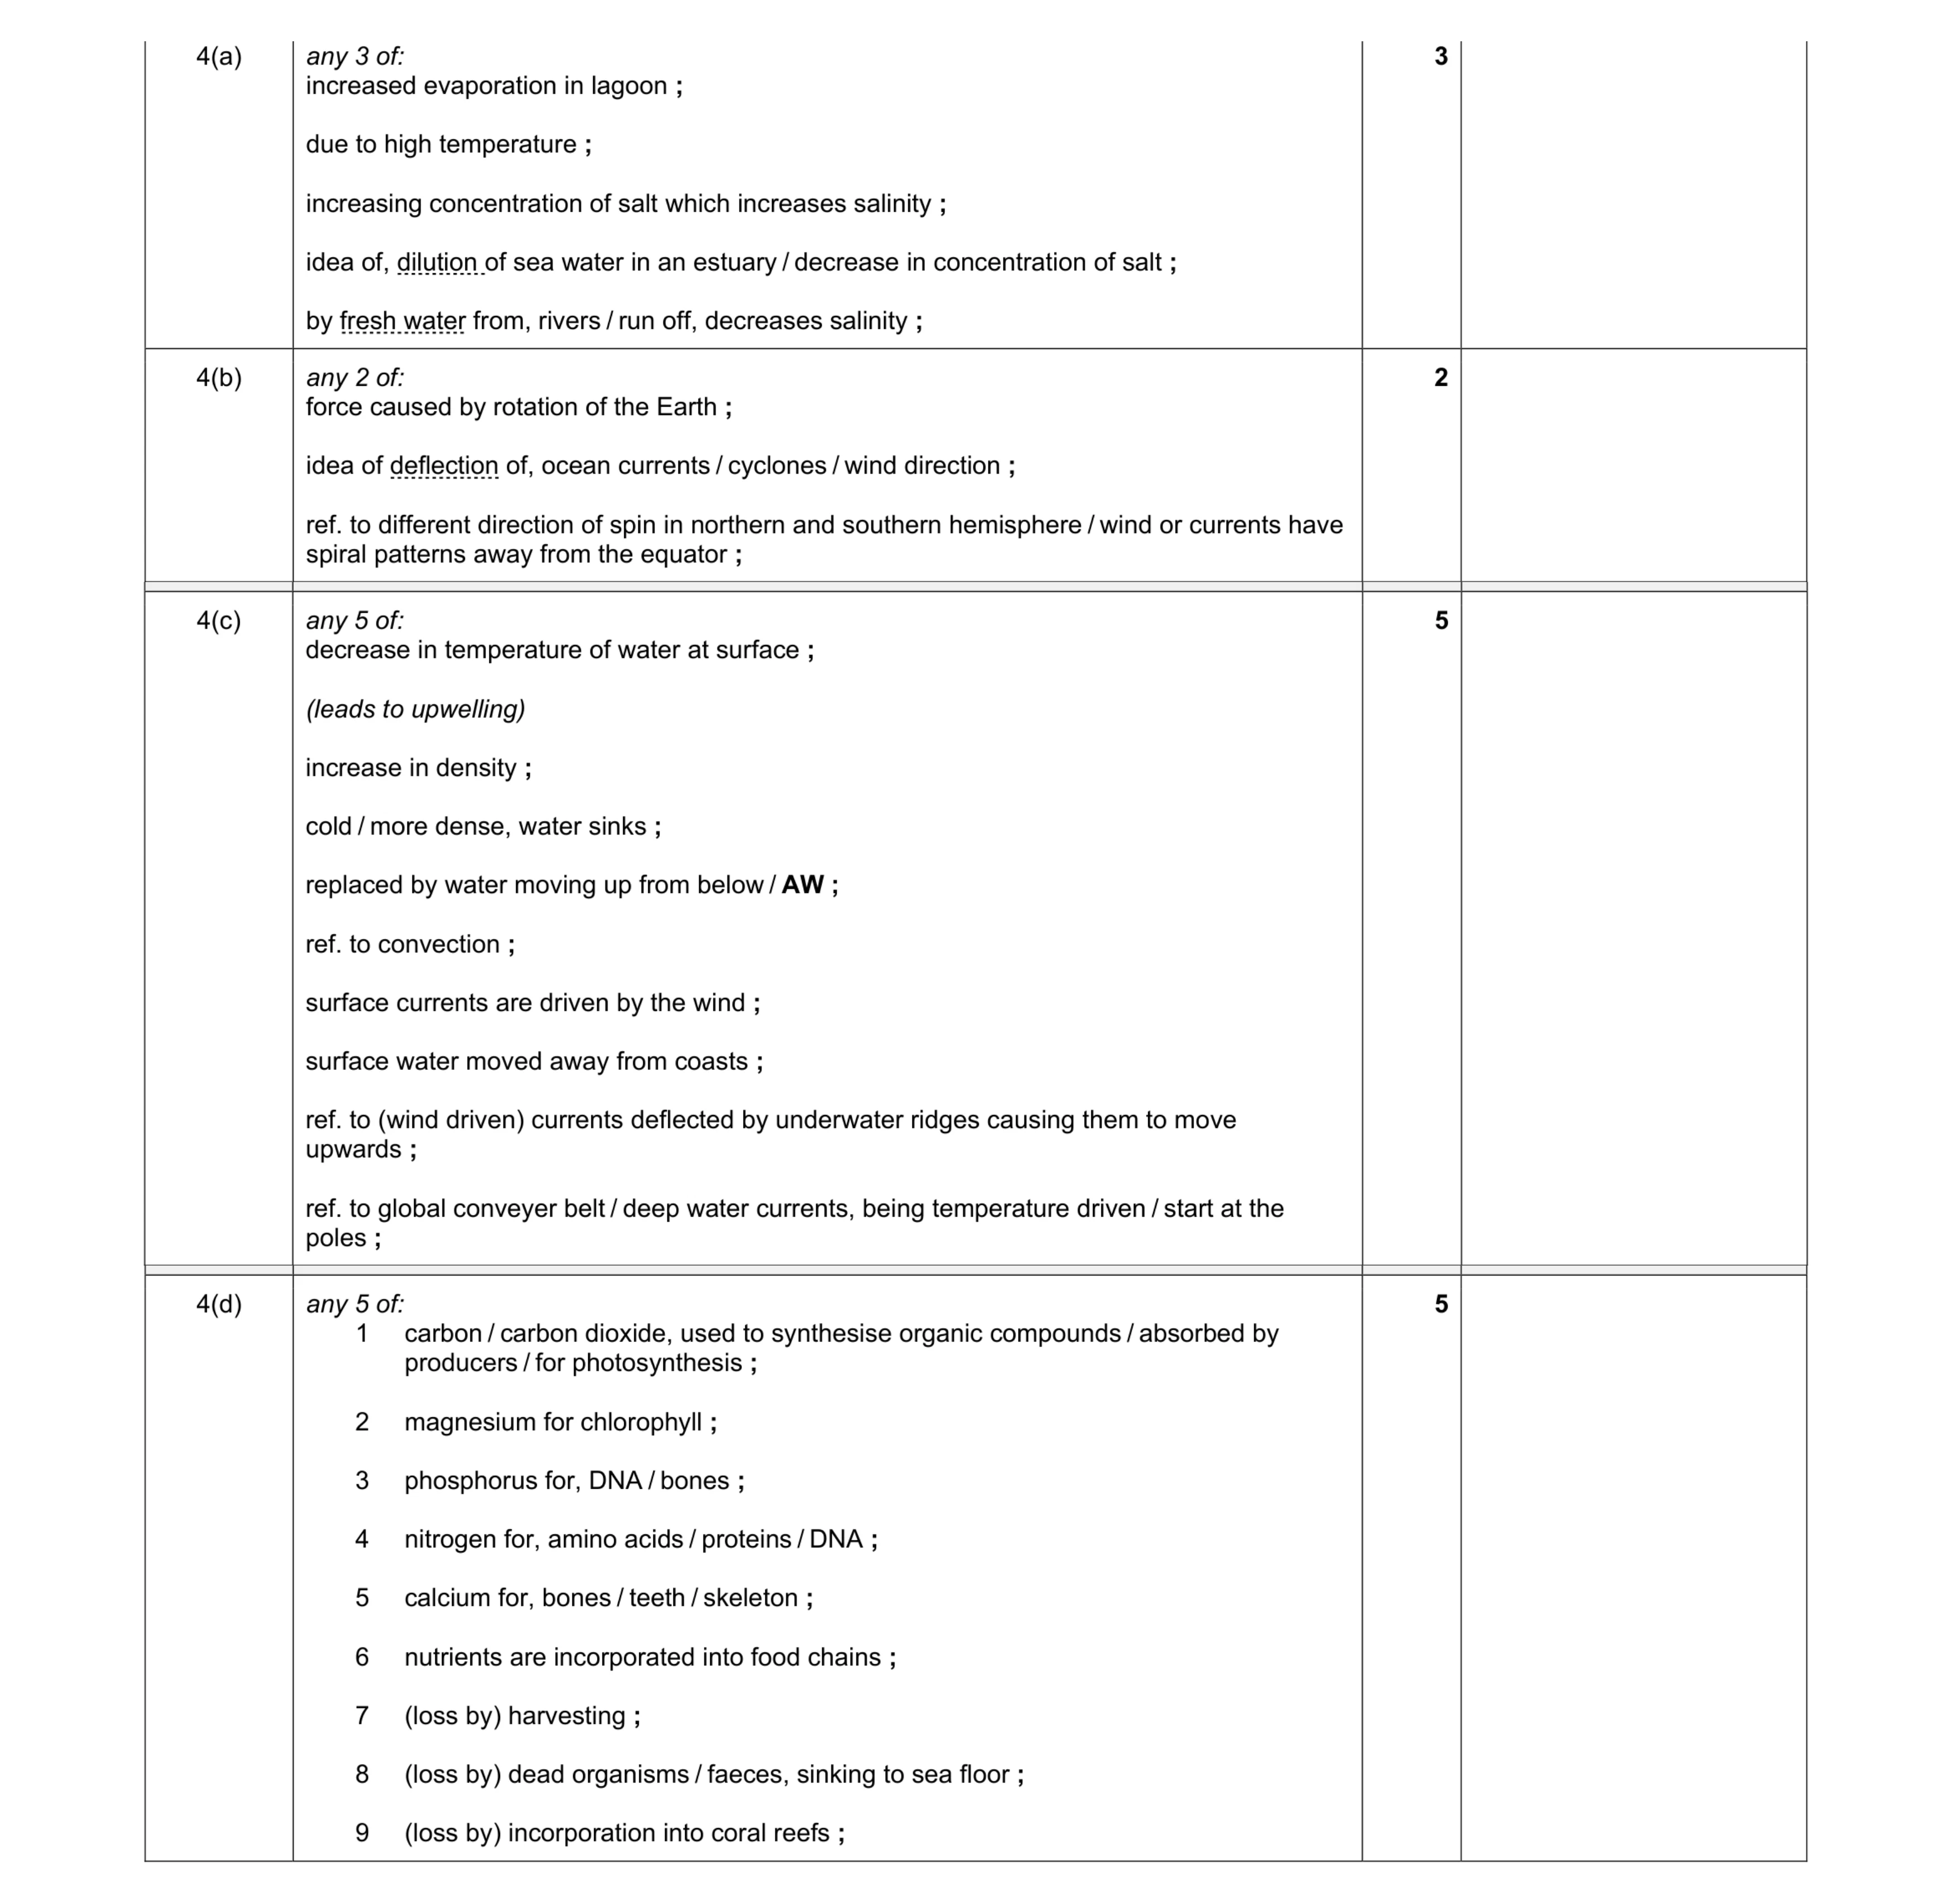 15
15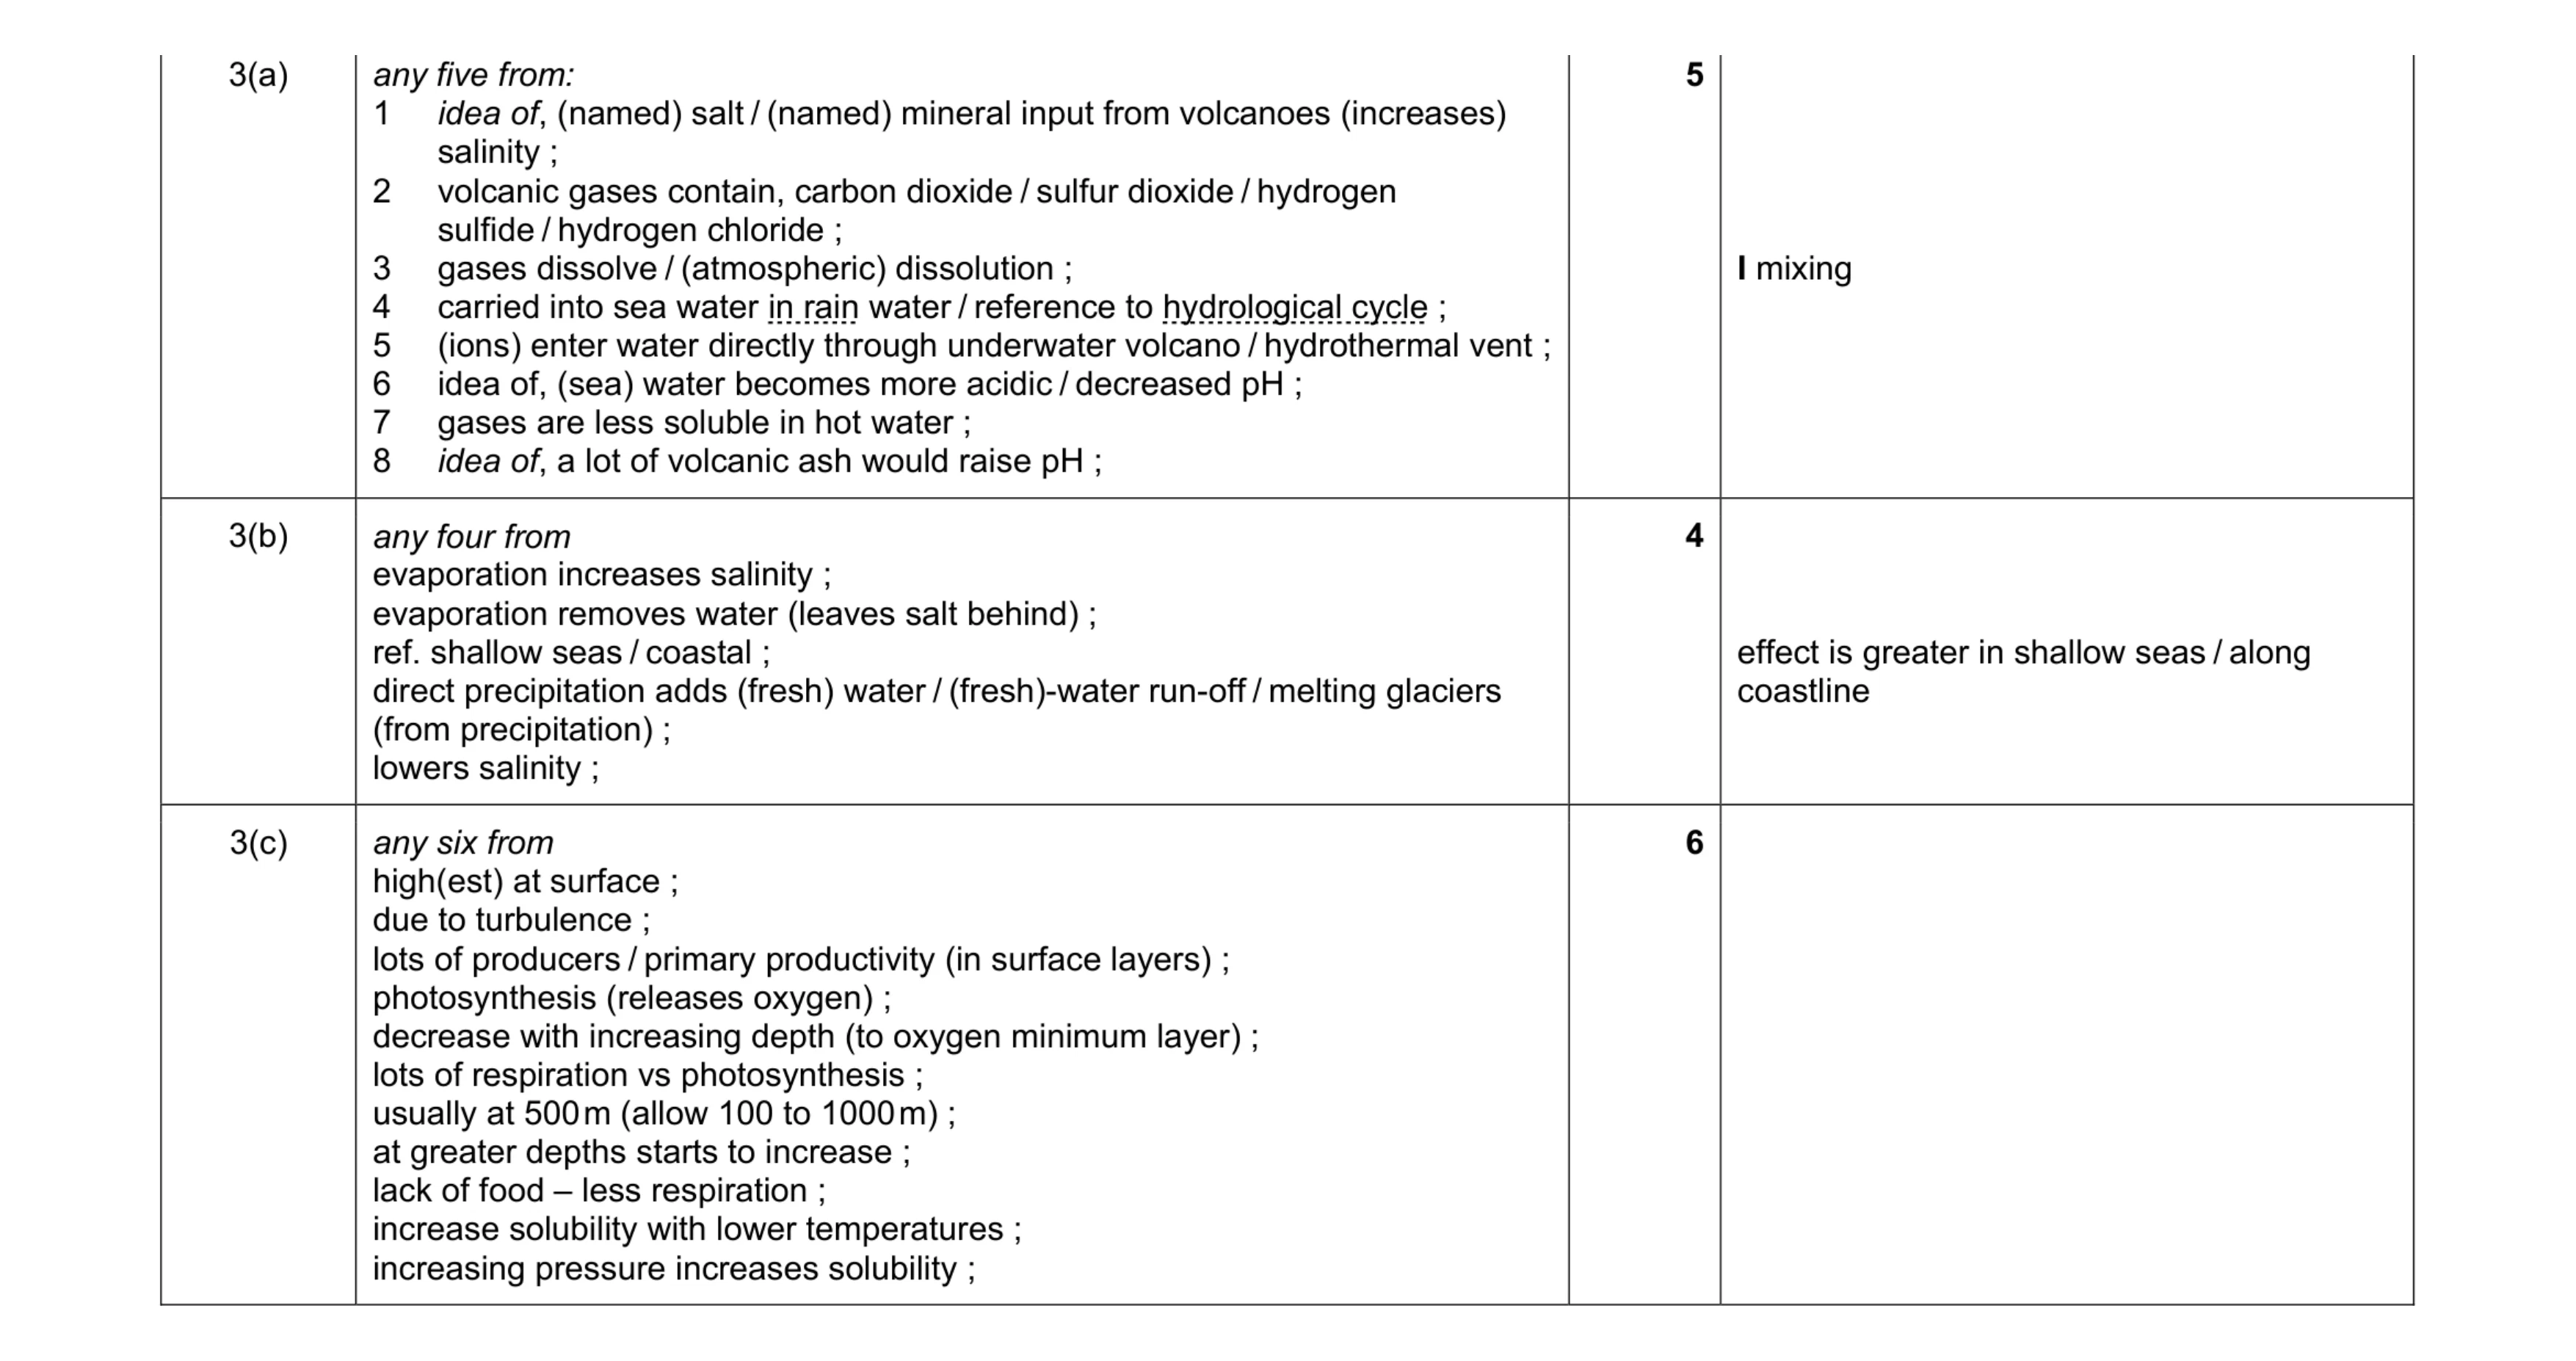 15
15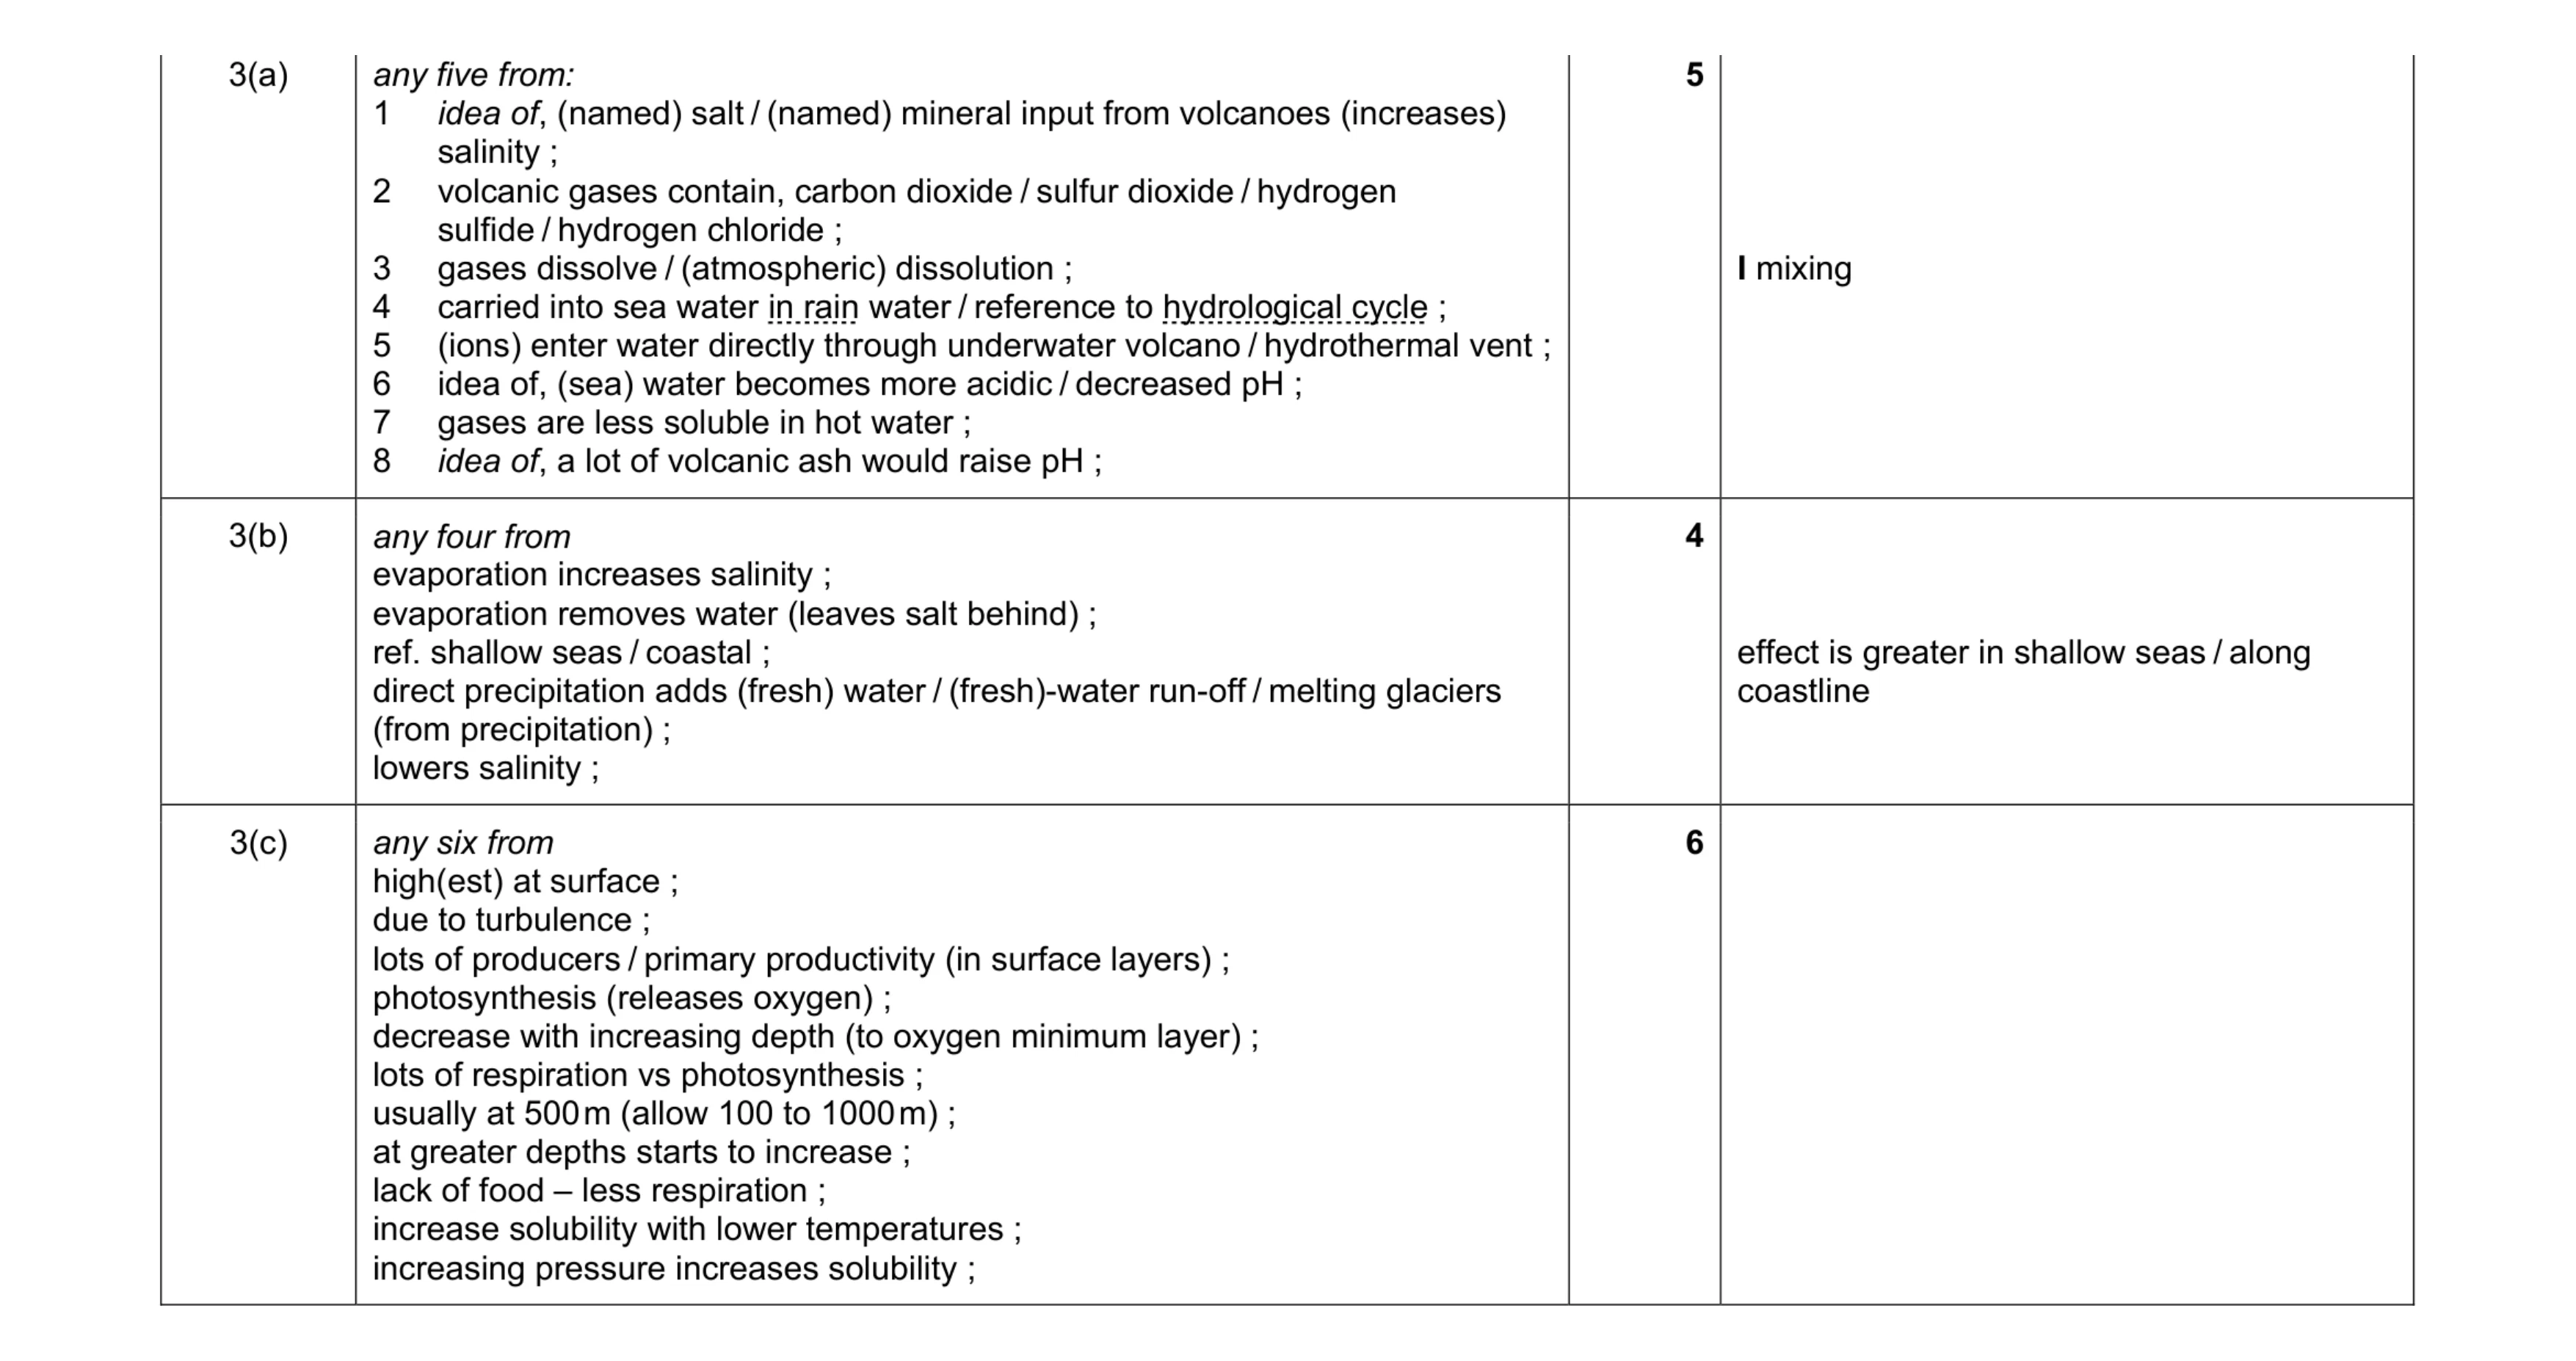 15
15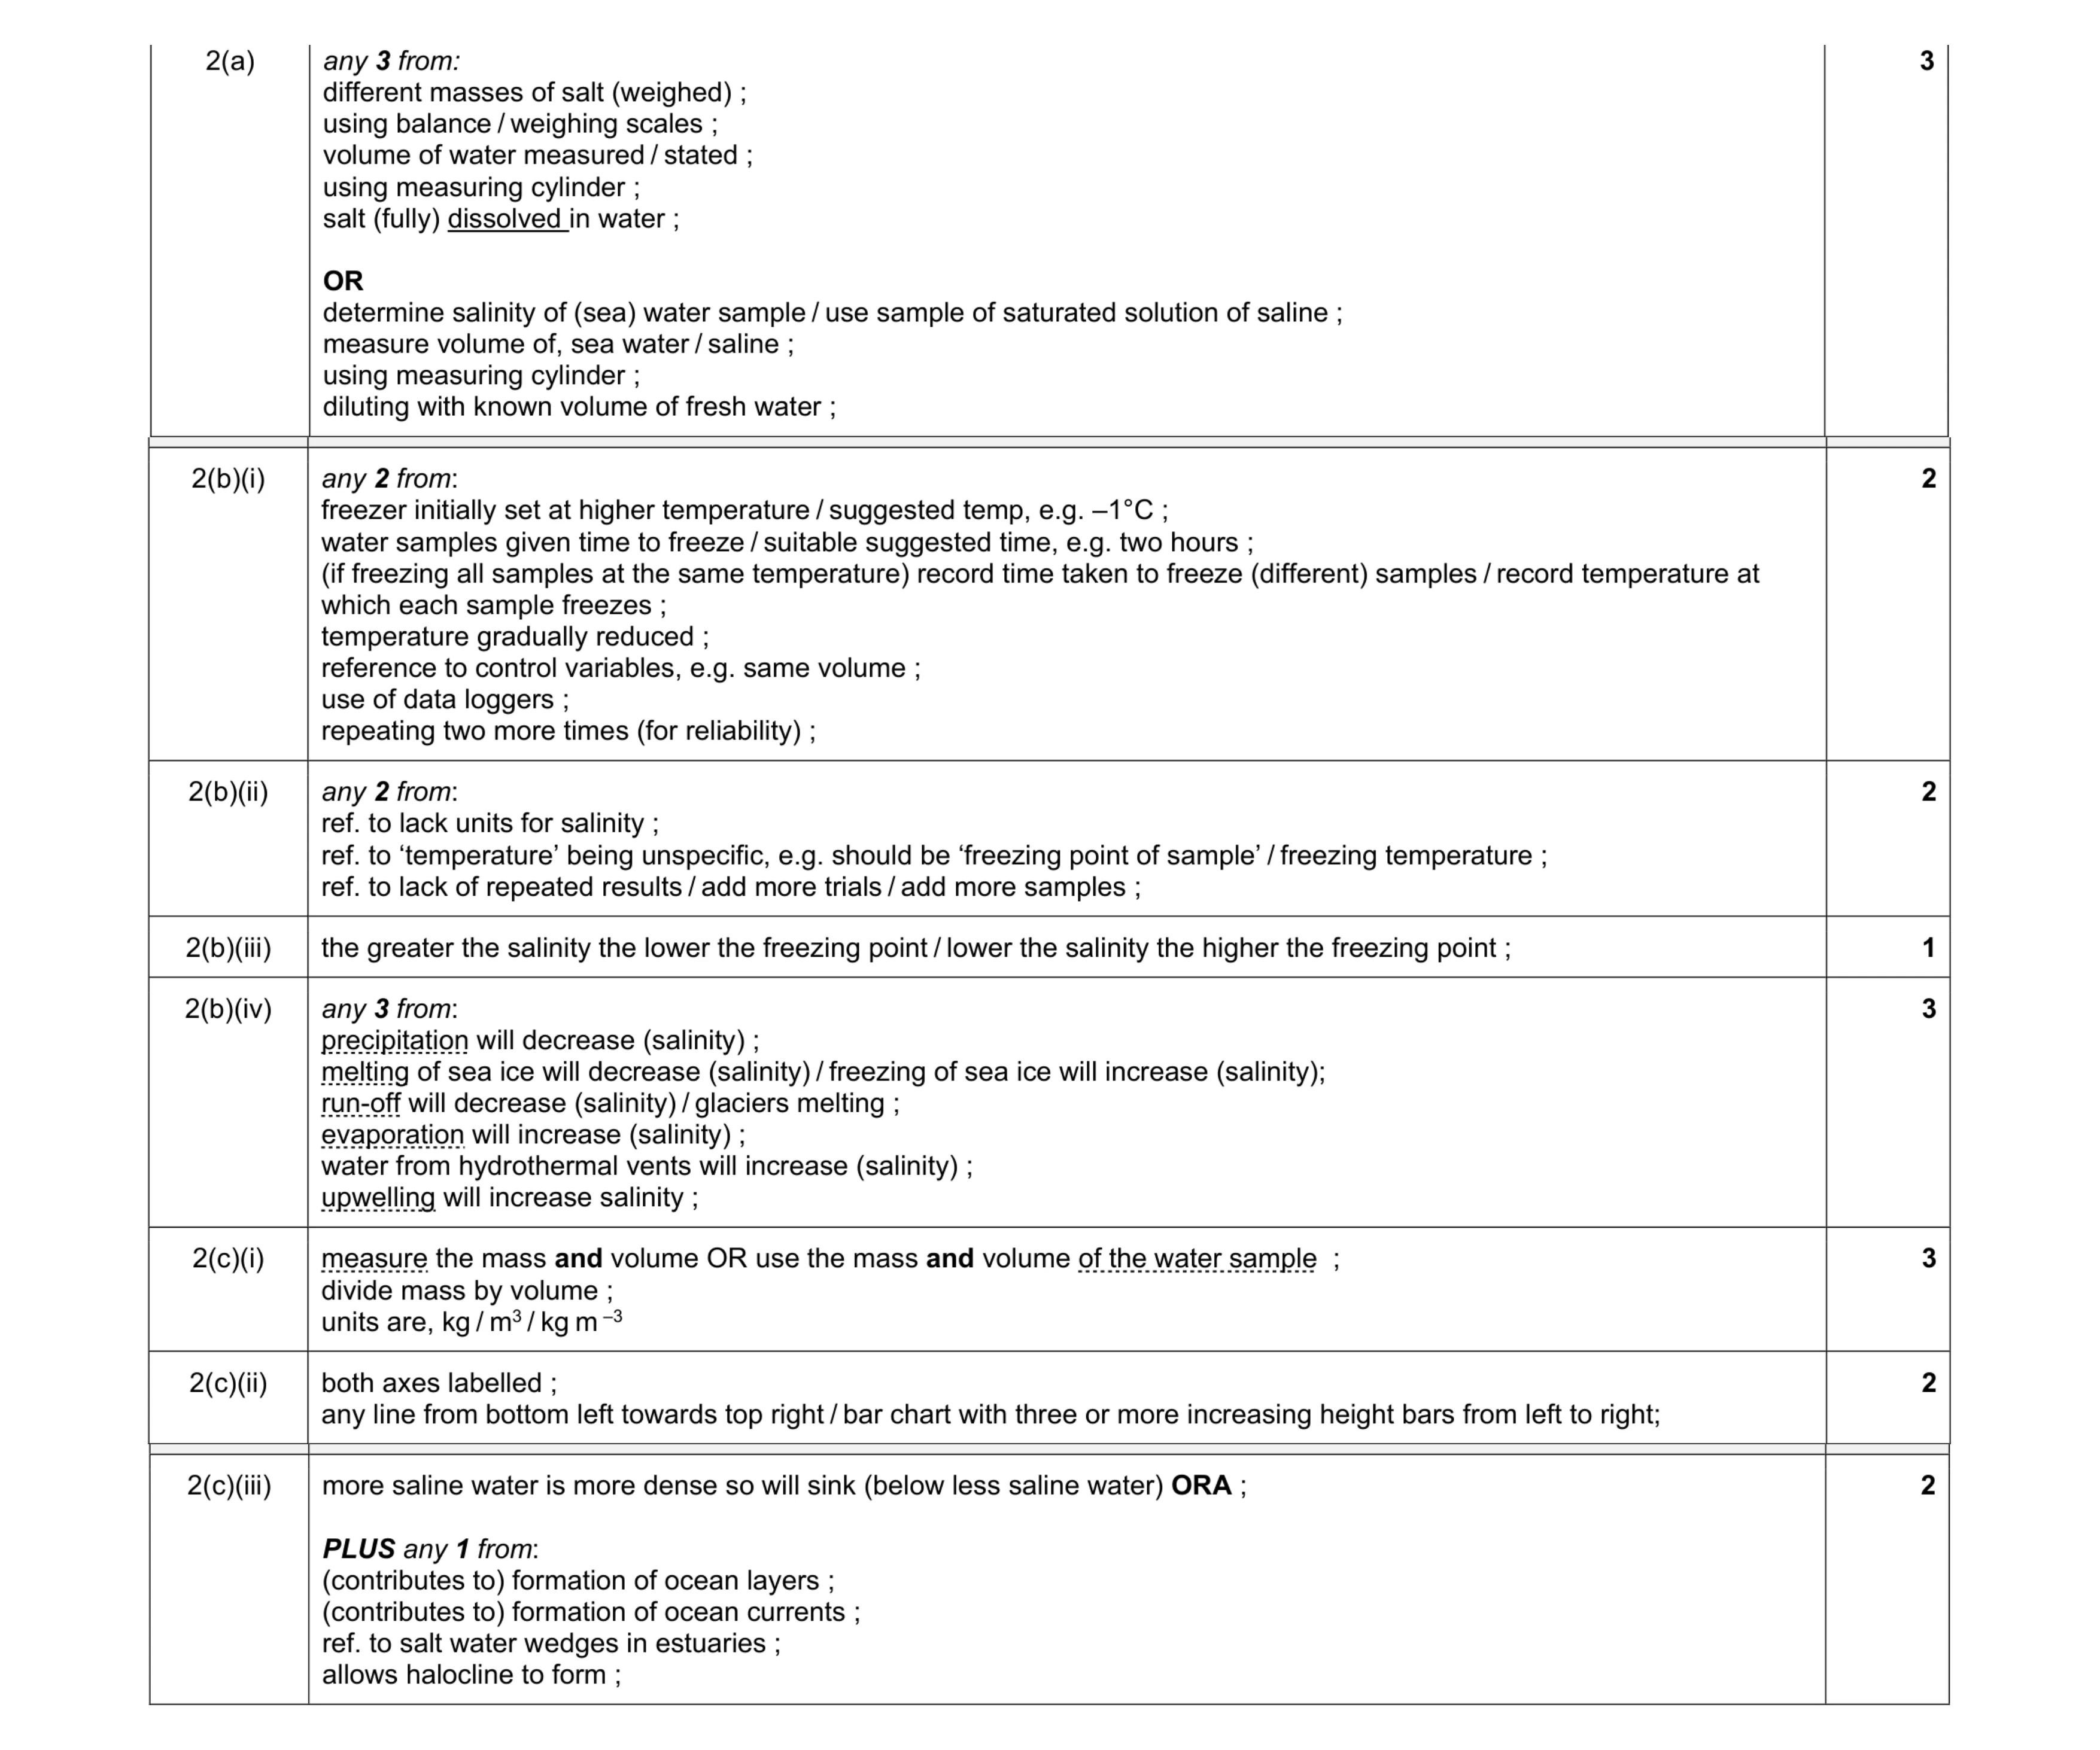 18
18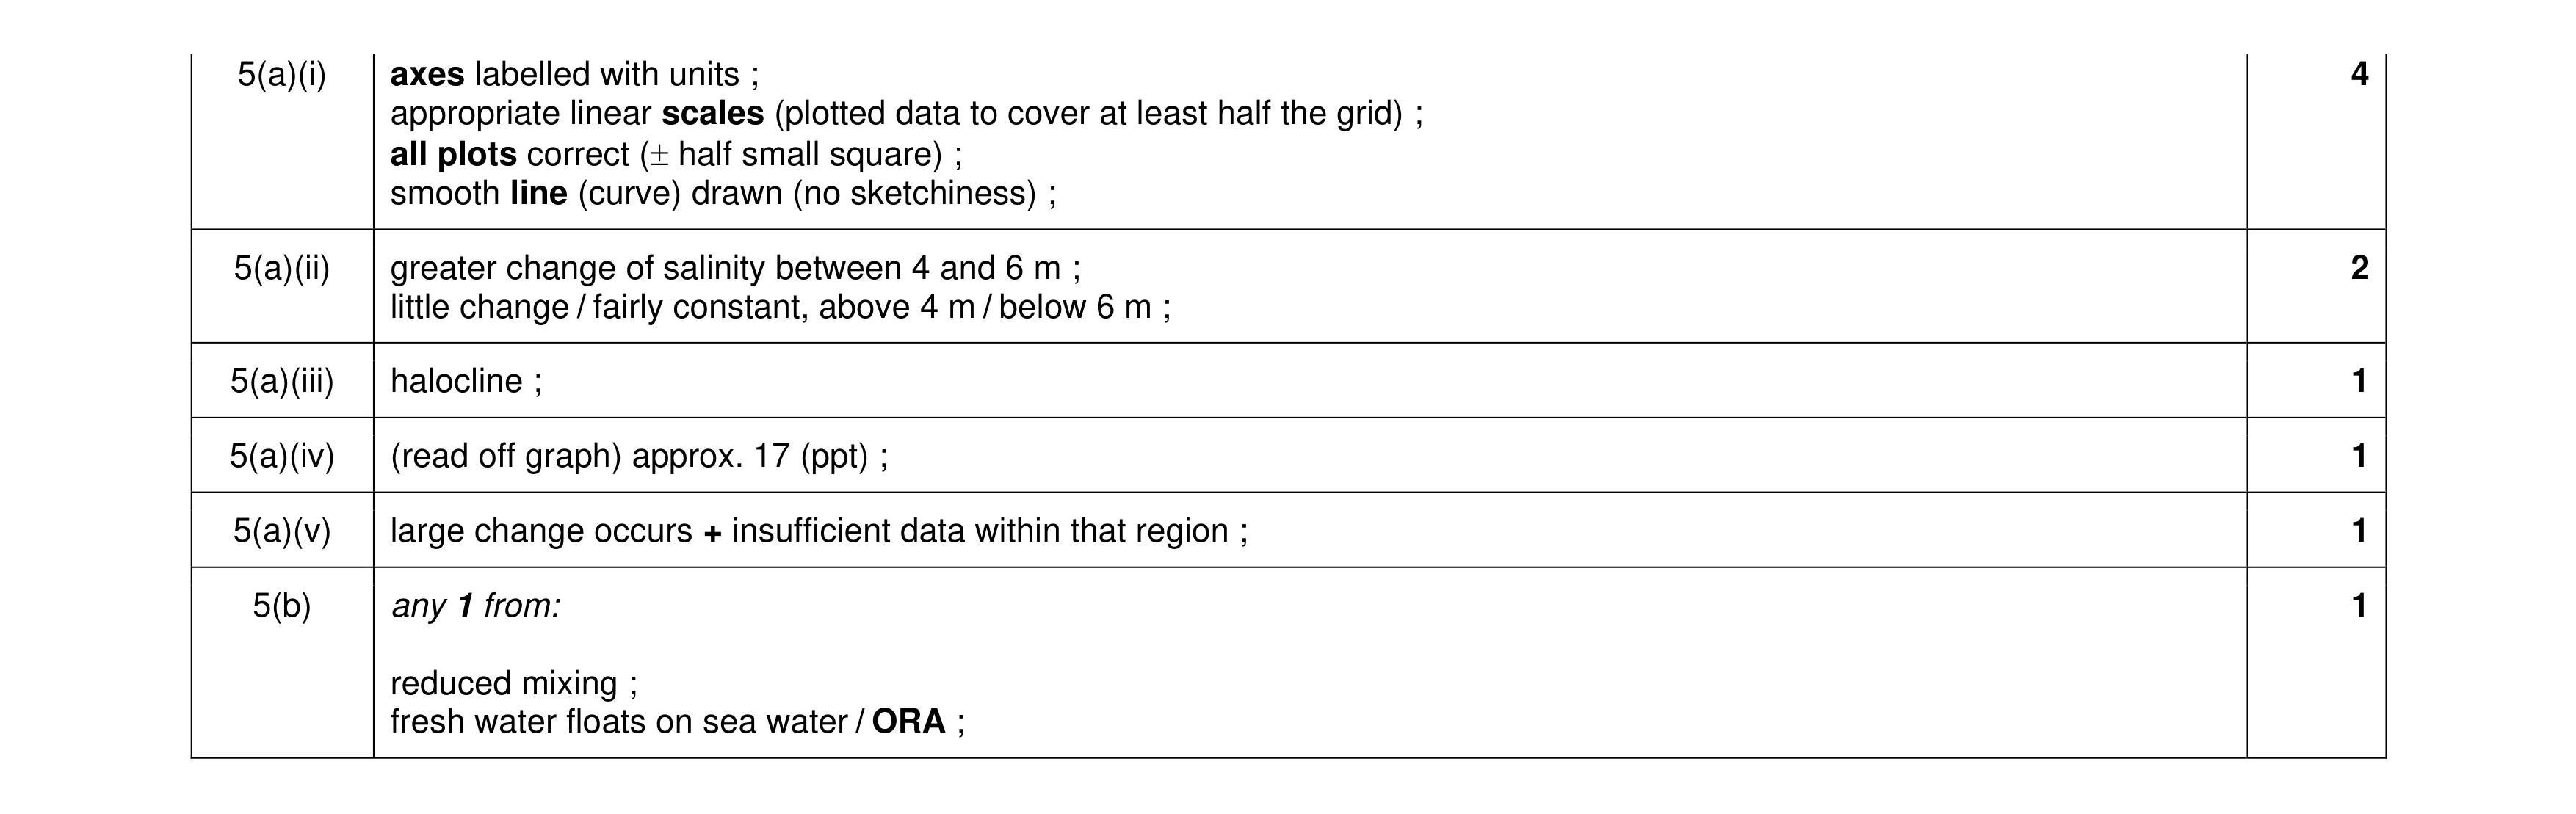 10
10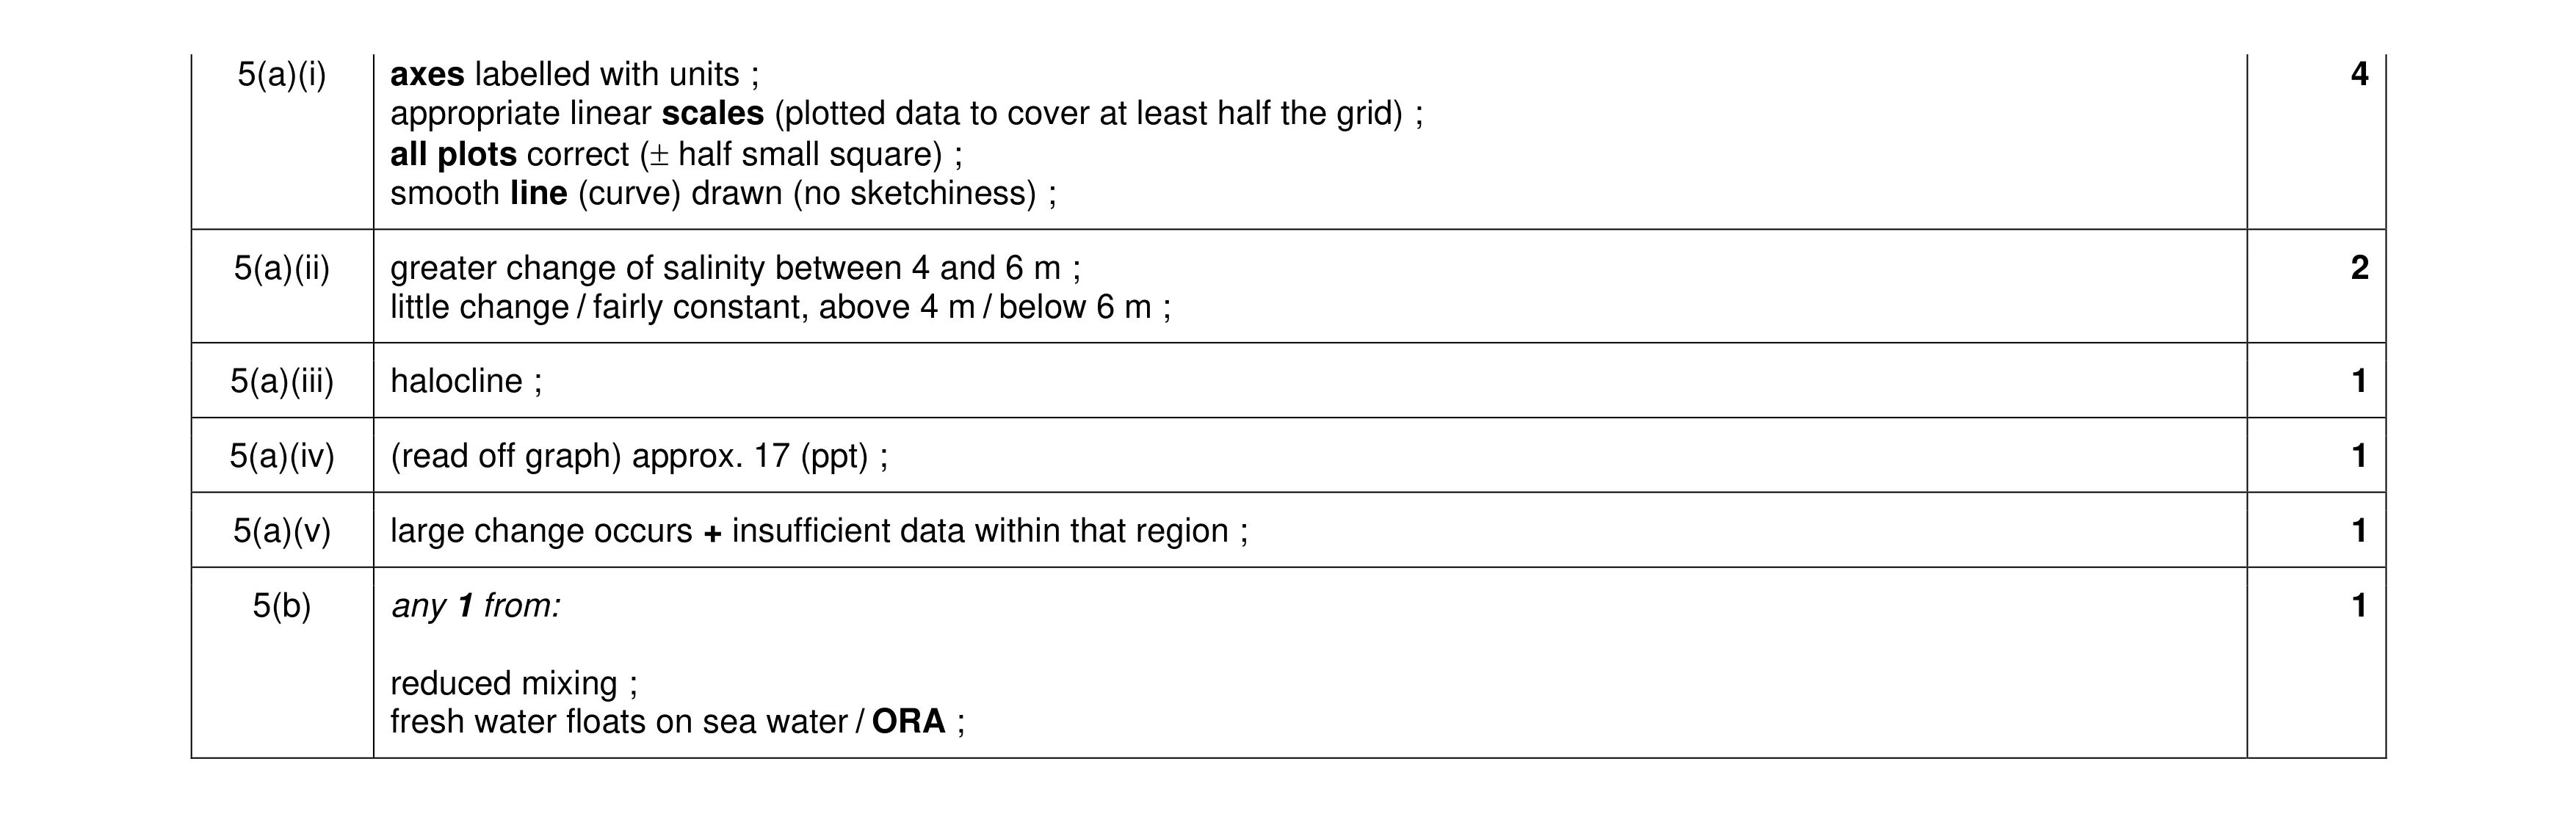 10
10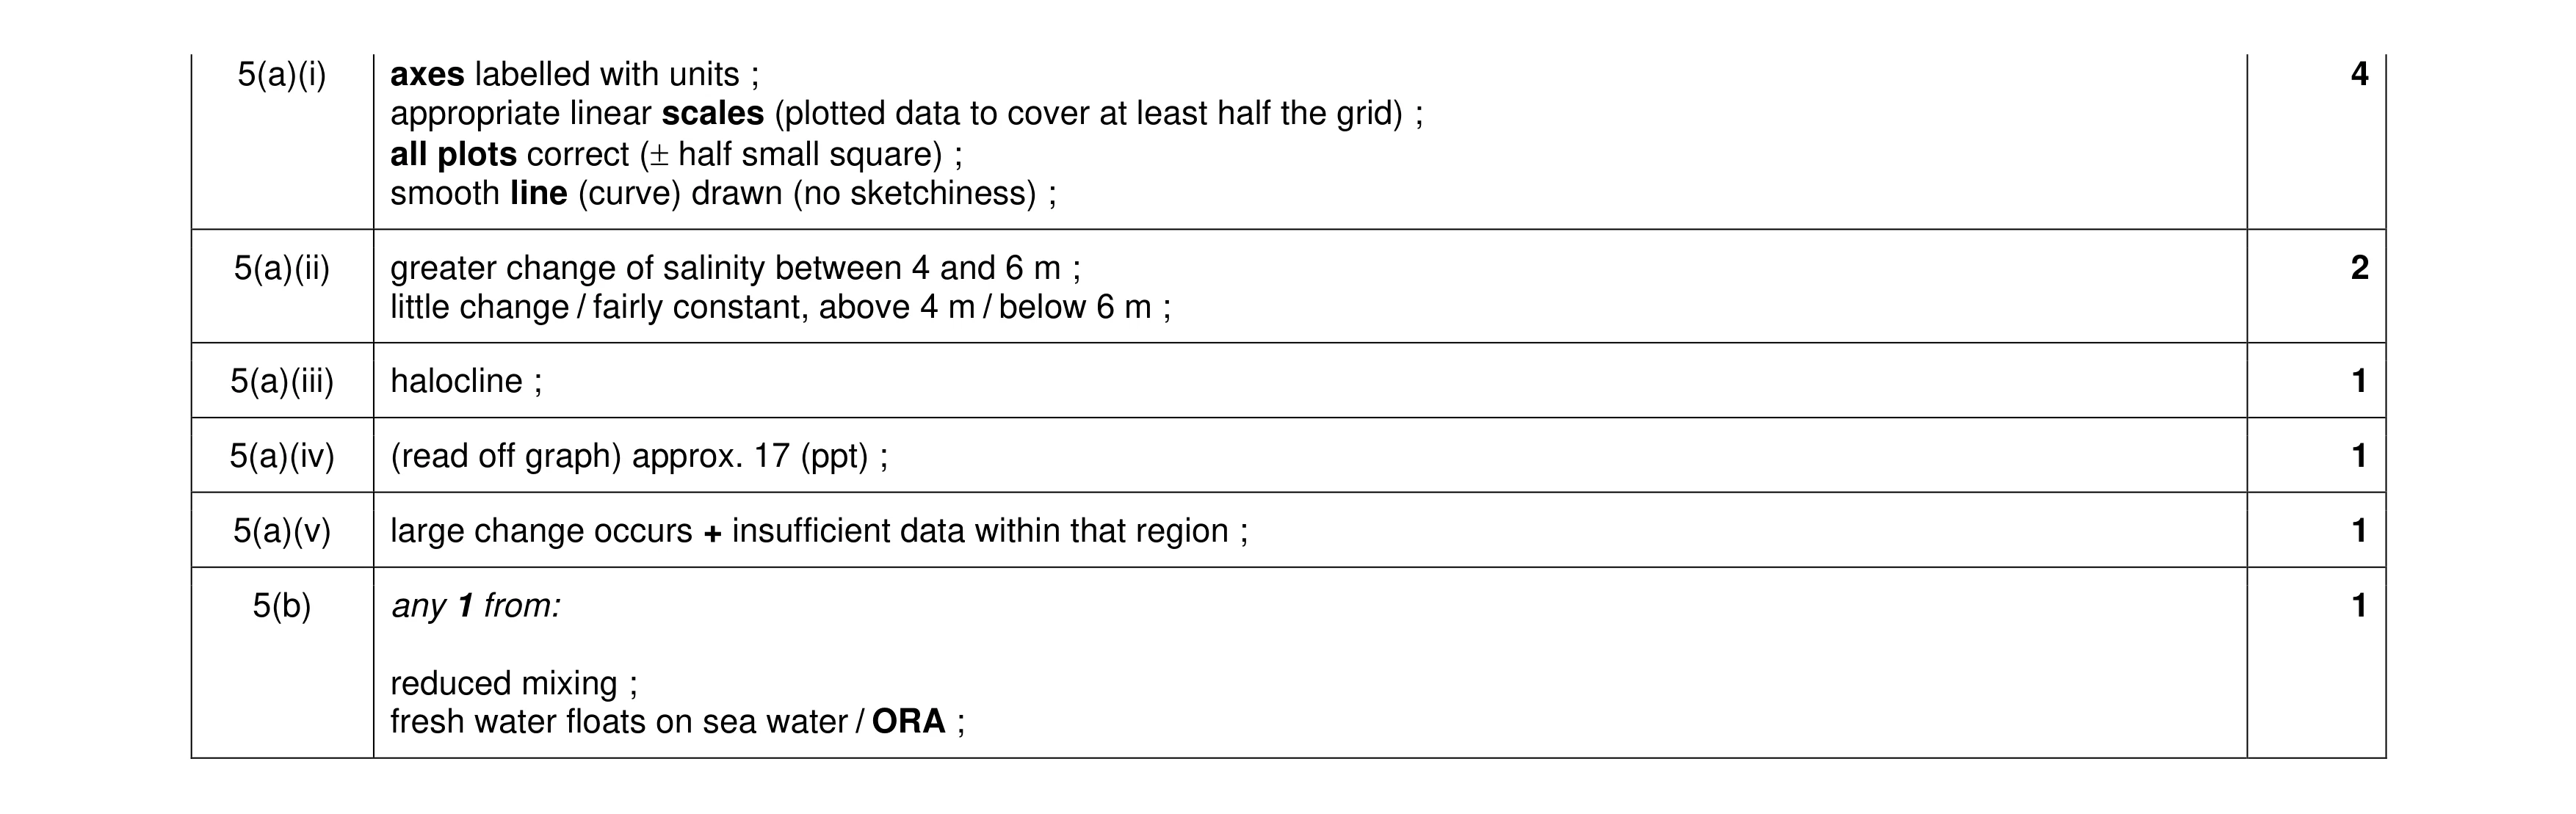 10
10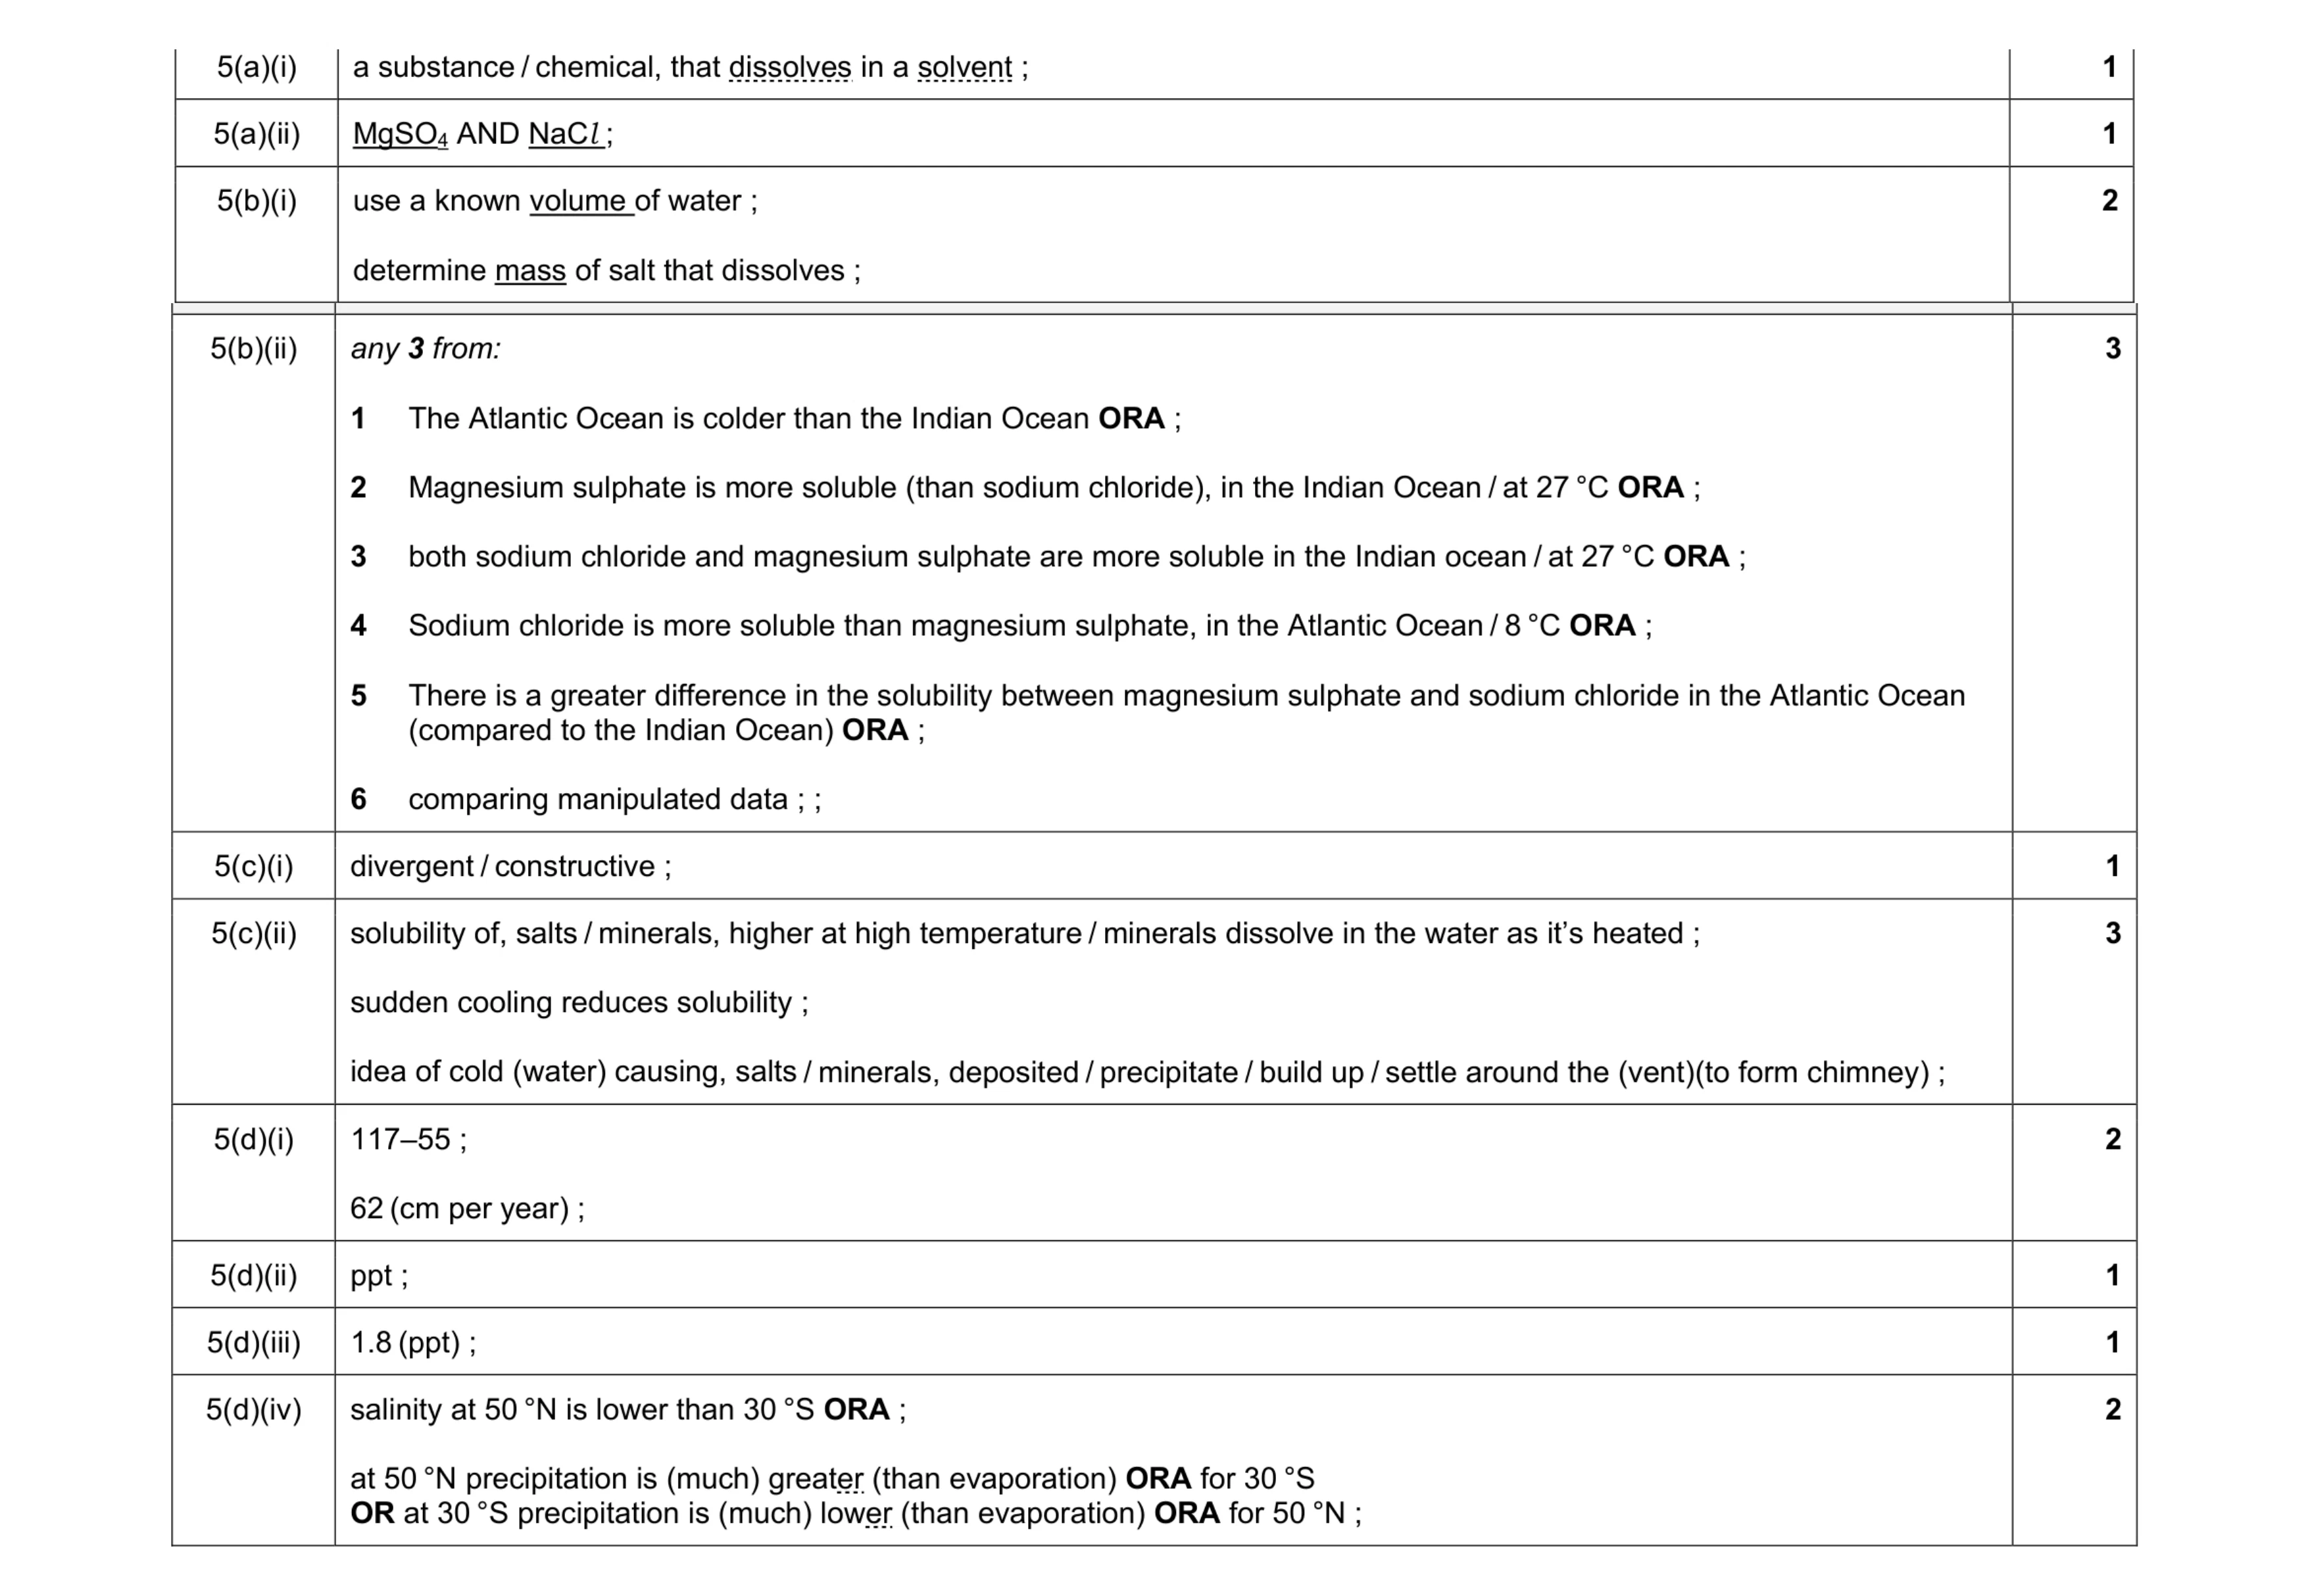 11
11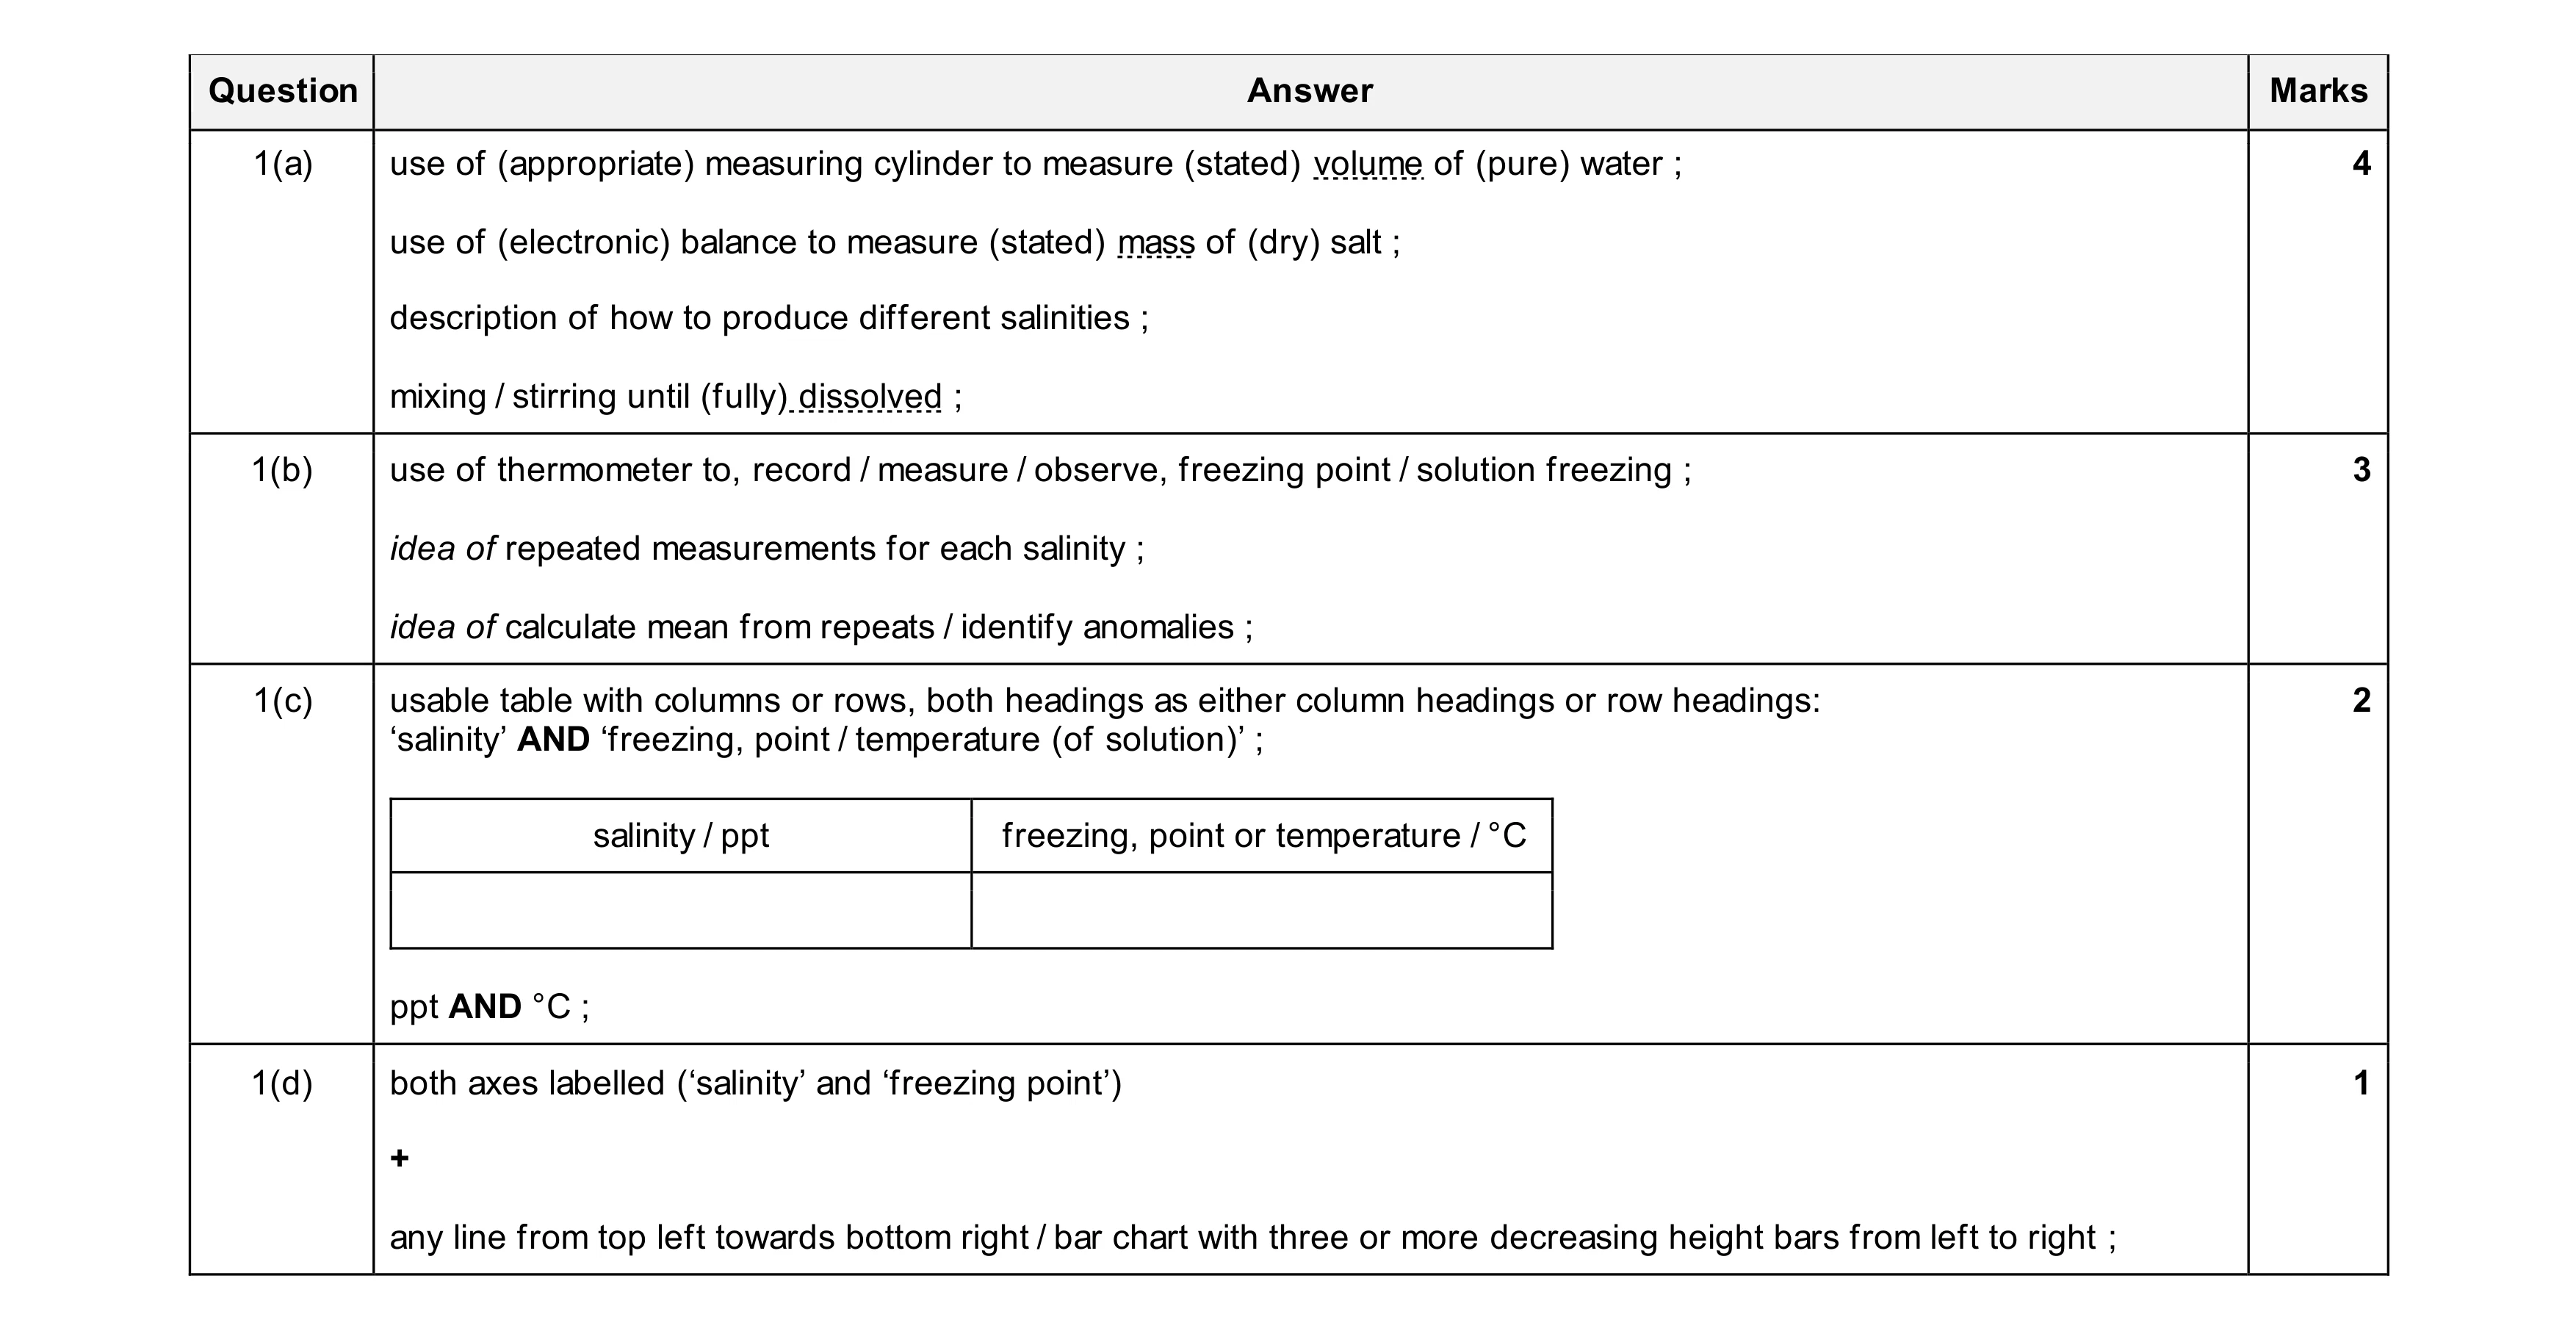 10
10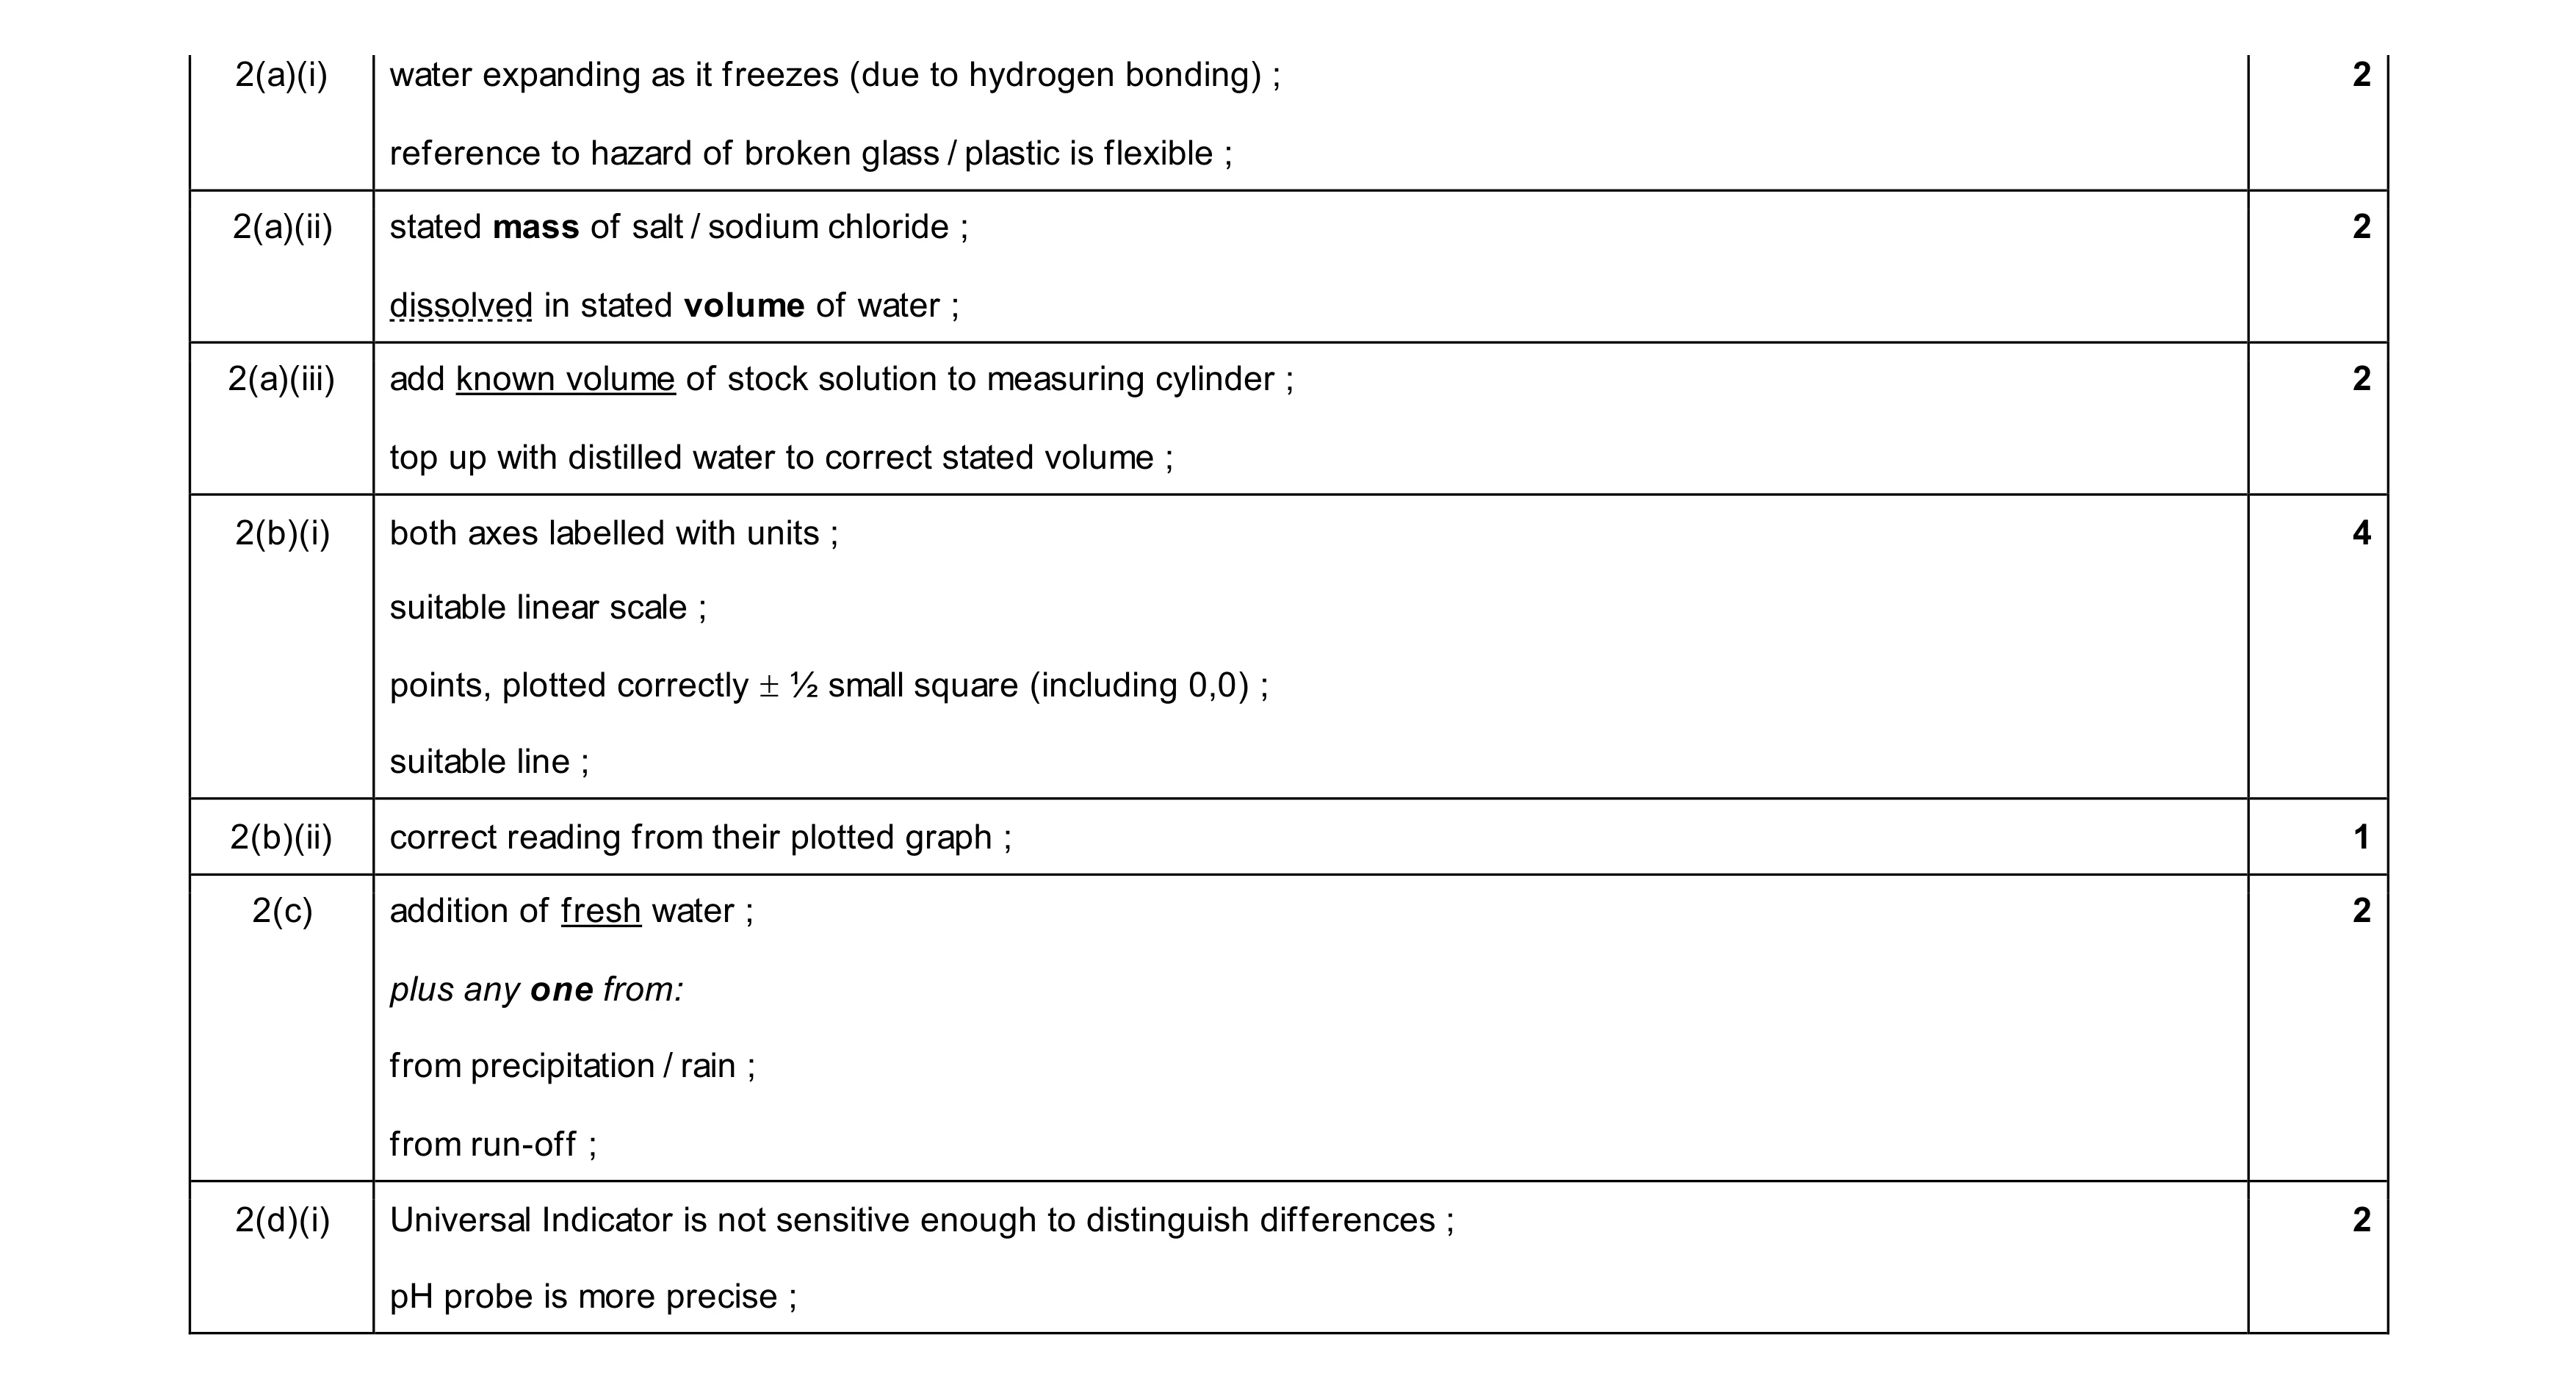 15
15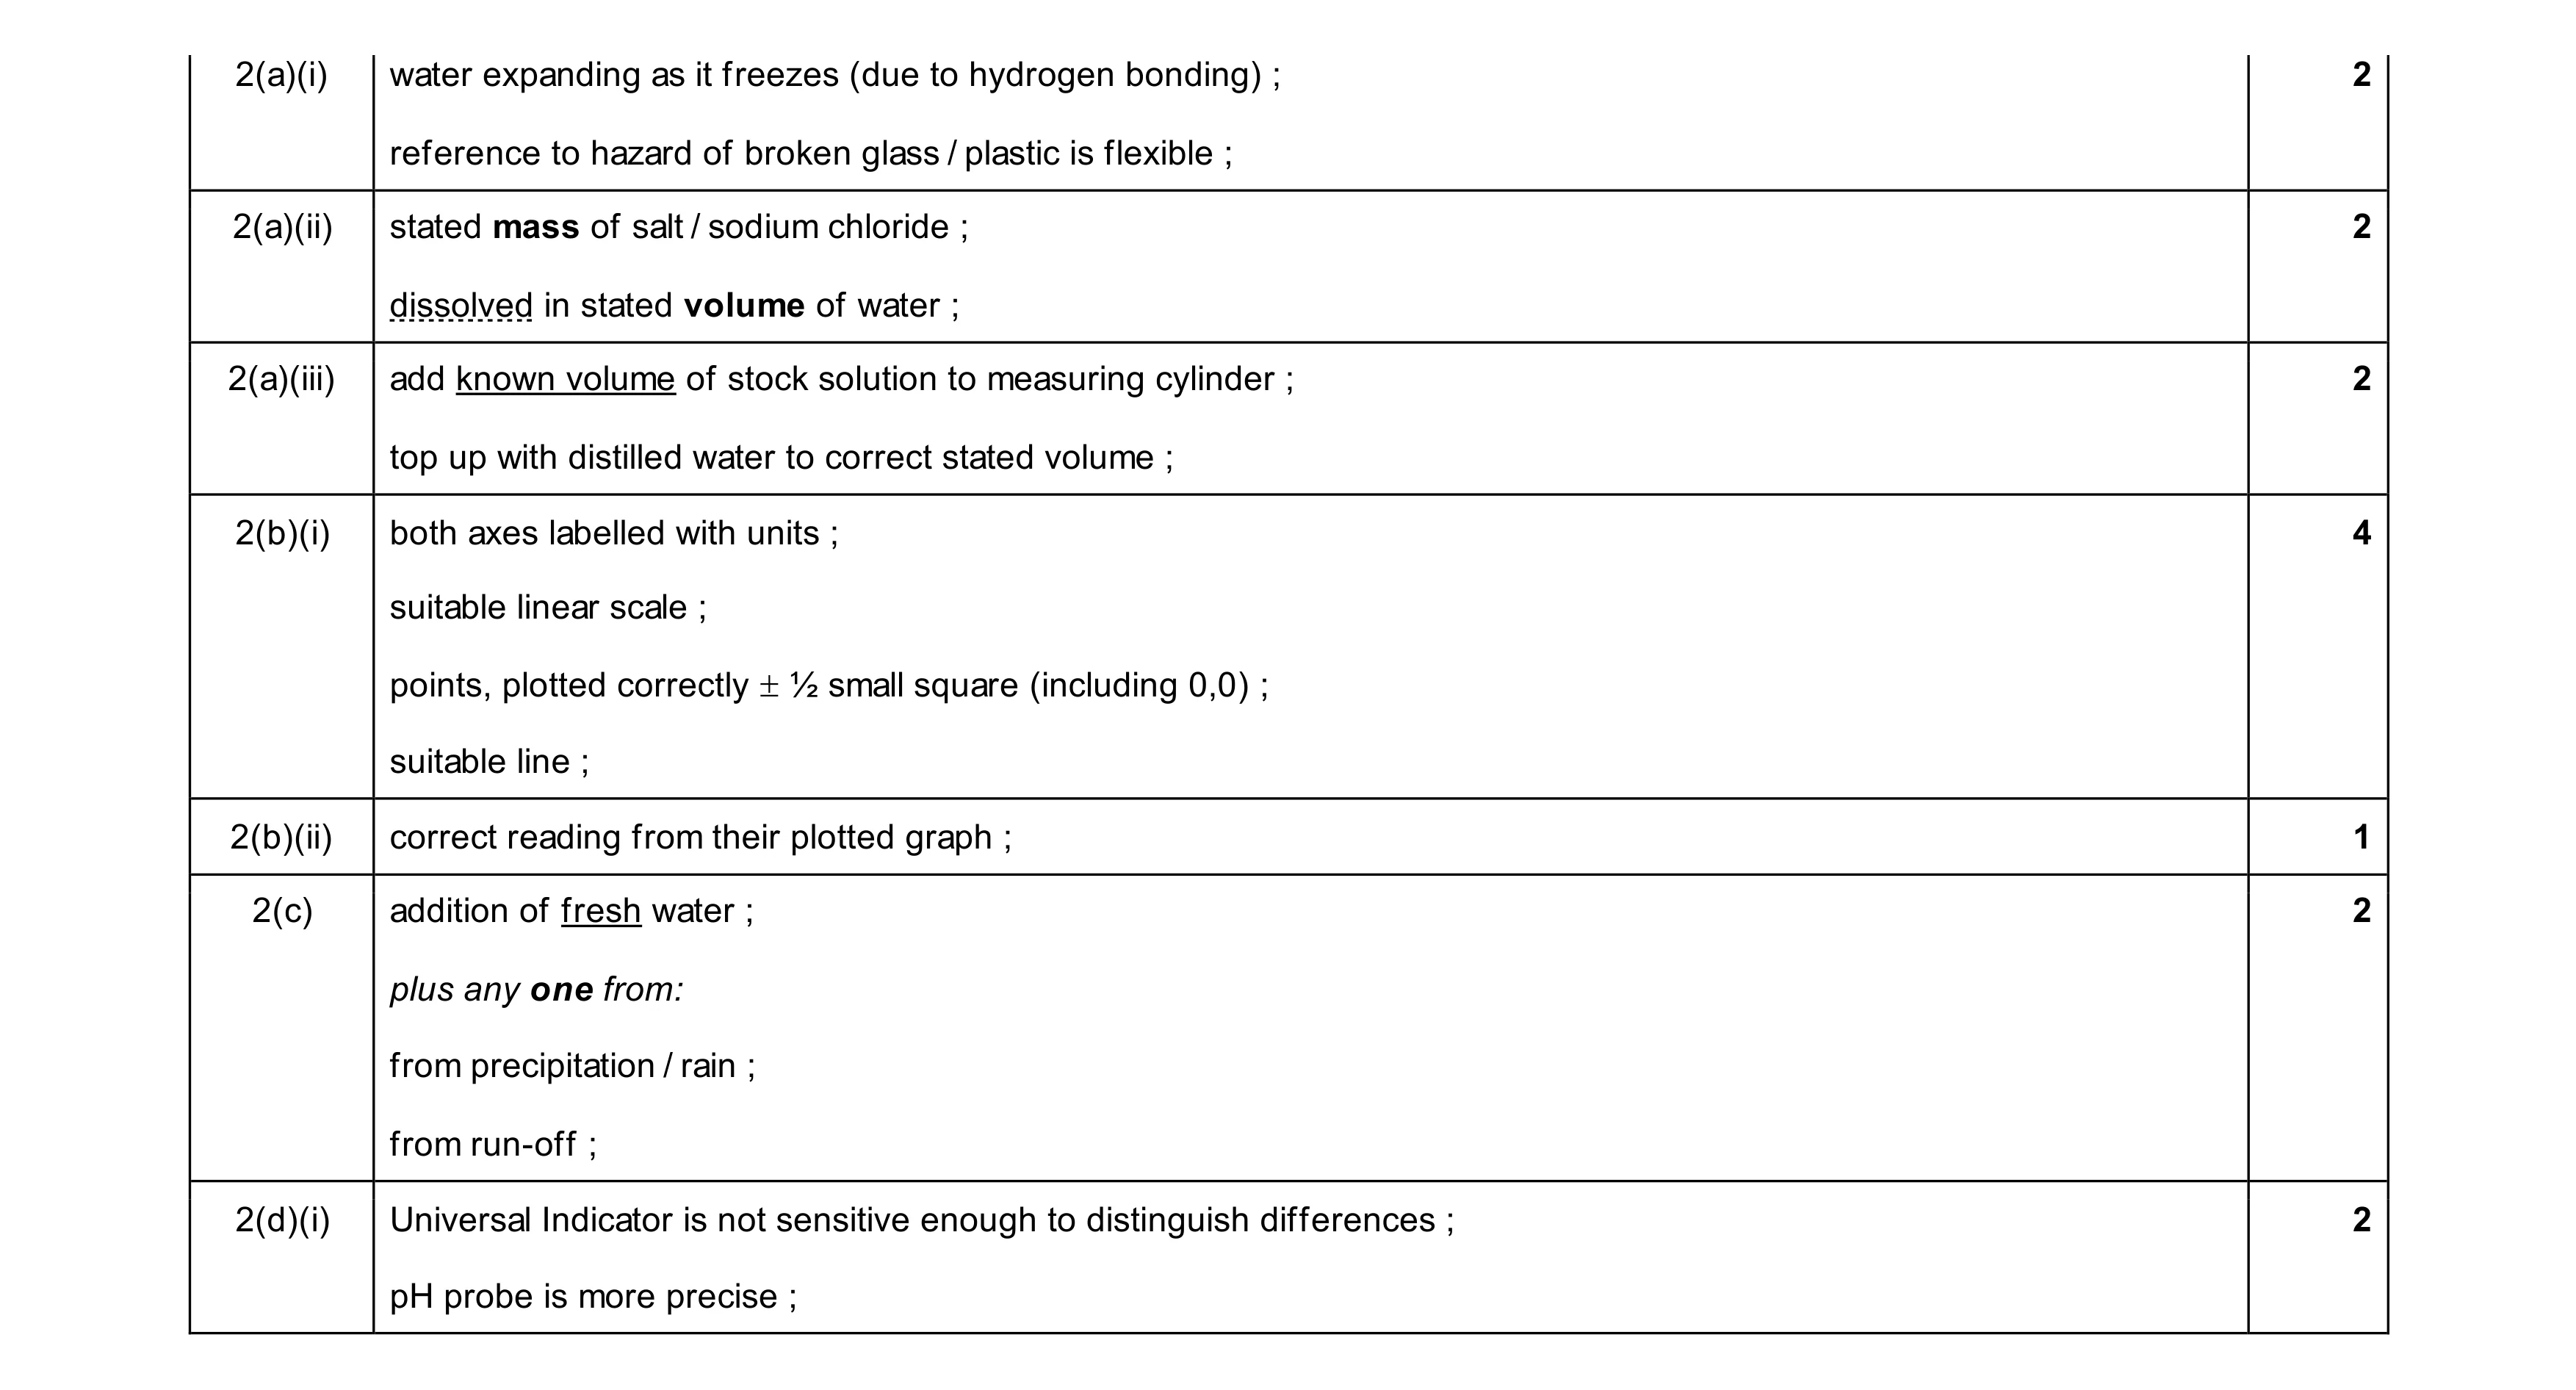 15
15