Cambridge A Level Marine Science 9693 — 2019 May/June Paper 2 · Variant 2
9693/22/M/J/19 · 4 questions · 50 marks · ≈56 min
The question paper and its mark scheme, free to read here and free to download. This is Cambridge’s own paper, exactly as it was sat.
Question paper12 pages

Mark scheme7 pages
Answers below. Sit the paper first if you are practising.
Questions as text
Q1 · Predator-prey relationships are important to maintain a healthy balance of populations…
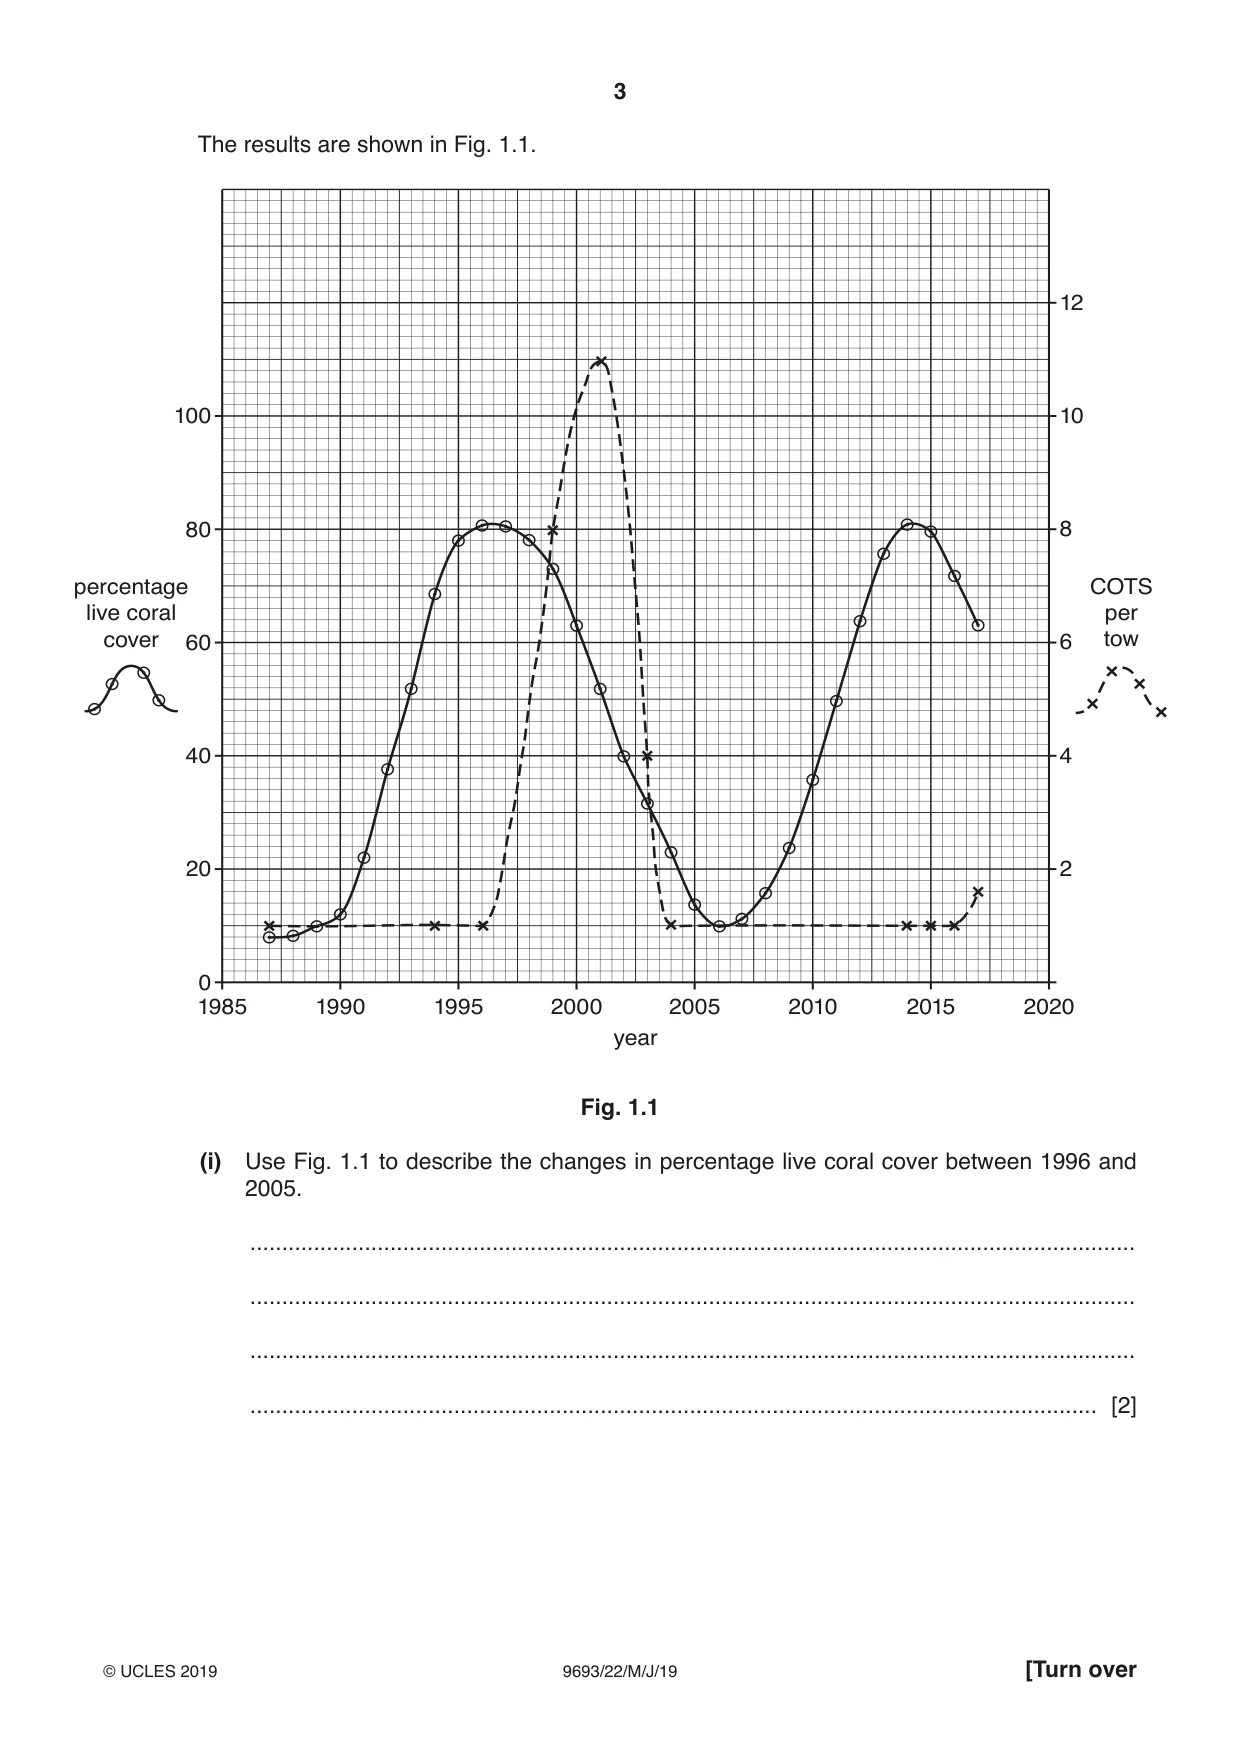
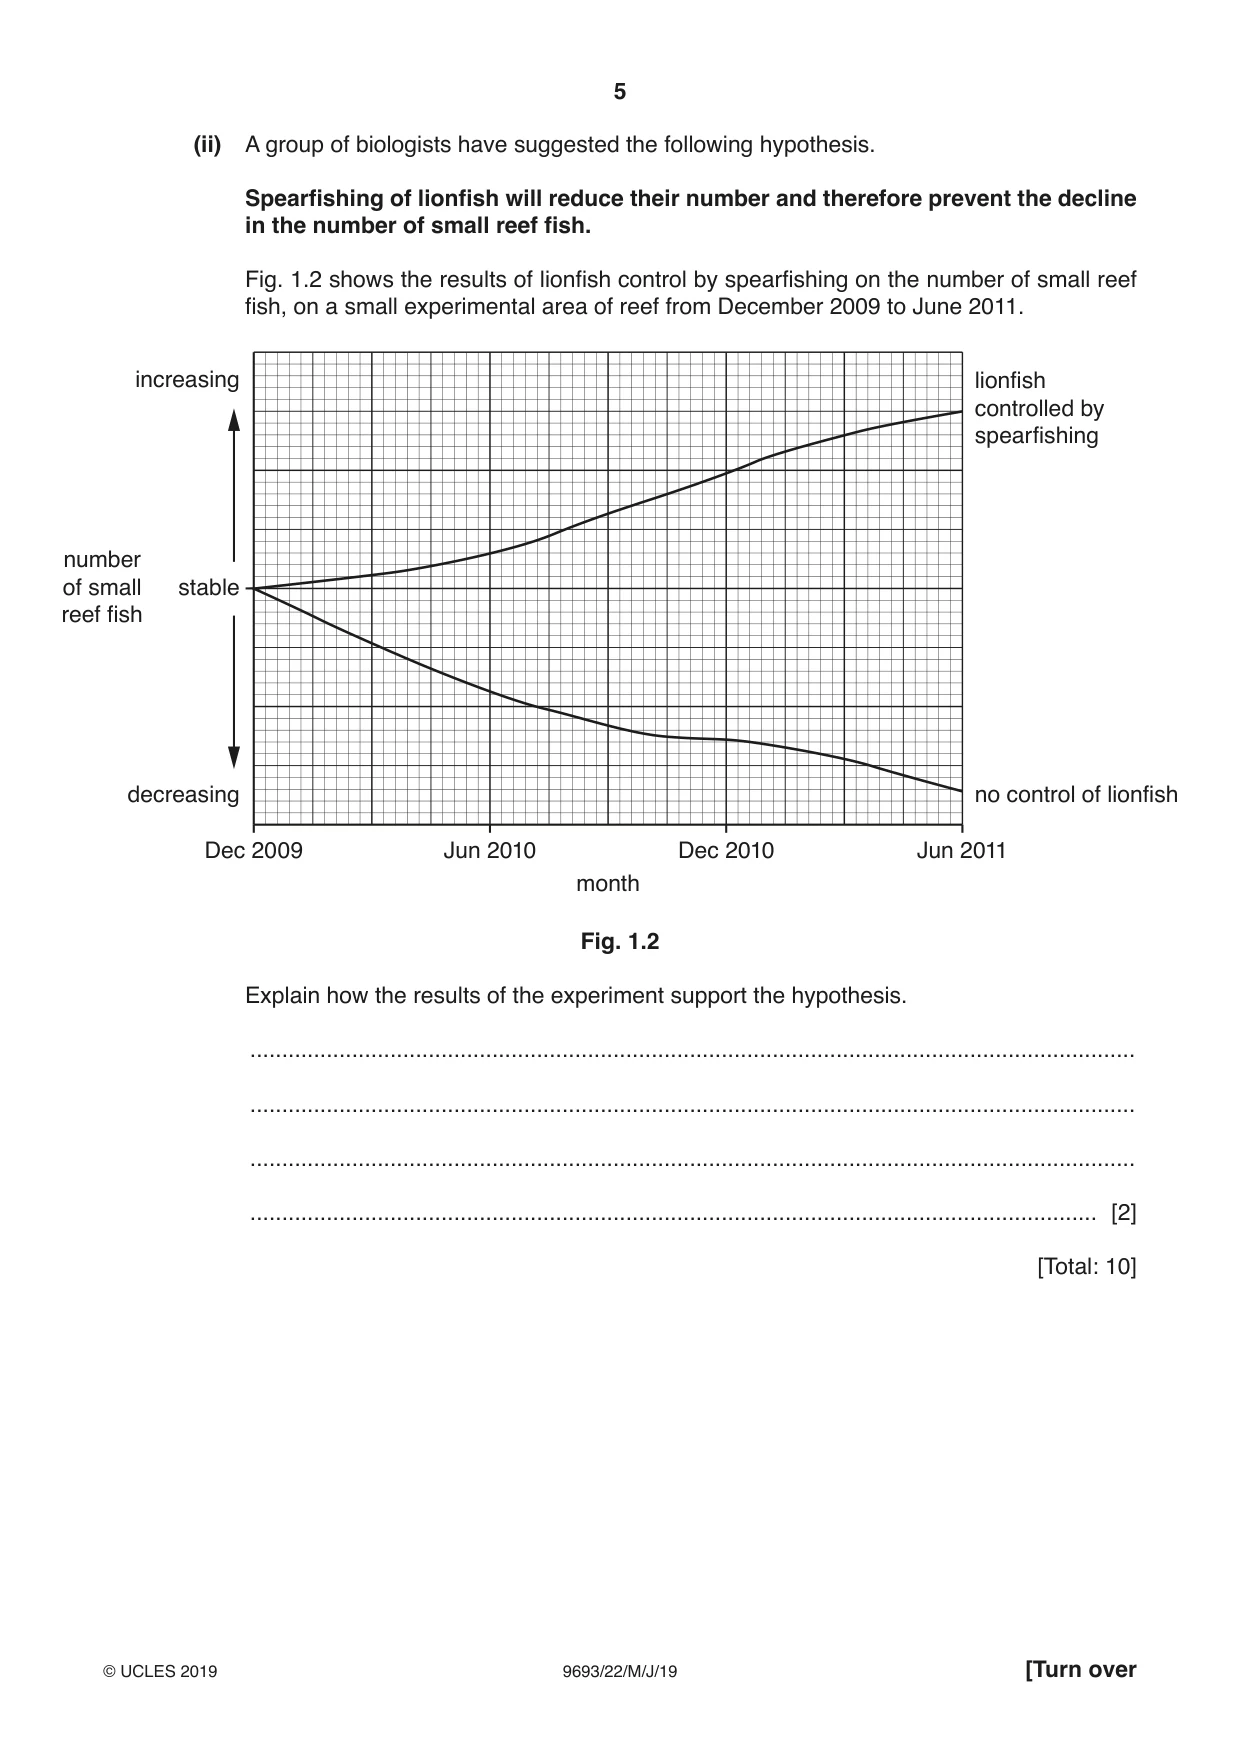
1 Predator-prey relationships are important to maintain a healthy balance of populations within ecosystems. (a) Define the term predator. ................................................................................................................................................... ................................................................................................................................................... ................................................................................................................................................... ............................................................................................................................................. [2] (b) Researchers measured the percentage live coral cover in a representative area of the Great Barrier Reef, eastern Australia, each year between 1987 and 2017. They also measured the abundance of the crown-of-thorns starfish (COTS), which feeds on coral. This was done by towing a diver behind a boat over a measured distance. The diver recorded the number of COTS seen per tow. This was not carried out every year. The results are shown in Fig. 1.1. 12 100 10 80 8 percentage COTS live coral per cover 60 6 tow 40 4 20 2 0 1985 1990 1995 2000 2005 2010 2015 2020 year Fig. 1.1 (i) Use Fig. 1.1 to describe the changes in percentage live coral cover between 1996 and 2005. ........................................................................................................................................... ........................................................................................................................................... ........................................................................................................................................... ..................................................................................................................................... [2] (ii) Use Fig. 1.1 to explain how populations of coral and COTS are interrelated. ........................................................................................................................................... ........................................................................................................................................... ........................................................................................................................................... ..................................................................................................................................... [2] (c) Lionfish are predators that normally live in the Indo-Pacific Ocean. They have recently been introduced to Caribbean coral reefs. Their populations have increased and spread greatly, partly because they have no natural predators in these areas. Lionfish have reduced the number of small reef fish by up to 95% on some reefs. Attempts to eradicate the lionfish have all failed. (i) Suggest the outcomes if there was no attempt to control the number of lionfish. ........................................................................................................................................... ........................................................................................................................................... ........................................................................................................................................... ..................................................................................................................................... [2] (ii) A group of biologists have suggested the following hypothesis. Spearfishing of lionfish will reduce their number and therefore prevent the decline in the number of small reef fish. Fig. 1.2 shows the results of lionfish control by spearfishing on the number of small reef fish, on a small experimental area of reef from December 2009 to June 2011. increasing lionfish controlled by spearfishing number of small stable reef fish decreasing no control of lionfish Dec 2009 Jun 2010 Dec 2010 Jun 2011 month Fig. 1.2 Explain how the results of the experiment support the hypothesis. ........................................................................................................................................... ........................................................................................................................................... ........................................................................................................................................... ..................................................................................................................................... [2] [Total: 10]
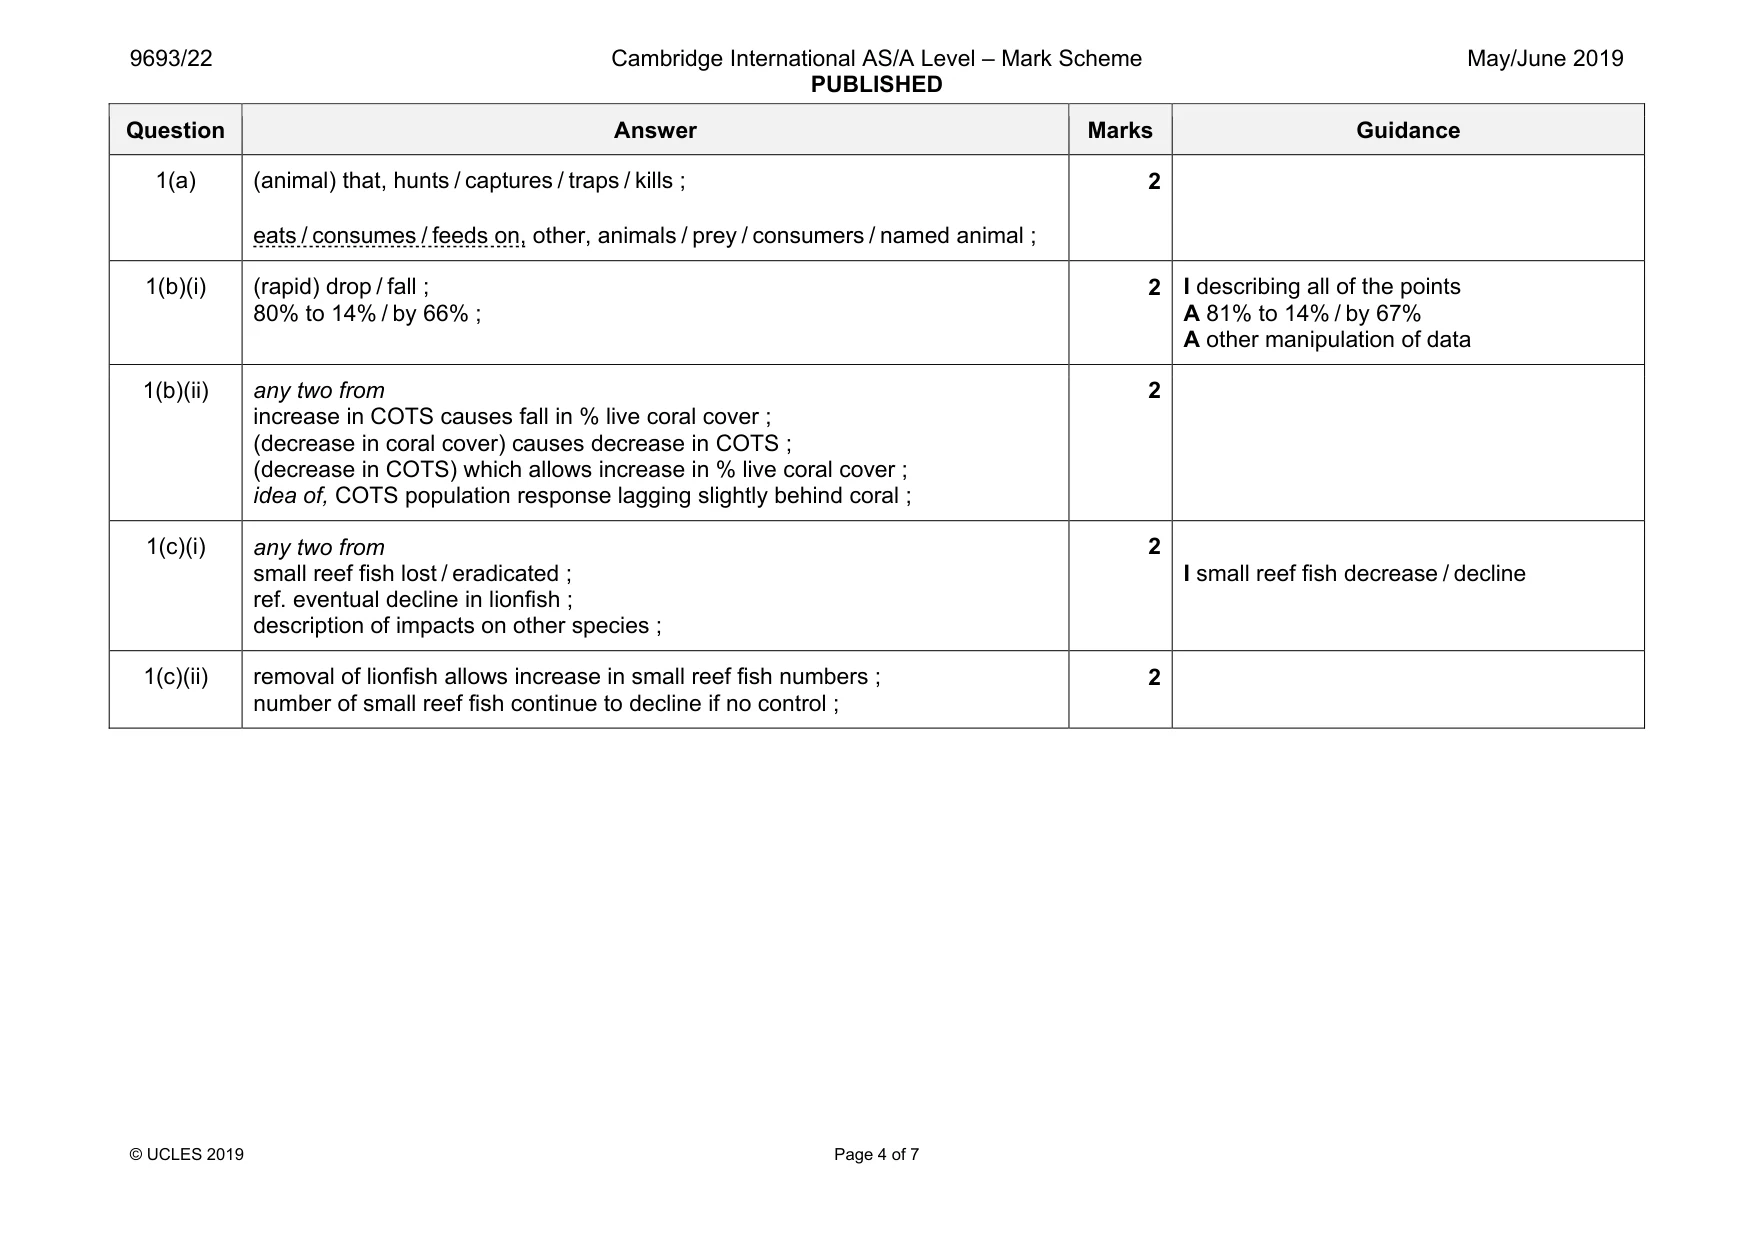
Mark scheme: 1(a) (animal) that, hunts / captures / traps / kills ; eats / consumes / feeds on, other, animals / prey / consumers / named animal ; 2 1(b)(i) (rapid) drop / fall ; 80% to 14% / by 66% ; 2 I describing all of the points A 81% to 14% / by 67% A other manipulation of data 1(b)(ii) any two from increase in COTS causes fall in % live coral cover ; (decrease in coral cover) causes decrease in COTS ; (decrease in COTS) which allows increase in % live coral cover ; idea of, COTS population response lagging slightly behind coral ; 2 1(c)(i) any two from small reef fish lost / eradicated ; ref. eventual decline in lionfish ; description of impacts on other species ; 2 I small reef fish decrease / decline 1(c)(ii) removal of lionfish allows increase in small reef fish numbers ; number of small reef fish continue to decline if no control ; 2
Q2 · Fish in the open ocean ecosystems are dependent on complex plankton-based food webs with…
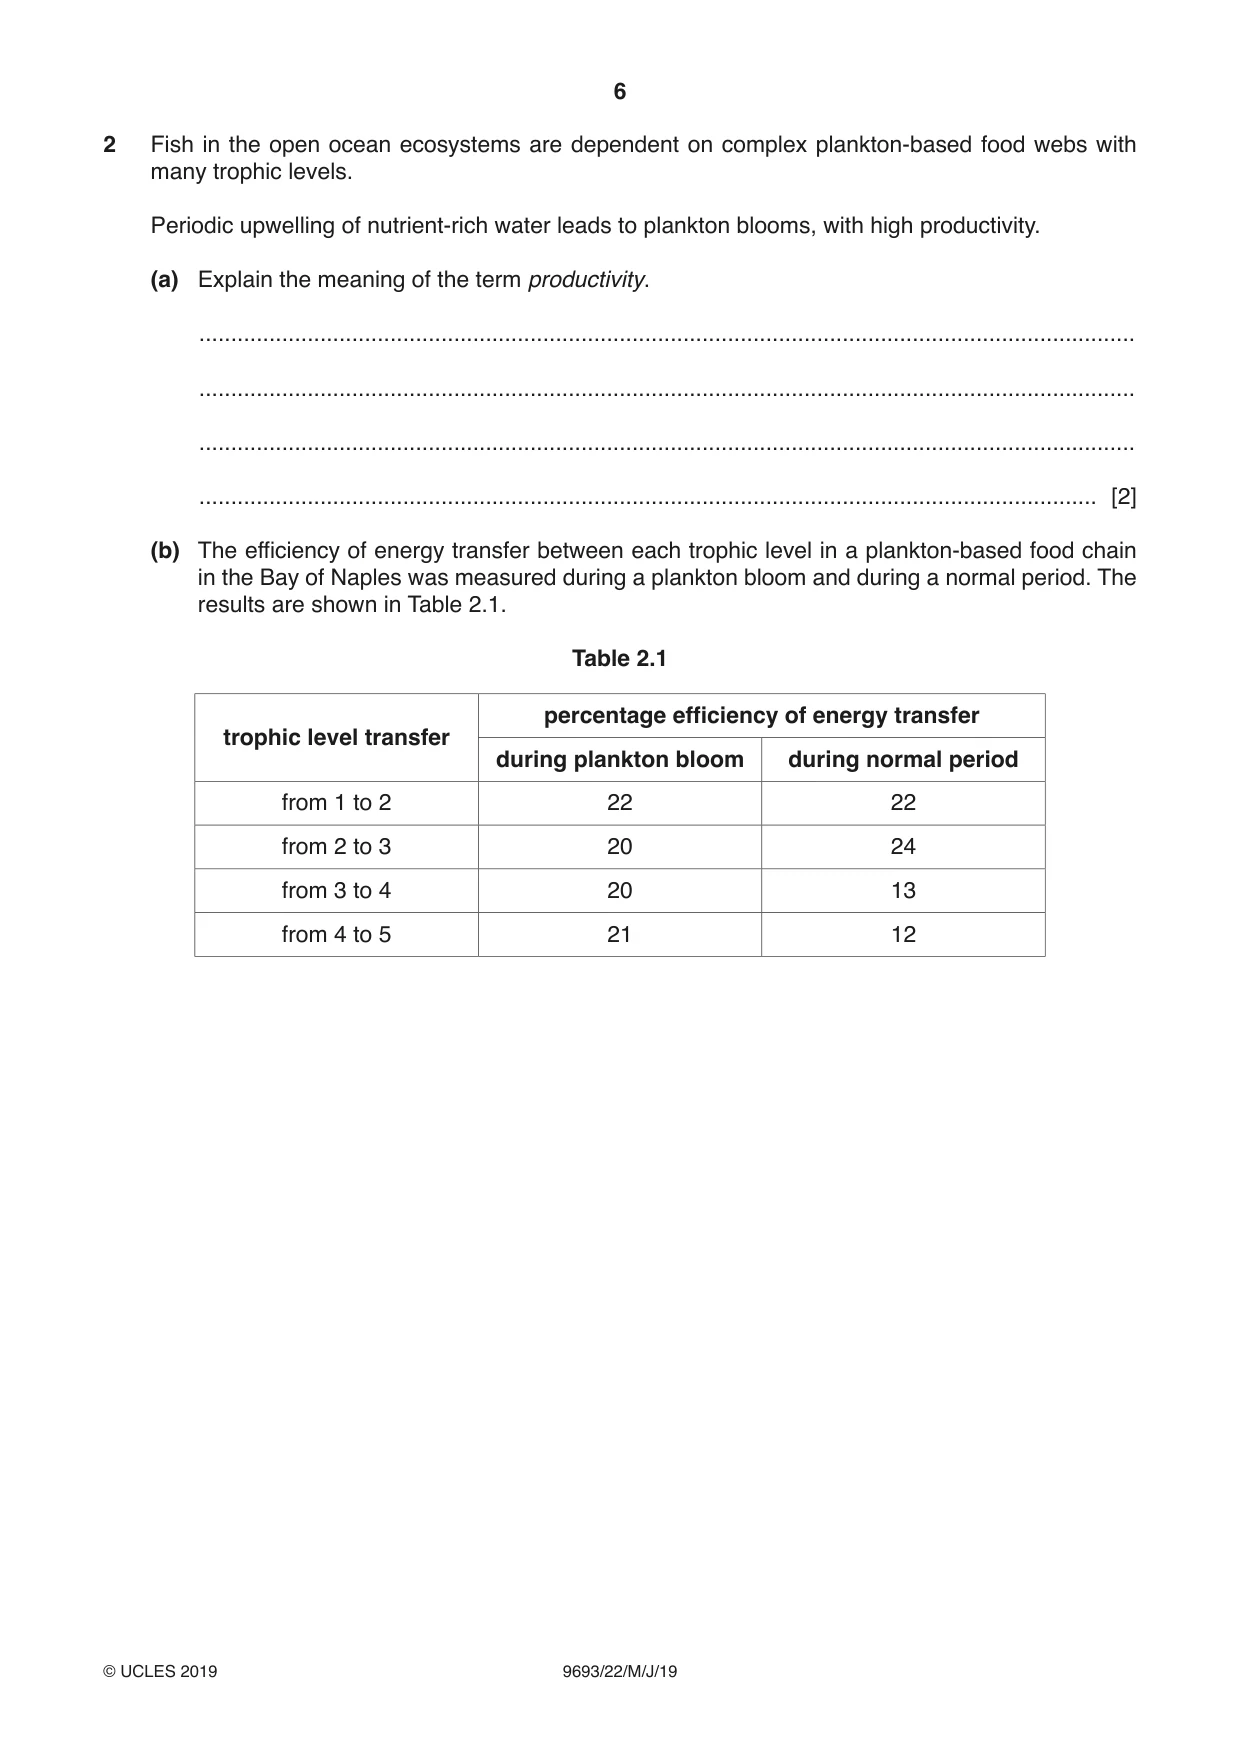
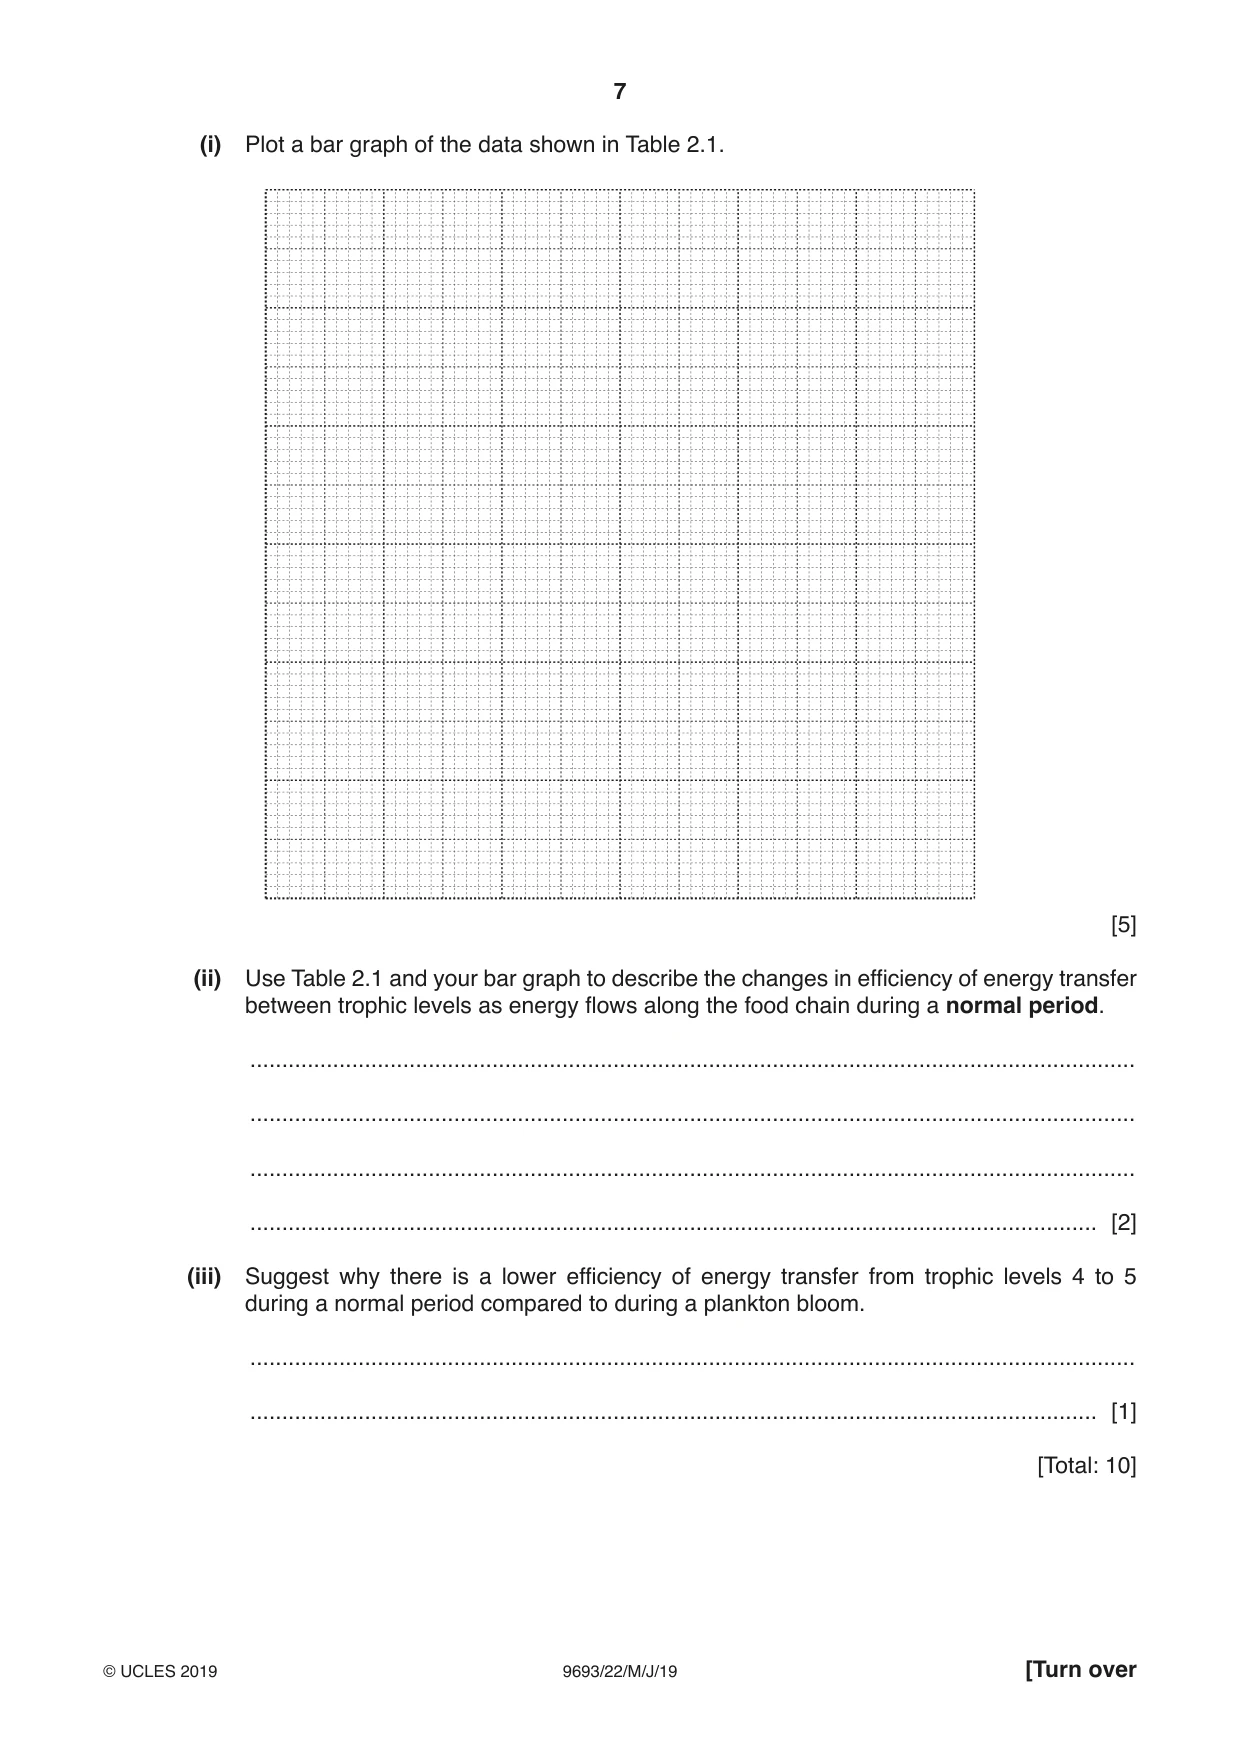
2 Fish in the open ocean ecosystems are dependent on complex plankton-based food webs with many trophic levels. Periodic upwelling of nutrient-rich water leads to plankton blooms, with high productivity. (a) Explain the meaning of the term productivity. ................................................................................................................................................... ................................................................................................................................................... ................................................................................................................................................... ............................................................................................................................................. [2] (b) The efficiency of energy transfer between each trophic level in a plankton-based food chain in the Bay of Naples was measured during a plankton bloom and during a normal period. The results are shown in Table 2.1. Table 2.1 percentage efficiency of energy transfer trophic level transfer during plankton bloom during normal period from 1 to 2 22 22 from 2 to 3 20 24 from 3 to 4 20 13 from 4 to 5 21 12 (i) Plot a bar graph of the data shown in Table 2.1. [5] (ii) Use Table 2.1 and your bar graph to describe the changes in efficiency of energy transfer between trophic levels as energy flows along the food chain during a normal period. ........................................................................................................................................... ........................................................................................................................................... ........................................................................................................................................... ..................................................................................................................................... [2] (iii) Suggest why there is a lower efficiency of energy transfer from trophic levels 4 to 5 during a normal period compared to during a plankton bloom. ........................................................................................................................................... ..................................................................................................................................... [1] [Total: 10]
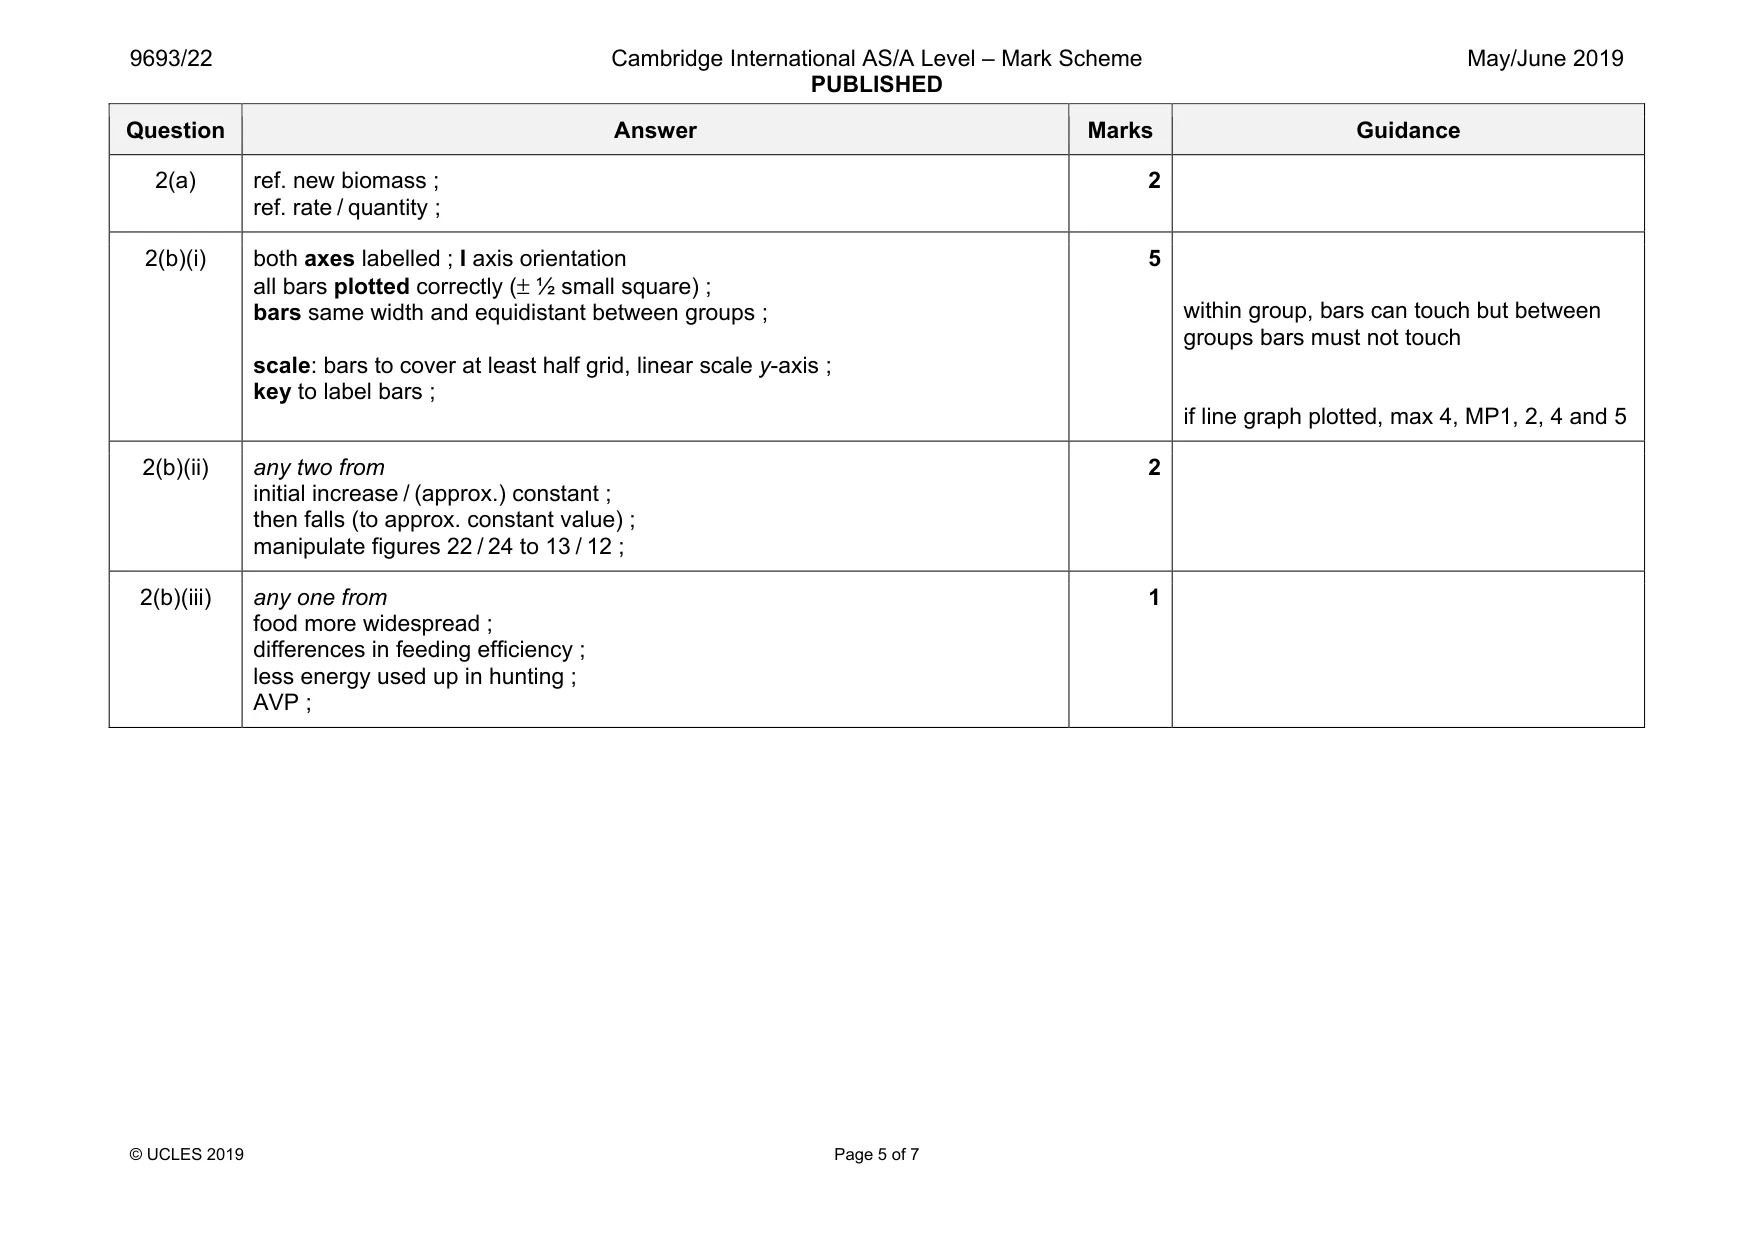
Mark scheme: 2(a) ref. new biomass ; ref. rate / quantity ; 2 2(b)(i) both axes labelled ; I axis orientation all bars plotted correctly (± ½ small square) ; bars same width and equidistant between groups ; scale: bars to cover at least half grid, linear scale y-axis ; key to label bars ; 5 within group, bars can touch but between groups bars must not touch if line graph plotted, max 4, MP1, 2, 4 and 5 2(b)(ii) any two from initial increase / (approx.) constant ; then falls (to approx. constant value) ; manipulate figures 22 / 24 to 13 / 12 ; 2 2(b)(iii) any one from food more widespread ; differences in feeding efficiency ; less energy used up in hunting ; AVP ; 1
Q3 · Explain the effect of volcanic activity on the chemical composition of sea water
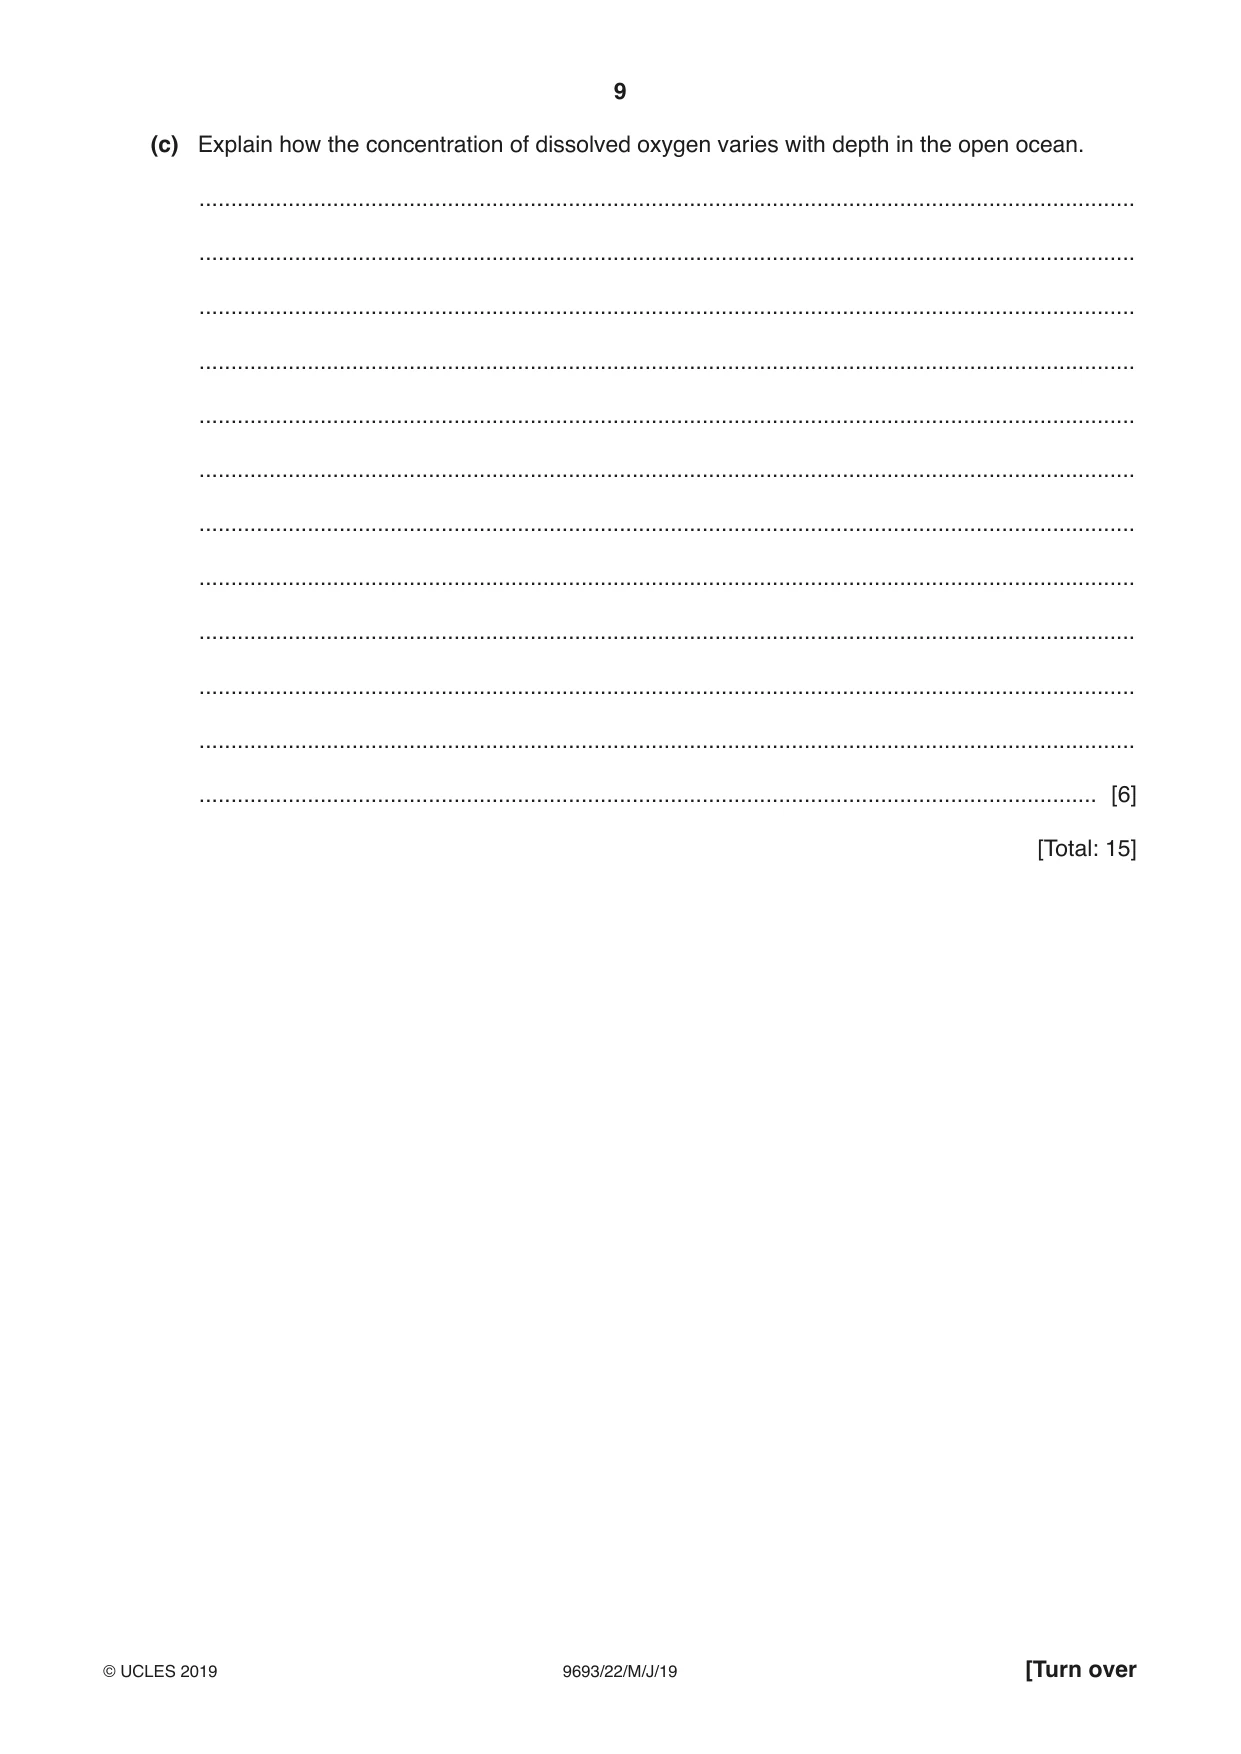
3 (a) Explain the effect of volcanic activity on the chemical composition of sea water. ................................................................................................................................................... ................................................................................................................................................... ................................................................................................................................................... ................................................................................................................................................... ................................................................................................................................................... ................................................................................................................................................... ................................................................................................................................................... ................................................................................................................................................... ................................................................................................................................................... ............................................................................................................................................. [5] (b) Describe and explain the effects of evaporation and precipitation on the salinity of sea water. ................................................................................................................................................... ................................................................................................................................................... ................................................................................................................................................... ................................................................................................................................................... ................................................................................................................................................... ................................................................................................................................................... ................................................................................................................................................... ............................................................................................................................................. [4] (c) Explain how the concentration of dissolved oxygen varies with depth in the open ocean. ................................................................................................................................................... ................................................................................................................................................... ................................................................................................................................................... ................................................................................................................................................... ................................................................................................................................................... ................................................................................................................................................... ................................................................................................................................................... ................................................................................................................................................... ................................................................................................................................................... ................................................................................................................................................... ................................................................................................................................................... ............................................................................................................................................. [6] [Total: 15]
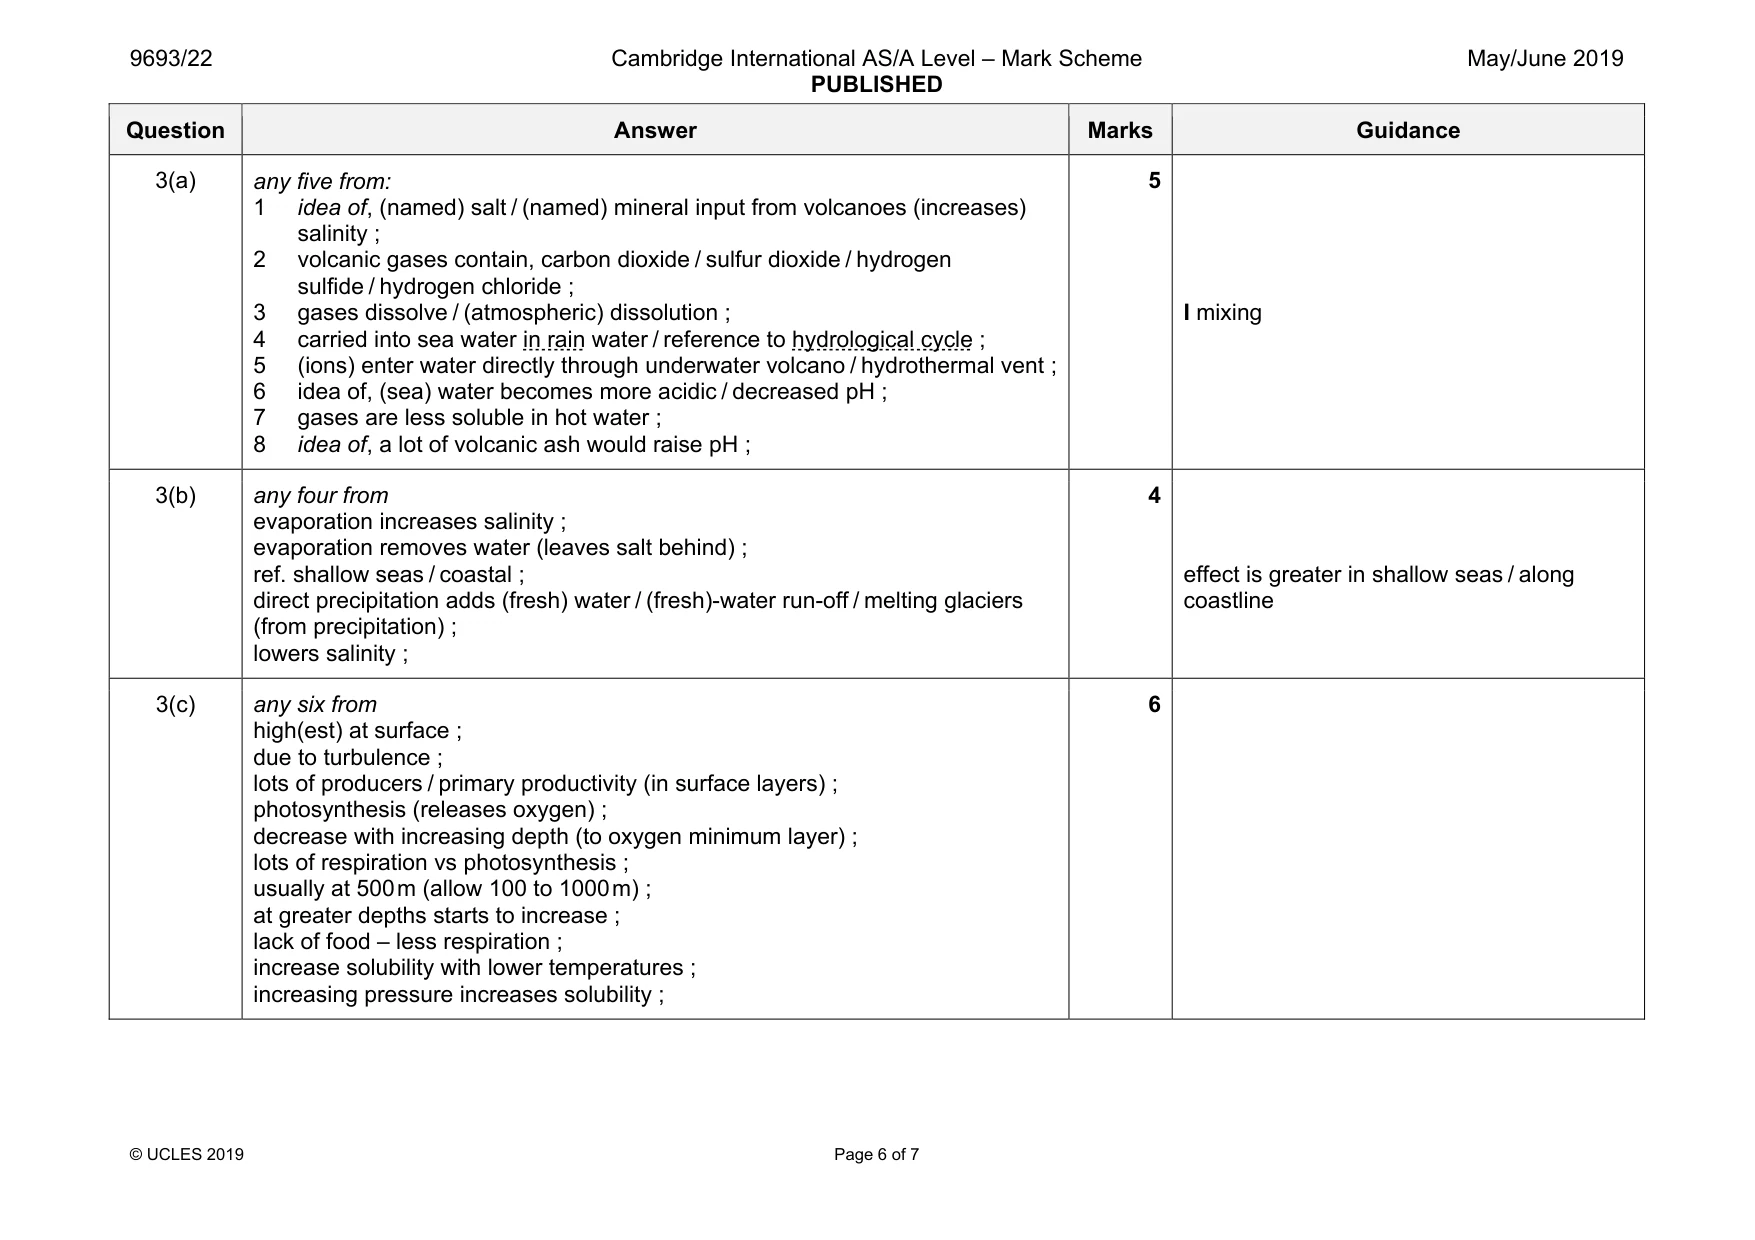
Mark scheme: 3(a) any five from: 1 idea of, (named) salt / (named) mineral input from volcanoes (increases) salinity ; 2 volcanic gases contain, carbon dioxide / sulfur dioxide / hydrogen sulfide / hydrogen chloride ; 3 gases dissolve / (atmospheric) dissolution ; 4 carried into sea water in rain water / reference to hydrological cycle ; 5 (ions) enter water directly through underwater volcano / hydrothermal vent ; 6 idea of, (sea) water becomes more acidic / decreased pH ; 7 gases are less soluble in hot water ; 8 idea of, a lot of volcanic ash would raise pH ; 5 I mixing 3(b) any four from evaporation increases salinity ; evaporation removes water (leaves salt behind) ; ref. shallow seas / coastal ; direct precipitation adds (fresh) water / (fresh)-water run-off / melting glaciers (from precipitation) ; lowers salinity ; 4 effect is greater in shallow seas / along coastline 3(c) any six from high(est) at surface ; due to turbulence ; lots of producers / primary productivity (in surface layers) ; photosynthesis (releases oxygen) ; decrease with increasing depth (to oxygen minimum layer) ; lots of respiration vs photosynthesis ; usually at 500 m (allow 100 to 1000 m) ; at greater depths starts to increase ; lack of food – less respiration ; increase solubility with lower temperatures ; increasing pressure increases solubility ; 6
Q4 · Describe the processes that give rise to the morphology of sandy shores
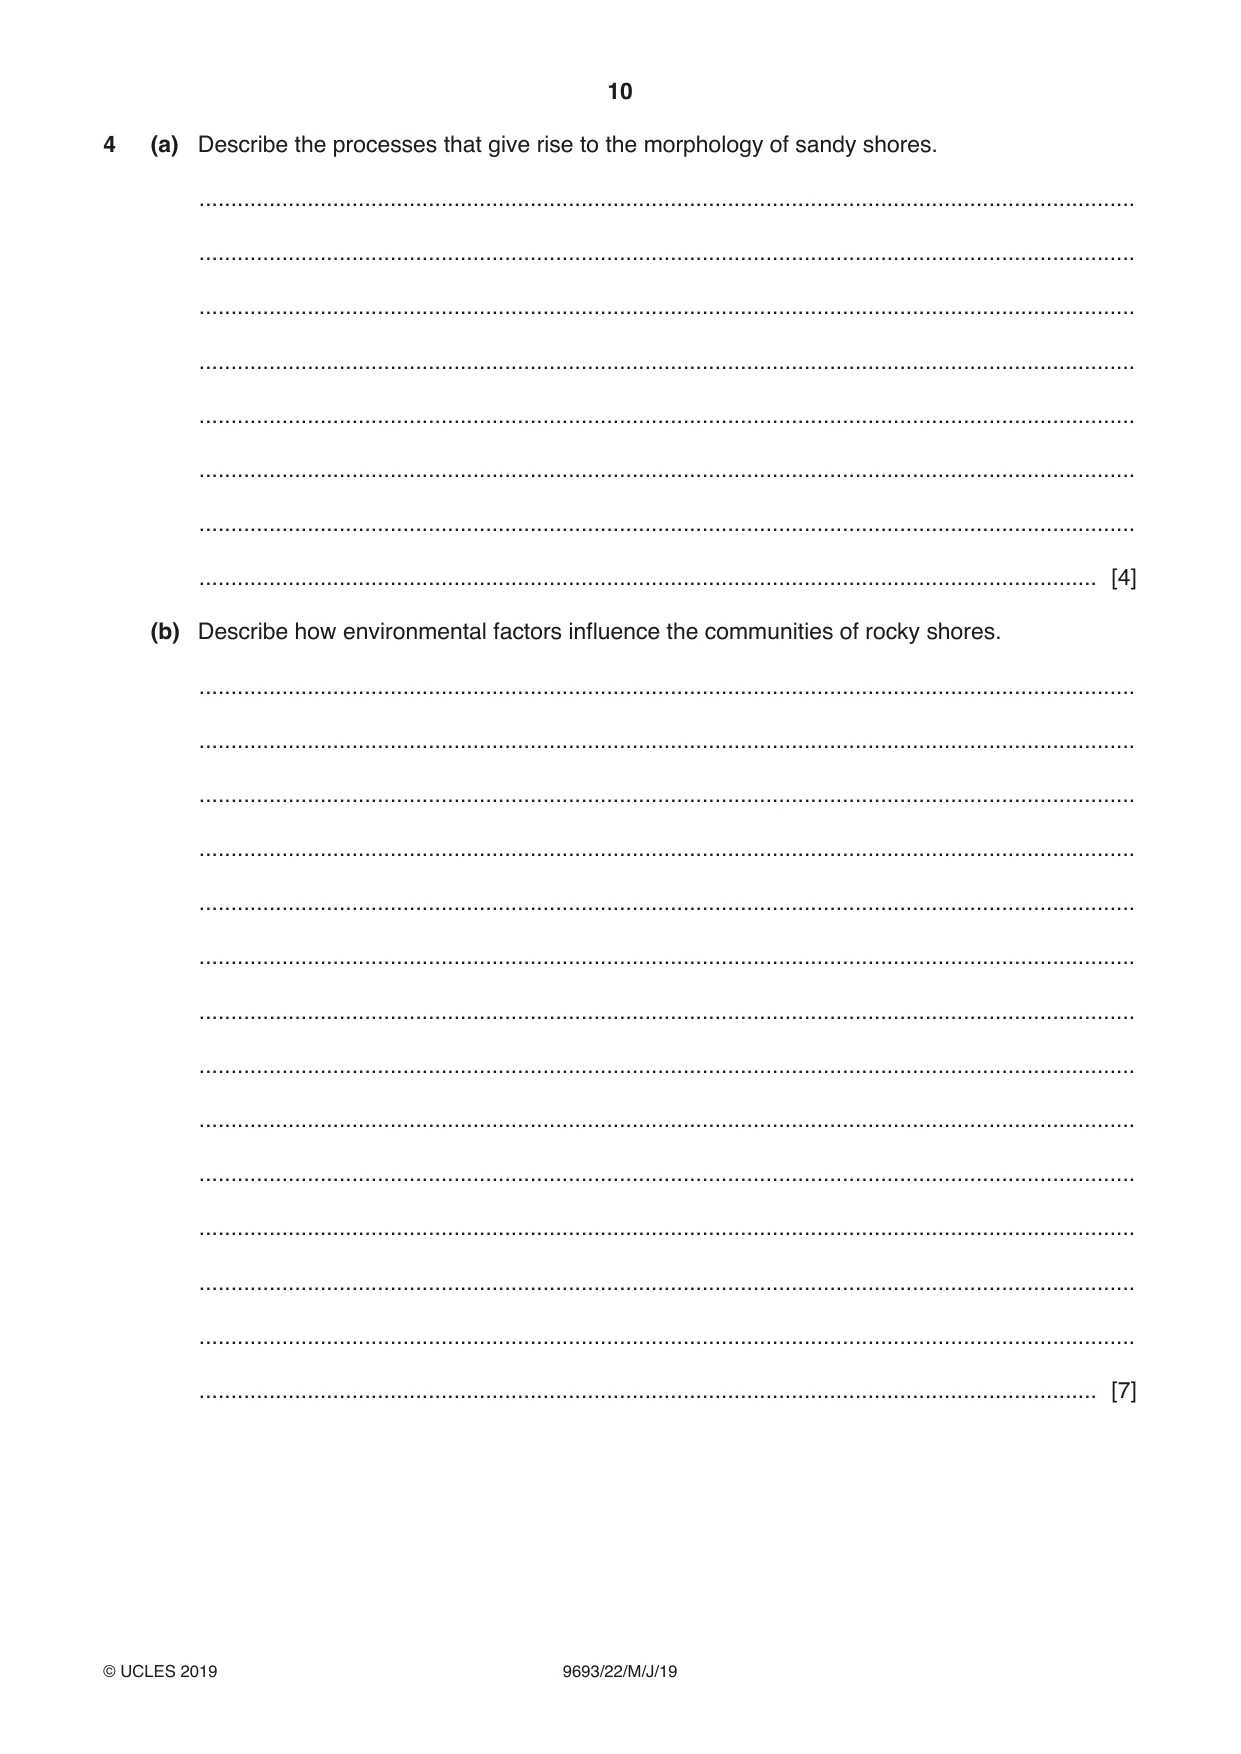
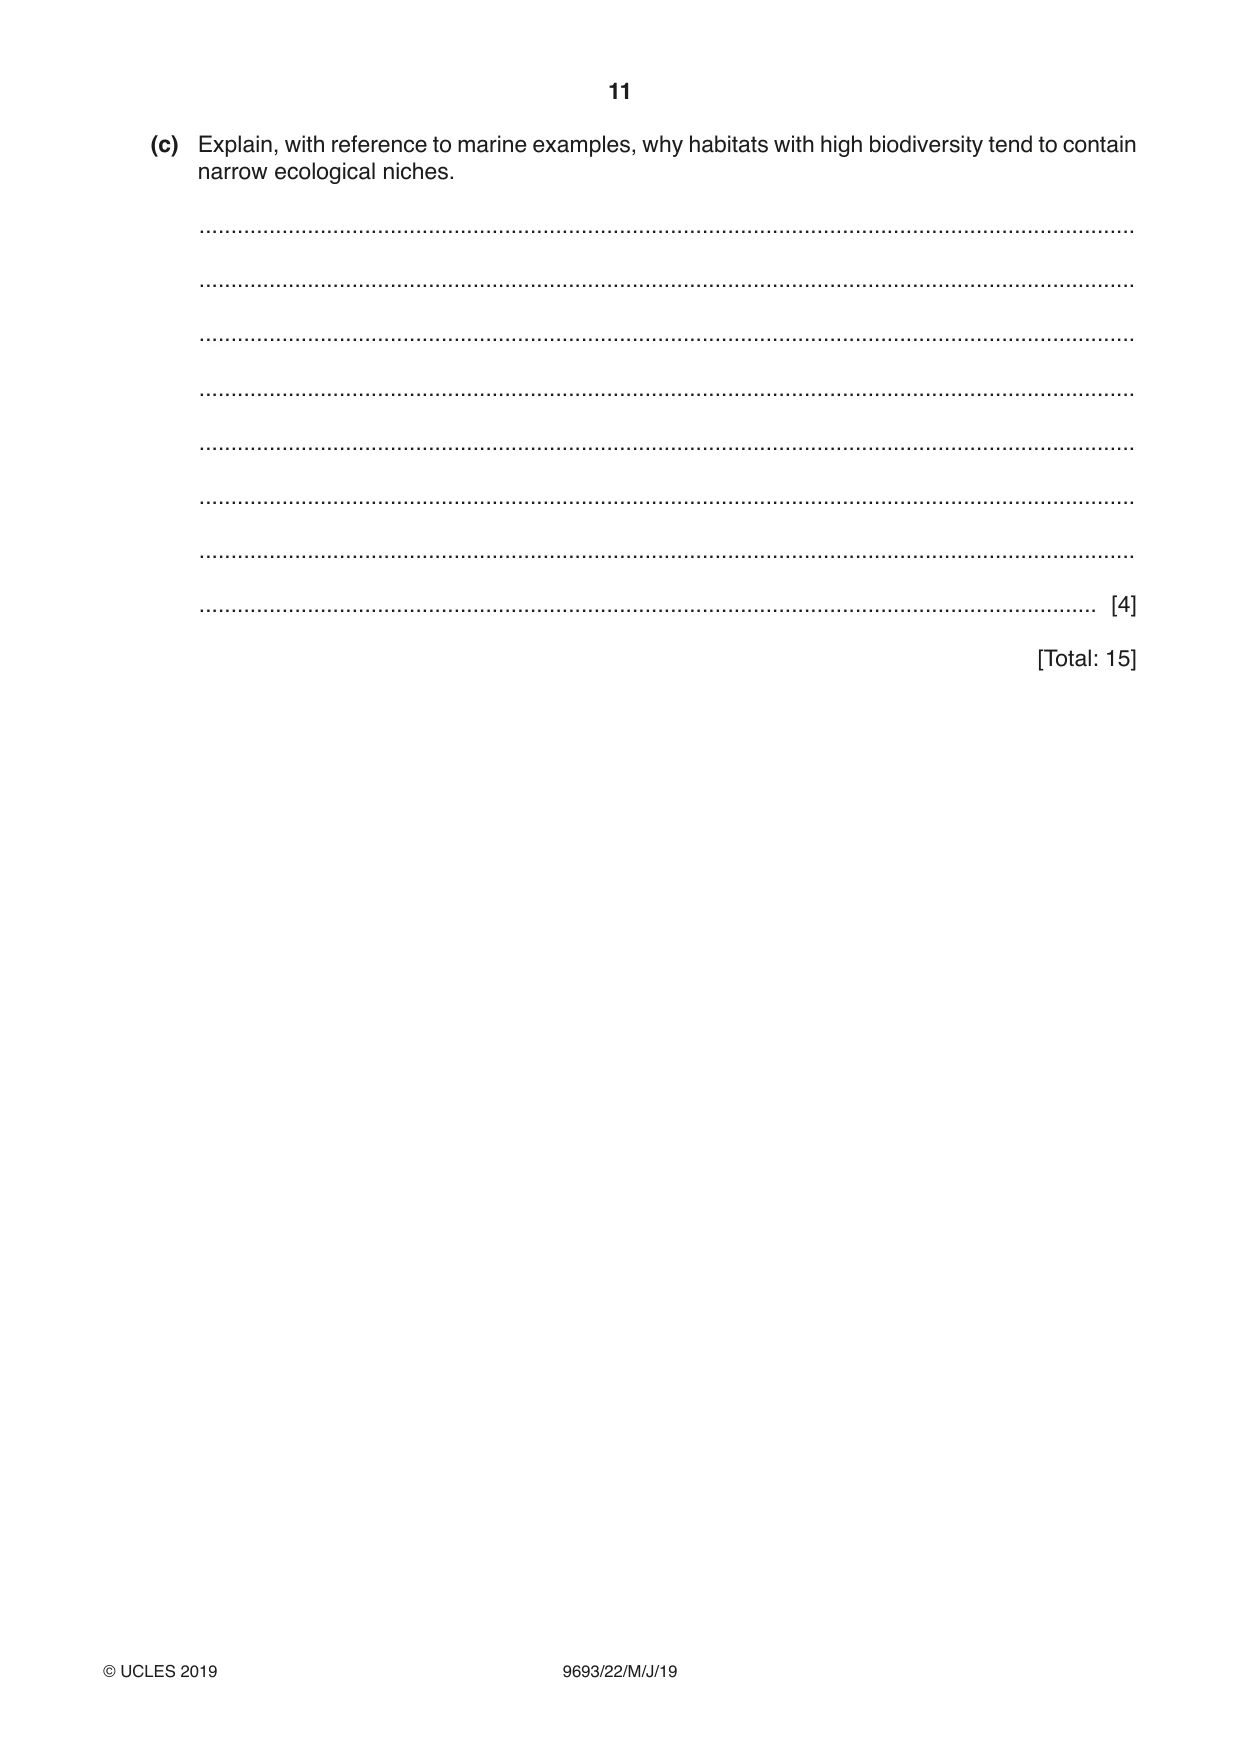
4 (a) Describe the processes that give rise to the morphology of sandy shores. ................................................................................................................................................... ................................................................................................................................................... ................................................................................................................................................... ................................................................................................................................................... ................................................................................................................................................... ................................................................................................................................................... ................................................................................................................................................... ............................................................................................................................................. [4] (b) Describe how environmental factors influence the communities of rocky shores. ................................................................................................................................................... ................................................................................................................................................... ................................................................................................................................................... ................................................................................................................................................... ................................................................................................................................................... ................................................................................................................................................... ................................................................................................................................................... ................................................................................................................................................... ................................................................................................................................................... ................................................................................................................................................... ................................................................................................................................................... ................................................................................................................................................... ................................................................................................................................................... ............................................................................................................................................. [7] (c) Explain, with reference to marine examples, why habitats with high biodiversity tend to contain narrow ecological niches. ................................................................................................................................................... ................................................................................................................................................... ................................................................................................................................................... ................................................................................................................................................... ................................................................................................................................................... ................................................................................................................................................... ................................................................................................................................................... ............................................................................................................................................. [4] [Total: 15]
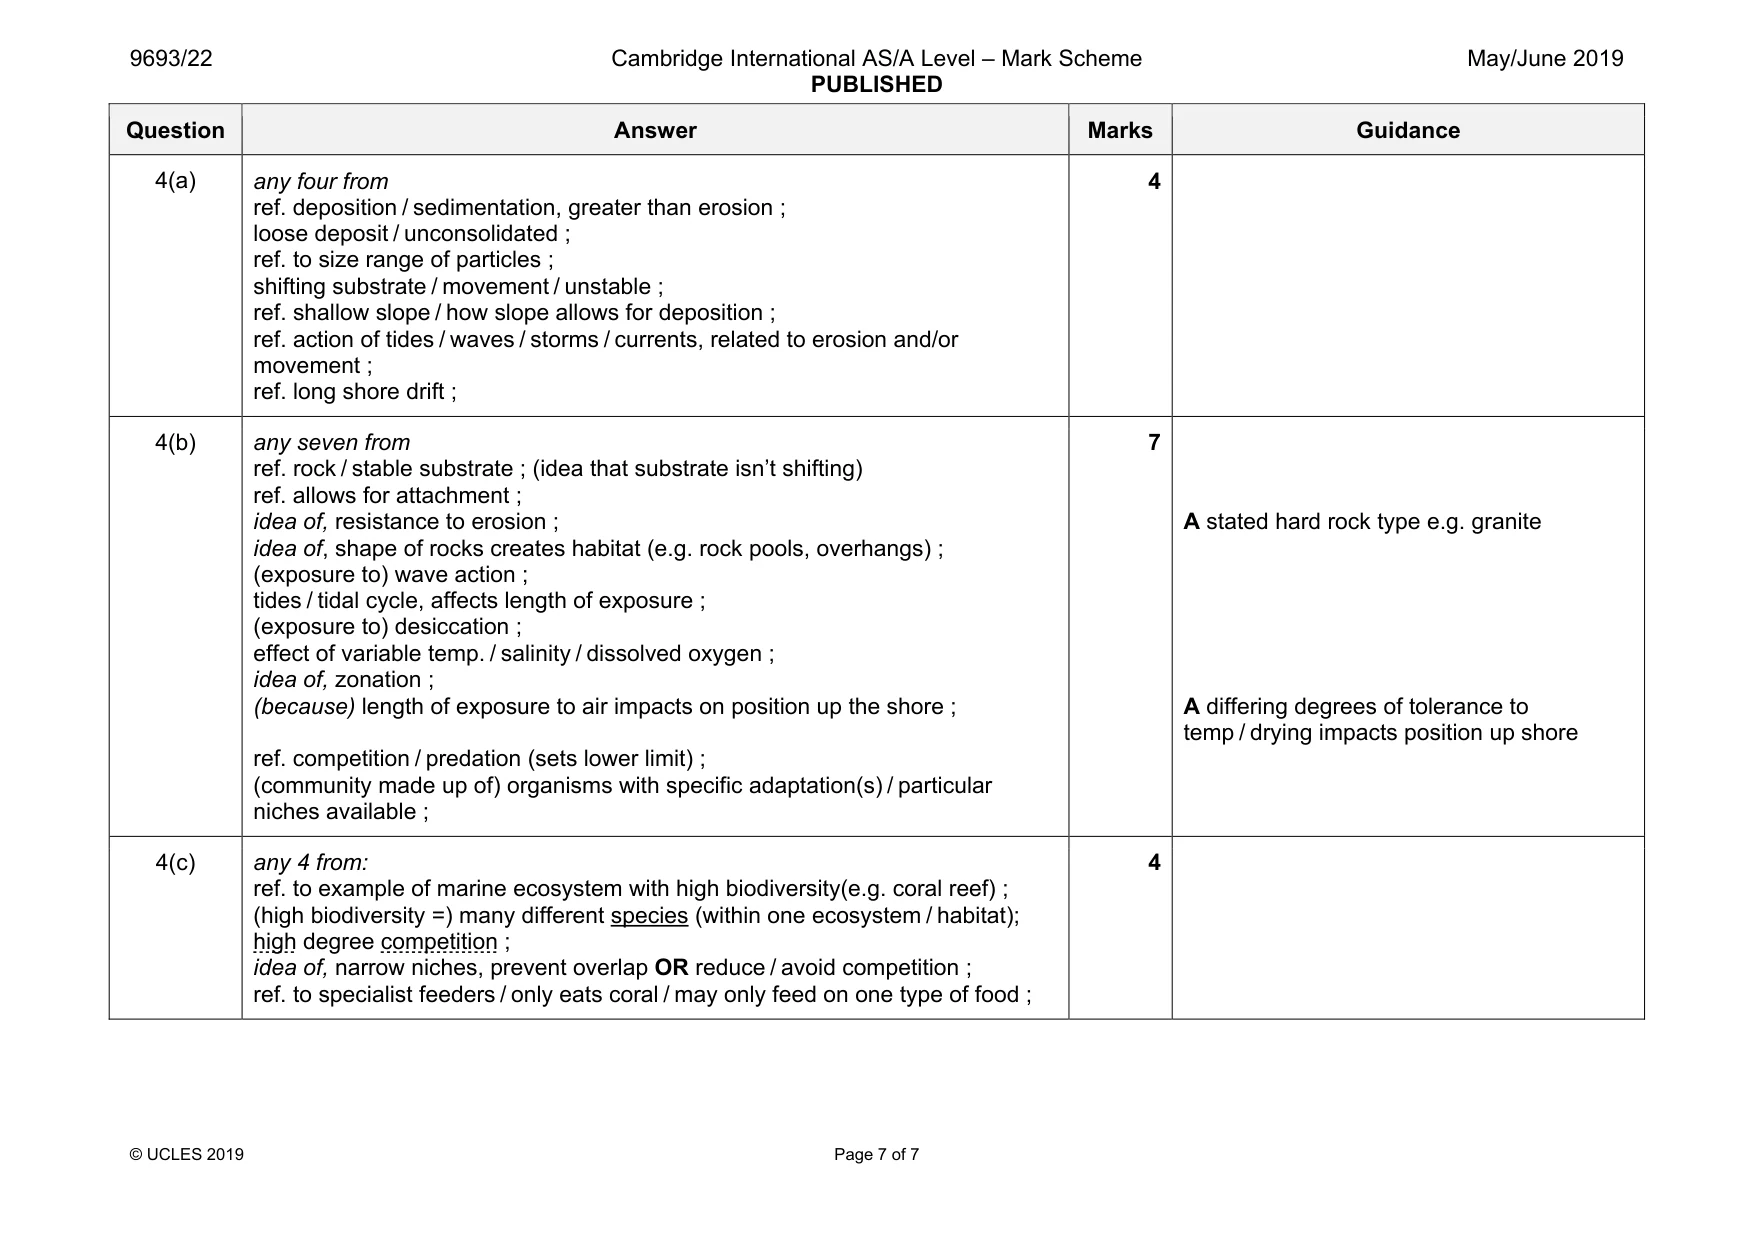
Mark scheme: 4(a) any four from ref. deposition / sedimentation, greater than erosion ; loose deposit / unconsolidated ; ref. to size range of particles ; shifting substrate / movement / unstable ; ref. shallow slope / how slope allows for deposition ; ref. action of tides / waves / storms / currents, related to erosion and/or movement ; ref. long shore drift ; 4 4(b) any seven from ref. rock / stable substrate ; (idea that substrate isn’t shifting) ref. allows for attachment ; idea of, resistance to erosion ; idea of, shape of rocks creates habitat (e.g. rock pools, overhangs) ; (exposure to) wave action ; tides / tidal cycle, affects length of exposure ; (exposure to) desiccation ; effect of variable temp. / salinity / dissolved oxygen ; idea of, zonation ; (because) length of exposure to air impacts on position up the shore ; ref. competition / predation (sets lower limit) ; (community made up of) organisms with specific adaptation(s) / particular niches available ; 7 A stated hard rock type e.g. granite A differing degrees of tolerance to temp / drying impacts position up shore 4(c) any 4 from: ref. to example of marine ecosystem with high biodiversity(e.g. coral reef) ; (high biodiversity =) many different species (within one ecosystem / habitat); high degree competition ; idea of, narrow niches, prevent overlap OR reduce / avoid competition ; ref. to specialist feeders / only eats coral / may only feed on one type of food ; 4
What was in this paper
The subtopics covered by these 4 questions, and how many questions each got. Open one in a new tab to see every Cambridge question on it.
What you needed in this session
Cambridge’s own grade thresholds for 2019 May/June, Paper 2 · Variant 2. A higher threshold means an easier paper — the bar moves with how the cohort did.