Cambridge A Level Marine Science 9693 — 2022 Oct/Nov Paper 2 · Variant 2
9693/22/O/N/22 · 6 questions · 75 marks · ≈84 min
The question paper and its mark scheme, free to read here and free to download. This is Cambridge’s own paper, exactly as it was sat.
Question paper16 pages
Mark scheme12 pages
Answers below. Sit the paper first if you are practising.
Questions as text
Q1 · A student was given water samples from three different environments to compare
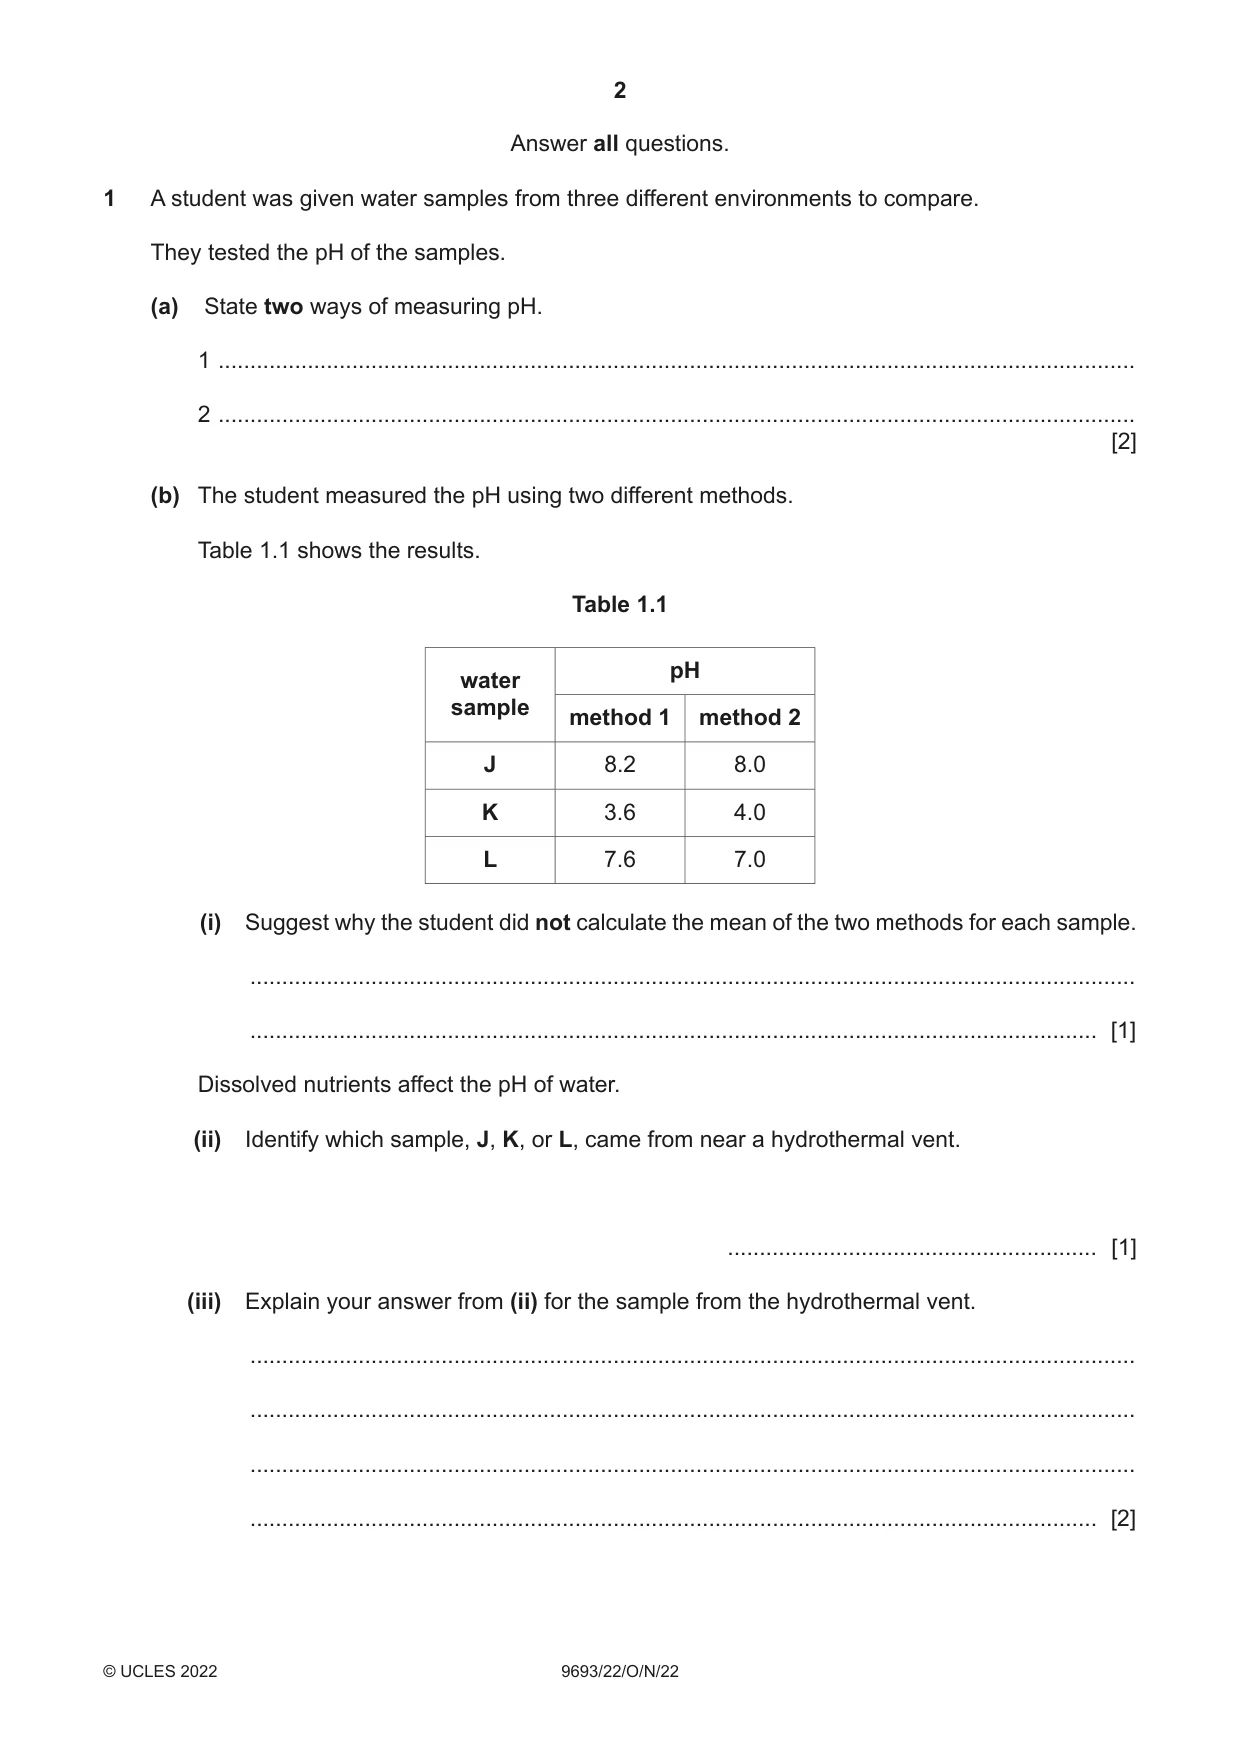
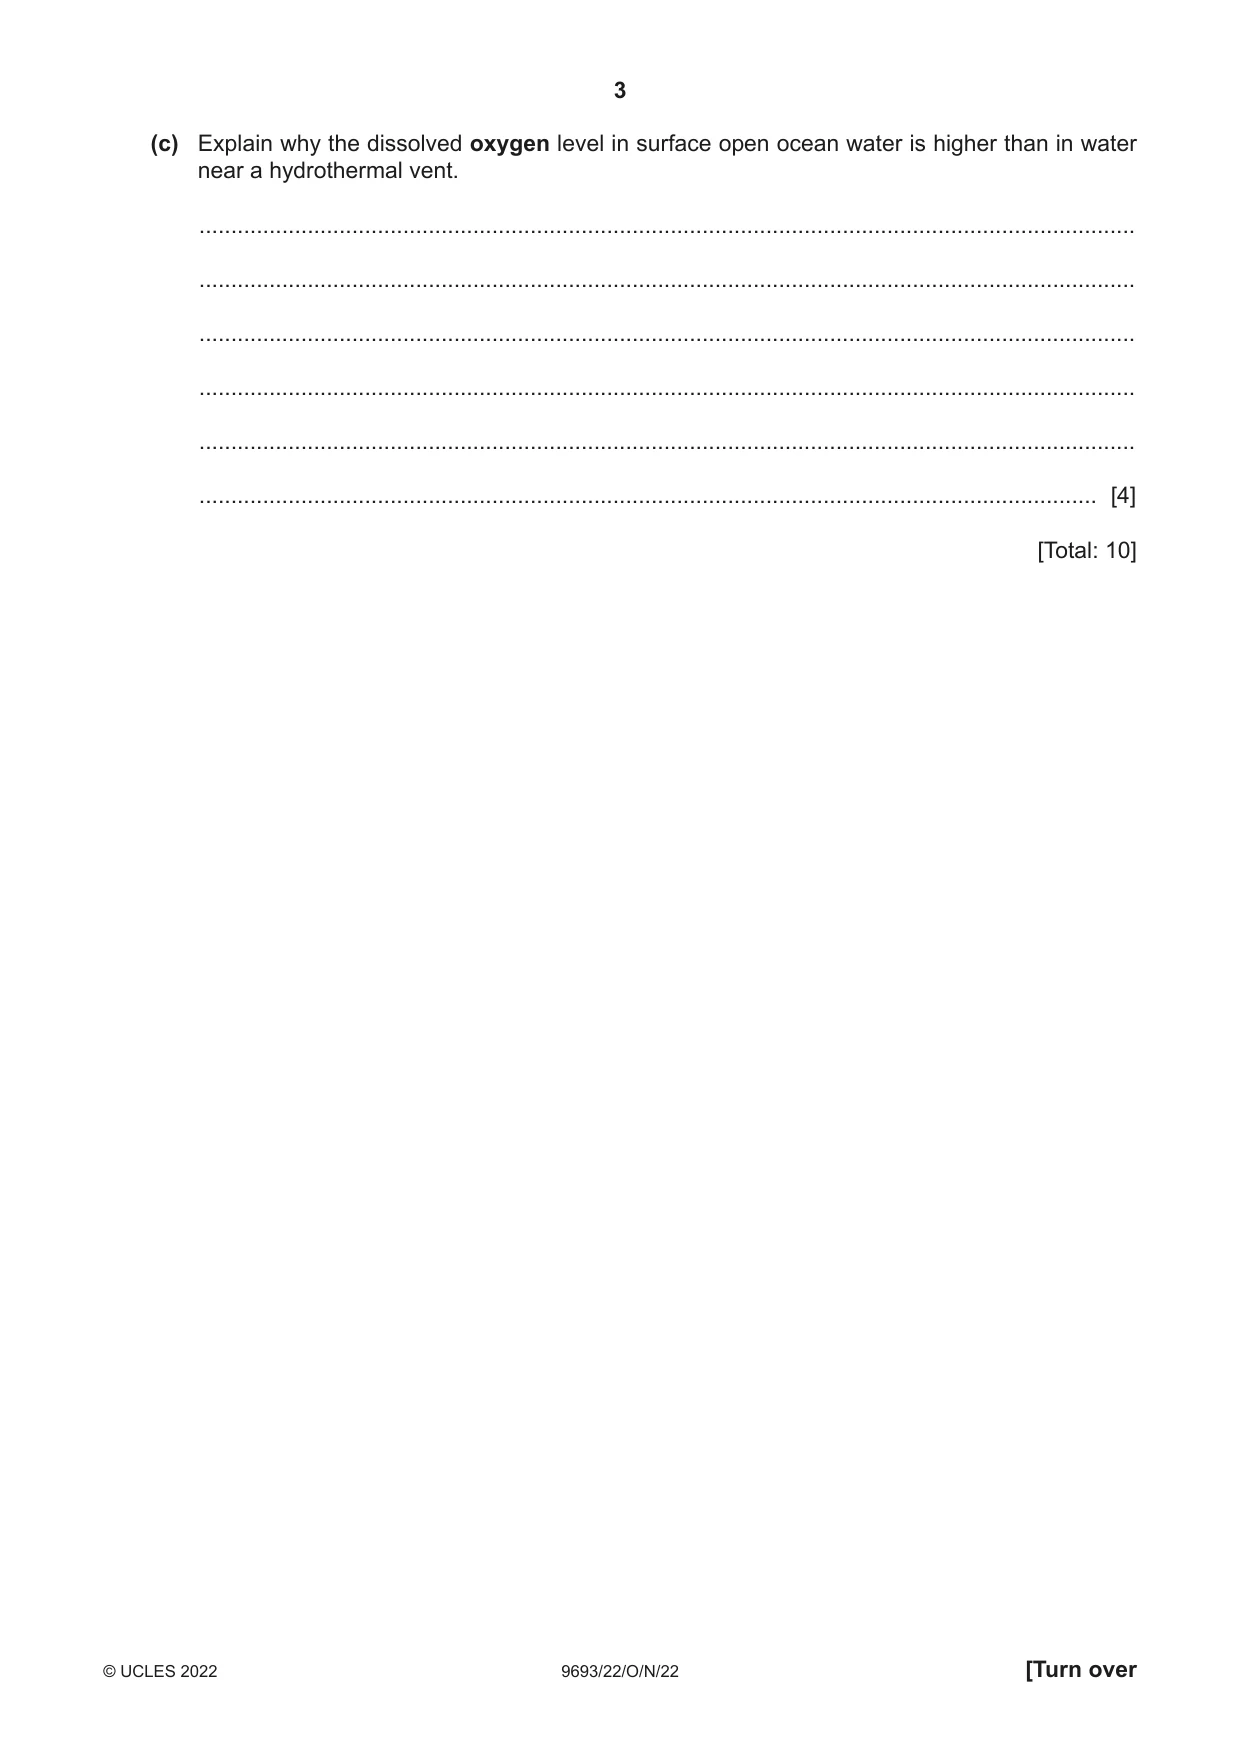
1 A student was given water samples from three different environments to compare. They tested the pH of the samples. (a) State two ways of measuring pH. 1 ................................................................................................................................................ 2 ................................................................................................................................................ [2] (b) The student measured the pH using two different methods. Table 1.1 shows the results. Table 1.1 pH water sample method 1 method 2 J 8.2 8.0 K 3.6 4.0 L 7.6 7.0 (i) Suggest why the student did not calculate the mean of the two methods for each sample. ........................................................................................................................................... ..................................................................................................................................... [1] Dissolved nutrients affect the pH of water. (ii) Identify which sample, J, K, or L, came from near a hydrothermal vent. .......................................................... [1] (iii) Explain your answer from (ii) for the sample from the hydrothermal vent. ........................................................................................................................................... ........................................................................................................................................... ........................................................................................................................................... ..................................................................................................................................... [2] (c) Explain why the dissolved oxygen level in surface open ocean water is higher than in water near a hydrothermal vent. ................................................................................................................................................... ................................................................................................................................................... ................................................................................................................................................... ................................................................................................................................................... ................................................................................................................................................... ............................................................................................................................................. [4] [Total: 10]
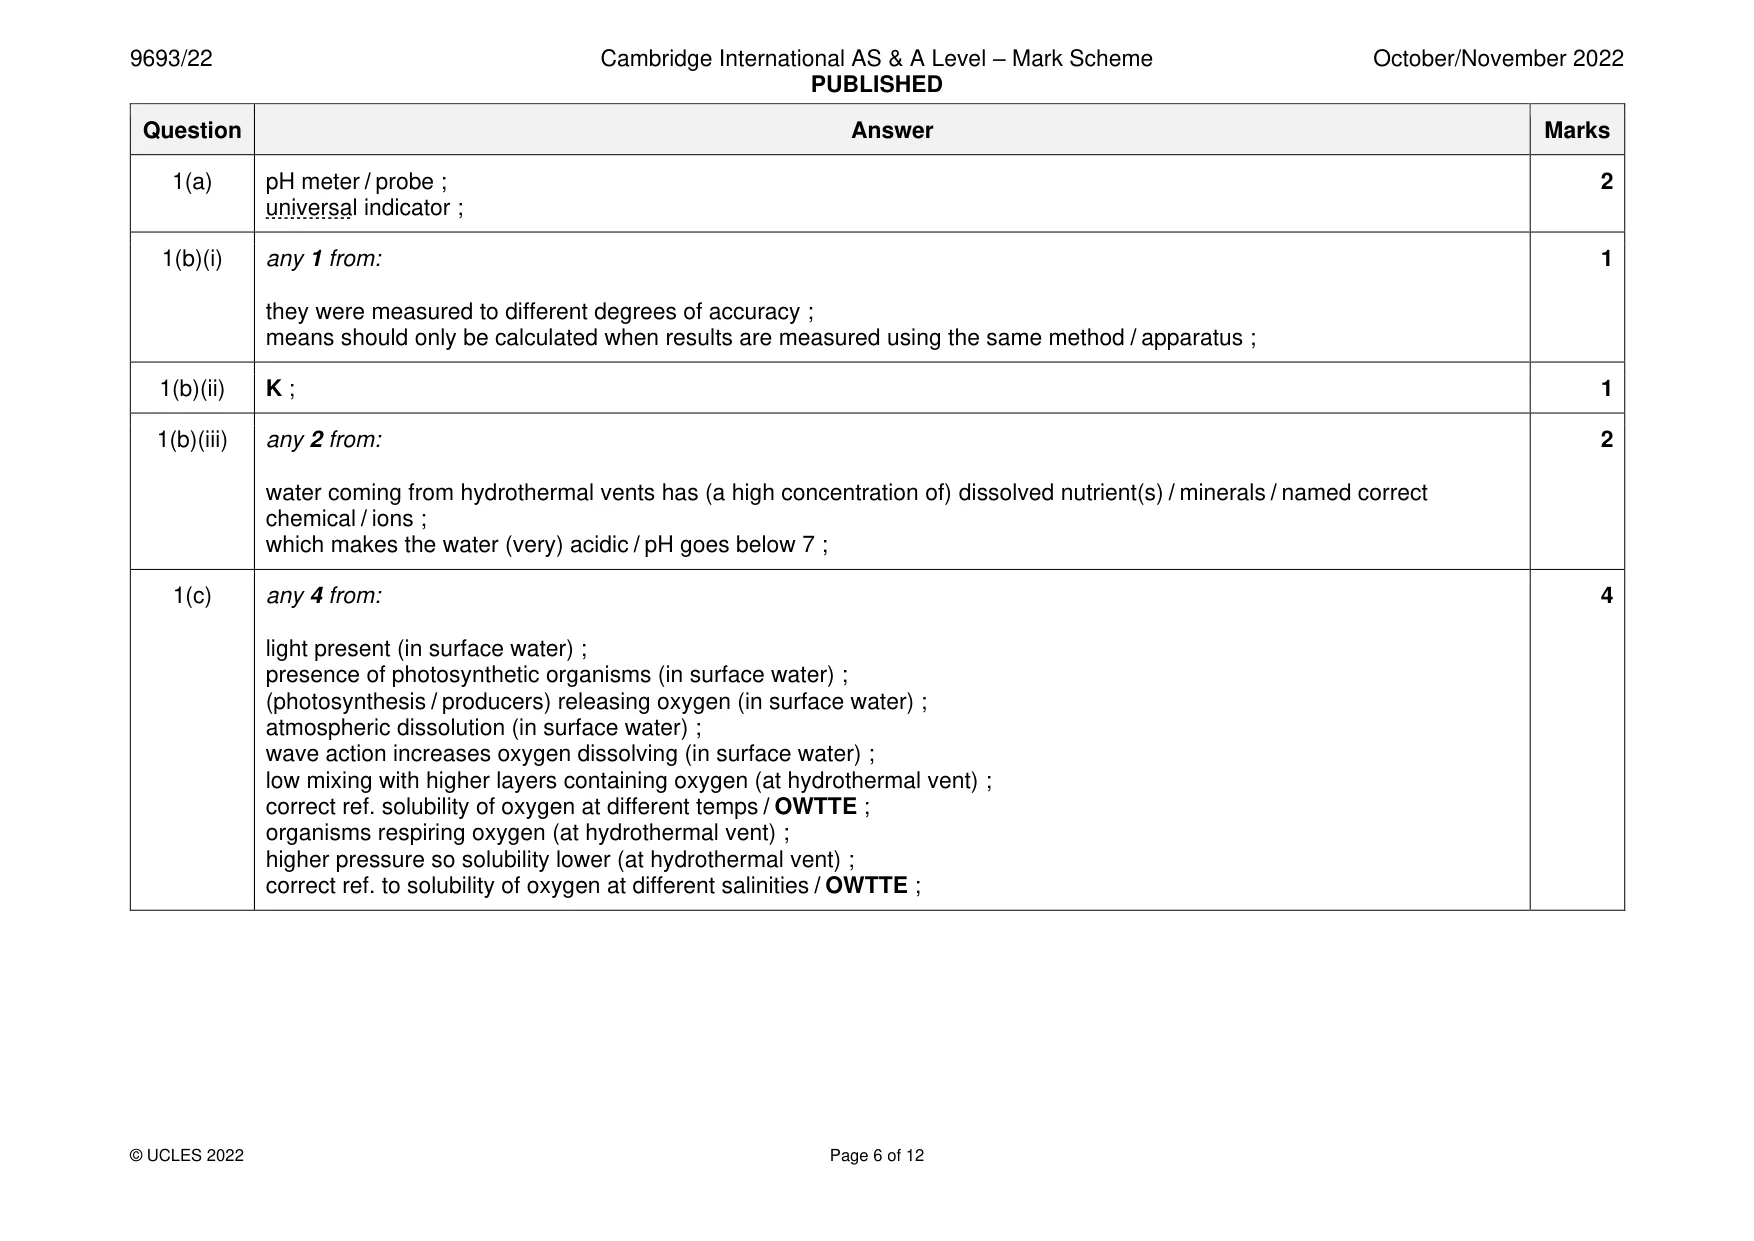
Mark scheme: Question Answer Marks 1(a) pH meter / probe ; 2 universal indicator ; 1(b)(i) any 1 from: 1 they were measured to different degrees of accuracy ; means should only be calculated when results are measured using the same method / apparatus ; 1(b)(ii) K ; 1 1(b)(iii) any 2 from: 2 water coming from hydrothermal vents has (a high concentration of) dissolved nutrient(s) / minerals / named correct chemical / ions ; which makes the water (very) acidic / pH goes below 7 ; 1(c) any 4 from: 4 light present (in surface water) ; presence of photosynthetic organisms (in surface water) ; (photosynthesis / producers) releasing oxygen (in surface water) ; atmospheric dissolution (in surface water) ; wave action increases oxygen dissolving (in surface water) ; low mixing with higher layers containing oxygen (at hydrothermal vent) ; correct ref. solubility of oxygen at different temps / OWTTE ; organisms respiring oxygen (at hydrothermal vent) ; higher pressure so solubility lower (at hydrothermal vent) ; correct ref. to solubility of oxygen at different salinities / OWTTE ;
Q2 · A high magnification image of a diatom
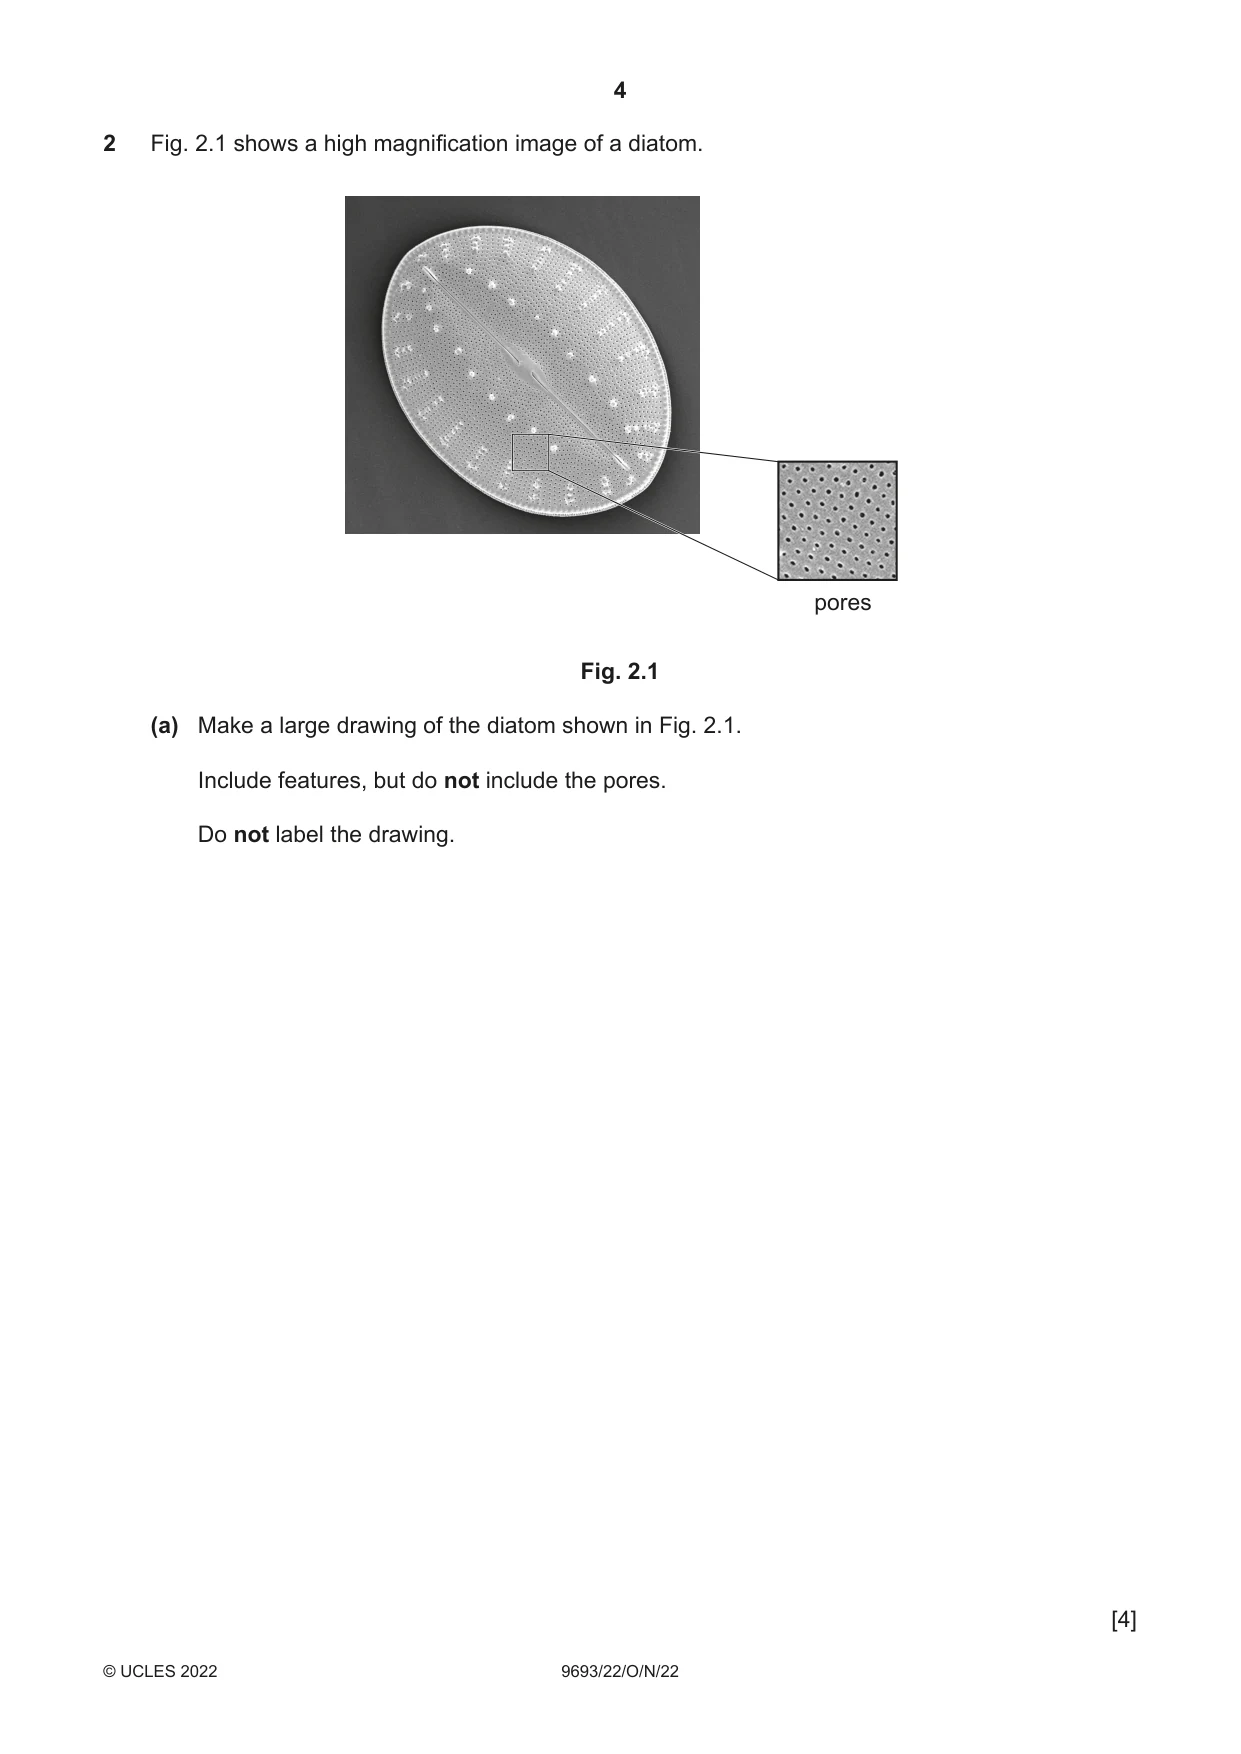
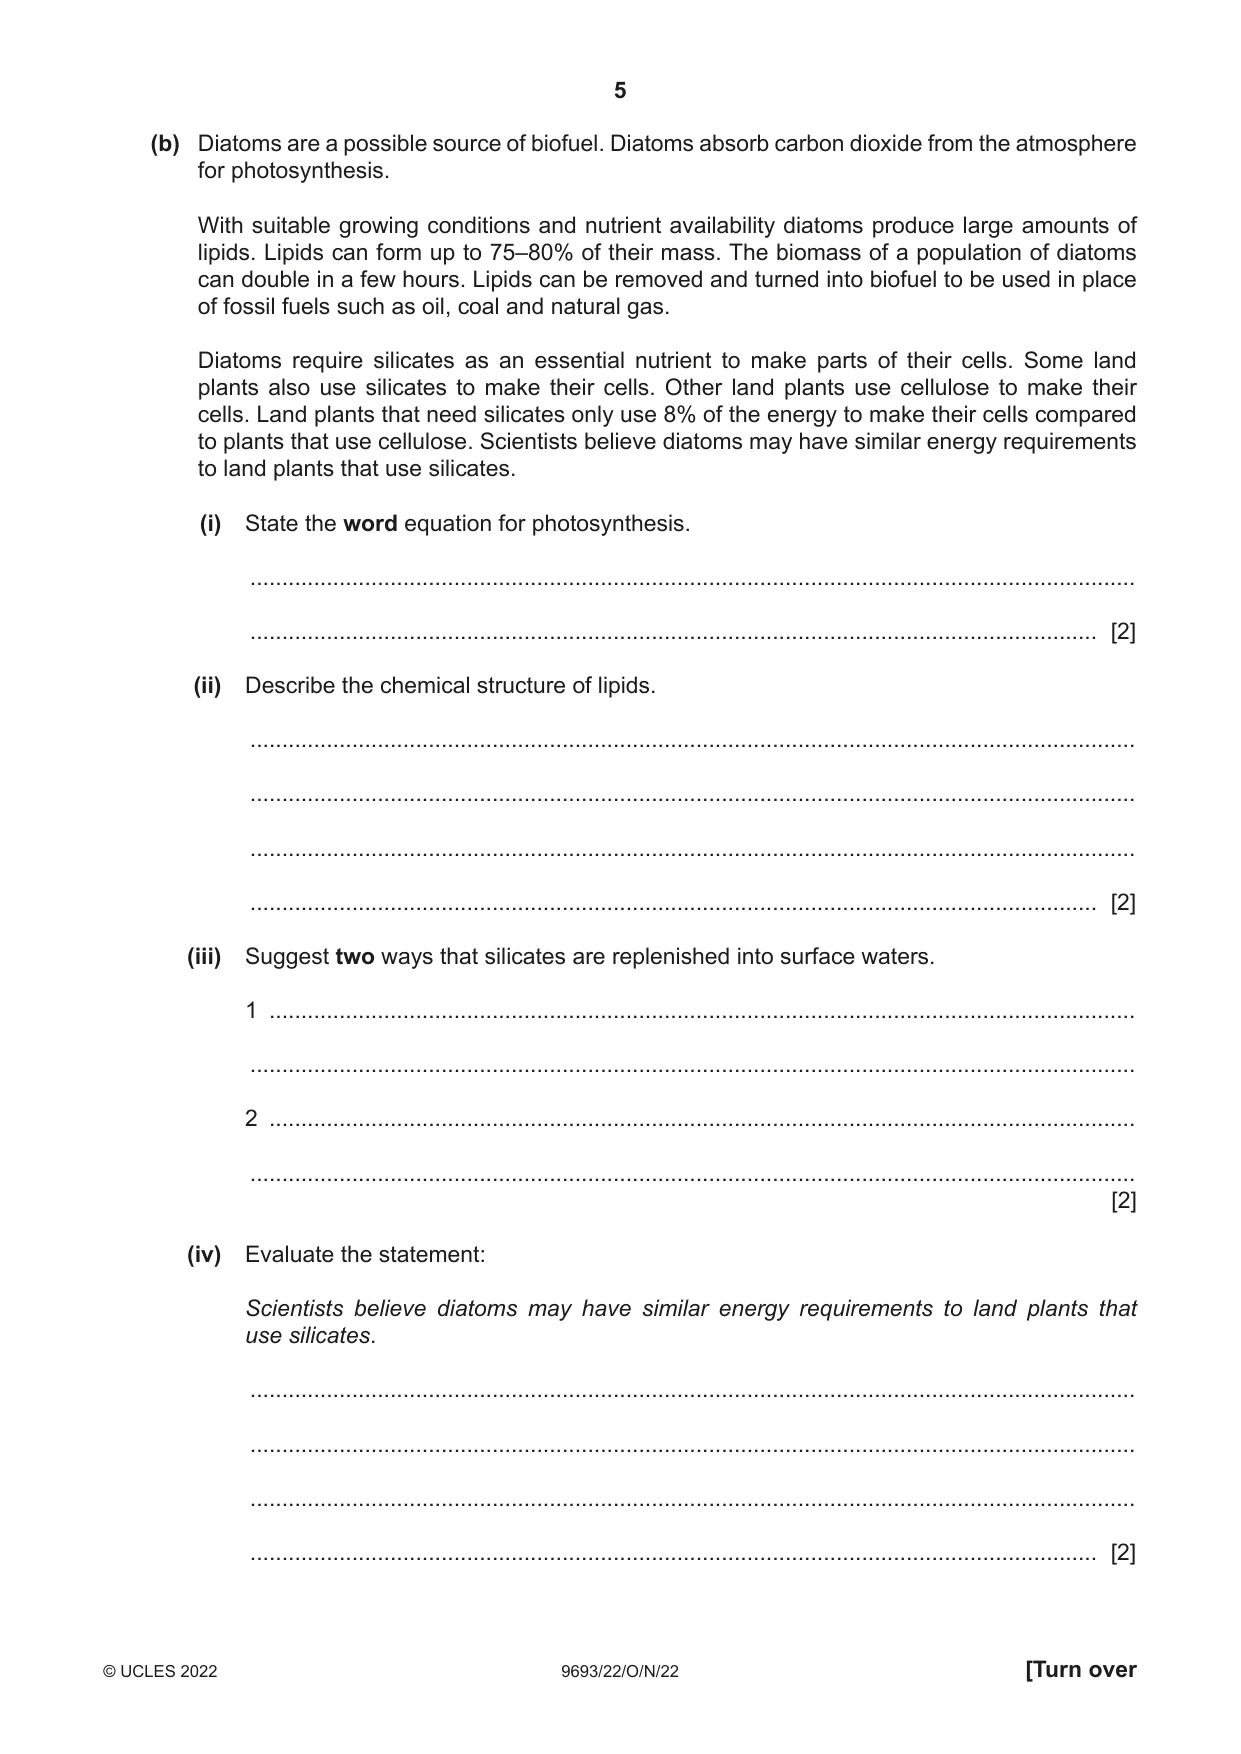
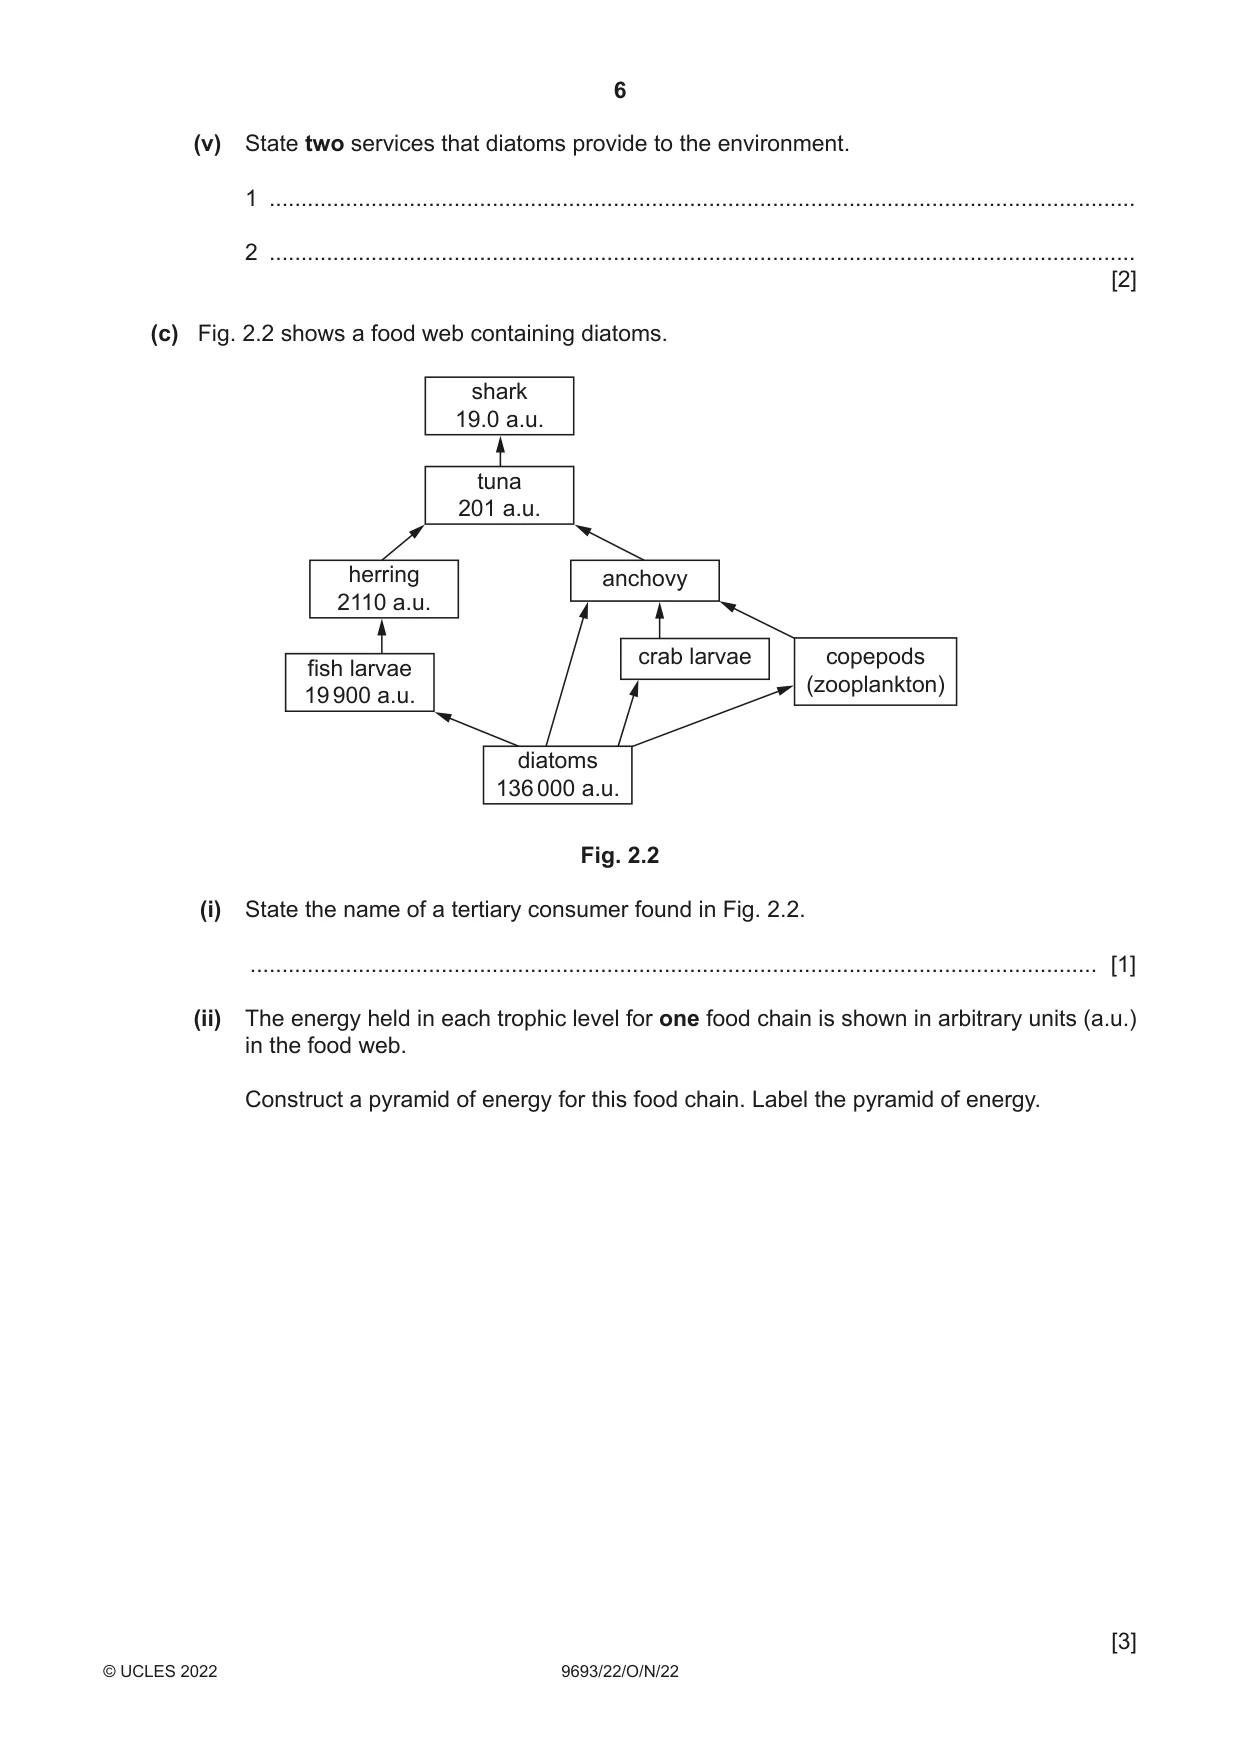
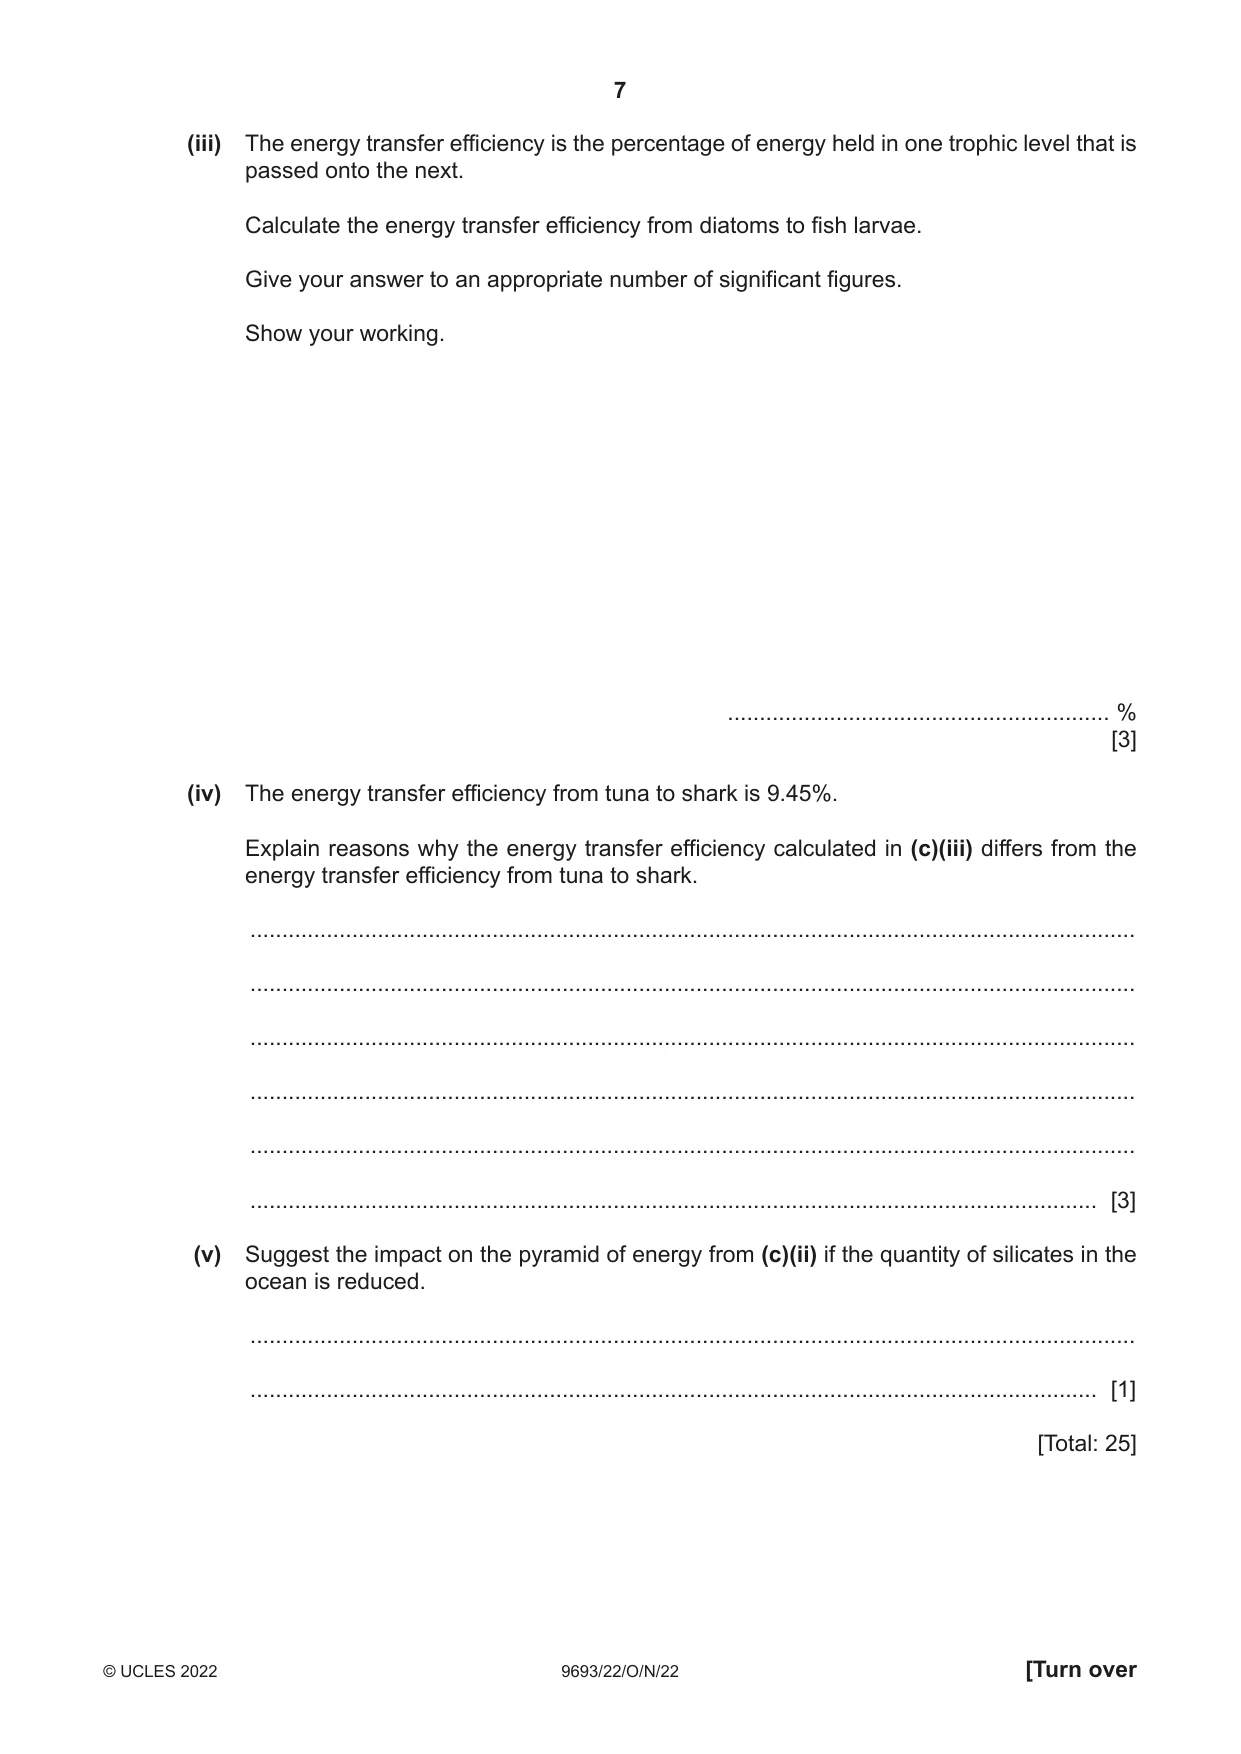
2 Fig. 2.1 shows a high magnification image of a diatom. pores Fig. 2.1 (a) Make a large drawing of the diatom shown in Fig. 2.1. Include features, but do not include the pores. Do not label the drawing. [4] (b) Diatoms are a possible source of biofuel. Diatoms absorb carbon dioxide from the atmosphere for photosynthesis. With suitable growing conditions and nutrient availability diatoms produce large amounts of lipids. Lipids can form up to 75–80% of their mass. The biomass of a population of diatoms can double in a few hours. Lipids can be removed and turned into biofuel to be used in place of fossil fuels such as oil, coal and natural gas. Diatoms require silicates as an essential nutrient to make parts of their cells. Some land plants also use silicates to make their cells. Other land plants use cellulose to make their cells. Land plants that need silicates only use 8% of the energy to make their cells compared to plants that use cellulose. Scientists believe diatoms may have similar energy requirements to land plants that use silicates. (i) State the word equation for photosynthesis. ........................................................................................................................................... ..................................................................................................................................... [2] (ii) Describe the chemical structure of lipids. ........................................................................................................................................... ........................................................................................................................................... ........................................................................................................................................... ..................................................................................................................................... [2] (iii) Suggest two ways that silicates are replenished into surface waters. 1 ........................................................................................................................................ ........................................................................................................................................... 2 ........................................................................................................................................ ........................................................................................................................................... [2] (iv) Evaluate the statement: Scientists believe diatoms may have similar energy requirements to land plants that use silicates. ........................................................................................................................................... ........................................................................................................................................... ........................................................................................................................................... ..................................................................................................................................... [2] (v) State two services that diatoms provide to the environment. 1 ........................................................................................................................................ 2 ........................................................................................................................................ [2] (c) Fig. 2.2 shows a food web containing diatoms. shark 19.0 a.u. tuna 201 a.u. herring anchovy 2110 a.u. crab larvae copepods fish larvae (zooplankton) 19 900 a.u. diatoms 136 000 a.u. Fig. 2.2 (i) State the name of a tertiary consumer found in Fig. 2.2. ..................................................................................................................................... [1] (ii) The energy held in each trophic level for one food chain is shown in arbitrary units (a.u.) in the food web. Construct a pyramid of energy for this food chain. Label the pyramid of energy. [3] (iii) The energy transfer efficiency is the percentage of energy held in one trophic level that is passed onto the next. Calculate the energy transfer efficiency from diatoms to fish larvae. Give your answer to an appropriate number of significant figures. Show your working. ............................................................ % [3] (iv) The energy transfer efficiency from tuna to shark is 9.45%. Explain reasons why the energy transfer efficiency calculated in (c)(iii) differs from the energy transfer efficiency from tuna to shark. ........................................................................................................................................... ........................................................................................................................................... ........................................................................................................................................... ........................................................................................................................................... ........................................................................................................................................... ..................................................................................................................................... [3] (v) Suggest the impact on the pyramid of energy from (c)(ii) if the quantity of silicates in the ocean is reduced. ........................................................................................................................................... ..................................................................................................................................... [1] [Total: 25]
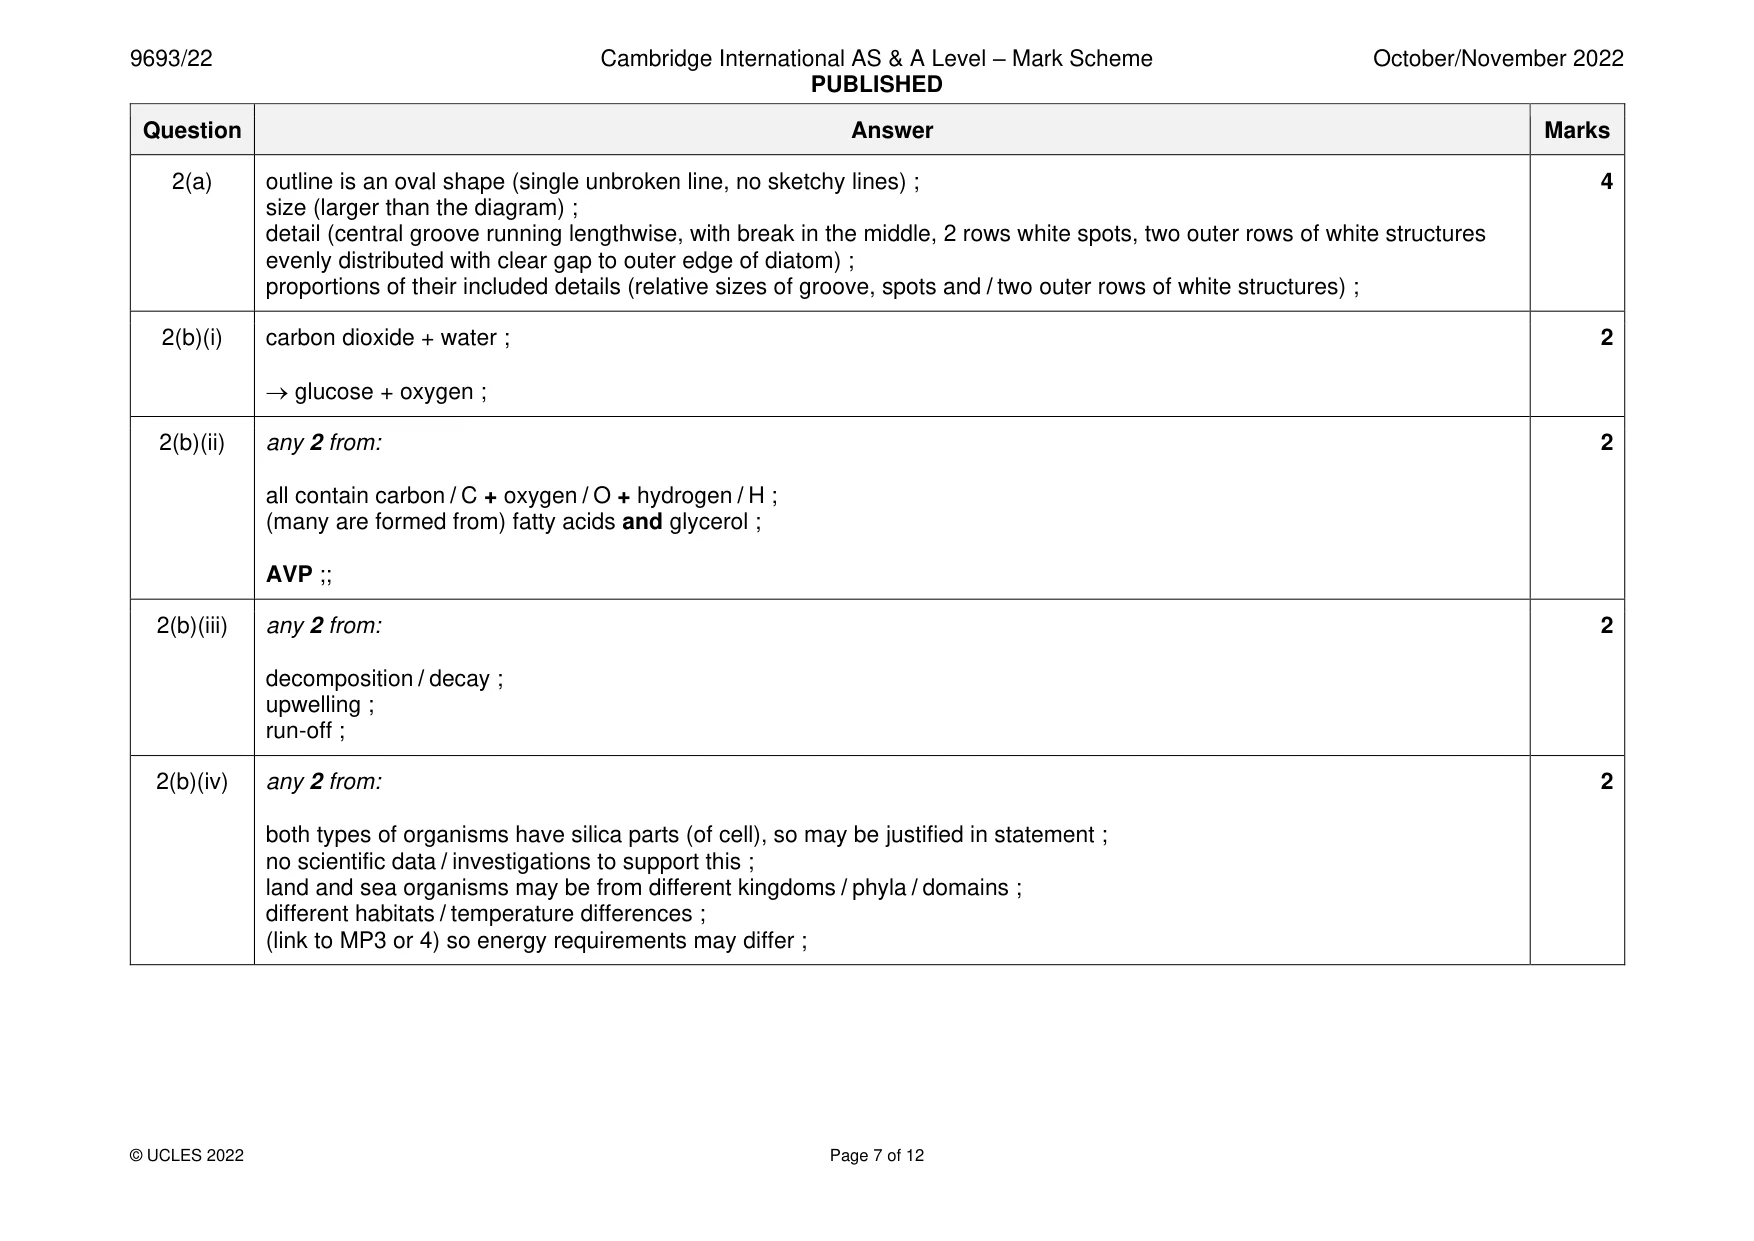
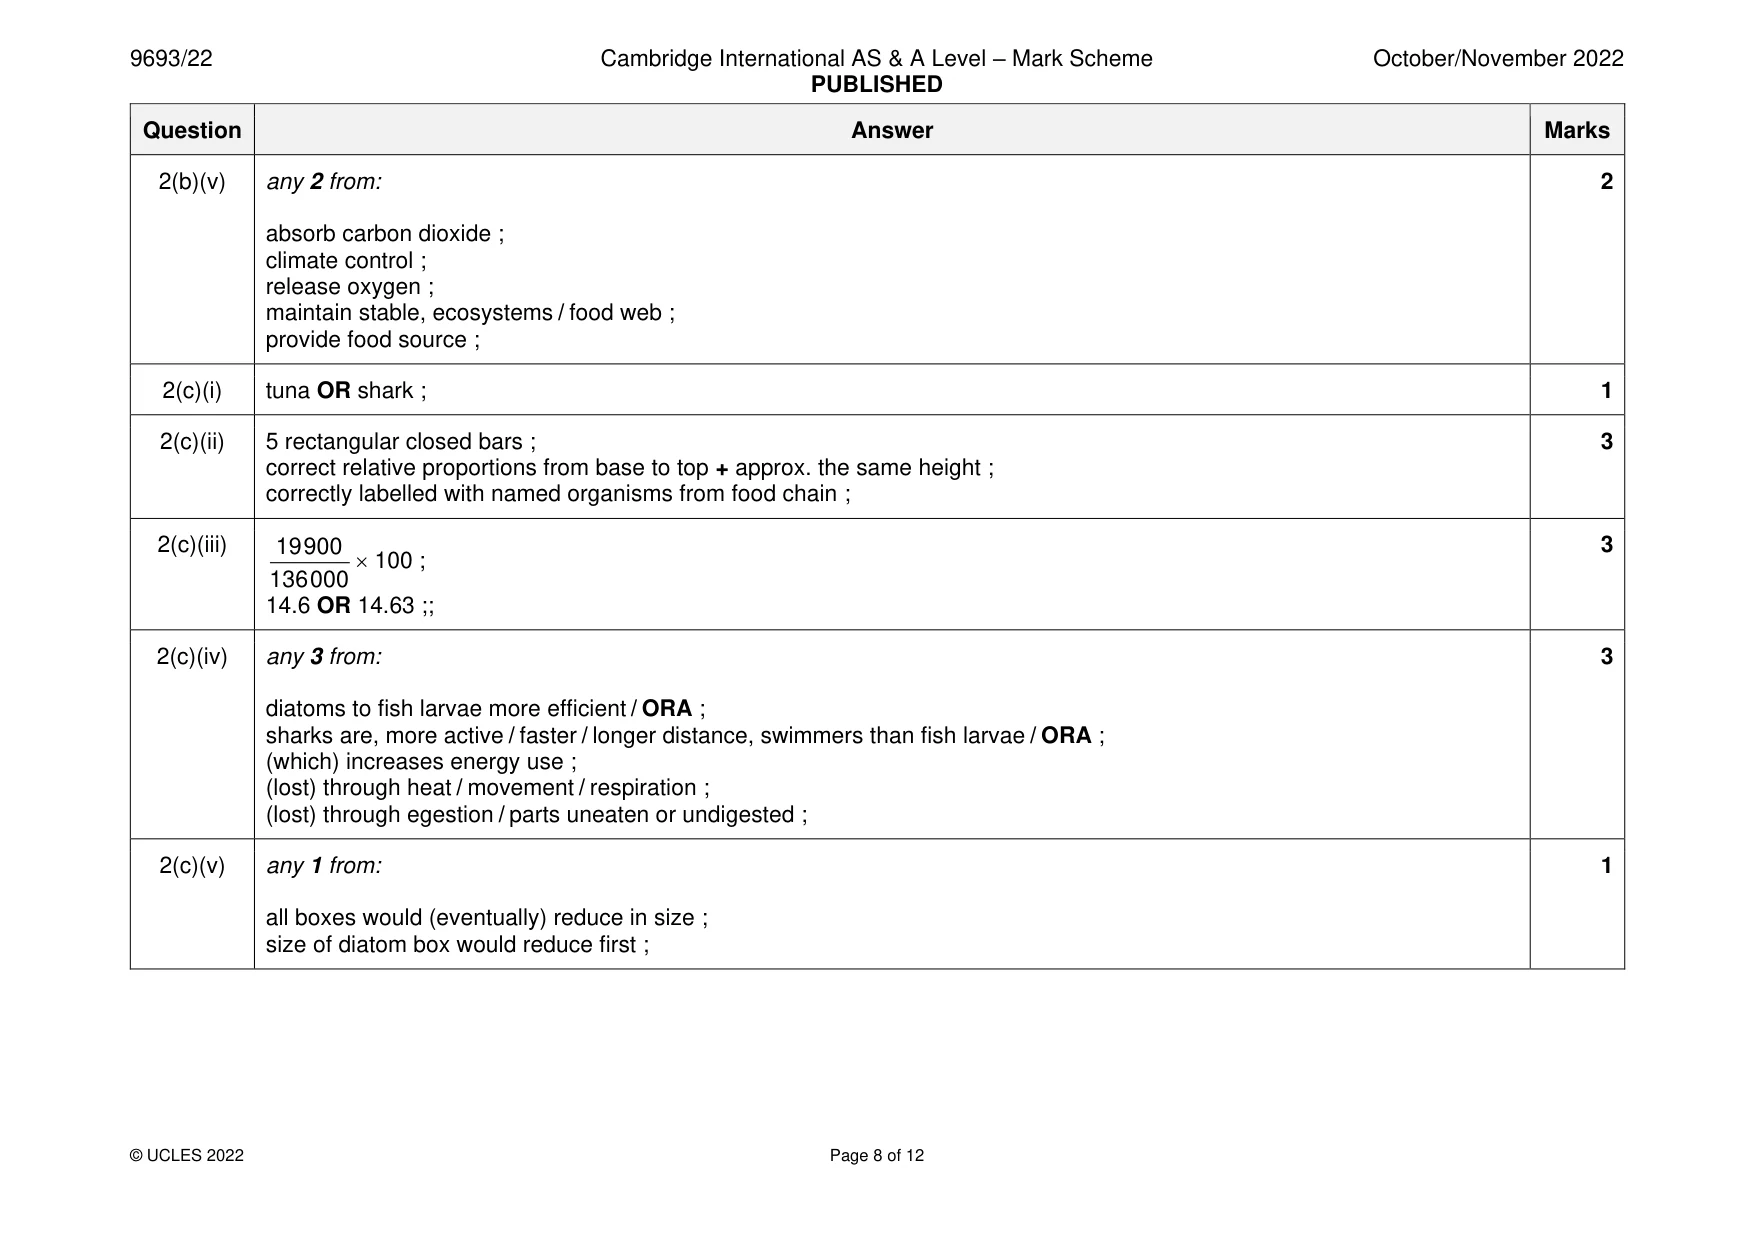
Mark scheme: 2(a) outline is an oval shape (single unbroken line, no sketchy lines) ; 4 size (larger than the diagram) ; detail (central groove running lengthwise, with break in the middle, 2 rows white spots, two outer rows of white structures evenly distributed with clear gap to outer edge of diatom) ; proportions of their included details (relative sizes of groove, spots and / two outer rows of white structures) ; 2(b)(i) carbon dioxide + water ; 2 → glucose + oxygen ; 2(b)(ii) any 2 from: 2 all contain carbon / C + oxygen / O + hydrogen / H ; (many are formed from) fatty acids and glycerol ; AVP ;; 2(b)(iii) any 2 from: 2 decomposition / decay ; upwelling ; run-off ; 2(b)(iv) any 2 from: 2 both types of organisms have silica parts (of cell), so may be justified in statement ; no scientific data / investigations to support this ; land and sea organisms may be from different kingdoms / phyla / domains ; different habitats / temperature differences ; (link to MP3 or 4) so energy requirements may differ ; 2(b)(v) any 2 from: 2 absorb carbon dioxide ; climate control ; release oxygen ; maintain stable, ecosystems / food web ; provide food source ; 2(c)(i) tuna OR shark ; 1 2(c)(ii) 5 rectangular closed bars ; 3 correct relative proportions from base to top + approx. the same height ; correctly labelled with named organisms from food chain ; 2(c)(iii) 19 900 3 100 ; 136 000 14.6 OR 14.63 ;; 2(c)(iv) any 3 from: 3 diatoms to fish larvae more efficient / ORA ; sharks are, more active / faster / longer distance, swimmers than fish larvae / ORA ; (which) increases energy use ; (lost) through heat / movement / respiration ; (lost) through egestion / parts uneaten or undigested ; 2(c)(v) any 1 from: 1 all boxes would (eventually) reduce in size ; size of diatom box would reduce first ;
Q3 · Many organisms have a planktonic stage in their development
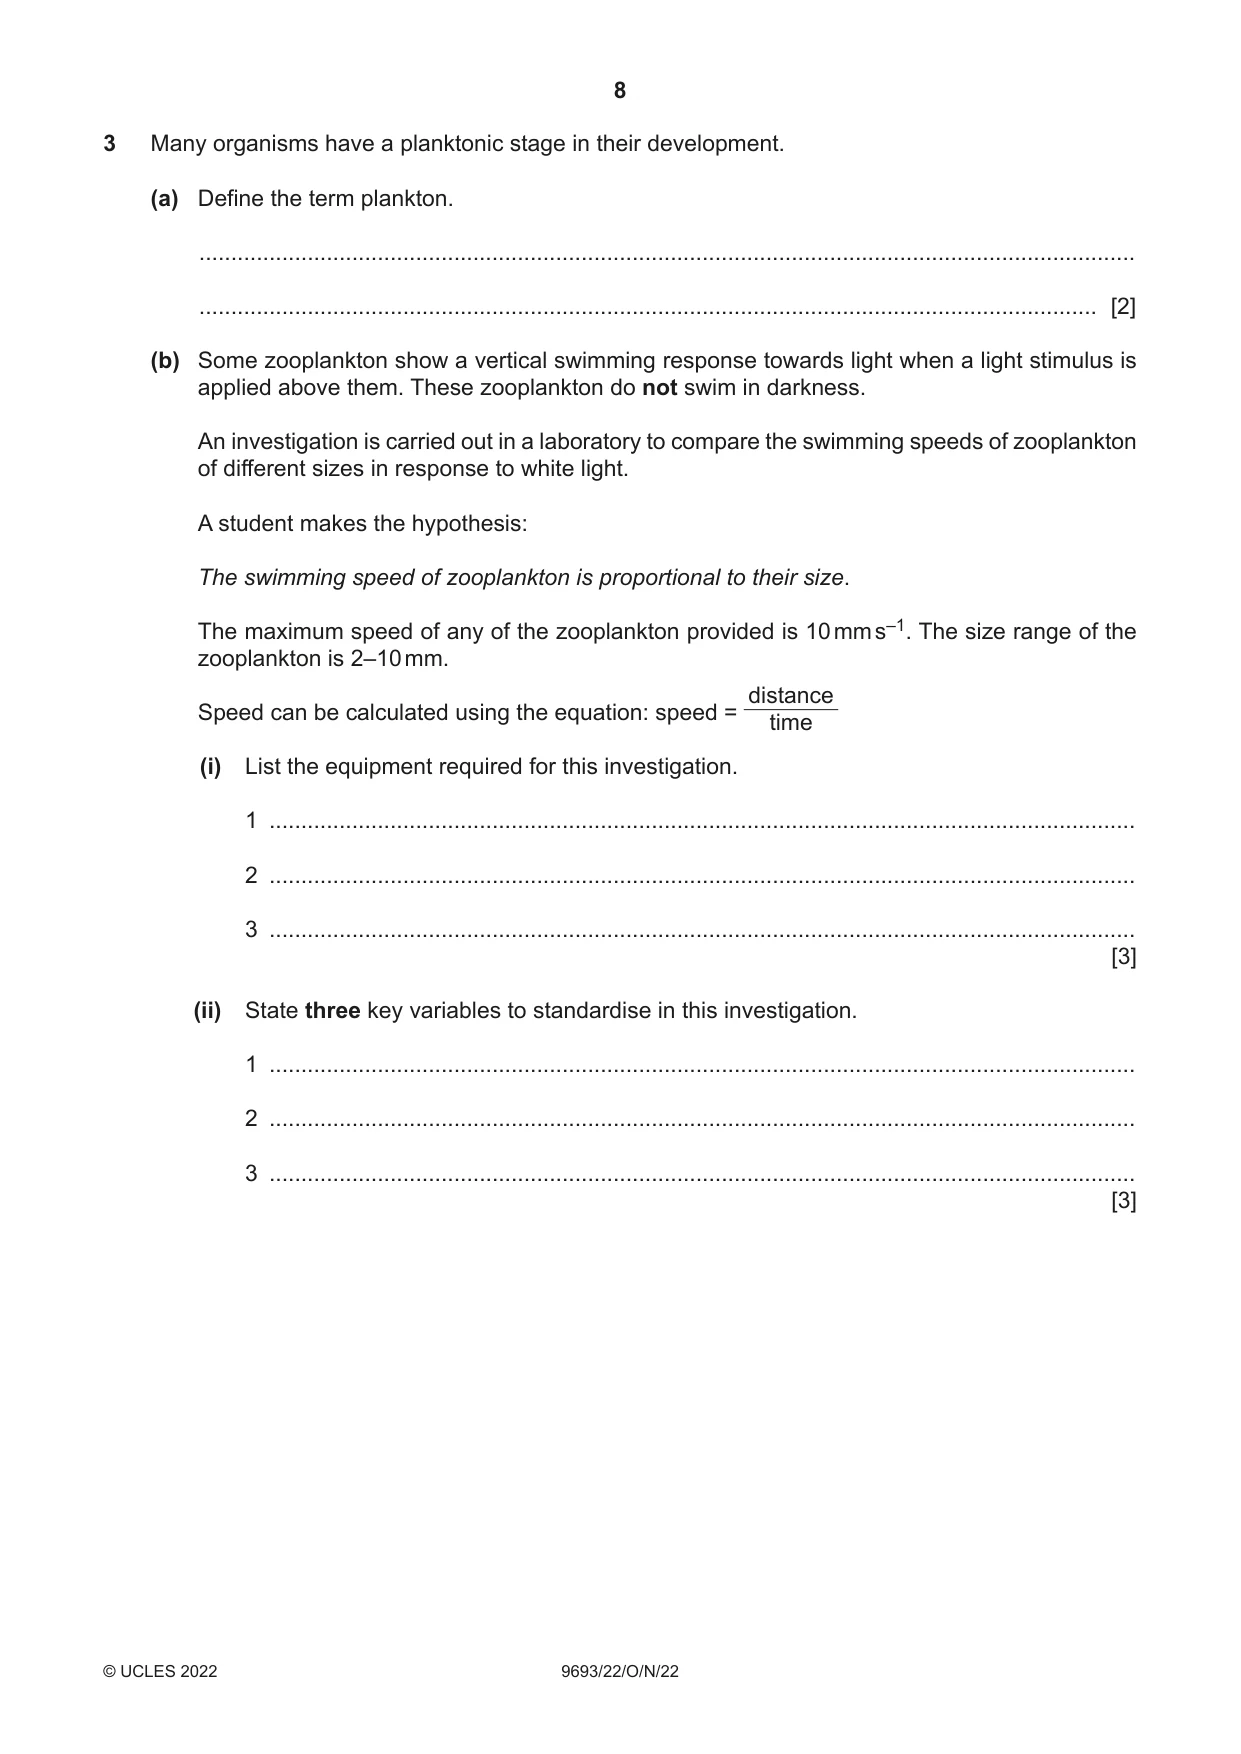
3 Many organisms have a planktonic stage in their development. (a) Define the term plankton. ................................................................................................................................................... ............................................................................................................................................. [2] (b) Some zooplankton show a vertical swimming response towards light when a light stimulus is applied above them. These zooplankton do not swim in darkness. An investigation is carried out in a laboratory to compare the swimming speeds of zooplankton of different sizes in response to white light. A student makes the hypothesis: The swimming speed of zooplankton is proportional to their size. The maximum speed of any of the zooplankton provided is 10 mm s–1. The size range of the zooplankton is 2–10 mm. distance Speed can be calculated using the equation: speed = time (i) List the equipment required for this investigation. 1 ........................................................................................................................................ 2 ........................................................................................................................................ 3 ........................................................................................................................................ [3] (ii) State three key variables to standardise in this investigation. 1 ........................................................................................................................................ 2 ........................................................................................................................................ 3 ........................................................................................................................................ [3] (iii) Outline a method to compare the swimming speeds of zooplankton of different sizes in response to white light. ........................................................................................................................................... ........................................................................................................................................... ........................................................................................................................................... ........................................................................................................................................... ........................................................................................................................................... ........................................................................................................................................... ........................................................................................................................................... ........................................................................................................................................... ........................................................................................................................................... ........................................................................................................................................... ........................................................................................................................................... ........................................................................................................................................... ..................................................................................................................................... [5] (c) Use the space below to draw a suitable table to record the results from the method described in (b)(iii). Include full headings and units in the table. Do not write in any results. [2] [Total: 15]
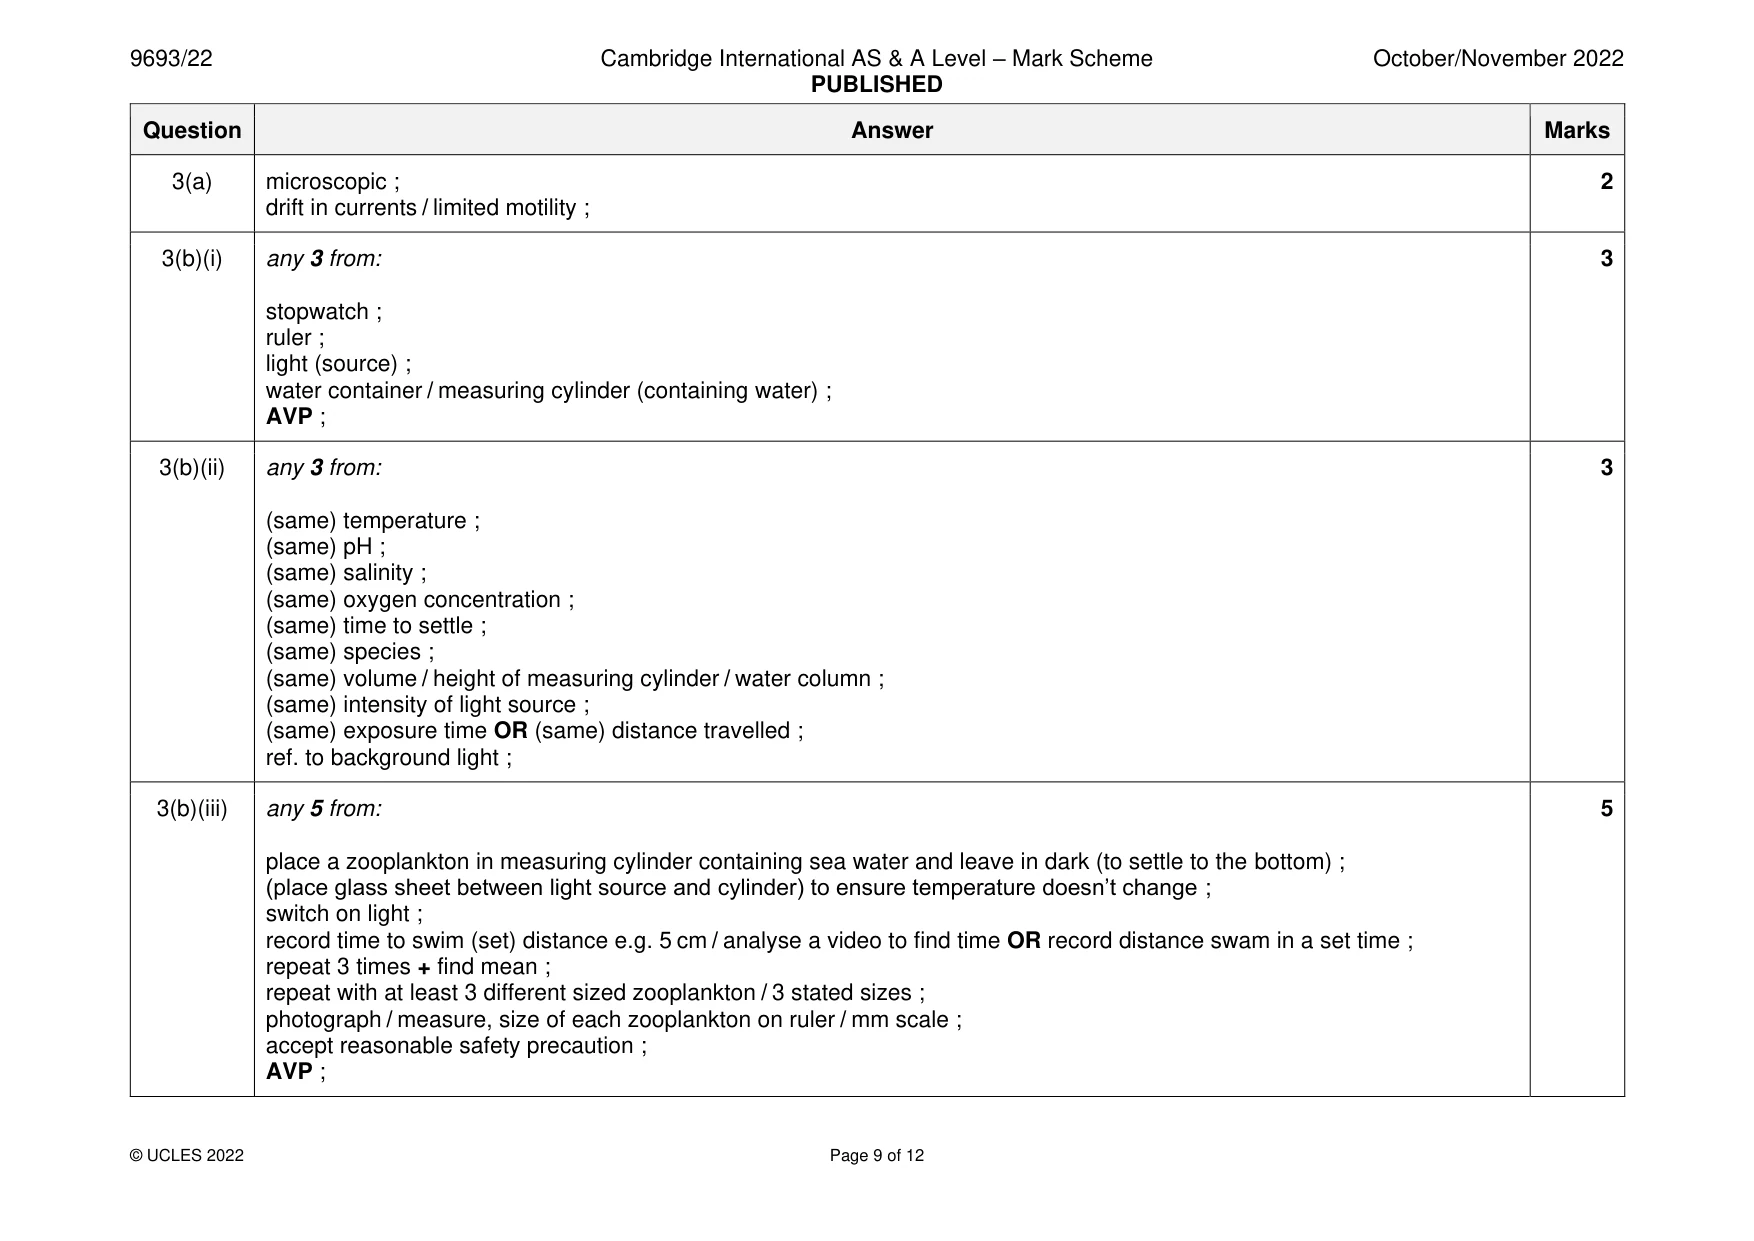
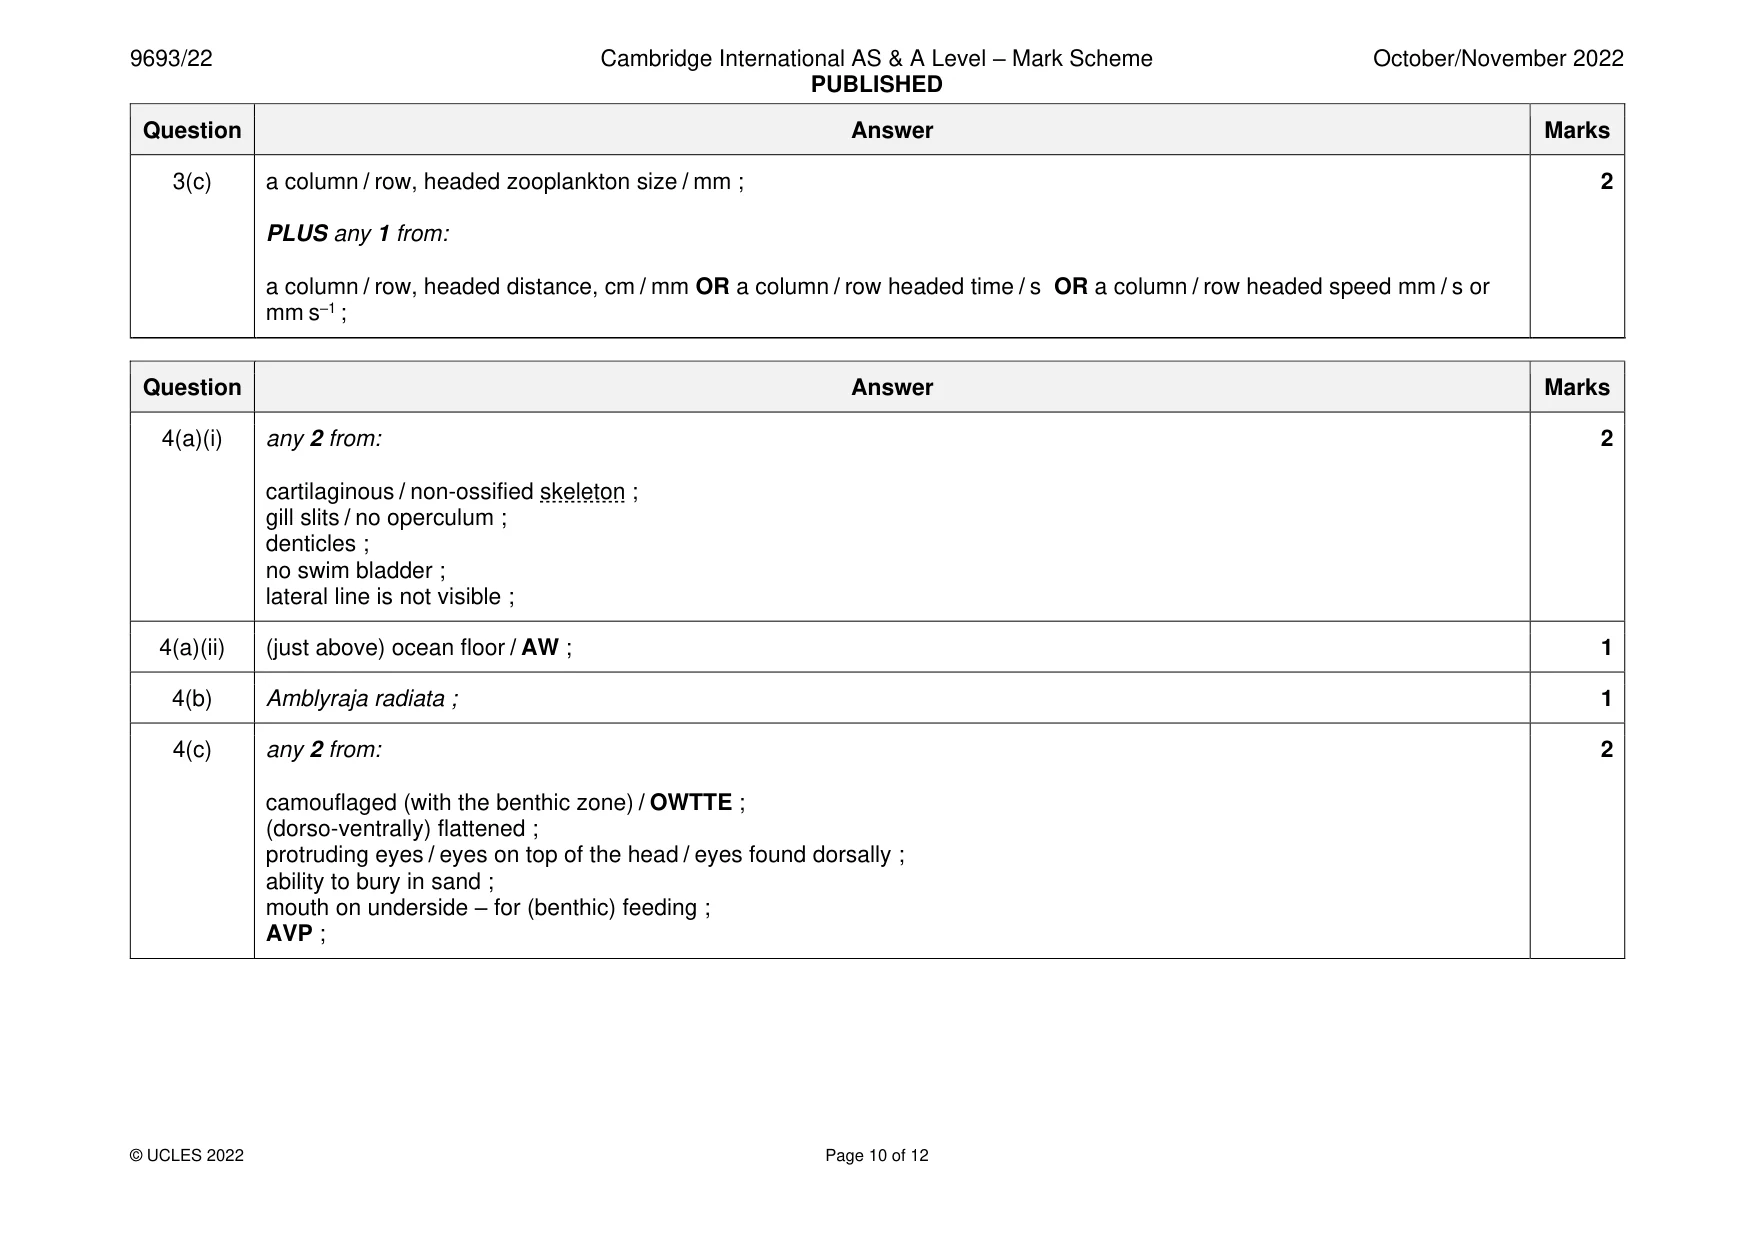
Mark scheme: 3(a) microscopic ; 2 drift in currents / limited motility ; 3(b)(i) any 3 from: 3 stopwatch ; ruler ; light (source) ; water container / measuring cylinder (containing water) ; AVP ; 3(b)(ii) any 3 from: 3 (same) temperature ; (same) pH ; (same) salinity ; (same) oxygen concentration ; (same) time to settle ; (same) species ; (same) volume / height of measuring cylinder / water column ; (same) intensity of light source ; (same) exposure time OR (same) distance travelled ; ref. to background light ; 3(b)(iii) any 5 from: 5 place a zooplankton in measuring cylinder containing sea water and leave in dark (to settle to the bottom) ; (place glass sheet between light source and cylinder) to ensure temperature doesn’t change ; switch on light ; record time to swim (set) distance e.g. 5 cm / analyse a video to find time OR record distance swam in a set time ; repeat 3 times + find mean ; repeat with at least 3 different sized zooplankton / 3 stated sizes ; photograph / measure, size of each zooplankton on ruler / mm scale ; accept reasonable safety precaution ; AVP ; 3(c) a column / row, headed zooplankton size / mm ; 2 PLUS any 1 from: a column / row, headed distance, cm / mm OR a column / row headed time / s OR a column / row headed speed mm / s or mm s–1 ;
Q4 · Skate are cartilaginous fish which live in the benthic zone
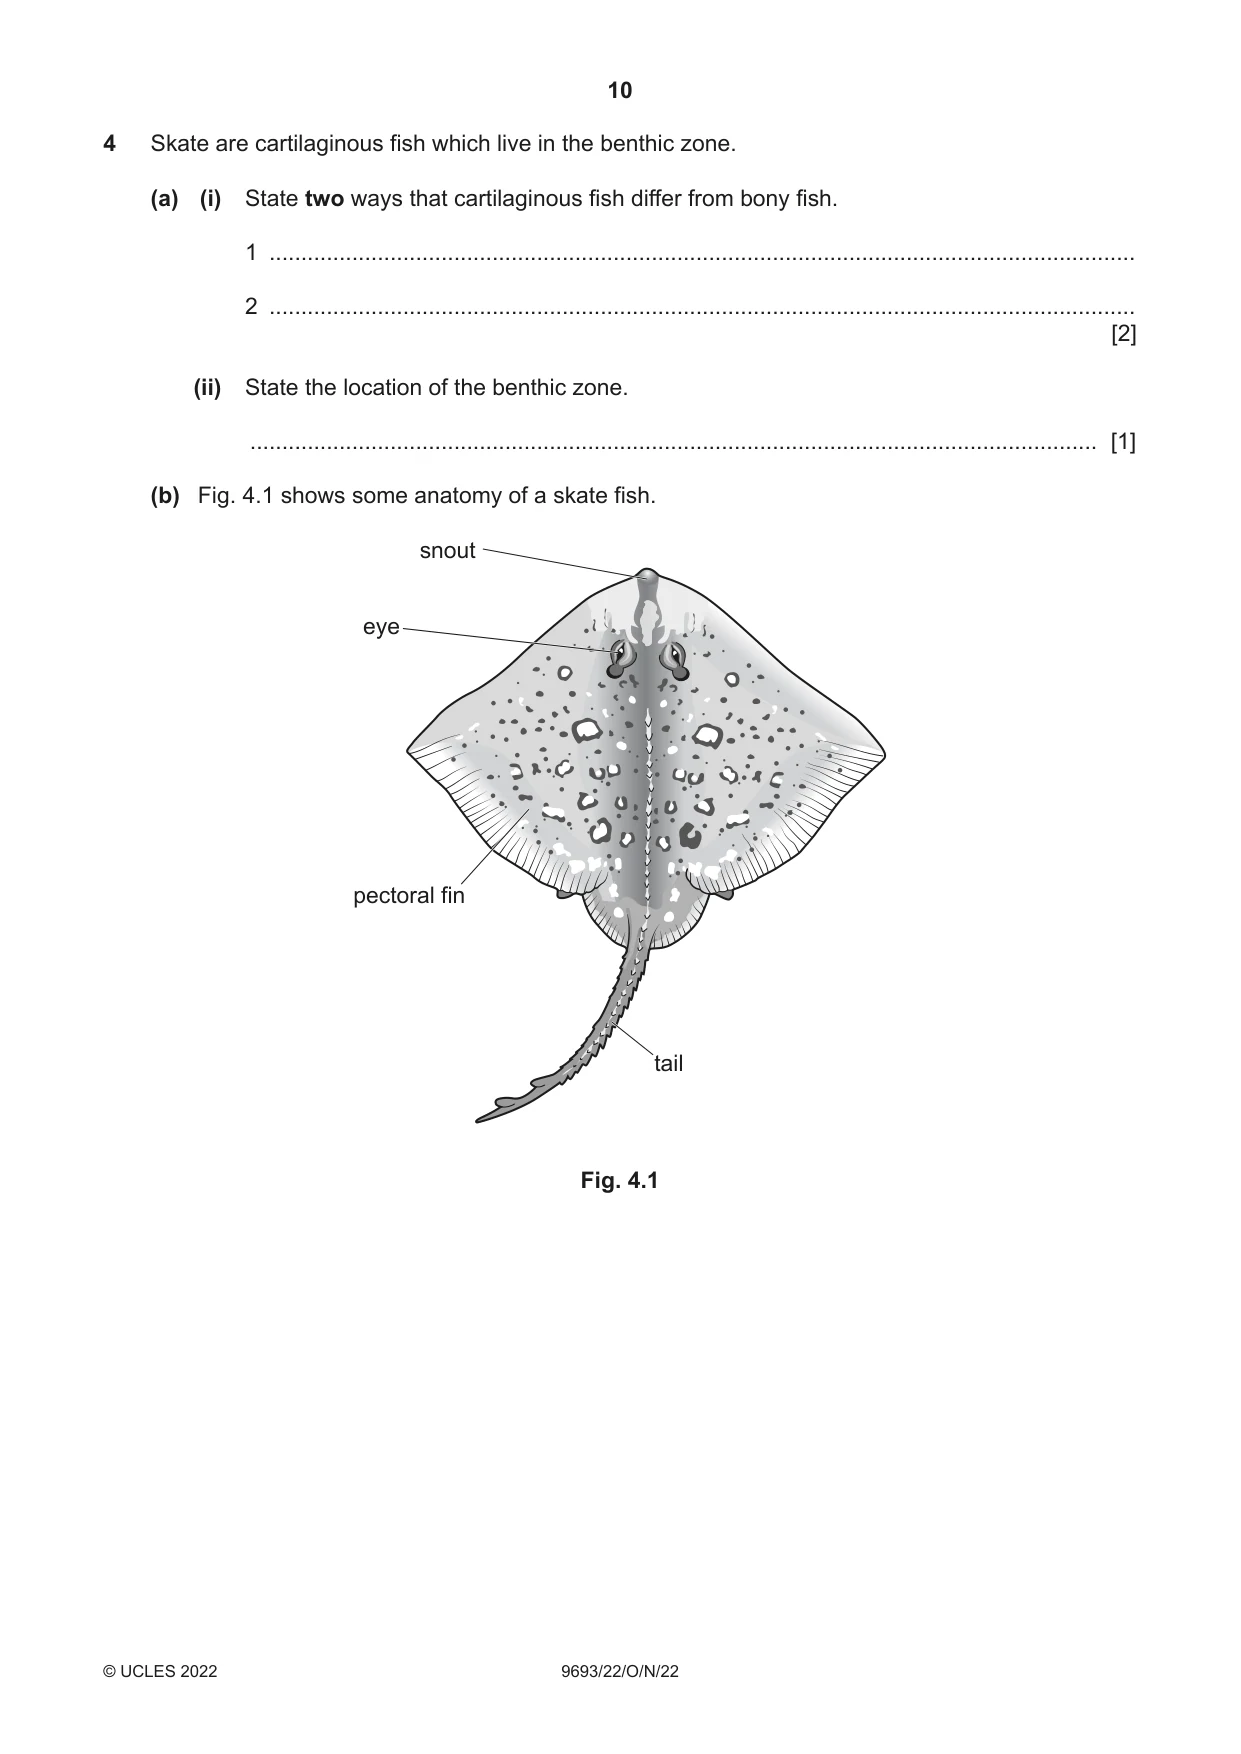
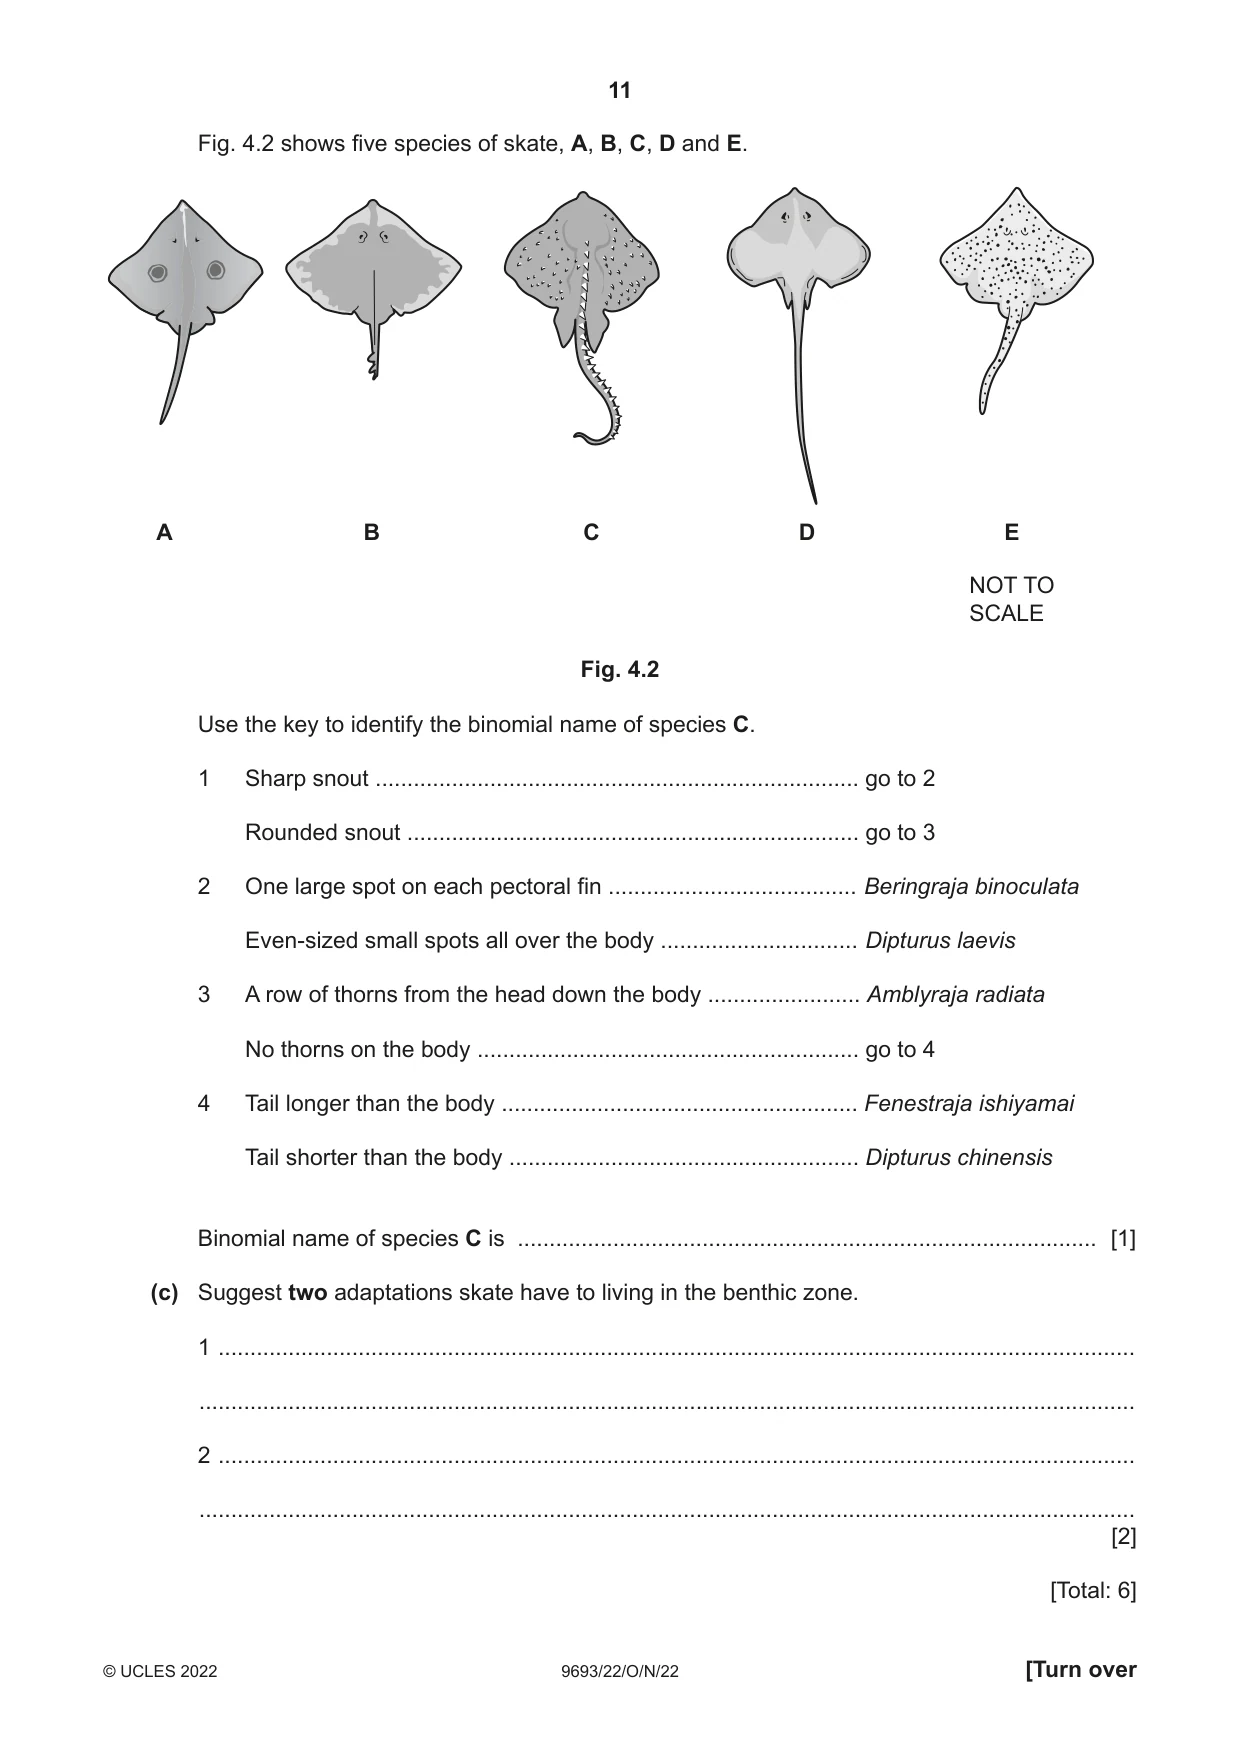
4 Skate are cartilaginous fish which live in the benthic zone. (a) (i) State two ways that cartilaginous fish differ from bony fish. 1 ........................................................................................................................................ 2 ........................................................................................................................................ [2] (ii) State the location of the benthic zone. ..................................................................................................................................... [1] (b) Fig. 4.1 shows some anatomy of a skate fish. snout eye pectoral fin tail Fig. 4.1 Fig. 4.2 shows five species of skate, A, B, C, D and E. A B C D E NOT TO SCALE Fig. 4.2 Use the key to identify the binomial name of species C. 1 Sharp snout ............................................................................ go to 2 Rounded snout ....................................................................... go to 3 2 One large spot on each pectoral fin ....................................... Beringraja binoculata Even-sized small spots all over the body ............................... Dipturus laevis 3 A row of thorns from the head down the body ........................ Amblyraja radiata No thorns on the body ............................................................ go to 4 4 Tail longer than the body ........................................................ Fenestraja ishiyamai Tail shorter than the body ....................................................... Dipturus chinensis Binomial name of species C is ........................................................................................... [1] (c) Suggest two adaptations skate have to living in the benthic zone. 1 ................................................................................................................................................ ................................................................................................................................................... 2 ................................................................................................................................................ ................................................................................................................................................... [2] [Total: 6]
Mark scheme: 4(a)(i) any 2 from: 2 cartilaginous / non-ossified skeleton ; gill slits / no operculum ; denticles ; no swim bladder ; lateral line is not visible ; 4(a)(ii) (just above) ocean floor / AW ; 1 4(b) Amblyraja radiata ; 1 4(c) any 2 from: 2 camouflaged (with the benthic zone) / OWTTE ; (dorso-ventrally) flattened ; protruding eyes / eyes on top of the head / eyes found dorsally ; ability to bury in sand ; mouth on underside – for (benthic) feeding ; AVP ;
Q5 · The salinity at different depths in an estuary
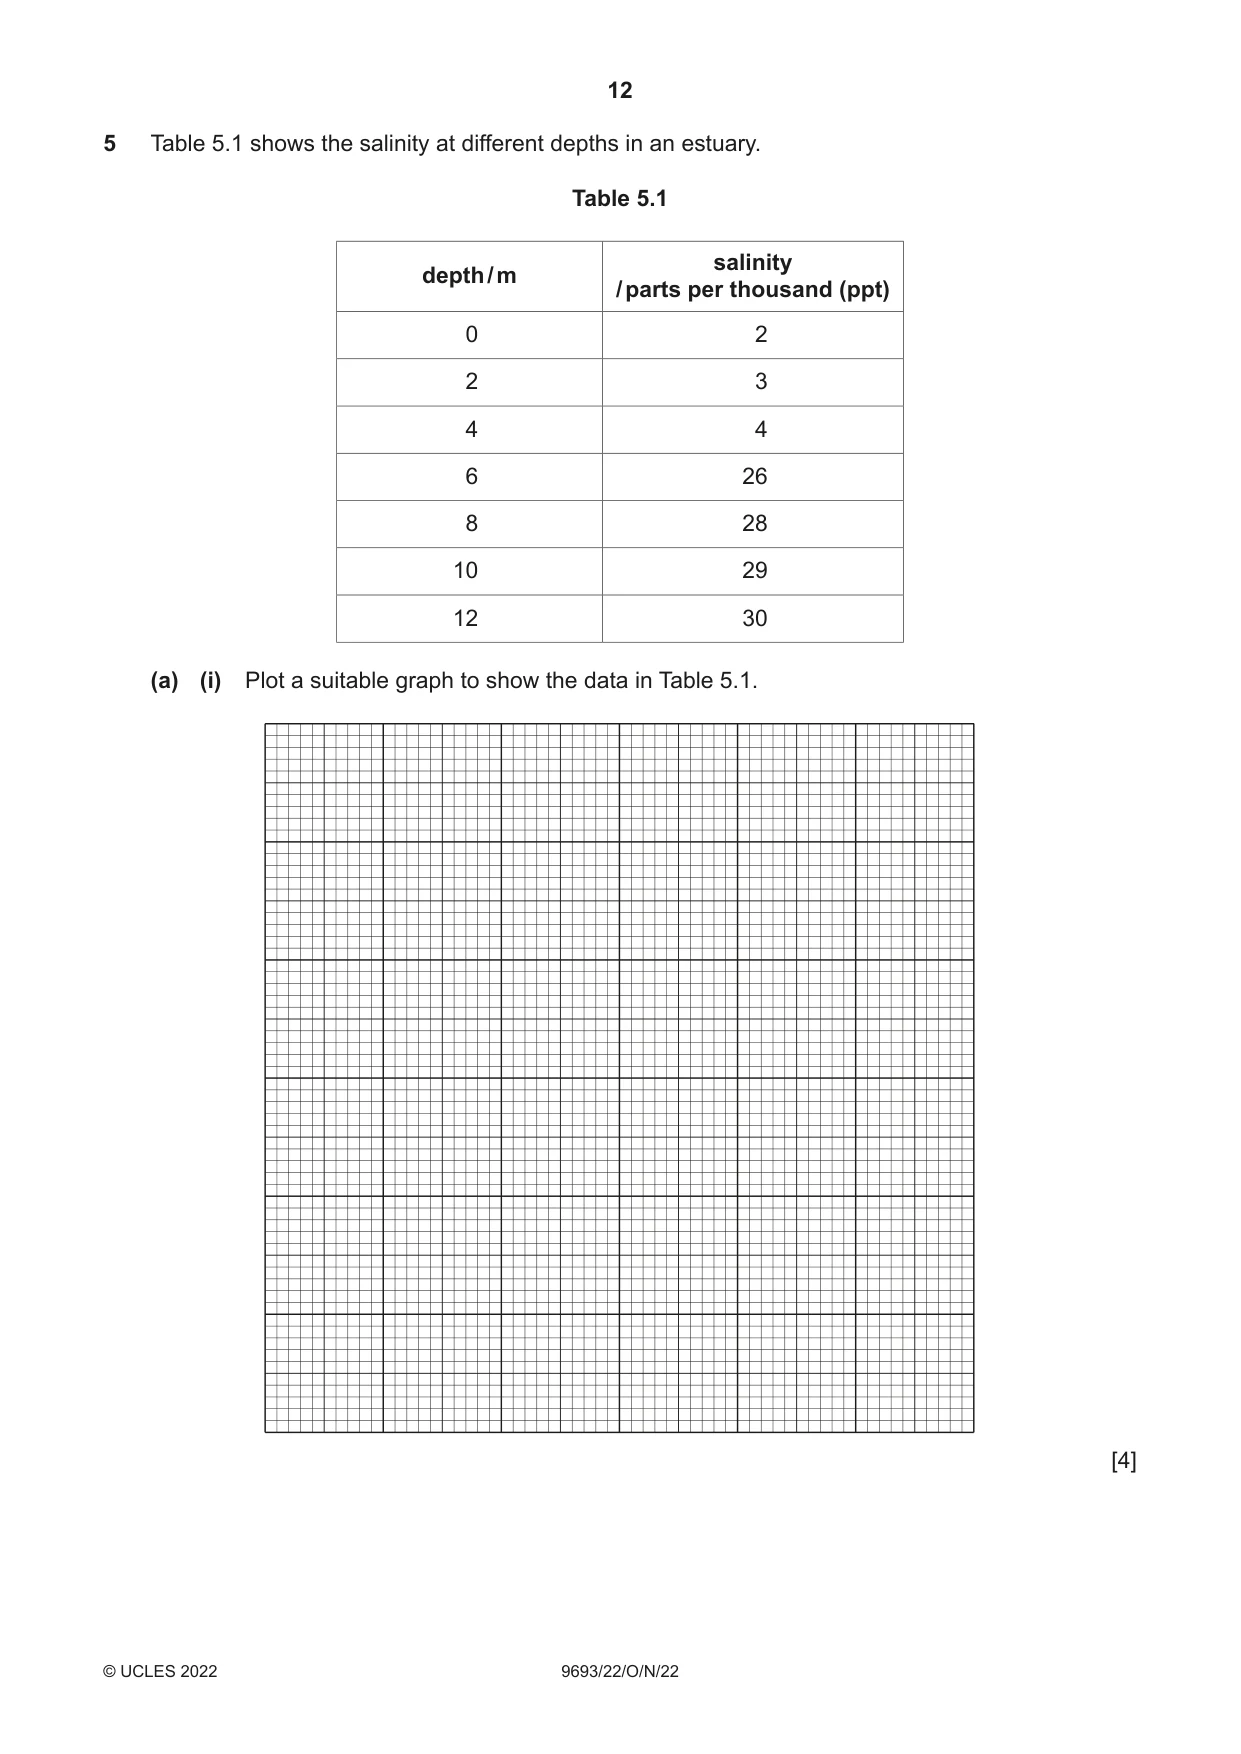
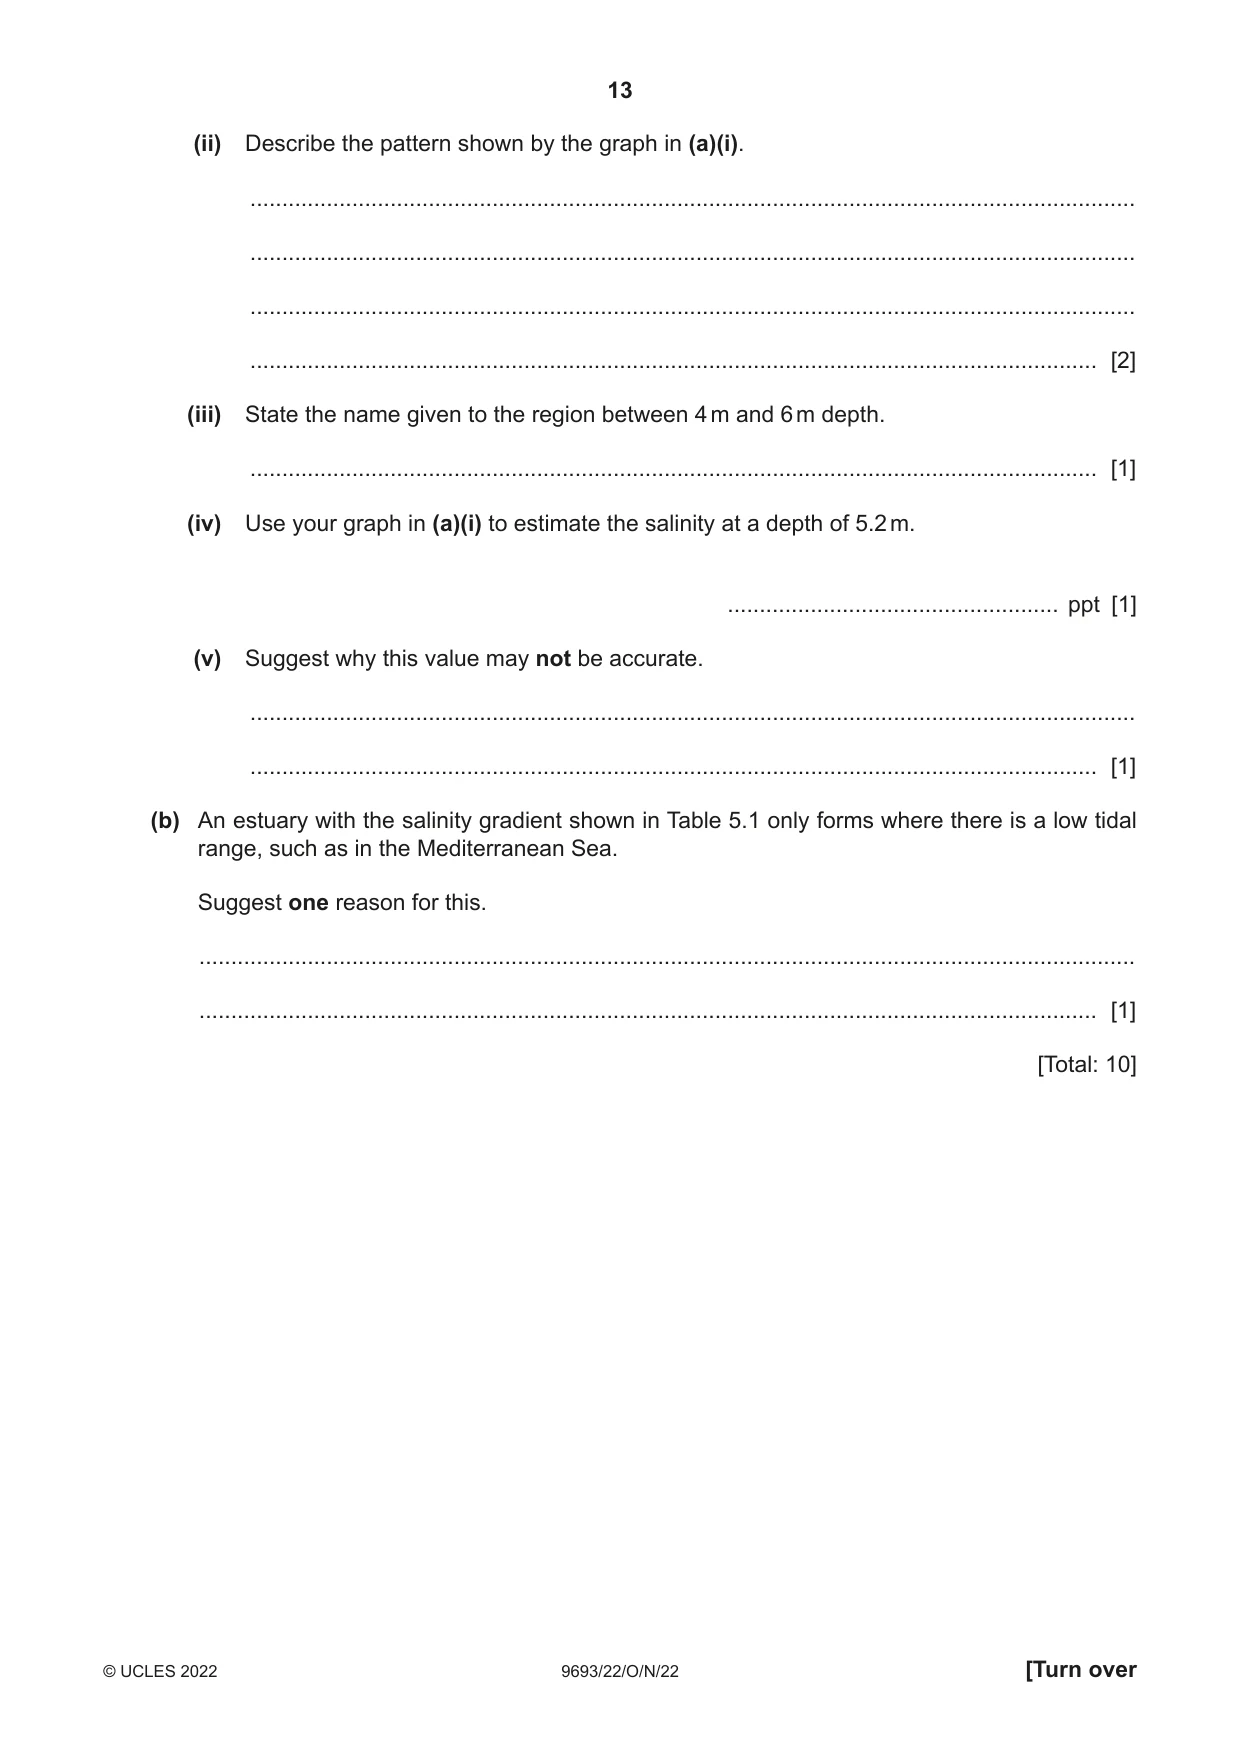
5 Table 5.1 shows the salinity at different depths in an estuary. Table 5.1 salinity depth / m / parts per thousand (ppt) 0 2 2 3 4 4 6 26 8 28 10 29 12 30 (a) (i) Plot a suitable graph to show the data in Table 5.1. [4] (ii) Describe the pattern shown by the graph in (a)(i). ........................................................................................................................................... ........................................................................................................................................... ........................................................................................................................................... ..................................................................................................................................... [2] (iii) State the name given to the region between 4 m and 6 m depth. ..................................................................................................................................... [1] (iv) Use your graph in (a)(i) to estimate the salinity at a depth of 5.2 m. .................................................... ppt [1] (v) Suggest why this value may not be accurate. ........................................................................................................................................... ..................................................................................................................................... [1] (b) An estuary with the salinity gradient shown in Table 5.1 only forms where there is a low tidal range, such as in the Mediterranean Sea. Suggest one reason for this. ................................................................................................................................................... ............................................................................................................................................. [1] [Total: 10]
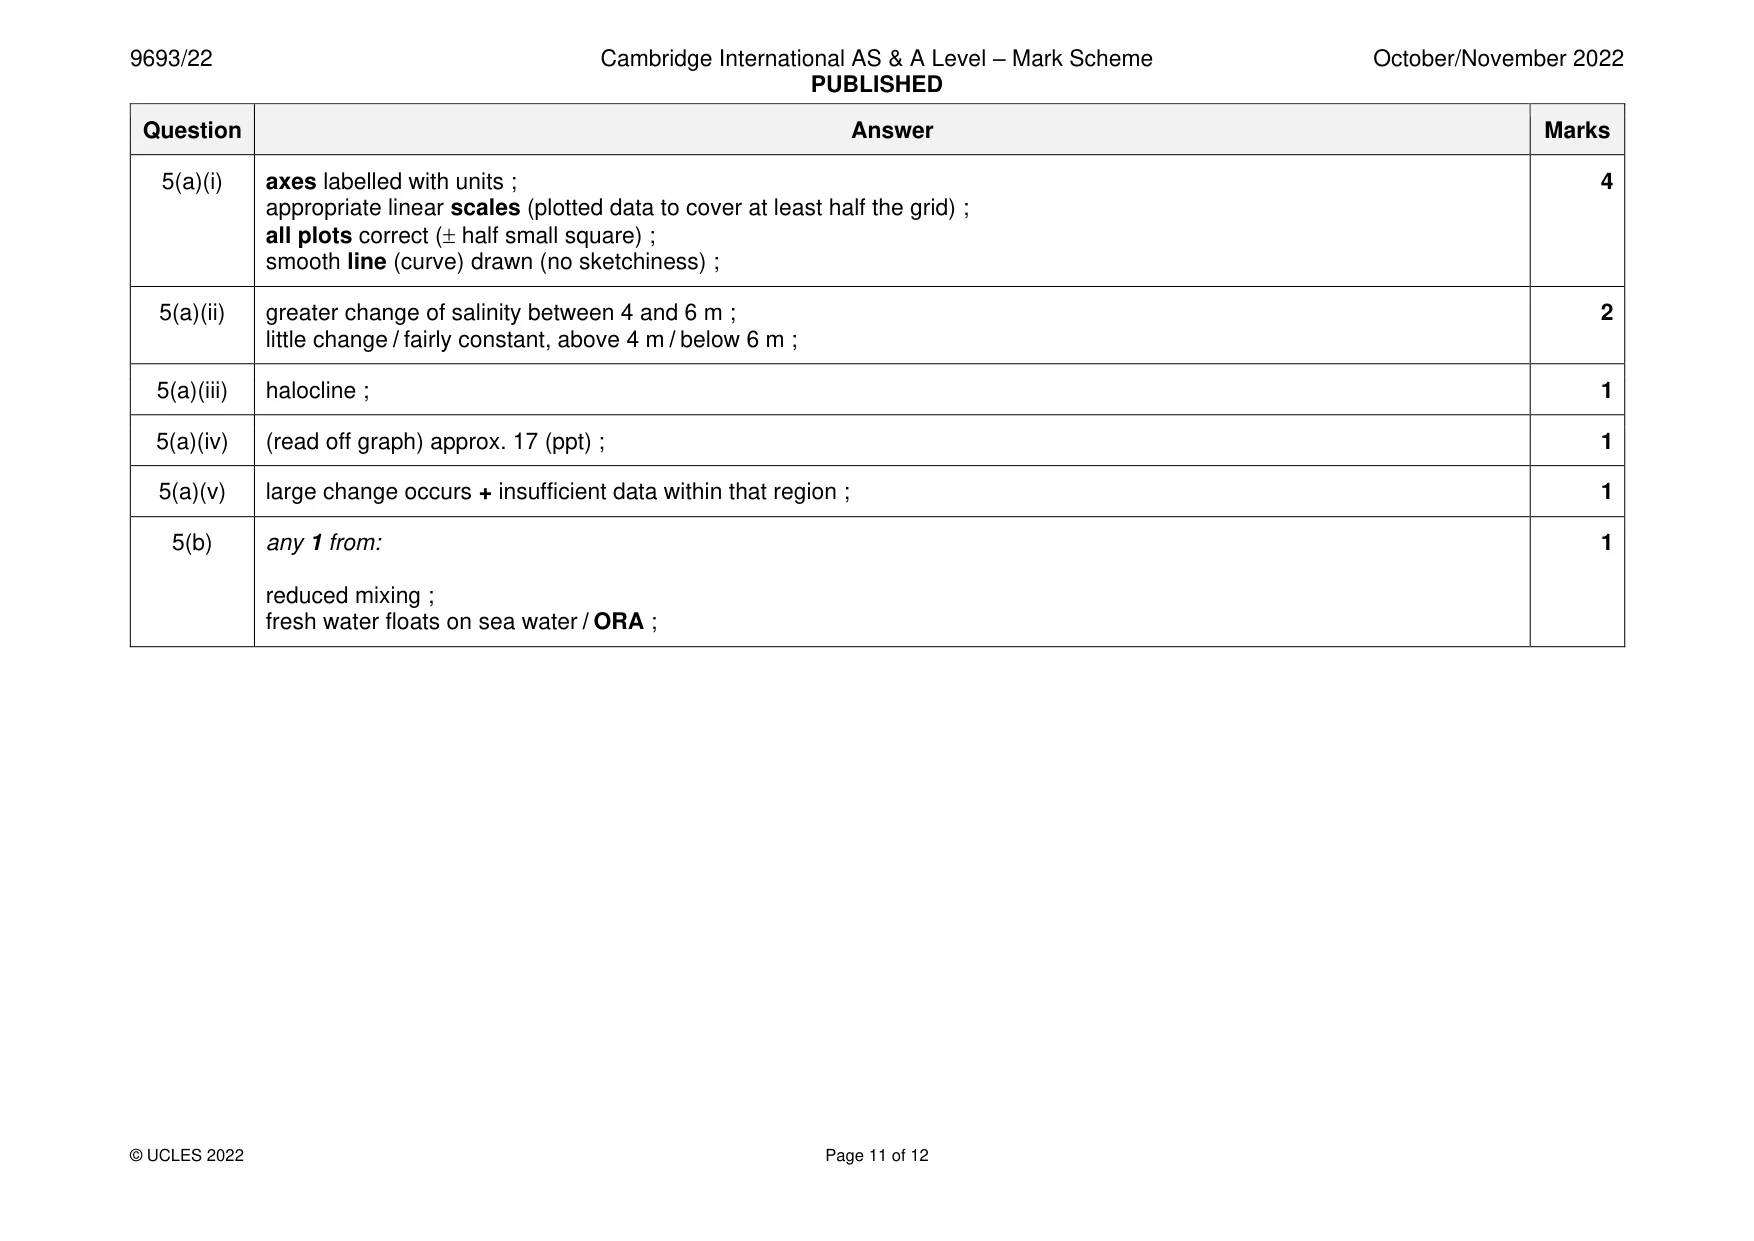
Mark scheme: 5(a)(i) axes labelled with units ; 4 appropriate linear scales (plotted data to cover at least half the grid) ; all plots correct ( half small square) ; smooth line (curve) drawn (no sketchiness) ; 5(a)(ii) greater change of salinity between 4 and 6 m ; 2 little change / fairly constant, above 4 m / below 6 m ; 5(a)(iii) halocline ; 1 5(a)(iv) (read off graph) approx. 17 (ppt) ; 1 5(a)(v) large change occurs + insufficient data within that region ; 1 5(b) any 1 from: 1 reduced mixing ; fresh water floats on sea water / ORA ;
Q6 · A report was made to scientists that an invasive tree species, Nypa fruticans, had become…
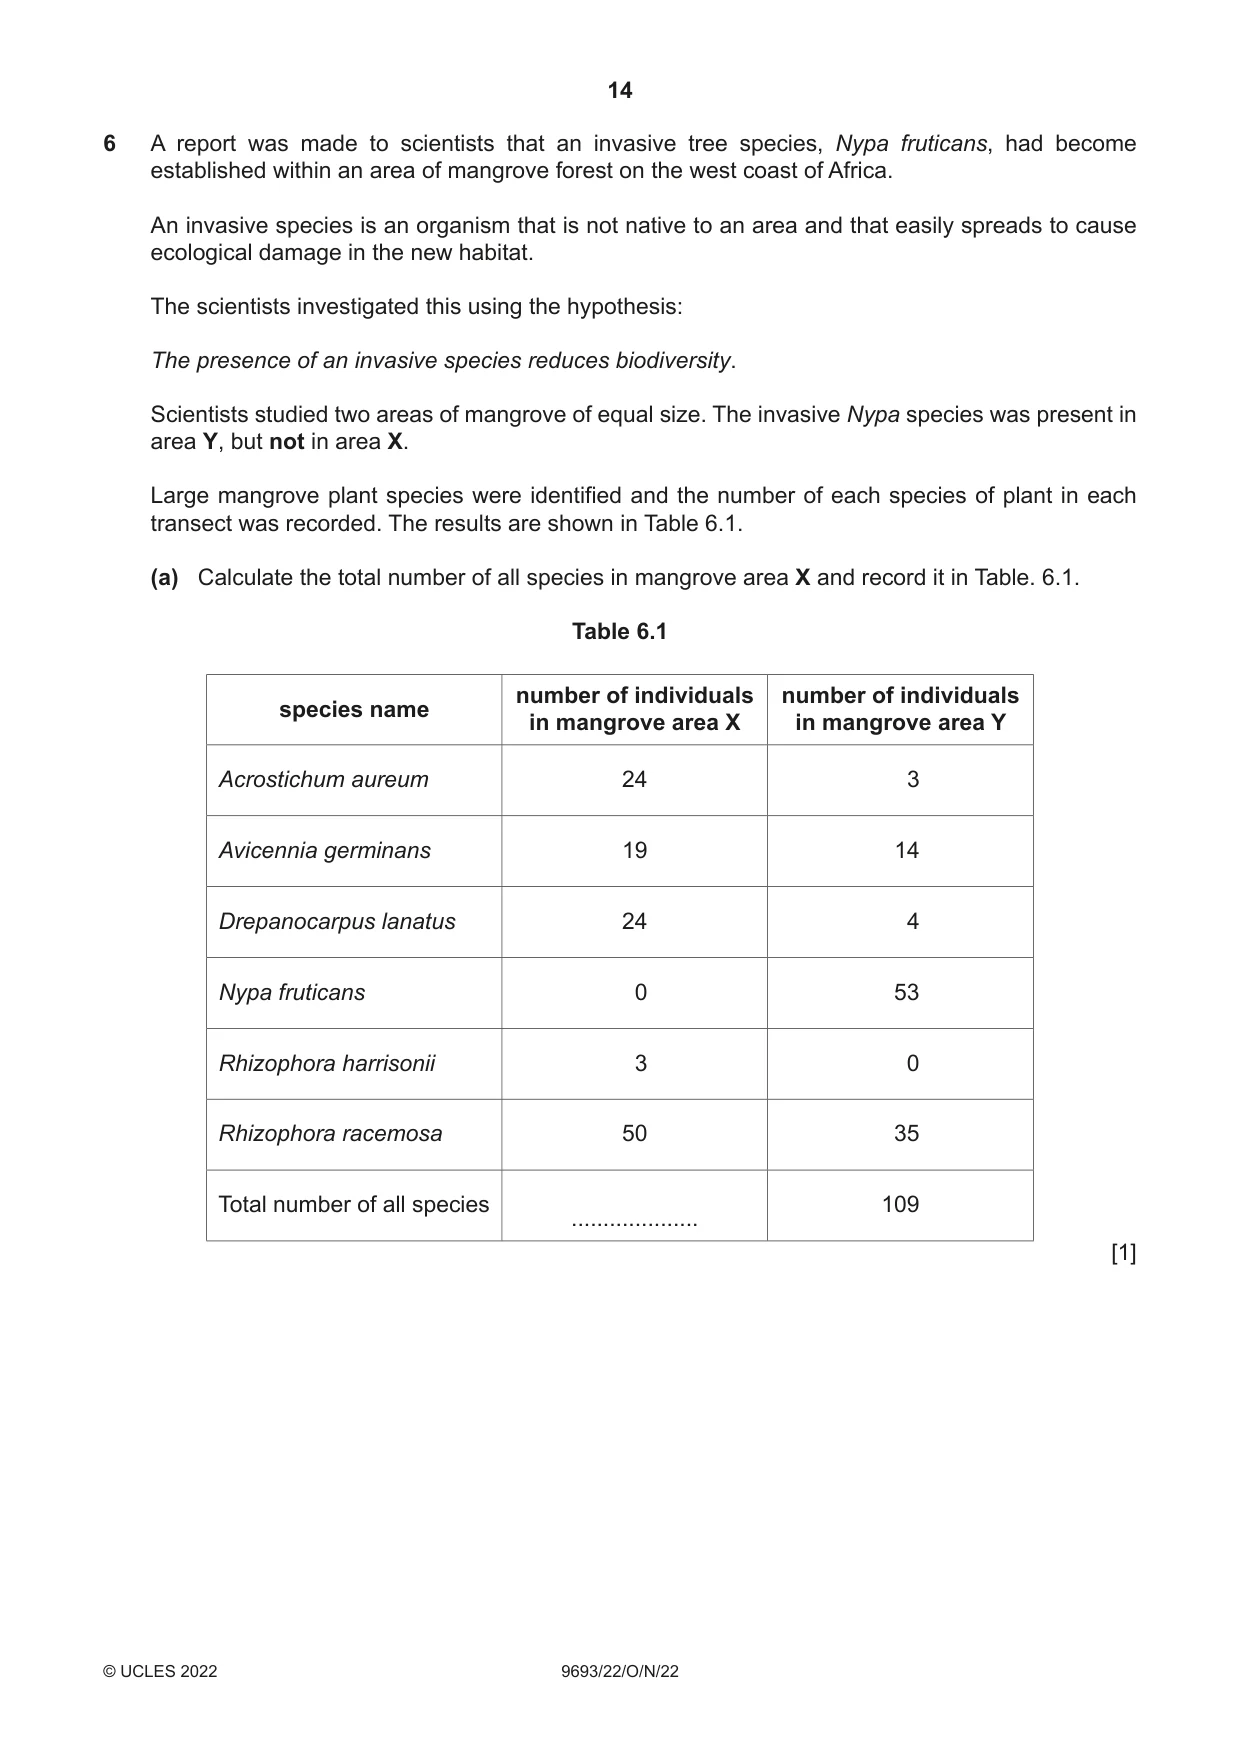
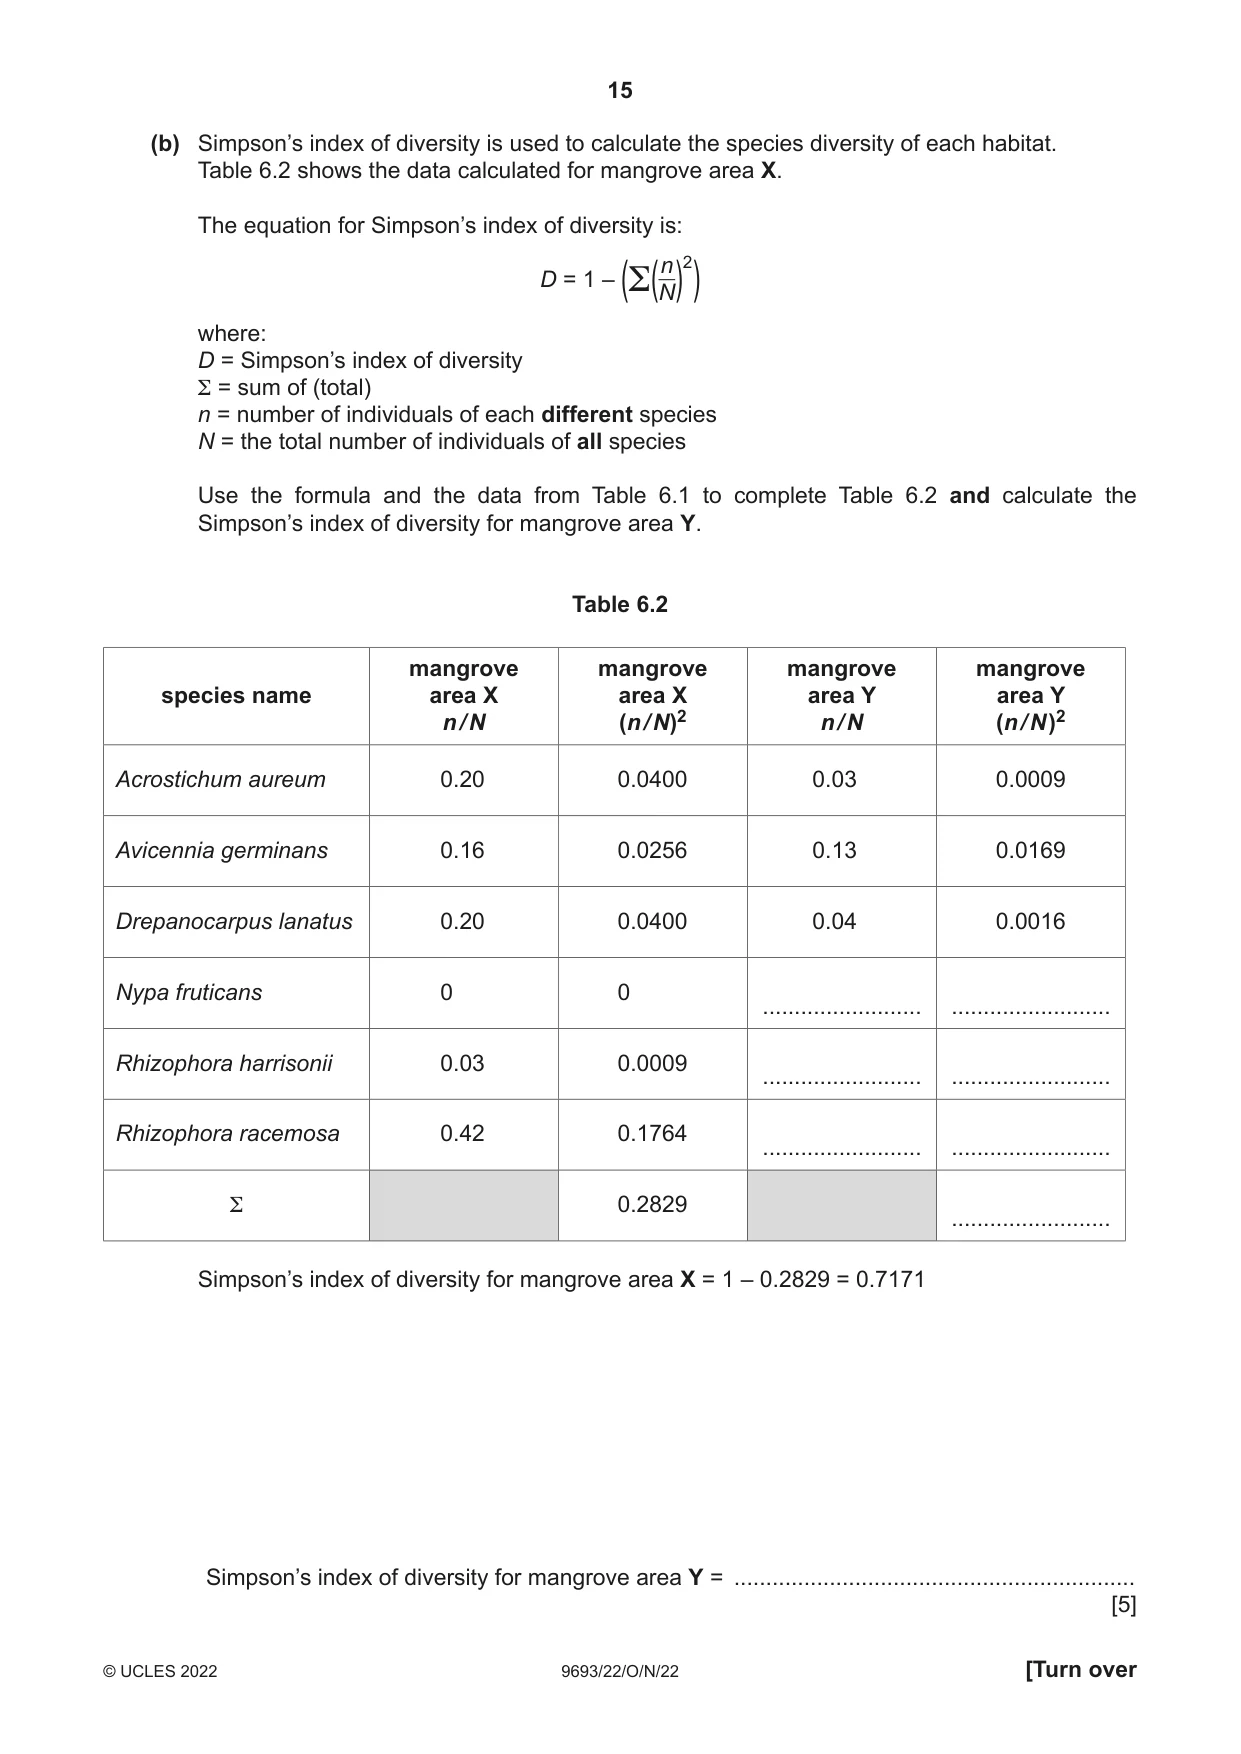
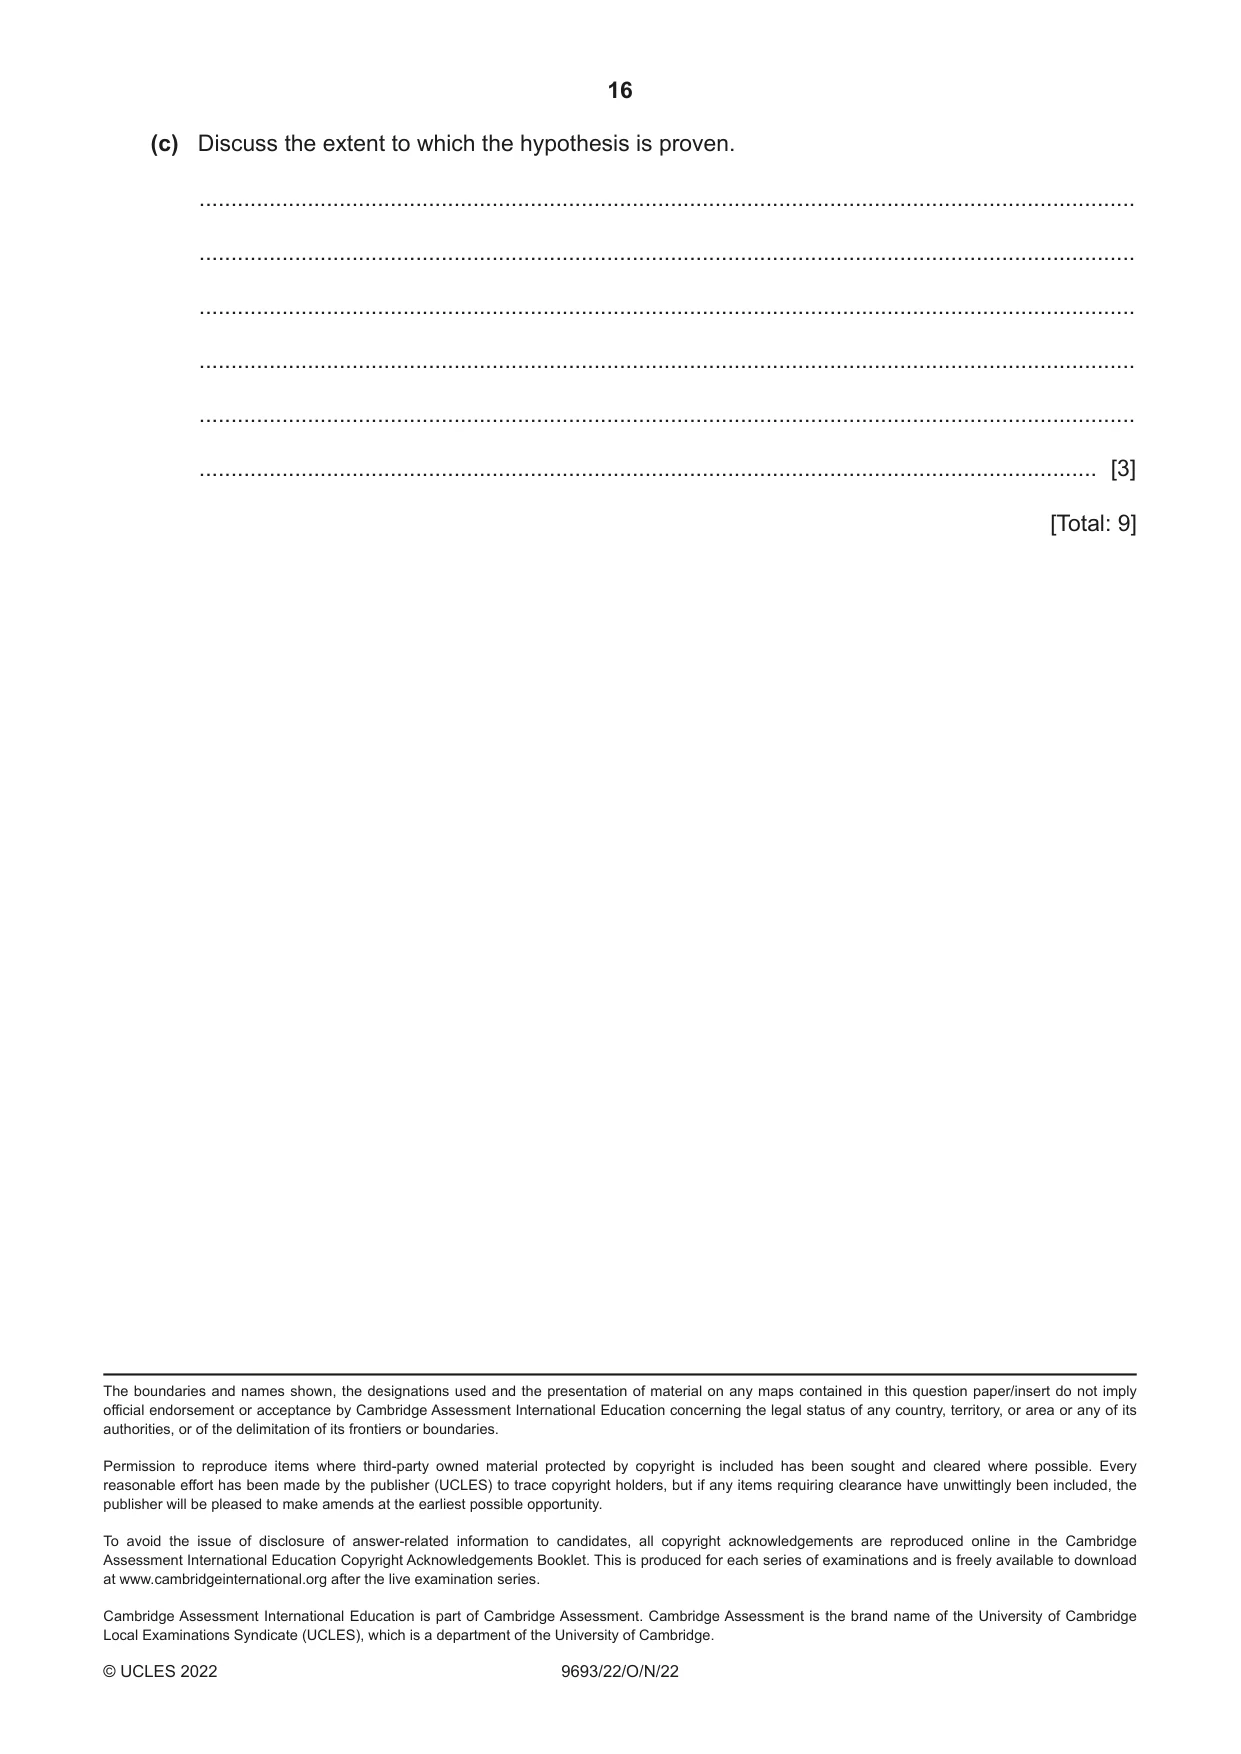
6 A report was made to scientists that an invasive tree species, Nypa fruticans, had become established within an area of mangrove forest on the west coast of Africa. An invasive species is an organism that is not native to an area and that easily spreads to cause ecological damage in the new habitat. The scientists investigated this using the hypothesis: The presence of an invasive species reduces biodiversity. Scientists studied two areas of mangrove of equal size. The invasive Nypa species was present in area Y, but not in area X. Large mangrove plant species were identified and the number of each species of plant in each transect was recorded. The results are shown in Table 6.1. (a) Calculate the total number of all species in mangrove area X and record it in Table. 6.1. Table 6.1 number of individuals number of individuals species name in mangrove area X in mangrove area Y Acrostichum aureum 24 3 Avicennia germinans 19 14 Drepanocarpus lanatus 24 4 Nypa fruticans 0 53 Rhizophora harrisonii 3 0 Rhizophora racemosa 50 35 Total number of all species 109 .................... [1] (b) Simpson’s index of diversity is used to calculate the species diversity of each habitat. Table 6.2 shows the data calculated for mangrove area X. The equation for Simpson’s index of diversity is: n D = 1 – (Σ( N) 2) where: D = Simpson’s index of diversity Σ = sum of (total) n = number of individuals of each different species N = the total number of individuals of all species Use the formula and the data from Table 6.1 to complete Table 6.2 and calculate the Simpson’s index of diversity for mangrove area Y. Table 6.2 mangrove mangrove mangrove mangrove species name area X area X area Y area Y n / N (n / N)2 n / N (n / N )2 Acrostichum aureum 0.20 0.0400 0.03 0.0009 Avicennia germinans 0.16 0.0256 0.13 0.0169 Drepanocarpus lanatus 0.20 0.0400 0.04 0.0016 Nypa fruticans 0 0 ......................... ......................... Rhizophora harrisonii 0.03 0.0009 ......................... ......................... Rhizophora racemosa 0.42 0.1764 ......................... ......................... Σ 0.2829 ......................... Simpson’s index of diversity for mangrove area X = 1 – 0.2829 = 0.7171 Simpson’s index of diversity for mangrove area Y = ............................................................... [5] (c) Discuss the extent to which the hypothesis is proven. ................................................................................................................................................... ................................................................................................................................................... ................................................................................................................................................... ................................................................................................................................................... ................................................................................................................................................... ............................................................................................................................................. [3] [Total: 9] The boundaries and names shown, the designations used and the presentation of material on any maps contained in this question paper/insert do not imply official endorsement or acceptance by Cambridge Assessment International Education concerning the legal status of any country, territory, or area or any of its authorities, or of the delimitation of its frontiers or boundaries.
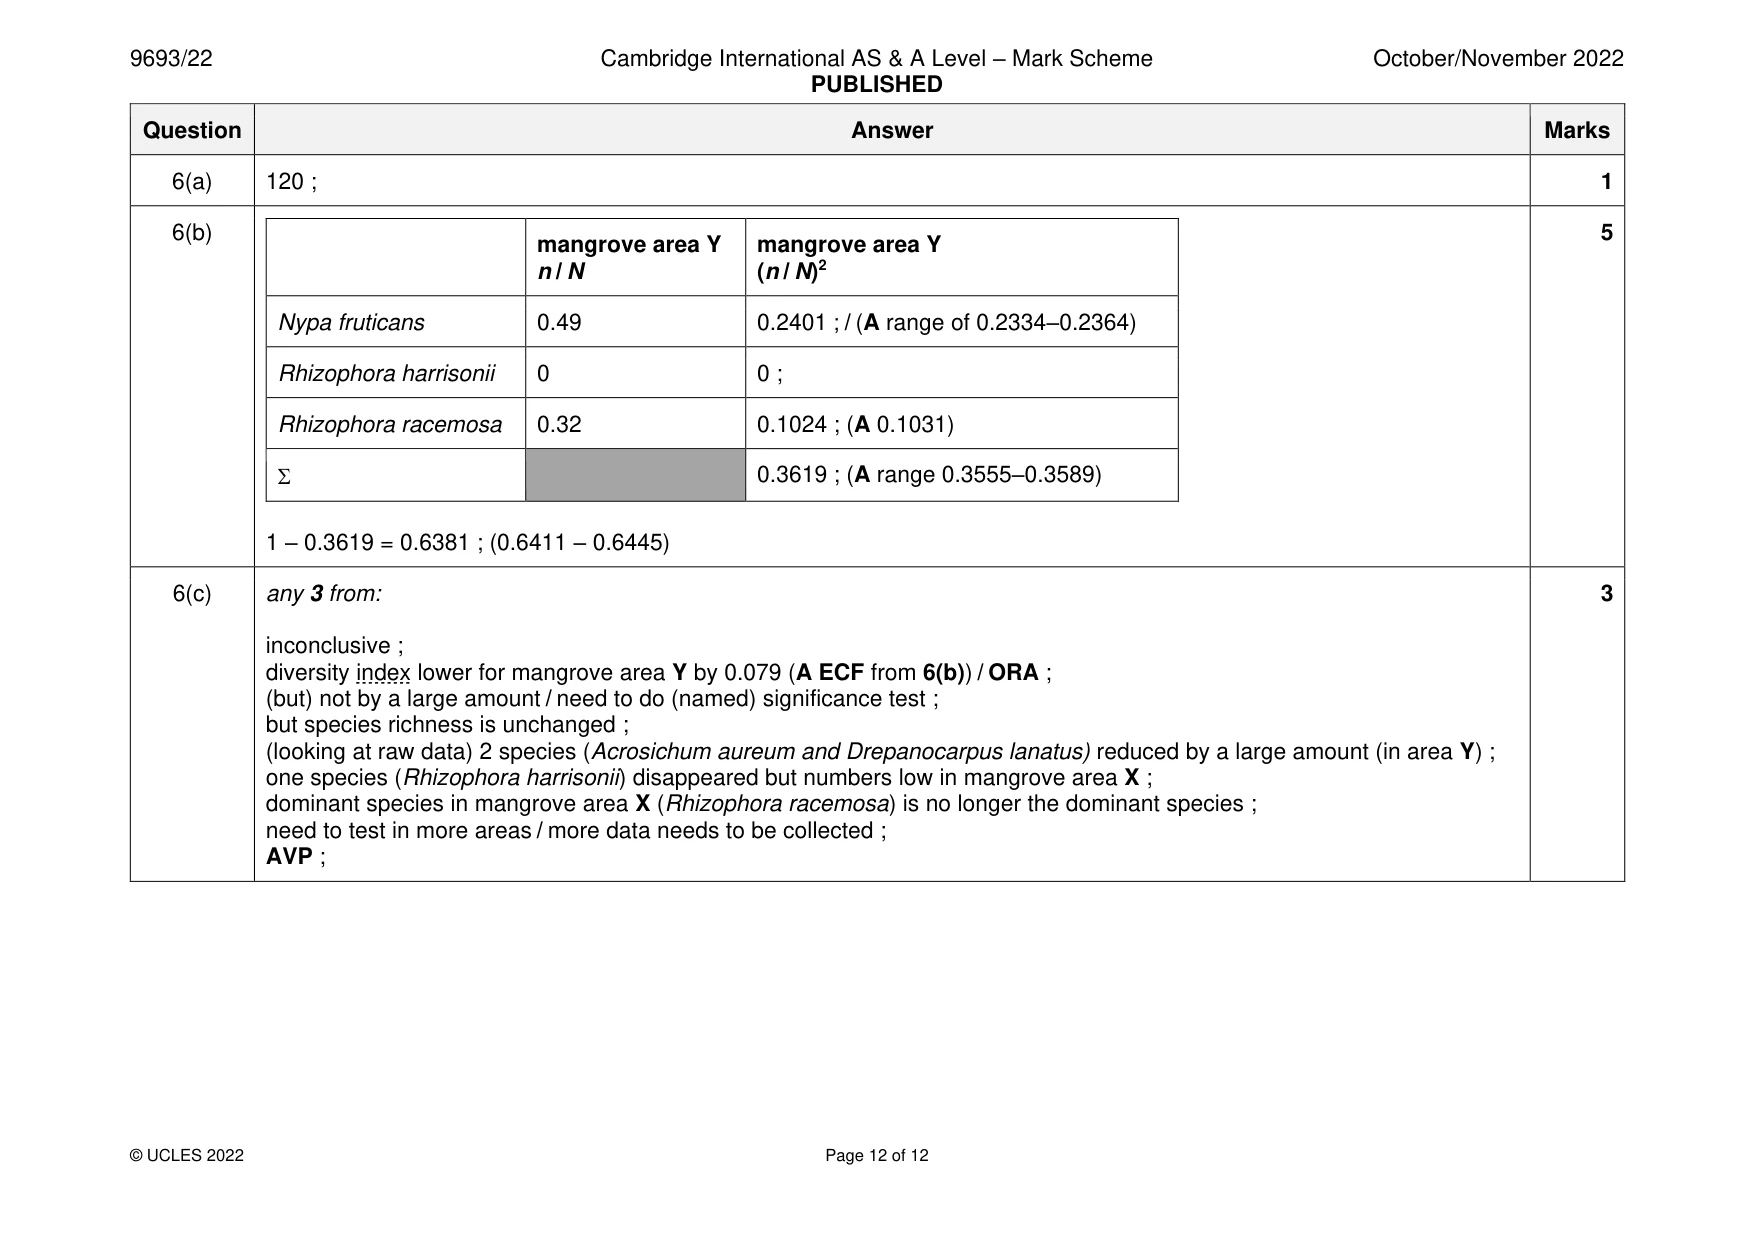
Mark scheme: 6(a) 120 ; 1 6(b) 5 mangrove area Y mangrove area Y n / N (n / N)2 Nypa fruticans 0.49 0.2401 ; / (A range of 0.2334–0.2364) Rhizophora harrisonii 0 0 ; Rhizophora racemosa 0.32 0.1024 ; (A 0.1031) 0.3619 ; (A range 0.3555–0.3589) 1 – 0.3619 = 0.6381 ; (0.6411 – 0.6445) 6(c) any 3 from: 3 inconclusive ; diversity index lower for mangrove area Y by 0.079 (A ECF from 6(b)) / ORA ; (but) not by a large amount / need to do (named) significance test ; but species richness is unchanged ; (looking at raw data) 2 species (Acrosichum aureum and Drepanocarpus lanatus) reduced by a large amount (in area Y) ; one species (Rhizophora harrisonii) disappeared but numbers low in mangrove area X ; dominant species in mangrove area X (Rhizophora racemosa) is no longer the dominant species ; need to test in more areas / more data needs to be collected ; AVP ;
What was in this paper
The subtopics covered by these 6 questions, and how many questions each got. Open one in a new tab to see every Cambridge question on it.
What you needed in this session
Cambridge’s own grade thresholds for 2022 Oct/Nov, Paper 2 · Variant 2. A higher threshold means an easier paper — the bar moves with how the cohort did.