Cambridge A Level Marine Science 9693 — 2025 Oct/Nov Paper 2 · Variant 3
9693/23/O/N/25 · 5 questions · 75 marks · 105 min
The question paper and its mark scheme, free to read here and free to download. This is Cambridge’s own paper, exactly as it was sat.
Question paper24 pages







Mark scheme17 pages
Answers below. Sit the paper first if you are practising.
Questions as text
Q1 · A species of starfish
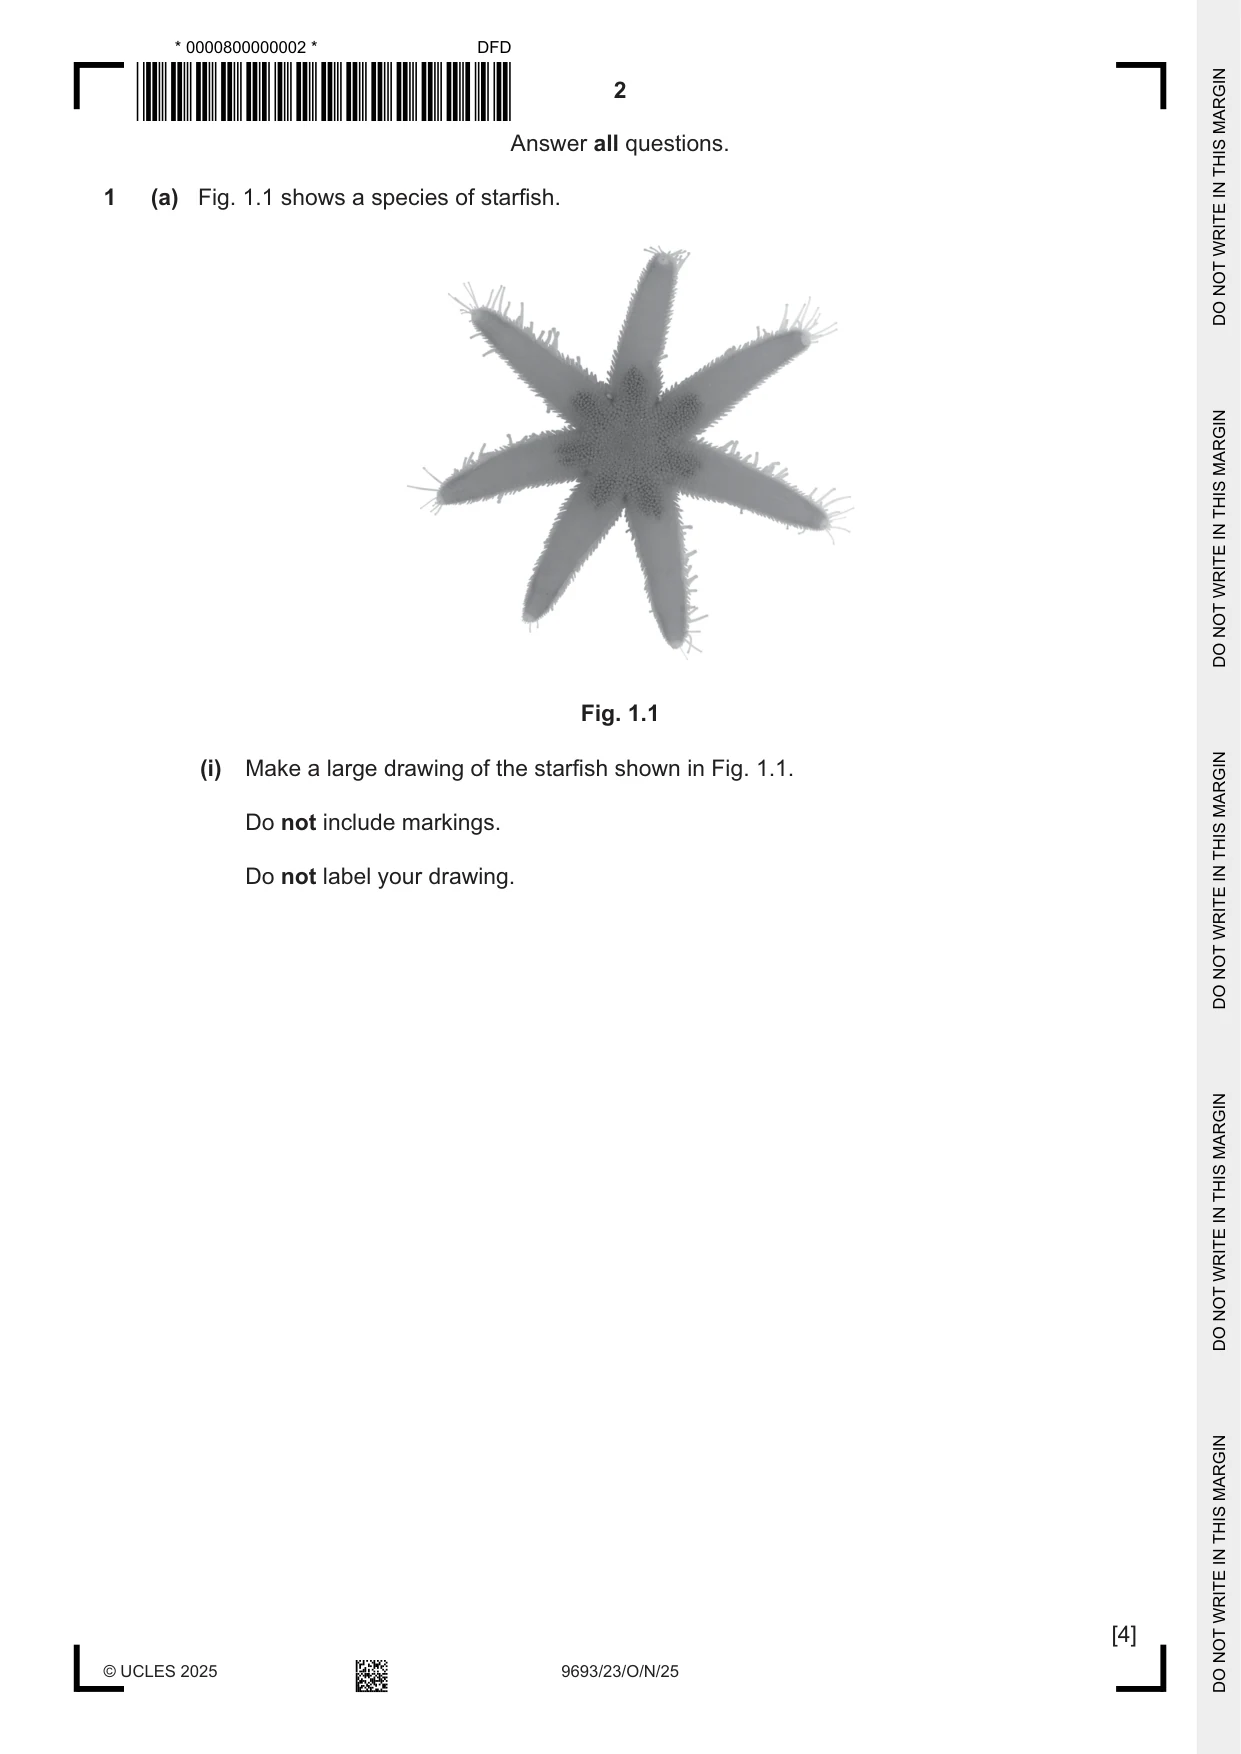
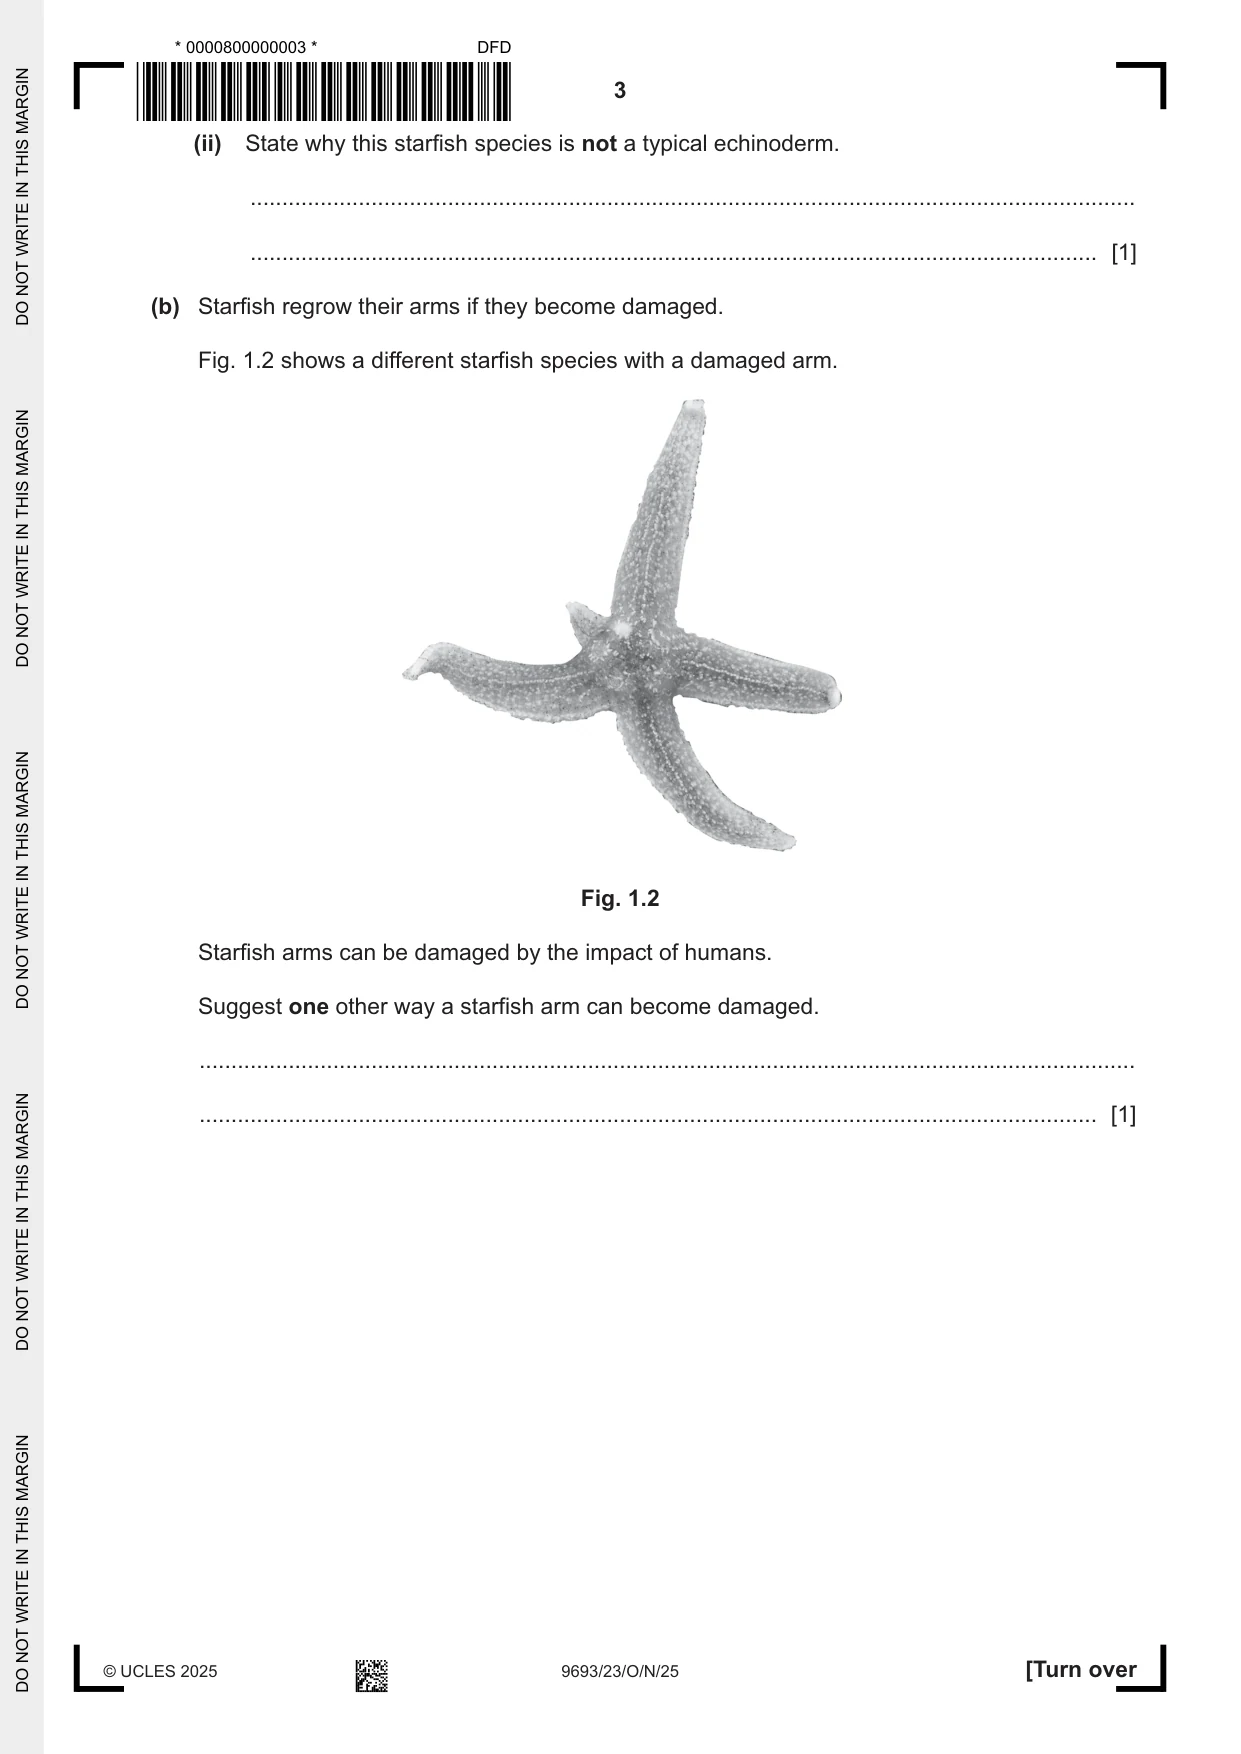
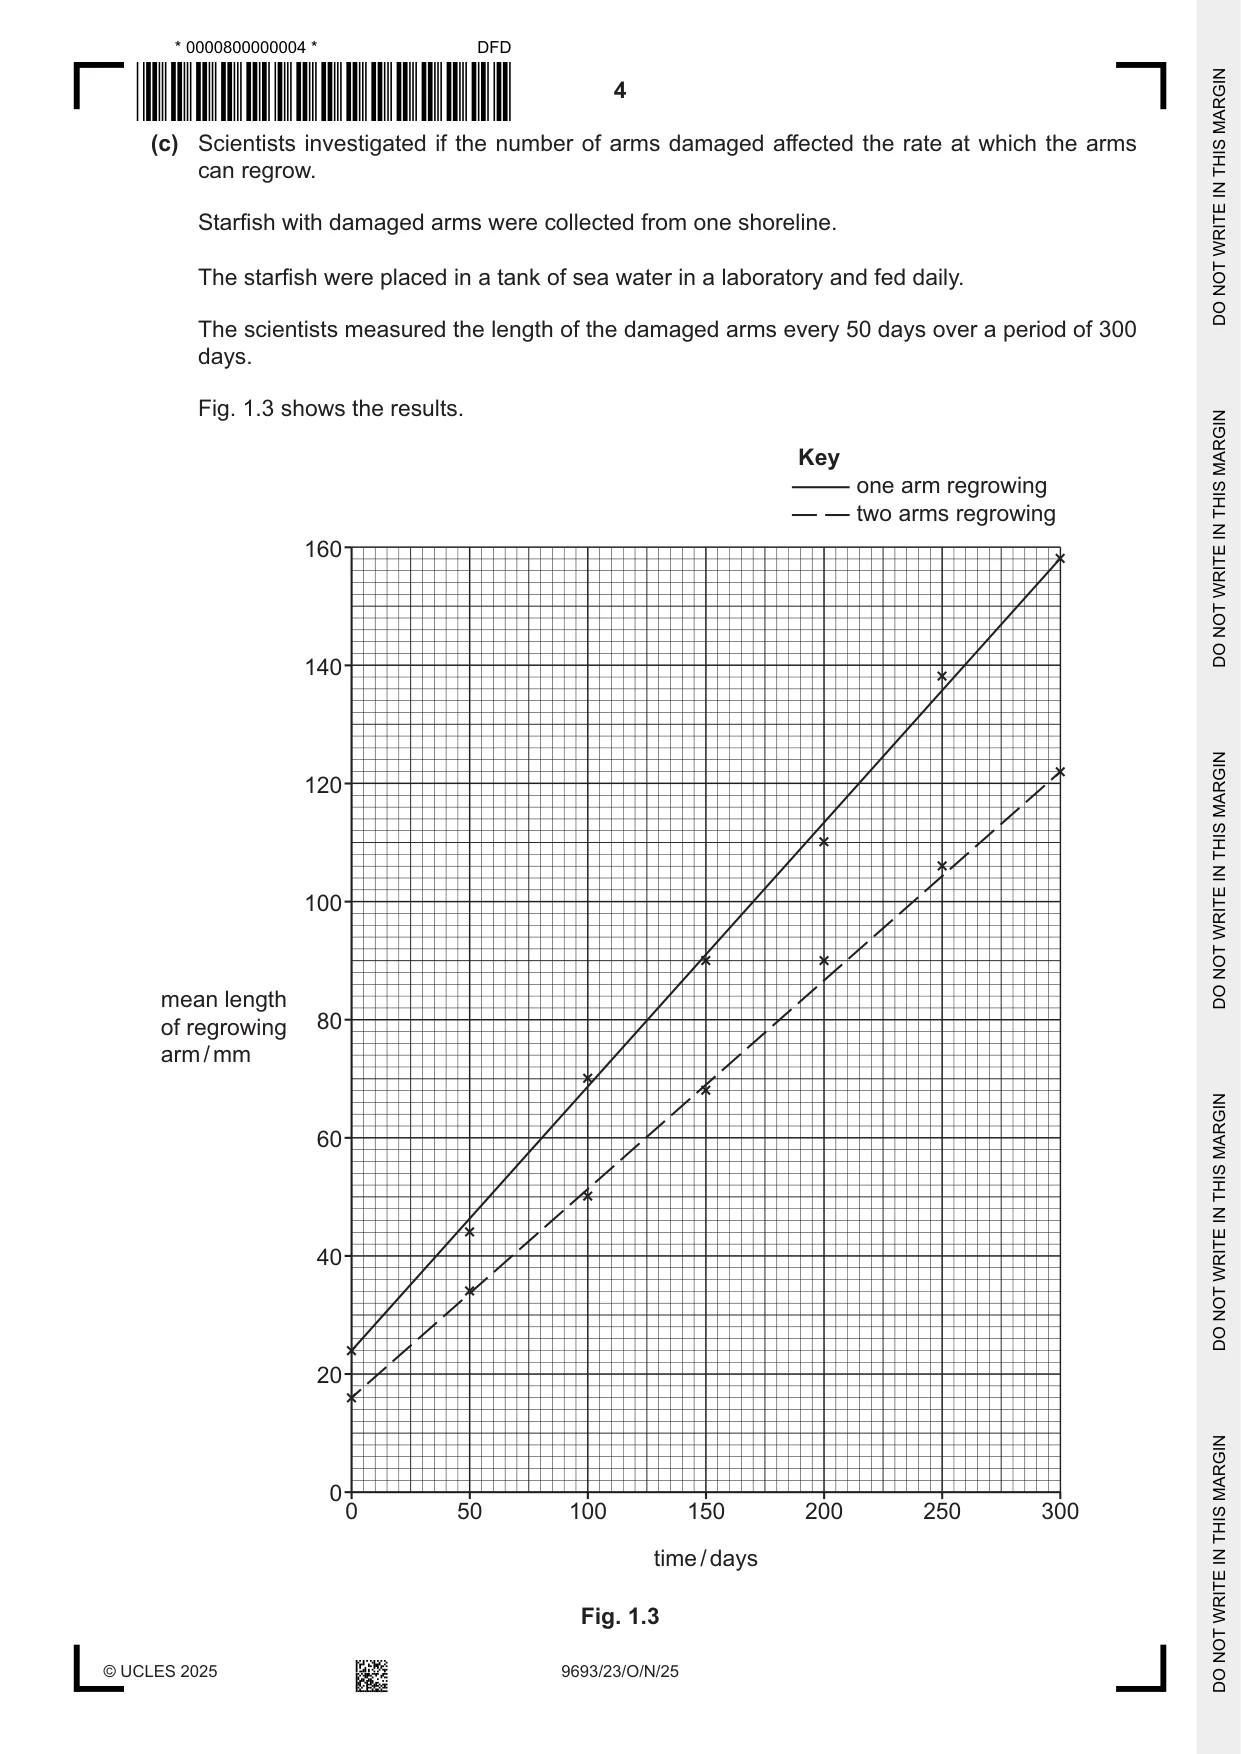
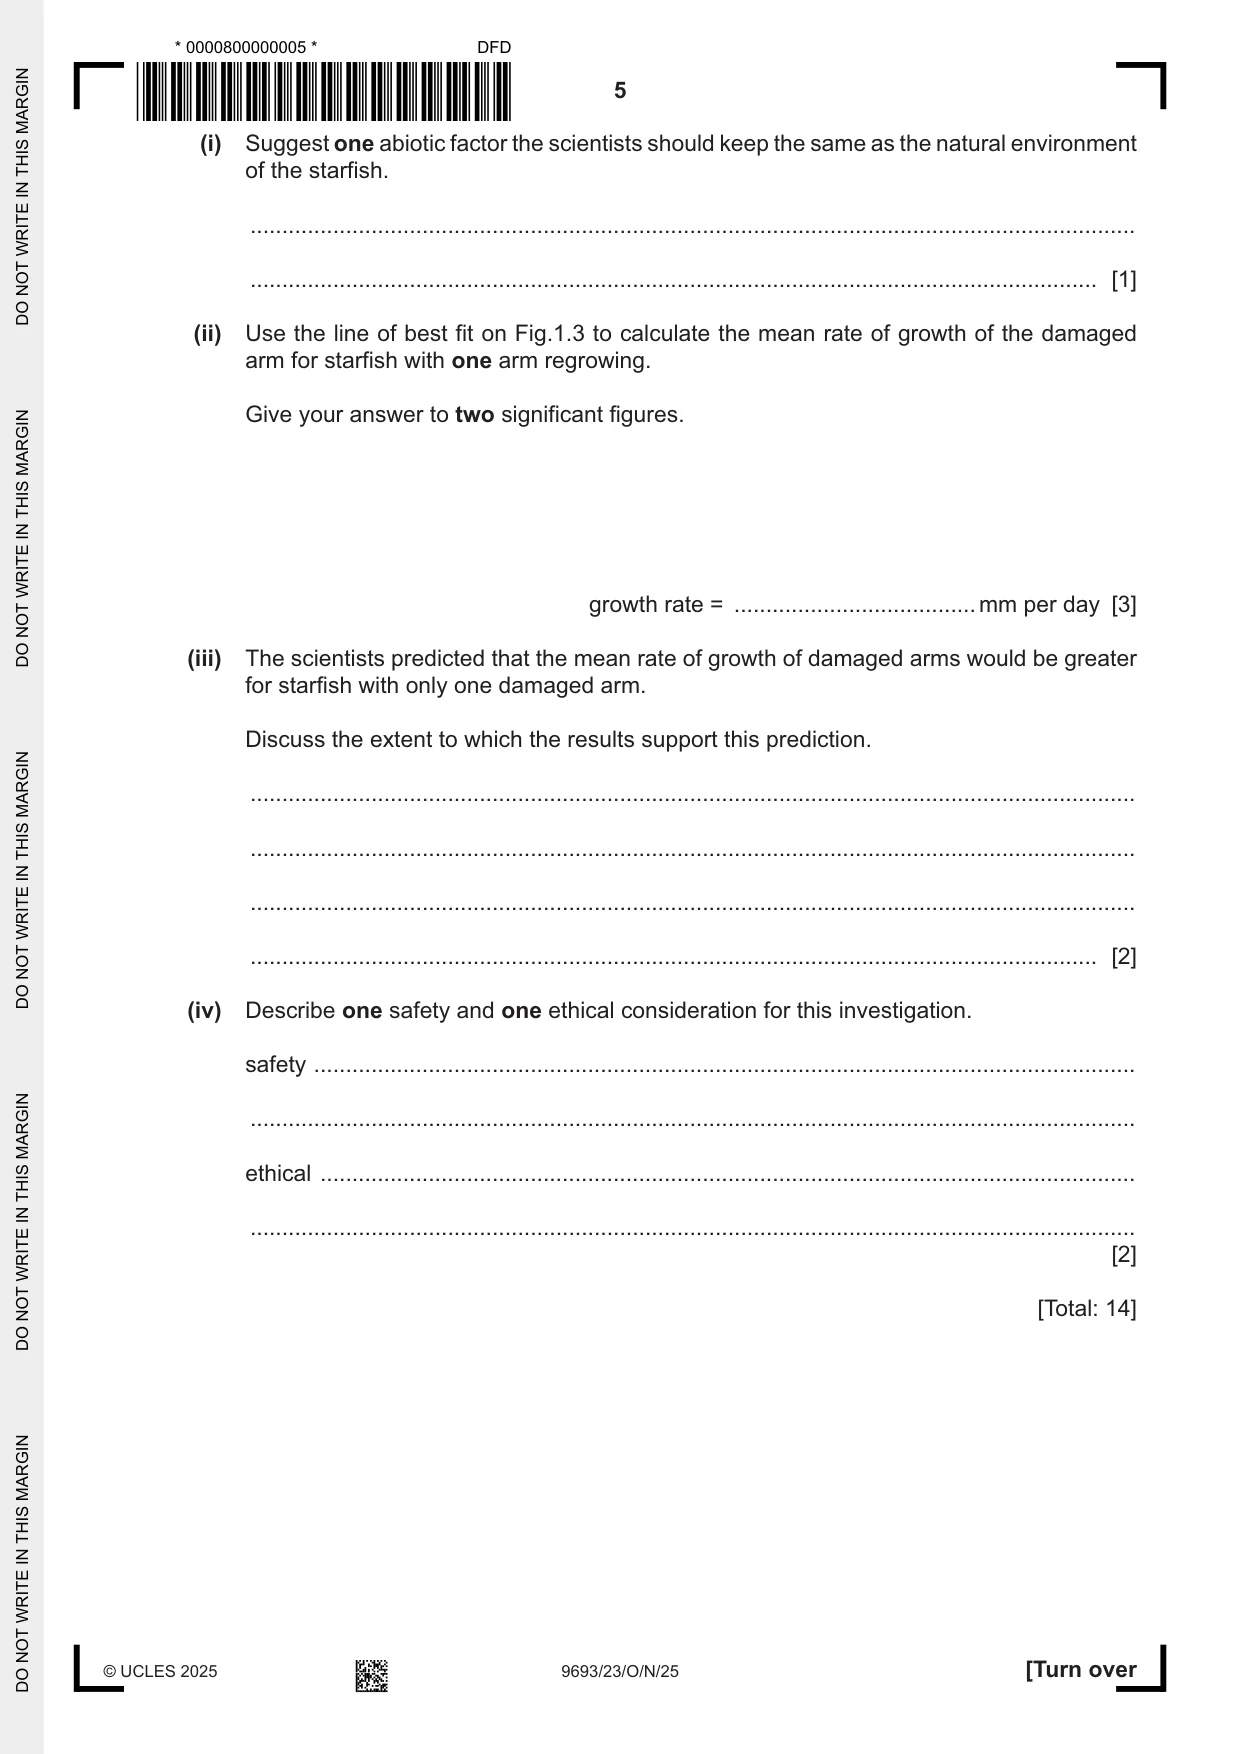
1 (a) Fig. 1.1 shows a species of starfish. Fig. 1.1 (i) Make a large drawing of the starfish shown in Fig. 1.1. Do not include markings. Do not label your drawing. [4] (ii) State why this starfish species is not a typical echinoderm. ........................................................................................................................................... ..................................................................................................................................... [1] (b) Starfish regrow their arms if they become damaged. Fig. 1.2 shows a different starfish species with a damaged arm. Fig. 1.2 Starfish arms can be damaged by the impact of humans. Suggest one other way a starfish arm can become damaged. ................................................................................................................................................... ............................................................................................................................................. [1] (c) Scientists investigated if the number of arms damaged affected the rate at which the arms can regrow. Starfish with damaged arms were collected from one shoreline. The starfish were placed in a tank of sea water in a laboratory and fed daily. The scientists measured the length of the damaged arms every 50 days over a period of 300 days. Fig. 1.3 shows the results. Key one arm regrowing two arms regrowing 160 140 120 100 mean length of regrowing 80 arm / mm 60 40 20 0 0 50 100 150 200 250 300 time / days Fig. 1.3 (i) Suggest one abiotic factor the scientists should keep the same as the natural environment of the starfish. ........................................................................................................................................... ..................................................................................................................................... [1] (ii) Use the line of best fit on Fig.1.3 to calculate the mean rate of growth of the damaged arm for starfish with one arm regrowing. Give your answer to two significant figures. growth rate = ...................................... mm per day [3] (iii) The scientists predicted that the mean rate of growth of damaged arms would be greater for starfish with only one damaged arm. Discuss the extent to which the results support this prediction. ........................................................................................................................................... ........................................................................................................................................... ........................................................................................................................................... ..................................................................................................................................... [2] (iv) Describe one safety and one ethical consideration for this investigation. safety ................................................................................................................................. ........................................................................................................................................... ethical ................................................................................................................................ ........................................................................................................................................... [2] [Total: 14]
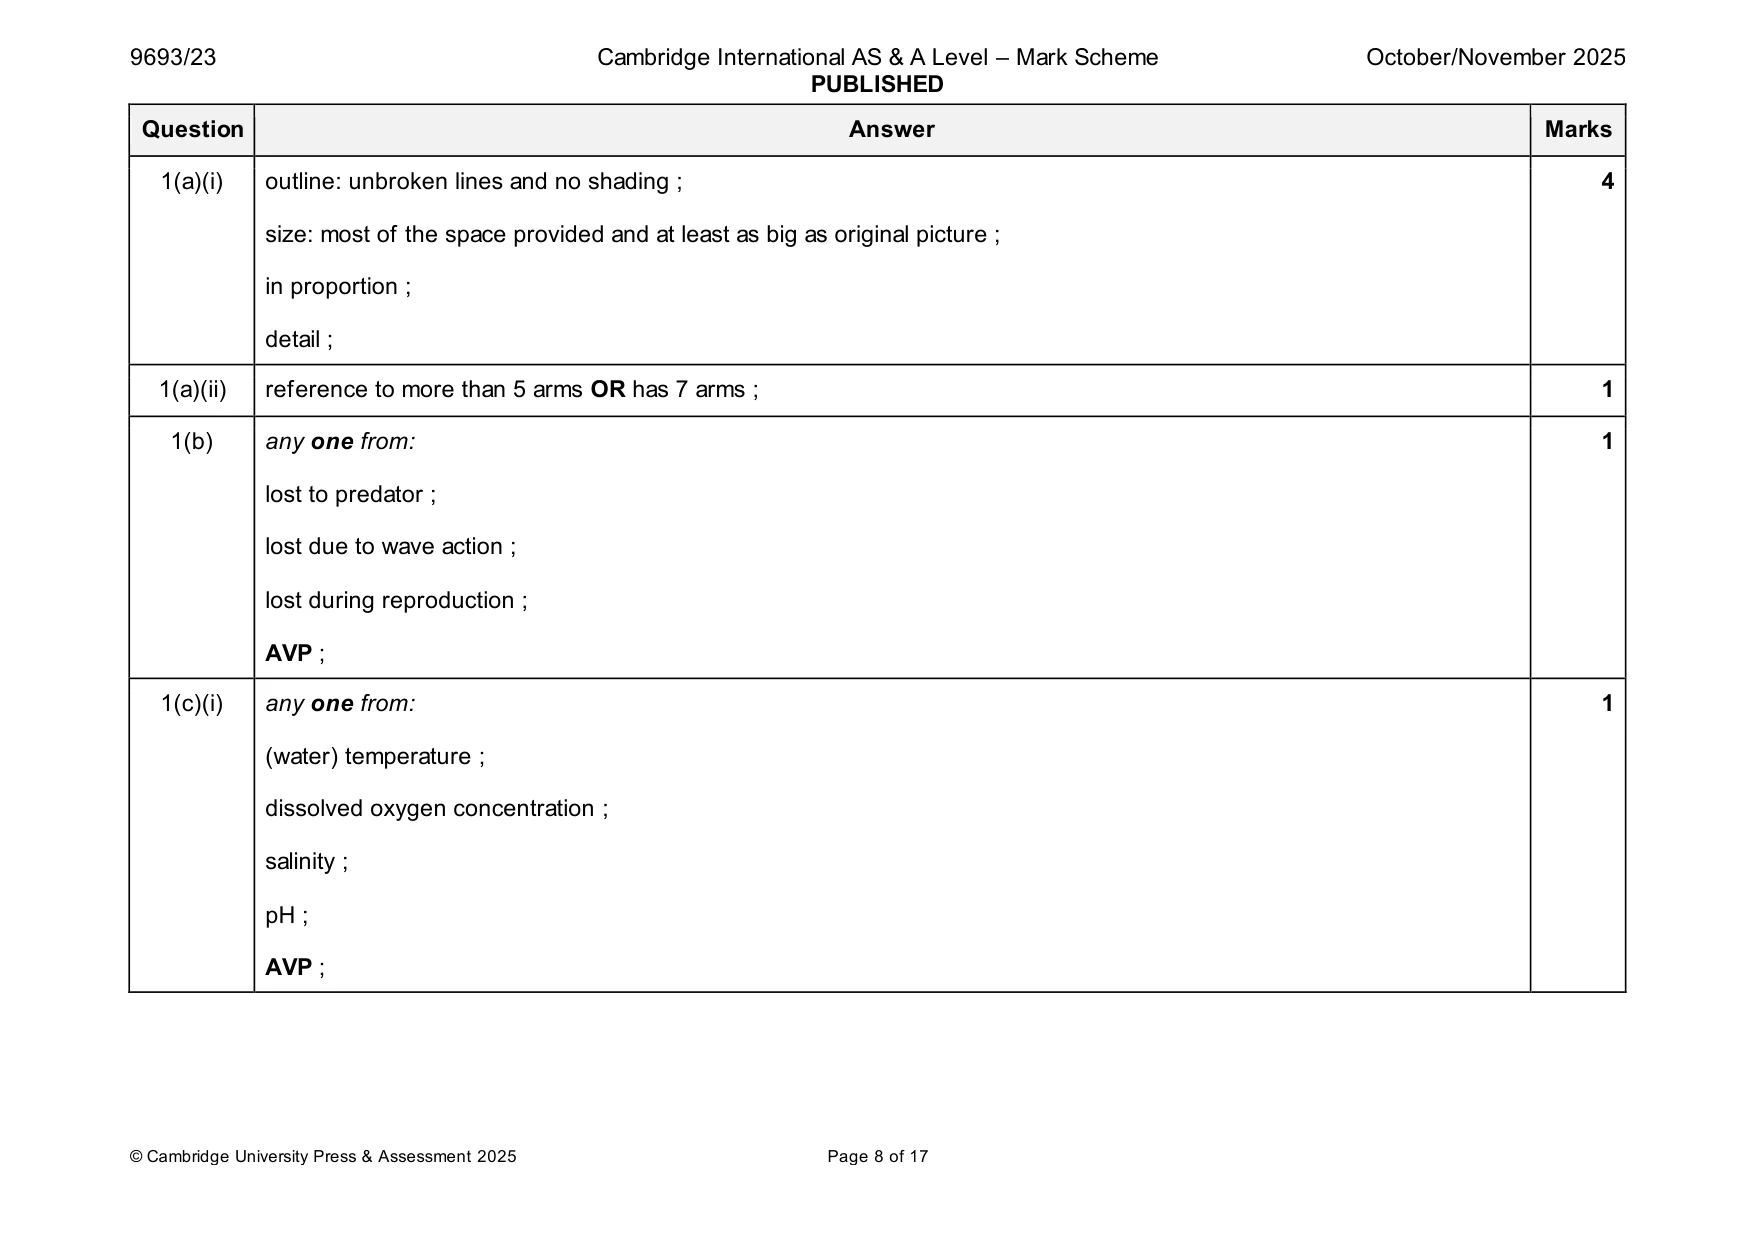
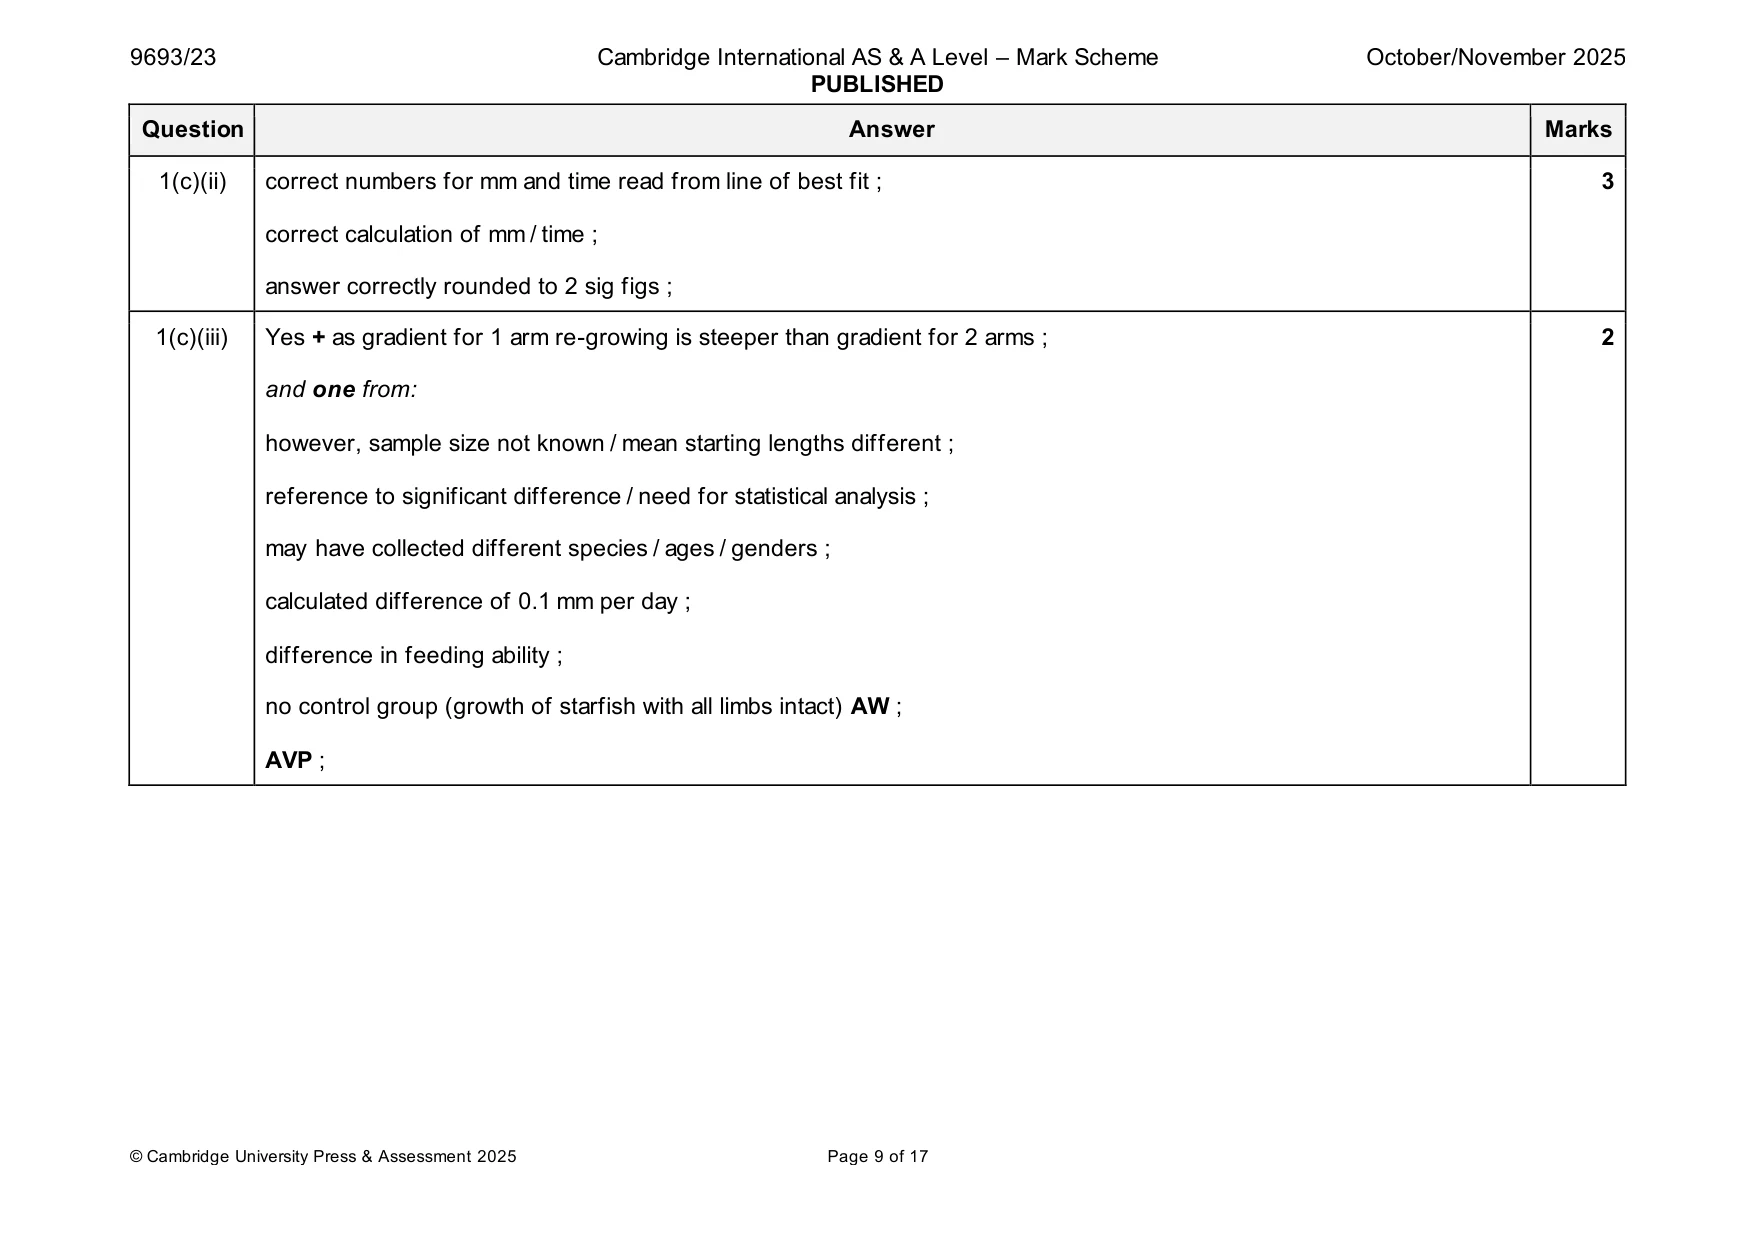
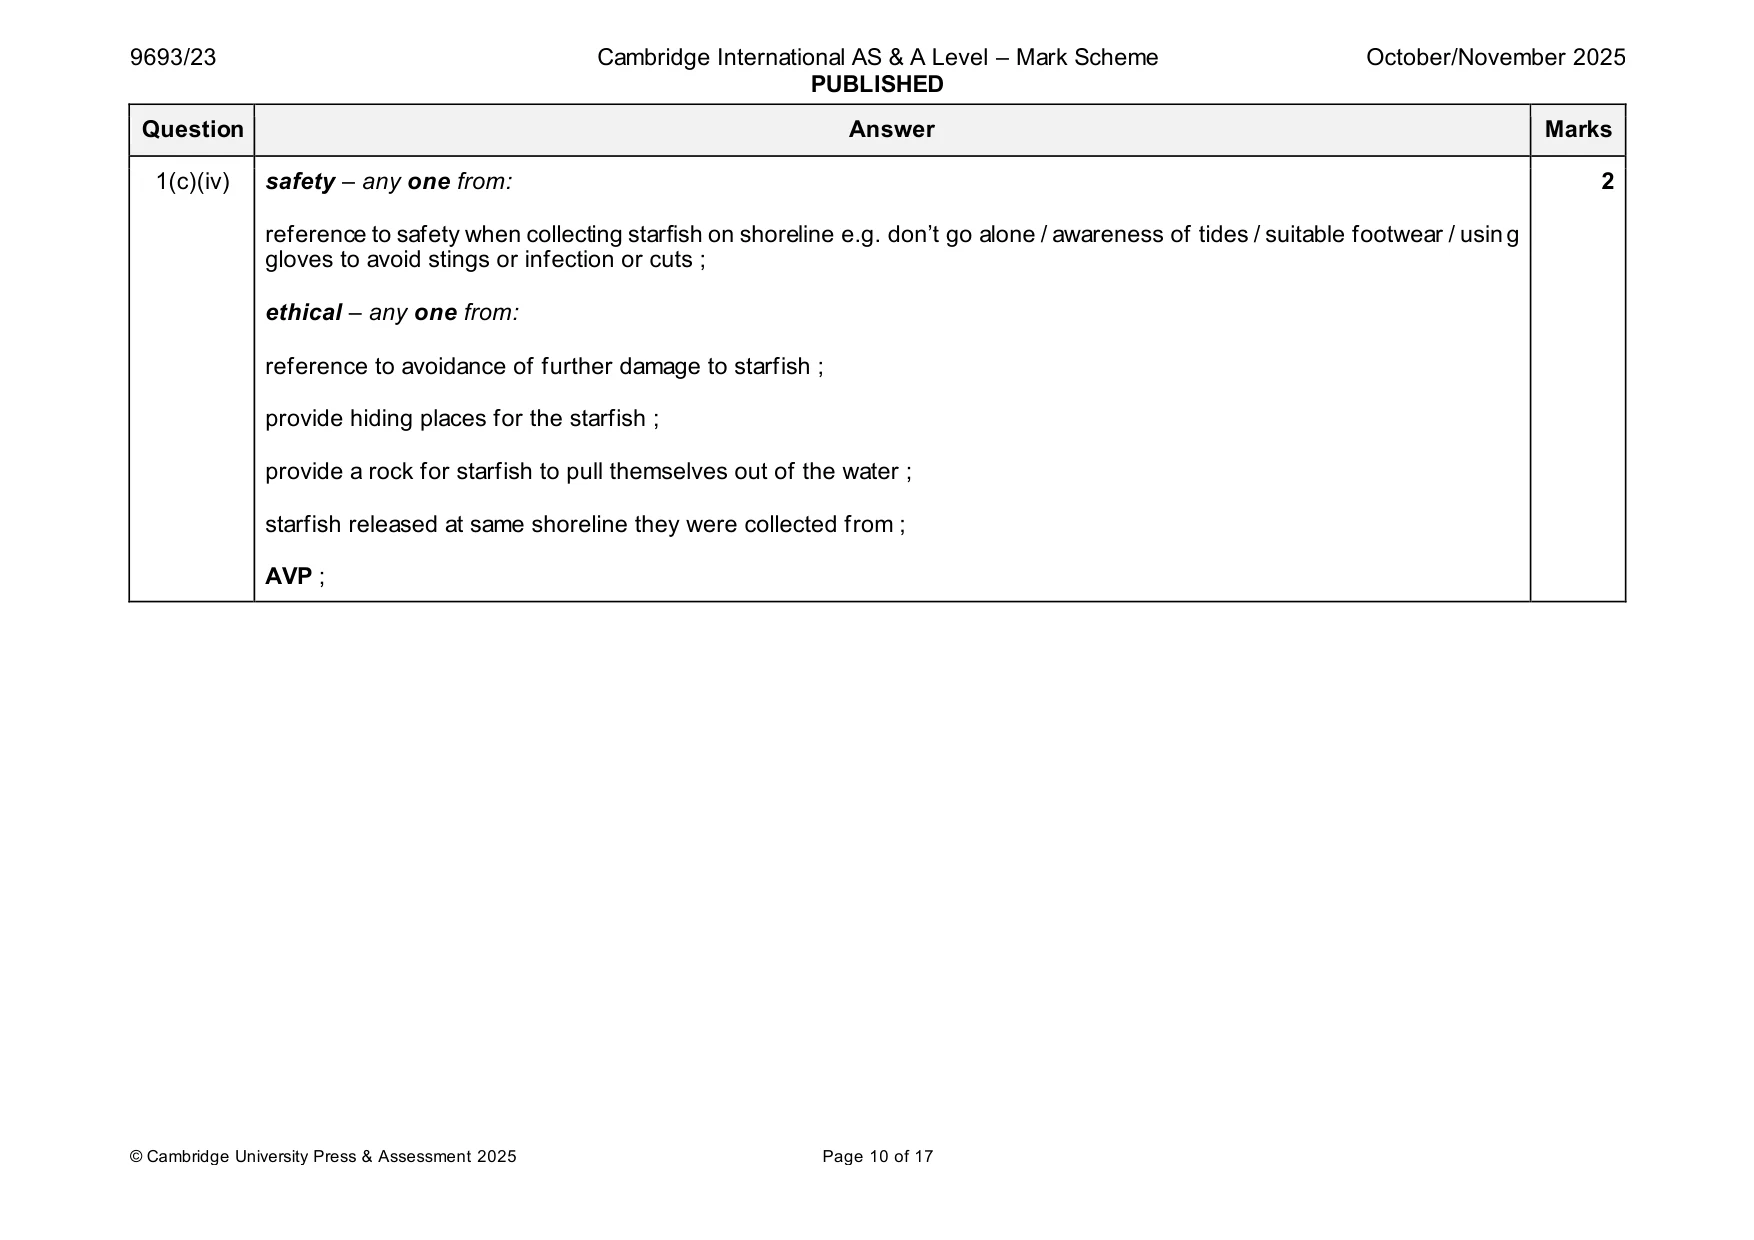
Mark scheme: Question Answer Marks 1(a)(i) outline: unbroken lines and no shading ; 4 size: most of the space provided and at least as big as original picture ; in proportion ; detail ; 1(a)(ii) reference to more than 5 arms OR has 7 arms ; 1 1(b) any one from: 1 lost to predator ; lost due to wave action ; lost during reproduction ; AVP ; 1(c)(i) any one from: 1 (water) temperature ; dissolved oxygen concentration ; salinity ; pH ; AVP ; 1(c)(ii) correct numbers for mm and time read from line of best fit ; 3 correct calculation of mm / time ; answer correctly rounded to 2 sig figs ; 1(c)(iii) Yes + as gradient for 1 arm re-growing is steeper than gradient for 2 arms ; 2 and one from: however, sample size not known / mean starting lengths different ; reference to significant difference / need for statistical analysis ; may have collected different species / ages / genders ; calculated difference of 0.1 mm per day ; difference in feeding ability ; no control group (growth of starfish with all limbs intact) AW ; AVP ; 1(c)(iv) safety – any one from: 2 reference to safety when collecting starfish on shoreline e.g. don’t go alone / awareness of tides / suitable footwear / using gloves to avoid stings or infection or cuts ; ethical – any one from: reference to avoidance of further damage to starfish ; provide hiding places for the starfish ; provide a rock for starfish to pull themselves out of the water ; starfish released at same shoreline they were collected from ; AVP ;
Q2 · A student investigated the effect of salinity on the freezing point of water
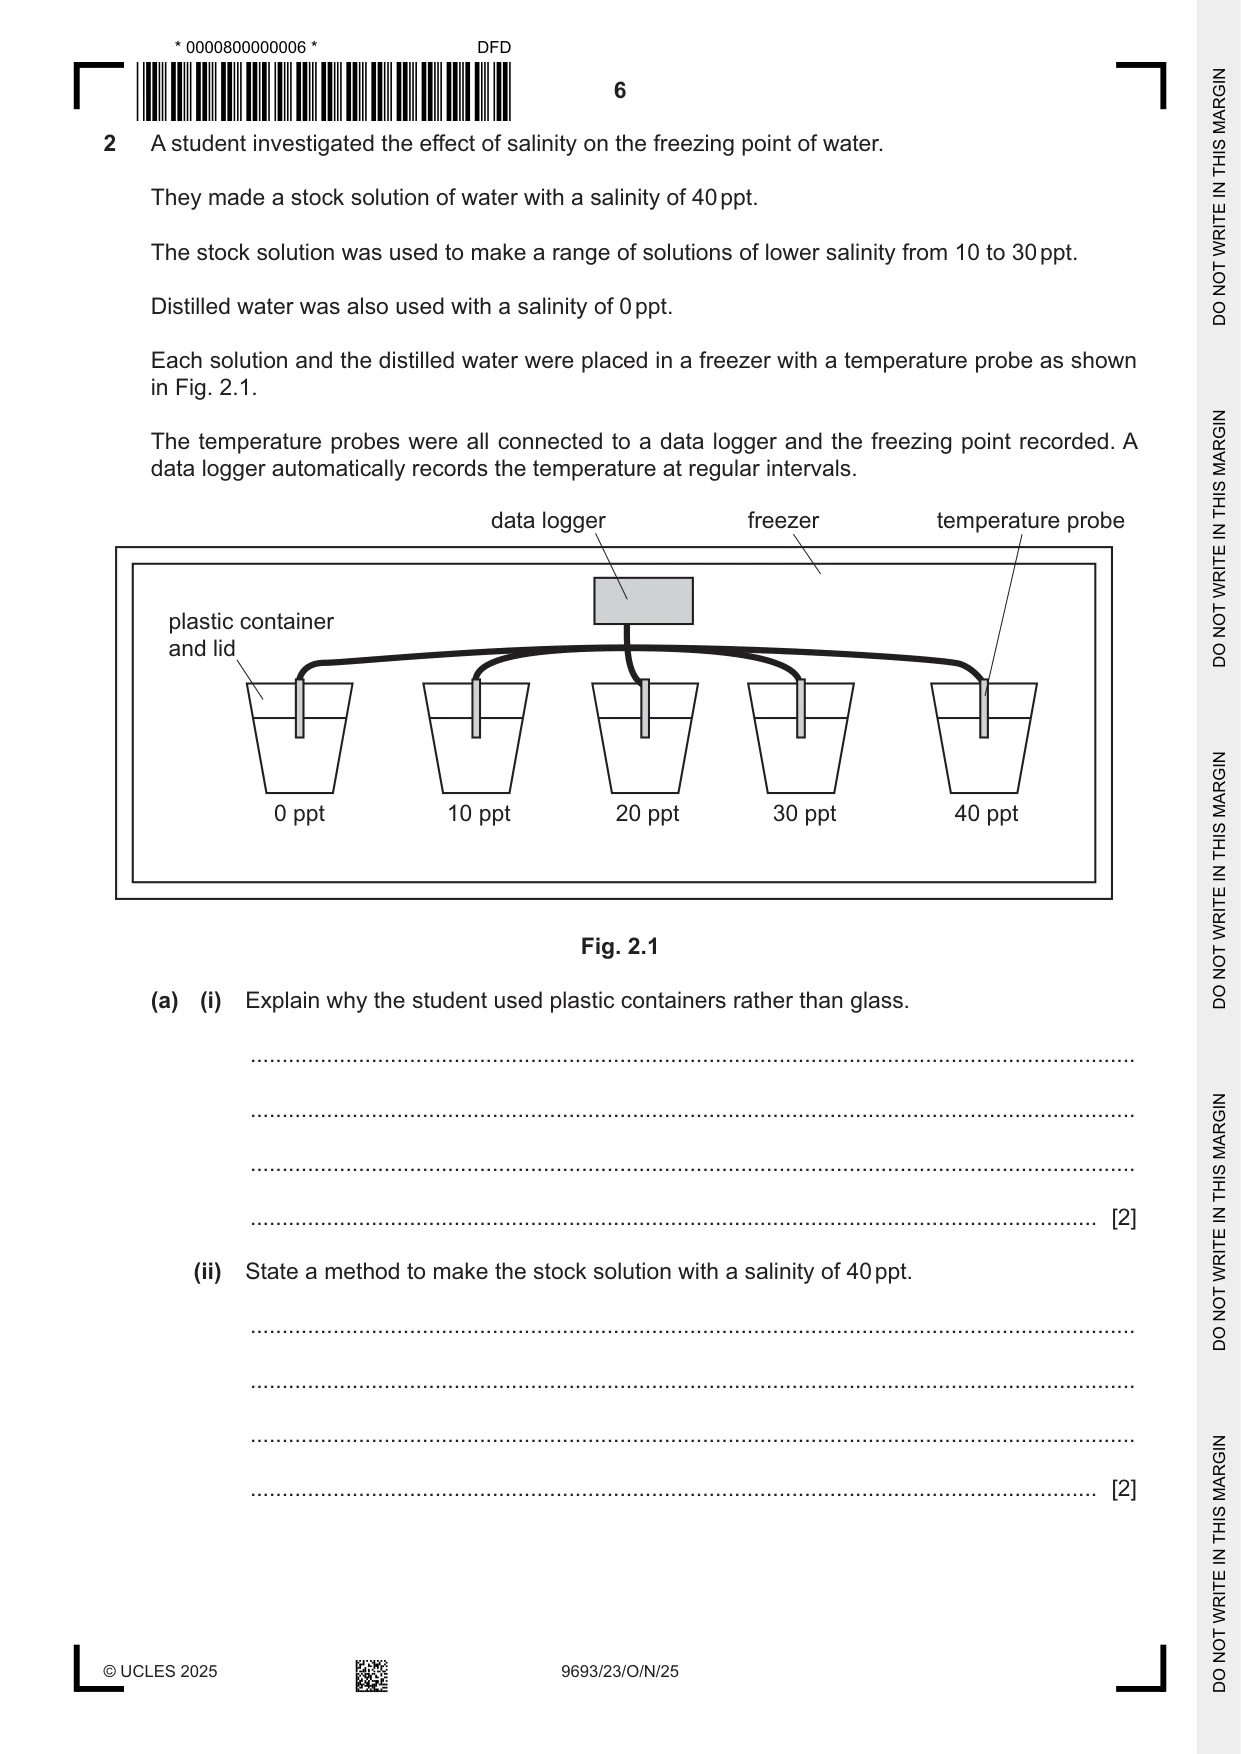
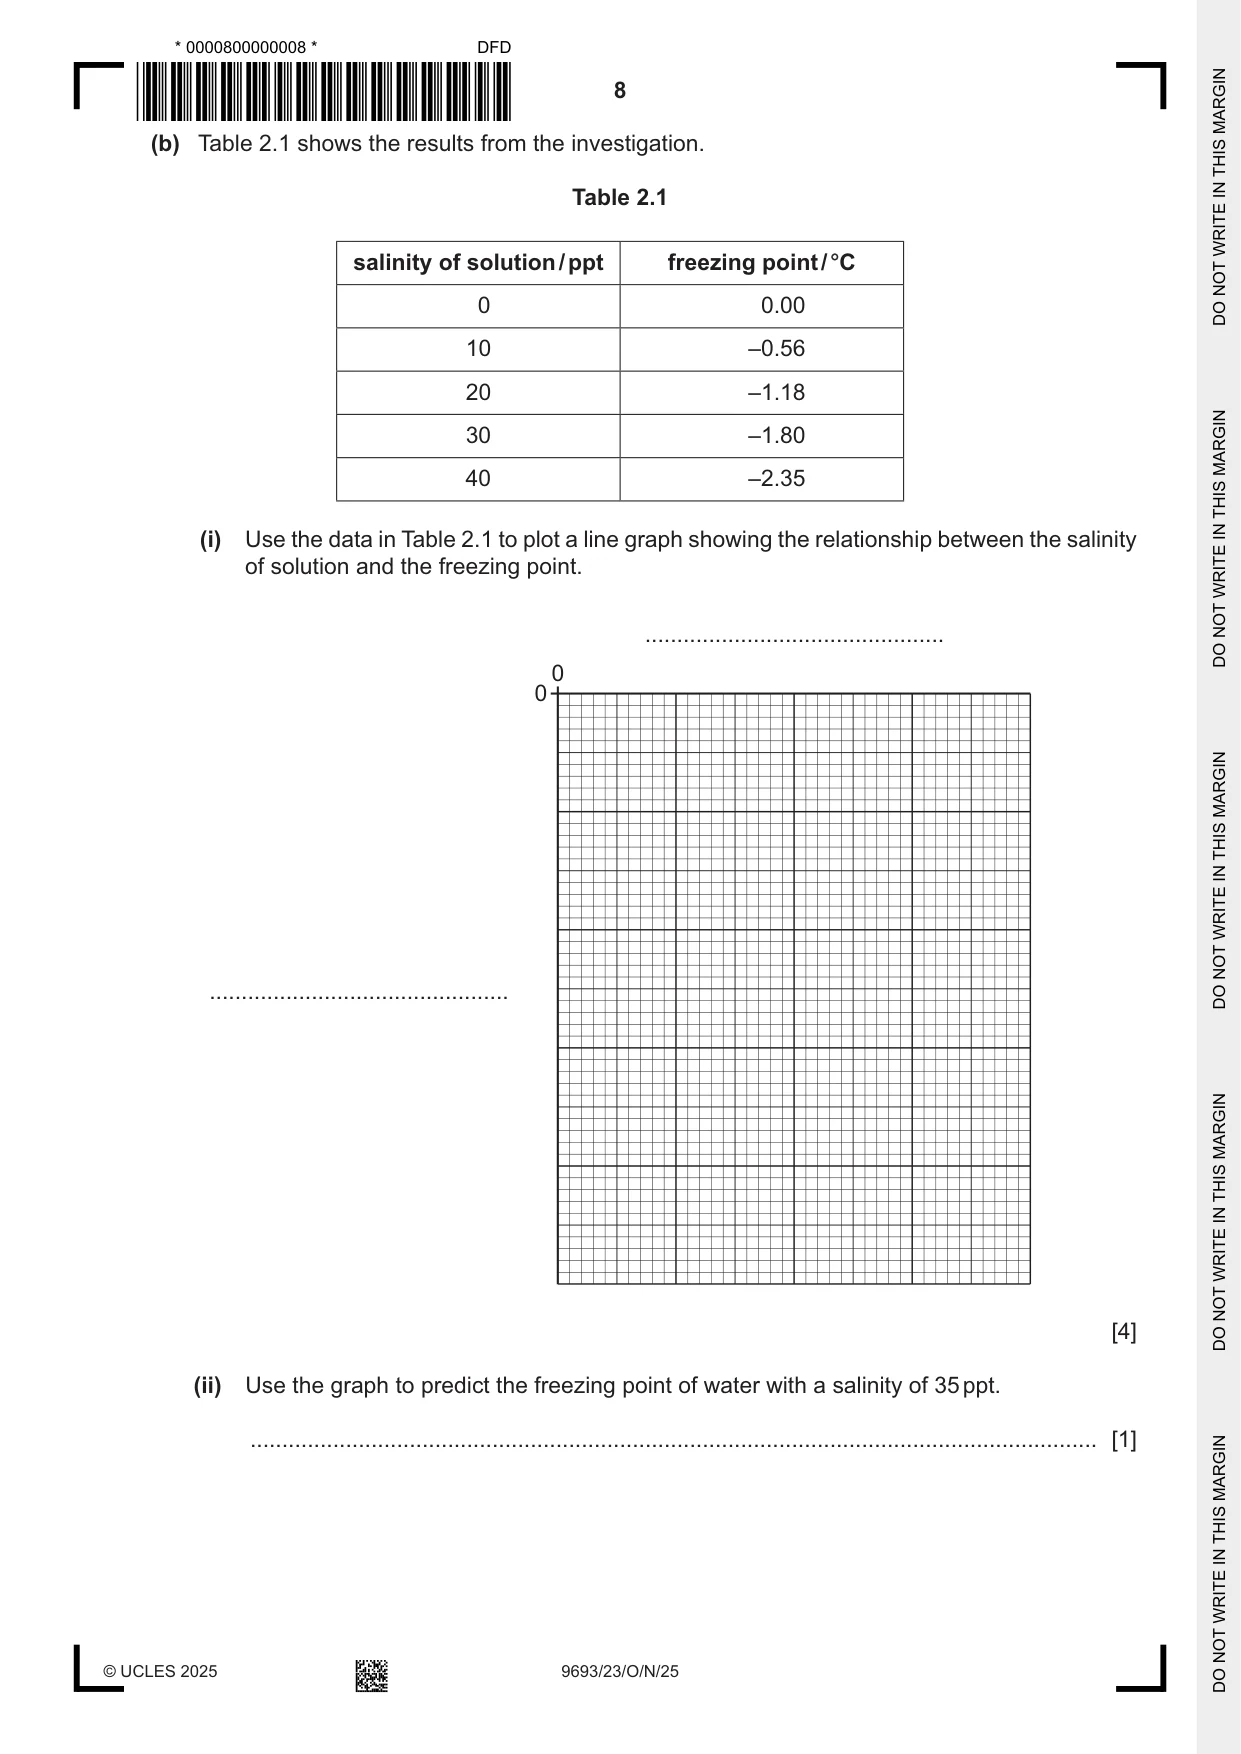
2 A student investigated the effect of salinity on the freezing point of water. They made a stock solution of water with a salinity of 40 ppt. The stock solution was used to make a range of solutions of lower salinity from 10 to 30 ppt. Distilled water was also used with a salinity of 0 ppt. Each solution and the distilled water were placed in a freezer with a temperature probe as shown in Fig. 2.1. The temperature probes were all connected to a data logger and the freezing point recorded. A data logger automatically records the temperature at regular intervals. data logger freezer temperature probe plastic container and lid 0 ppt 10 ppt 20 ppt 30 ppt 40 ppt Fig. 2.1 (a) (i) Explain why the student used plastic containers rather than glass. ........................................................................................................................................... ........................................................................................................................................... ........................................................................................................................................... ..................................................................................................................................... [2] (ii) State a method to make the stock solution with a salinity of 40 ppt. ........................................................................................................................................... ........................................................................................................................................... ........................................................................................................................................... ..................................................................................................................................... [2] (iii) Describe how to use the stock solution to make 500 cm3 of solution with a salinity of 20 ppt. ........................................................................................................................................... ........................................................................................................................................... ........................................................................................................................................... ..................................................................................................................................... [2] (b) Table 2.1 shows the results from the investigation. Table 2.1 salinity of solution / ppt freezing point / °C 0 0.00 10 –0.56 20 –1.18 30 –1.80 40 –2.35 (i) Use the data in Table 2.1 to plot a line graph showing the relationship between the salinity of solution and the freezing point. ............................................... 0 0 ............................................... [4] (ii) Use the graph to predict the freezing point of water with a salinity of 35 ppt. ..................................................................................................................................... [1] (c) Explain why the salinity of sea water may decrease. ................................................................................................................................................... ................................................................................................................................................... ................................................................................................................................................... ............................................................................................................................................. [2] (d) The student investigated how salinity affected the pH of the five salinities of water. Explain the advantage of using a pH probe rather than Universal Indicator to obtain the results. ................................................................................................................................................... ................................................................................................................................................... ................................................................................................................................................... ............................................................................................................................................. [2] [Total: 15]
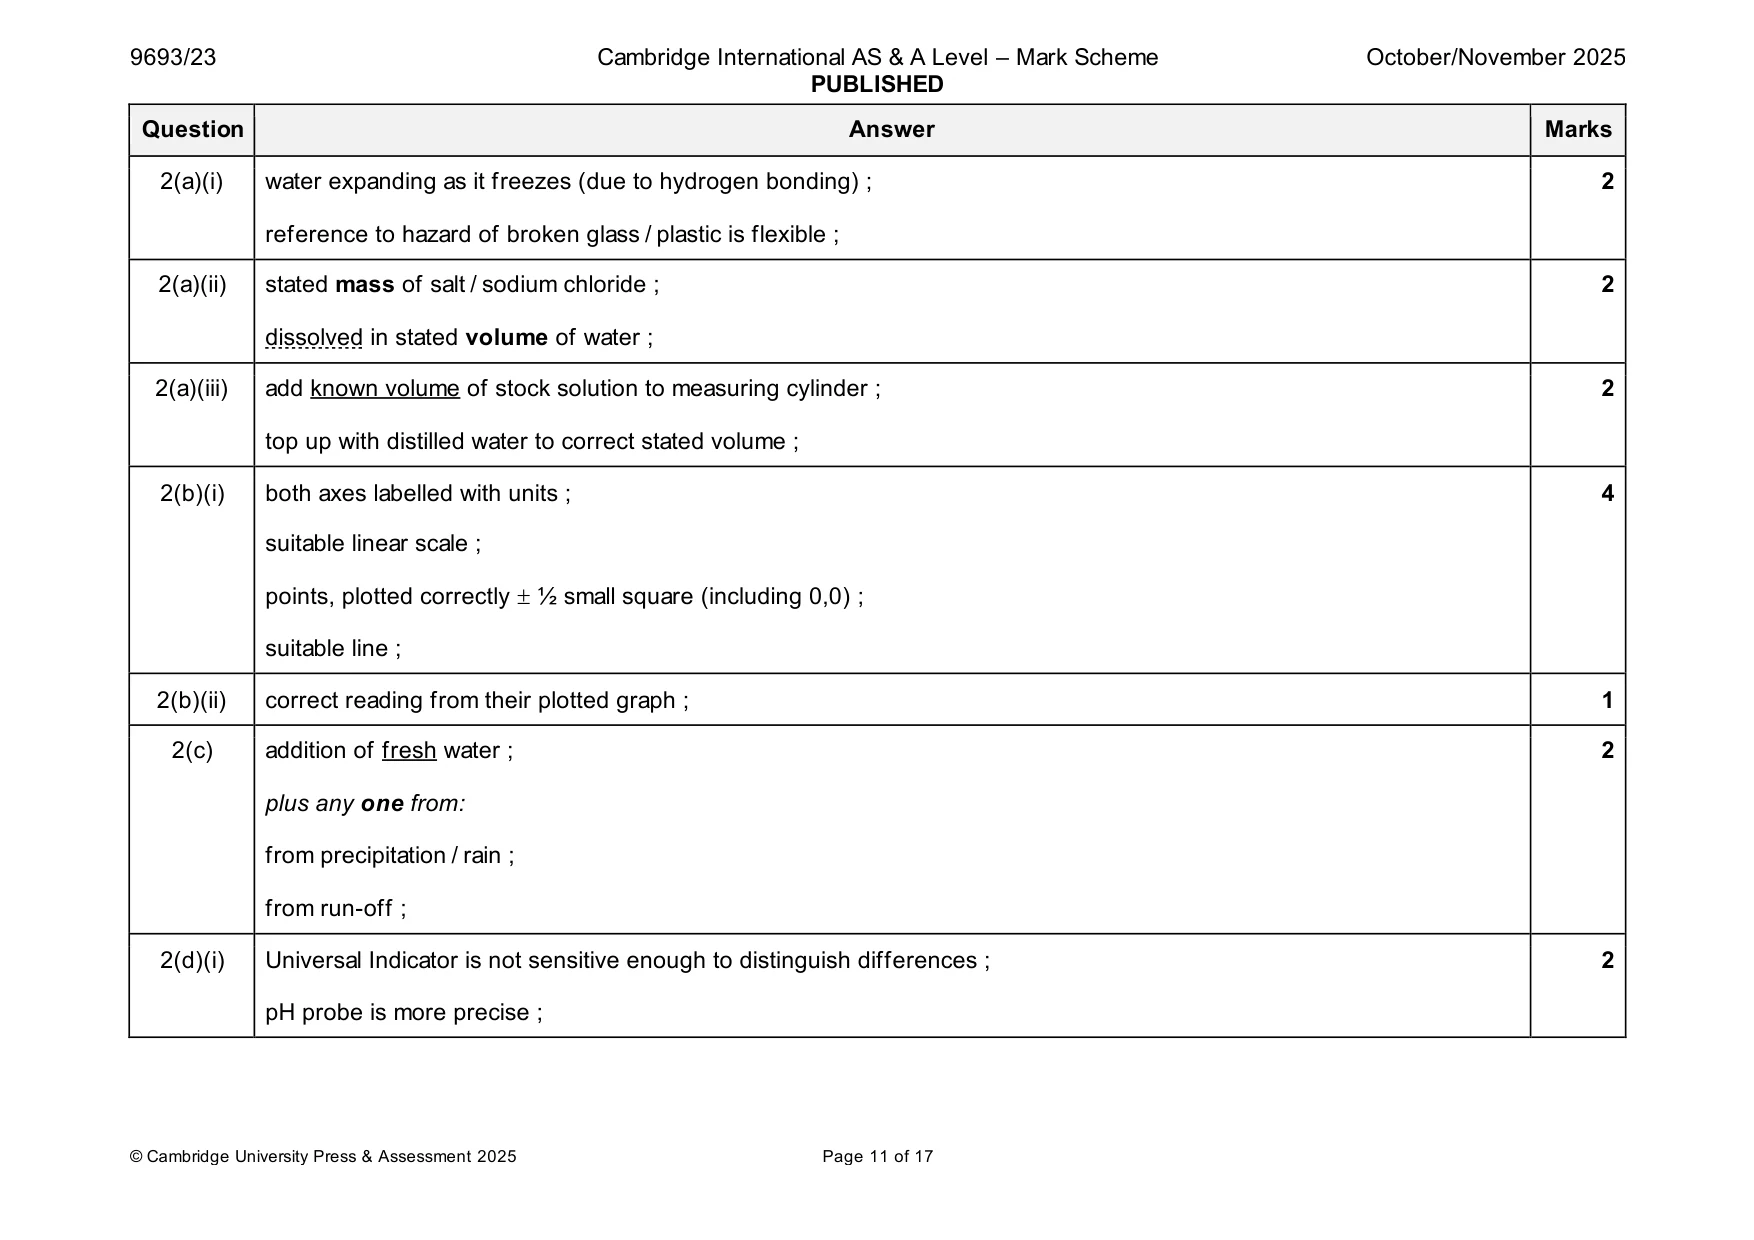
Mark scheme: 2(a)(i) water expanding as it freezes (due to hydrogen bonding) ; 2 reference to hazard of broken glass / plastic is flexible ; 2(a)(ii) stated mass of salt / sodium chloride ; 2 dissolved in stated volume of water ; 2(a)(iii) add known volume of stock solution to measuring cylinder ; 2 top up with distilled water to correct stated volume ; 2(b)(i) both axes labelled with units ; 4 suitable linear scale ; points, plotted correctly ½ small square (including 0,0) ; suitable line ; 2(b)(ii) correct reading from their plotted graph ; 1 2(c) addition of fresh water ; 2 plus any one from: from precipitation / rain ; from run-off ; 2(d)(i) Universal Indicator is not sensitive enough to distinguish differences ; 2 pH probe is more precise ;
Q3 · A student investigated how light intensity affected the rate of photosynthesis in two…
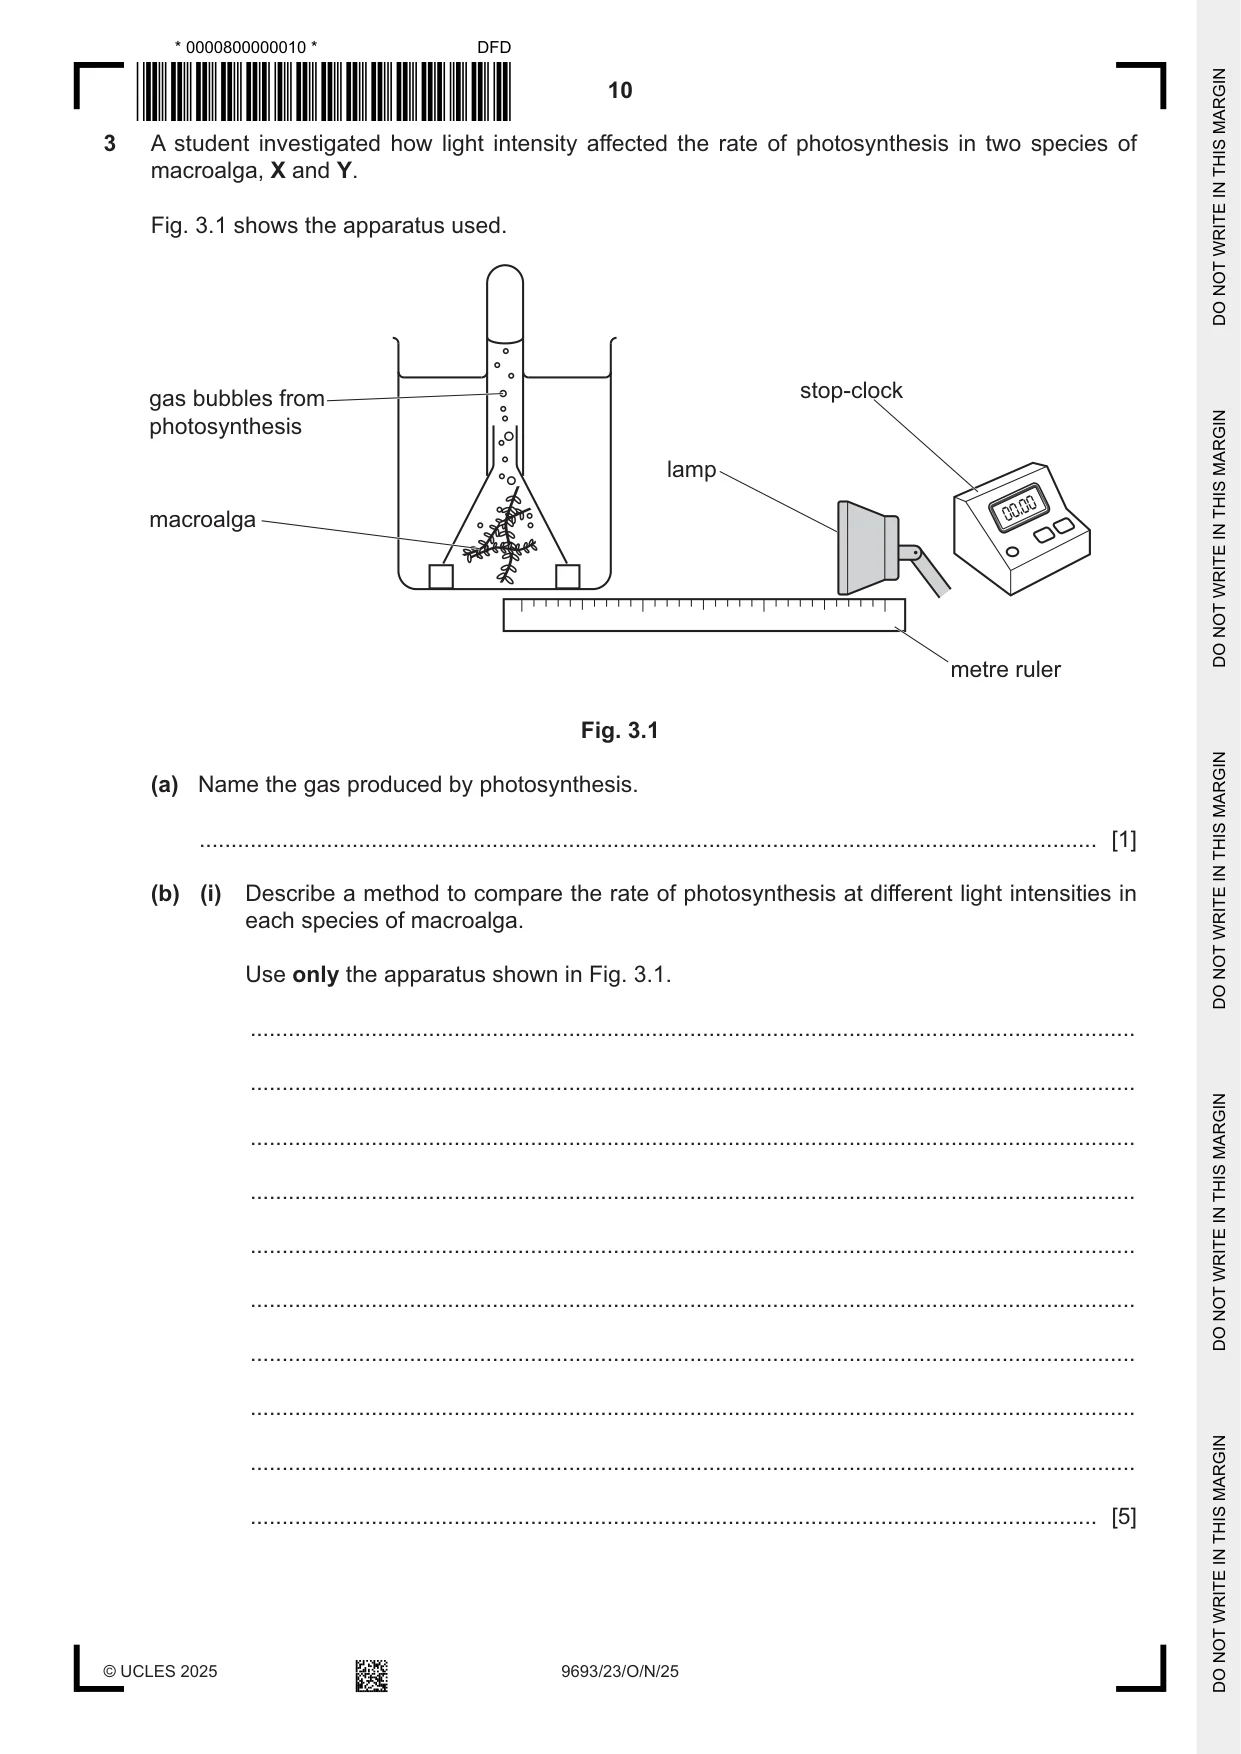
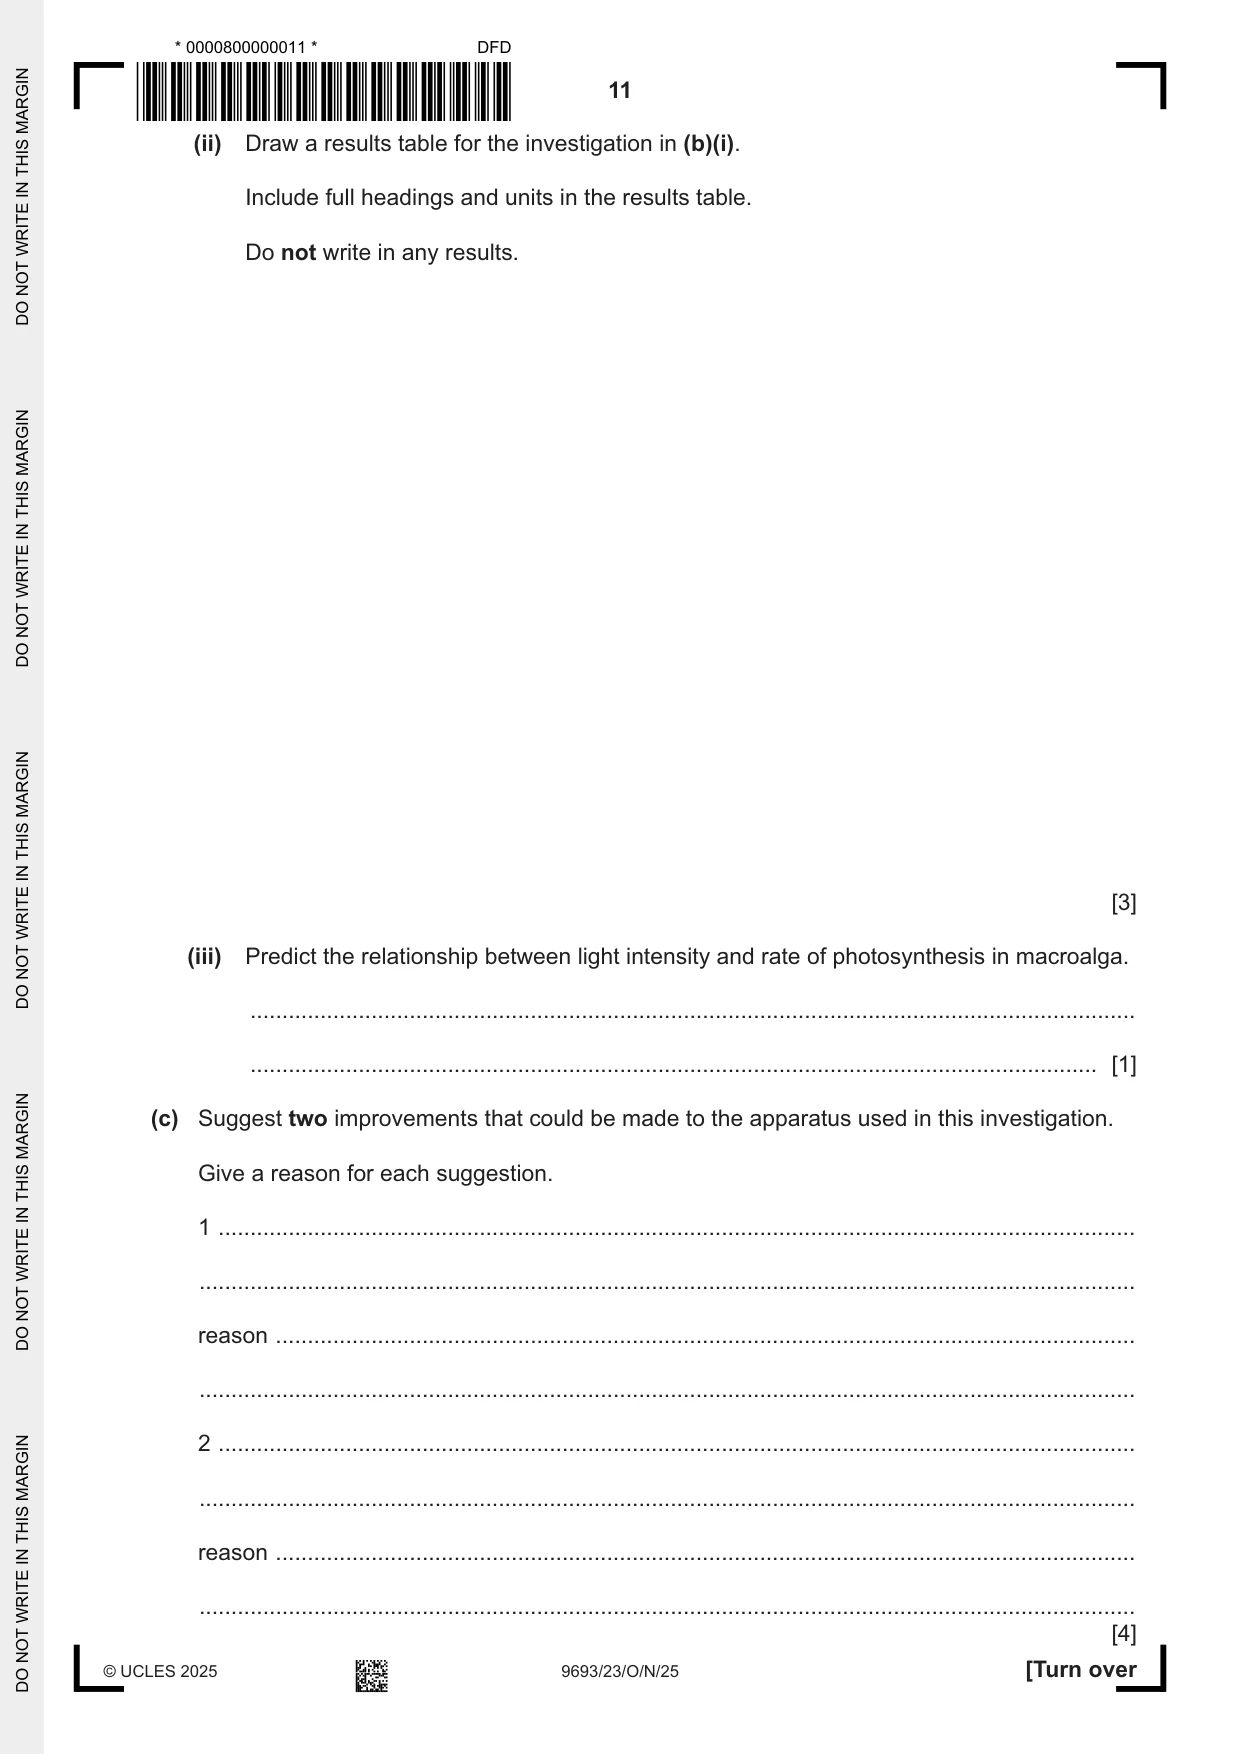
3 A student investigated how light intensity affected the rate of photosynthesis in two species of macroalga, X and Y. Fig. 3.1 shows the apparatus used. stop-clock gas bubbles from photosynthesis lamp 00.00 macroalga metre ruler Fig. 3.1 (a) Name the gas produced by photosynthesis. ............................................................................................................................................. [1] (b) (i) Describe a method to compare the rate of photosynthesis at different light intensities in each species of macroalga. Use only the apparatus shown in Fig. 3.1. ........................................................................................................................................... ........................................................................................................................................... ........................................................................................................................................... ........................................................................................................................................... ........................................................................................................................................... ........................................................................................................................................... ........................................................................................................................................... ........................................................................................................................................... ........................................................................................................................................... ..................................................................................................................................... [5] (ii) Draw a results table for the investigation in (b)(i). Include full headings and units in the results table. Do not write in any results. [3] (iii) Predict the relationship between light intensity and rate of photosynthesis in macroalga. ........................................................................................................................................... ..................................................................................................................................... [1] (c) Suggest two improvements that could be made to the apparatus used in this investigation. Give a reason for each suggestion. 1 ................................................................................................................................................ ................................................................................................................................................... reason ....................................................................................................................................... ................................................................................................................................................... 2 ................................................................................................................................................ ................................................................................................................................................... reason ....................................................................................................................................... ................................................................................................................................................... [4] (d) Explain the importance of photosynthesis to consumers. ................................................................................................................................................... ................................................................................................................................................... ................................................................................................................................................... ................................................................................................................................................... ................................................................................................................................................... ............................................................................................................................................. [3] [Total: 17]
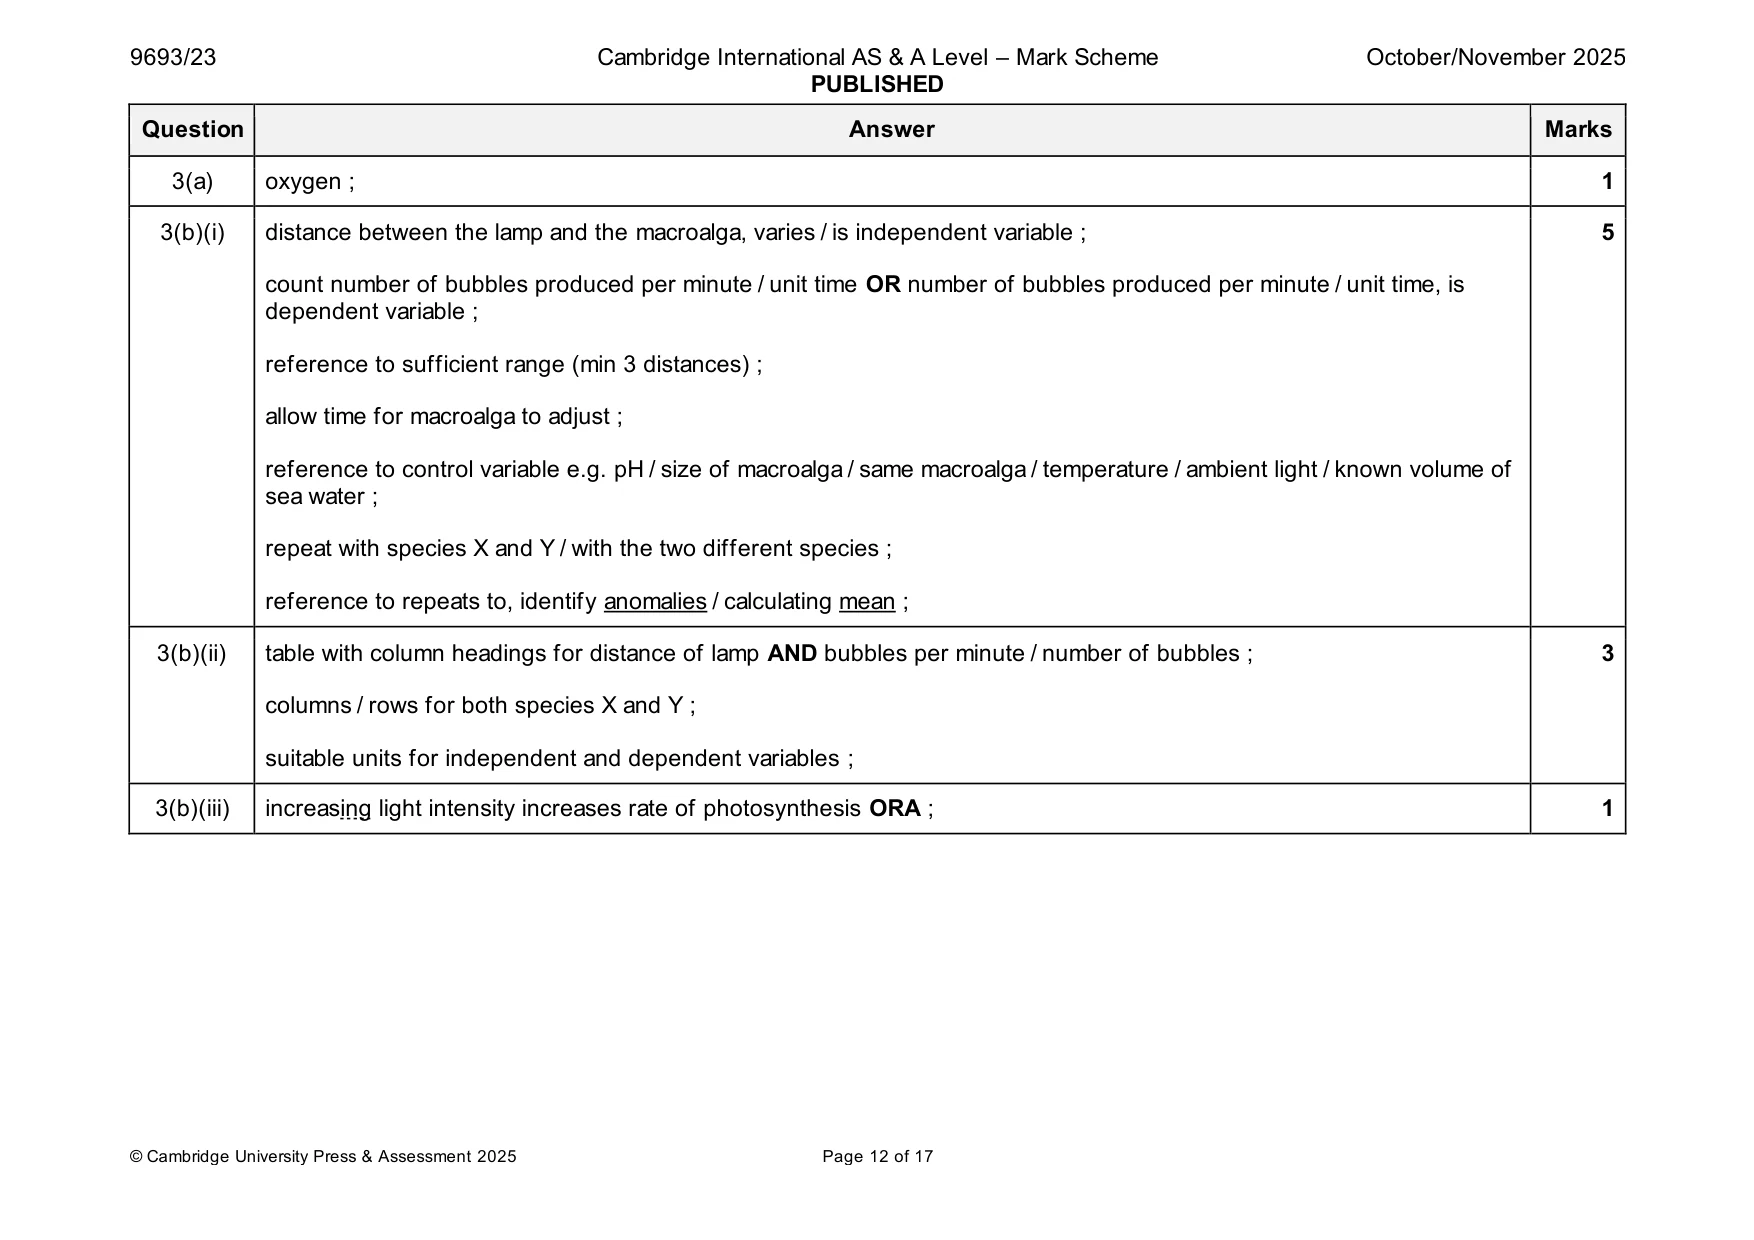
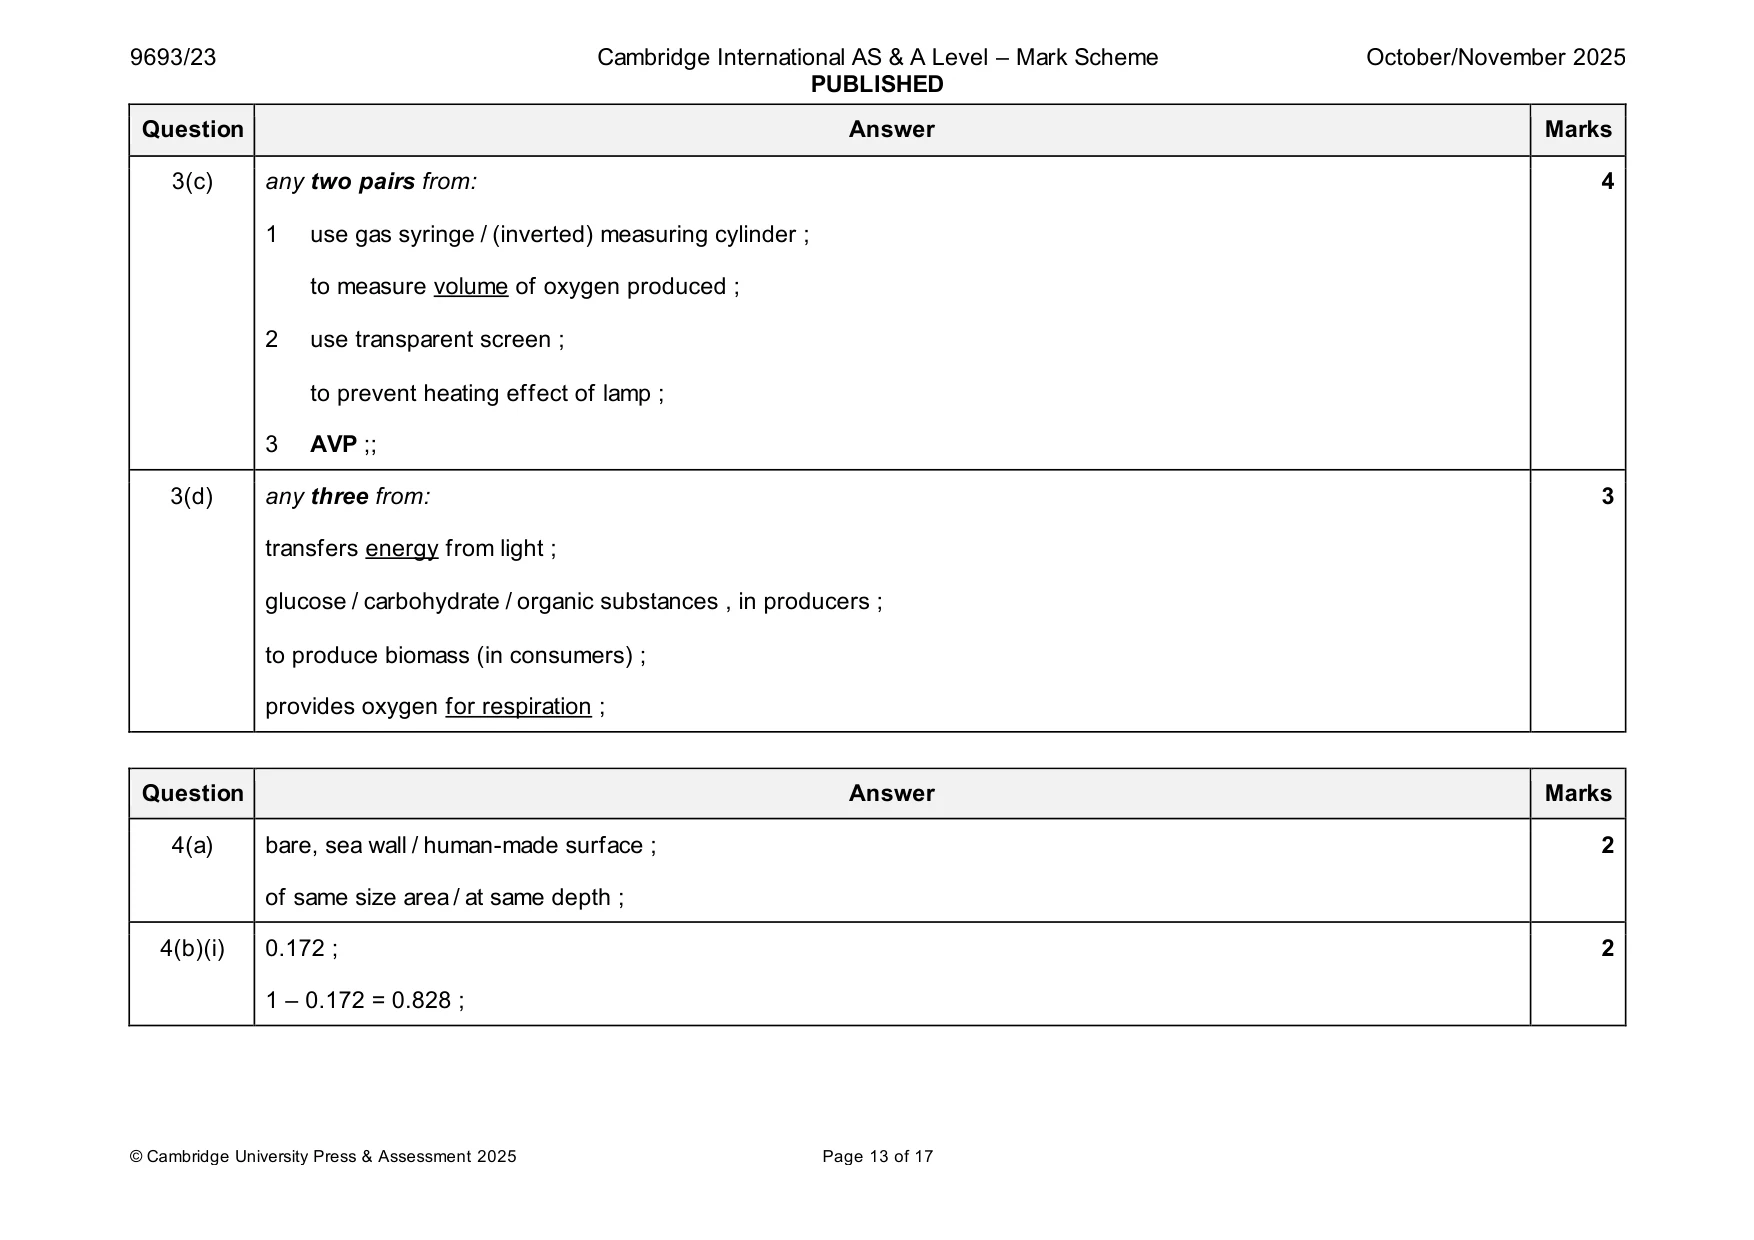
Mark scheme: 3(a) oxygen ; 1 3(b)(i) distance between the lamp and the macroalga, varies / is independent variable ; 5 count number of bubbles produced per minute / unit time OR number of bubbles produced per minute / unit time, is dependent variable ; reference to sufficient range (min 3 distances) ; allow time for macroalga to adjust ; reference to control variable e.g. pH / size of macroalga / same macroalga / temperature / ambient light / known volume of sea water ; repeat with species X and Y / with the two different species ; reference to repeats to, identify anomalies / calculating mean ; 3(b)(ii) table with column headings for distance of lamp AND bubbles per minute / number of bubbles ; 3 columns / rows for both species X and Y ; suitable units for independent and dependent variables ; 3(b)(iii) increasing light intensity increases rate of photosynthesis ORA ; 1 3(c) any two pairs from: 4 1 use gas syringe / (inverted) measuring cylinder ; to measure volume of oxygen produced ; 2 use transparent screen ; to prevent heating effect of lamp ; 3 AVP ;; 3(d) any three from: 3 transfers energy from light ; glucose / carbohydrate / organic substances , in producers ; to produce biomass (in consumers) ; provides oxygen for respiration ;
Q4 · Living walls are used to help increase diversity on human made structures
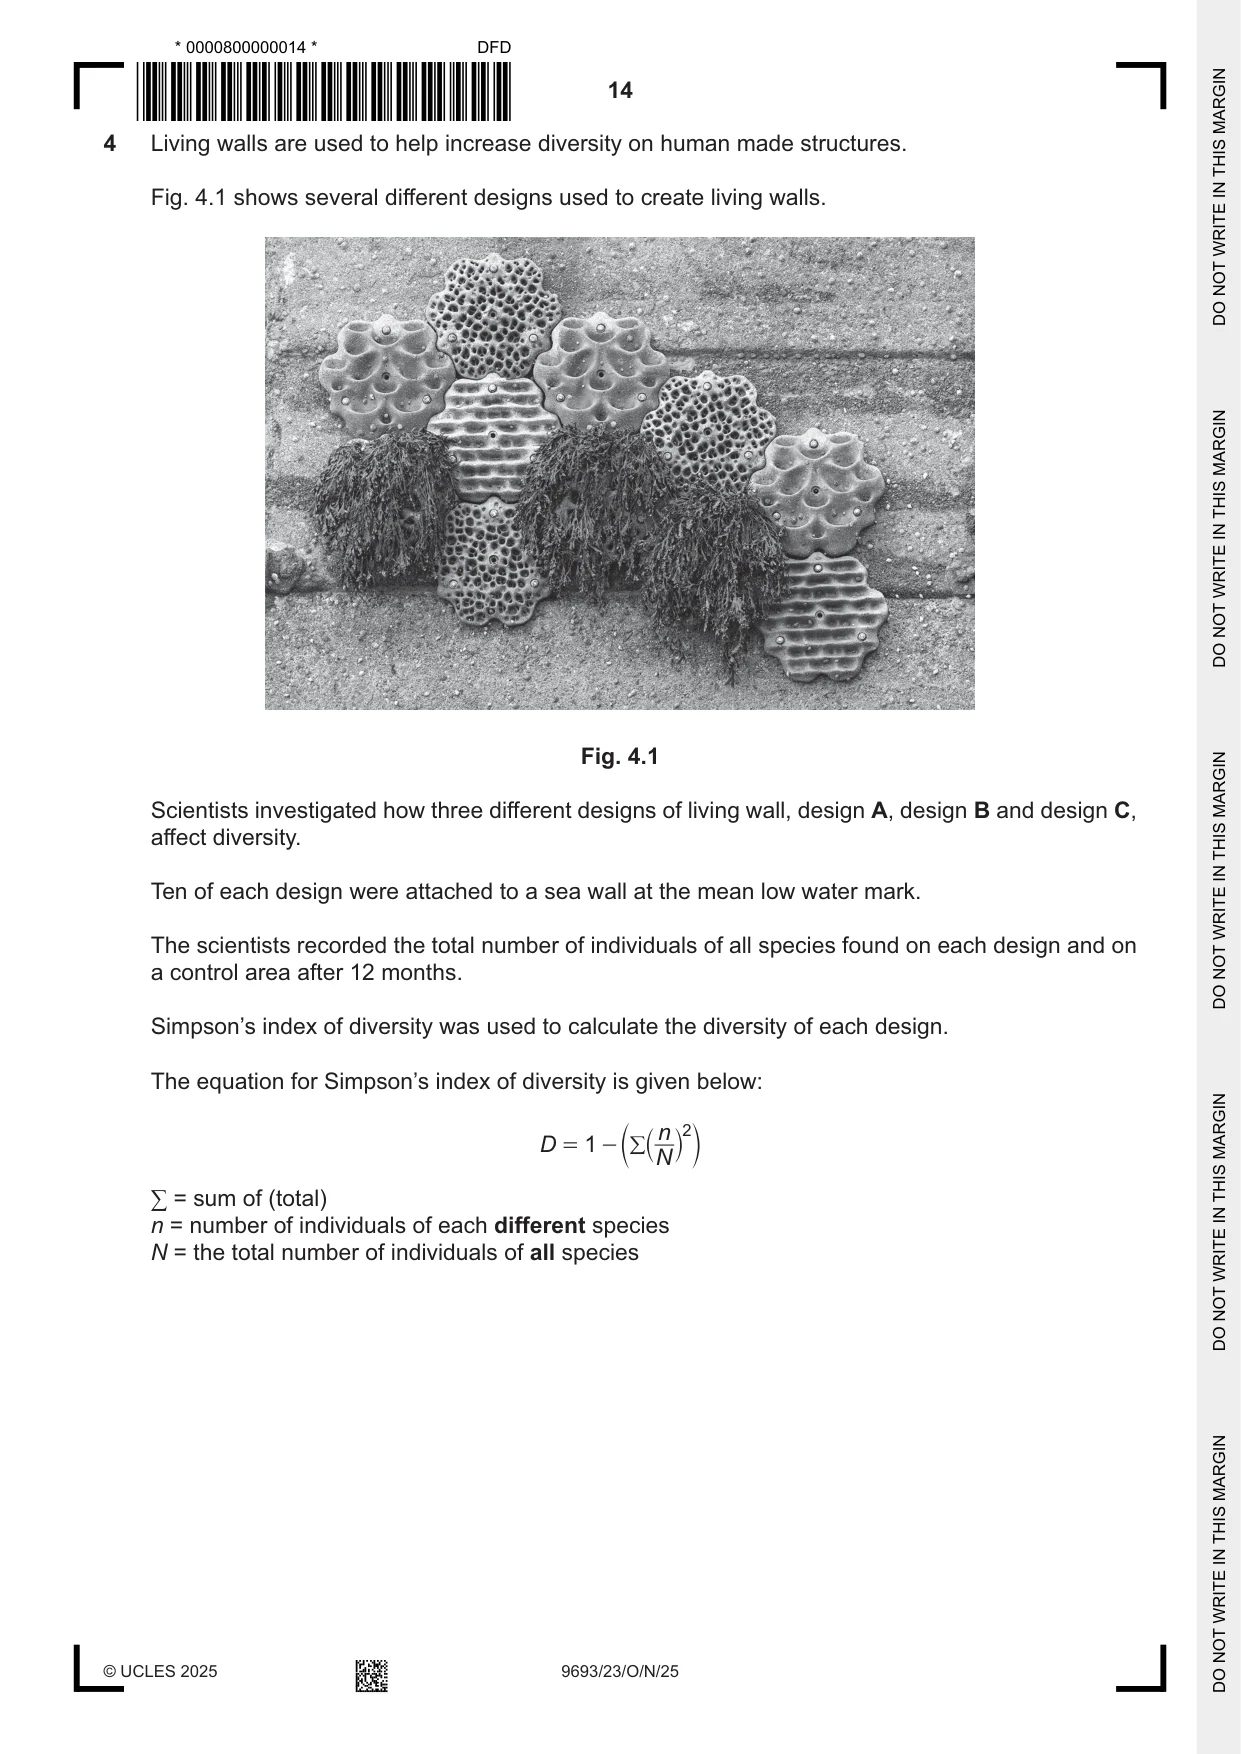
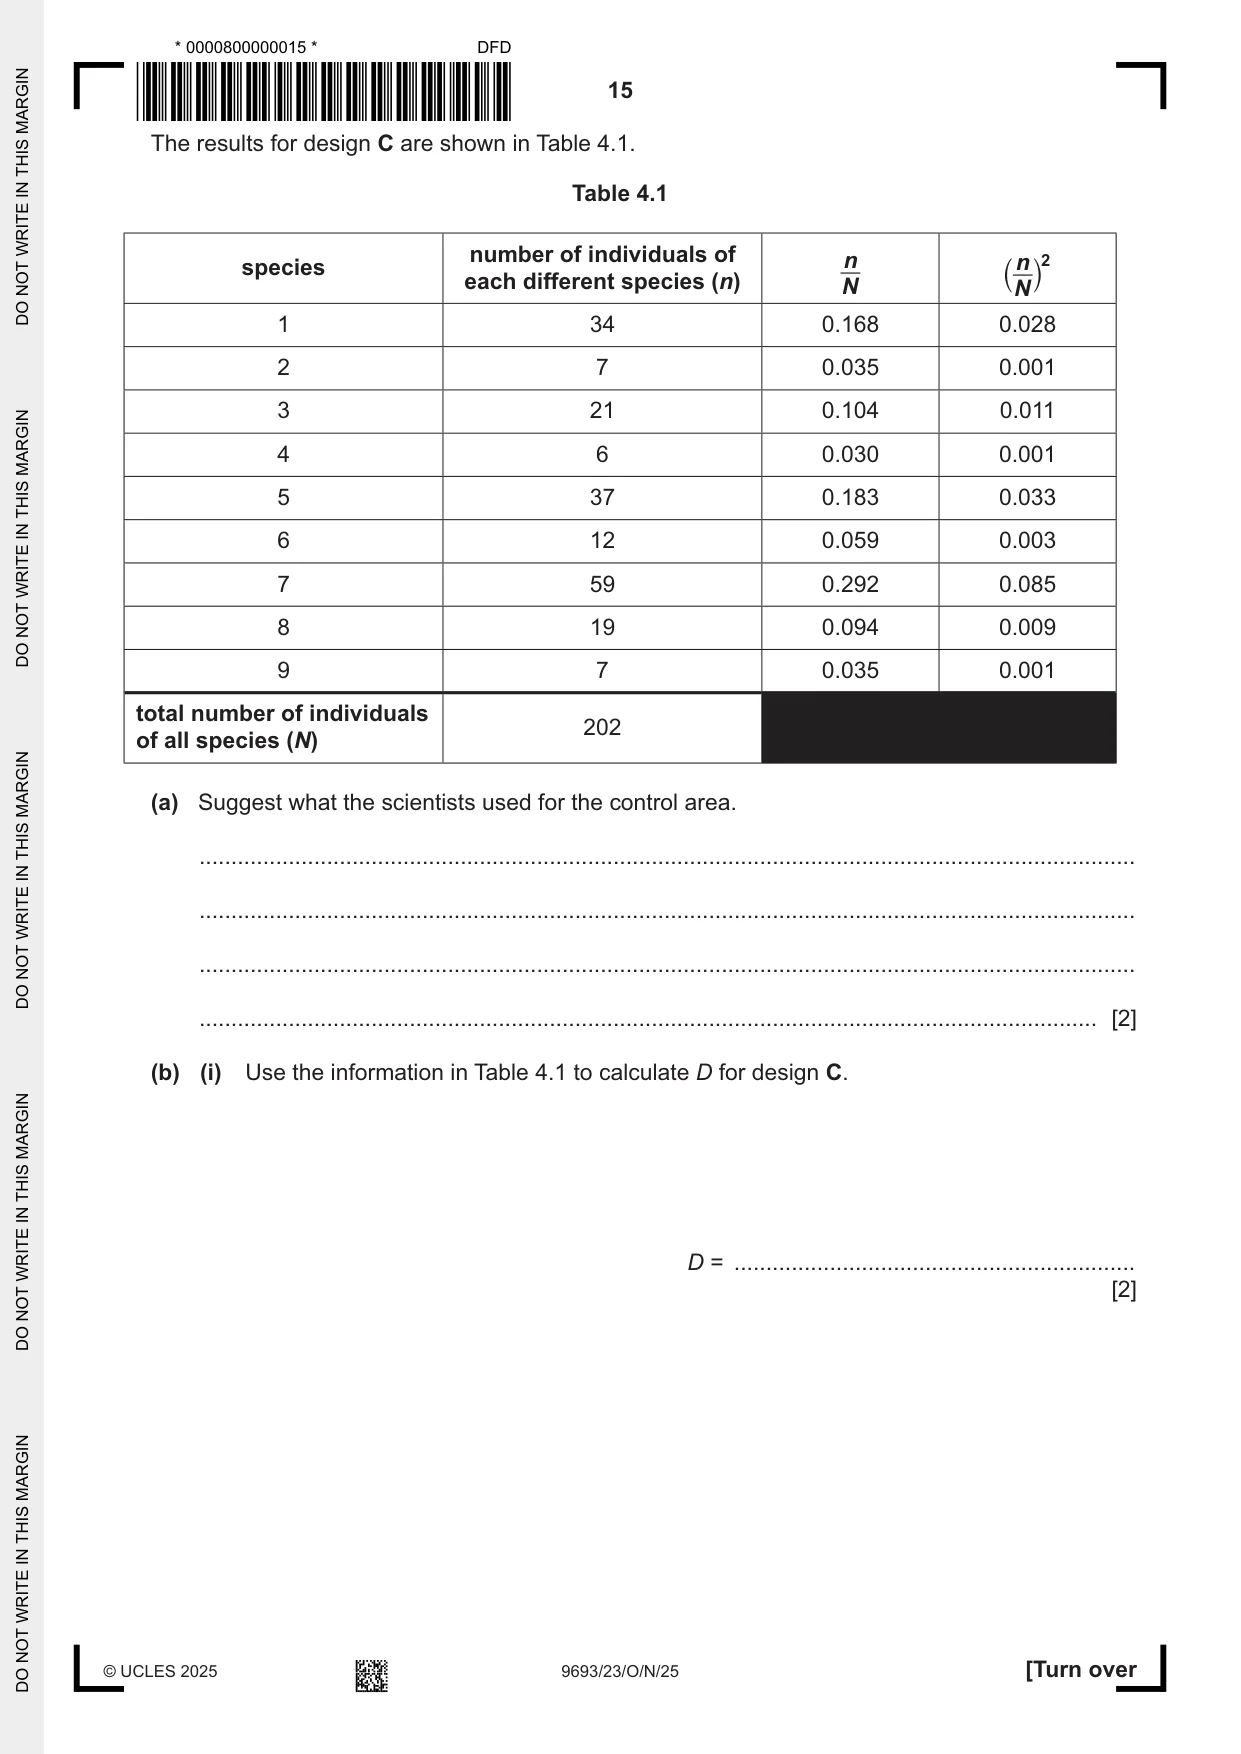
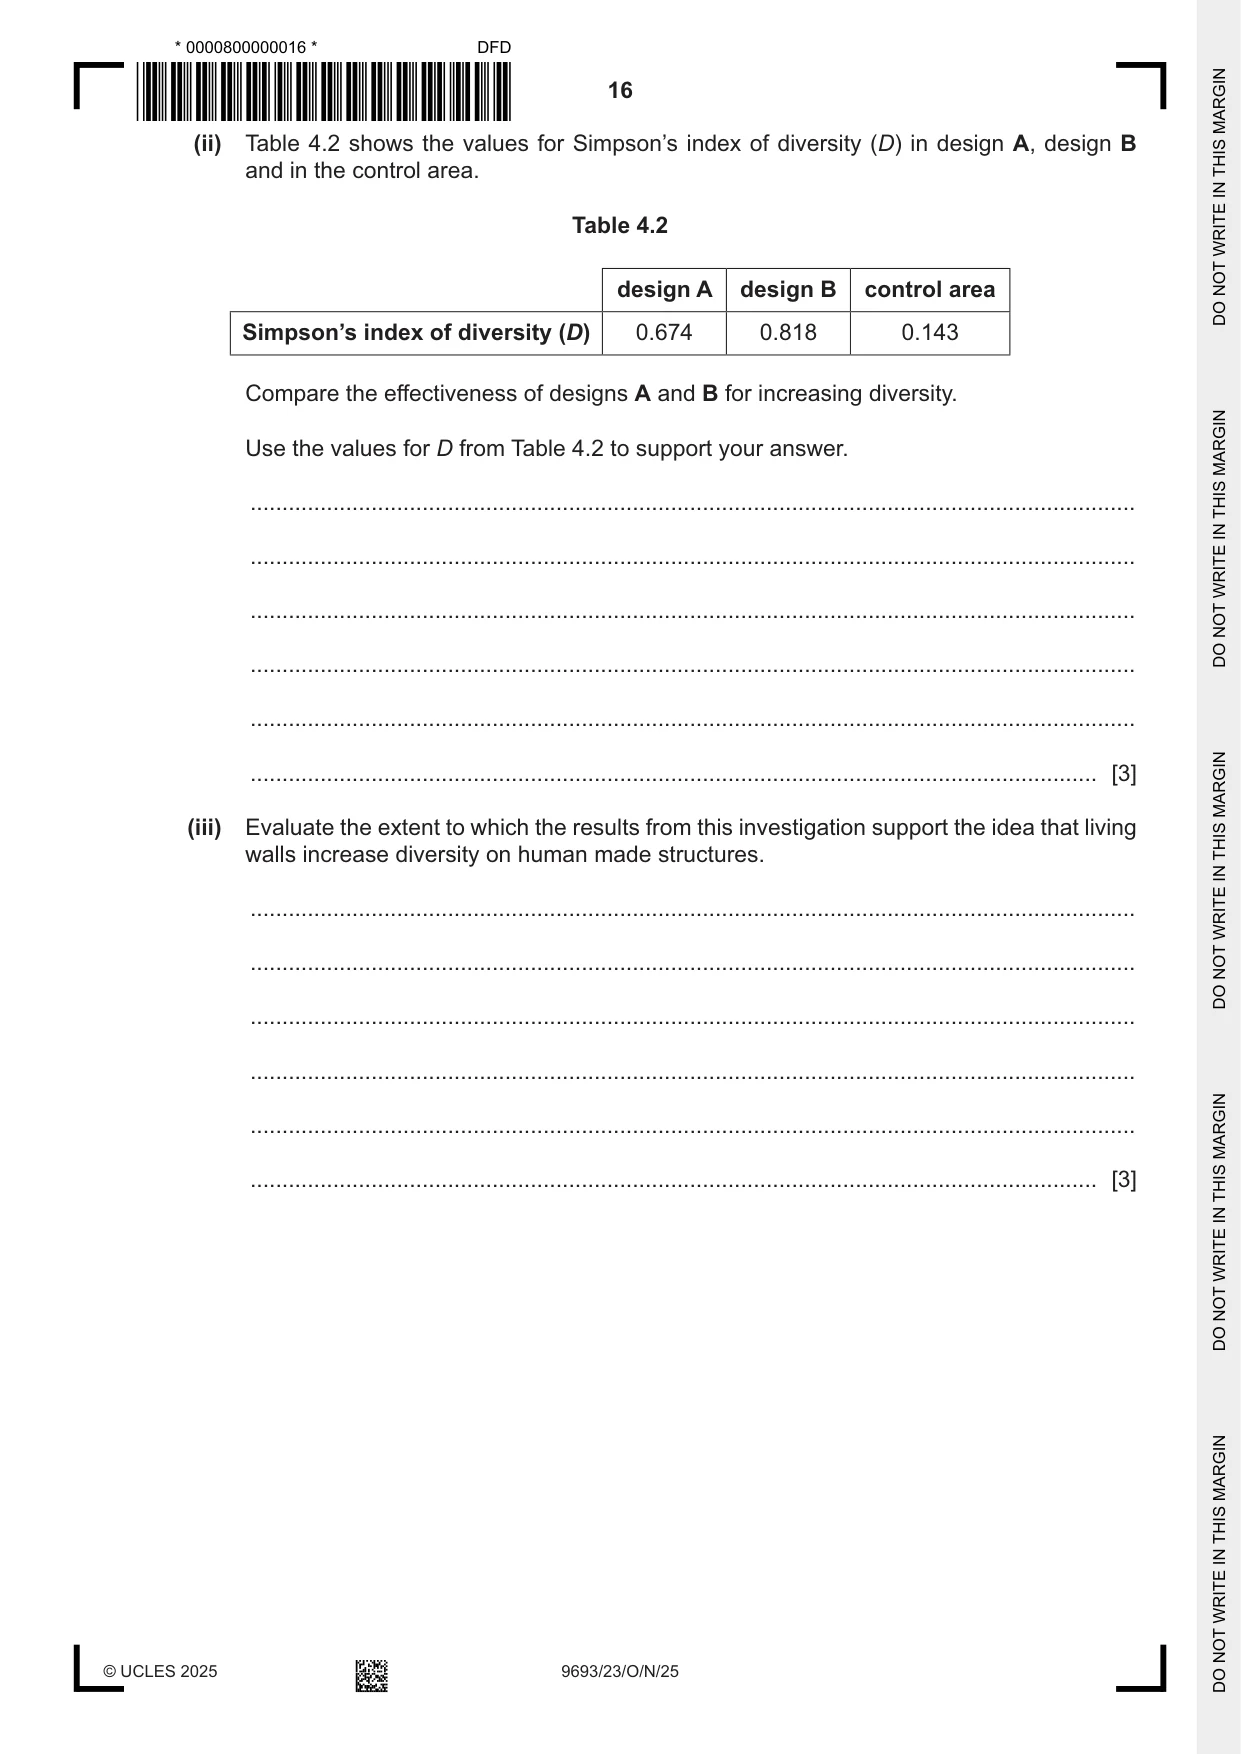
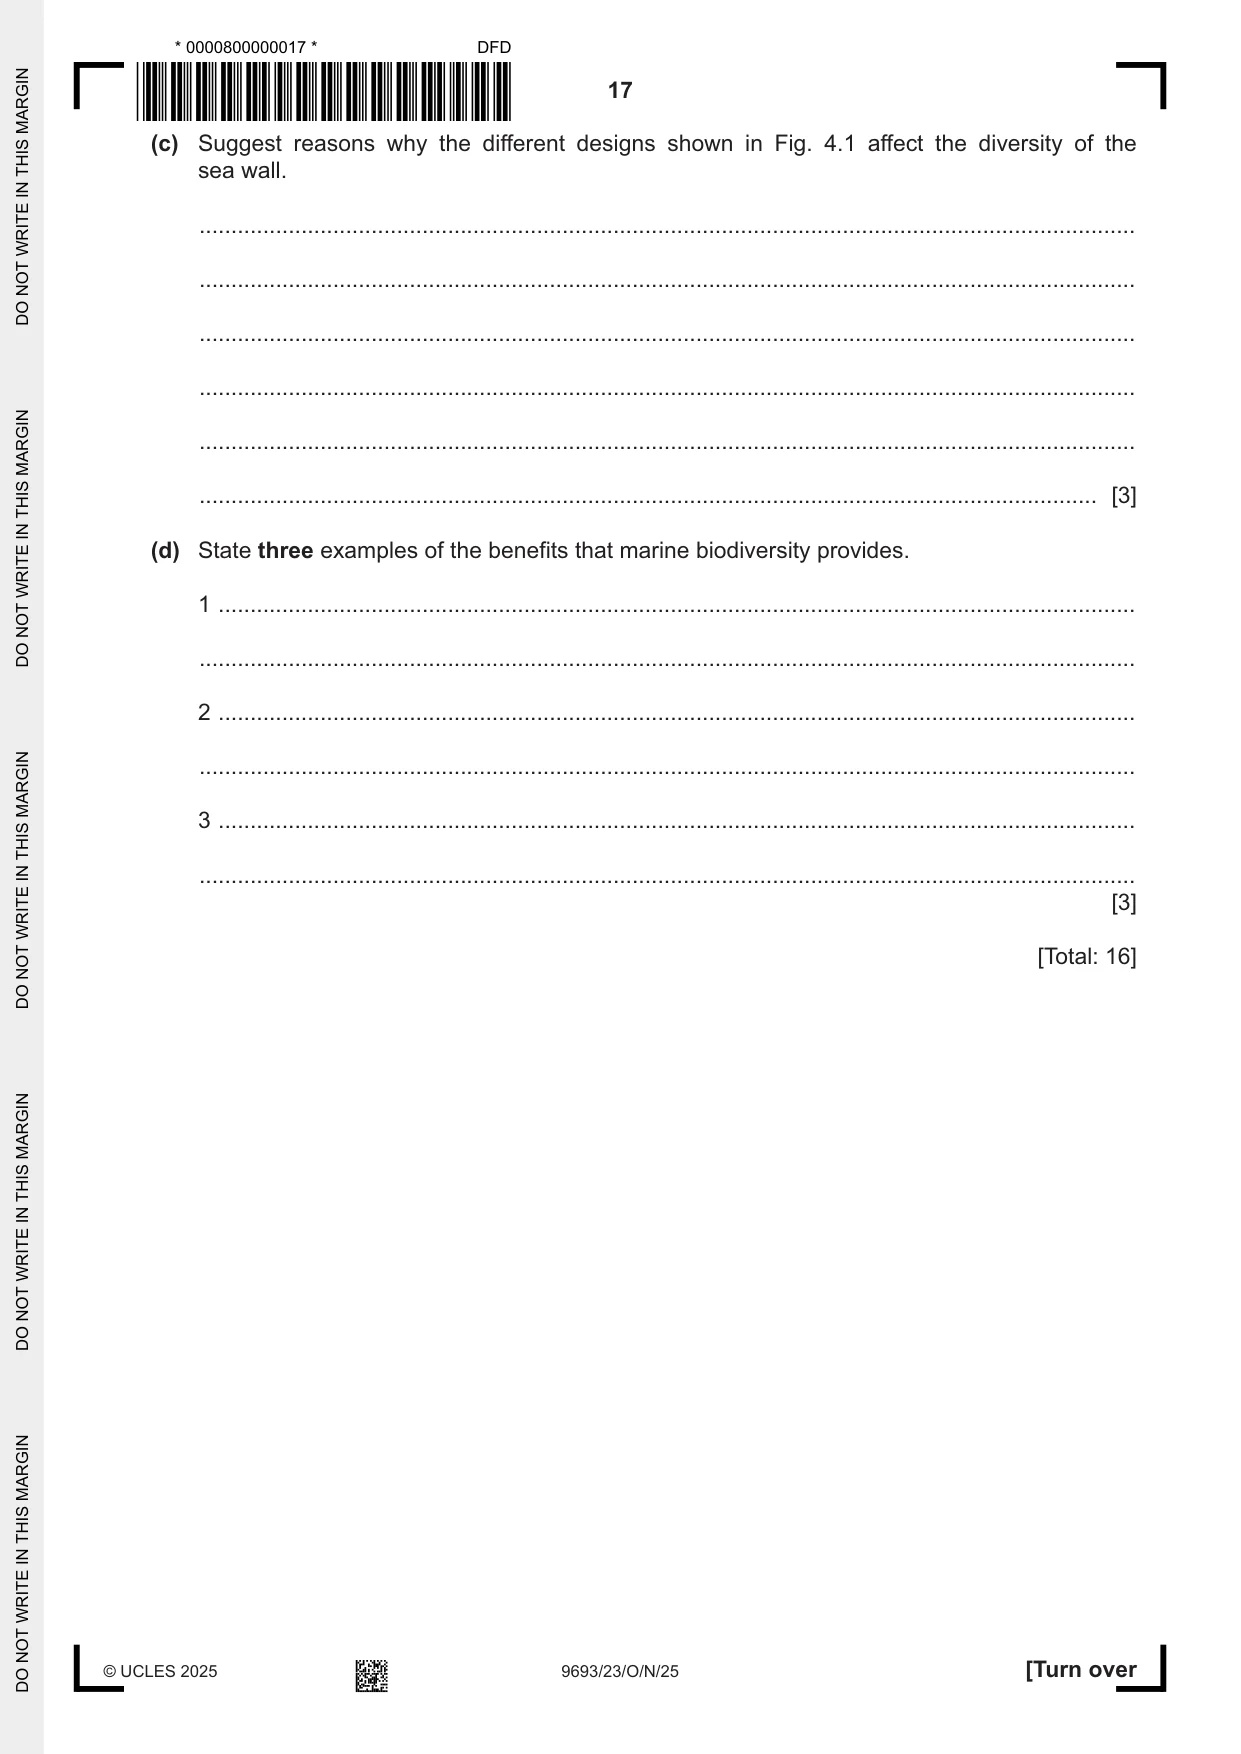
4 Living walls are used to help increase diversity on human made structures. Fig. 4.1 shows several different designs used to create living walls. Fig. 4.1 Scientists investigated how three different designs of living wall, design A, design B and design C, affect diversity. Ten of each design were attached to a sea wall at the mean low water mark. The scientists recorded the total number of individuals of all species found on each design and on a control area after 12 months. Simpson’s index of diversity was used to calculate the diversity of each design. The equation for Simpson’s index of diversity is given below: n 2 D = 1 -c / ` j m N ∑ = sum of (total) n = number of individuals of each different species N = the total number of individuals of all species The results for design C are shown in Table 4.1. Table 4.1 number of individuals of n n 2 species ` j each different species (n) N N 1 34 0.168 0.028 2 7 0.035 0.001 3 21 0.104 0.011 4 6 0.030 0.001 5 37 0.183 0.033 6 12 0.059 0.003 7 59 0.292 0.085 8 19 0.094 0.009 9 7 0.035 0.001 total number of individuals 202 of all species (N) (a) Suggest what the scientists used for the control area. ................................................................................................................................................... ................................................................................................................................................... ................................................................................................................................................... ............................................................................................................................................. [2] (b) (i) Use the information in Table 4.1 to calculate D for design C. D = ............................................................... [2] (ii) Table 4.2 shows the values for Simpson’s index of diversity (D) in design A, design B and in the control area. Table 4.2 design A design B control area Simpson’s index of diversity (D) 0.674 0.818 0.143 Compare the effectiveness of designs A and B for increasing diversity. Use the values for D from Table 4.2 to support your answer. ........................................................................................................................................... ........................................................................................................................................... ........................................................................................................................................... ........................................................................................................................................... ........................................................................................................................................... ..................................................................................................................................... [3] (iii) Evaluate the extent to which the results from this investigation support the idea that living walls increase diversity on human made structures. ........................................................................................................................................... ........................................................................................................................................... ........................................................................................................................................... ........................................................................................................................................... ........................................................................................................................................... ..................................................................................................................................... [3] (c) Suggest reasons why the different designs shown in Fig. 4.1 affect the diversity of the sea wall. ................................................................................................................................................... ................................................................................................................................................... ................................................................................................................................................... ................................................................................................................................................... ................................................................................................................................................... ............................................................................................................................................. [3] (d) State three examples of the benefits that marine biodiversity provides. 1 ................................................................................................................................................ ................................................................................................................................................... 2 ................................................................................................................................................ ................................................................................................................................................... 3 ................................................................................................................................................ ................................................................................................................................................... [3] [Total: 16]
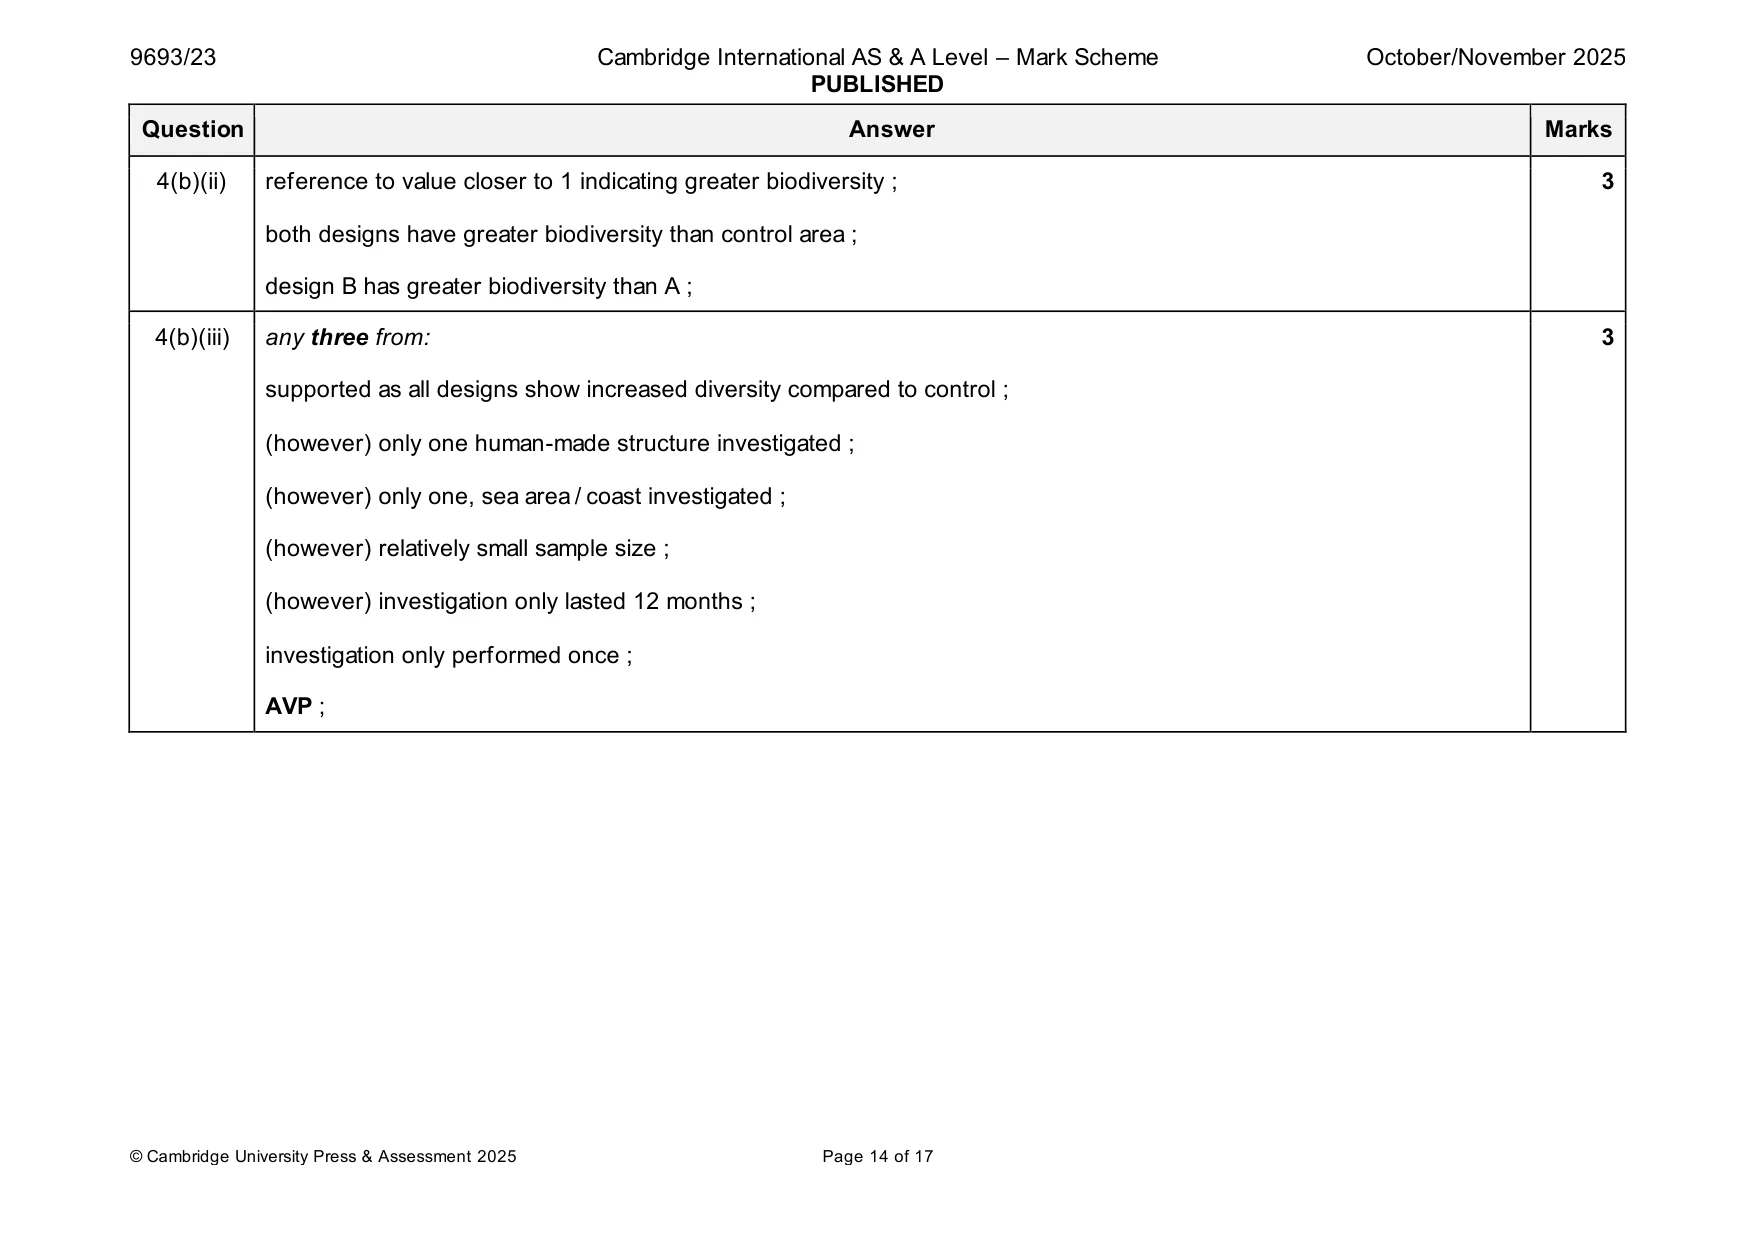
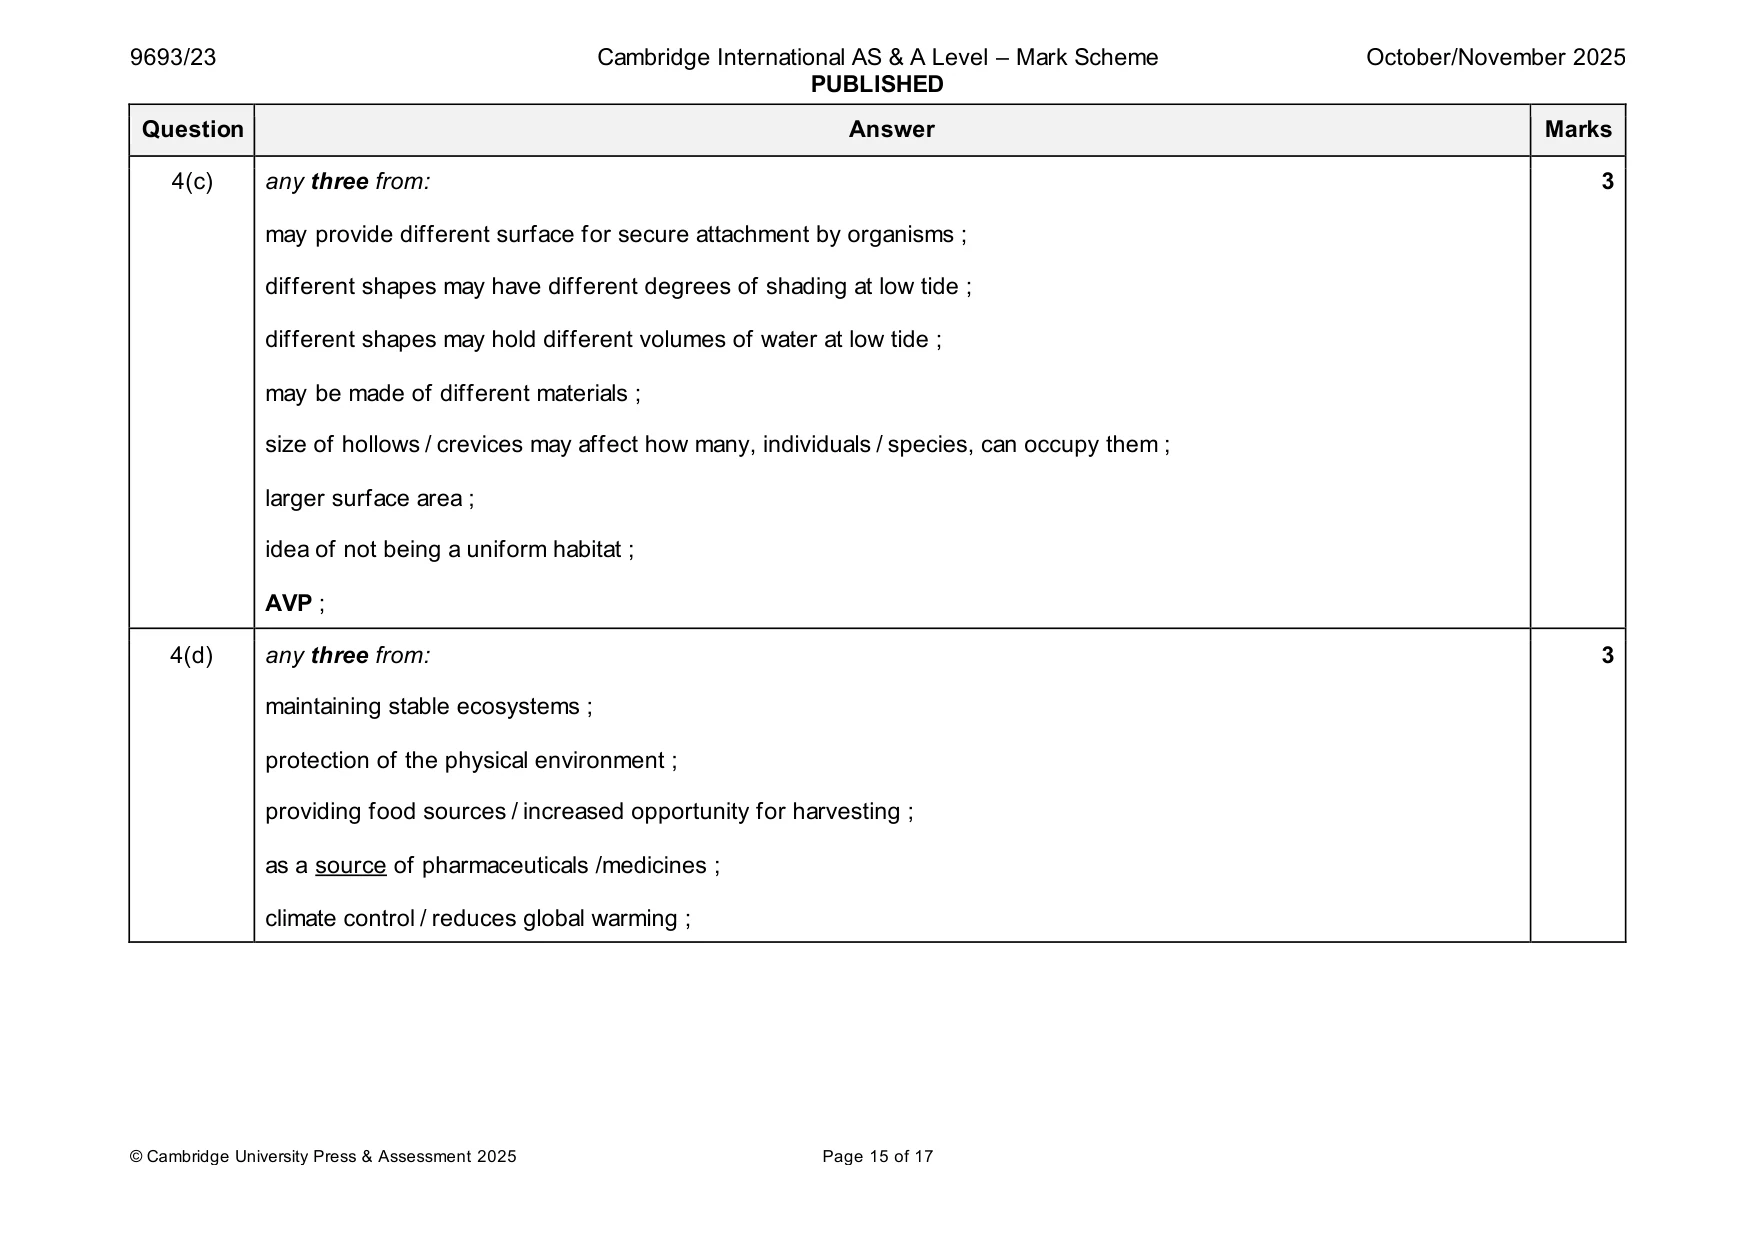
Mark scheme: 4(a) bare, sea wall / human-made surface ; 2 of same size area / at same depth ; 4(b)(i) 0.172 ; 2 1 – 0.172 = 0.828 ; 4(b)(ii) reference to value closer to 1 indicating greater biodiversity ; 3 both designs have greater biodiversity than control area ; design B has greater biodiversity than A ; 4(b)(iii) any three from: 3 supported as all designs show increased diversity compared to control ; (however) only one human-made structure investigated ; (however) only one, sea area / coast investigated ; (however) relatively small sample size ; (however) investigation only lasted 12 months ; investigation only performed once ; AVP ; 4(c) any three from: 3 may provide different surface for secure attachment by organisms ; different shapes may have different degrees of shading at low tide ; different shapes may hold different volumes of water at low tide ; may be made of different materials ; size of hollows / crevices may affect how many, individuals / species, can occupy them ; larger surface area ; idea of not being a uniform habitat ; AVP ; 4(d) any three from: 3 maintaining stable ecosystems ; protection of the physical environment ; providing food sources / increased opportunity for harvesting ; as a source of pharmaceuticals /medicines ; climate control / reduces global warming ;
Q5 · Weathering and erosion affect the shape and structure of coastlines and shores
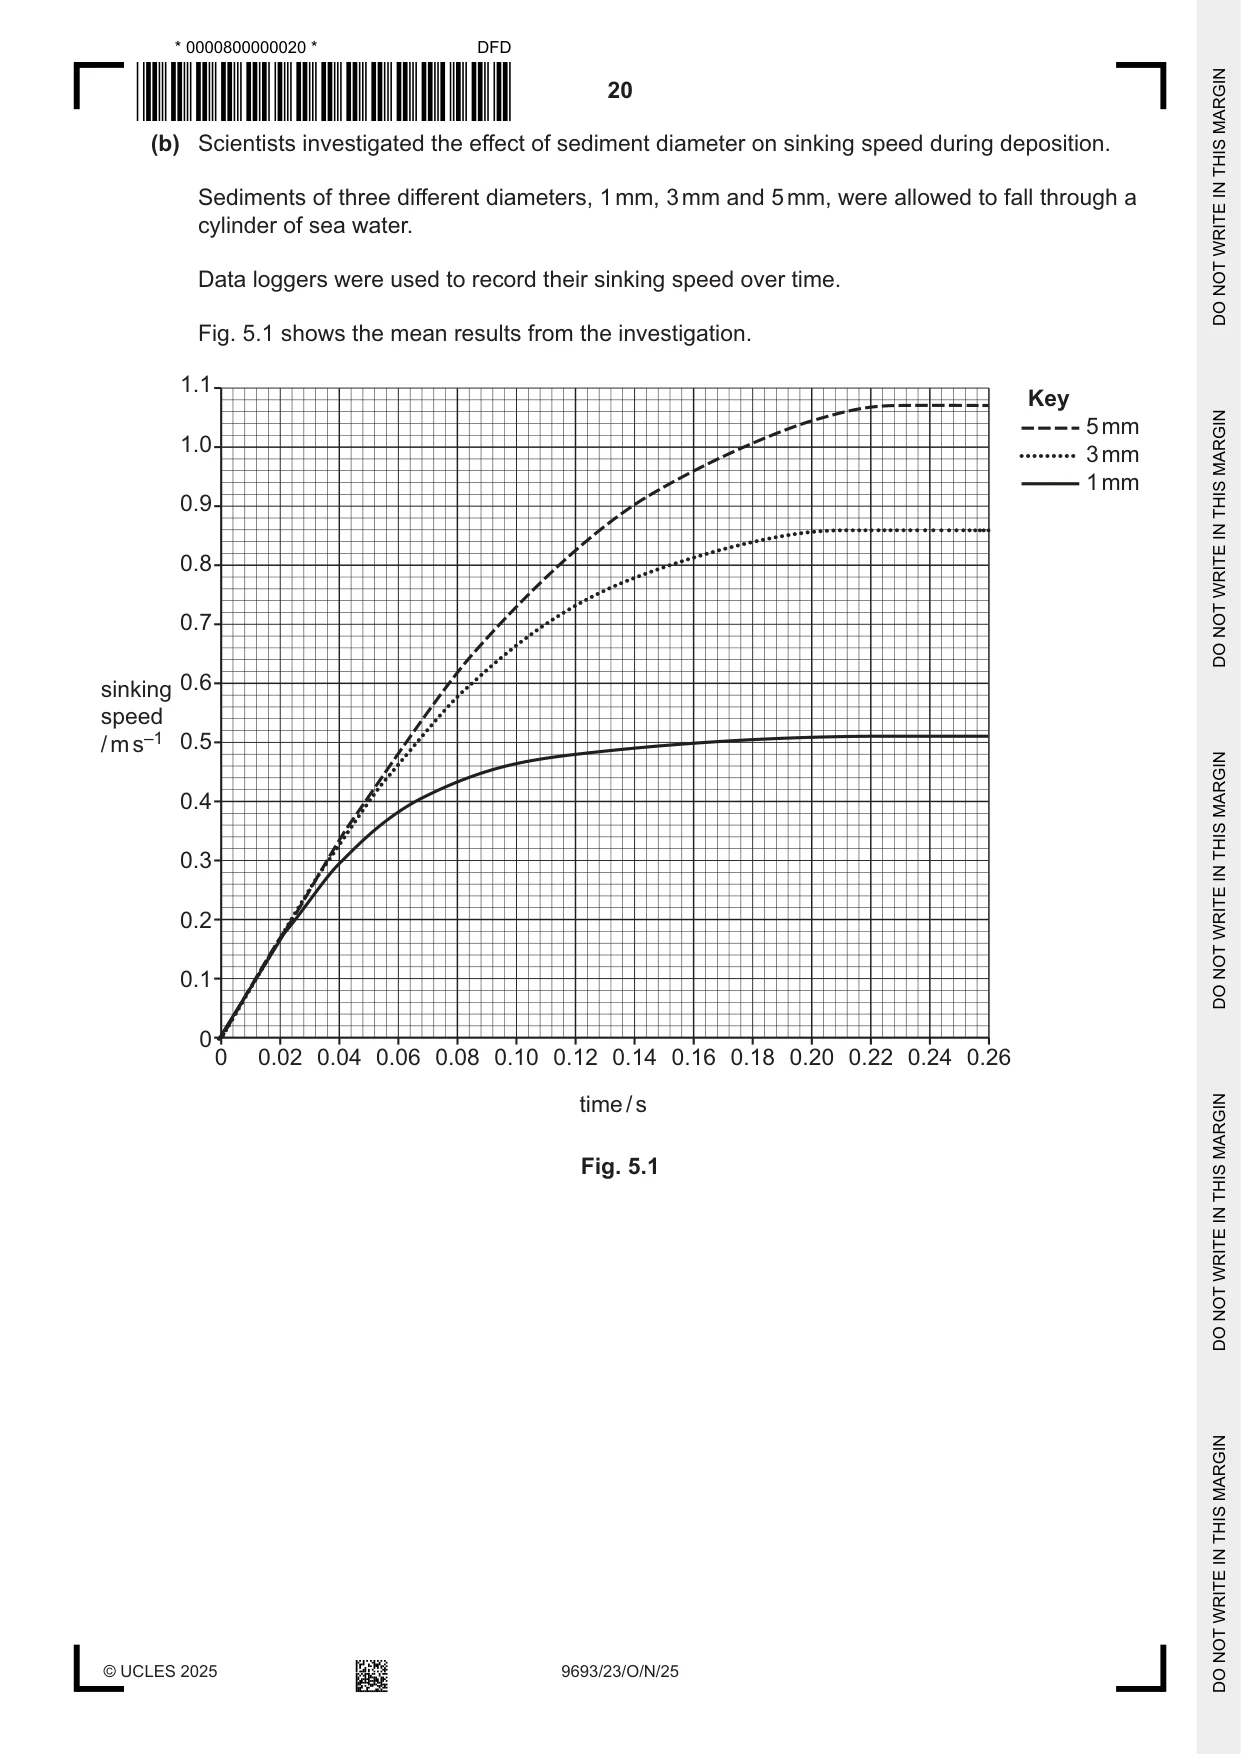
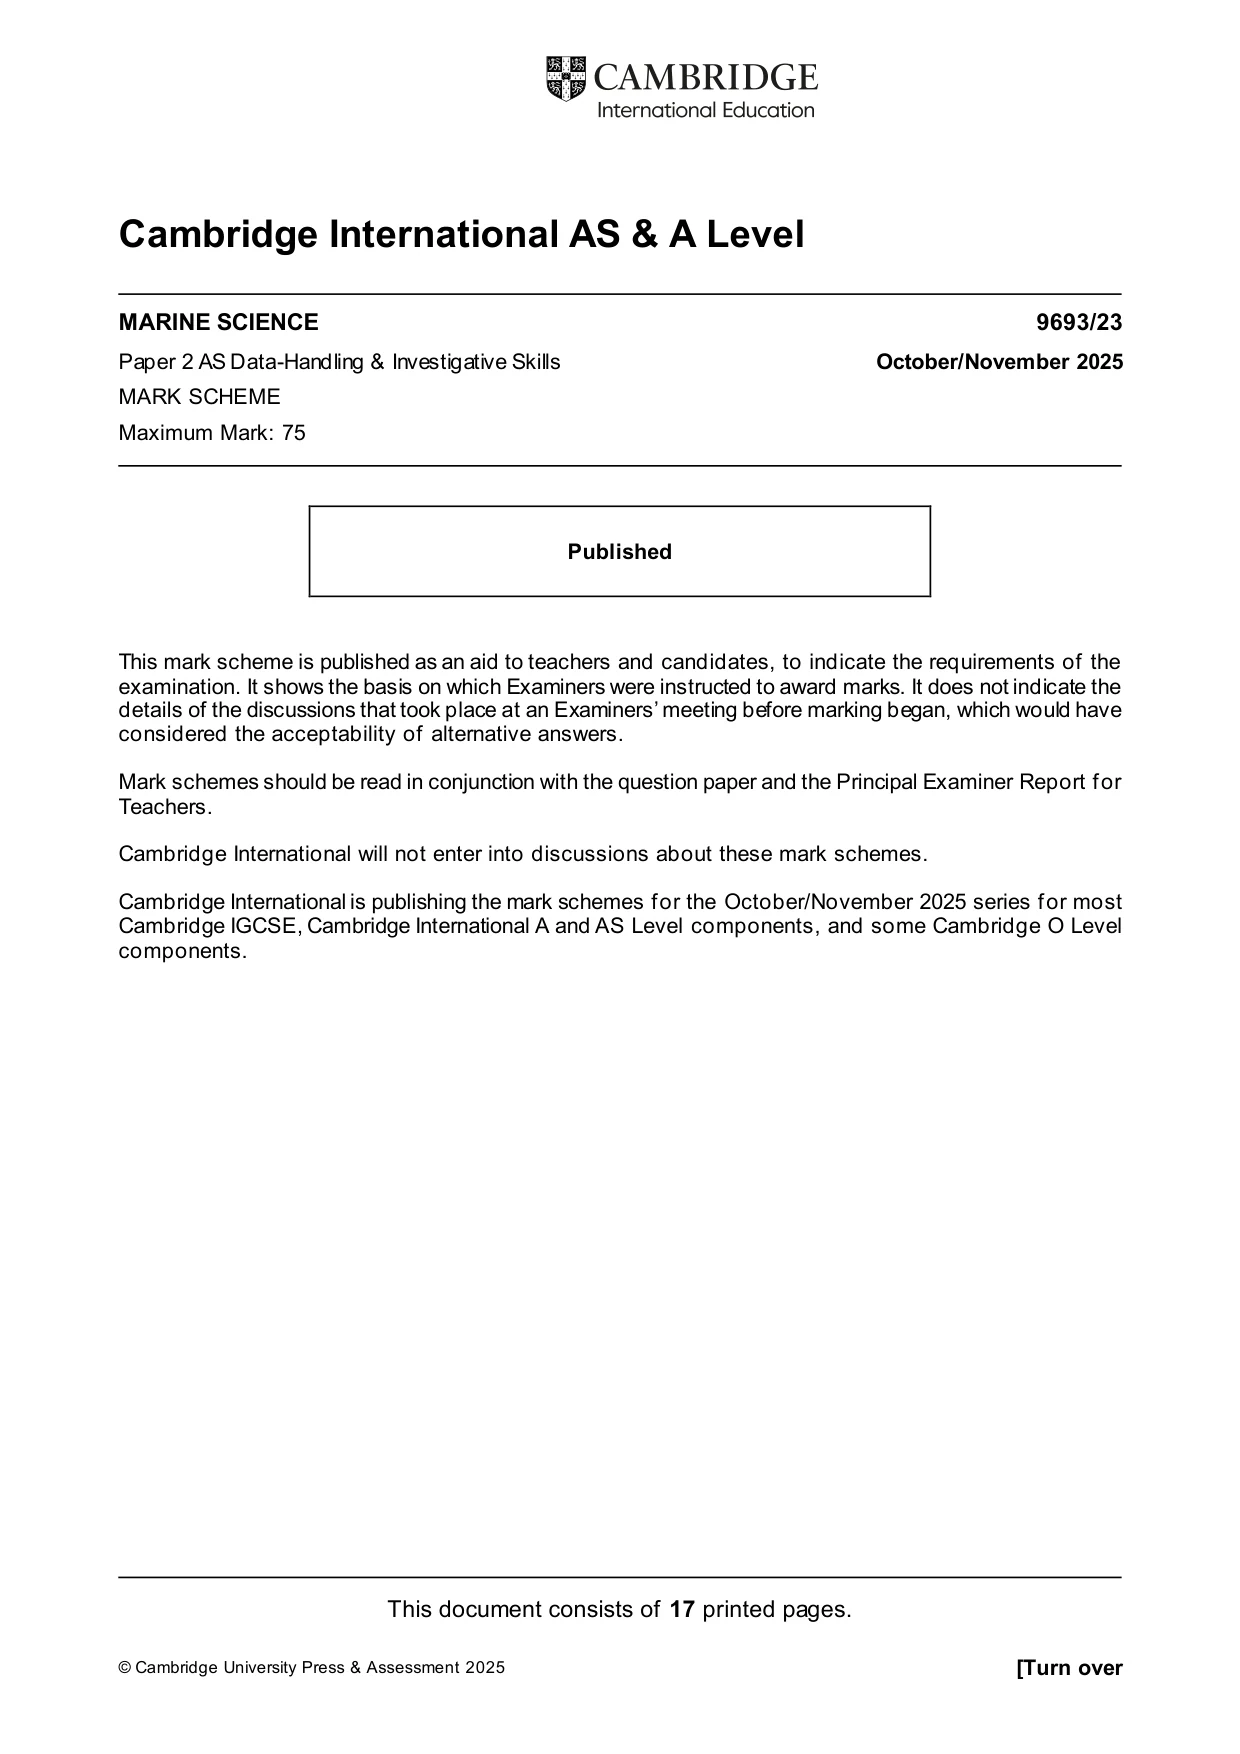
5 Weathering and erosion affect the shape and structure of coastlines and shores. (a) (i) Explain the difference between weathering and erosion. ........................................................................................................................................... ........................................................................................................................................... ........................................................................................................................................... ..................................................................................................................................... [2] (ii) Erosion can be caused by the action of water. State two other causes of erosion. 1 ........................................................................................................................................ 2 ........................................................................................................................................ [2] (b) Scientists investigated the effect of sediment diameter on sinking speed during deposition. Sediments of three different diameters, 1 mm, 3 mm and 5 mm, were allowed to fall through a cylinder of sea water. Data loggers were used to record their sinking speed over time. Fig. 5.1 shows the mean results from the investigation. 1.1 Key 5mm 1.0 3mm 1mm 0.9 0.8 0.7 0.6sinking speed /ms–1 0.5 0.4 0.3 0.2 0.1 0 0 0.02 0.04 0.06 0.08 0.10 0.12 0.14 0.16 0.18 0.20 0.22 0.24 0.26 time/s Fig. 5.1 (i) Calculate the maximum difference in sinking speed for sediments of 1 mm and 5 mm diameter. difference in sinking speed = ................................................ m s–1 [1] (ii) Use Fig. 5.1 to compare the effect of sediment diameter on sinking speed. ........................................................................................................................................... ........................................................................................................................................... ........................................................................................................................................... ........................................................................................................................................... ........................................................................................................................................... ..................................................................................................................................... [3] (iii) Suggest one factor, other than diameter, that will affect the sinking speed of sediments. ........................................................................................................................................... ..................................................................................................................................... [1] (c) Mangrove forests are tidal ecosystems which have a major influence on biodiversity and the distribution of sediments. (i) Explain how mangrove forests affect the distribution of sediments. ........................................................................................................................................... ........................................................................................................................................... ........................................................................................................................................... ..................................................................................................................................... [2] (ii) Other than increasing biodiversity, explain the ecological importance of mangrove forests trapping sediments. ........................................................................................................................................... ........................................................................................................................................... ........................................................................................................................................... ..................................................................................................................................... [2] [Total: 13]
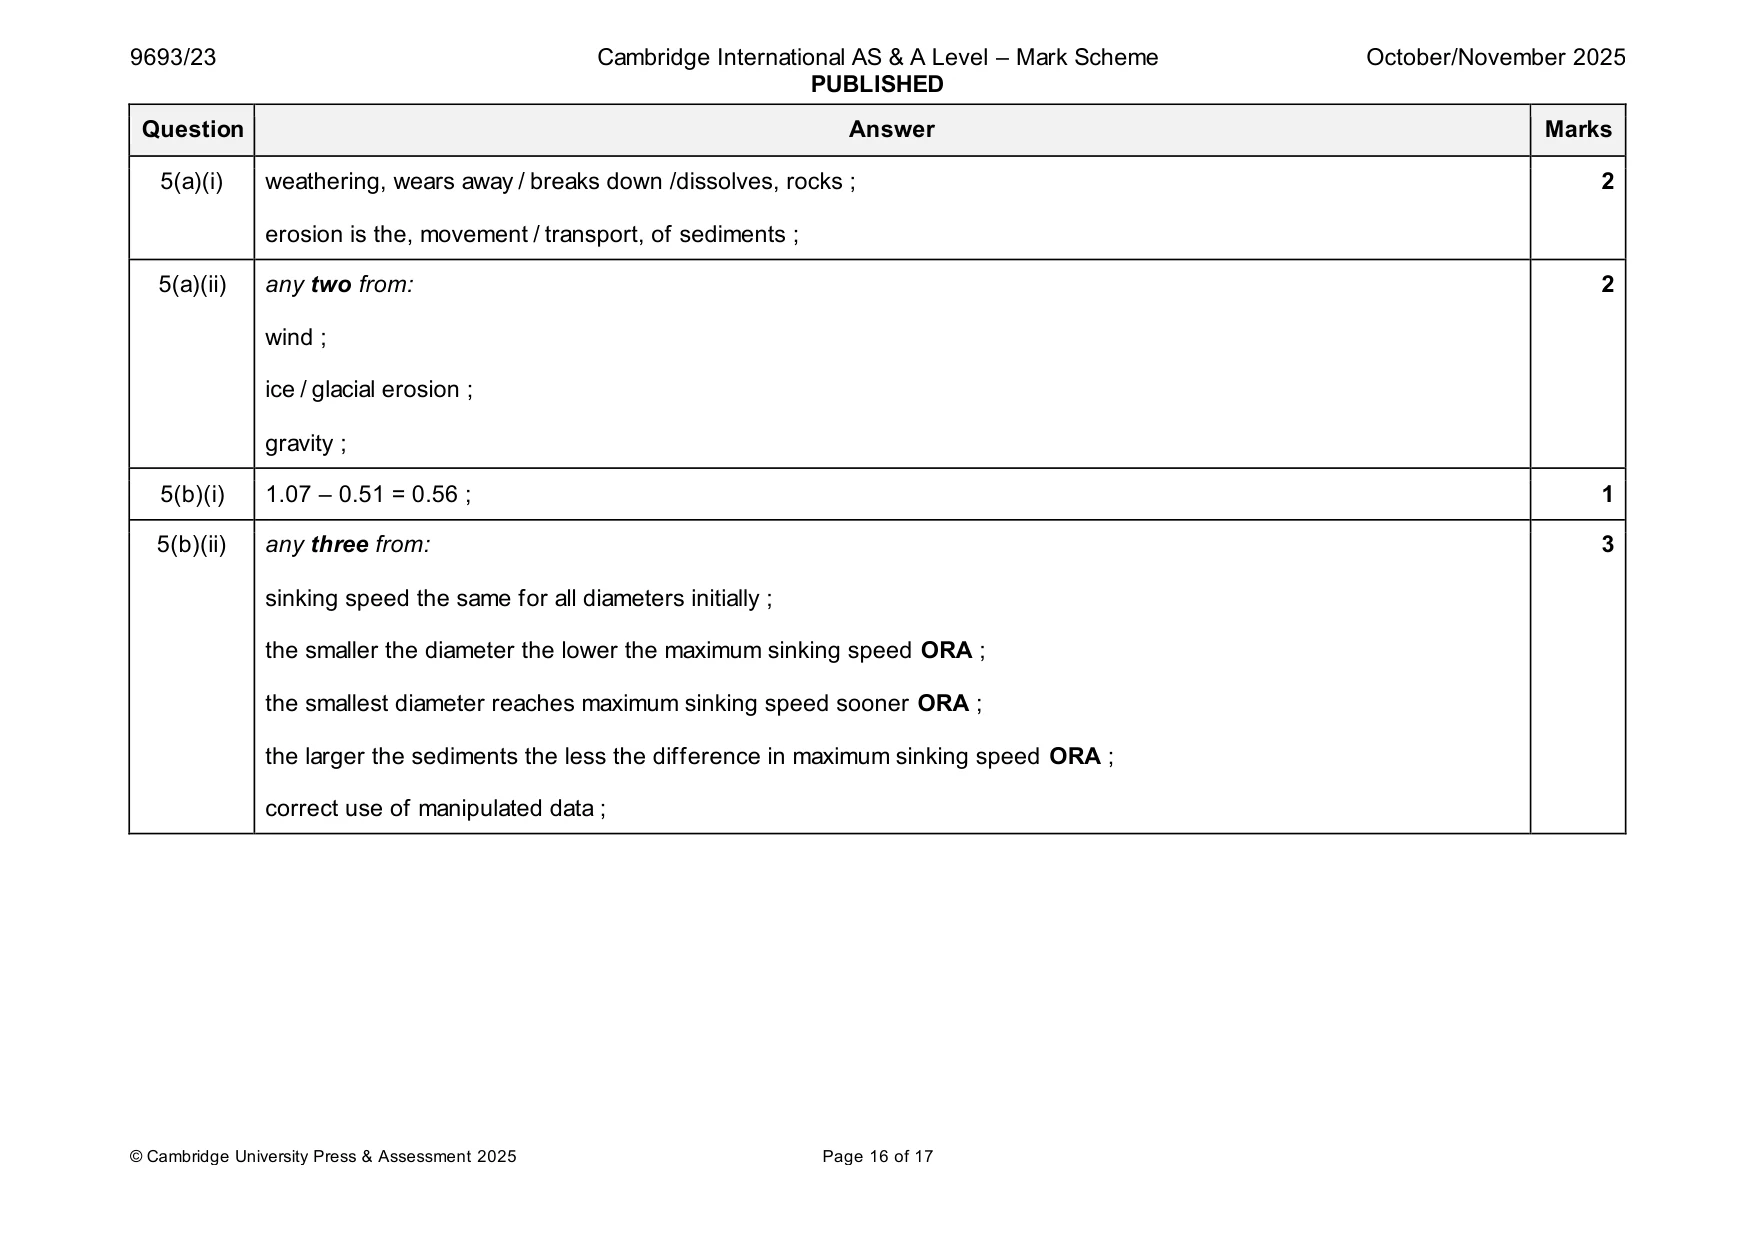
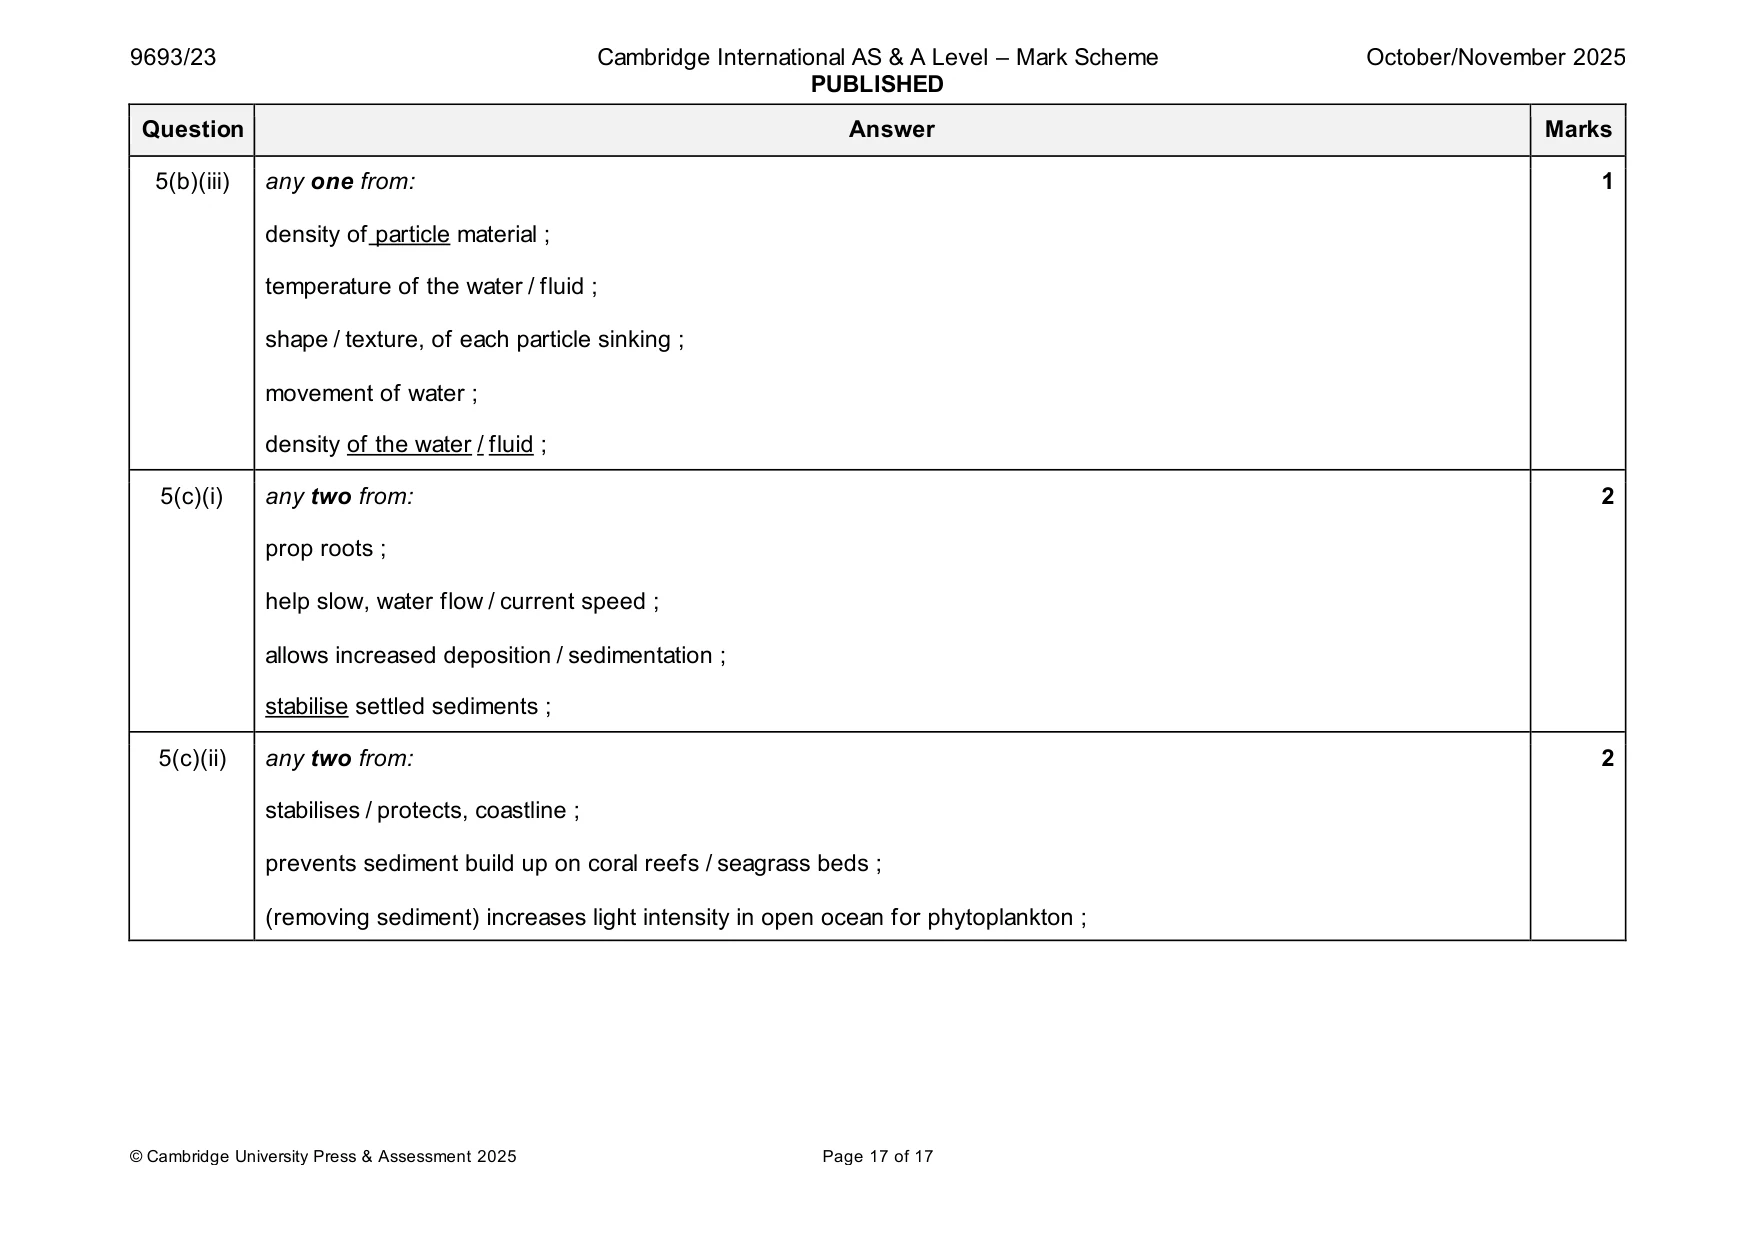
Mark scheme: 5(a)(i) weathering, wears away / breaks down /dissolves, rocks ; 2 erosion is the, movement / transport, of sediments ; 5(a)(ii) any two from: 2 wind ; ice / glacial erosion ; gravity ; 5(b)(i) 1.07 – 0.51 = 0.56 ; 1 5(b)(ii) any three from: 3 sinking speed the same for all diameters initially ; the smaller the diameter the lower the maximum sinking speed ORA ; the smallest diameter reaches maximum sinking speed sooner ORA ; the larger the sediments the less the difference in maximum sinking speed ORA ; correct use of manipulated data ; 5(b)(iii) any one from: 1 density of particle material ; temperature of the water / fluid ; shape / texture, of each particle sinking ; movement of water ; density of the water / fluid ; 5(c)(i) any two from: 2 prop roots ; help slow, water flow / current speed ; allows increased deposition / sedimentation ; stabilise settled sediments ; 5(c)(ii) any two from: 2 stabilises / protects, coastline ; prevents sediment build up on coral reefs / seagrass beds ; (removing sediment) increases light intensity in open ocean for phytoplankton ;
What was in this paper
The subtopics covered by these 5 questions, and how many questions each got. Open one in a new tab to see every Cambridge question on it.
What you needed in this session
Cambridge’s own grade thresholds for 2025 Oct/Nov, Paper 2 · Variant 3. A higher threshold means an easier paper — the bar moves with how the cohort did.