Cambridge A Level Geography 9696 — 2022 Oct/Nov Paper 2 · Variant 1
9696/21/O/N/22 · 6 questions · 60 marks · ≈68 min
The question paper and its mark scheme, free to read here and free to download. This is Cambridge’s own paper, exactly as it was sat.
Question paper4 pages

Mark scheme19 pages
Answers below. Sit the paper first if you are practising.




Questions as text
Q1 · Levels of food security for HICs, MICs and LICs in 2018
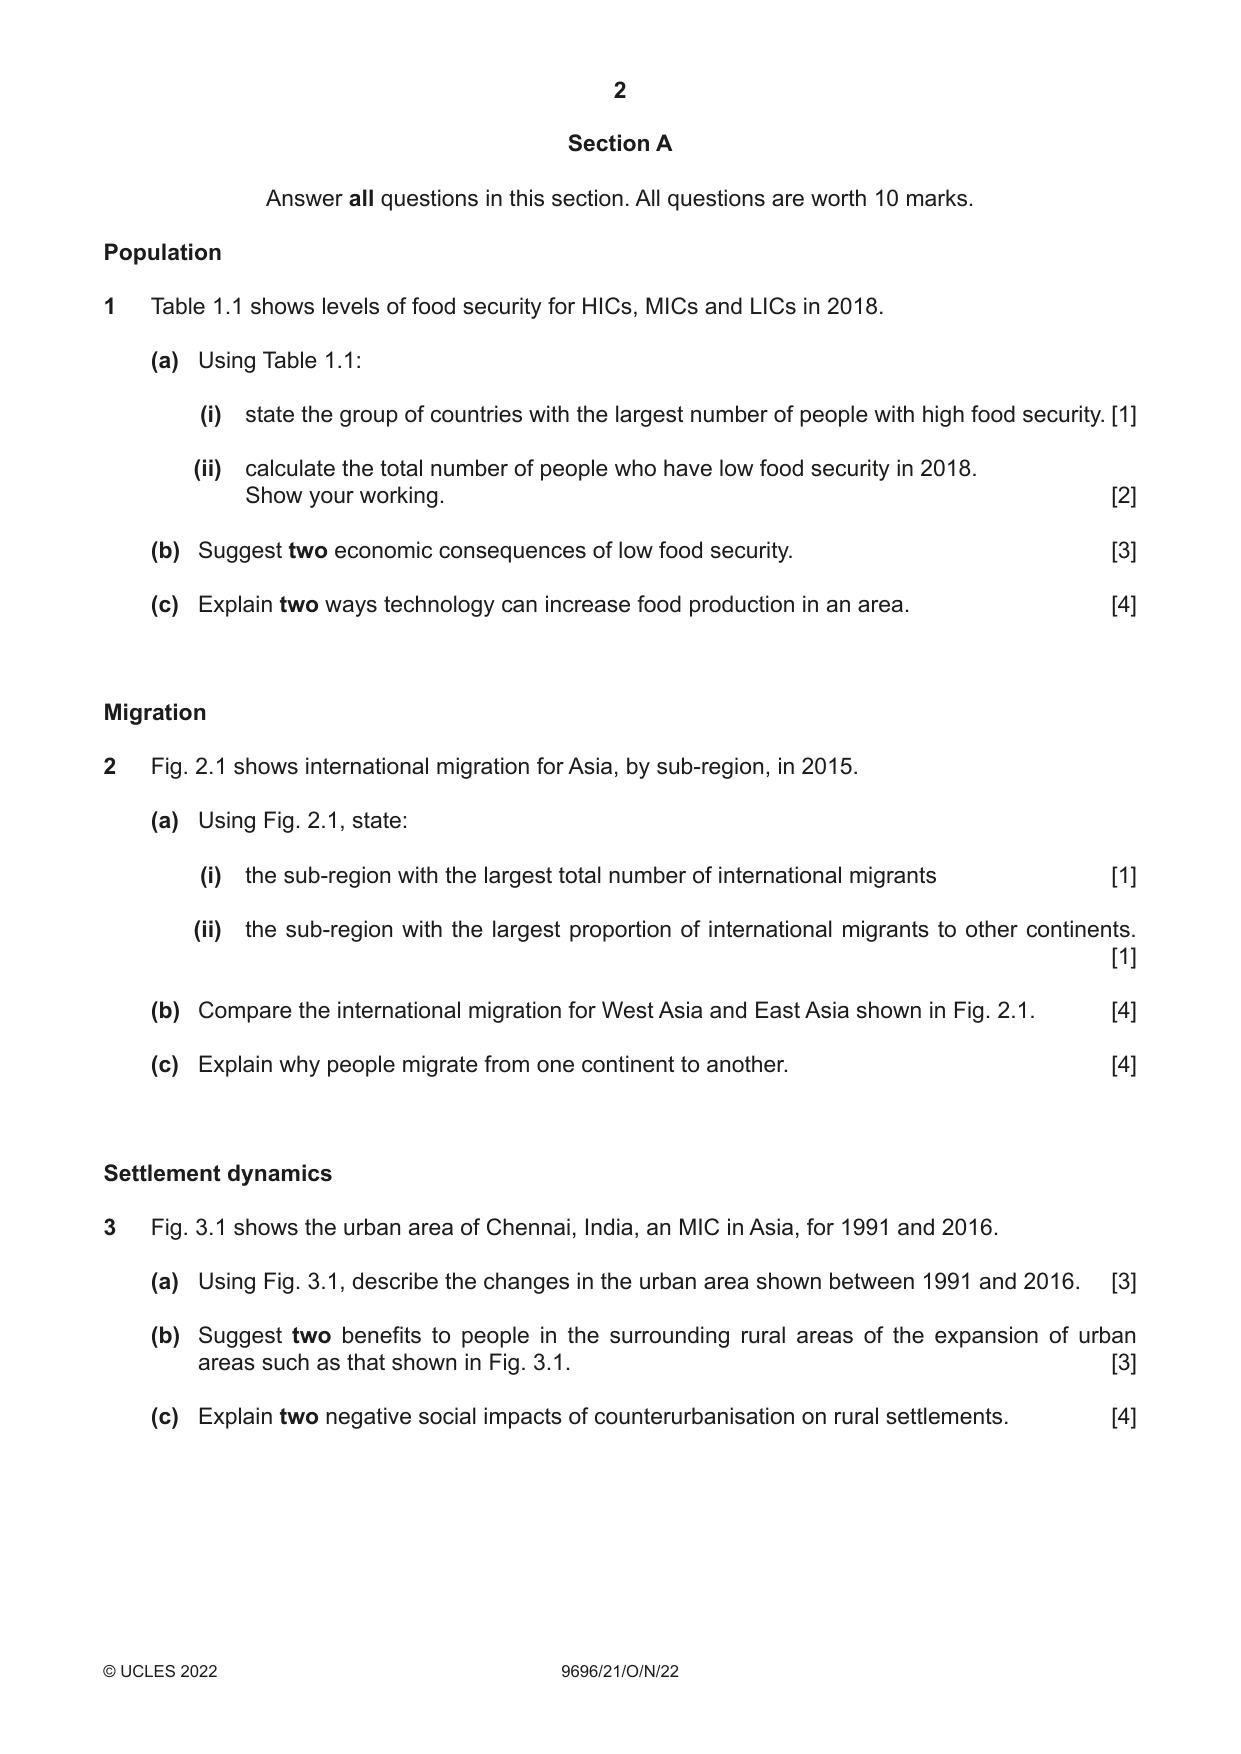
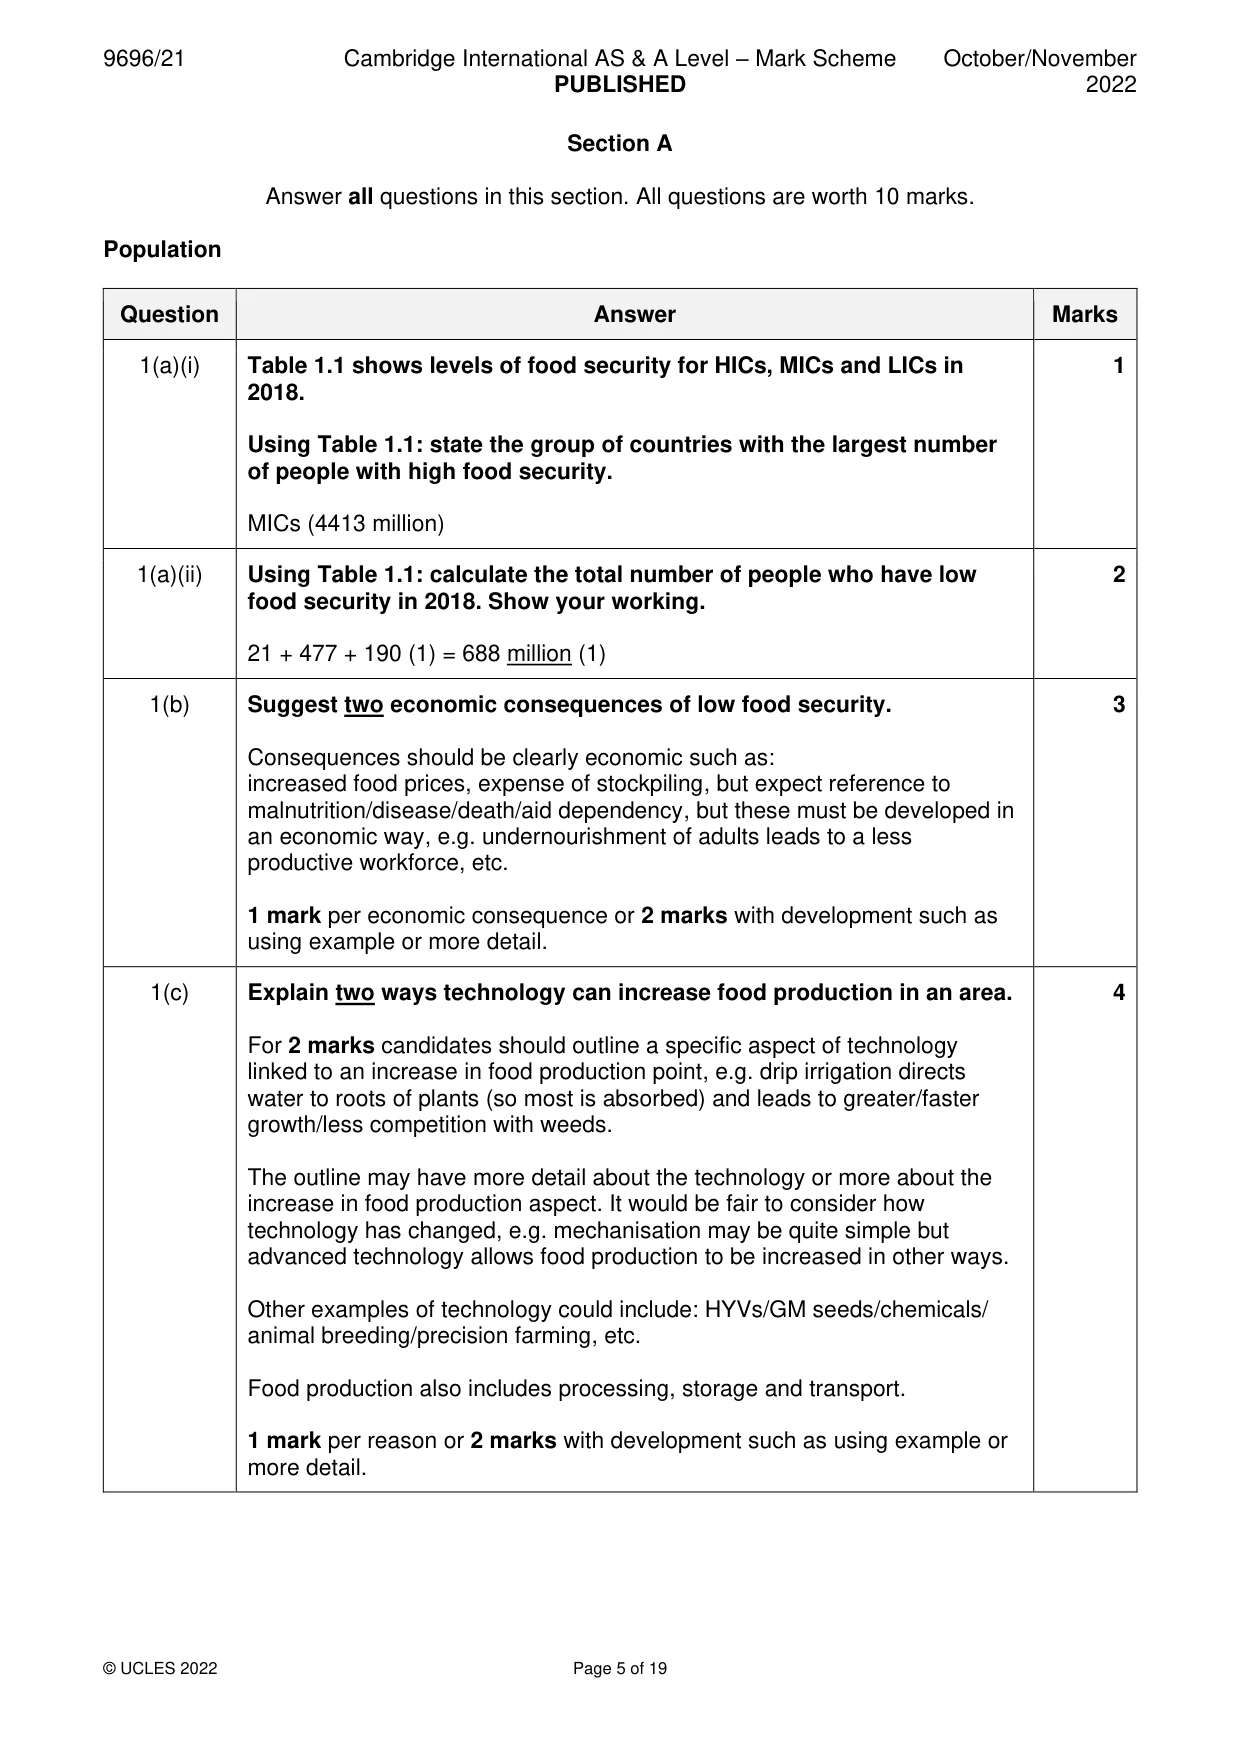
1 Table 1.1 shows levels of food security for HICs, MICs and LICs in 2018. (a) Using Table 1.1: (i) state the group of countries with the largest number of people with high food security. [1] (ii) calculate the total number of people who have low food security in 2018. Show your working. [2] (b) Suggest two economic consequences of low food security. [3] (c) Explain two ways technology can increase food production in an area. [4] Migration
Mark scheme: Question Answer Marks 1(a)(i) Table 1.1 shows levels of food security for HICs, MICs and LICs in 1 2018. Using Table 1.1: state the group of countries with the largest number of people with high food security. MICs (4413 million) 1(a)(ii) Using Table 1.1: calculate the total number of people who have low 2 food security in 2018. Show your working. 21 + 477 + 190 (1) = 688 million (1) 1(b) Suggest two economic consequences of low food security. 3 Consequences should be clearly economic such as: increased food prices, expense of stockpiling, but expect reference to malnutrition/disease/death/aid dependency, but these must be developed in an economic way, e.g. undernourishment of adults leads to a less productive workforce, etc. 1 mark per economic consequence or 2 marks with development such as using example or more detail. 1(c) Explain two ways technology can increase food production in an area. 4 For 2 marks candidates should outline a specific aspect of technology linked to an increase in food production point, e.g. drip irrigation directs water to roots of plants (so most is absorbed) and leads to greater/faster growth/less competition with weeds. The outline may have more detail about the technology or more about the increase in food production aspect. It would be fair to consider how technology has changed, e.g. mechanisation may be quite simple but advanced technology allows food production to be increased in other ways. Other examples of technology could include: HYVs/GM seeds/chemicals/ animal breeding/precision farming, etc. Food production also includes processing, storage and transport. 1 mark per reason or 2 marks with development such as using example or more detail. Migration
Q2 · International migration for Asia, by sub-region, in 2015
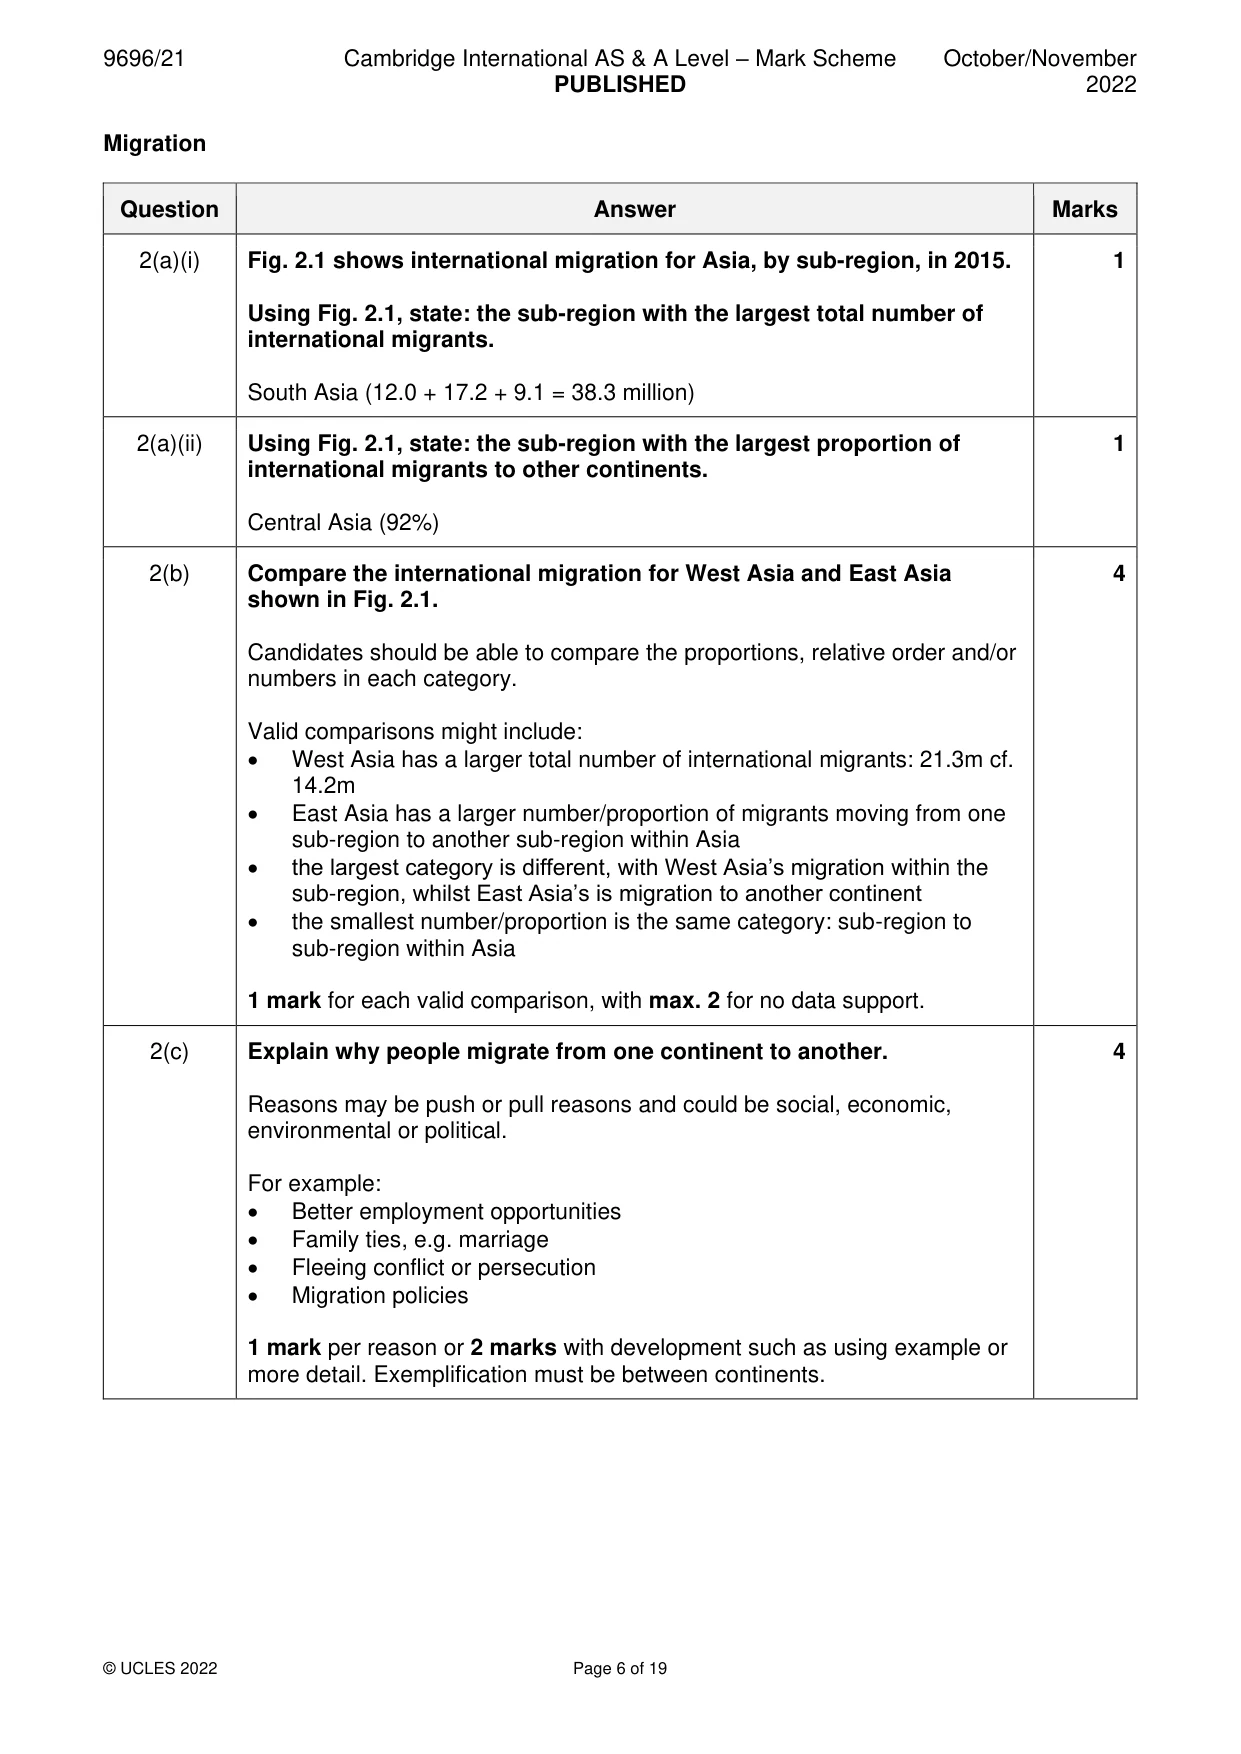
2 Fig. 2.1 shows international migration for Asia, by sub-region, in 2015. (a) Using Fig. 2.1, state: (i) the sub-region with the largest total number of international migrants [1] (ii) the sub-region with the largest proportion of international migrants to other continents. [1] (b) Compare the international migration for West Asia and East Asia shown in Fig. 2.1. [4] (c) Explain why people migrate from one continent to another. [4] Settlement dynamics
Mark scheme: 2(a)(i) Fig. 2.1 shows international migration for Asia, by sub-region, in 2015. 1 Using Fig. 2.1, state: the sub-region with the largest total number of international migrants. South Asia (12.0 + 17.2 + 9.1 = 38.3 million) 2(a)(ii) Using Fig. 2.1, state: the sub-region with the largest proportion of 1 international migrants to other continents. Central Asia (92%) 2(b) Compare the international migration for West Asia and East Asia 4 shown in Fig. 2.1. Candidates should be able to compare the proportions, relative order and/or numbers in each category. Valid comparisons might include: • West Asia has a larger total number of international migrants: 21.3m cf. 14.2m • East Asia has a larger number/proportion of migrants moving from one sub-region to another sub-region within Asia • the largest category is different, with West Asia’s migration within the sub-region, whilst East Asia’s is migration to another continent • the smallest number/proportion is the same category: sub-region to sub-region within Asia 1 mark for each valid comparison, with max. 2 for no data support. 2(c) Explain why people migrate from one continent to another. 4 Reasons may be push or pull reasons and could be social, economic, environmental or political. For example: • Better employment opportunities • Family ties, e.g. marriage • Fleeing conflict or persecution • Migration policies 1 mark per reason or 2 marks with development such as using example or more detail. Exemplification must be between continents. Settlement dynamics
Q3 · The urban area of Chennai, India, an MIC in Asia, for 1991 and 2016
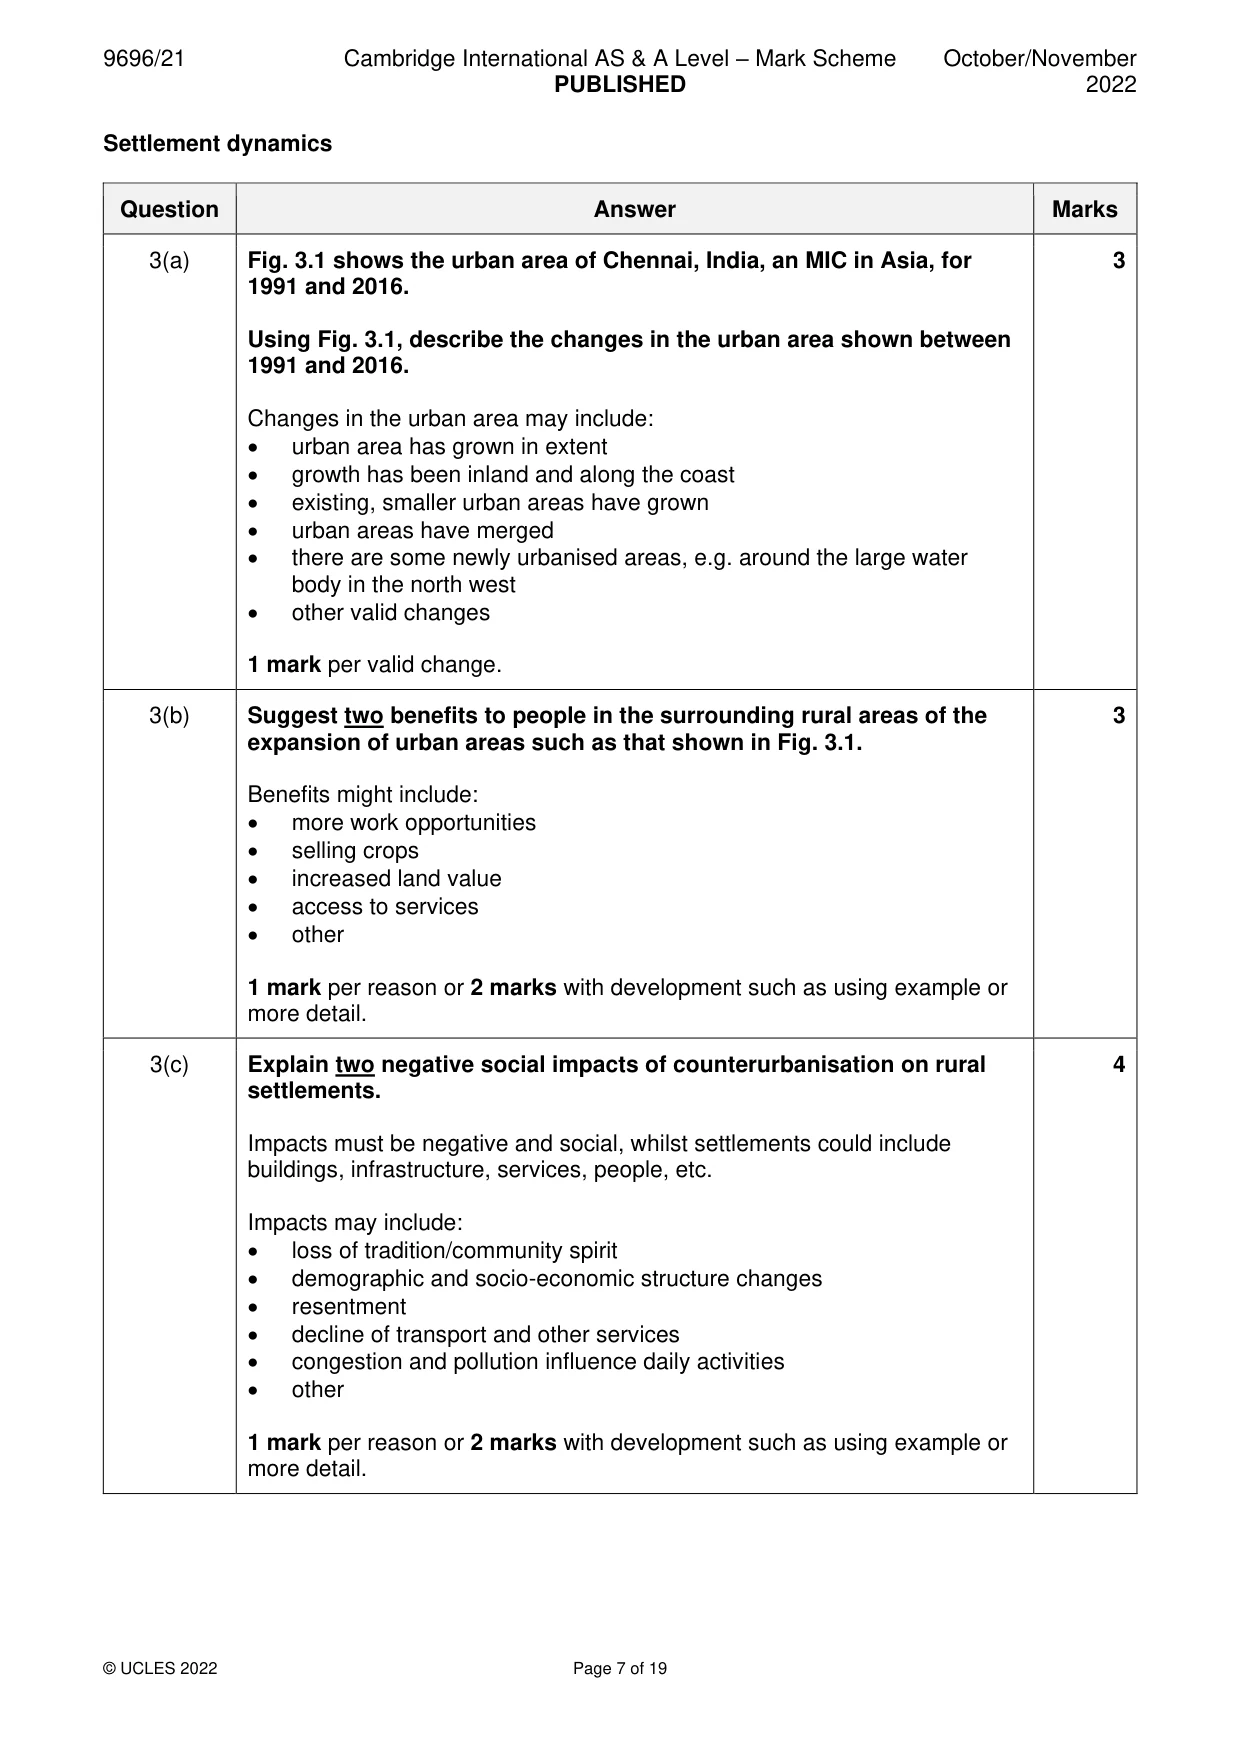
3 Fig. 3.1 shows the urban area of Chennai, India, an MIC in Asia, for 1991 and 2016. (a) Using Fig. 3.1, describe the changes in the urban area shown between 1991 and 2016. [3] (b) Suggest two benefits to people in the surrounding rural areas of the expansion of urban areas such as that shown in Fig. 3.1. [3] (c) Explain two negative social impacts of counterurbanisation on rural settlements. [4]
Mark scheme: 3(a) Fig. 3.1 shows the urban area of Chennai, India, an MIC in Asia, for 3 1991 and 2016. Using Fig. 3.1, describe the changes in the urban area shown between 1991 and 2016. Changes in the urban area may include: • urban area has grown in extent • growth has been inland and along the coast • existing, smaller urban areas have grown • urban areas have merged • there are some newly urbanised areas, e.g. around the large water body in the north west • other valid changes 1 mark per valid change. 3(b) Suggest two benefits to people in the surrounding rural areas of the 3 expansion of urban areas such as that shown in Fig. 3.1. Benefits might include: • more work opportunities • selling crops • increased land value • access to services • other 1 mark per reason or 2 marks with development such as using example or more detail. 3(c) Explain two negative social impacts of counterurbanisation on rural 4 settlements. Impacts must be negative and social, whilst settlements could include buildings, infrastructure, services, people, etc. Impacts may include: • loss of tradition/community spirit • demographic and socio-economic structure changes • resentment • decline of transport and other services • congestion and pollution influence daily activities • other 1 mark per reason or 2 marks with development such as using example or more detail. Section B Answer one question from this section. All questions are worth 30 marks. Population
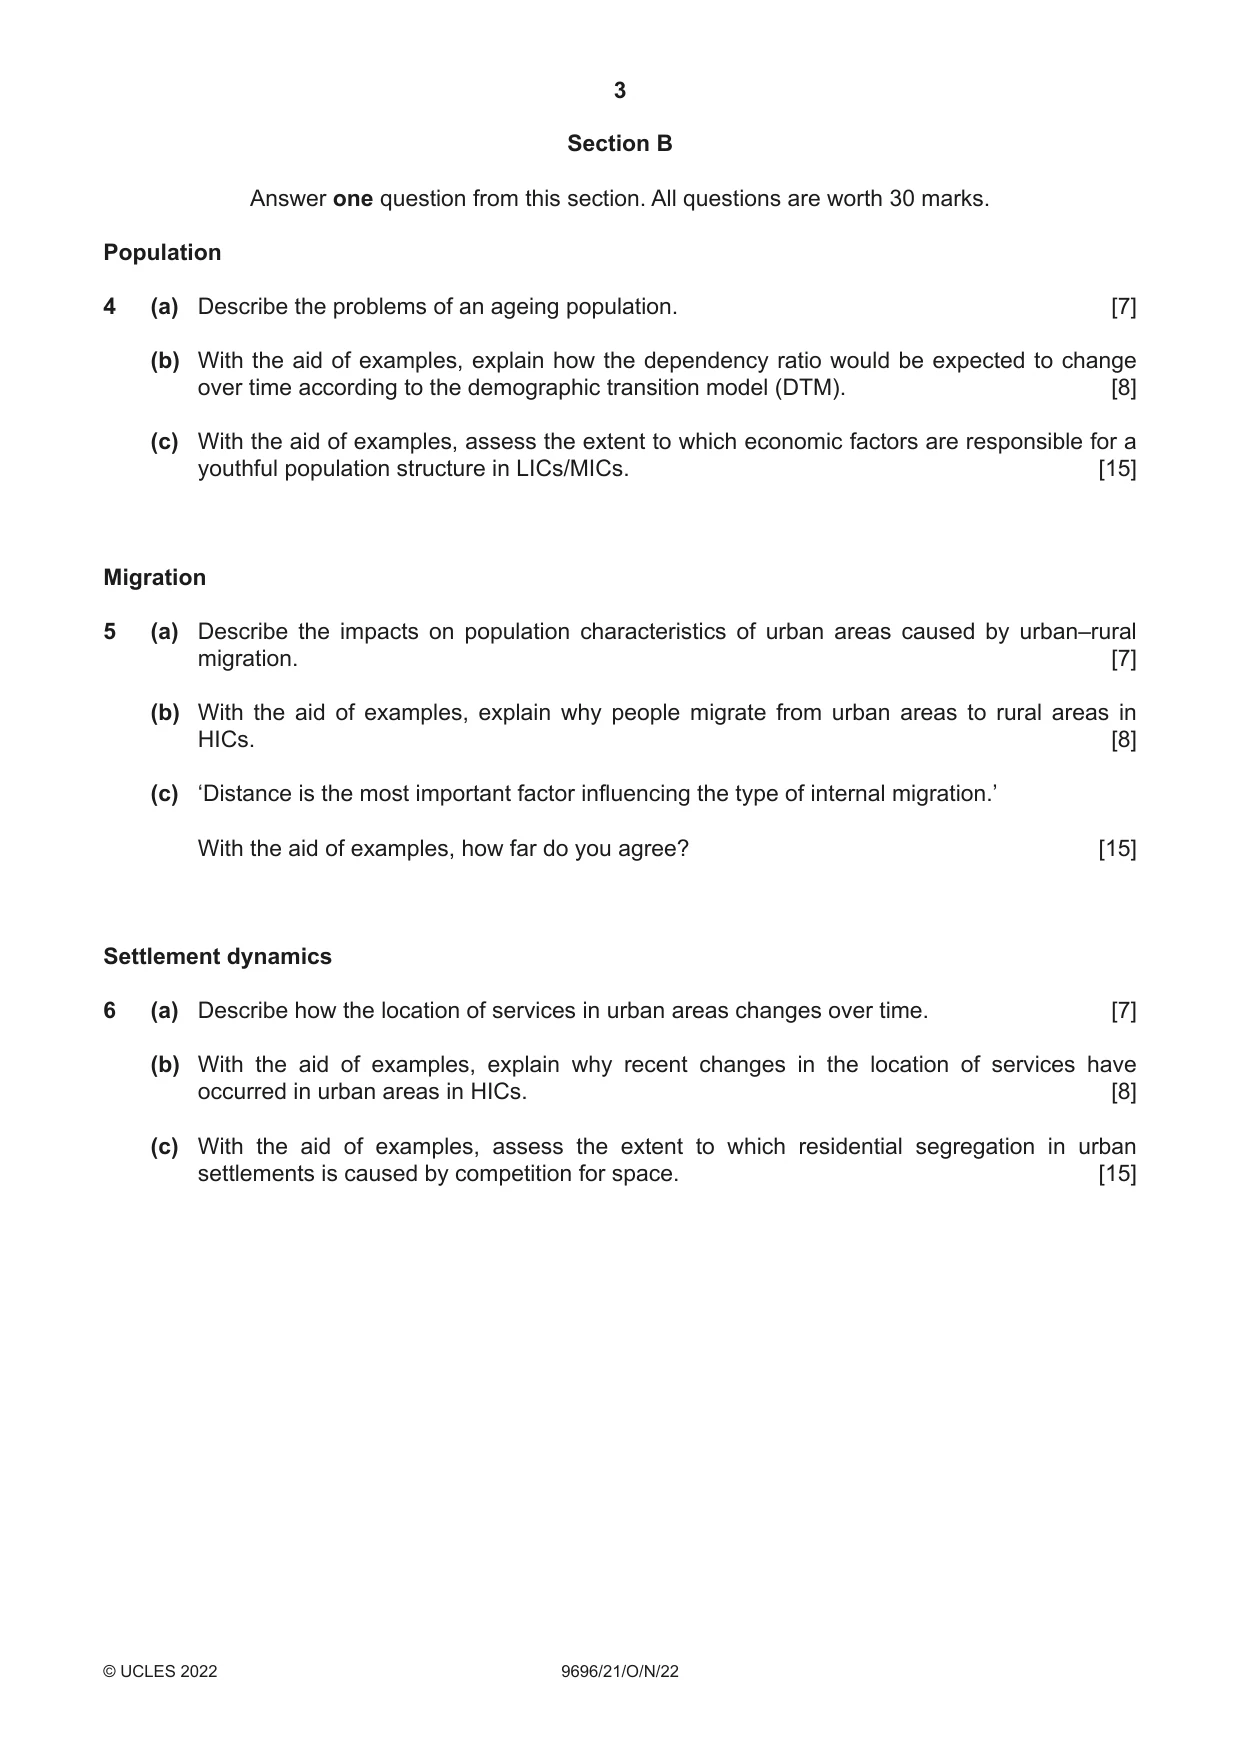
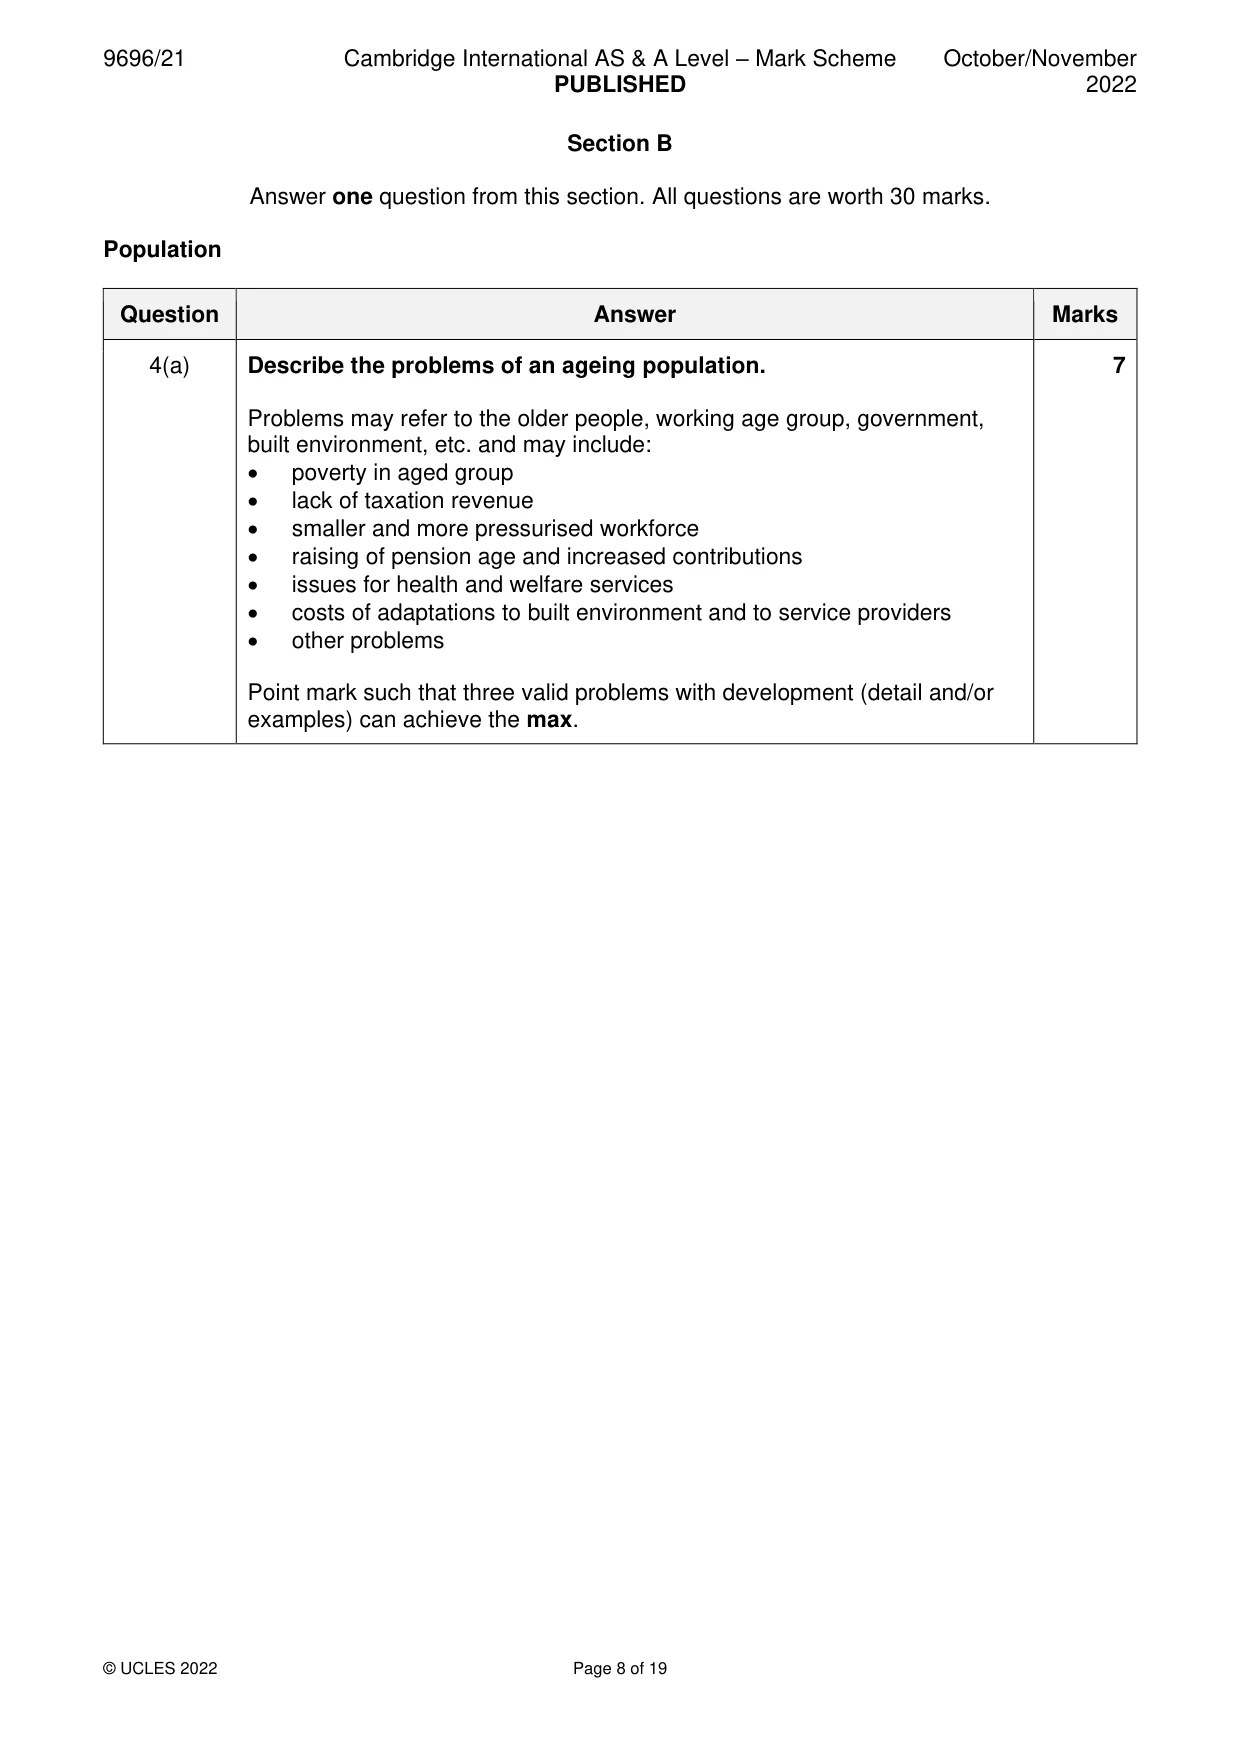
Q4 · Describe the problems of an ageing population
4 (a) Describe the problems of an ageing population. [7] (b) With the aid of examples, explain how the dependency ratio would be expected to change over time according to the demographic transition model (DTM). [8] (c) With the aid of examples, assess the extent to which economic factors are responsible for a youthful population structure in LICs/MICs. [15] Migration
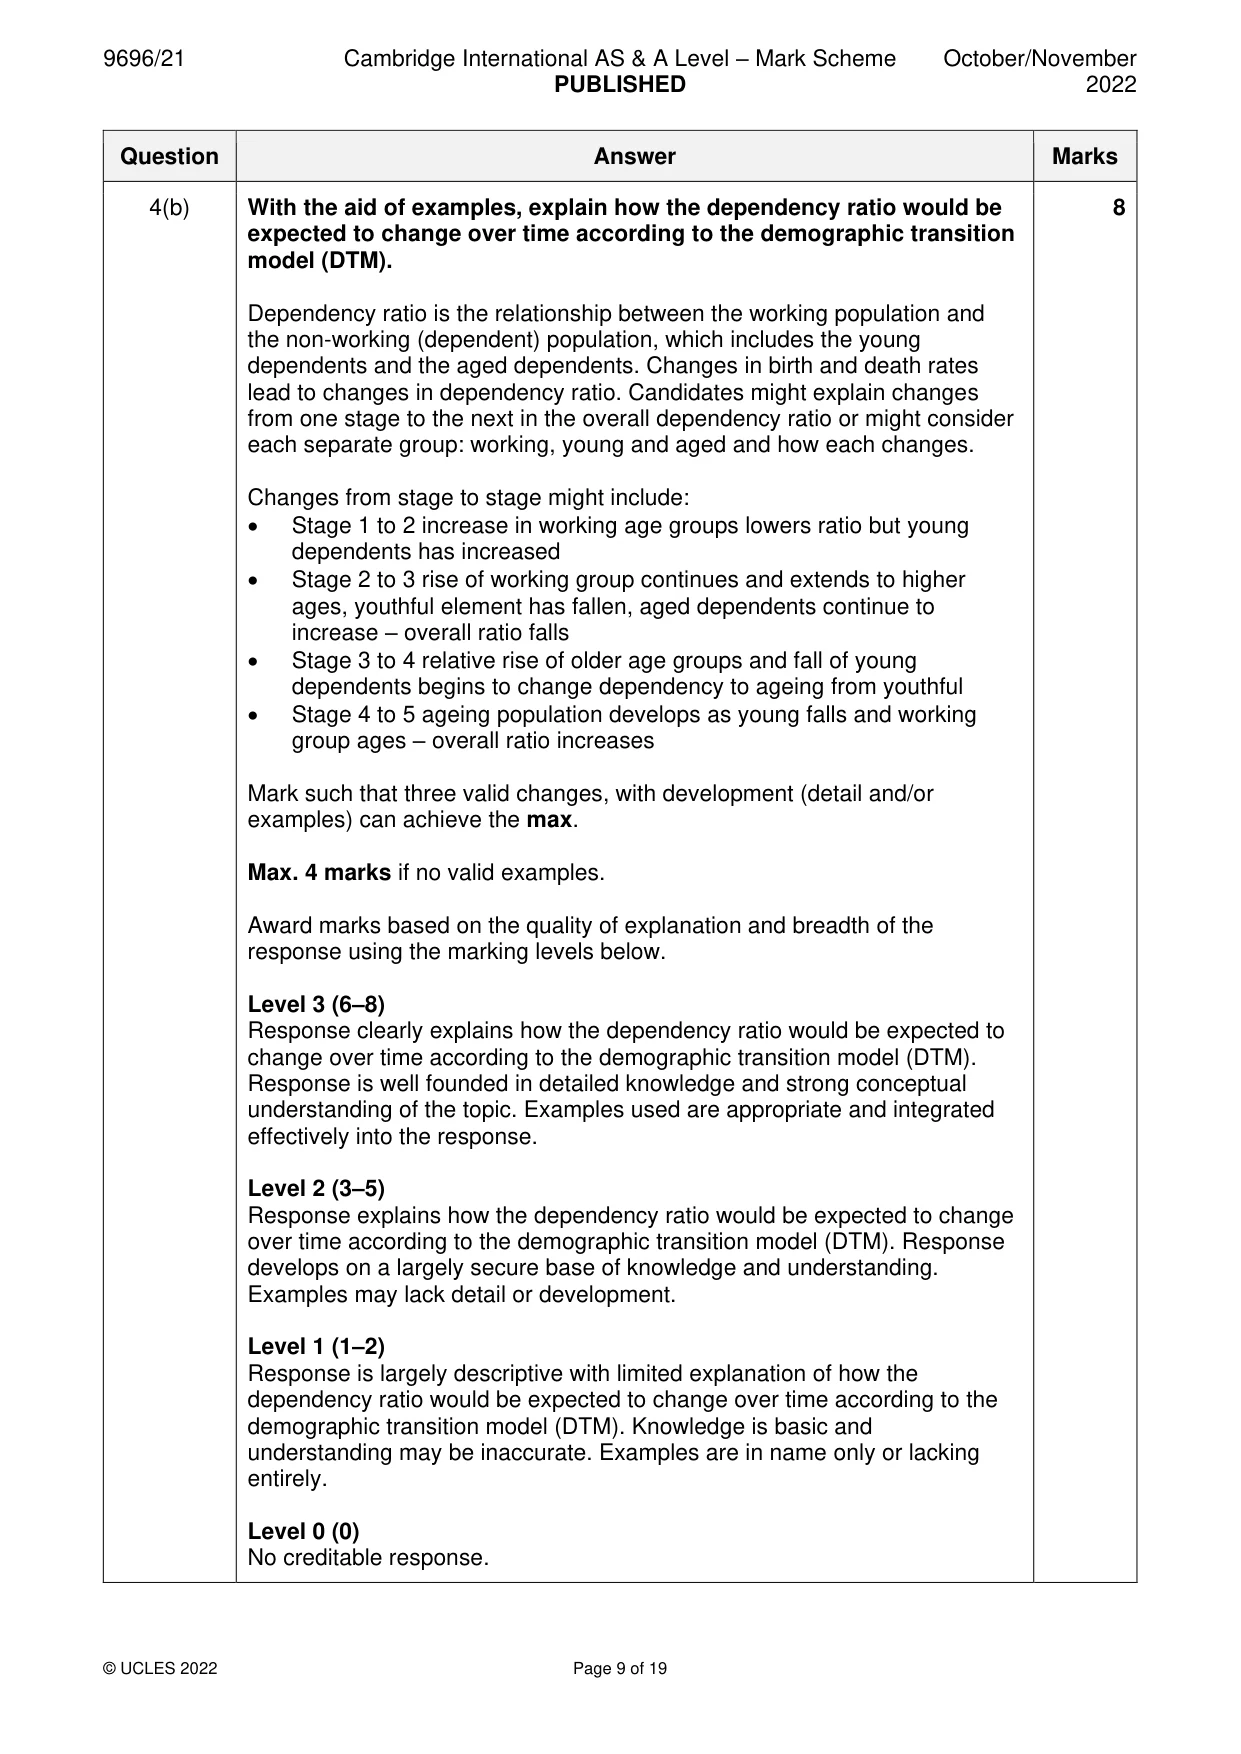
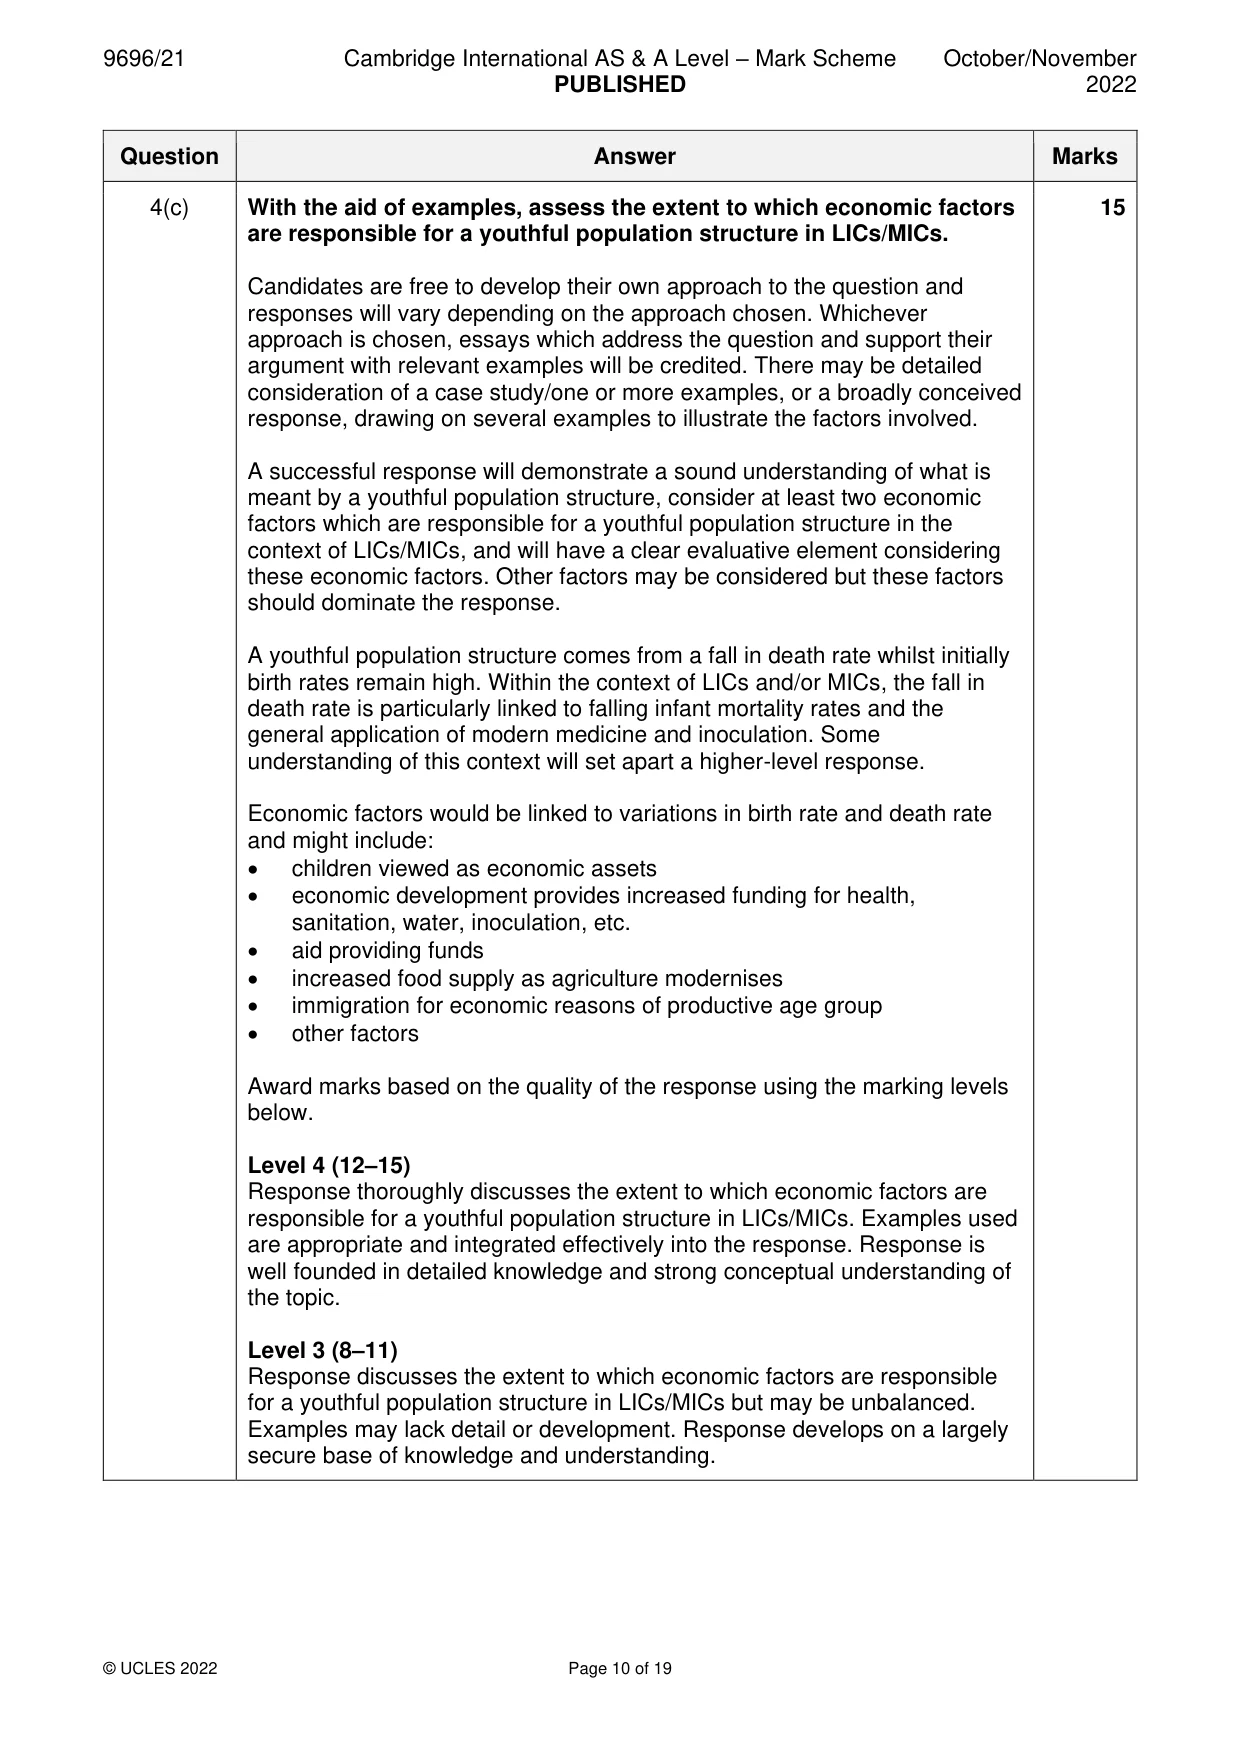
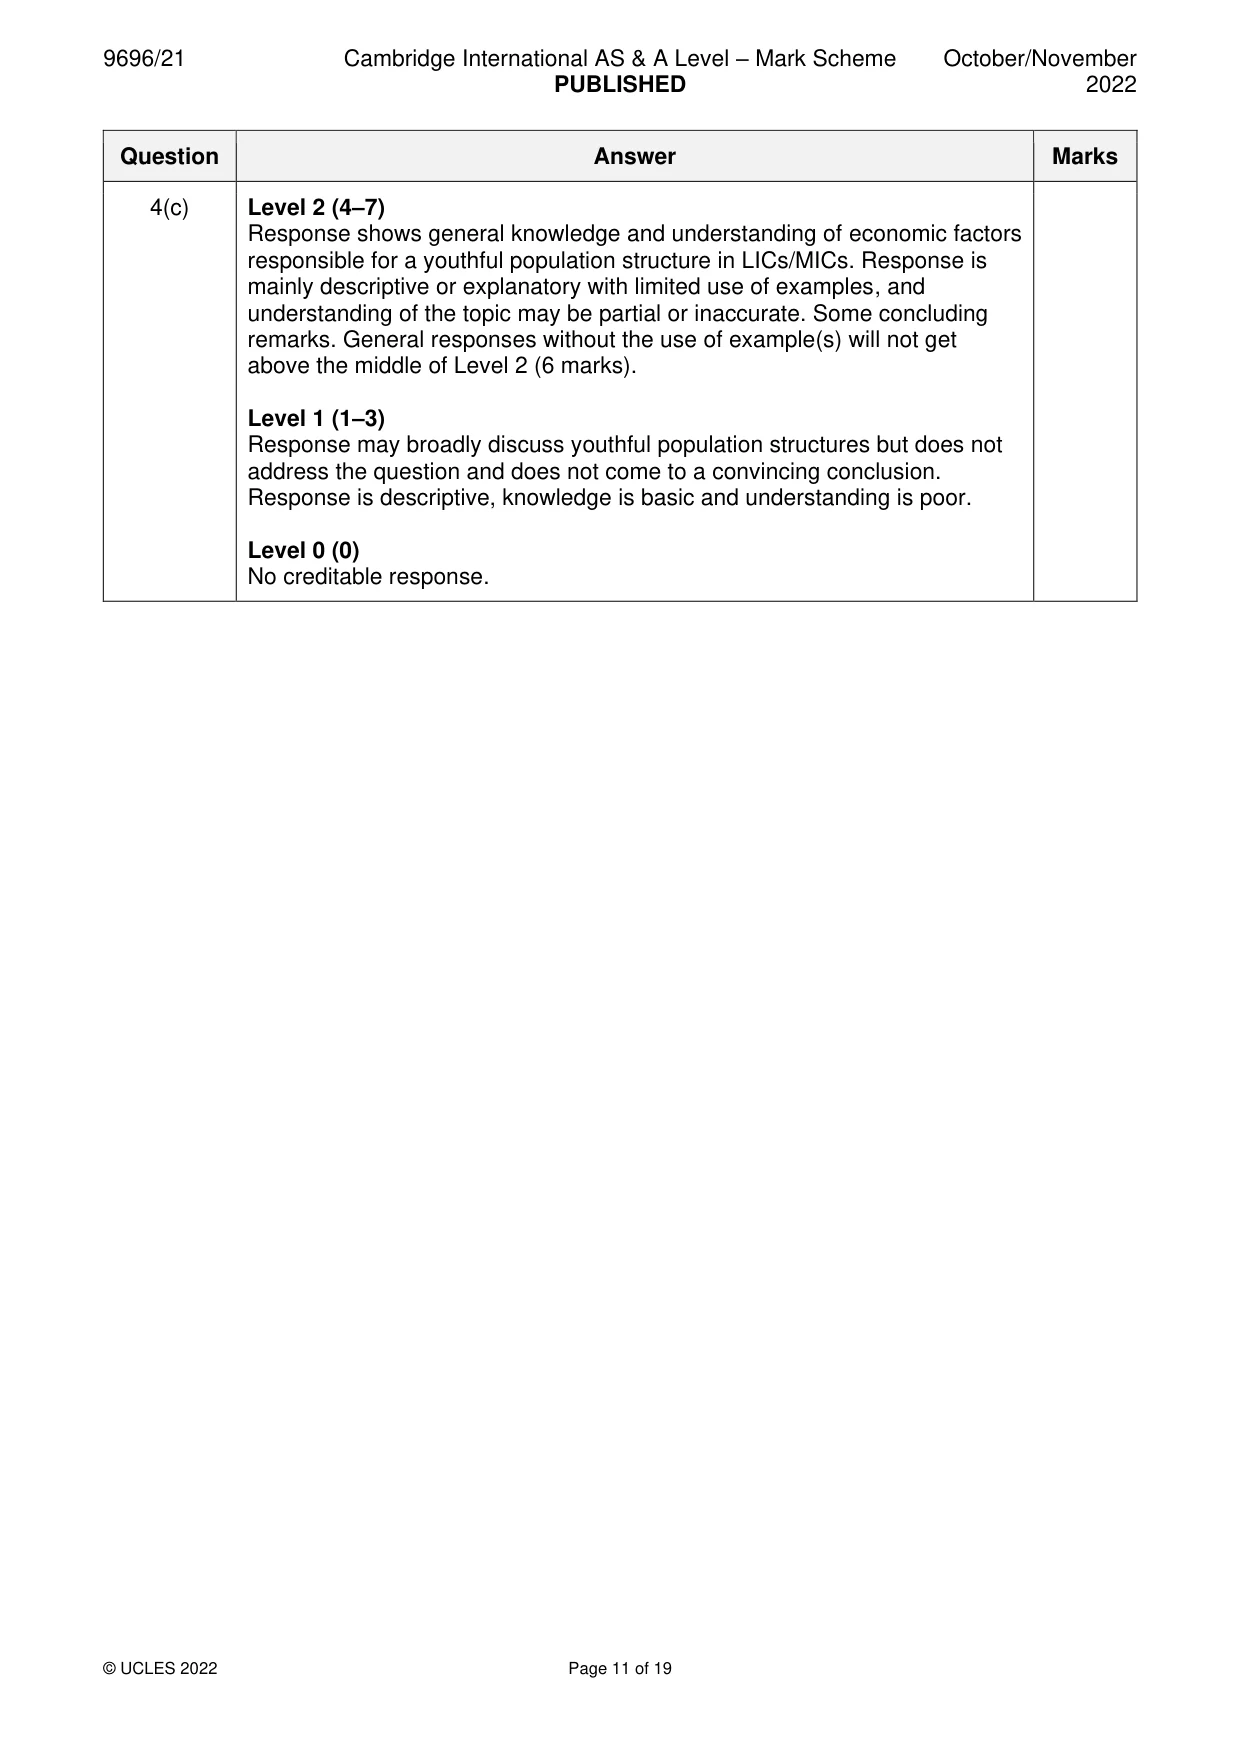
Mark scheme: 4(a) Describe the problems of an ageing population. 7 Problems may refer to the older people, working age group, government, built environment, etc. and may include: • poverty in aged group • lack of taxation revenue • smaller and more pressurised workforce • raising of pension age and increased contributions • issues for health and welfare services • costs of adaptations to built environment and to service providers • other problems Point mark such that three valid problems with development (detail and/or examples) can achieve the max. 4(b) With the aid of examples, explain how the dependency ratio would be 8 expected to change over time according to the demographic transition model (DTM). Dependency ratio is the relationship between the working population and the non-working (dependent) population, which includes the young dependents and the aged dependents. Changes in birth and death rates lead to changes in dependency ratio. Candidates might explain changes from one stage to the next in the overall dependency ratio or might consider each separate group: working, young and aged and how each changes. Changes from stage to stage might include: • Stage 1 to 2 increase in working age groups lowers ratio but young dependents has increased • Stage 2 to 3 rise of working group continues and extends to higher ages, youthful element has fallen, aged dependents continue to increase – overall ratio falls • Stage 3 to 4 relative rise of older age groups and fall of young dependents begins to change dependency to ageing from youthful • Stage 4 to 5 ageing population develops as young falls and working group ages – overall ratio increases Mark such that three valid changes, with development (detail and/or examples) can achieve the max. Max. 4 marks if no valid examples. Award marks based on the quality of explanation and breadth of the response using the marking levels below. Level 3 (6–8) Response clearly explains how the dependency ratio would be expected to change over time according to the demographic transition model (DTM). Response is well founded in detailed knowledge and strong conceptual understanding of the topic. Examples used are appropriate and integrated effectively into the response. Level 2 (3–5) Response explains how the dependency ratio would be expected to change over time according to the demographic transition model (DTM). Response develops on a largely secure base of knowledge and understanding. Examples may lack detail or development. Level 1 (1–2) Response is largely descriptive with limited explanation of how the dependency ratio would be expected to change over time according to the demographic transition model (DTM). Knowledge is basic and understanding may be inaccurate. Examples are in name only or lacking entirely. Level 0 (0) No creditable response. 4(c) With the aid of examples, assess the extent to which economic factors 15 are responsible for a youthful population structure in LICs/MICs. Candidates are free to develop their own approach to the question and responses will vary depending on the approach chosen. Whichever approach is chosen, essays which address the question and support their argument with relevant examples will be credited. There may be detailed consideration of a case study/one or more examples, or a broadly conceived response, drawing on several examples to illustrate the factors involved. A successful response will demonstrate a sound understanding of what is meant by a youthful population structure, consider at least two economic factors which are responsible for a youthful population structure in the context of LICs/MICs, and will have a clear evaluative element considering these economic factors. Other factors may be considered but these factors should dominate the response. A youthful population structure comes from a fall in death rate whilst initially birth rates remain high. Within the context of LICs and/or MICs, the fall in death rate is particularly linked to falling infant mortality rates and the general application of modern medicine and inoculation. Some understanding of this context will set apart a higher-level response. Economic factors would be linked to variations in birth rate and death rate and might include: • children viewed as economic assets • economic development provides increased funding for health, sanitation, water, inoculation, etc. • aid providing funds • increased food supply as agriculture modernises • immigration for economic reasons of productive age group • other factors Award marks based on the quality of the response using the marking levels below. Level 4 (12–15) Response thoroughly discusses the extent to which economic factors are responsible for a youthful population structure in LICs/MICs. Examples used are appropriate and integrated effectively into the response. Response is well founded in detailed knowledge and strong conceptual understanding of the topic. Level 3 (8–11) Response discusses the extent to which economic factors are responsible for a youthful population structure in LICs/MICs but may be unbalanced. Examples may lack detail or development. Response develops on a largely secure base of knowledge and understanding. 4(c) Level 2 (4–7) Response shows general knowledge and understanding of economic factors responsible for a youthful population structure in LICs/MICs. Response is mainly descriptive or explanatory with limited use of examples, and understanding of the topic may be partial or inaccurate. Some concluding remarks. General responses without the use of example(s) will not get above the middle of Level 2 (6 marks). Level 1 (1–3) Response may broadly discuss youthful population structures but does not address the question and does not come to a convincing conclusion. Response is descriptive, knowledge is basic and understanding is poor. Level 0 (0) No creditable response. Migration
Q5 · Describe the impacts on population characteristics of urban areas caused by urban–rural…
5 (a) Describe the impacts on population characteristics of urban areas caused by urban–rural migration. [7] (b) With the aid of examples, explain why people migrate from urban areas to rural areas in HICs. [8] (c) ‘Distance is the most important factor influencing the type of internal migration.’ With the aid of examples, how far do you agree? [15] Settlement dynamics
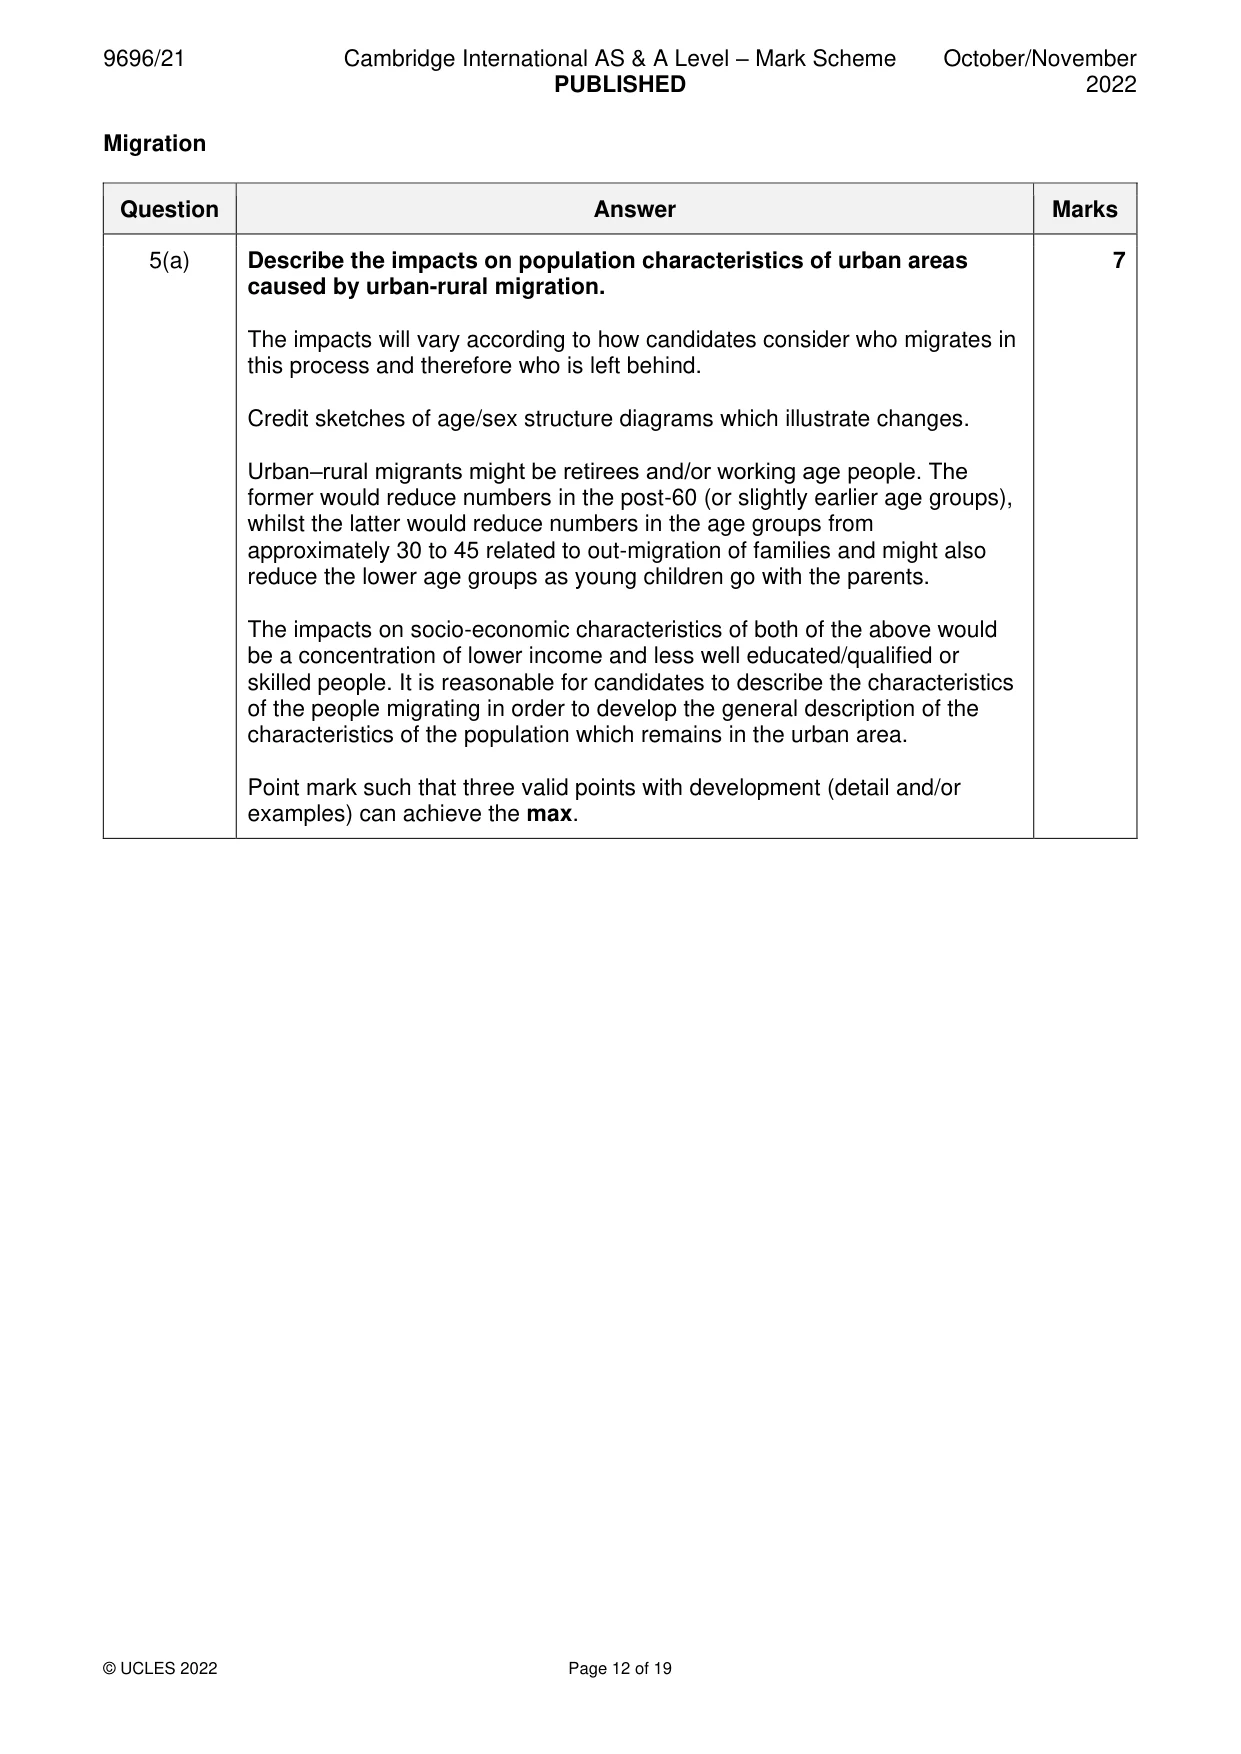
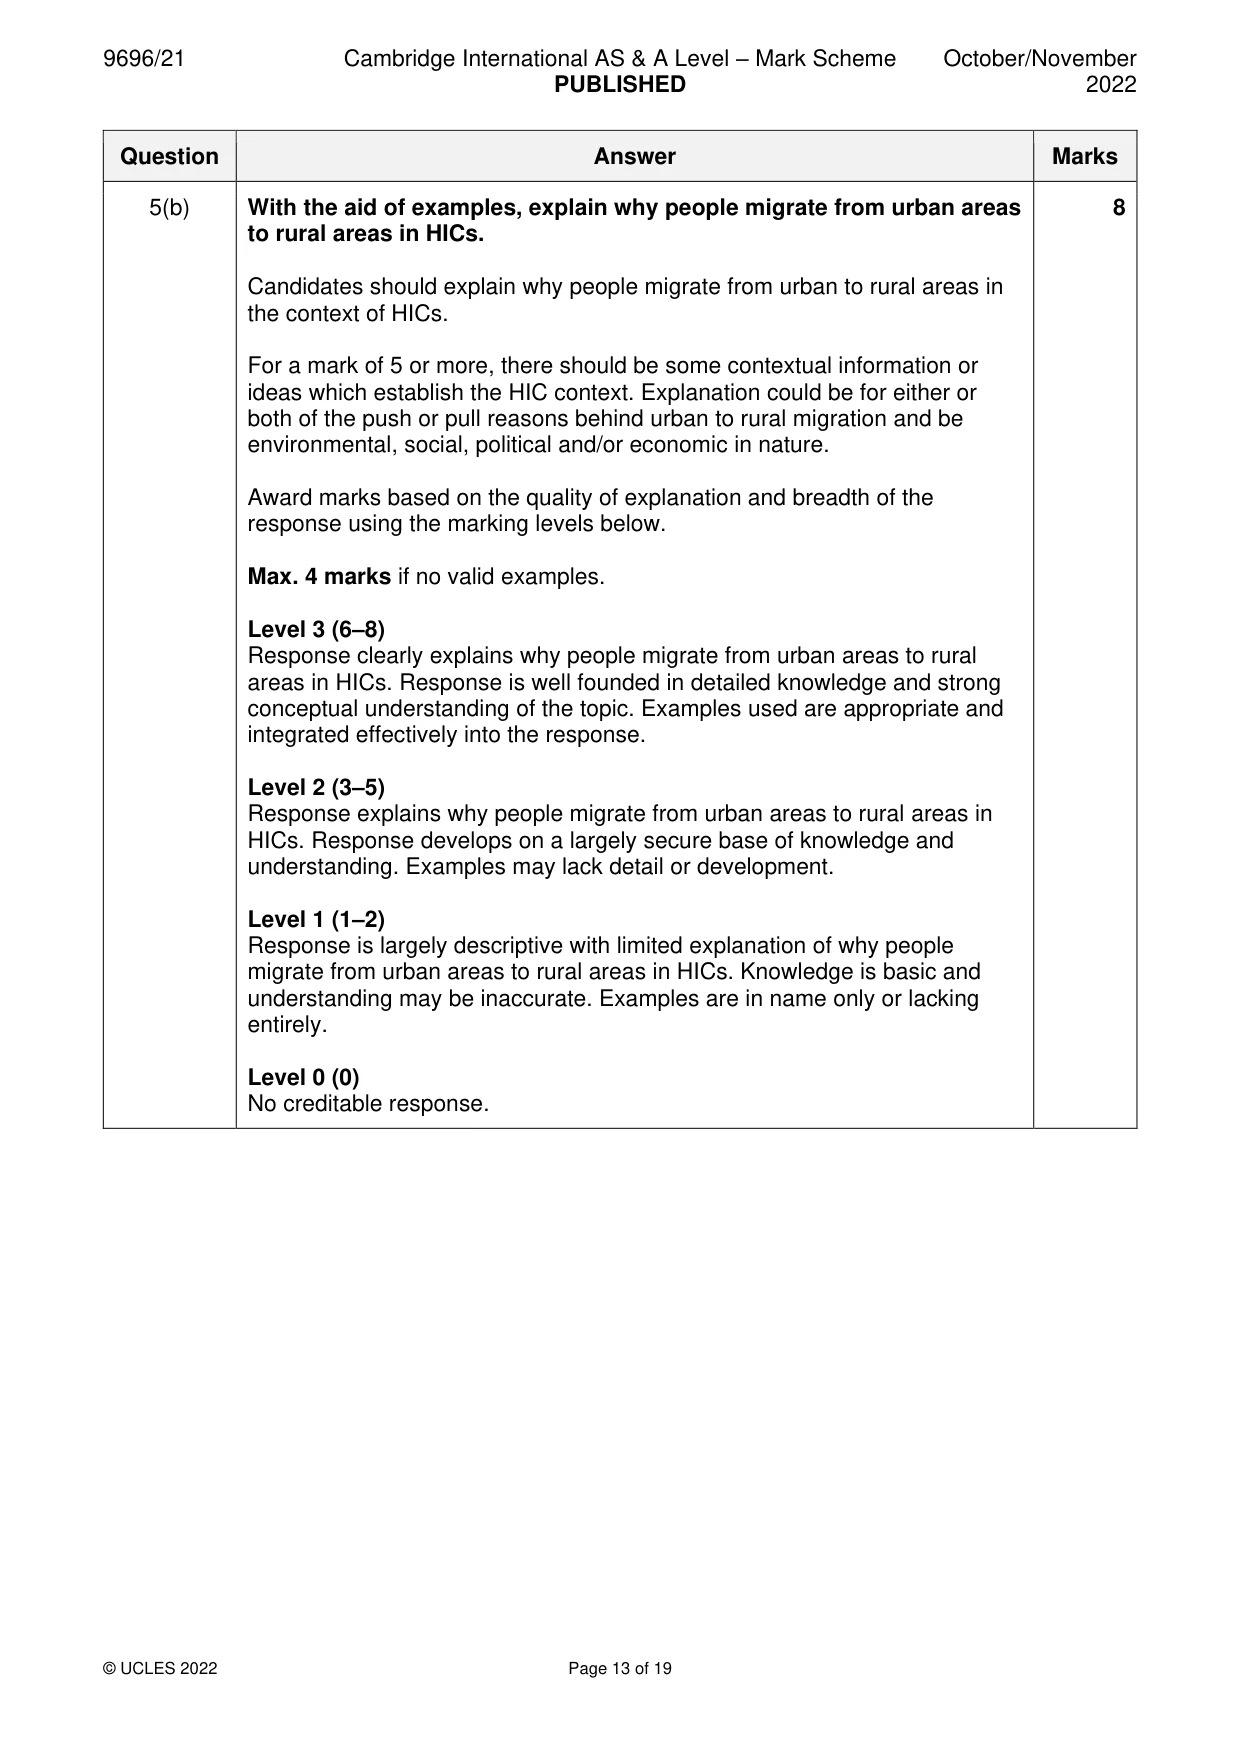
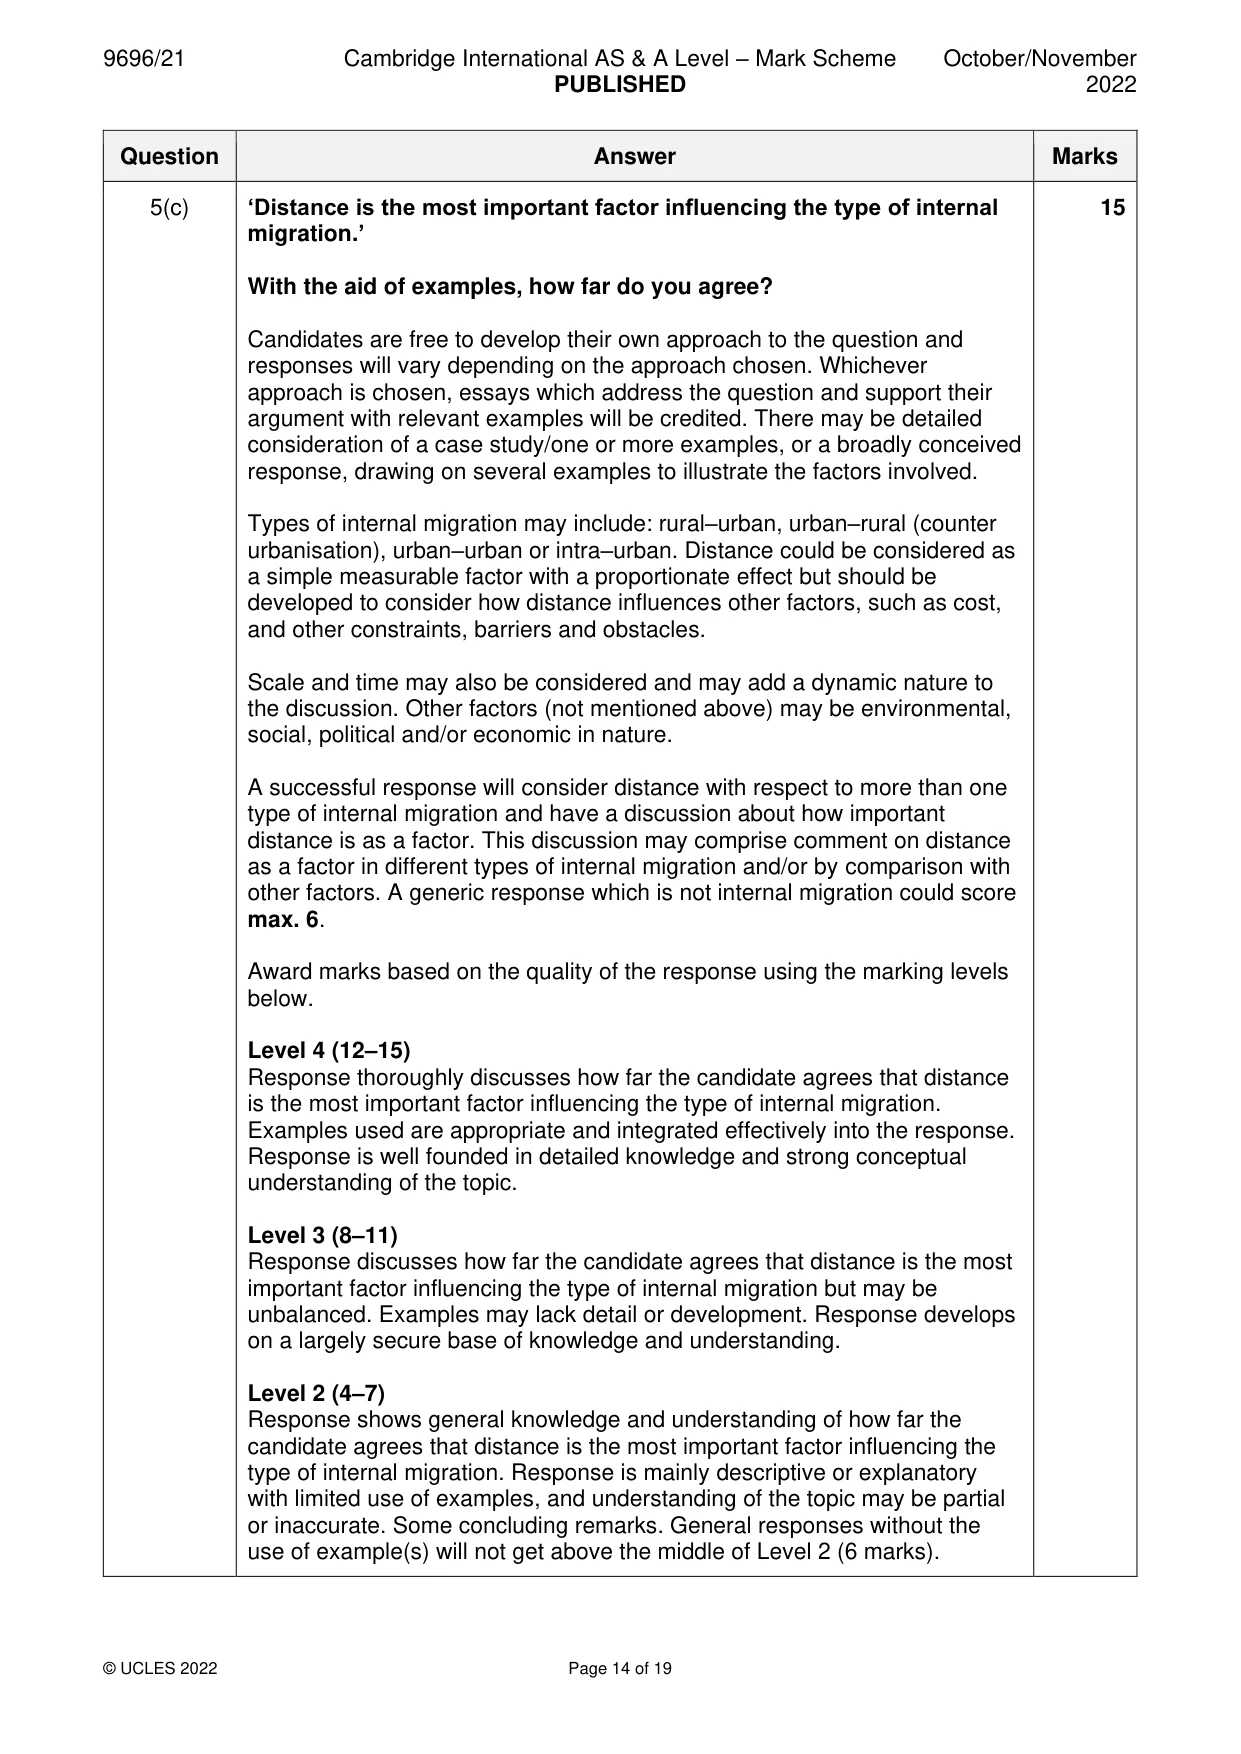
Mark scheme: 5(a) Describe the impacts on population characteristics of urban areas 7 caused by urban-rural migration. The impacts will vary according to how candidates consider who migrates in this process and therefore who is left behind. Credit sketches of age/sex structure diagrams which illustrate changes. Urban‒rural migrants might be retirees and/or working age people. The former would reduce numbers in the post-60 (or slightly earlier age groups), whilst the latter would reduce numbers in the age groups from approximately 30 to 45 related to out-migration of families and might also reduce the lower age groups as young children go with the parents. The impacts on socio-economic characteristics of both of the above would be a concentration of lower income and less well educated/qualified or skilled people. It is reasonable for candidates to describe the characteristics of the people migrating in order to develop the general description of the characteristics of the population which remains in the urban area. Point mark such that three valid points with development (detail and/or examples) can achieve the max. 5(b) With the aid of examples, explain why people migrate from urban areas 8 to rural areas in HICs. Candidates should explain why people migrate from urban to rural areas in the context of HICs. For a mark of 5 or more, there should be some contextual information or ideas which establish the HIC context. Explanation could be for either or both of the push or pull reasons behind urban to rural migration and be environmental, social, political and/or economic in nature. Award marks based on the quality of explanation and breadth of the response using the marking levels below. Max. 4 marks if no valid examples. Level 3 (6–8) Response clearly explains why people migrate from urban areas to rural areas in HICs. Response is well founded in detailed knowledge and strong conceptual understanding of the topic. Examples used are appropriate and integrated effectively into the response. Level 2 (3–5) Response explains why people migrate from urban areas to rural areas in HICs. Response develops on a largely secure base of knowledge and understanding. Examples may lack detail or development. Level 1 (1–2) Response is largely descriptive with limited explanation of why people migrate from urban areas to rural areas in HICs. Knowledge is basic and understanding may be inaccurate. Examples are in name only or lacking entirely. Level 0 (0) No creditable response. 5(c) ‘Distance is the most important factor influencing the type of internal 15 migration.’ With the aid of examples, how far do you agree? Candidates are free to develop their own approach to the question and responses will vary depending on the approach chosen. Whichever approach is chosen, essays which address the question and support their argument with relevant examples will be credited. There may be detailed consideration of a case study/one or more examples, or a broadly conceived response, drawing on several examples to illustrate the factors involved. Types of internal migration may include: rural–urban, urban–rural (counter urbanisation), urban–urban or intra–urban. Distance could be considered as a simple measurable factor with a proportionate effect but should be developed to consider how distance influences other factors, such as cost, and other constraints, barriers and obstacles. Scale and time may also be considered and may add a dynamic nature to the discussion. Other factors (not mentioned above) may be environmental, social, political and/or economic in nature. A successful response will consider distance with respect to more than one type of internal migration and have a discussion about how important distance is as a factor. This discussion may comprise comment on distance as a factor in different types of internal migration and/or by comparison with other factors. A generic response which is not internal migration could score max. 6. Award marks based on the quality of the response using the marking levels below. Level 4 (12–15) Response thoroughly discusses how far the candidate agrees that distance is the most important factor influencing the type of internal migration. Examples used are appropriate and integrated effectively into the response. Response is well founded in detailed knowledge and strong conceptual understanding of the topic. Level 3 (8–11) Response discusses how far the candidate agrees that distance is the most important factor influencing the type of internal migration but may be unbalanced. Examples may lack detail or development. Response develops on a largely secure base of knowledge and understanding. Level 2 (4–7) Response shows general knowledge and understanding of how far the candidate agrees that distance is the most important factor influencing the type of internal migration. Response is mainly descriptive or explanatory with limited use of examples, and understanding of the topic may be partial or inaccurate. Some concluding remarks. General responses without the use of example(s) will not get above the middle of Level 2 (6 marks). 5(c) Level 1 (1–3) Response may broadly discuss distance as a factor in migration but does not address the question and does not come to a convincing conclusion. Response is descriptive, knowledge is basic and understanding is poor. Level 0 (0) No creditable response. Settlement dynamics
Q6 · Describe how the location of services in urban areas changes over time
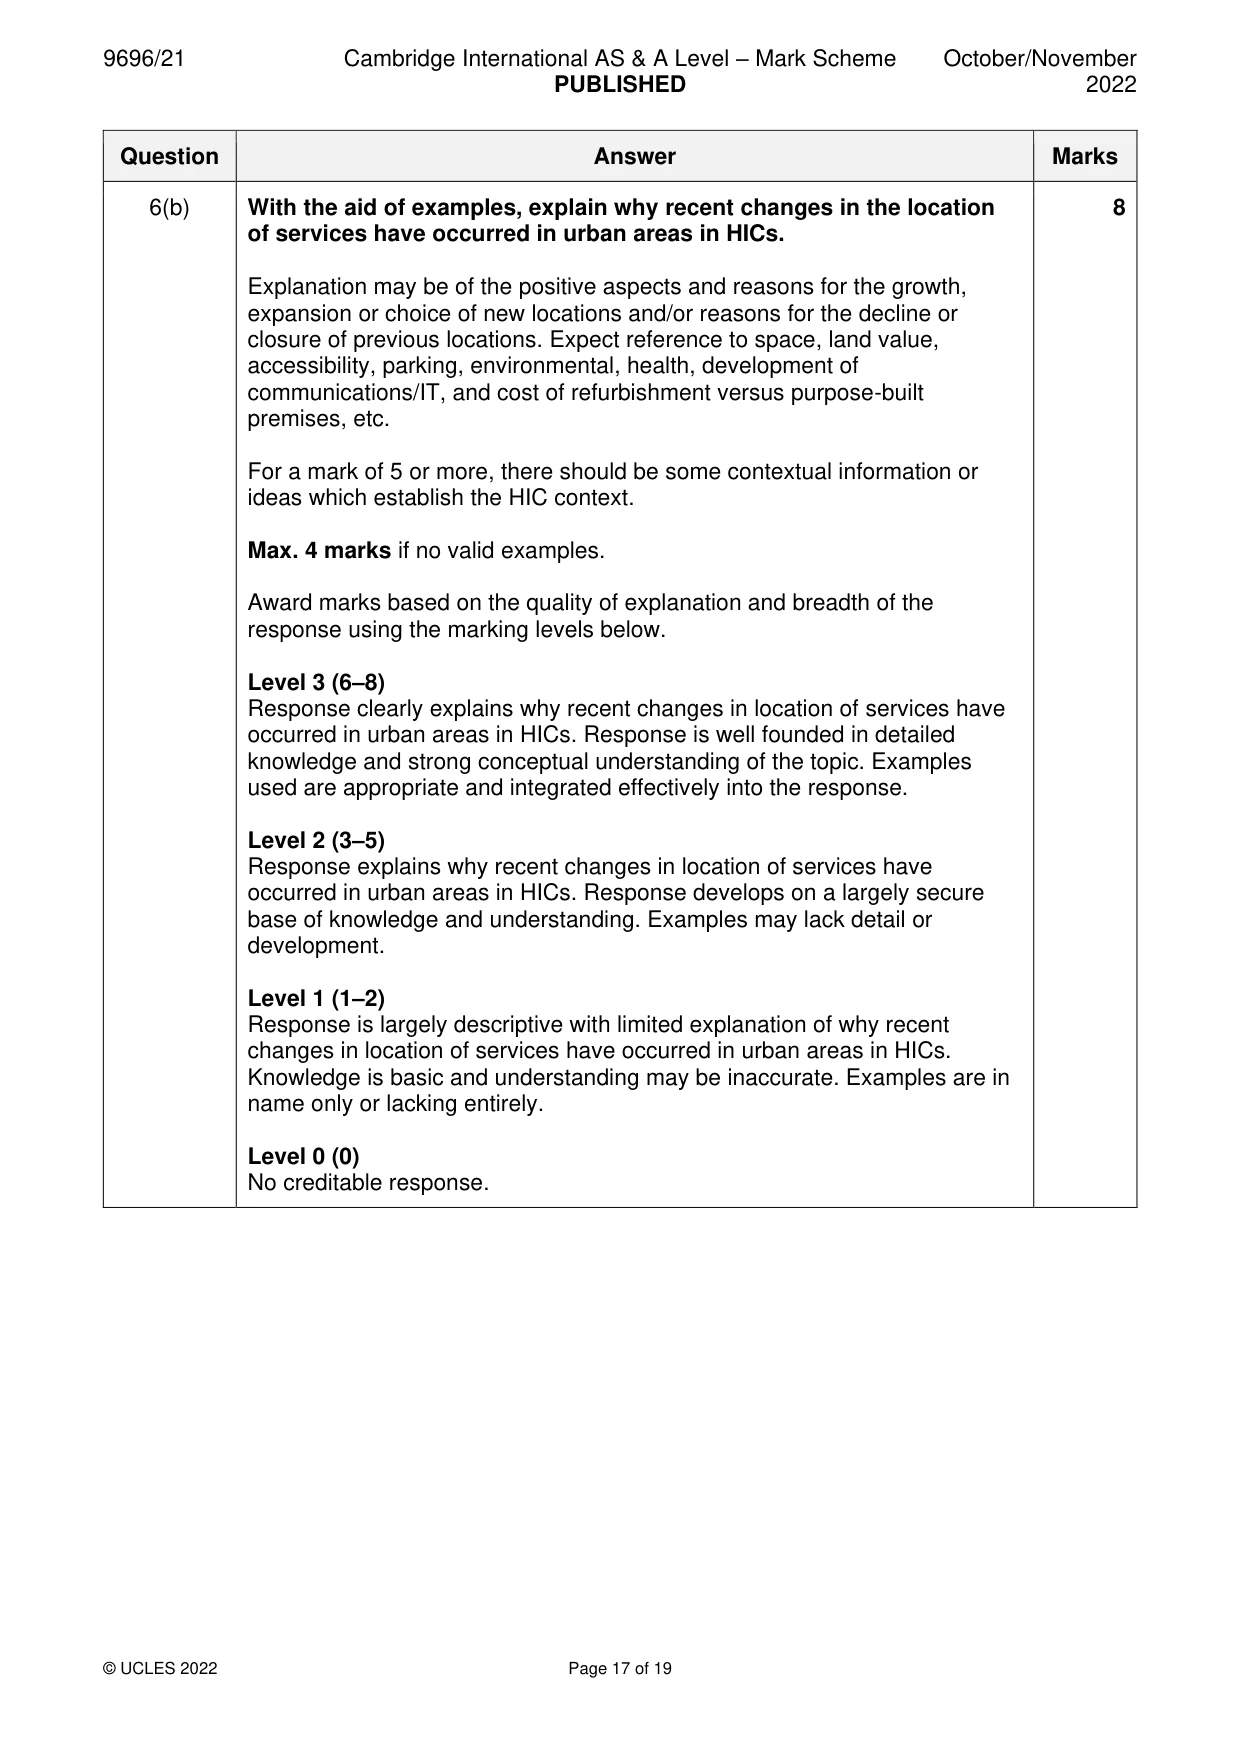
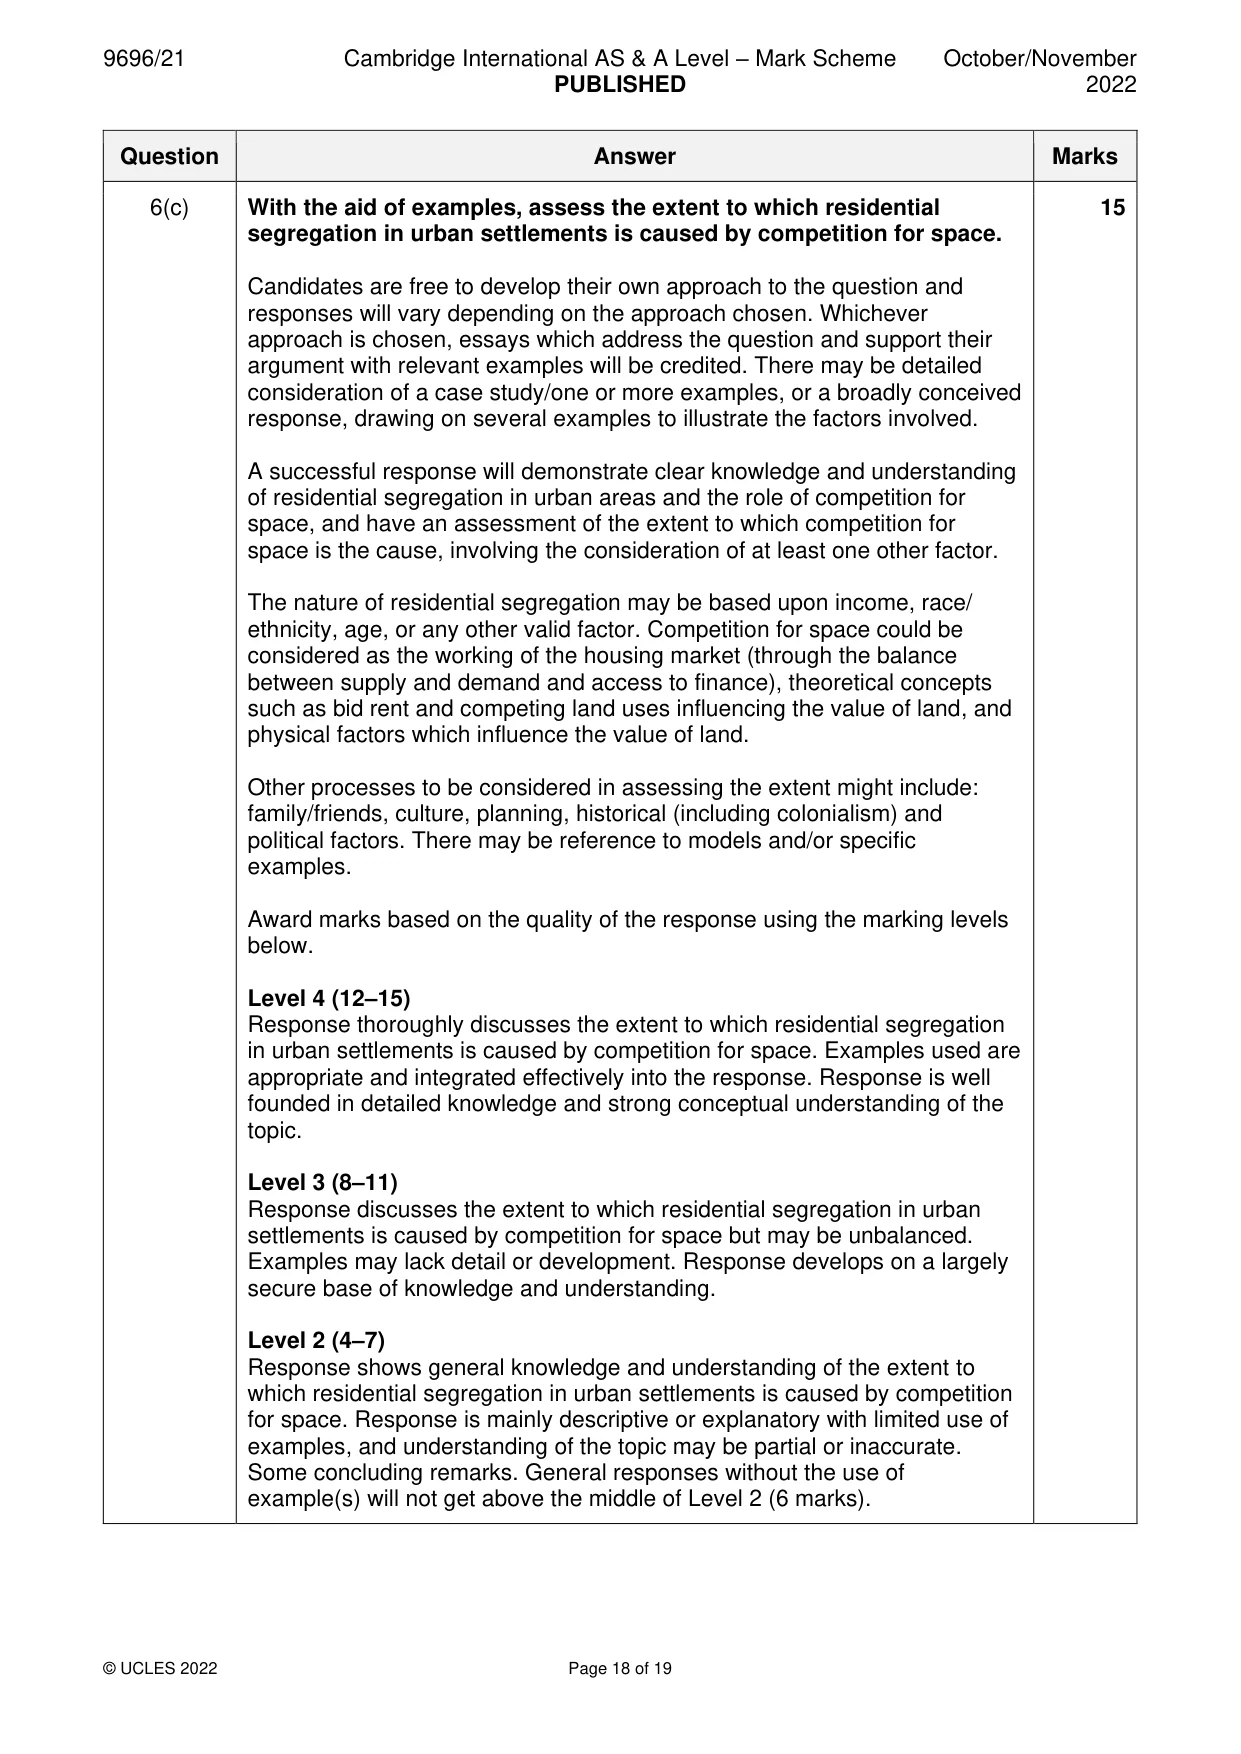
6 (a) Describe how the location of services in urban areas changes over time. [7] (b) With the aid of examples, explain why recent changes in the location of services have occurred in urban areas in HICs. [8] (c) With the aid of examples, assess the extent to which residential segregation in urban settlements is caused by competition for space. [15]
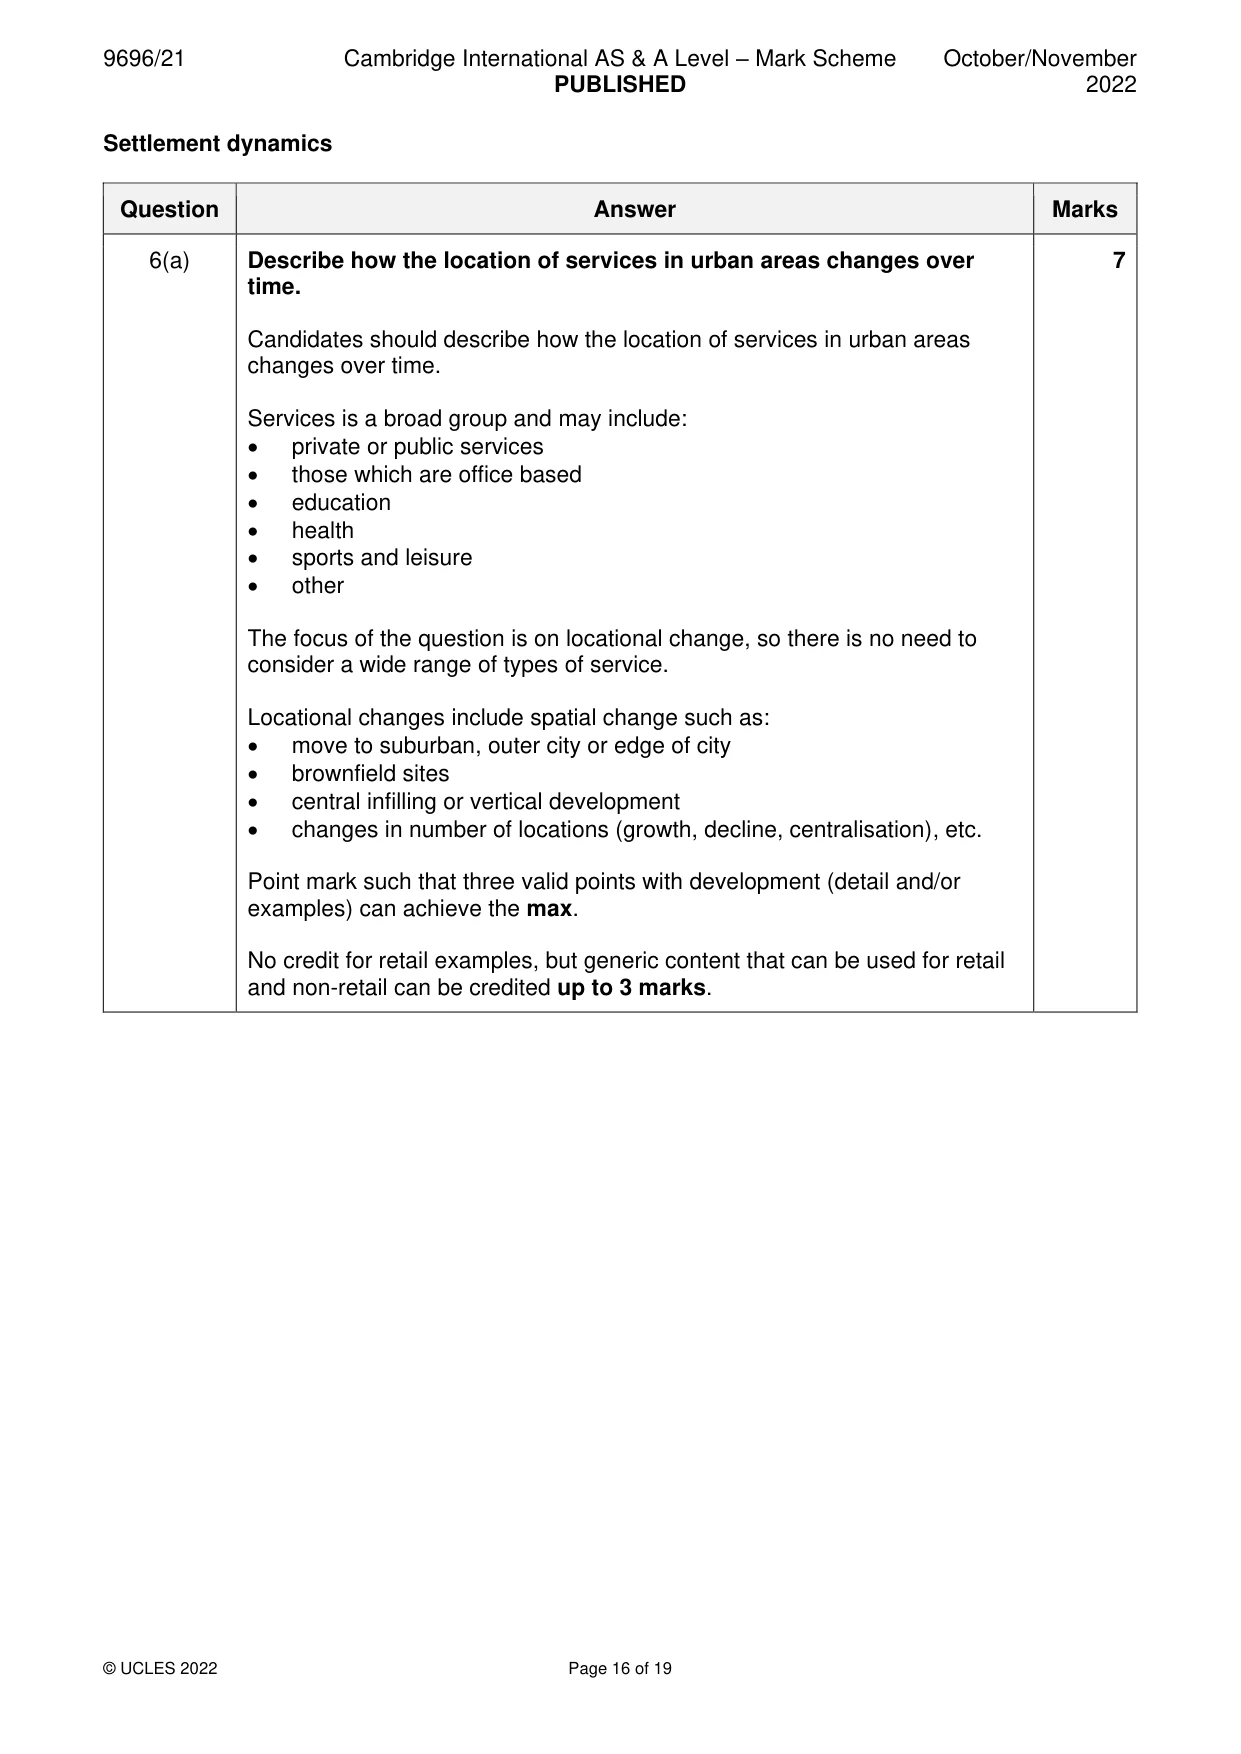
Mark scheme: 6(a) Describe how the location of services in urban areas changes over 7 time. Candidates should describe how the location of services in urban areas changes over time. Services is a broad group and may include: • private or public services • those which are office based • education • health • sports and leisure • other The focus of the question is on locational change, so there is no need to consider a wide range of types of service. Locational changes include spatial change such as: • move to suburban, outer city or edge of city • brownfield sites • central infilling or vertical development • changes in number of locations (growth, decline, centralisation), etc. Point mark such that three valid points with development (detail and/or examples) can achieve the max. No credit for retail examples, but generic content that can be used for retail and non-retail can be credited up to 3 marks. 6(b) With the aid of examples, explain why recent changes in the location 8 of services have occurred in urban areas in HICs. Explanation may be of the positive aspects and reasons for the growth, expansion or choice of new locations and/or reasons for the decline or closure of previous locations. Expect reference to space, land value, accessibility, parking, environmental, health, development of communications/IT, and cost of refurbishment versus purpose-built premises, etc. For a mark of 5 or more, there should be some contextual information or ideas which establish the HIC context. Max. 4 marks if no valid examples. Award marks based on the quality of explanation and breadth of the response using the marking levels below. Level 3 (6–8) Response clearly explains why recent changes in location of services have occurred in urban areas in HICs. Response is well founded in detailed knowledge and strong conceptual understanding of the topic. Examples used are appropriate and integrated effectively into the response. Level 2 (3–5) Response explains why recent changes in location of services have occurred in urban areas in HICs. Response develops on a largely secure base of knowledge and understanding. Examples may lack detail or development. Level 1 (1–2) Response is largely descriptive with limited explanation of why recent changes in location of services have occurred in urban areas in HICs. Knowledge is basic and understanding may be inaccurate. Examples are in name only or lacking entirely. Level 0 (0) No creditable response. 6(c) With the aid of examples, assess the extent to which residential 15 segregation in urban settlements is caused by competition for space. Candidates are free to develop their own approach to the question and responses will vary depending on the approach chosen. Whichever approach is chosen, essays which address the question and support their argument with relevant examples will be credited. There may be detailed consideration of a case study/one or more examples, or a broadly conceived response, drawing on several examples to illustrate the factors involved. A successful response will demonstrate clear knowledge and understanding of residential segregation in urban areas and the role of competition for space, and have an assessment of the extent to which competition for space is the cause, involving the consideration of at least one other factor. The nature of residential segregation may be based upon income, race/ ethnicity, age, or any other valid factor. Competition for space could be considered as the working of the housing market (through the balance between supply and demand and access to finance), theoretical concepts such as bid rent and competing land uses influencing the value of land, and physical factors which influence the value of land. Other processes to be considered in assessing the extent might include: family/friends, culture, planning, historical (including colonialism) and political factors. There may be reference to models and/or specific examples. Award marks based on the quality of the response using the marking levels below. Level 4 (12–15) Response thoroughly discusses the extent to which residential segregation in urban settlements is caused by competition for space. Examples used are appropriate and integrated effectively into the response. Response is well founded in detailed knowledge and strong conceptual understanding of the topic. Level 3 (8–11) Response discusses the extent to which residential segregation in urban settlements is caused by competition for space but may be unbalanced. Examples may lack detail or development. Response develops on a largely secure base of knowledge and understanding. Level 2 (4–7) Response shows general knowledge and understanding of the extent to which residential segregation in urban settlements is caused by competition for space. Response is mainly descriptive or explanatory with limited use of examples, and understanding of the topic may be partial or inaccurate. Some concluding remarks. General responses without the use of example(s) will not get above the middle of Level 2 (6 marks). 6(c) Level 1 (1–3) Response may broadly discuss residential segregation in urban settlements but does not address the question and does not come to a convincing conclusion. Response is descriptive, knowledge is basic and understanding is poor. Level 0 (0) No creditable response.
What was in this paper
The subtopics covered by these 6 questions, and how many questions each got. Open one in a new tab to see every Cambridge question on it.
What you needed in this session
Cambridge’s own grade thresholds for 2022 Oct/Nov, Paper 2 · Variant 1. A higher threshold means an easier paper — the bar moves with how the cohort did.