Cambridge A Level Geography 9696 — 2025 Oct/Nov Paper 2 · Variant 1
9696/21/O/N/25 · 6 questions · 60 marks · ≈68 min
The question paper and its mark scheme, free to read here and free to download. This is Cambridge’s own paper, exactly as it was sat.
Question paper4 pages


Mark scheme20 pages
Answers below. Sit the paper first if you are practising.






Questions as text
Q1 · The crude birth rate for the world, 1950–2020 and estimated to 2100
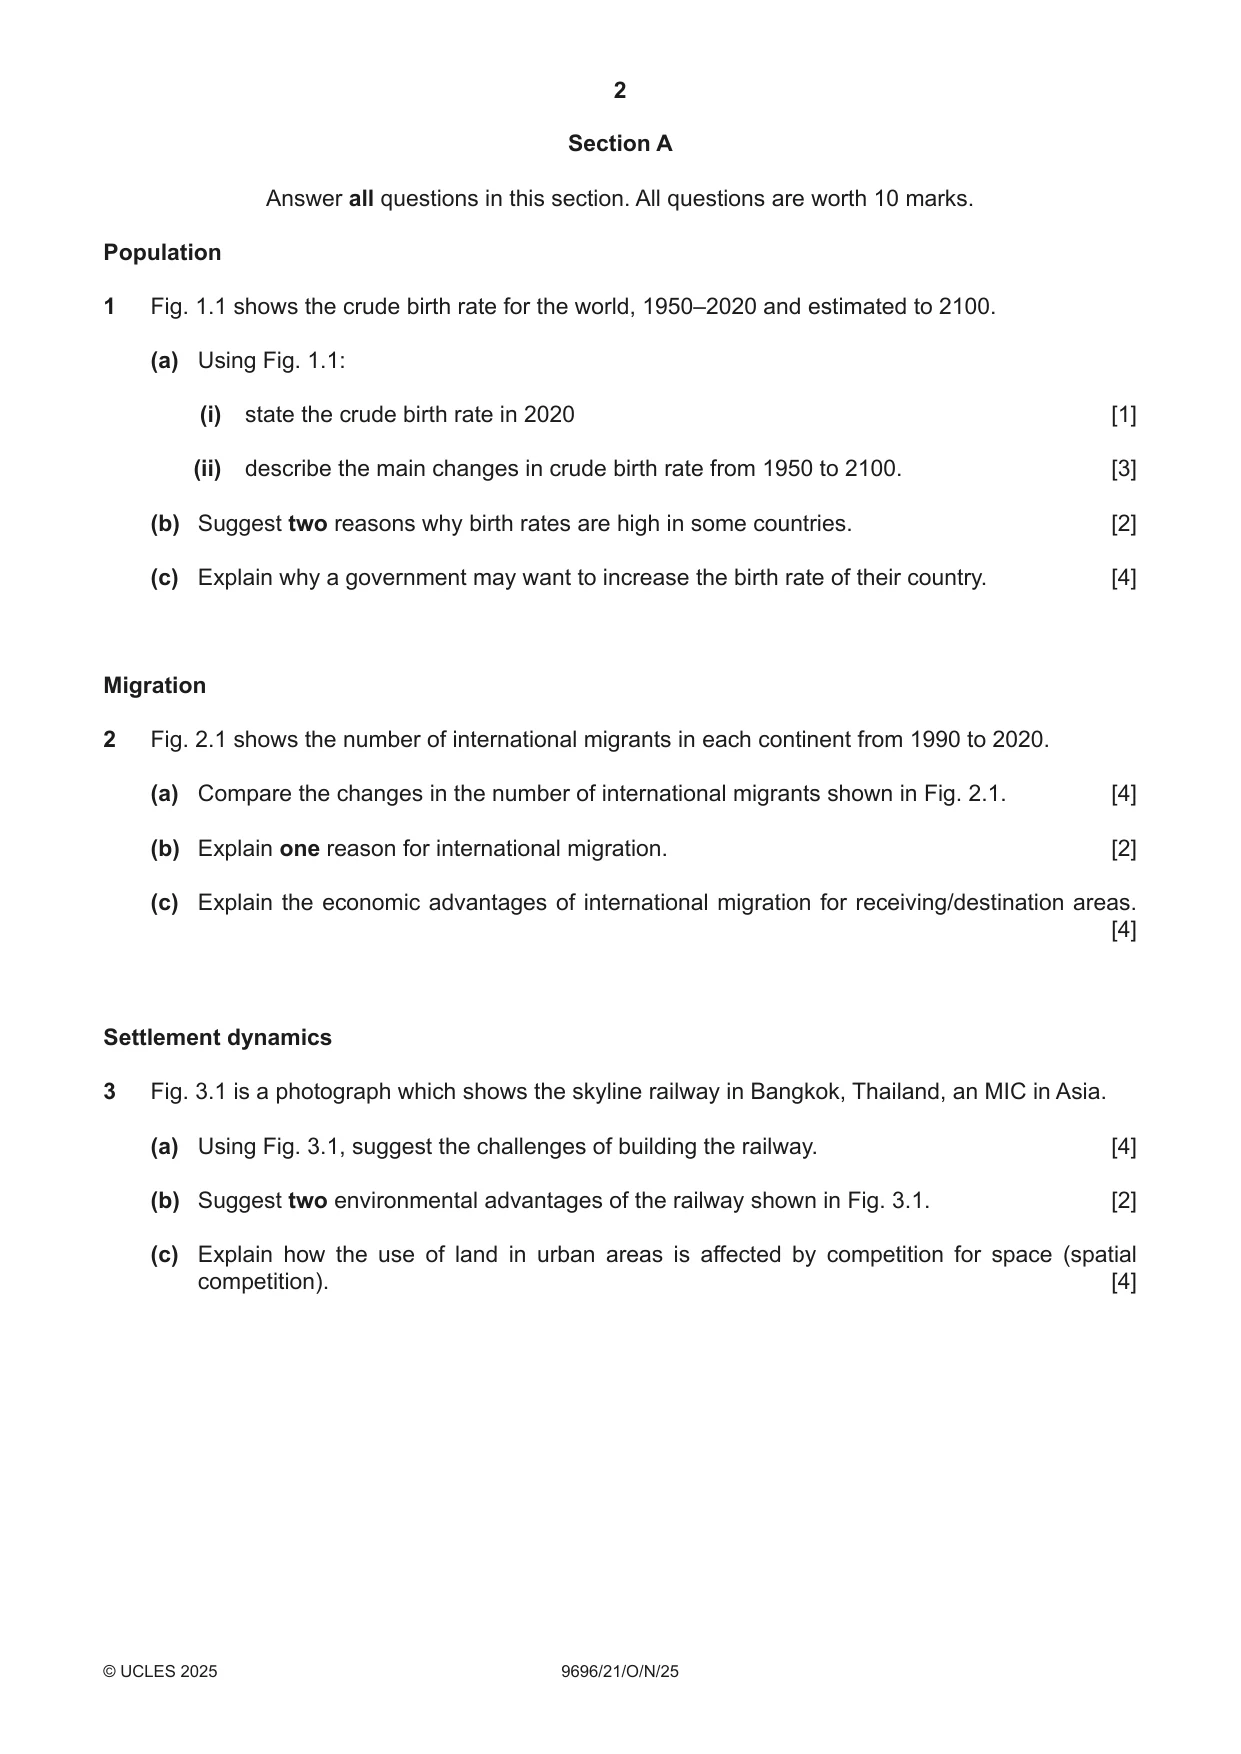
1 Fig. 1.1 shows the crude birth rate for the world, 1950–2020 and estimated to 2100. (a) Using Fig. 1.1: (i) state the crude birth rate in 2020 [1] (ii) describe the main changes in crude birth rate from 1950 to 2100. [3] (b) Suggest two reasons why birth rates are high in some countries. [2] (c) Explain why a government may want to increase the birth rate of their country. [4] Migration
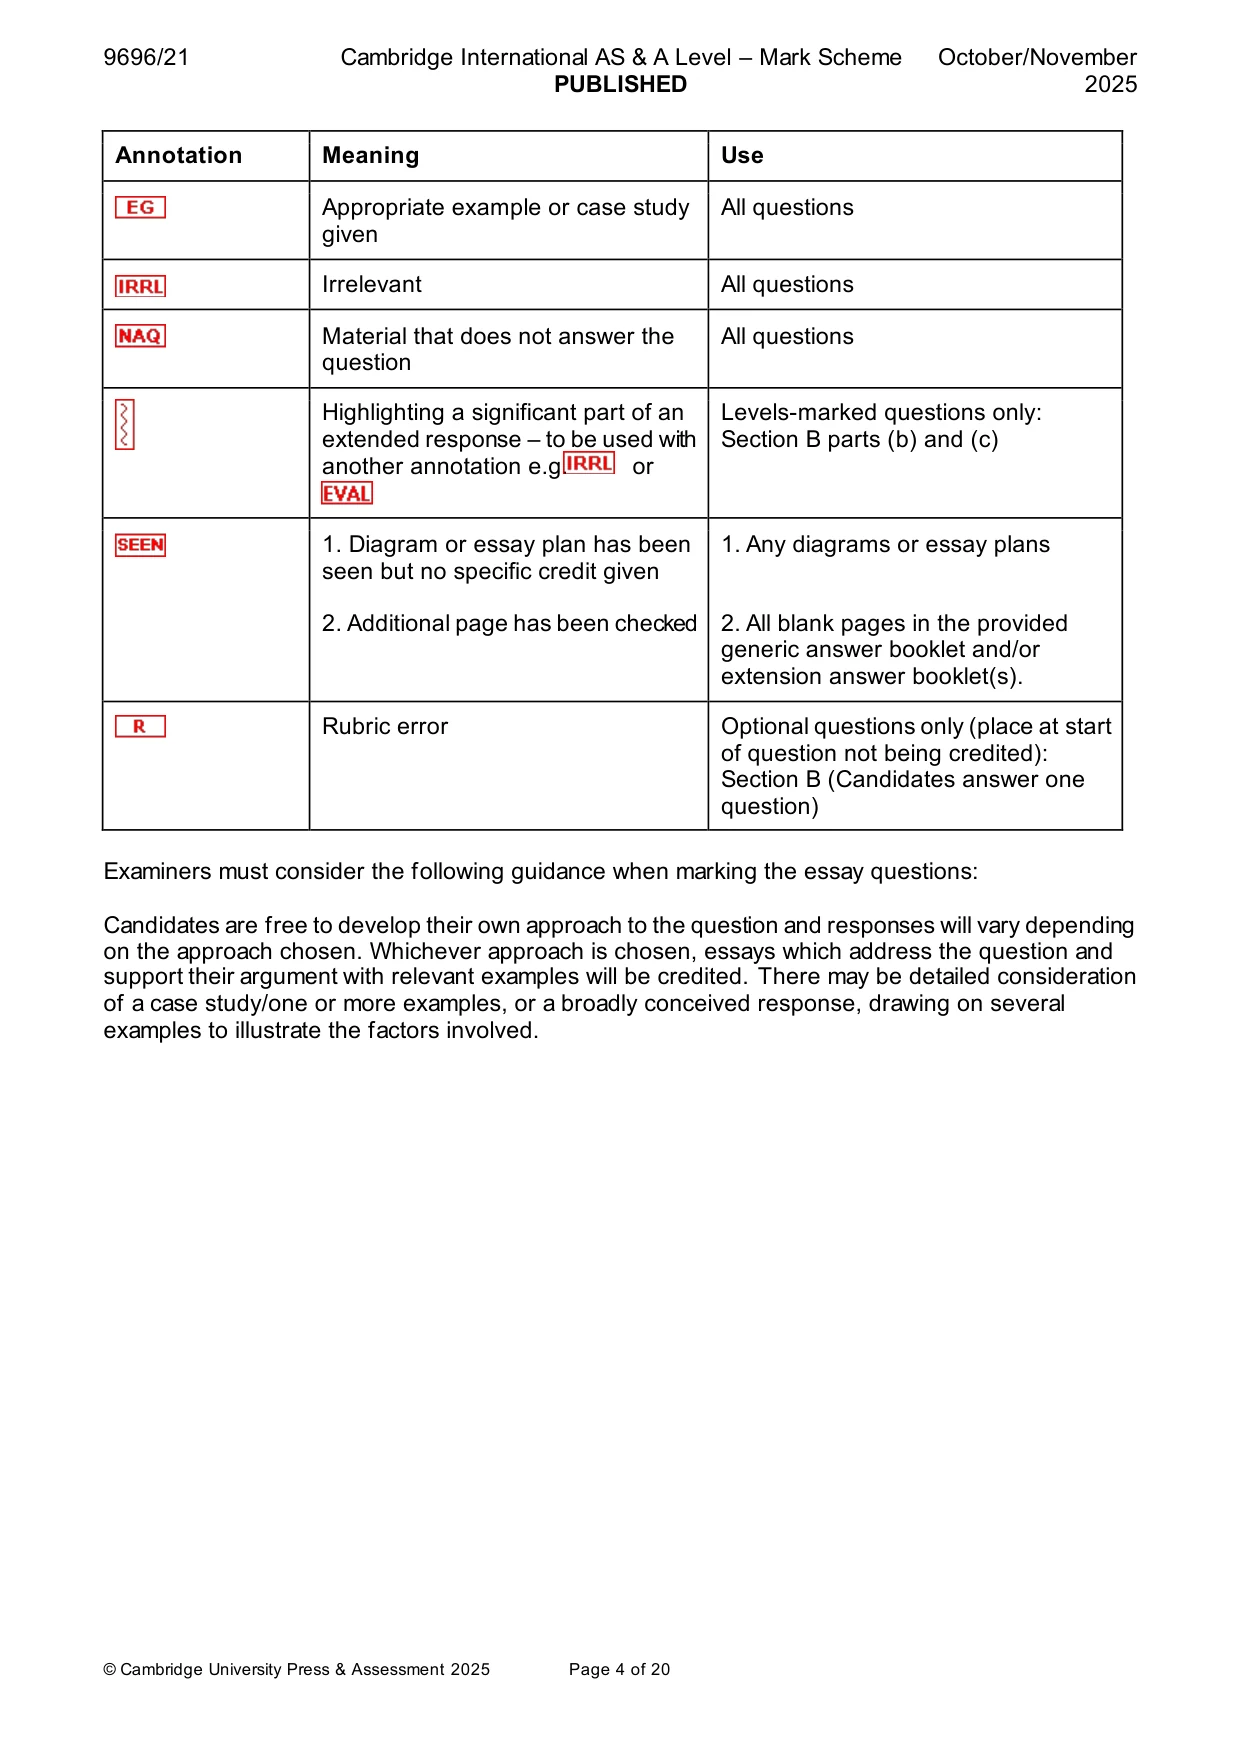
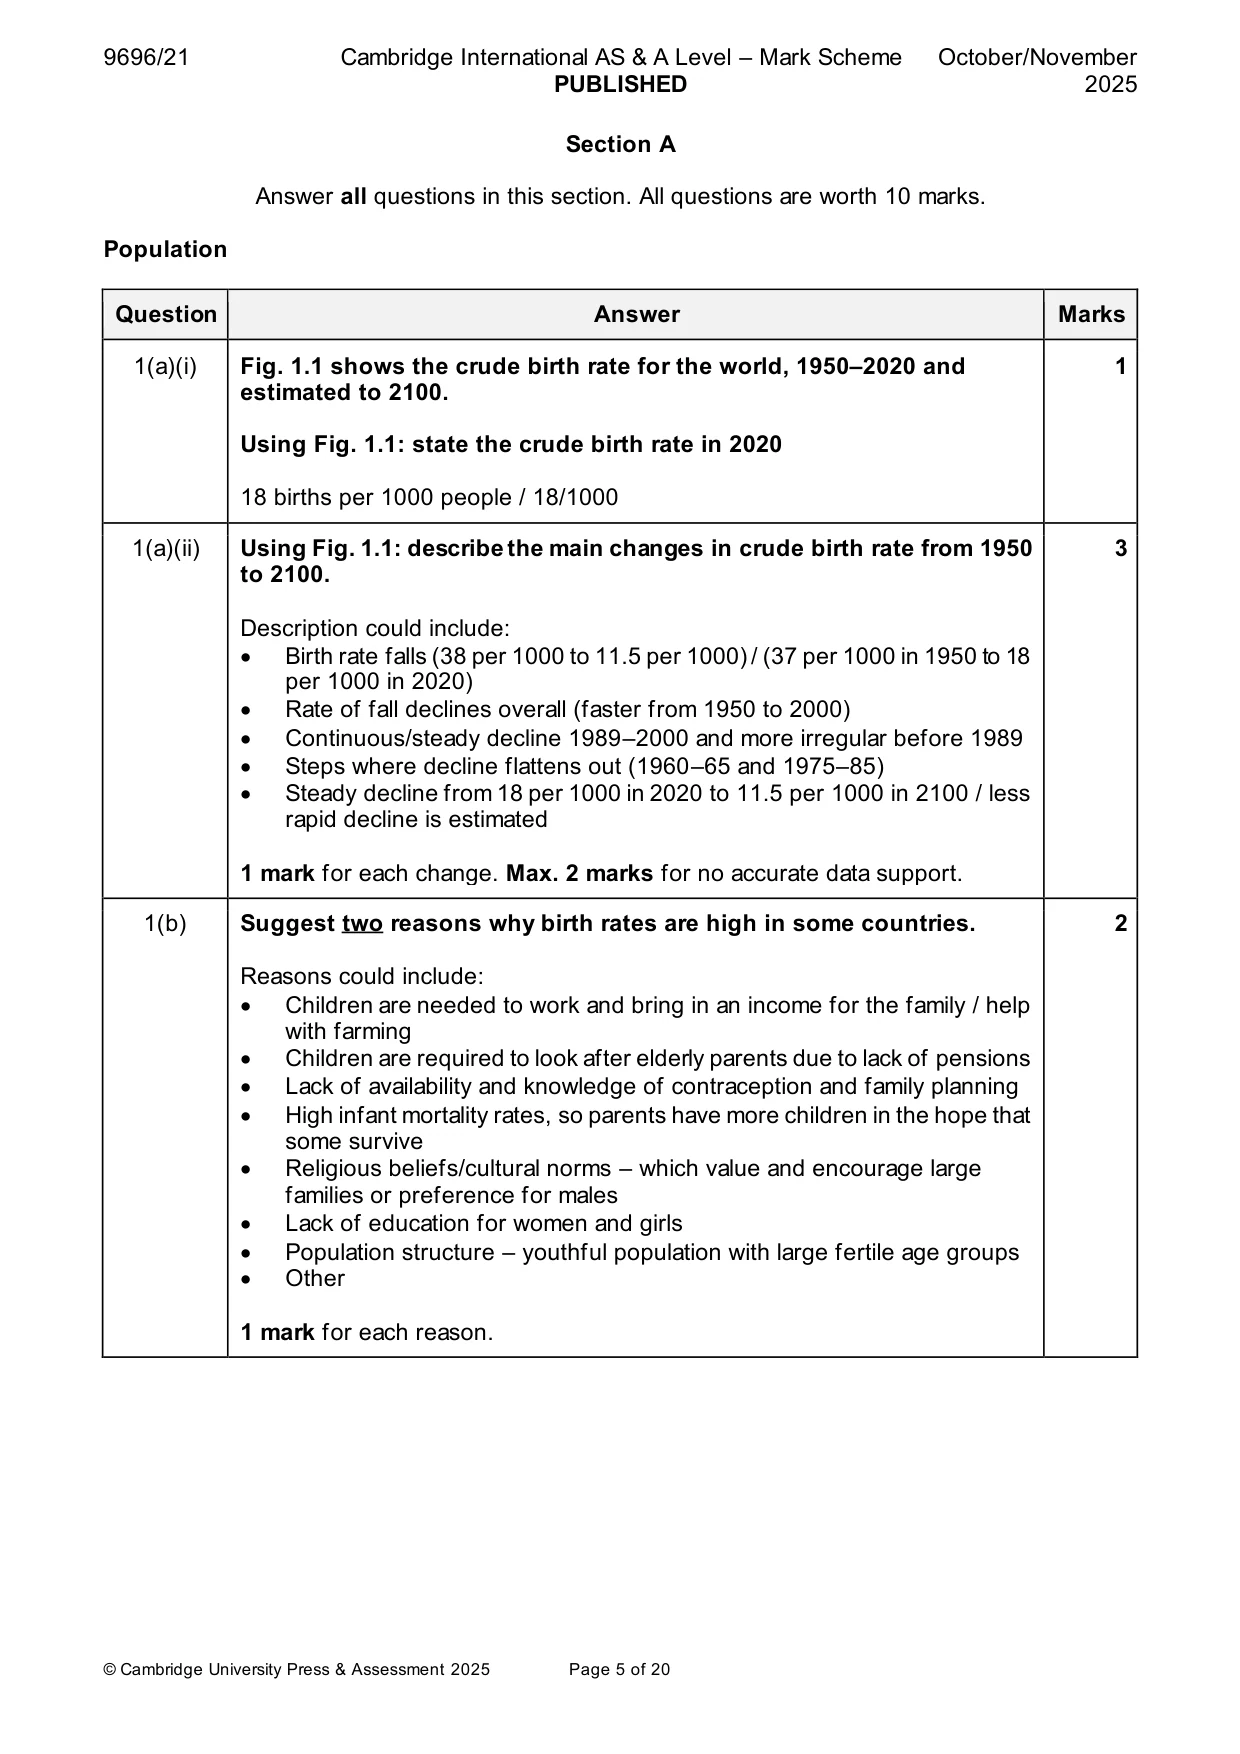
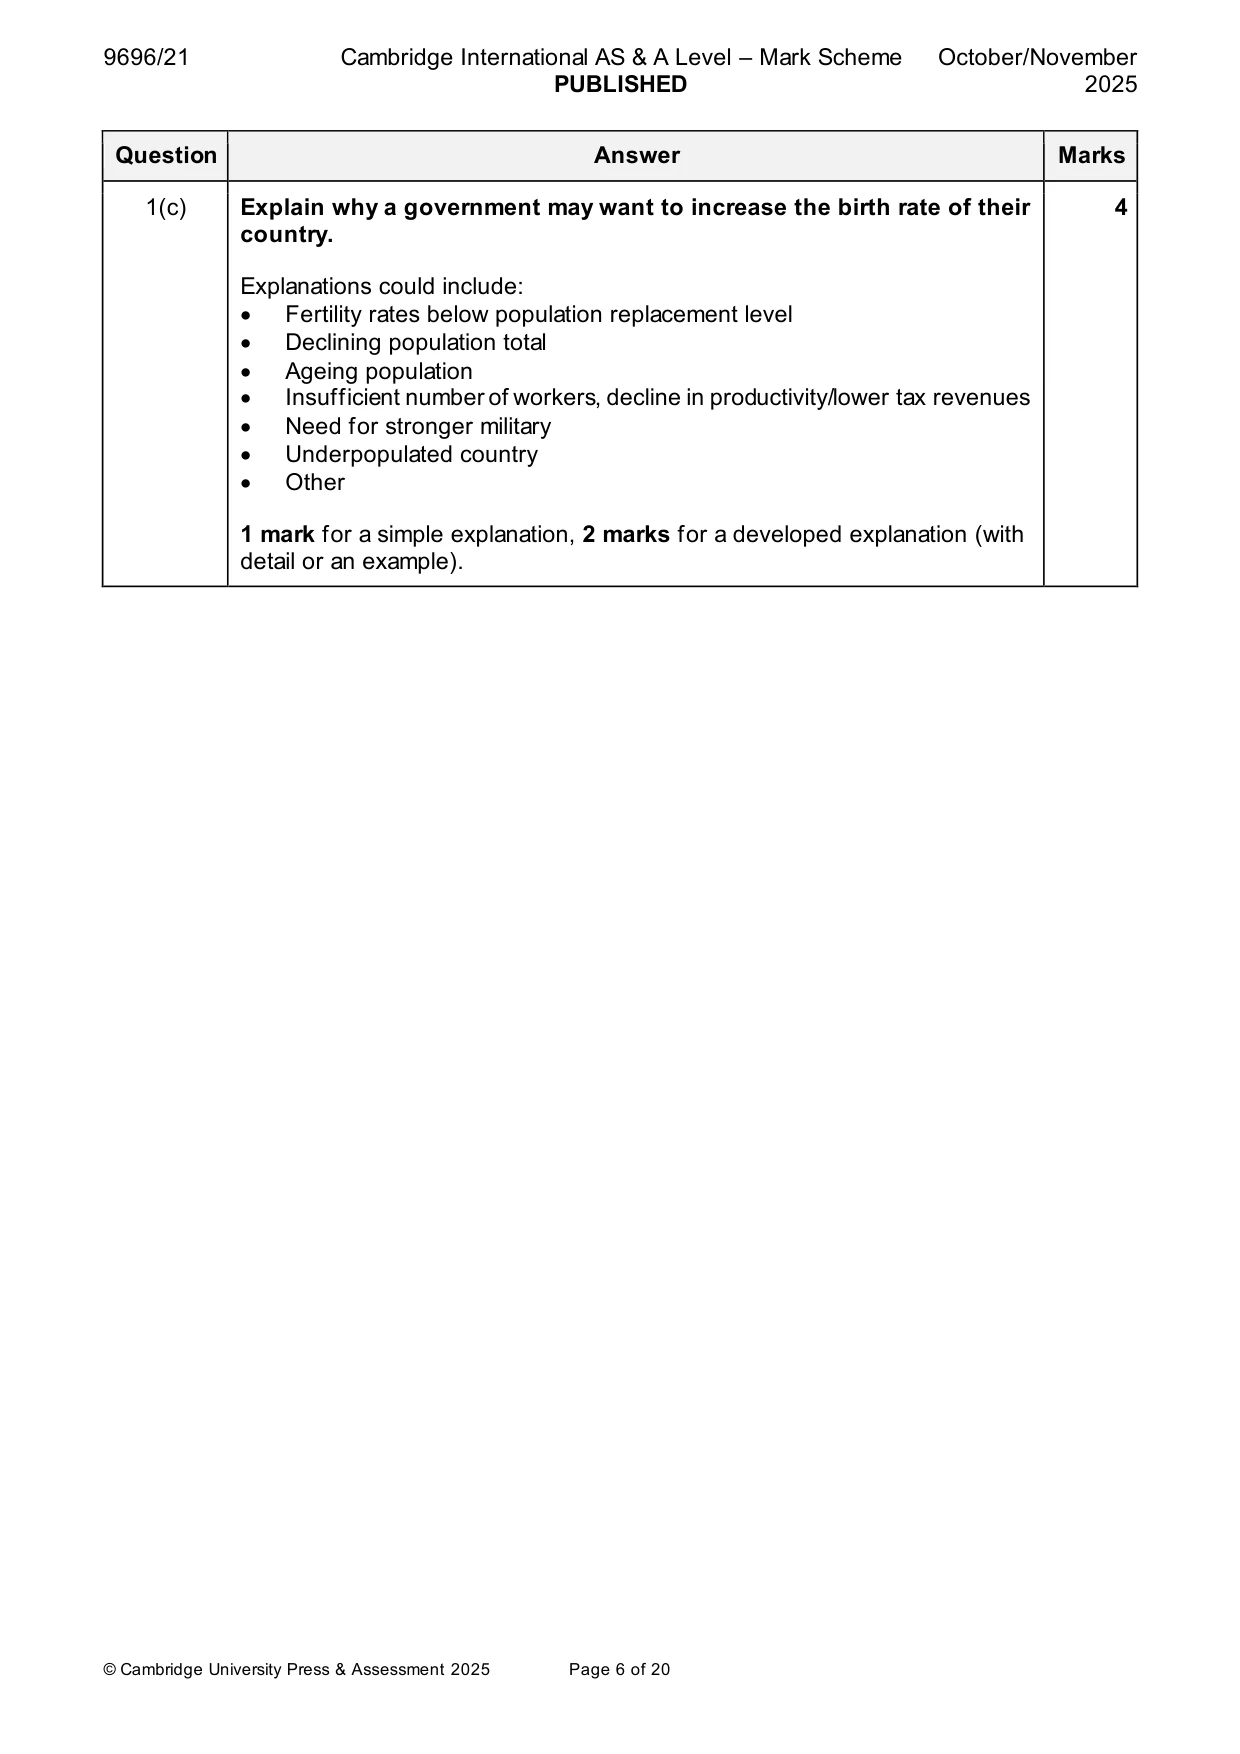
Mark scheme: Question Answer Marks 1(a)(i) Fig. 1.1 shows the crude birth rate for the world, 1950–2020 and 1 estimated to 2100. Using Fig. 1.1: state the crude birth rate in 2020 18 births per 1000 people / 18/1000 1(a)(ii) Using Fig. 1.1: describe the main changes in crude birth rate from 1950 3 to 2100. Description could include: • Birth rate falls (38 per 1000 to 11.5 per 1000) / (37 per 1000 in 1950 to 18 per 1000 in 2020) • Rate of fall declines overall (faster from 1950 to 2000) • Continuous/steady decline 1989–2000 and more irregular before 1989 • Steps where decline flattens out (1960–65 and 1975–85) • Steady decline from 18 per 1000 in 2020 to 11.5 per 1000 in 2100 / less rapid decline is estimated 1 mark for each change. Max. 2 marks for no accurate data support. 1(b) Suggest two reasons why birth rates are high in some countries. 2 Reasons could include: • Children are needed to work and bring in an income for the family / help with farming • Children are required to look after elderly parents due to lack of pensions • Lack of availability and knowledge of contraception and family planning • High infant mortality rates, so parents have more children in the hope that some survive • Religious beliefs/cultural norms – which value and encourage large families or preference for males • Lack of education for women and girls • Population structure – youthful population with large fertile age groups • Other 1 mark for each reason. 1(c) Explain why a government may want to increase the birth rate of their 4 country. Explanations could include: • Fertility rates below population replacement level • Declining population total • Ageing population • Insufficient number of workers, decline in productivity/lower tax revenues • Need for stronger military • Underpopulated country • Other 1 mark for a simple explanation, 2 marks for a developed explanation (with detail or an example). Migration
Q2 · The number of international migrants in each continent from 1990 to 2020
2 Fig. 2.1 shows the number of international migrants in each continent from 1990 to 2020. (a) Compare the changes in the number of international migrants shown in Fig. 2.1. [4] (b) Explain one reason for international migration. [2] (c) Explain the economic advantages of international migration for receiving/destination areas. [4] Settlement dynamics
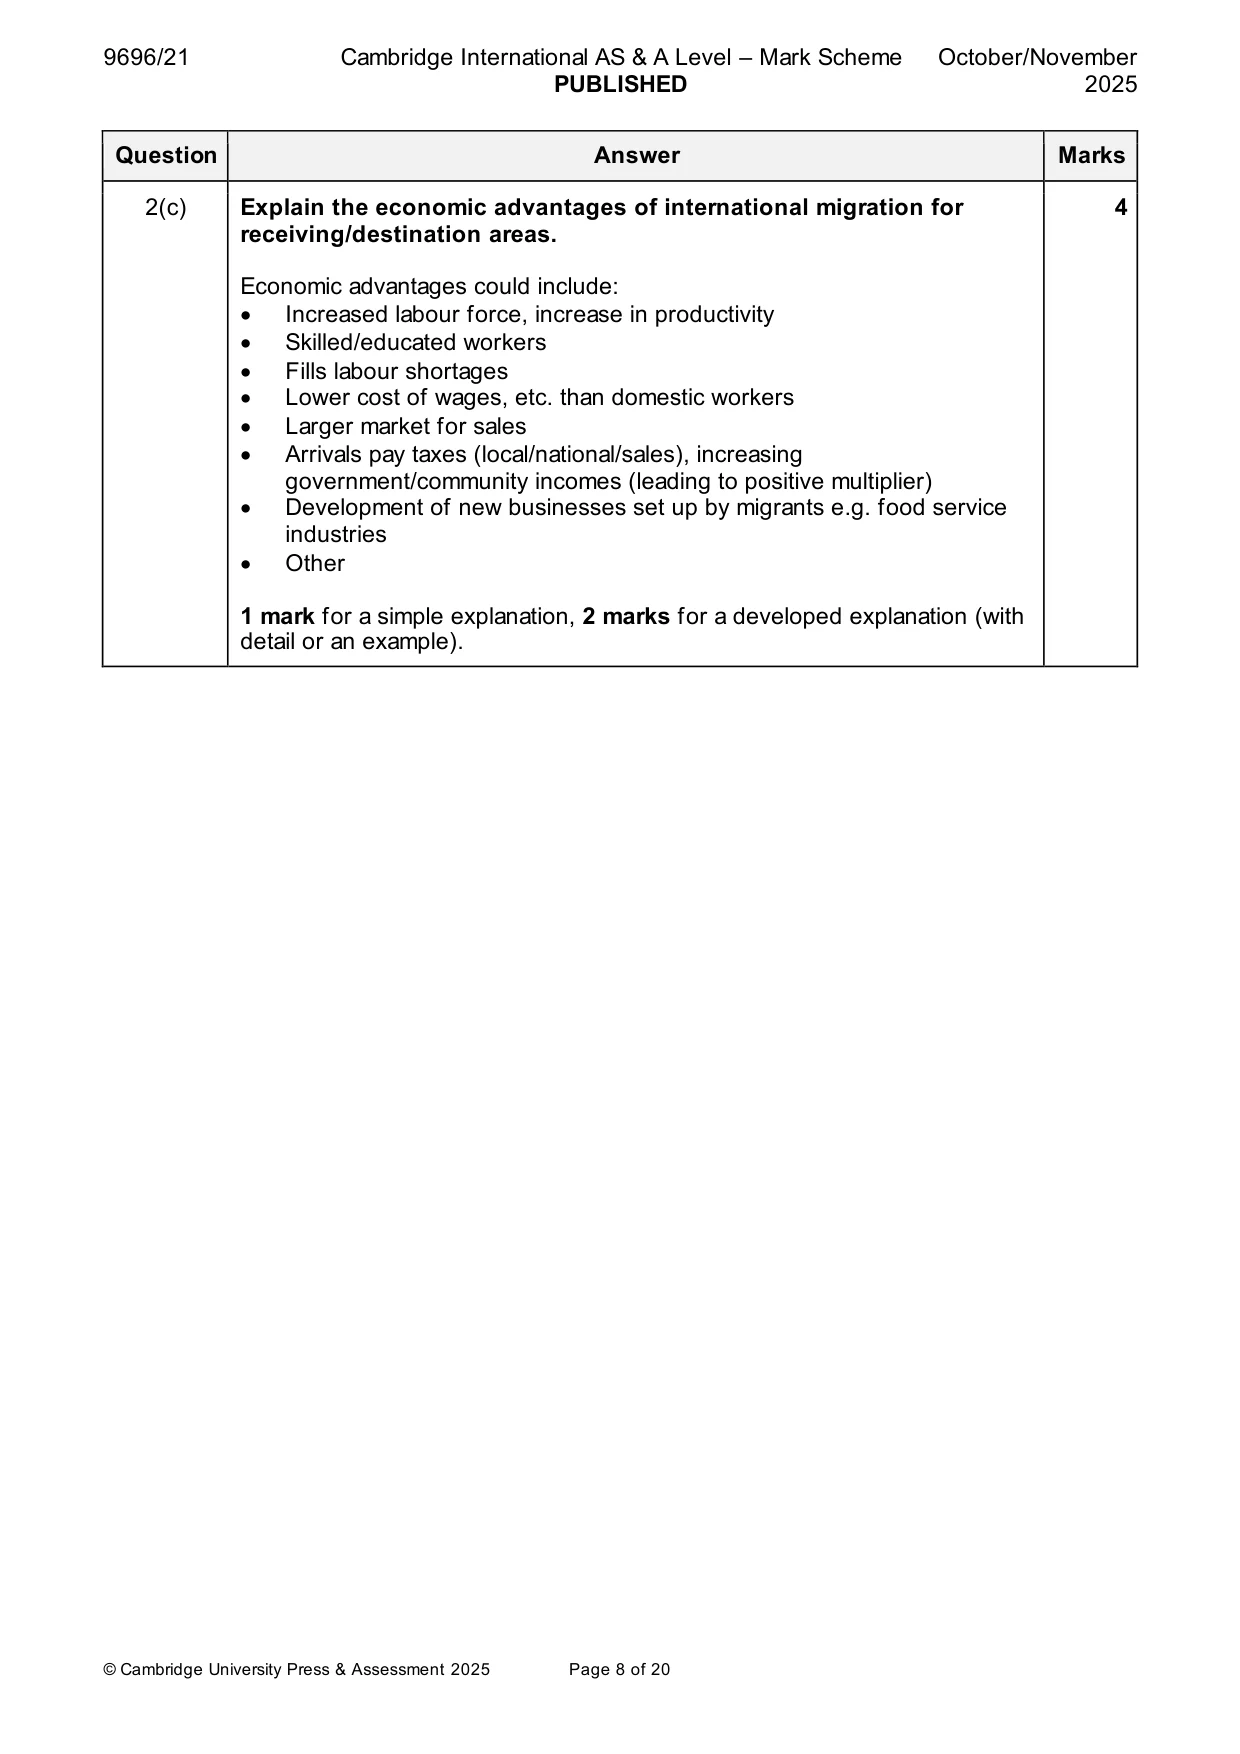
Mark scheme: 2(a) Fig. 2.1 shows the number of international migrants in each continent 4 from 1990 to 2020. Compare the changes in the number of international migrants shown in Fig. 2.1. Comparison includes both similarities and differences. Comparisons could include: • The number (of international migrants) increases in all continents • Numbers of migrants have nearly doubled in all continents • Asia and Europe have a similar increase numerically (just under 40 million in the period, 78% and 75%) • Oceania and South America and the Caribbean have a large overall increase though smaller numbers • Africa has the lowest % increase (62%), though migration has increased by 9.7 million, which is more than the increase in Oceania and South America and the Caribbean • Other 1 mark for simple comparative statement, 2 marks if supported with accurate data. Max. 1 mark if no comparison. 2(b) Explain one reason for international migration. 2 Reasons for international migration might be economic, social, environmental or political, pull and push factors, and could include: • Employment • Better pay • Improved work conditions • Better healthcare • Educational opportunities • Escape from unforeseen events e.g. conflict, natural disaster (refugees) • Other 1 mark for simple reason. 2 marks for developed reason. 2(c) Explain the economic advantages of international migration for 4 receiving/destination areas. Economic advantages could include: • Increased labour force, increase in productivity • Skilled/educated workers • Fills labour shortages • Lower cost of wages, etc. than domestic workers • Larger market for sales • Arrivals pay taxes (local/national/sales), increasing government/community incomes (leading to positive multiplier) • Development of new businesses set up by migrants e.g. food service industries • Other 1 mark for a simple explanation, 2 marks for a developed explanation (with detail or an example). Settlement dynamics
Q3 · A photograph which shows the skyline railway in Bangkok, Thailand, an MIC in Asia
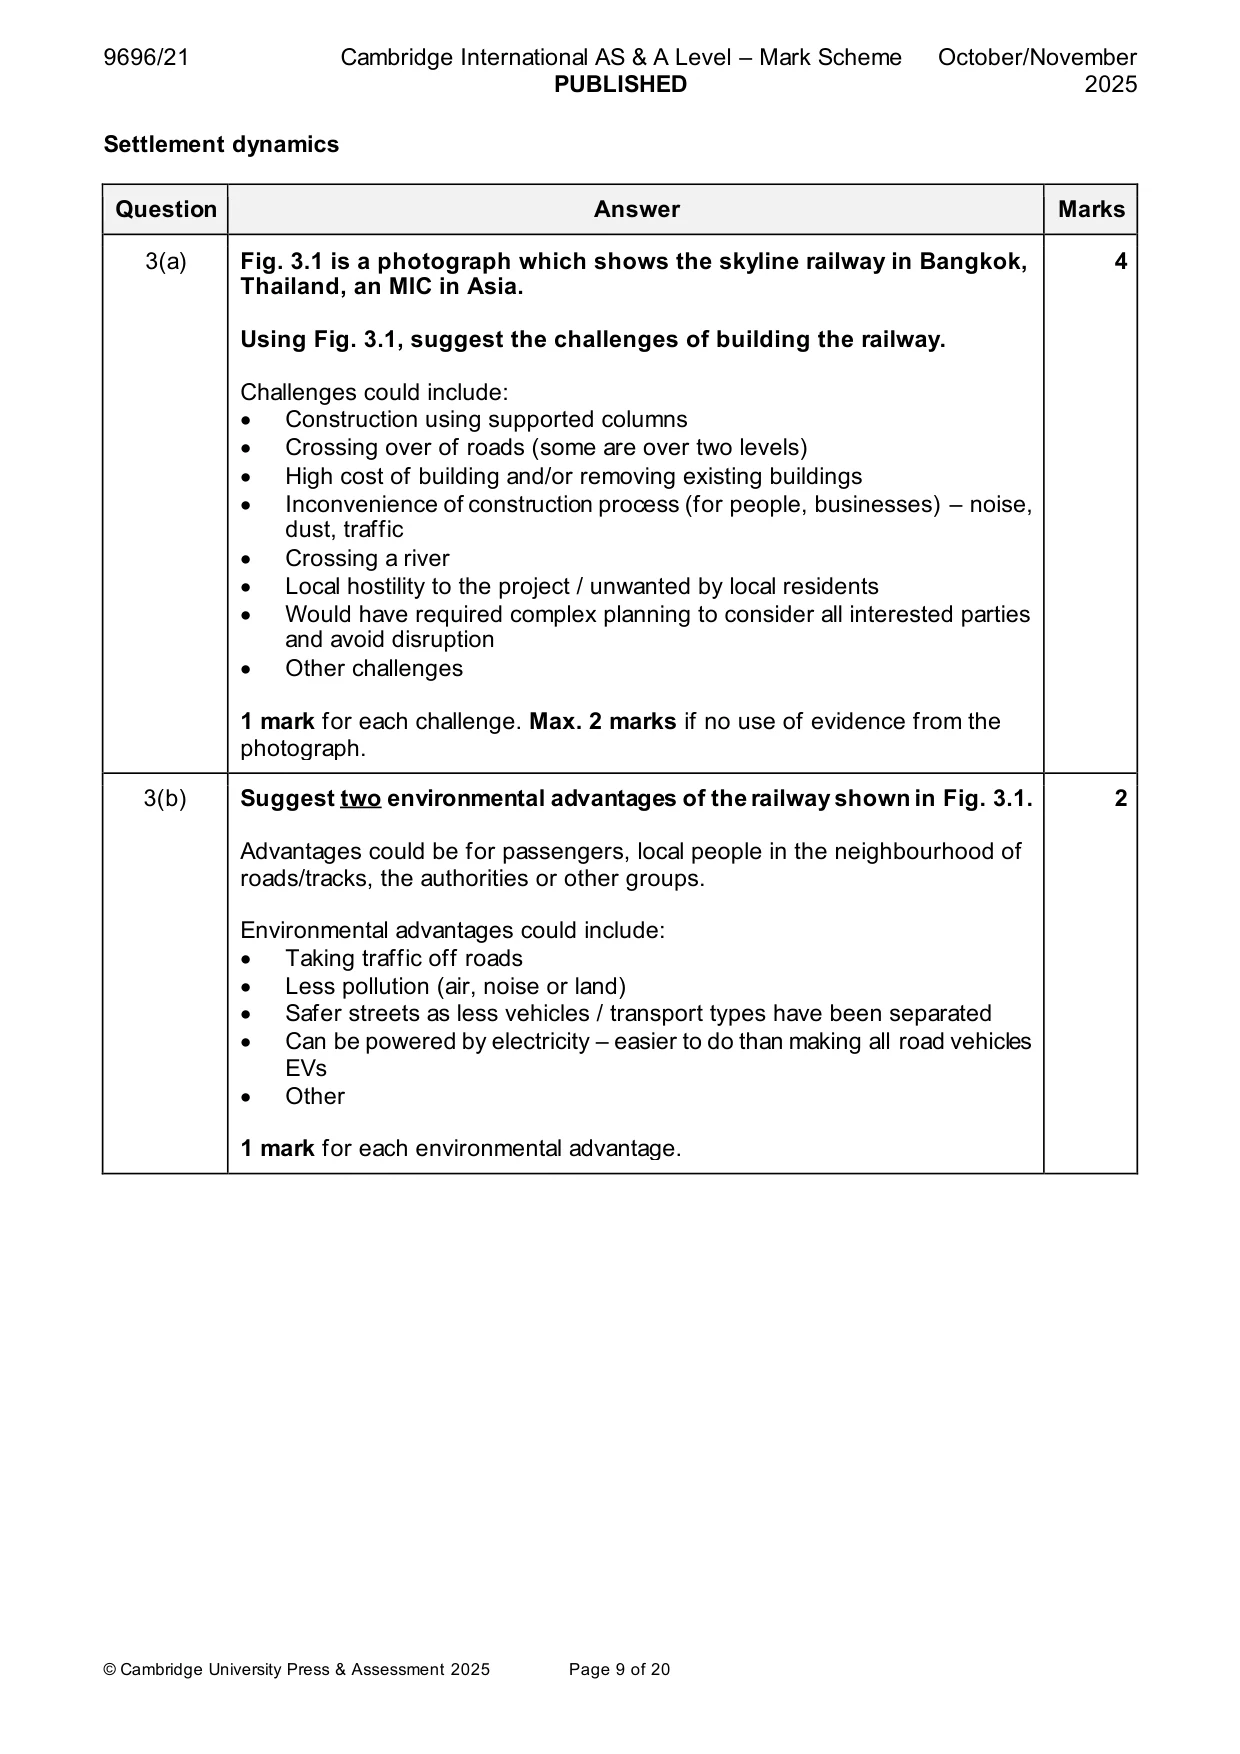
3 Fig. 3.1 is a photograph which shows the skyline railway in Bangkok, Thailand, an MIC in Asia. (a) Using Fig. 3.1, suggest the challenges of building the railway. [4] (b) Suggest two environmental advantages of the railway shown in Fig. 3.1. [2] (c) Explain how the use of land in urban areas is affected by competition for space (spatial competition). [4]
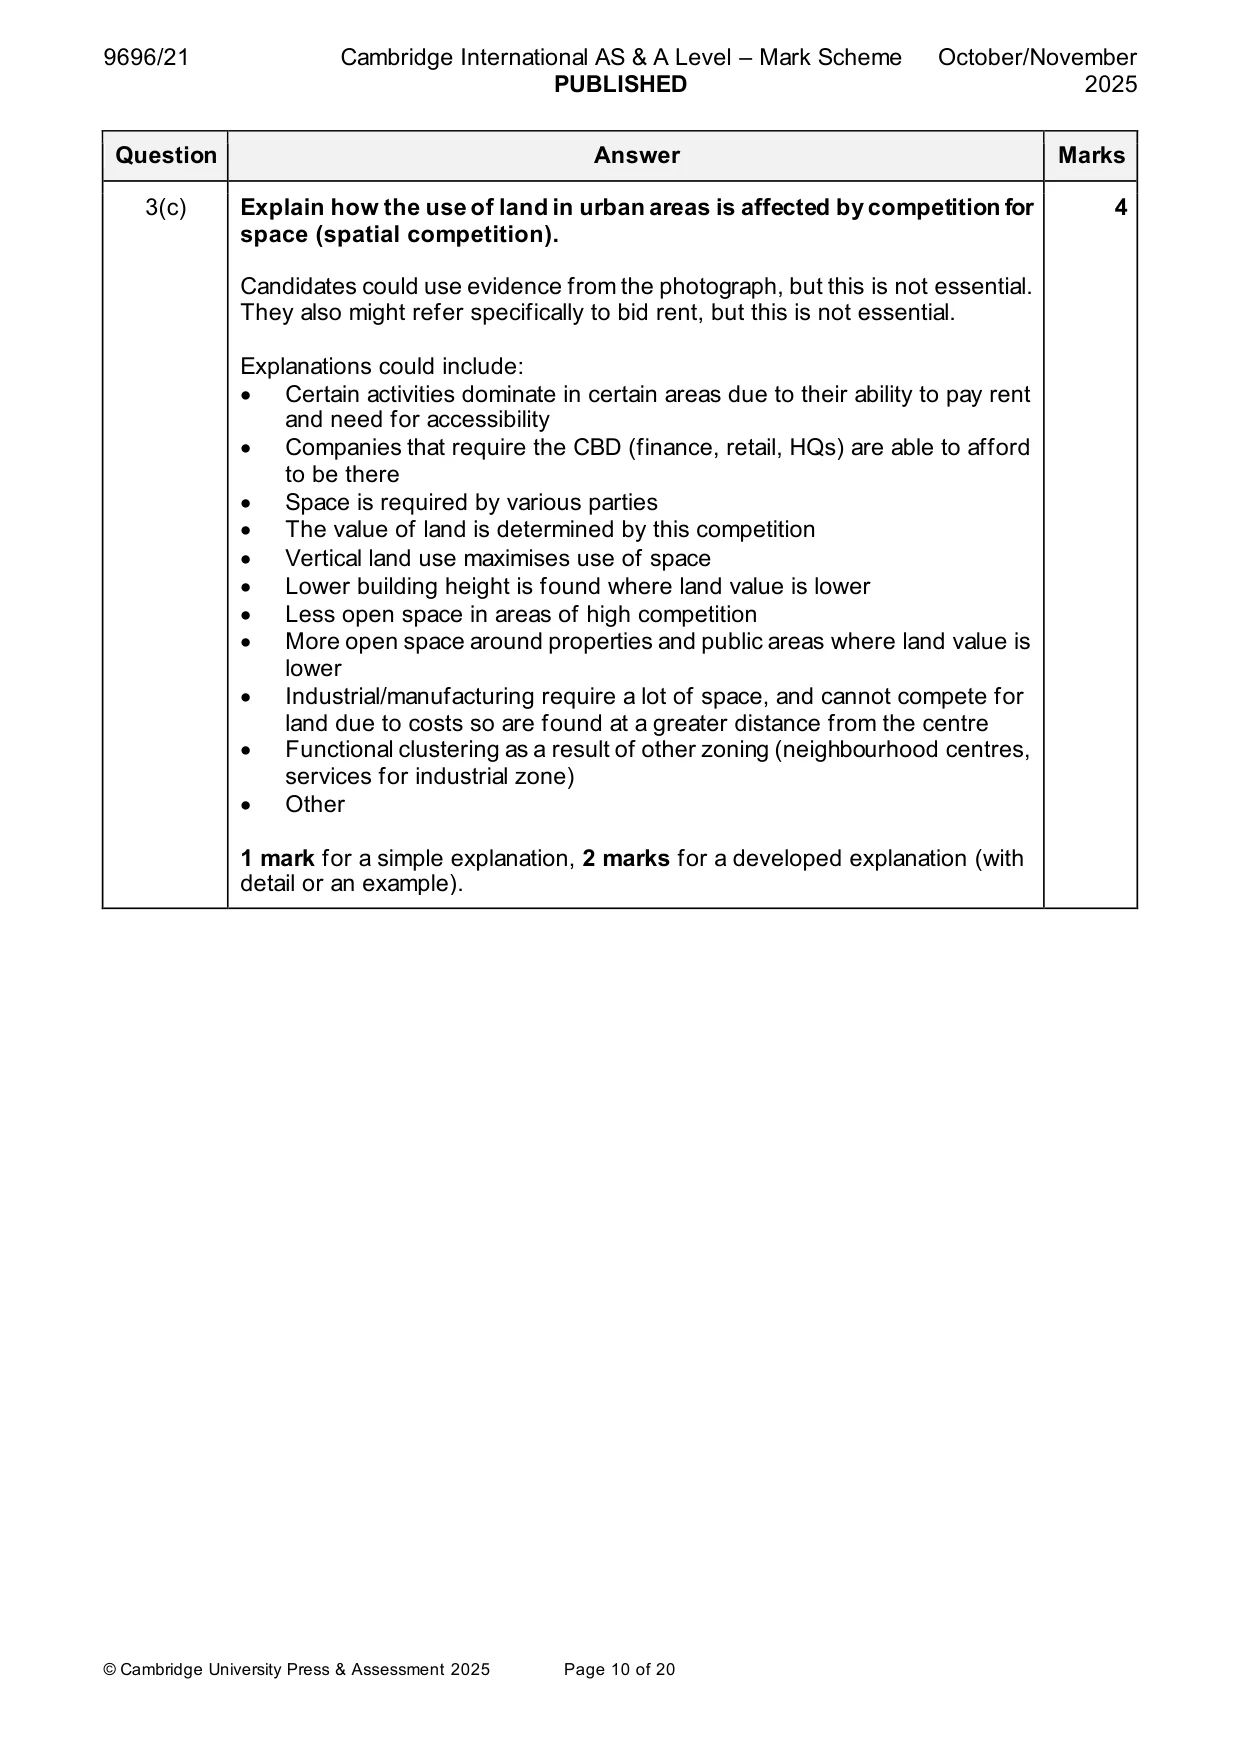
Mark scheme: 3(a) Fig. 3.1 is a photograph which shows the skyline railway in Bangkok, 4 Thailand, an MIC in Asia. Using Fig. 3.1, suggest the challenges of building the railway. Challenges could include: • Construction using supported columns • Crossing over of roads (some are over two levels) • High cost of building and/or removing existing buildings • Inconvenience of construction process (for people, businesses) – noise, dust, traffic • Crossing a river • Local hostility to the project / unwanted by local residents • Would have required complex planning to consider all interested parties and avoid disruption • Other challenges 1 mark for each challenge. Max. 2 marks if no use of evidence from the photograph. 3(b) Suggest two environmental advantages of the railway shown in Fig. 3.1. 2 Advantages could be for passengers, local people in the neighbourhood of roads/tracks, the authorities or other groups. Environmental advantages could include: • Taking traffic off roads • Less pollution (air, noise or land) • Safer streets as less vehicles / transport types have been separated • Can be powered by electricity – easier to do than making all road vehicles EVs • Other 1 mark for each environmental advantage. 3(c) Explain how the use of land in urban areas is affected by competition for 4 space (spatial competition). Candidates could use evidence from the photograph, but this is not essential. They also might refer specifically to bid rent, but this is not essential. Explanations could include: • Certain activities dominate in certain areas due to their ability to pay rent and need for accessibility • Companies that require the CBD (finance, retail, HQs) are able to afford to be there • Space is required by various parties • The value of land is determined by this competition • Vertical land use maximises use of space • Lower building height is found where land value is lower • Less open space in areas of high competition • More open space around properties and public areas where land value is lower • Industrial/manufacturing require a lot of space, and cannot compete for land due to costs so are found at a greater distance from the centre • Functional clustering as a result of other zoning (neighbourhood centres, services for industrial zone) • Other 1 mark for a simple explanation, 2 marks for a developed explanation (with detail or an example). Section B Answer one question from this section. All questions are worth 30 marks. Population
Q4 · Define the term ‘dependency ratio’
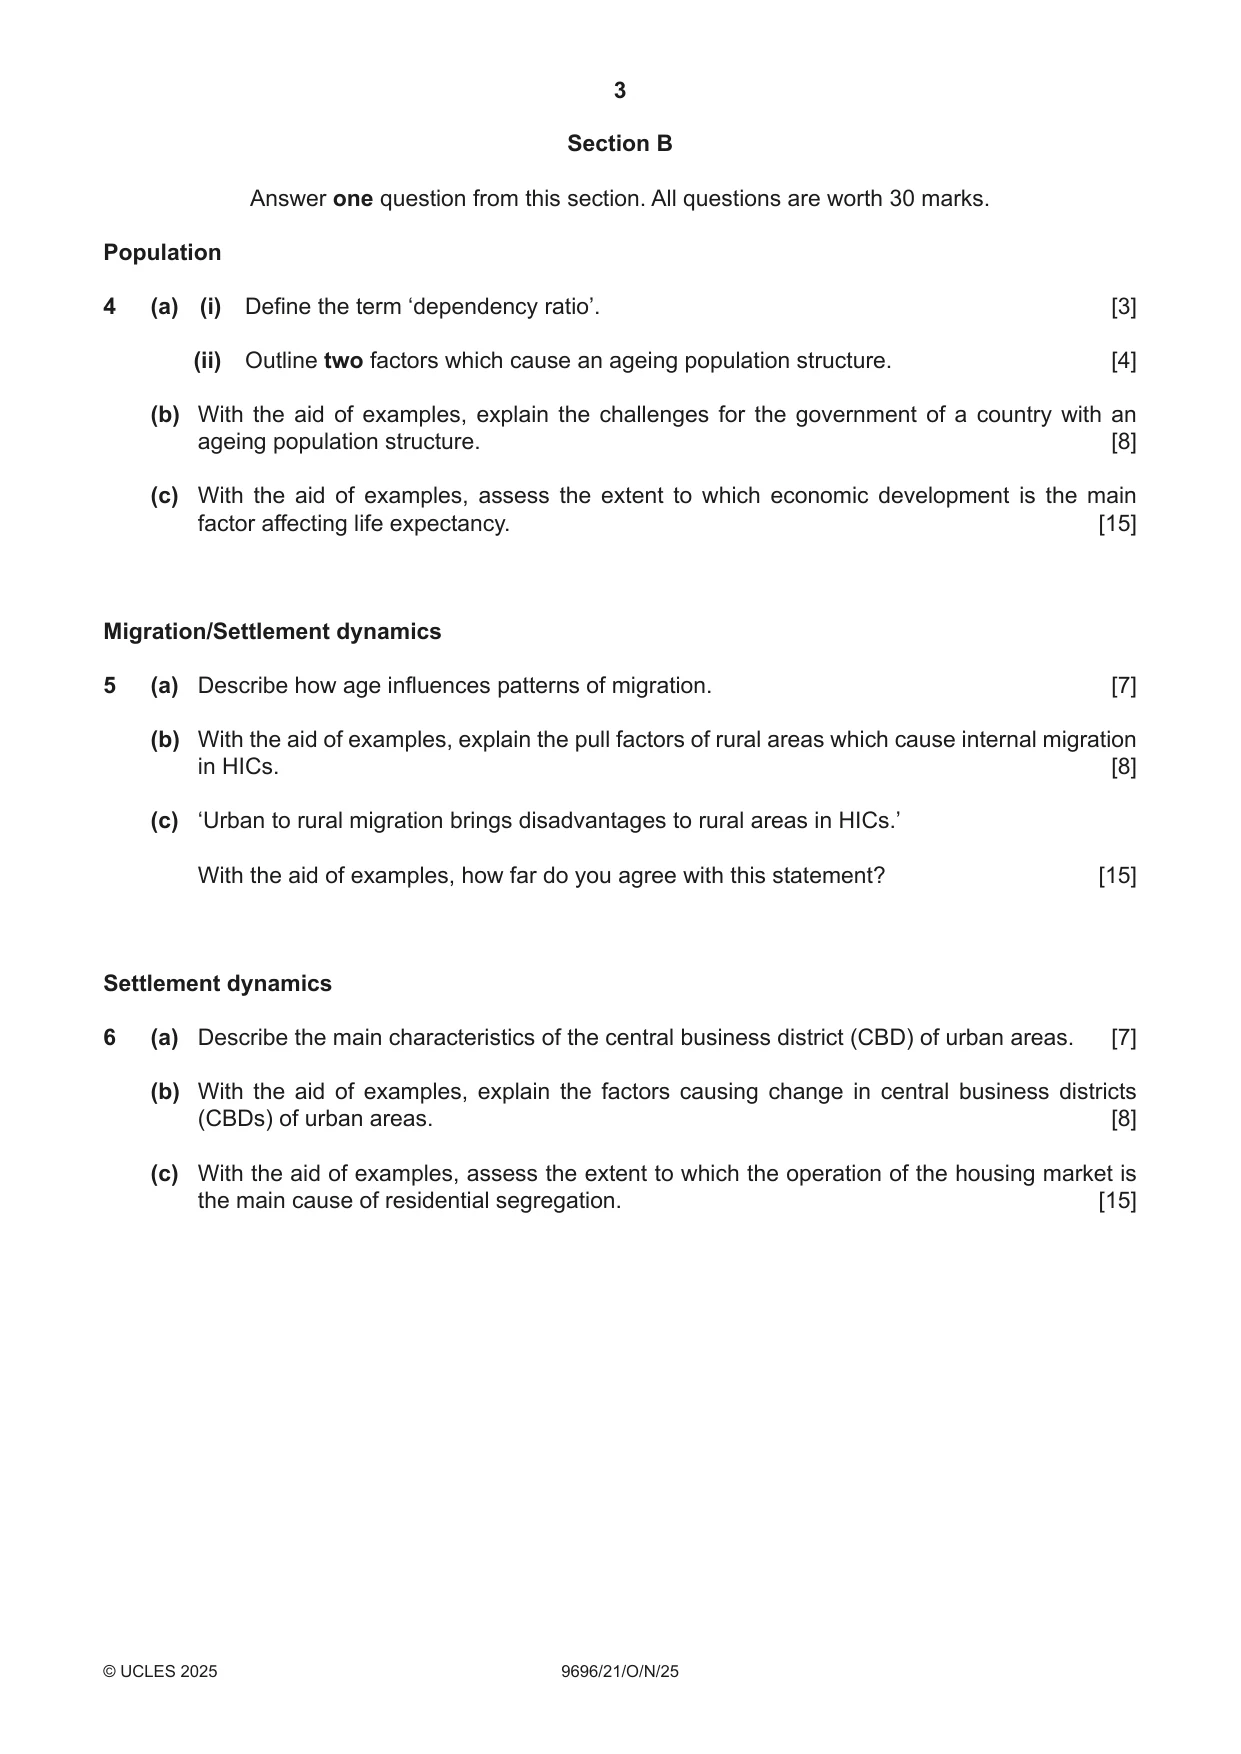
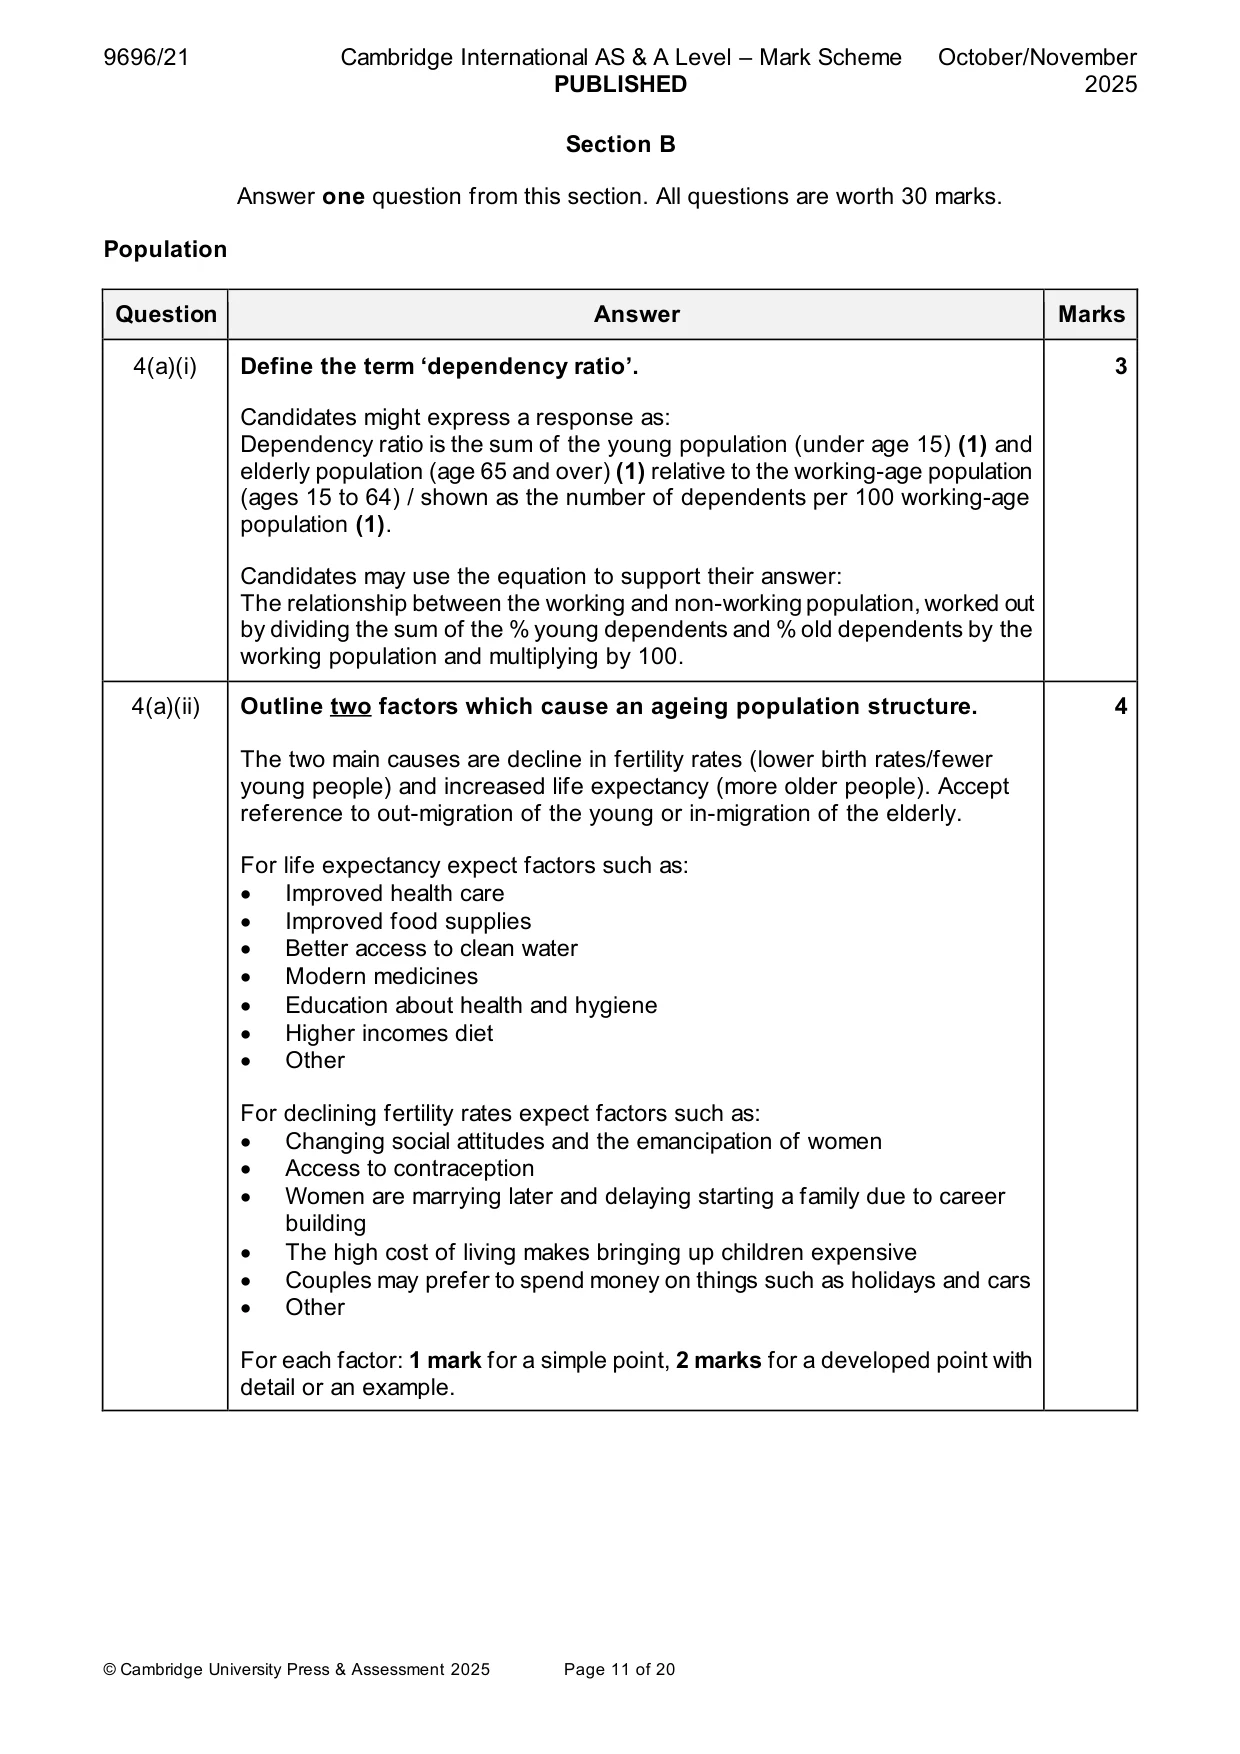
4 (a) (i) Define the term ‘dependency ratio’. [3] (ii) Outline two factors which cause an ageing population structure. [4] (b) With the aid of examples, explain the challenges for the government of a country with an ageing population structure. [8] (c) With the aid of examples, assess the extent to which economic development is the main factor affecting life expectancy. [15] Migration/Settlement dynamics
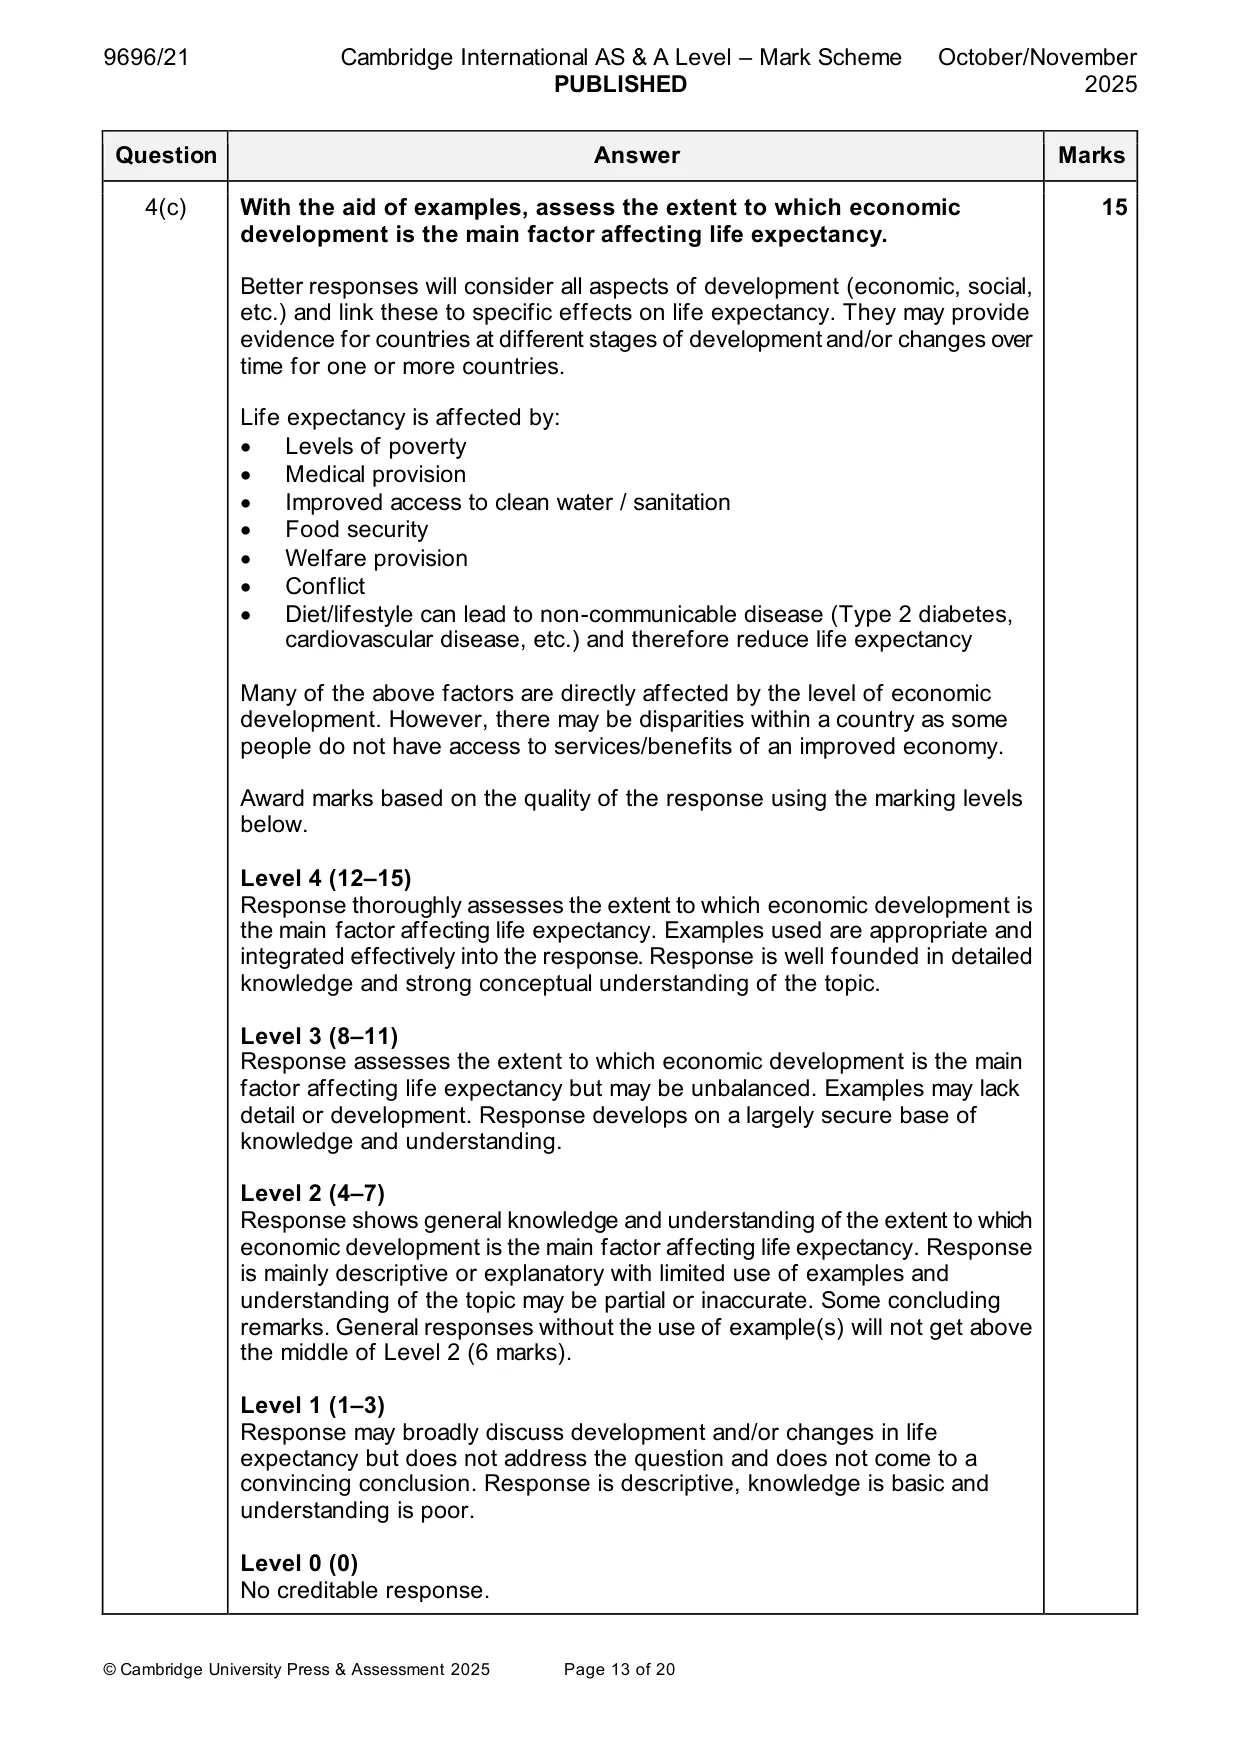
Mark scheme: 4(a)(i) Define the term ‘dependency ratio’. 3 Candidates might express a response as: Dependency ratio is the sum of the young population (under age 15) (1) and elderly population (age 65 and over) (1) relative to the working-age population (ages 15 to 64) / shown as the number of dependents per 100 working-age population (1). Candidates may use the equation to support their answer: The relationship between the working and non-working population, worked out by dividing the sum of the % young dependents and % old dependents by the working population and multiplying by 100. 4(a)(ii) Outline two factors which cause an ageing population structure. 4 The two main causes are decline in fertility rates (lower birth rates/fewer young people) and increased life expectancy (more older people). Accept reference to out-migration of the young or in-migration of the elderly. For life expectancy expect factors such as: • Improved health care • Improved food supplies • Better access to clean water • Modern medicines • Education about health and hygiene • Higher incomes diet • Other For declining fertility rates expect factors such as: • Changing social attitudes and the emancipation of women • Access to contraception • Women are marrying later and delaying starting a family due to career building • The high cost of living makes bringing up children expensive • Couples may prefer to spend money on things such as holidays and cars • Other For each factor: 1 mark for a simple point, 2 marks for a developed point with detail or an example. 4(b) With the aid of examples, explain the challenges for the government of a 8 country with an ageing population structure. Challenges could include: • Increased demand for health and social care services and facilities • Pension provision • Increased taxation for higher health and social care costs • The economically active group gets smaller – reduces productivity and innovation • Wage inflation • A growing dependent population • Decline in school population – closures • Mitigating increased expenditure may be politically controversial as need to cut funds for other services • Over-representation of values of older age groups in voting makes it hard for social change • Other Max. 4 marks if no valid examples. Award marks based on the quality of explanation and breadth of the response using the marking levels below. Level 3 (6–8) Response clearly explains the challenges for the government of a country with an ageing population structure. Response is well founded in detailed knowledge and strong conceptual understanding of the topic. Examples used are appropriate and integrated effectively into the response. Level 2 (3–5) Response explains the challenges for the government of a country with an ageing population structure. Response develops on a largely secure base of knowledge and understanding. Examples may lack detail or development. Level 1 (1–2) Response is largely descriptive of the challenges of an ageing population. Knowledge is basic and understanding may be inaccurate. Examples are in name only or lacking entirely. Level 0 (0) No creditable response. 4(c) With the aid of examples, assess the extent to which economic 15 development is the main factor affecting life expectancy. Better responses will consider all aspects of development (economic, social, etc.) and link these to specific effects on life expectancy. They may provide evidence for countries at different stages of development and/or changes over time for one or more countries. Life expectancy is affected by: • Levels of poverty • Medical provision • Improved access to clean water / sanitation • Food security • Welfare provision • Conflict • Diet/lifestyle can lead to non-communicable disease (Type 2 diabetes, cardiovascular disease, etc.) and therefore reduce life expectancy Many of the above factors are directly affected by the level of economic development. However, there may be disparities within a country as some people do not have access to services/benefits of an improved economy. Award marks based on the quality of the response using the marking levels below. Level 4 (12–15) Response thoroughly assesses the extent to which economic development is the main factor affecting life expectancy. Examples used are appropriate and integrated effectively into the response. Response is well founded in detailed knowledge and strong conceptual understanding of the topic. Level 3 (8–11) Response assesses the extent to which economic development is the main factor affecting life expectancy but may be unbalanced. Examples may lack detail or development. Response develops on a largely secure base of knowledge and understanding. Level 2 (4–7) Response shows general knowledge and understanding of the extent to which economic development is the main factor affecting life expectancy. Response is mainly descriptive or explanatory with limited use of examples and understanding of the topic may be partial or inaccurate. Some concluding remarks. General responses without the use of example(s) will not get above the middle of Level 2 (6 marks). Level 1 (1–3) Response may broadly discuss development and/or changes in life expectancy but does not address the question and does not come to a convincing conclusion. Response is descriptive, knowledge is basic and understanding is poor. Level 0 (0) No creditable response. Migration/Settlement dynamics
Q5 · Describe how age influences patterns of migration
5 (a) Describe how age influences patterns of migration. [7] (b) With the aid of examples, explain the pull factors of rural areas which cause internal migration in HICs. [8] (c) ‘Urban to rural migration brings disadvantages to rural areas in HICs.’ With the aid of examples, how far do you agree with this statement? [15] Settlement dynamics
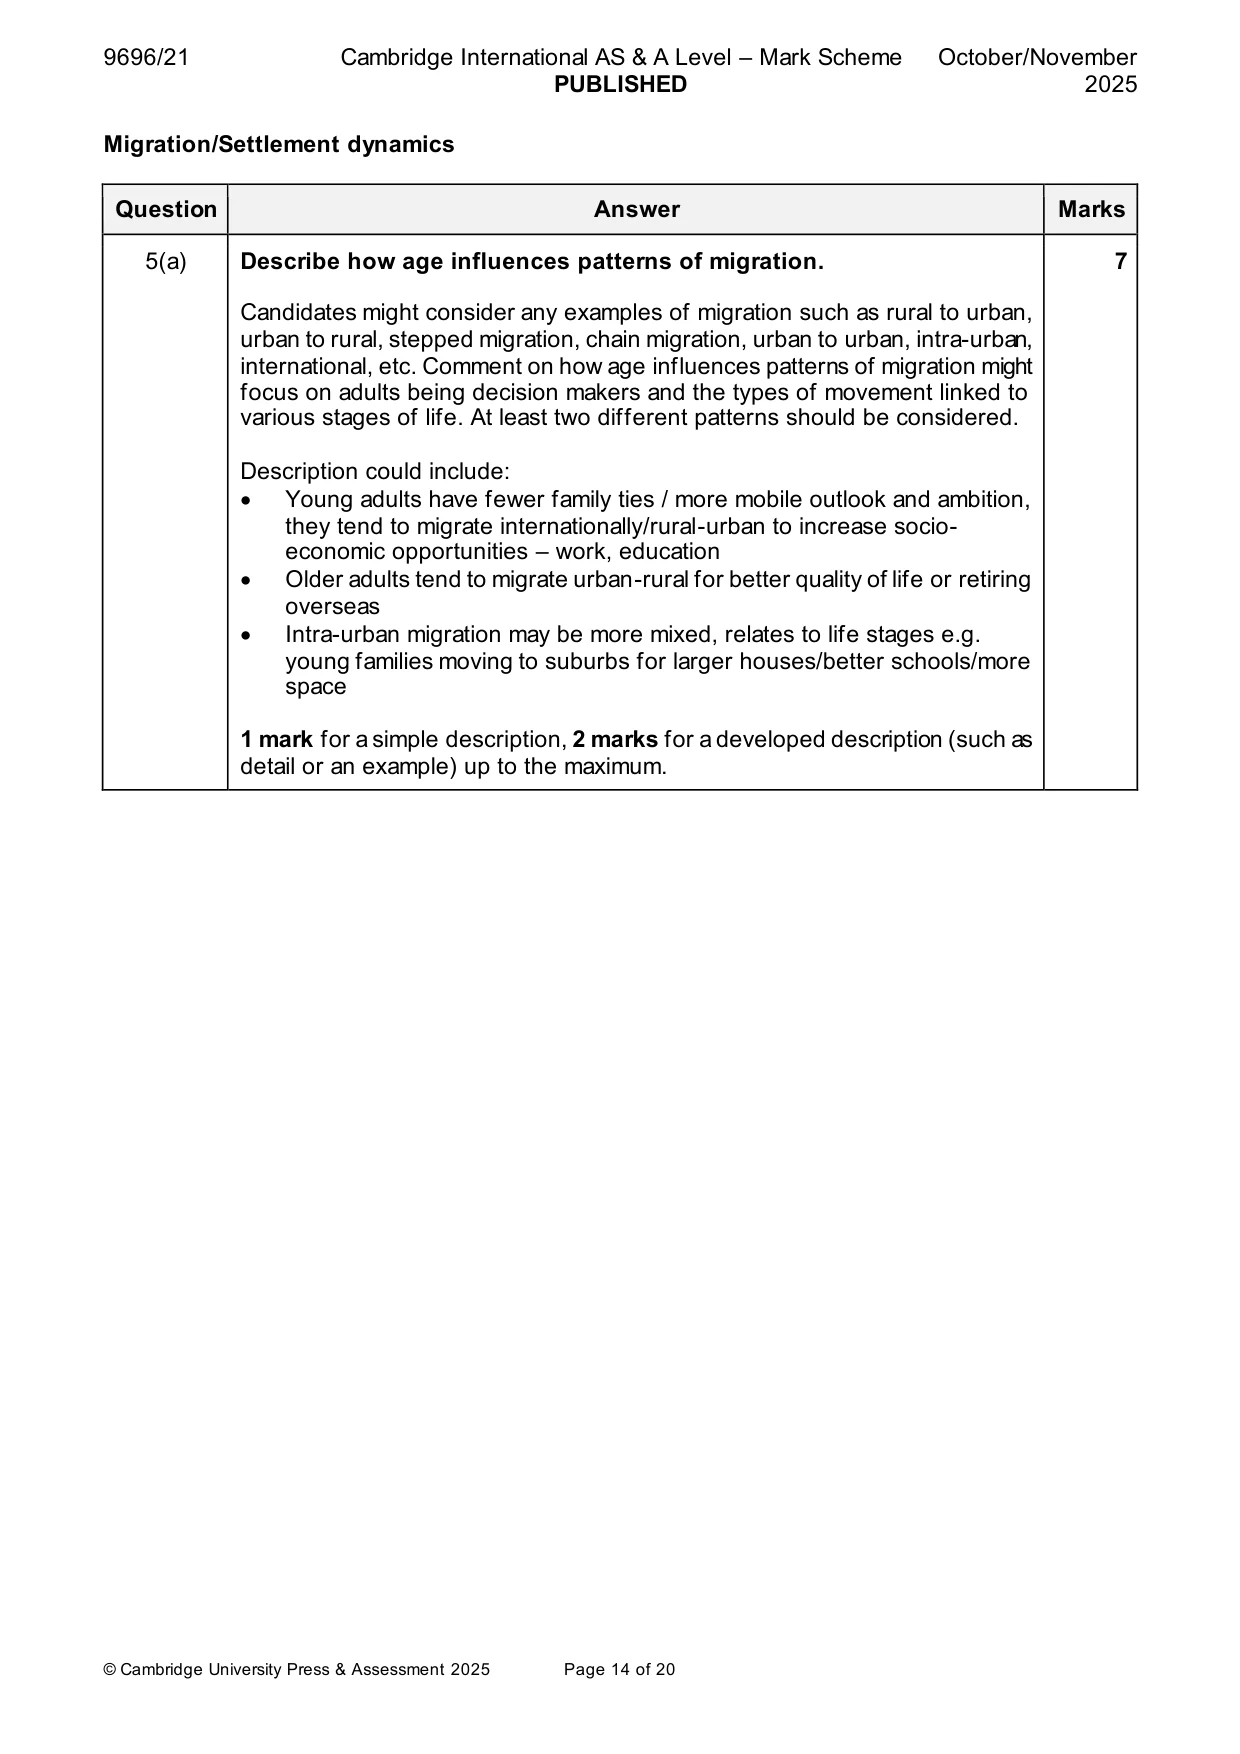
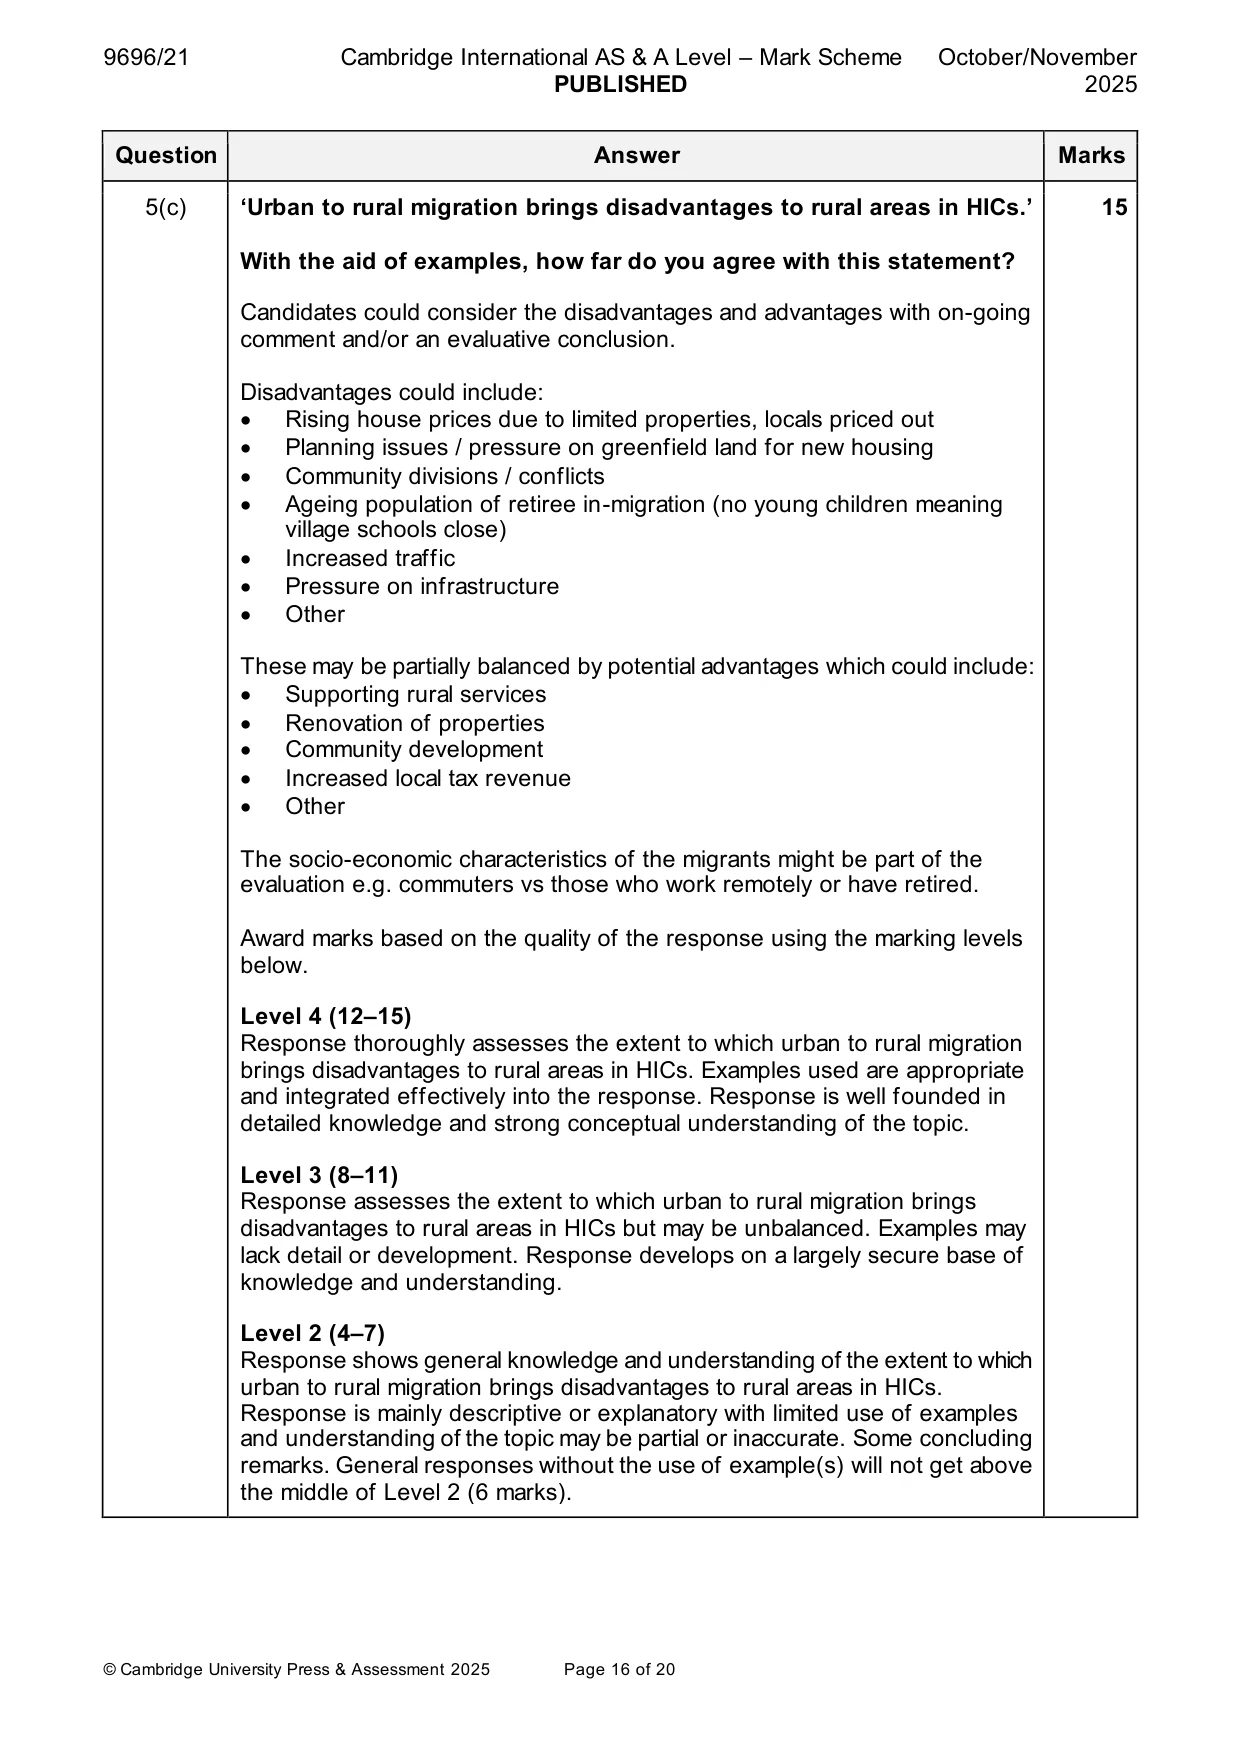
Mark scheme: 5(a) Describe how age influences patterns of migration. 7 Candidates might consider any examples of migration such as rural to urban, urban to rural, stepped migration, chain migration, urban to urban, intra-urban, international, etc. Comment on how age influences patterns of migration might focus on adults being decision makers and the types of movement linked to various stages of life. At least two different patterns should be considered. Description could include: • Young adults have fewer family ties / more mobile outlook and ambition, they tend to migrate internationally/rural-urban to increase socio- economic opportunities – work, education • Older adults tend to migrate urban-rural for better quality of life or retiring overseas • Intra-urban migration may be more mixed, relates to life stages e.g. young families moving to suburbs for larger houses/better schools/more space 1 mark for a simple description, 2 marks for a developed description (such as detail or an example) up to the maximum. 5(b) With the aid of examples, explain the pull factors of rural areas which 8 cause internal migration in HICs. Candidates may consider economic, social, environmental or political pull factors of rural areas. These could include: • Lower cost of living • Bigger/cheaper housing with more outdoor space • Cleaner greener environment • Access to outdoor recreational pursuits • Lower crime / anti-social behaviour • More positive community relations / like-minded people in the community • Better education / possibly less strain on services • Improved internet in rural areas / ability to work from home • Lower land values • Government investment • Other Max. 4 marks if no valid examples or a generic response without reference to the HIC context. Award marks based on the quality of explanation and breadth of the response using the marking levels below. Level 3 (6–8) Response clearly explains the pull factors of rural areas which cause internal migration in HICs. Response is well founded in detailed knowledge and strong conceptual understanding of the topic. Examples used are appropriate and integrated effectively into the response. Level 2 (3–5) Response explains the pull factors of rural areas which cause internal migration in HICs. Response develops on a largely secure base of knowledge and understanding. Examples may lack detail or development. Level 1 (1–2) Response is largely descriptive of the pull factors of rural areas which cause internal migration in HICs. Knowledge is basic and understanding may be inaccurate. Examples are in name only or lacking entirely. Level 0 (0) No creditable response. 5(c) ‘Urban to rural migration brings disadvantages to rural areas in HICs.’ 15 With the aid of examples, how far do you agree with this statement? Candidates could consider the disadvantages and advantages with on-going comment and/or an evaluative conclusion. Disadvantages could include: • Rising house prices due to limited properties, locals priced out • Planning issues / pressure on greenfield land for new housing • Community divisions / conflicts • Ageing population of retiree in-migration (no young children meaning village schools close) • Increased traffic • Pressure on infrastructure • Other These may be partially balanced by potential advantages which could include: • Supporting rural services • Renovation of properties • Community development • Increased local tax revenue • Other The socio-economic characteristics of the migrants might be part of the evaluation e.g. commuters vs those who work remotely or have retired. Award marks based on the quality of the response using the marking levels below. Level 4 (12–15) Response thoroughly assesses the extent to which urban to rural migration brings disadvantages to rural areas in HICs. Examples used are appropriate and integrated effectively into the response. Response is well founded in detailed knowledge and strong conceptual understanding of the topic. Level 3 (8–11) Response assesses the extent to which urban to rural migration brings disadvantages to rural areas in HICs but may be unbalanced. Examples may lack detail or development. Response develops on a largely secure base of knowledge and understanding. Level 2 (4–7) Response shows general knowledge and understanding of the extent to which urban to rural migration brings disadvantages to rural areas in HICs. Response is mainly descriptive or explanatory with limited use of examples and understanding of the topic may be partial or inaccurate. Some concluding remarks. General responses without the use of example(s) will not get above the middle of Level 2 (6 marks). 5(c) Level 1 (1–3) Response may broadly discuss urban to rural migration but does not address the question and does not come to a convincing conclusion. Response is descriptive, knowledge is basic and understanding is poor. Level 0 (0) No creditable response. Settlement dynamics
Q6 · Describe the main characteristics of the central business district (CBD) of urban areas
6 (a) Describe the main characteristics of the central business district (CBD) of urban areas. [7] (b) With the aid of examples, explain the factors causing change in central business districts (CBDs) of urban areas. [8] (c) With the aid of examples, assess the extent to which the operation of the housing market is the main cause of residential segregation. [15]
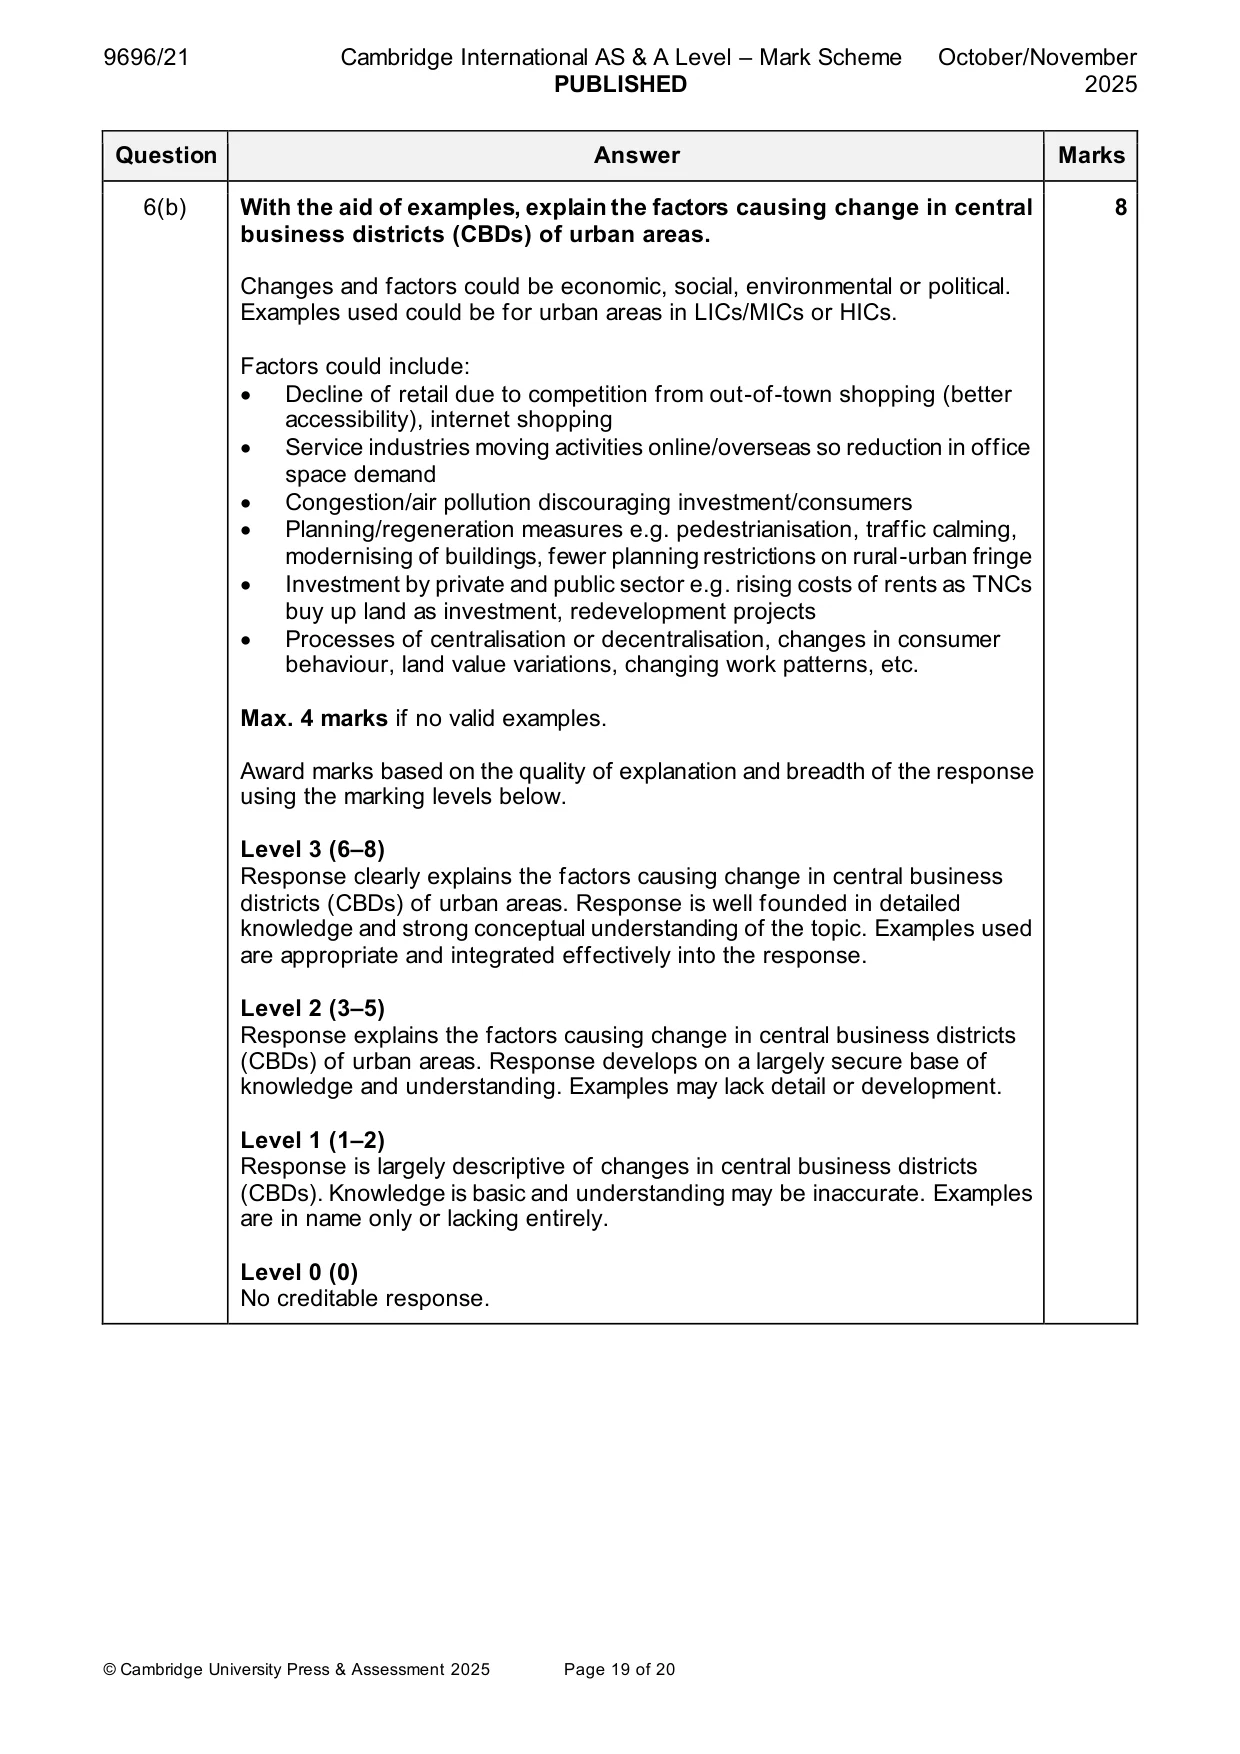
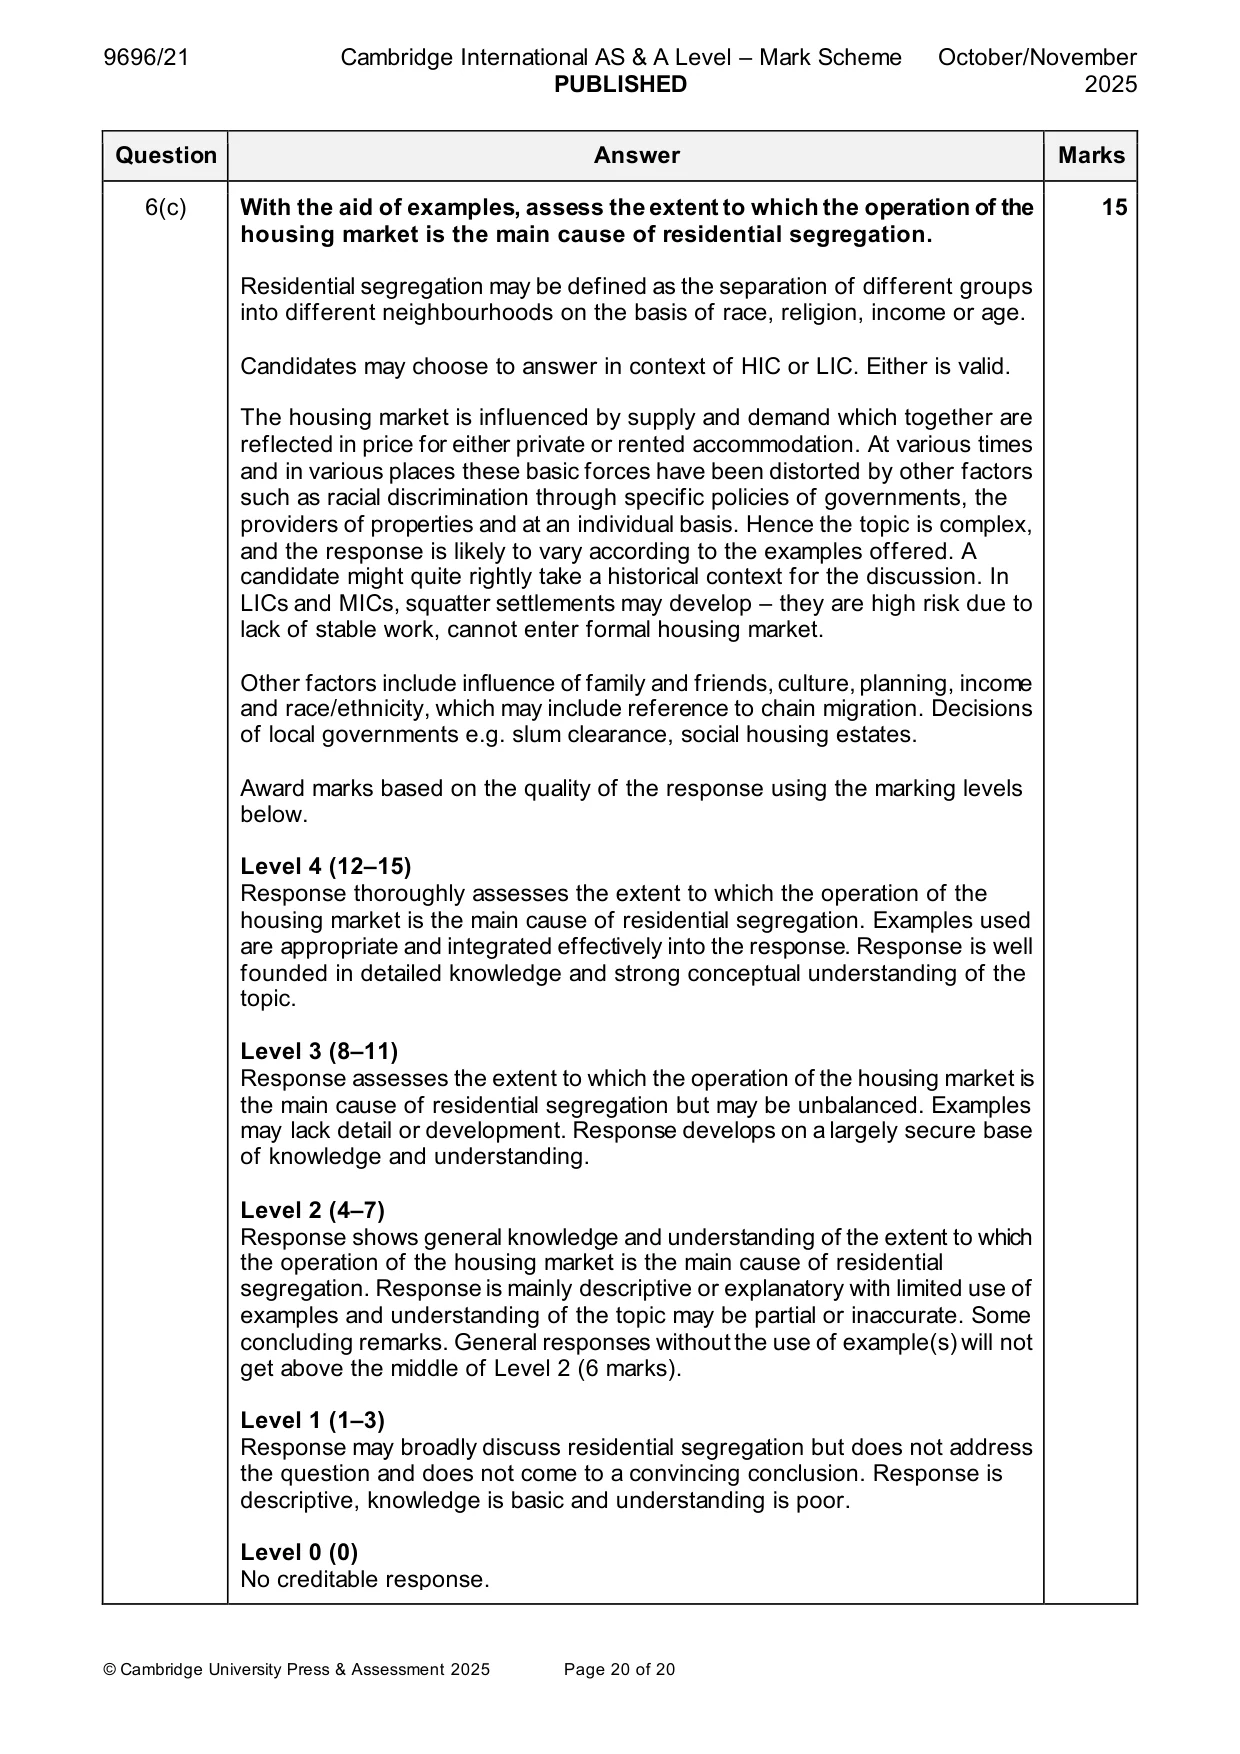
Mark scheme: 6(a) Describe the main characteristics of the central business district (CBD) 7 of urban areas. Characteristics could include: • Most expensive land in the city – Peak Land Value Intersection • Multi-storey buildings • High density of shops and offices • Low residential population • Internationally recognised brands on offer • High pedestrian ‘footfall’ • Traffic congestion and traffic calming measures • High density of roads and buildings • Lack of open space • High order shops e.g. department stores • Commercial zone • Modern shopping malls and pedestrian precincts • Cultural/historical buildings e.g. museums and castles (historic core) • Offices e.g. business sector • Entertainment/hospitality e.g. theatres, restaurants, hotels, clubs • Transport hub – bus and railway stations • Important administrative buildings such as government offices • Area of redevelopment / flagship developments • Other 1 mark for a simple description, 2 marks for a developed description (such as detail or an example) up to the maximum. 6(b) With the aid of examples, explain the factors causing change in central 8 business districts (CBDs) of urban areas. Changes and factors could be economic, social, environmental or political. Examples used could be for urban areas in LICs/MICs or HICs. Factors could include: • Decline of retail due to competition from out-of-town shopping (better accessibility), internet shopping • Service industries moving activities online/overseas so reduction in office space demand • Congestion/air pollution discouraging investment/consumers • Planning/regeneration measures e.g. pedestrianisation, traffic calming, modernising of buildings, fewer planning restrictions on rural-urban fringe • Investment by private and public sector e.g. rising costs of rents as TNCs buy up land as investment, redevelopment projects • Processes of centralisation or decentralisation, changes in consumer behaviour, land value variations, changing work patterns, etc. Max. 4 marks if no valid examples. Award marks based on the quality of explanation and breadth of the response using the marking levels below. Level 3 (6–8) Response clearly explains the factors causing change in central business districts (CBDs) of urban areas. Response is well founded in detailed knowledge and strong conceptual understanding of the topic. Examples used are appropriate and integrated effectively into the response. Level 2 (3–5) Response explains the factors causing change in central business districts (CBDs) of urban areas. Response develops on a largely secure base of knowledge and understanding. Examples may lack detail or development. Level 1 (1–2) Response is largely descriptive of changes in central business districts (CBDs). Knowledge is basic and understanding may be inaccurate. Examples are in name only or lacking entirely. Level 0 (0) No creditable response. 6(c) With the aid of examples, assess the extent to which the operation of the 15 housing market is the main cause of residential segregation. Residential segregation may be defined as the separation of different groups into different neighbourhoods on the basis of race, religion, income or age. Candidates may choose to answer in context of HIC or LIC. Either is valid. The housing market is influenced by supply and demand which together are reflected in price for either private or rented accommodation. At various times and in various places these basic forces have been distorted by other factors such as racial discrimination through specific policies of governments, the providers of properties and at an individual basis. Hence the topic is complex, and the response is likely to vary according to the examples offered. A candidate might quite rightly take a historical context for the discussion. In LICs and MICs, squatter settlements may develop – they are high risk due to lack of stable work, cannot enter formal housing market. Other factors include influence of family and friends, culture, planning, income and race/ethnicity, which may include reference to chain migration. Decisions of local governments e.g. slum clearance, social housing estates. Award marks based on the quality of the response using the marking levels below. Level 4 (12–15) Response thoroughly assesses the extent to which the operation of the housing market is the main cause of residential segregation. Examples used are appropriate and integrated effectively into the response. Response is well founded in detailed knowledge and strong conceptual understanding of the topic. Level 3 (8–11) Response assesses the extent to which the operation of the housing market is the main cause of residential segregation but may be unbalanced. Examples may lack detail or development. Response develops on a largely secure base of knowledge and understanding. Level 2 (4–7) Response shows general knowledge and understanding of the extent to which the operation of the housing market is the main cause of residential segregation. Response is mainly descriptive or explanatory with limited use of examples and understanding of the topic may be partial or inaccurate. Some concluding remarks. General responses without the use of example(s) will not get above the middle of Level 2 (6 marks). Level 1 (1–3) Response may broadly discuss residential segregation but does not address the question and does not come to a convincing conclusion. Response is descriptive, knowledge is basic and understanding is poor. Level 0 (0) No creditable response.
What was in this paper
The subtopics covered by these 6 questions, and how many questions each got. Open one in a new tab to see every Cambridge question on it.
What you needed in this session
Cambridge’s own grade thresholds for 2025 Oct/Nov, Paper 2 · Variant 1. A higher threshold means an easier paper — the bar moves with how the cohort did.