Cambridge A Level Geography 9696 — 2024 Oct/Nov Paper 2 · Variant 1
9696/21/O/N/24 · 6 questions · 60 marks · ≈68 min
The question paper and its mark scheme, free to read here and free to download. This is Cambridge’s own paper, exactly as it was sat.
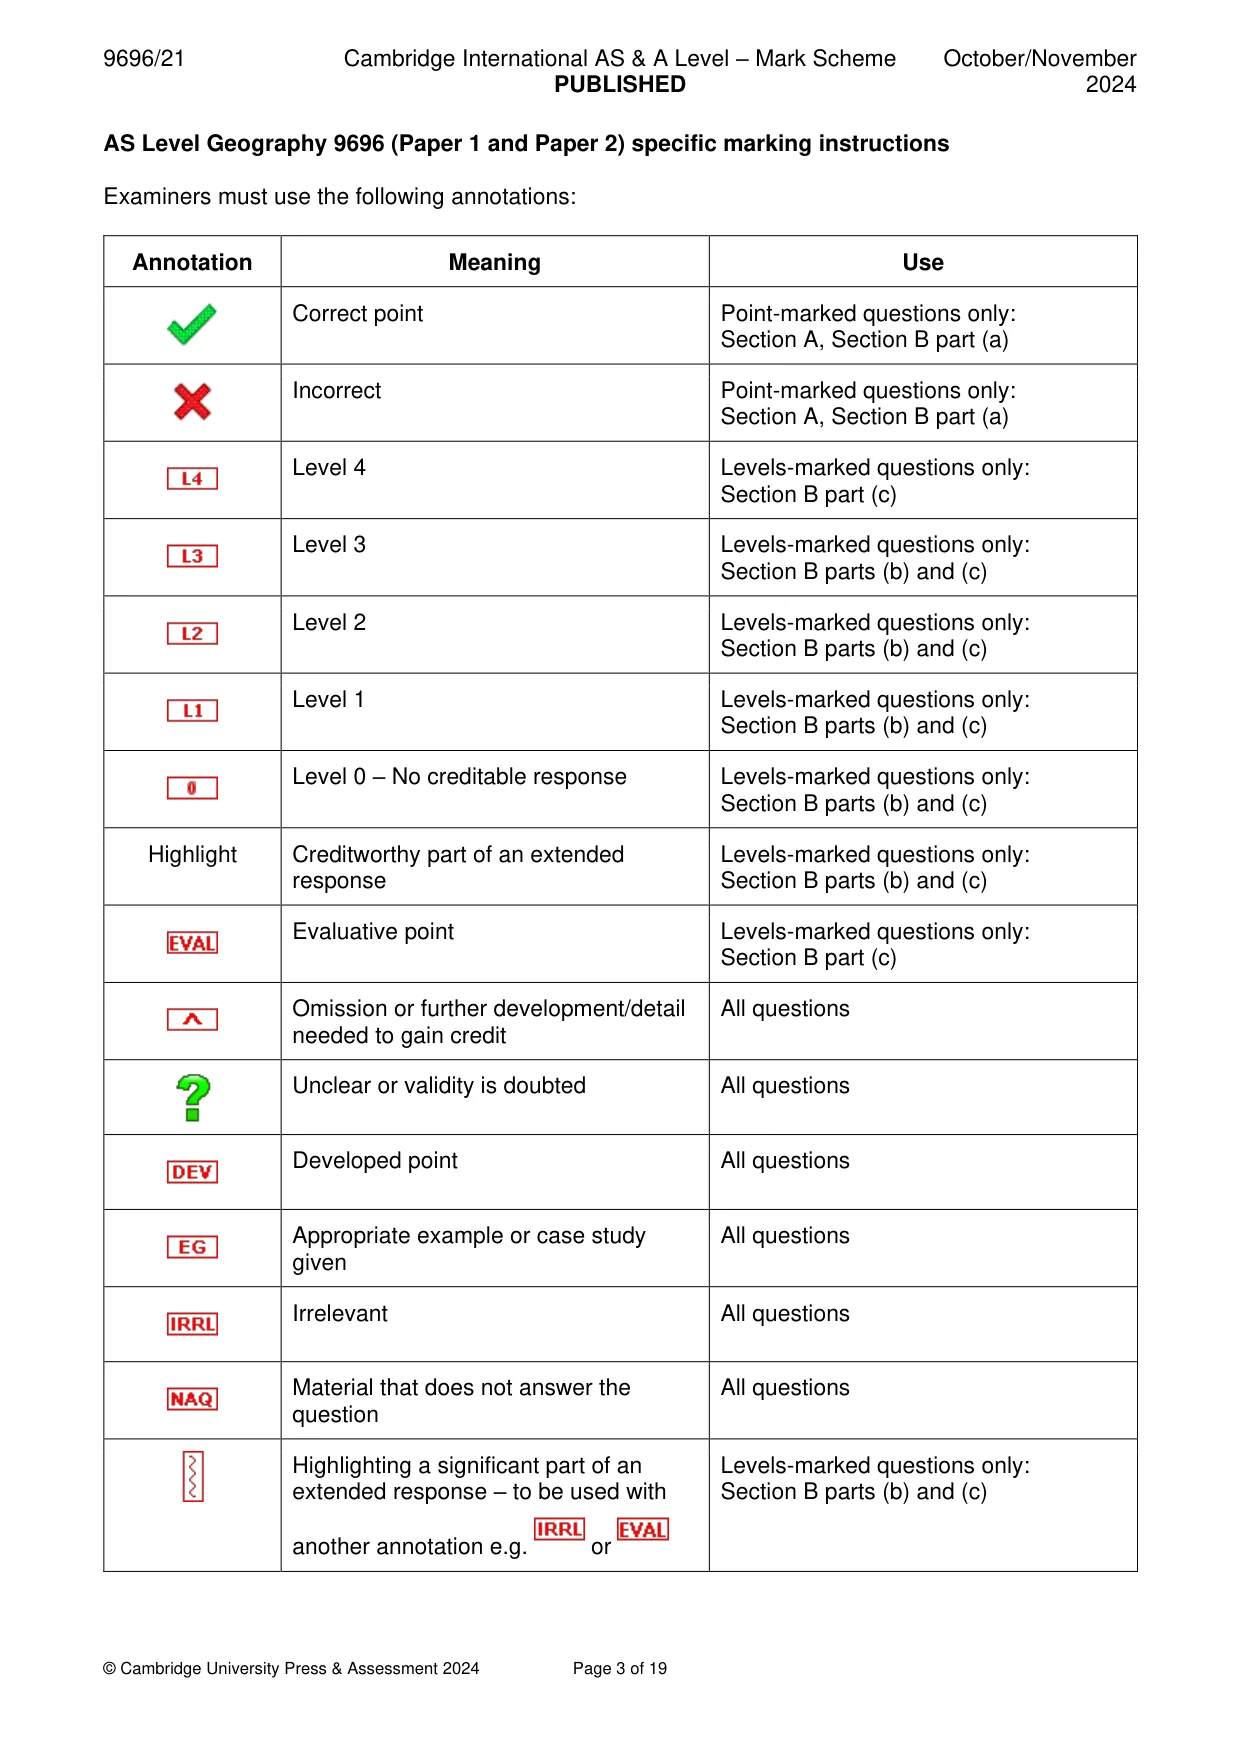
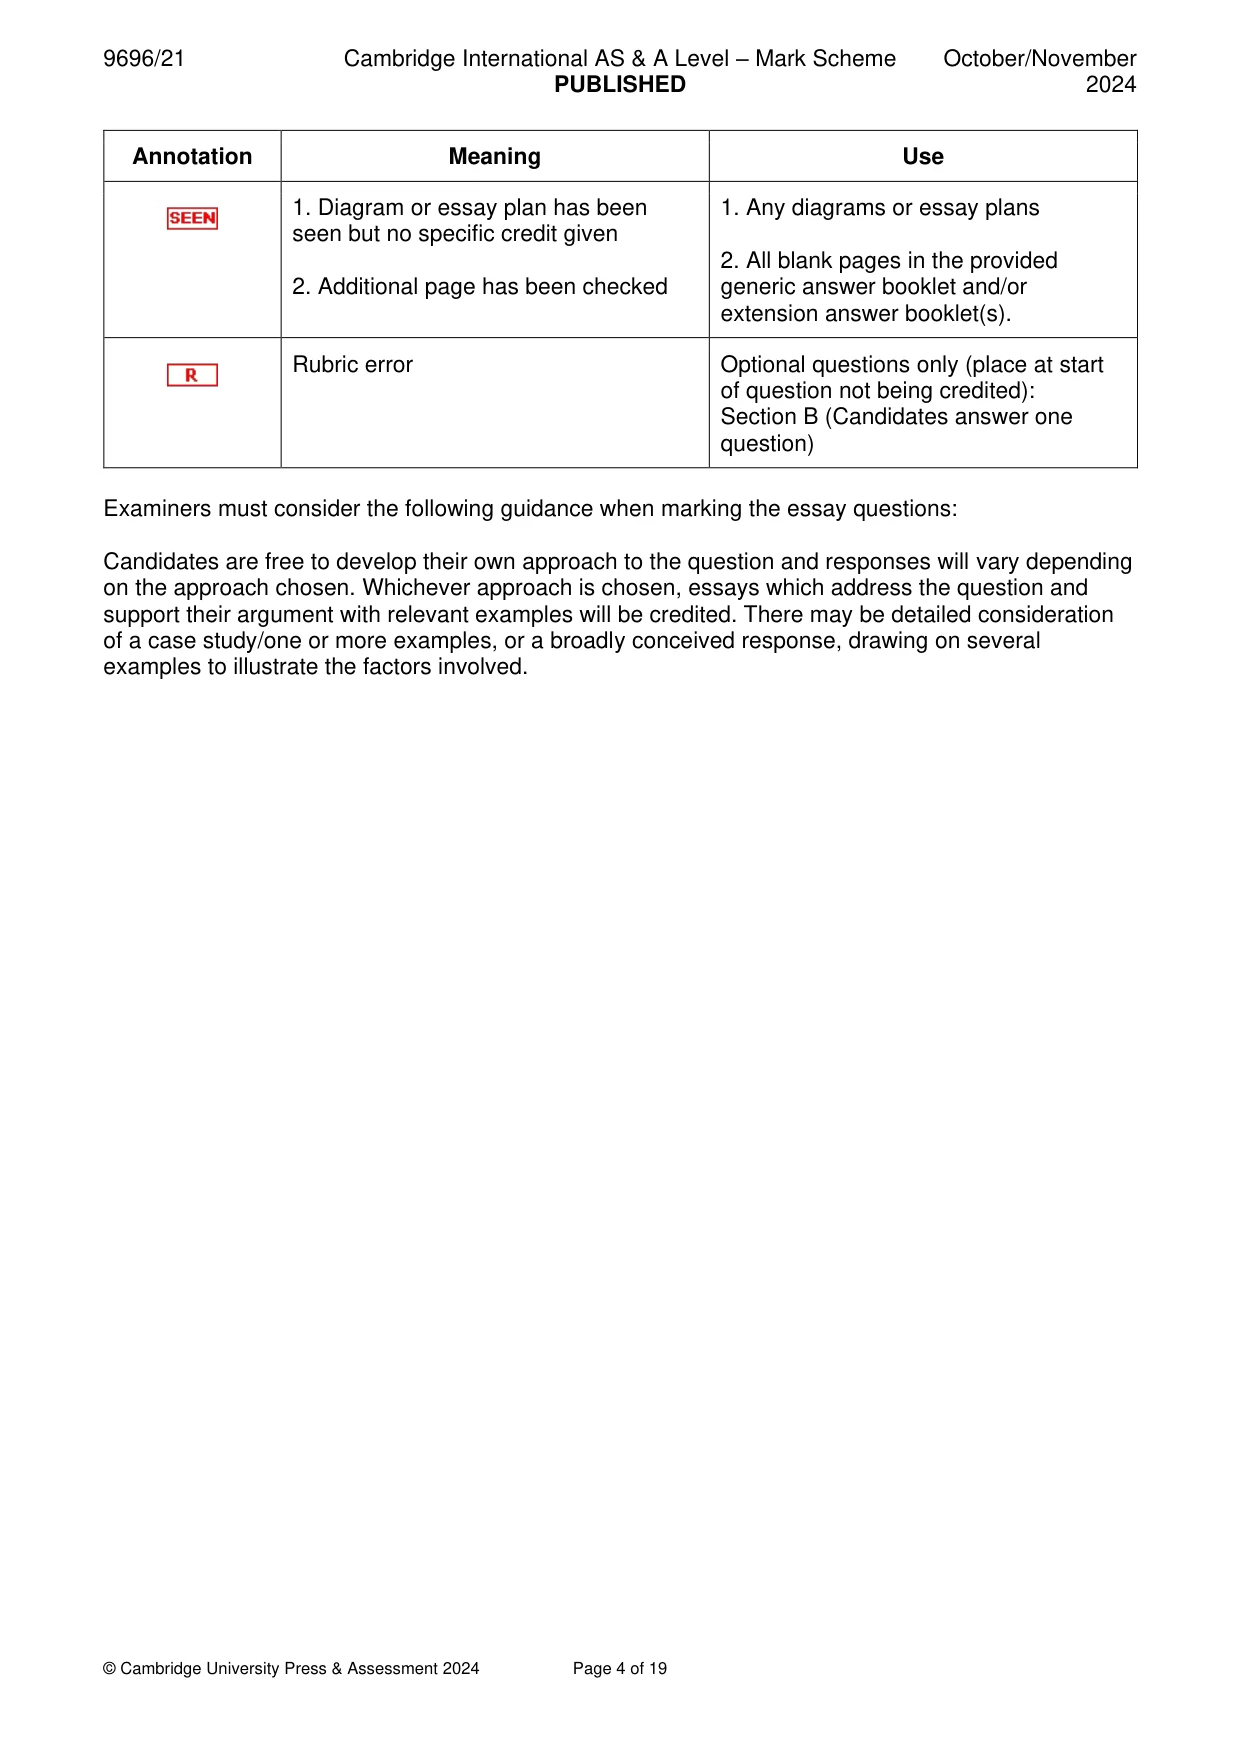
Question paper4 pages
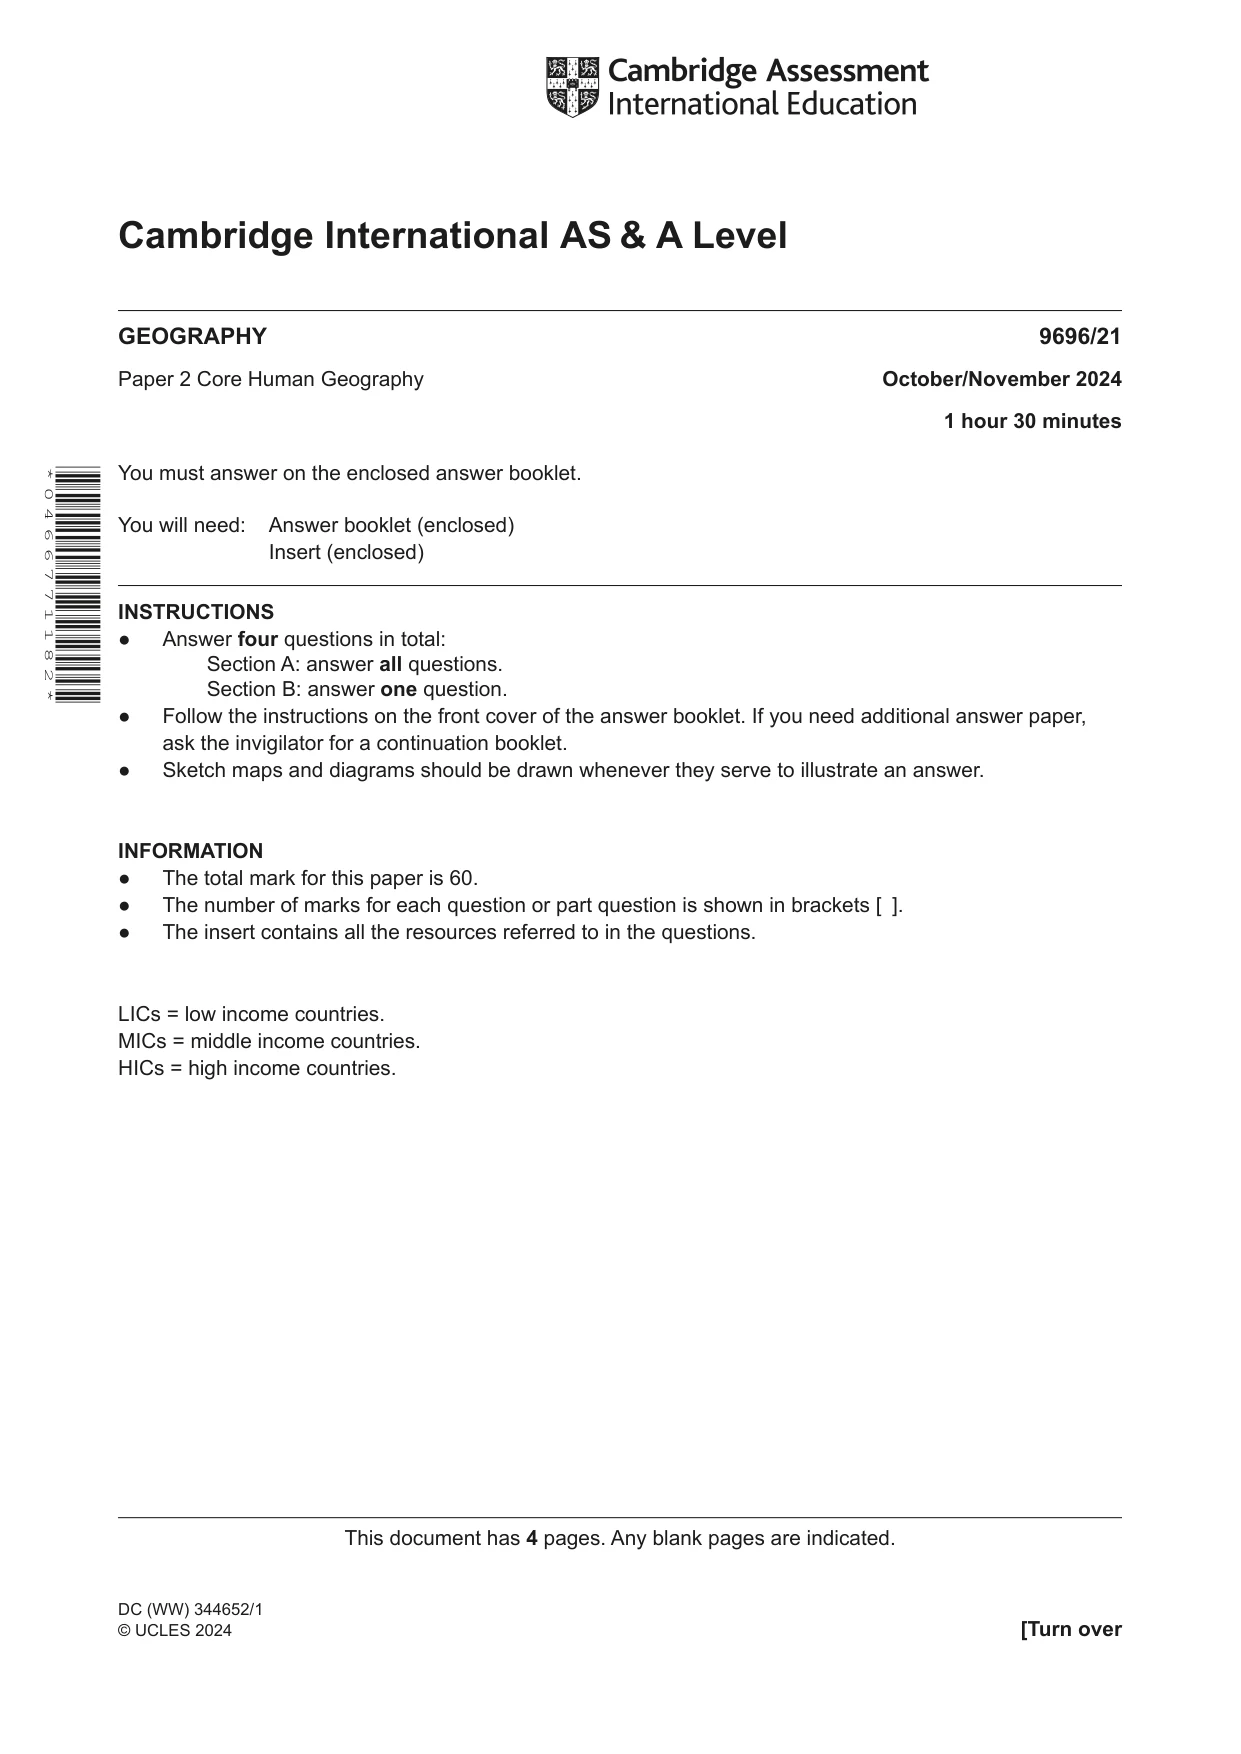
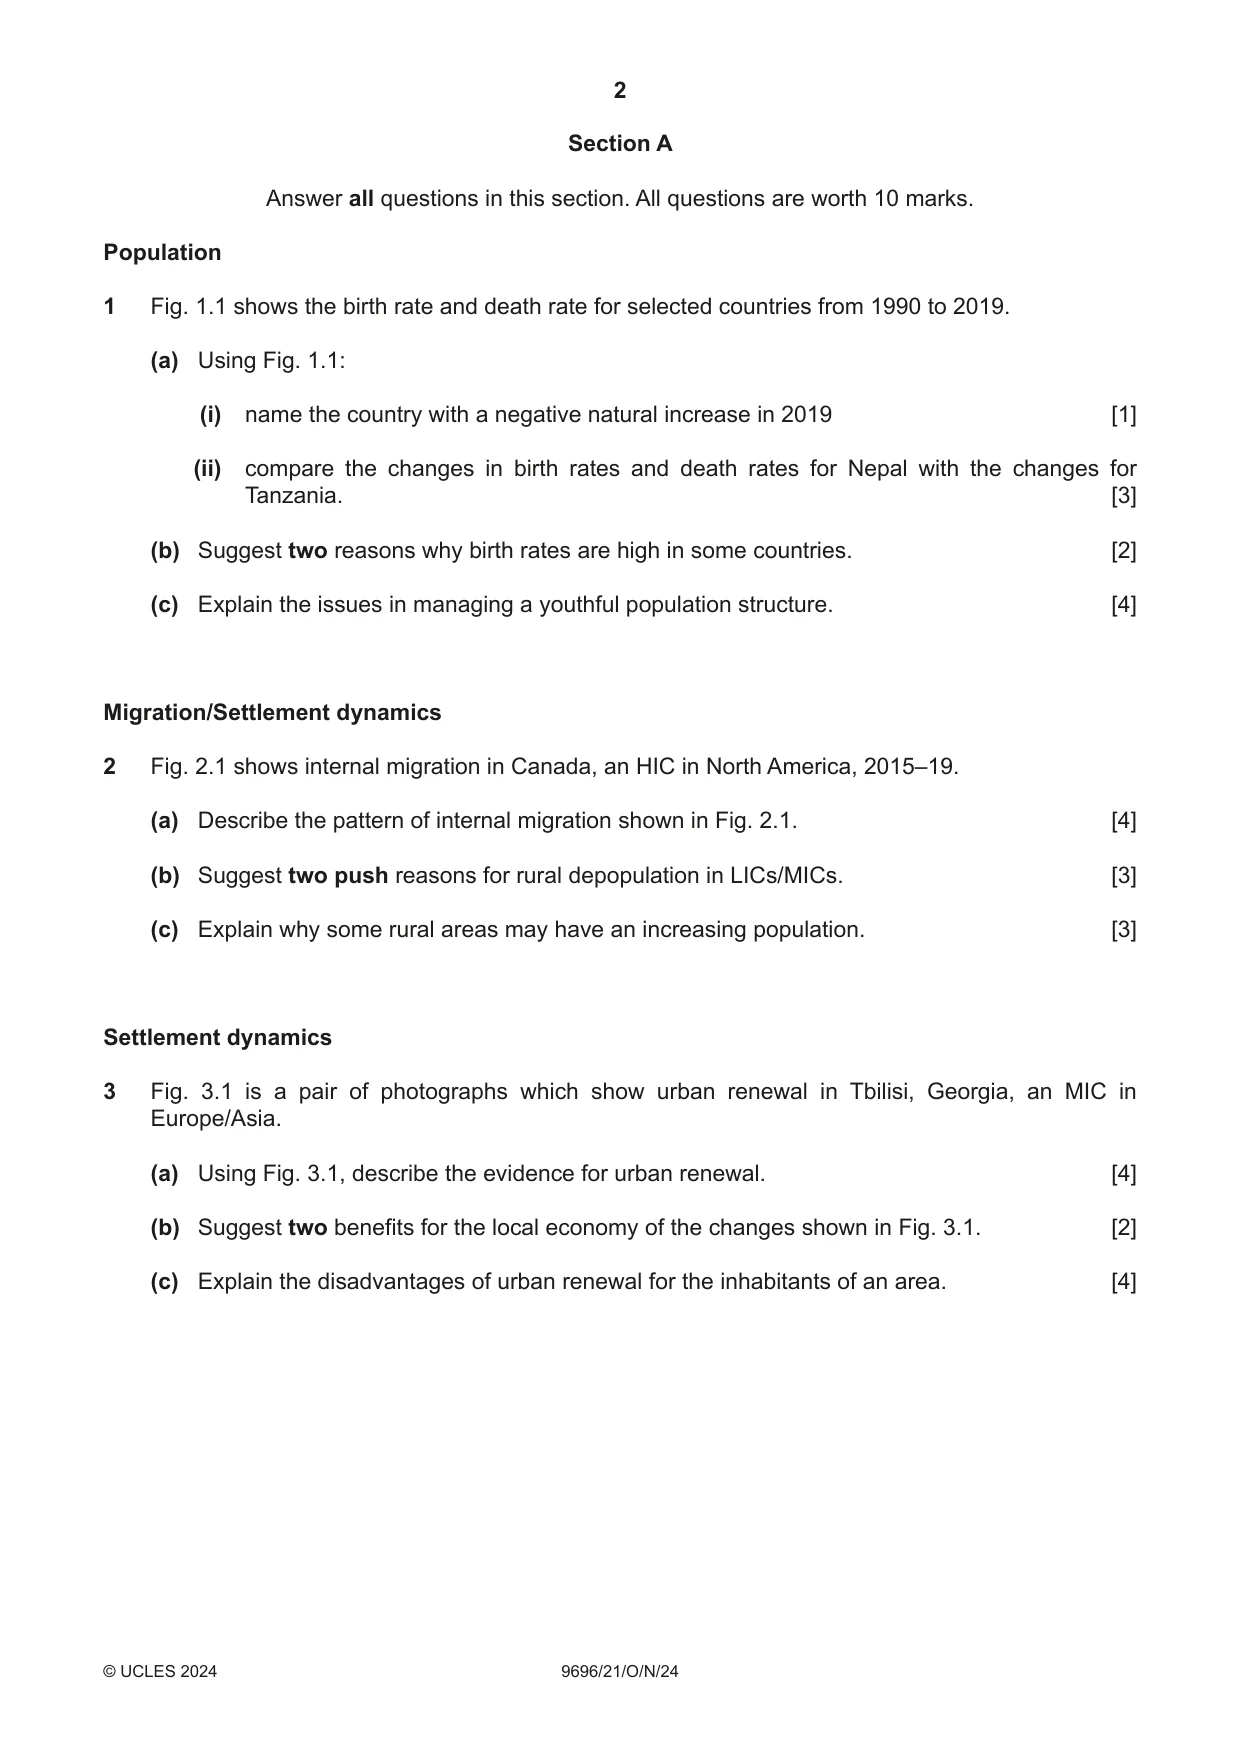
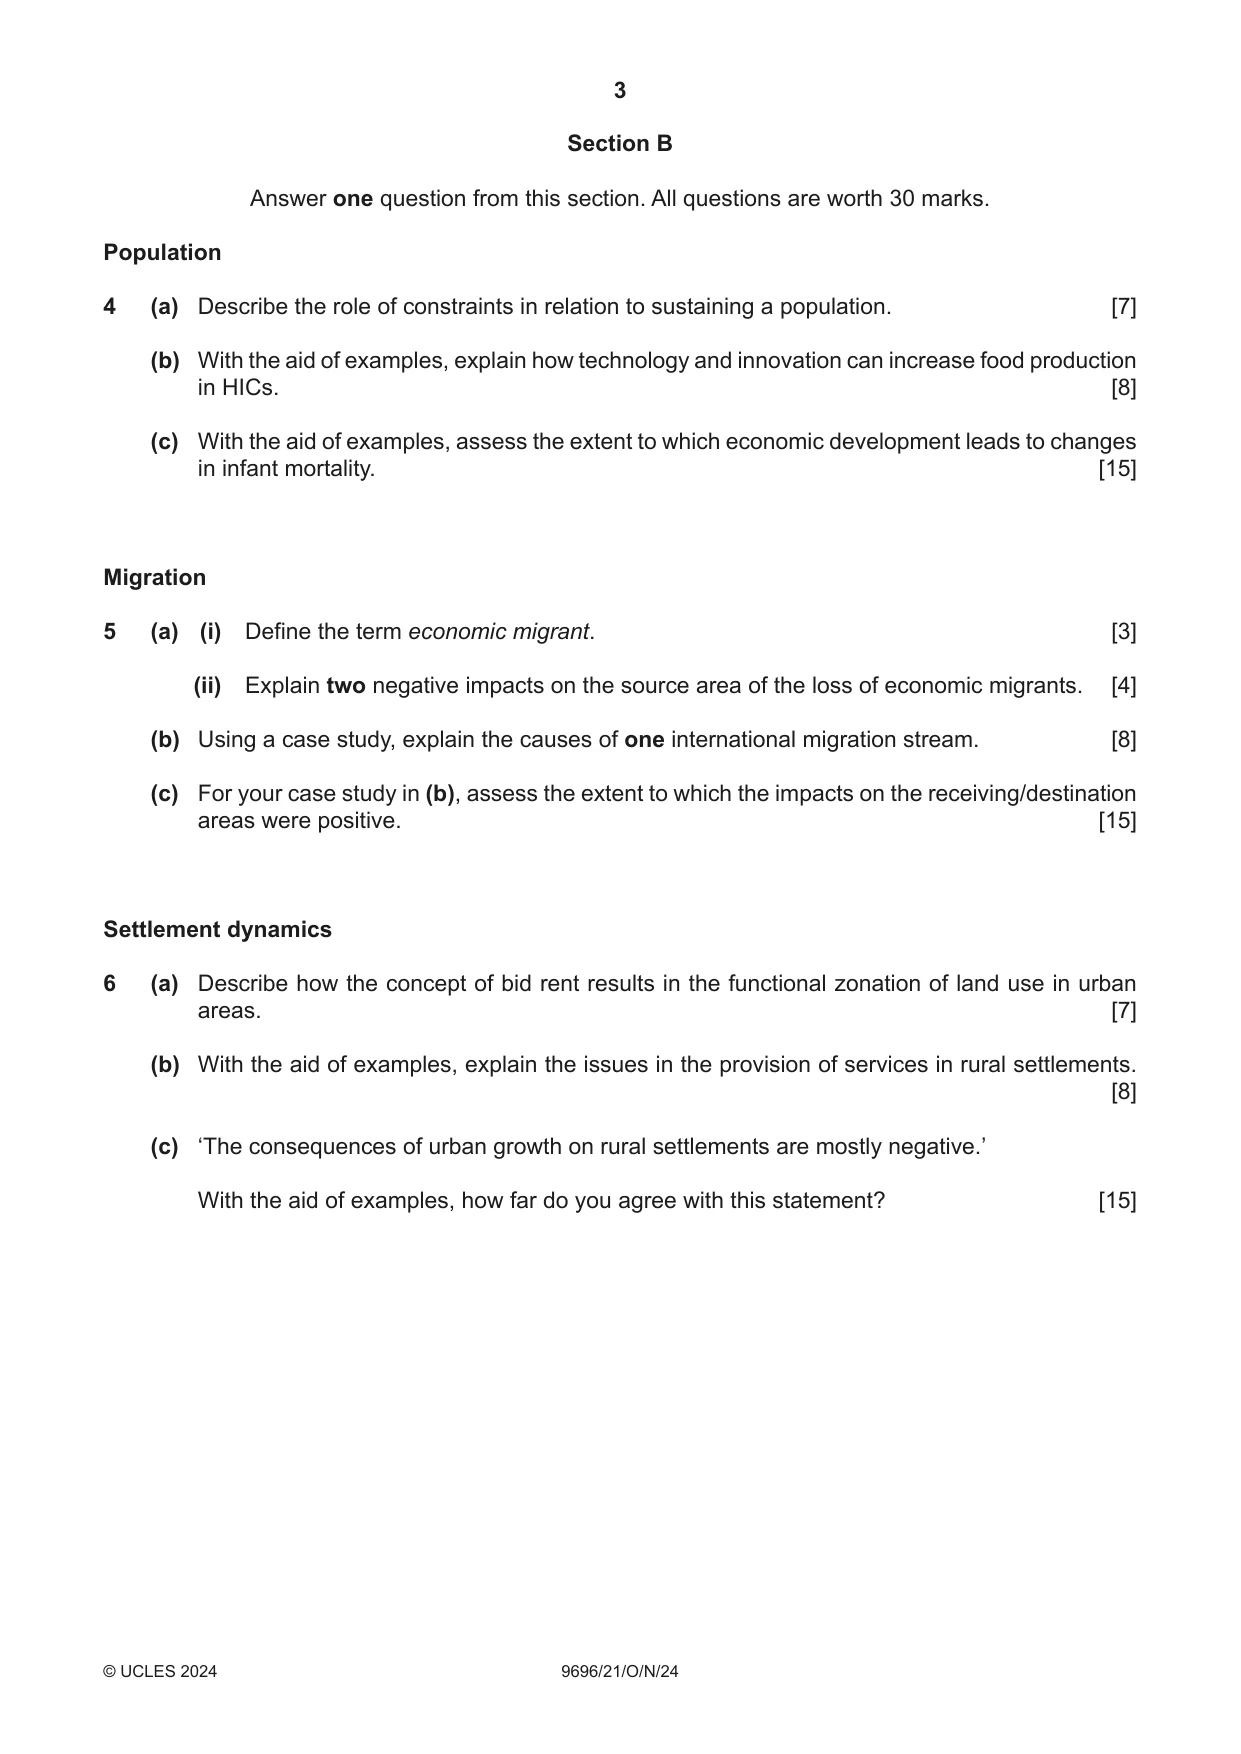

Mark scheme19 pages
Answers below. Sit the paper first if you are practising.

Questions as text
Q1 · The birth rate and death rate for selected countries from 1990 to 2019
1 Fig. 1.1 shows the birth rate and death rate for selected countries from 1990 to 2019. (a) Using Fig. 1.1: (i) name the country with a negative natural increase in 2019 [1] (ii) compare the changes in birth rates and death rates for Nepal with the changes for Tanzania. [3] (b) Suggest two reasons why birth rates are high in some countries. [2] (c) Explain the issues in managing a youthful population structure. [4] Migration/Settlement dynamics
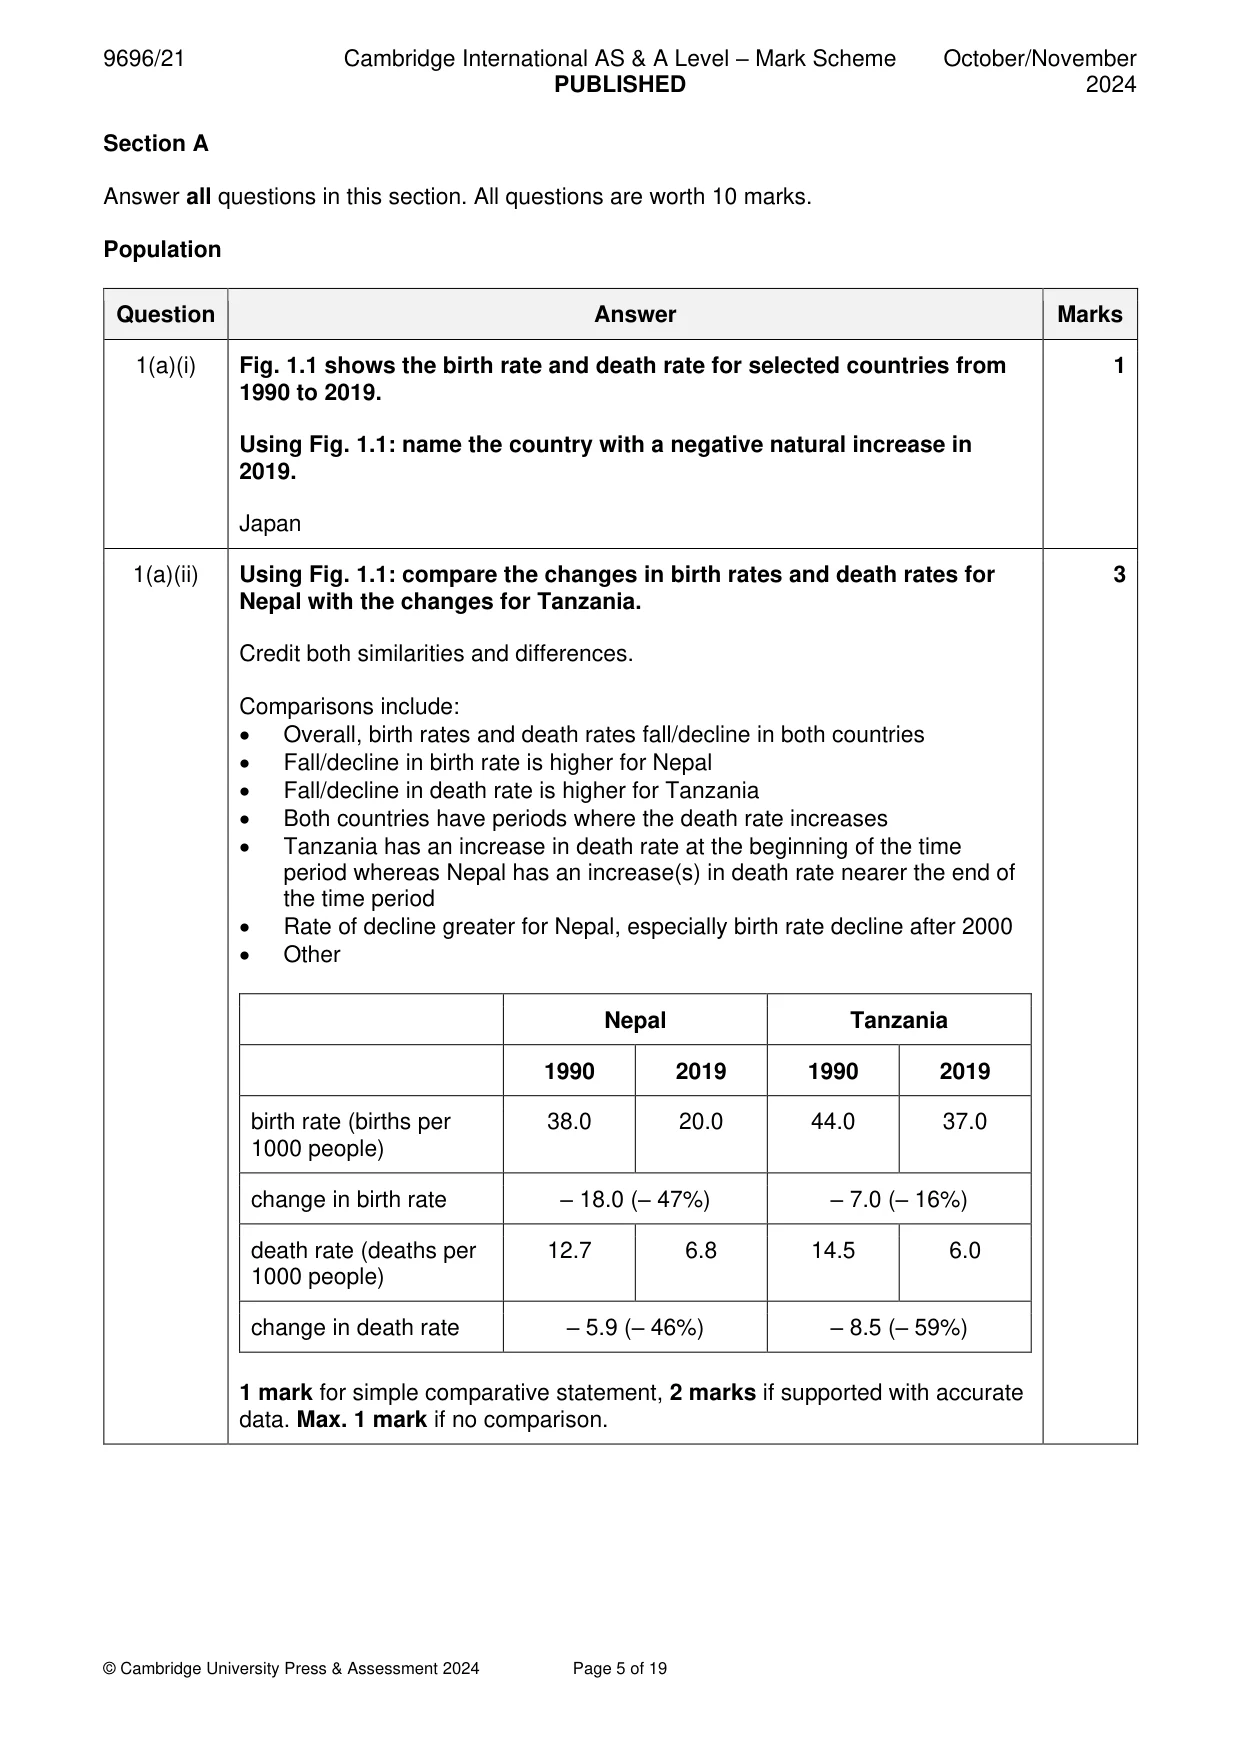
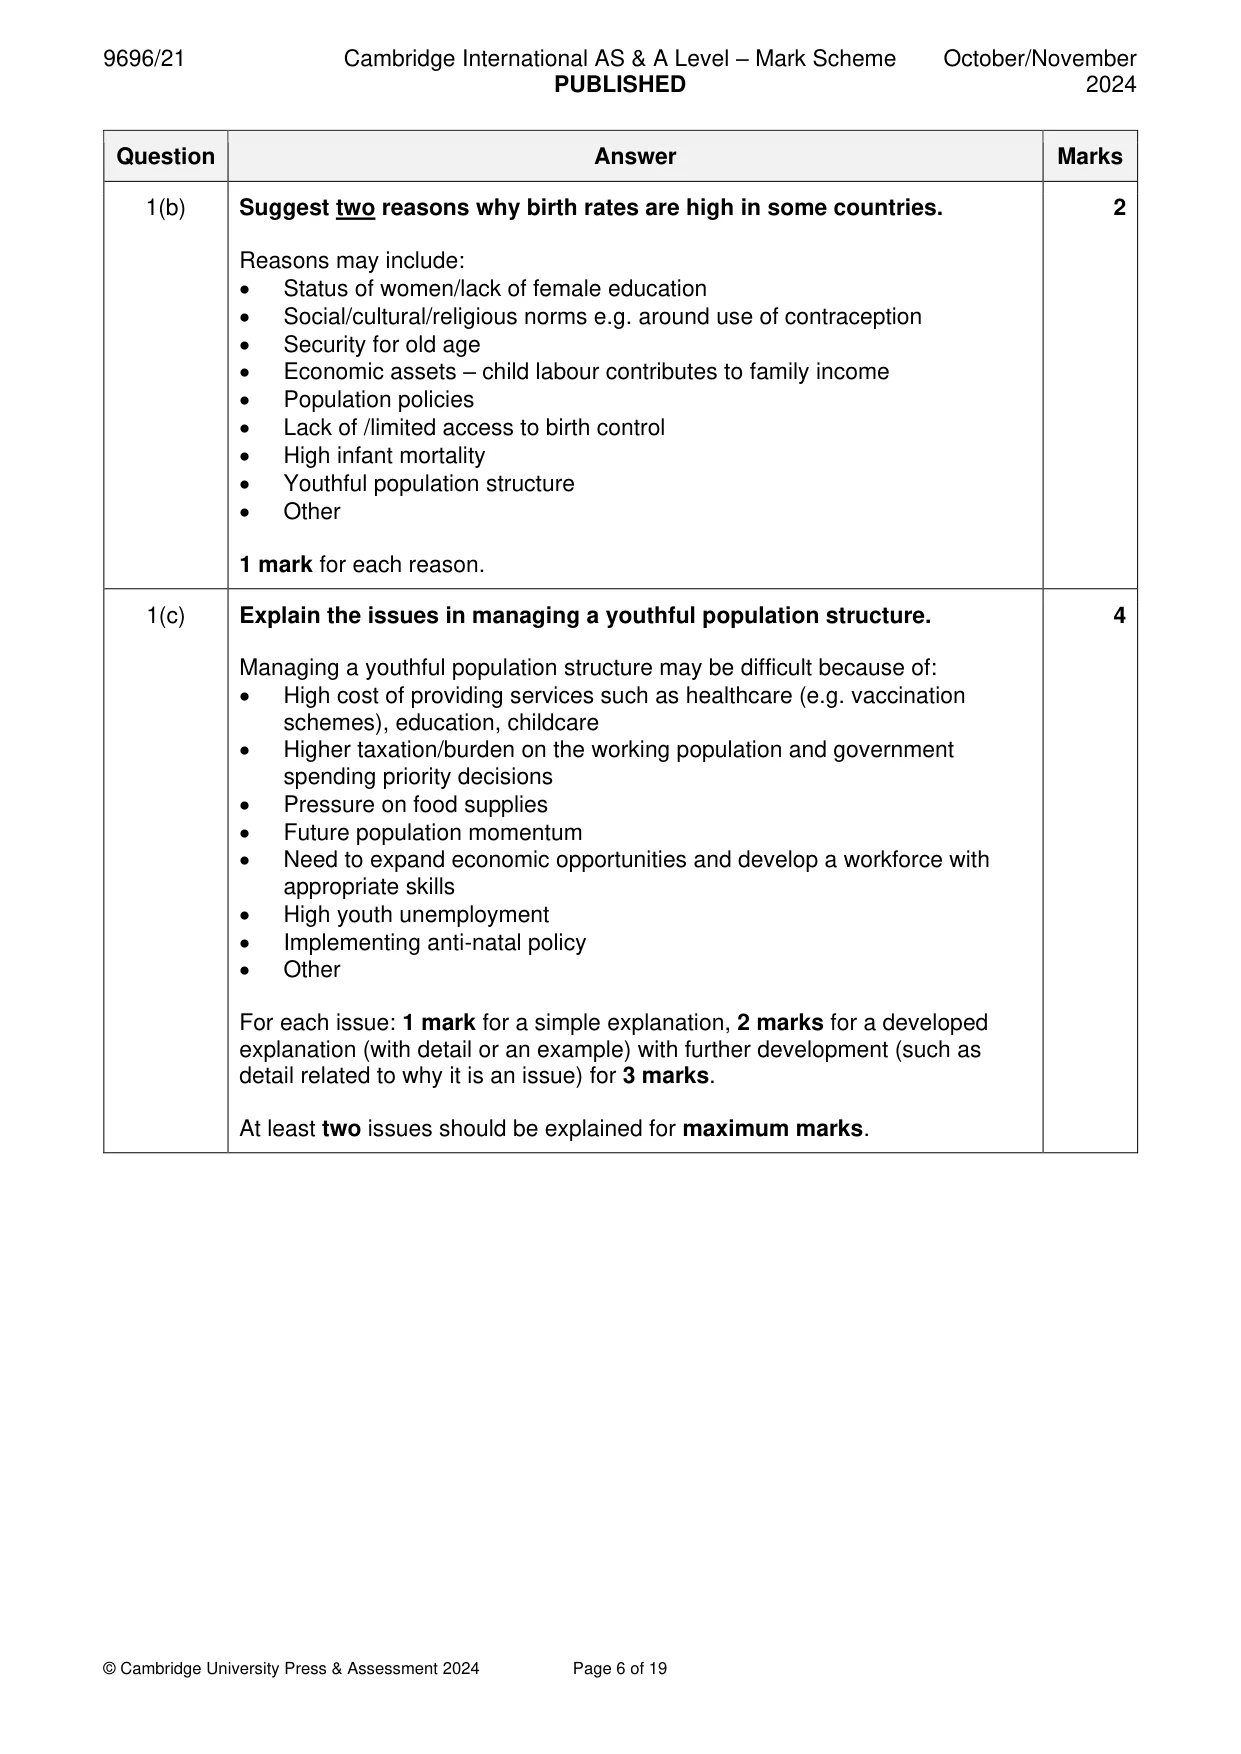
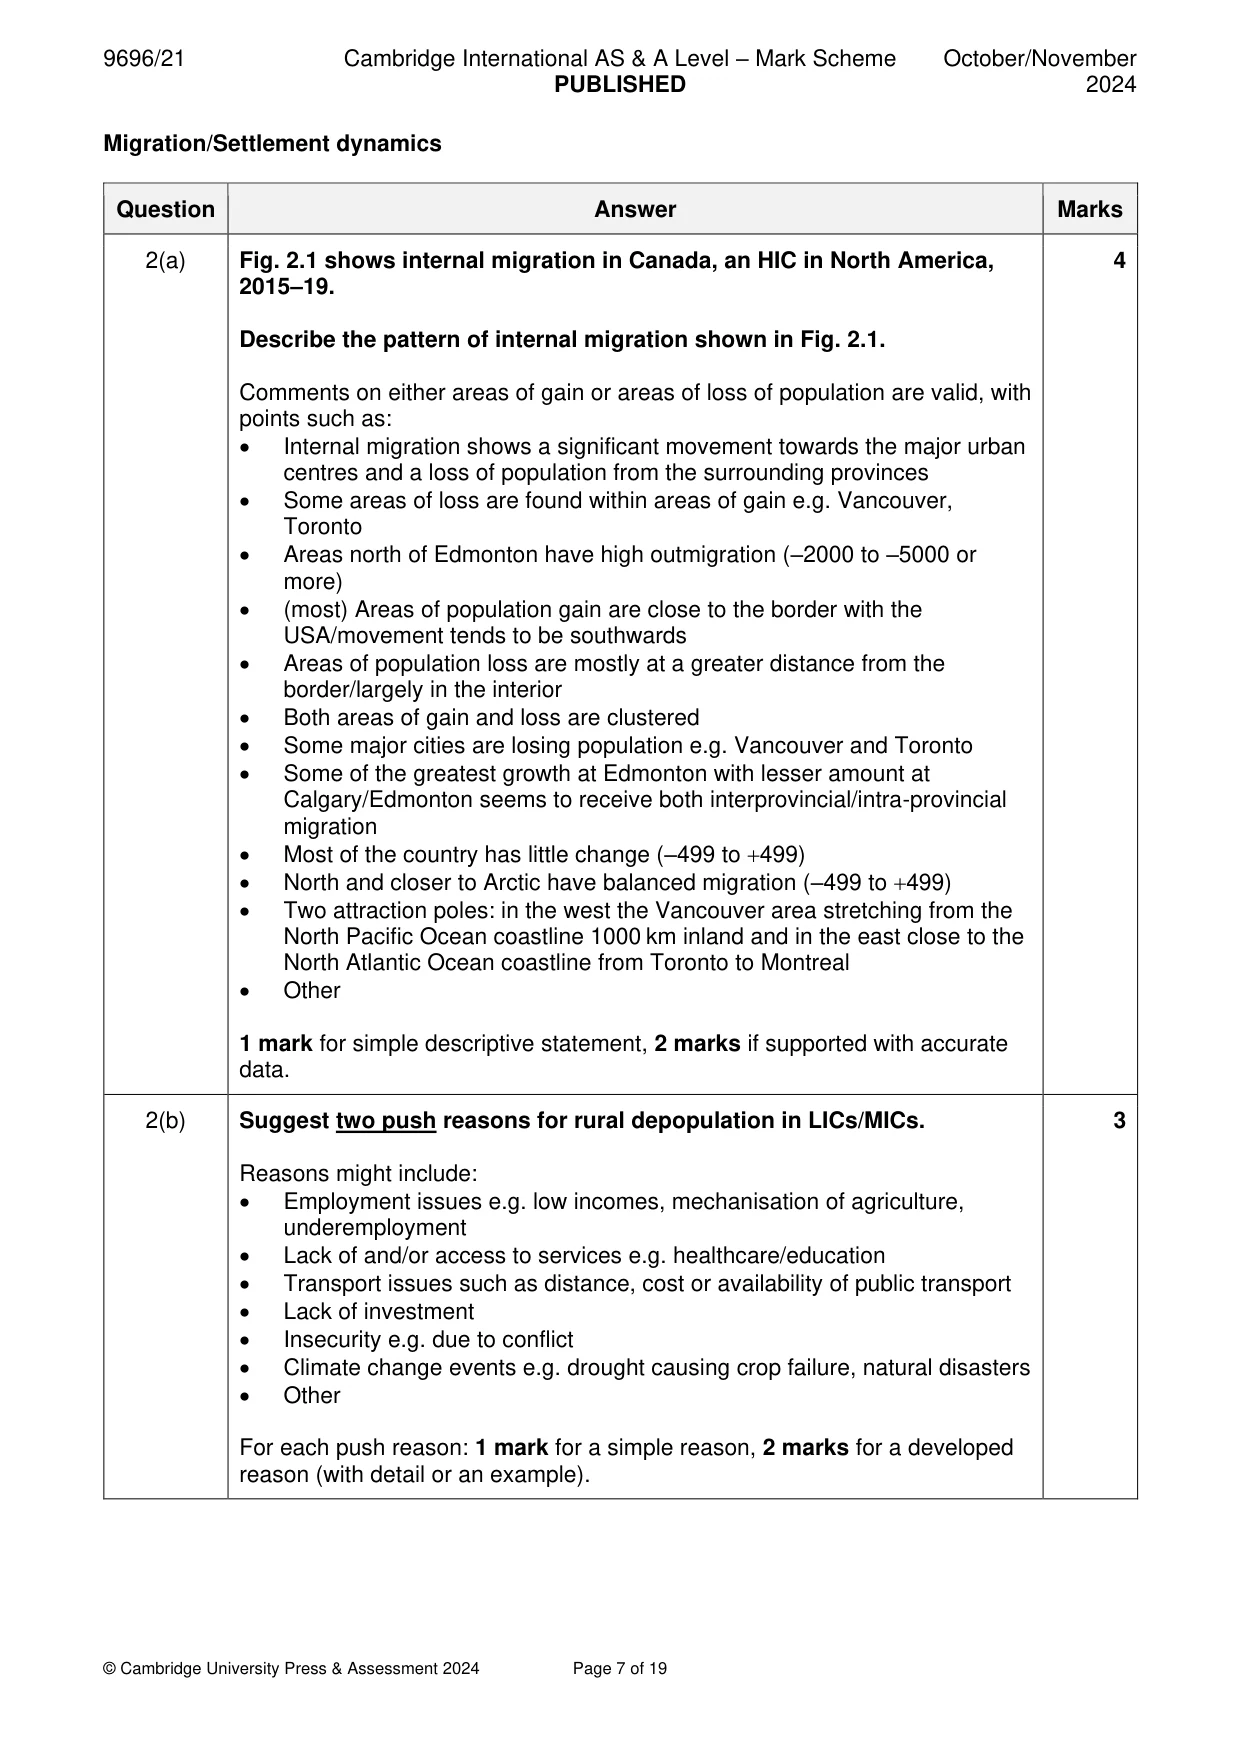
Mark scheme: Question Answer Marks 1(a)(i) Fig. 1.1 shows the birth rate and death rate for selected countries from 1 1990 to 2019. Using Fig. 1.1: name the country with a negative natural increase in 2019. Japan 1(a)(ii) Using Fig. 1.1: compare the changes in birth rates and death rates for 3 Nepal with the changes for Tanzania. Credit both similarities and differences. Comparisons include: • Overall, birth rates and death rates fall/decline in both countries • Fall/decline in birth rate is higher for Nepal • Fall/decline in death rate is higher for Tanzania • Both countries have periods where the death rate increases • Tanzania has an increase in death rate at the beginning of the time period whereas Nepal has an increase(s) in death rate nearer the end of the time period • Rate of decline greater for Nepal, especially birth rate decline after 2000 • Other Nepal Tanzania 1990 2019 1990 2019 birth rate (births per 38.0 20.0 44.0 37.0 1000 people) change in birth rate – 18.0 (– 47%) – 7.0 (– 16%) death rate (deaths per 12.7 6.8 14.5 6.0 1000 people) change in death rate – 5.9 (– 46%) – 8.5 (– 59%) 1 mark for simple comparative statement, 2 marks if supported with accurate data. Max. 1 mark if no comparison. 1(b) Suggest two reasons why birth rates are high in some countries. 2 Reasons may include: • Status of women/lack of female education • Social/cultural/religious norms e.g. around use of contraception • Security for old age • Economic assets – child labour contributes to family income • Population policies • Lack of /limited access to birth control • High infant mortality • Youthful population structure • Other 1 mark for each reason. 1(c) Explain the issues in managing a youthful population structure. 4 Managing a youthful population structure may be difficult because of: • High cost of providing services such as healthcare (e.g. vaccination schemes), education, childcare • Higher taxation/burden on the working population and government spending priority decisions • Pressure on food supplies • Future population momentum • Need to expand economic opportunities and develop a workforce with appropriate skills • High youth unemployment • Implementing anti-natal policy • Other For each issue: 1 mark for a simple explanation, 2 marks for a developed explanation (with detail or an example) with further development (such as detail related to why it is an issue) for 3 marks. At least two issues should be explained for maximum marks. Migration/Settlement dynamics
Q2 · Internal migration in Canada, an HIC in North America, 2015–19
2 Fig. 2.1 shows internal migration in Canada, an HIC in North America, 2015–19. (a) Describe the pattern of internal migration shown in Fig. 2.1. [4] (b) Suggest two push reasons for rural depopulation in LICs/MICs. [3] (c) Explain why some rural areas may have an increasing population. [3] Settlement dynamics
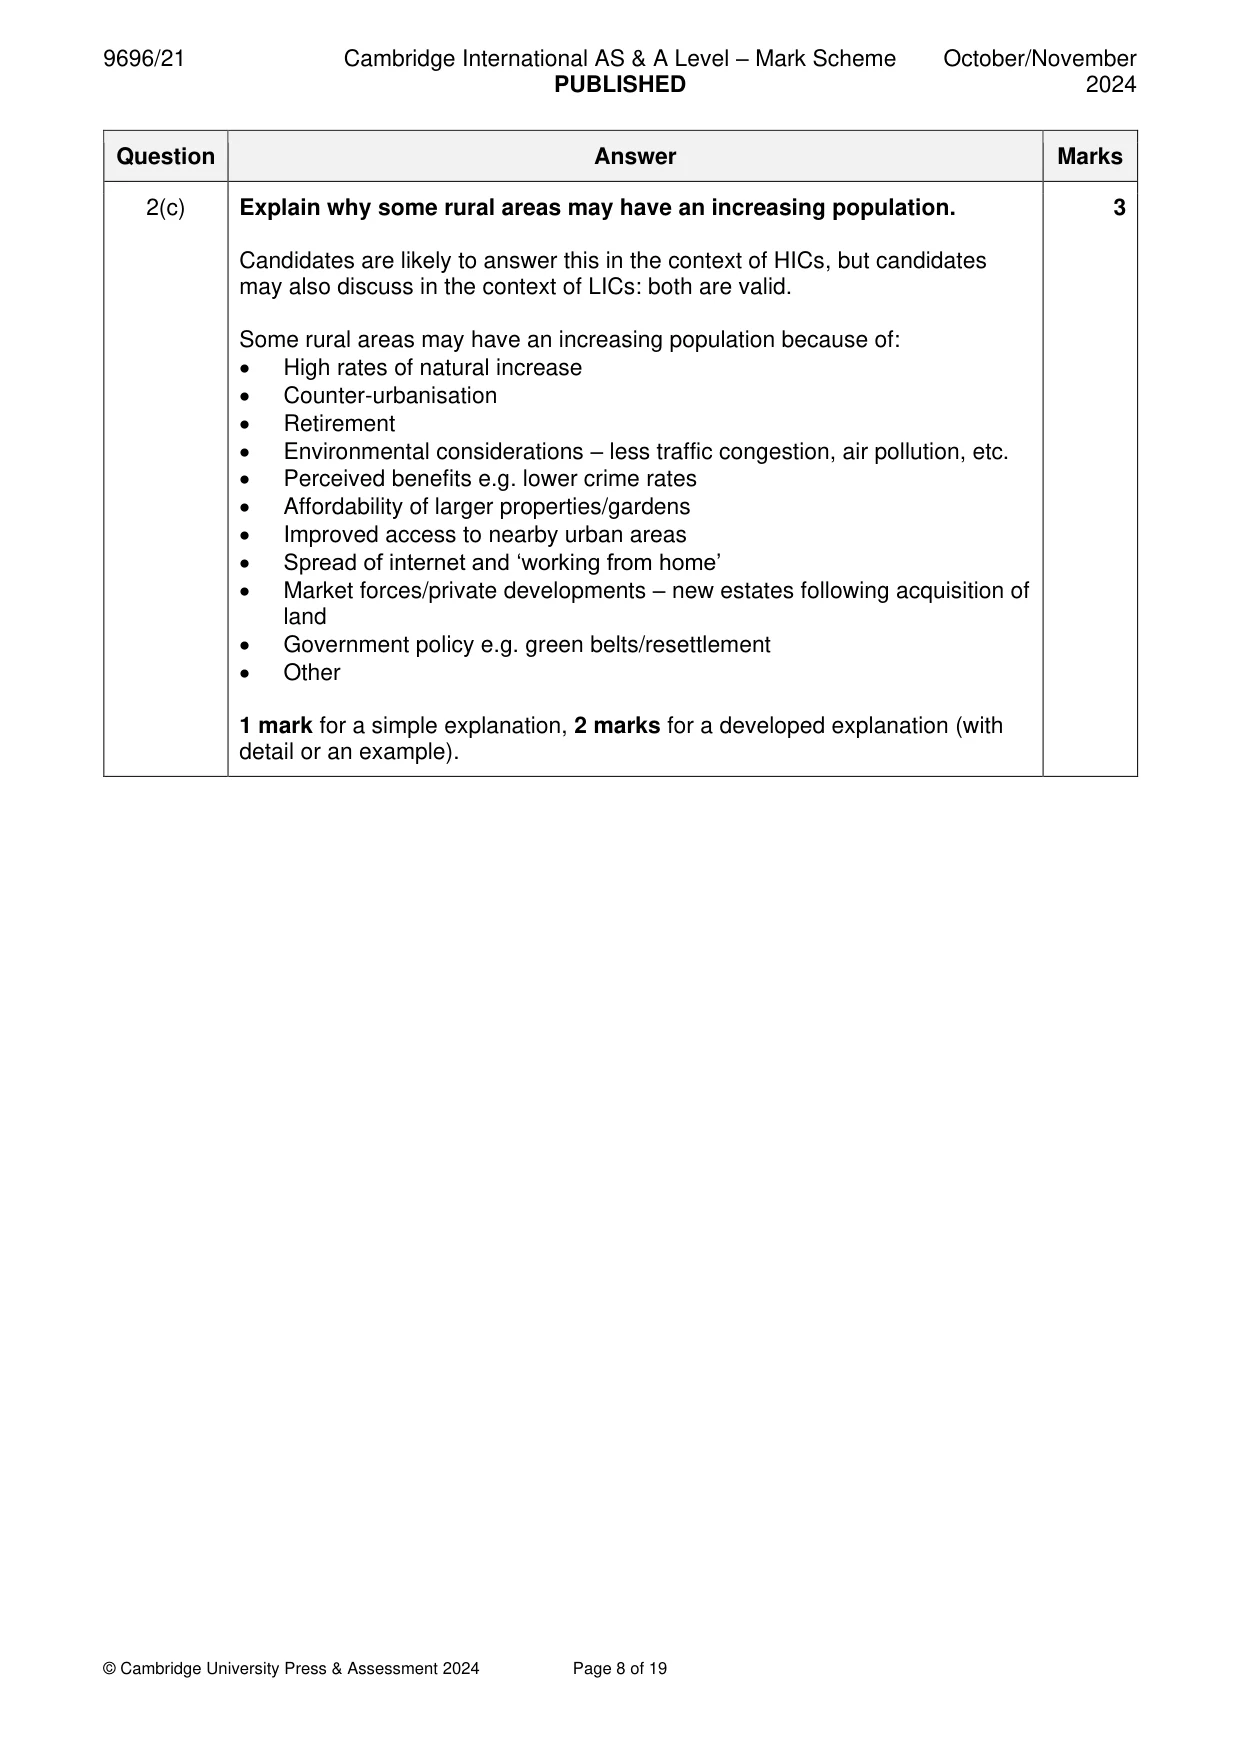
Mark scheme: 2(a) Fig. 2.1 shows internal migration in Canada, an HIC in North America, 4 2015–19. Describe the pattern of internal migration shown in Fig. 2.1. Comments on either areas of gain or areas of loss of population are valid, with points such as: • Internal migration shows a significant movement towards the major urban centres and a loss of population from the surrounding provinces • Some areas of loss are found within areas of gain e.g. Vancouver, Toronto • Areas north of Edmonton have high outmigration (–2000 to –5000 or more) • (most) Areas of population gain are close to the border with the USA/movement tends to be southwards • Areas of population loss are mostly at a greater distance from the border/largely in the interior • Both areas of gain and loss are clustered • Some major cities are losing population e.g. Vancouver and Toronto • Some of the greatest growth at Edmonton with lesser amount at Calgary/Edmonton seems to receive both interprovincial/intra-provincial migration • Most of the country has little change (–499 to +499) • North and closer to Arctic have balanced migration (–499 to +499) • Two attraction poles: in the west the Vancouver area stretching from the North Pacific Ocean coastline 1000 km inland and in the east close to the North Atlantic Ocean coastline from Toronto to Montreal • Other 1 mark for simple descriptive statement, 2 marks if supported with accurate data. 2(b) Suggest two push reasons for rural depopulation in LICs/MICs. 3 Reasons might include: • Employment issues e.g. low incomes, mechanisation of agriculture, underemployment • Lack of and/or access to services e.g. healthcare/education • Transport issues such as distance, cost or availability of public transport • Lack of investment • Insecurity e.g. due to conflict • Climate change events e.g. drought causing crop failure, natural disasters • Other For each push reason: 1 mark for a simple reason, 2 marks for a developed reason (with detail or an example). 2(c) Explain why some rural areas may have an increasing population. 3 Candidates are likely to answer this in the context of HICs, but candidates may also discuss in the context of LICs: both are valid. Some rural areas may have an increasing population because of: • High rates of natural increase • Counter-urbanisation • Retirement • Environmental considerations – less traffic congestion, air pollution, etc. • Perceived benefits e.g. lower crime rates • Affordability of larger properties/gardens • Improved access to nearby urban areas • Spread of internet and ‘working from home’ • Market forces/private developments – new estates following acquisition of land • Government policy e.g. green belts/resettlement • Other 1 mark for a simple explanation, 2 marks for a developed explanation (with detail or an example). Settlement dynamics
Q3 · A pair of photographs which show urban renewal in Tbilisi, Georgia, an MIC in Europe/Asia
3 Fig. 3.1 is a pair of photographs which show urban renewal in Tbilisi, Georgia, an MIC in Europe/Asia. (a) Using Fig. 3.1, describe the evidence for urban renewal. [4] (b) Suggest two benefits for the local economy of the changes shown in Fig. 3.1. [2] (c) Explain the disadvantages of urban renewal for the inhabitants of an area. [4]
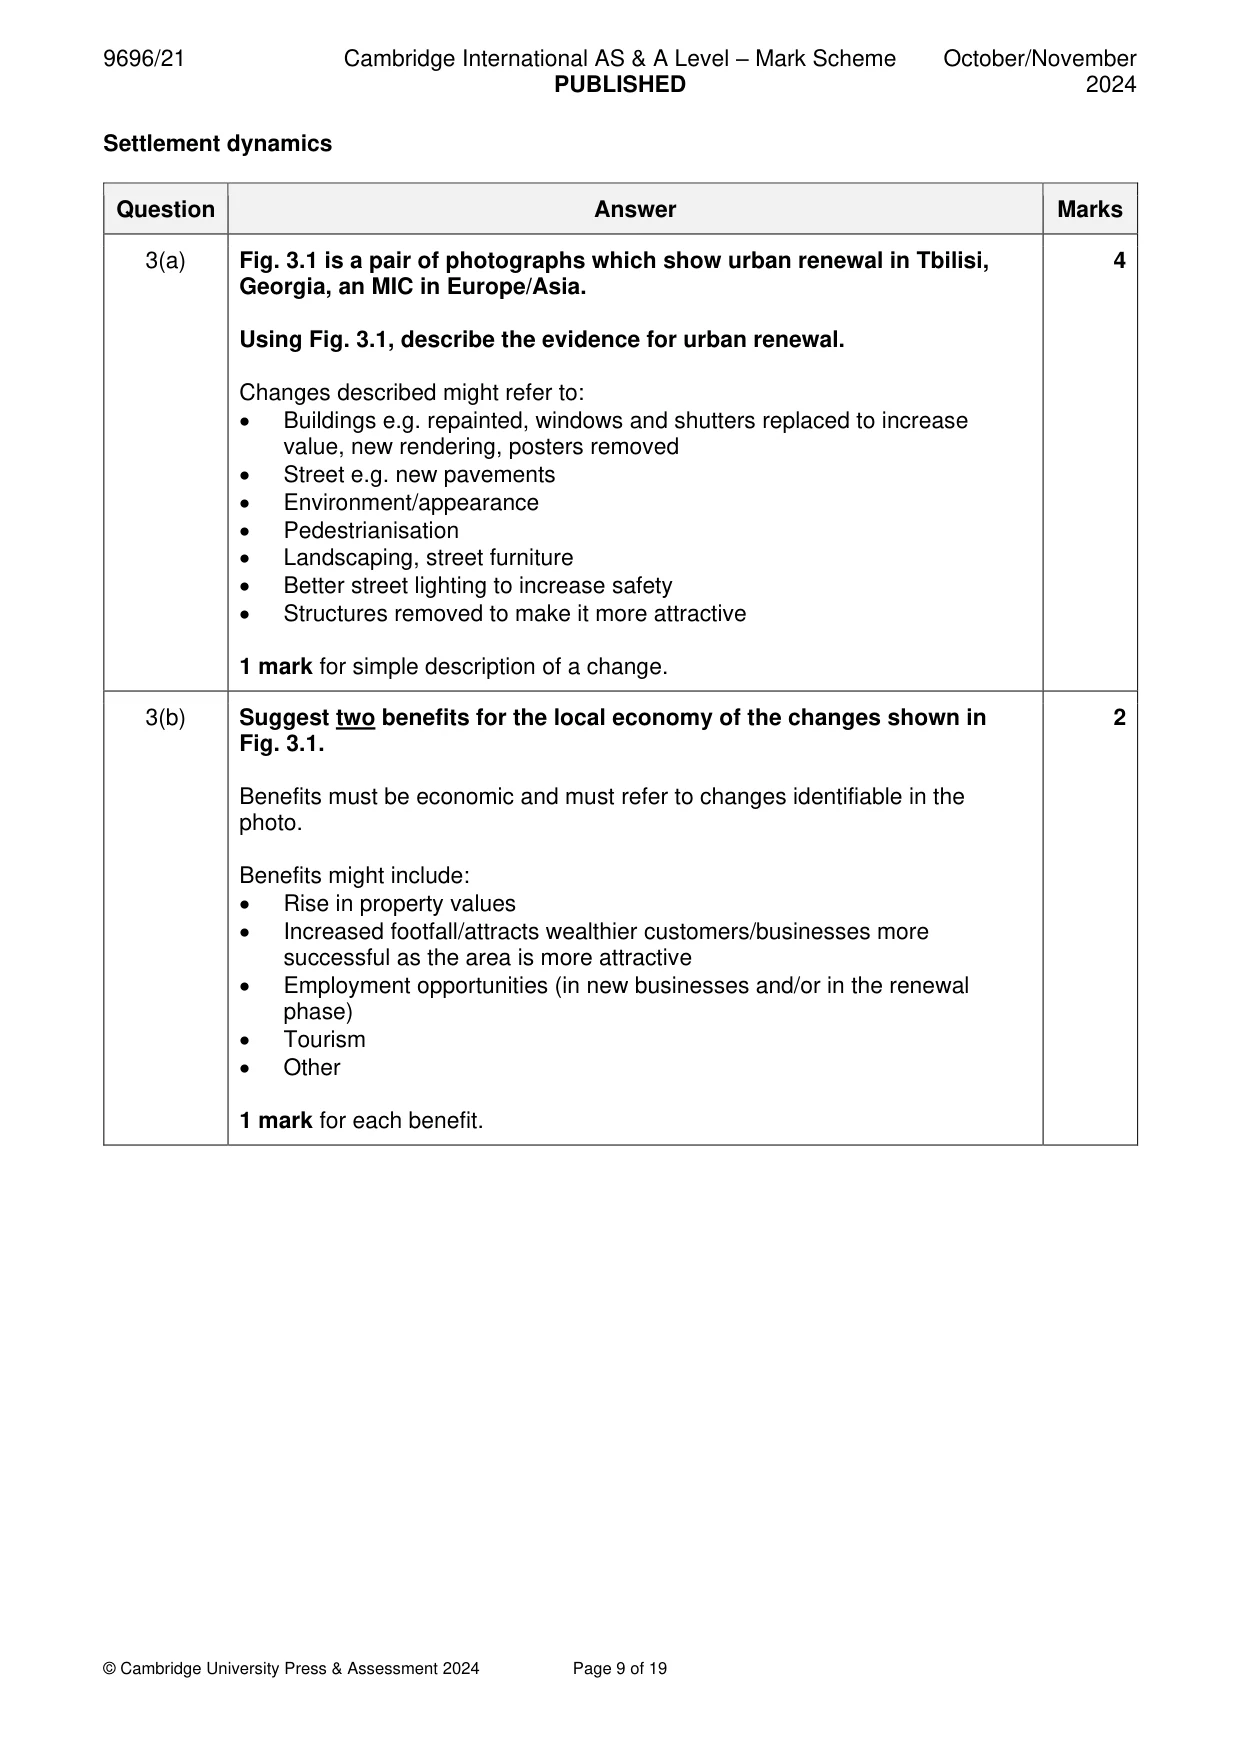
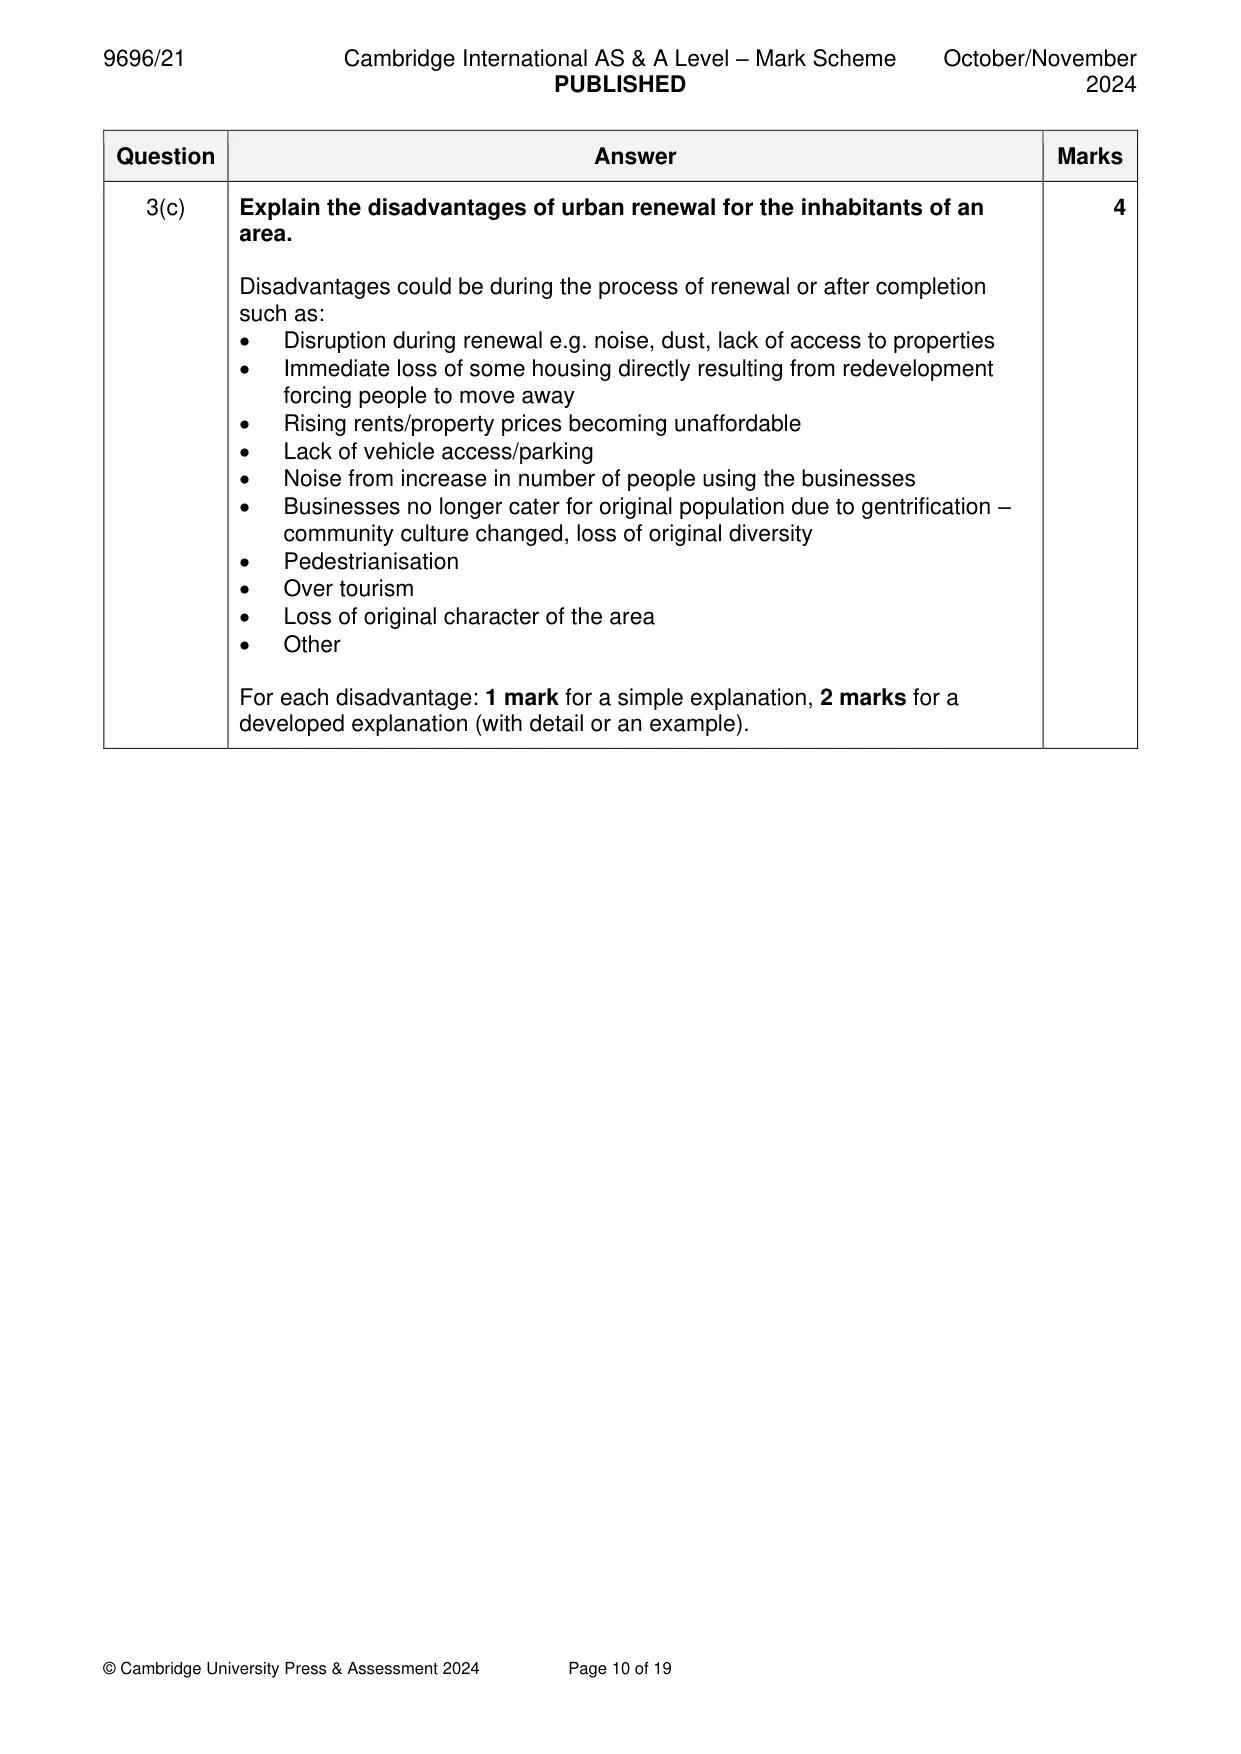
Mark scheme: 3(a) Fig. 3.1 is a pair of photographs which show urban renewal in Tbilisi, 4 Georgia, an MIC in Europe/Asia. Using Fig. 3.1, describe the evidence for urban renewal. Changes described might refer to: • Buildings e.g. repainted, windows and shutters replaced to increase value, new rendering, posters removed • Street e.g. new pavements • Environment/appearance • Pedestrianisation • Landscaping, street furniture • Better street lighting to increase safety • Structures removed to make it more attractive 1 mark for simple description of a change. 3(b) Suggest two benefits for the local economy of the changes shown in 2 Fig. 3.1. Benefits must be economic and must refer to changes identifiable in the photo. Benefits might include: • Rise in property values • Increased footfall/attracts wealthier customers/businesses more successful as the area is more attractive • Employment opportunities (in new businesses and/or in the renewal phase) • Tourism • Other 1 mark for each benefit. 3(c) Explain the disadvantages of urban renewal for the inhabitants of an 4 area. Disadvantages could be during the process of renewal or after completion such as: • Disruption during renewal e.g. noise, dust, lack of access to properties • Immediate loss of some housing directly resulting from redevelopment forcing people to move away • Rising rents/property prices becoming unaffordable • Lack of vehicle access/parking • Noise from increase in number of people using the businesses • Businesses no longer cater for original population due to gentrification – community culture changed, loss of original diversity • Pedestrianisation • Over tourism • Loss of original character of the area • Other For each disadvantage: 1 mark for a simple explanation, 2 marks for a developed explanation (with detail or an example). Section B Answer one question from this section. All questions are worth 30 marks. Population
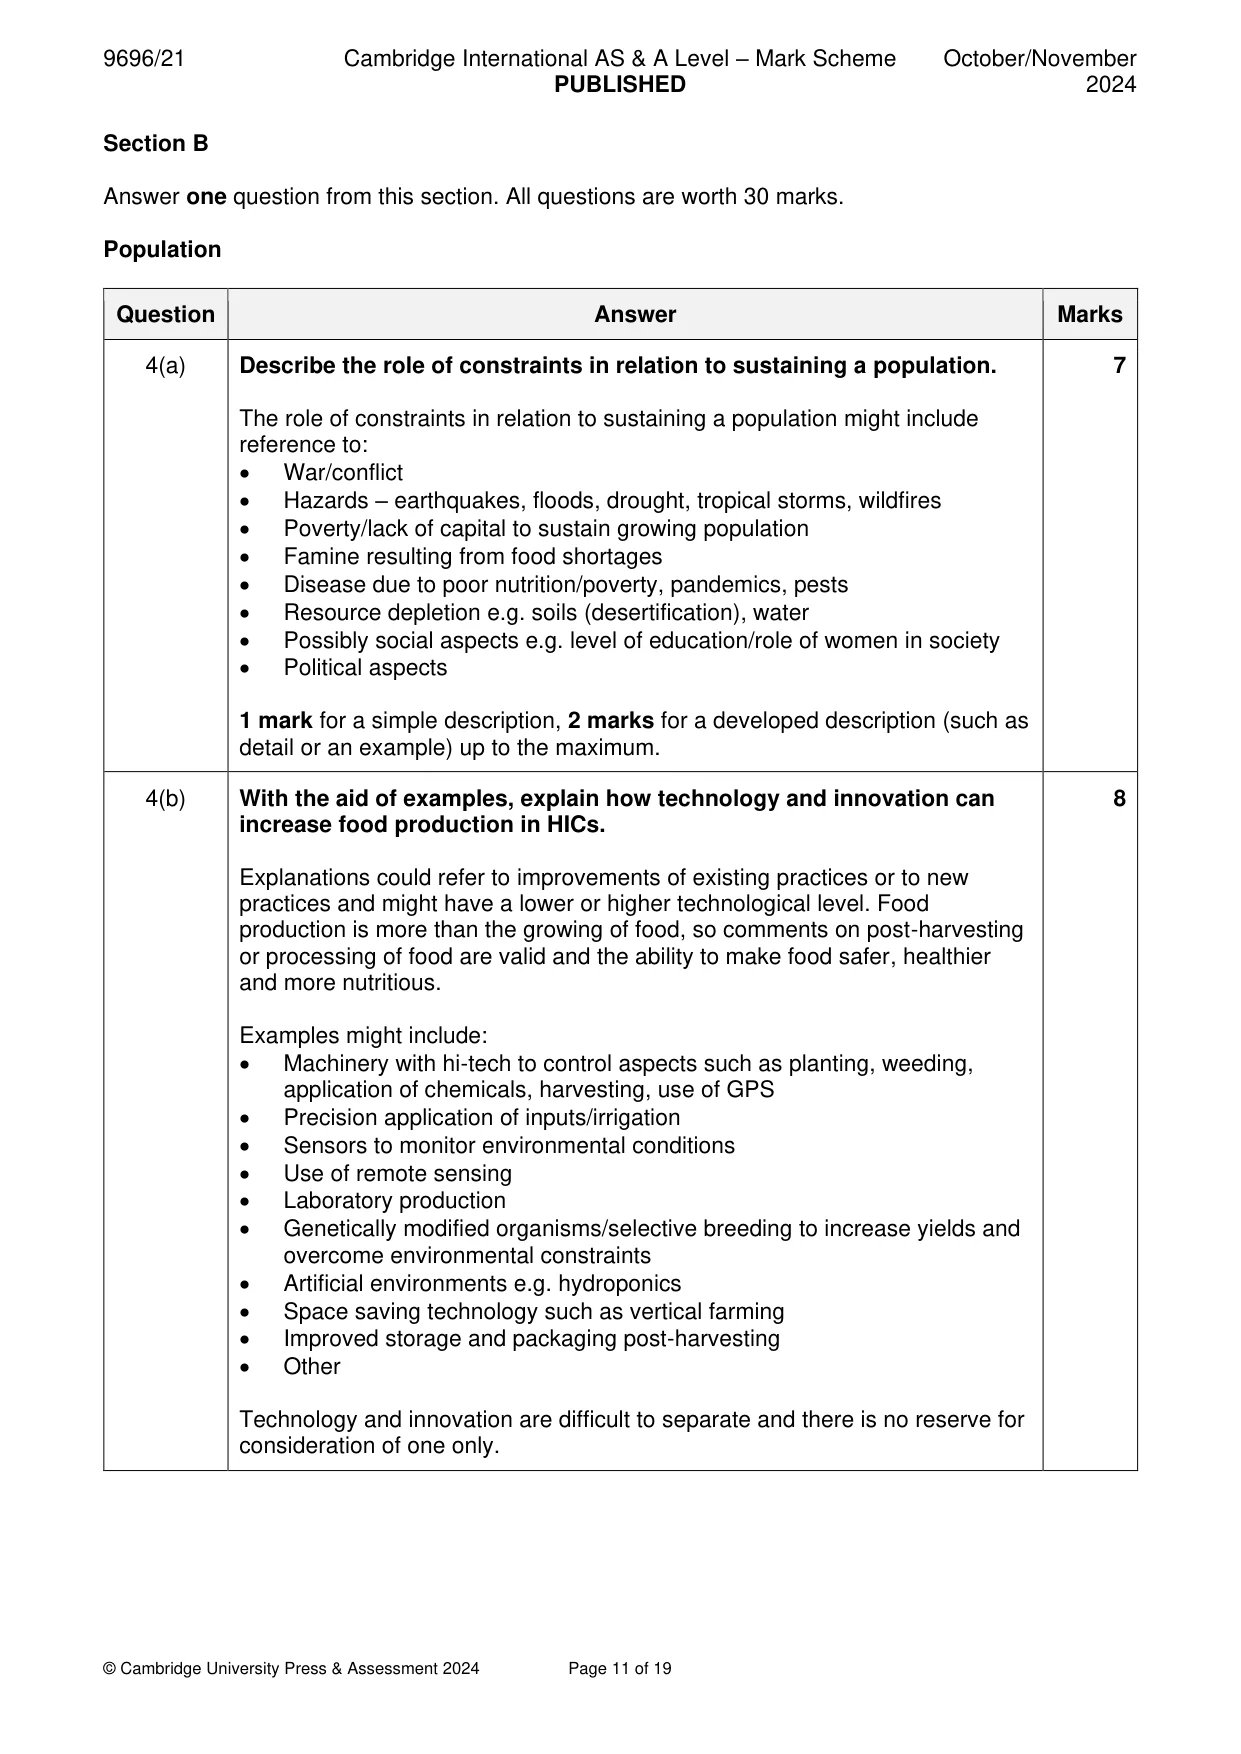
Q4 · Describe the role of constraints in relation to sustaining a population
4 (a) Describe the role of constraints in relation to sustaining a population. [7] (b) With the aid of examples, explain how technology and innovation can increase food production in HICs. [8] (c) With the aid of examples, assess the extent to which economic development leads to changes in infant mortality. [15] Migration
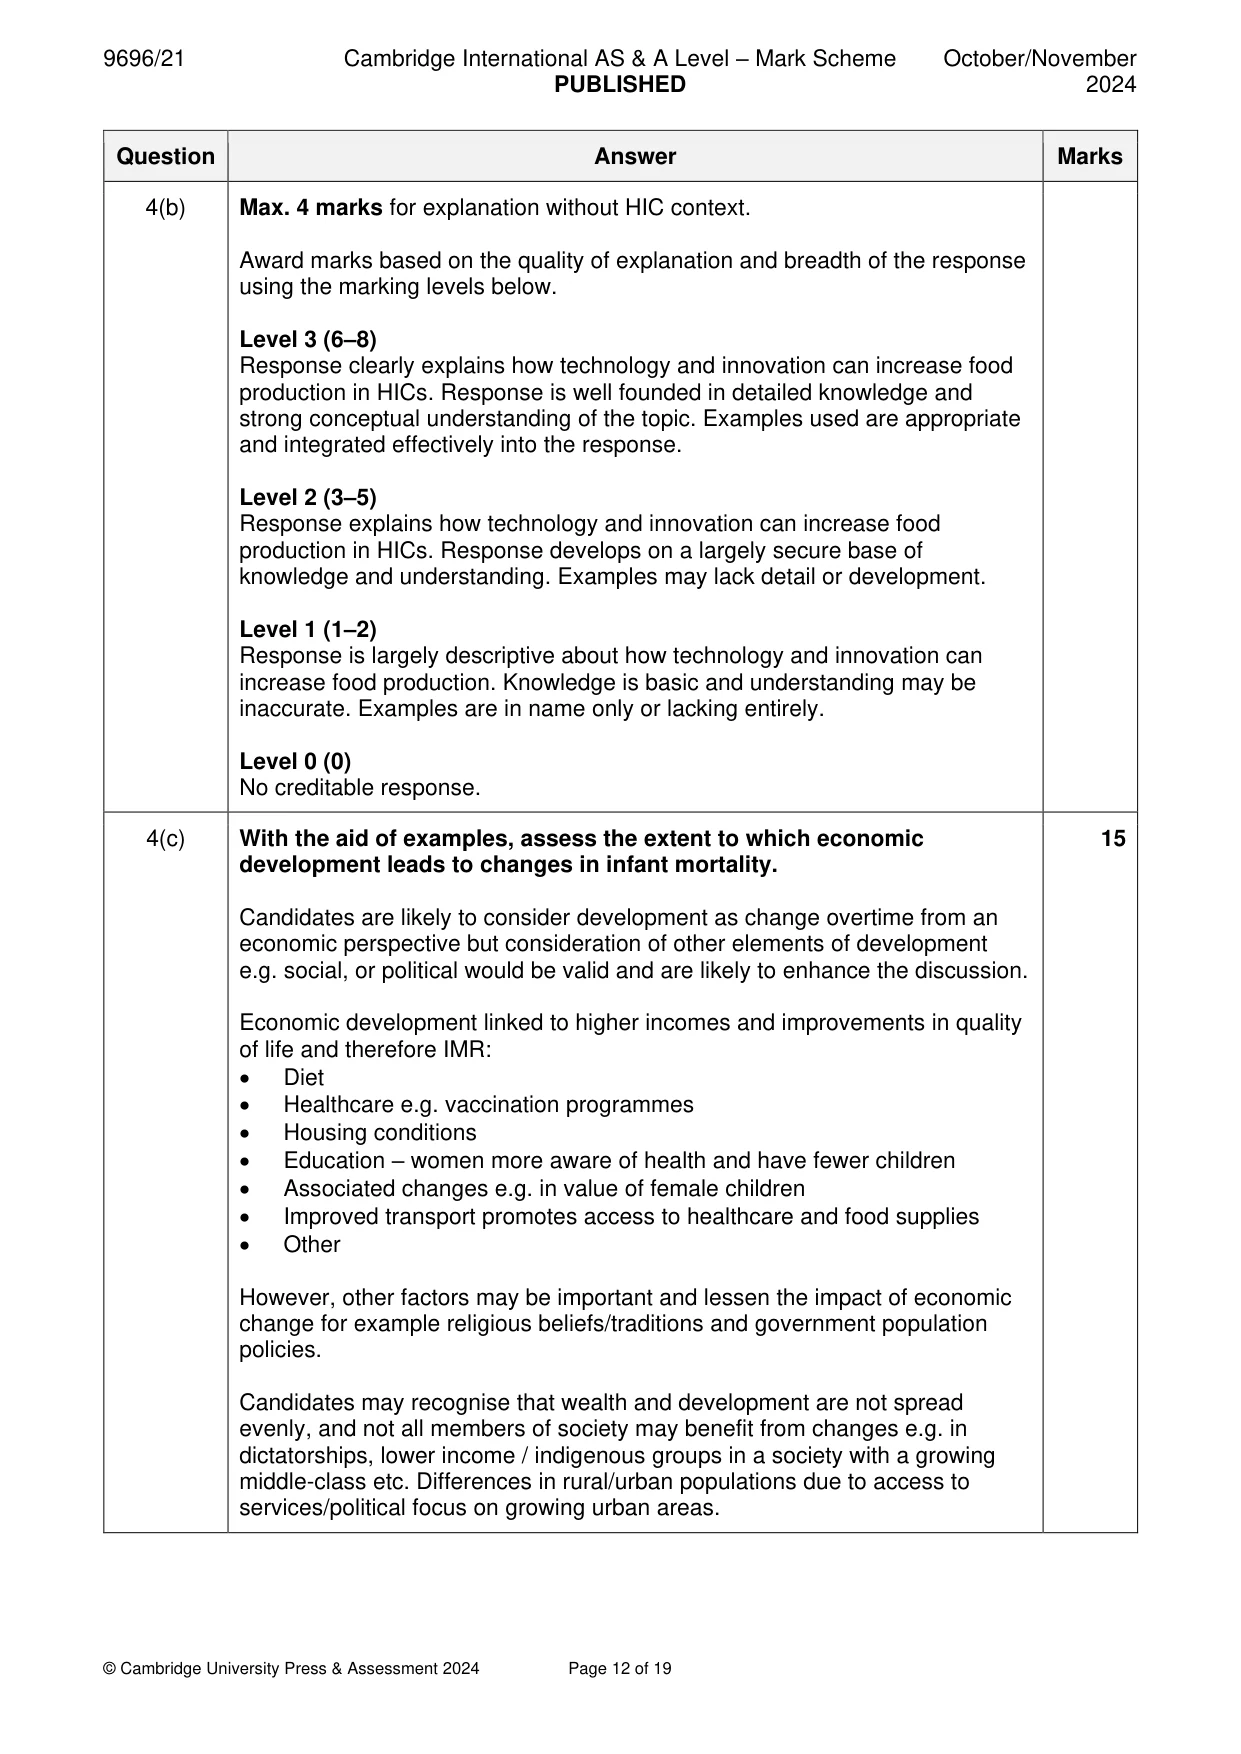
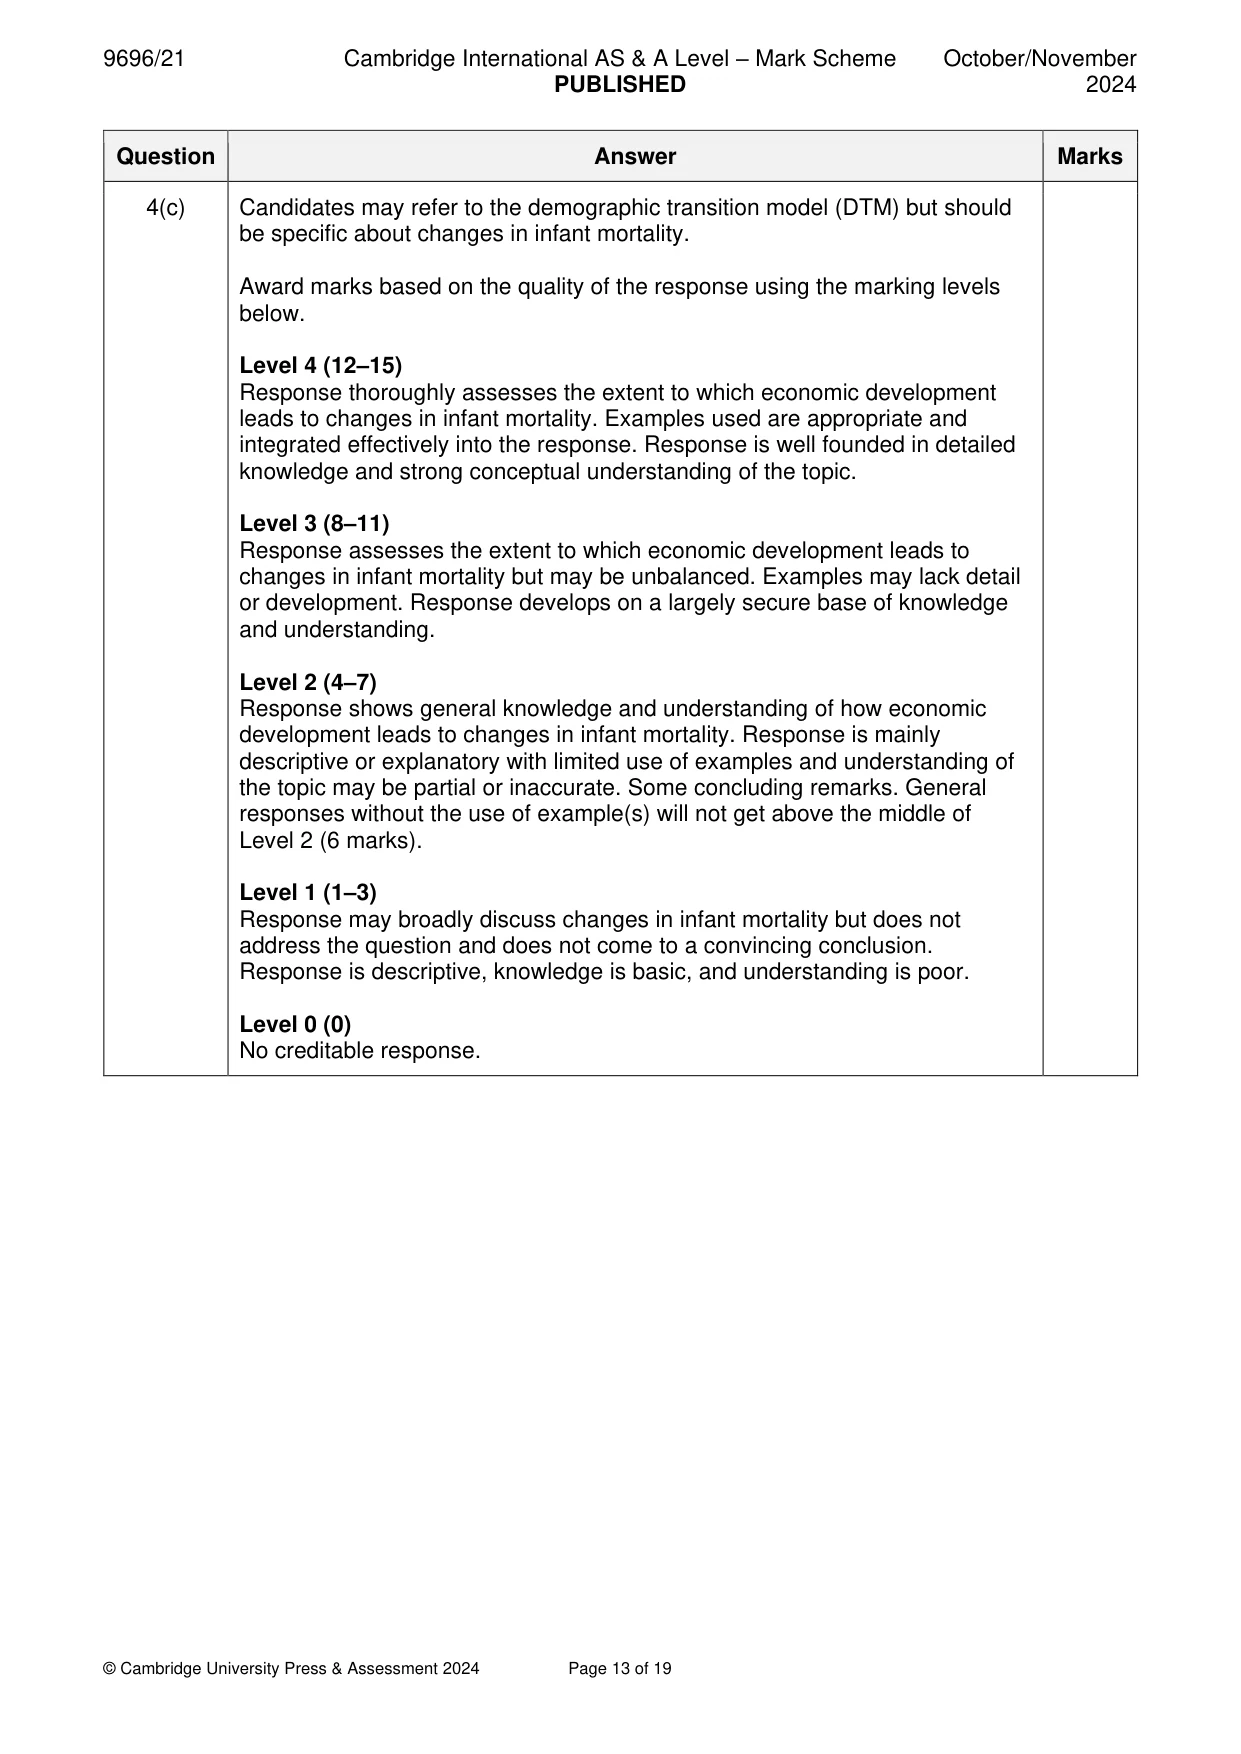
Mark scheme: 4(a) Describe the role of constraints in relation to sustaining a population. 7 The role of constraints in relation to sustaining a population might include reference to: • War/conflict • Hazards – earthquakes, floods, drought, tropical storms, wildfires • Poverty/lack of capital to sustain growing population • Famine resulting from food shortages • Disease due to poor nutrition/poverty, pandemics, pests • Resource depletion e.g. soils (desertification), water • Possibly social aspects e.g. level of education/role of women in society • Political aspects 1 mark for a simple description, 2 marks for a developed description (such as detail or an example) up to the maximum. 4(b) With the aid of examples, explain how technology and innovation can 8 increase food production in HICs. Explanations could refer to improvements of existing practices or to new practices and might have a lower or higher technological level. Food production is more than the growing of food, so comments on post-harvesting or processing of food are valid and the ability to make food safer, healthier and more nutritious. Examples might include: • Machinery with hi-tech to control aspects such as planting, weeding, application of chemicals, harvesting, use of GPS • Precision application of inputs/irrigation • Sensors to monitor environmental conditions • Use of remote sensing • Laboratory production • Genetically modified organisms/selective breeding to increase yields and overcome environmental constraints • Artificial environments e.g. hydroponics • Space saving technology such as vertical farming • Improved storage and packaging post-harvesting • Other Technology and innovation are difficult to separate and there is no reserve for consideration of one only. 4(b) Max. 4 marks for explanation without HIC context. Award marks based on the quality of explanation and breadth of the response using the marking levels below. Level 3 (6–8) Response clearly explains how technology and innovation can increase food production in HICs. Response is well founded in detailed knowledge and strong conceptual understanding of the topic. Examples used are appropriate and integrated effectively into the response. Level 2 (3–5) Response explains how technology and innovation can increase food production in HICs. Response develops on a largely secure base of knowledge and understanding. Examples may lack detail or development. Level 1 (1–2) Response is largely descriptive about how technology and innovation can increase food production. Knowledge is basic and understanding may be inaccurate. Examples are in name only or lacking entirely. Level 0 (0) No creditable response. 4(c) With the aid of examples, assess the extent to which economic 15 development leads to changes in infant mortality. Candidates are likely to consider development as change overtime from an economic perspective but consideration of other elements of development e.g. social, or political would be valid and are likely to enhance the discussion. Economic development linked to higher incomes and improvements in quality of life and therefore IMR: • Diet • Healthcare e.g. vaccination programmes • Housing conditions • Education – women more aware of health and have fewer children • Associated changes e.g. in value of female children • Improved transport promotes access to healthcare and food supplies • Other However, other factors may be important and lessen the impact of economic change for example religious beliefs/traditions and government population policies. Candidates may recognise that wealth and development are not spread evenly, and not all members of society may benefit from changes e.g. in dictatorships, lower income / indigenous groups in a society with a growing middle-class etc. Differences in rural/urban populations due to access to services/political focus on growing urban areas. 4(c) Candidates may refer to the demographic transition model (DTM) but should be specific about changes in infant mortality. Award marks based on the quality of the response using the marking levels below. Level 4 (12–15) Response thoroughly assesses the extent to which economic development leads to changes in infant mortality. Examples used are appropriate and integrated effectively into the response. Response is well founded in detailed knowledge and strong conceptual understanding of the topic. Level 3 (8–11) Response assesses the extent to which economic development leads to changes in infant mortality but may be unbalanced. Examples may lack detail or development. Response develops on a largely secure base of knowledge and understanding. Level 2 (4–7) Response shows general knowledge and understanding of how economic development leads to changes in infant mortality. Response is mainly descriptive or explanatory with limited use of examples and understanding of the topic may be partial or inaccurate. Some concluding remarks. General responses without the use of example(s) will not get above the middle of Level 2 (6 marks). Level 1 (1–3) Response may broadly discuss changes in infant mortality but does not address the question and does not come to a convincing conclusion. Response is descriptive, knowledge is basic, and understanding is poor. Level 0 (0) No creditable response. Migration
Q5 · Define the term economic migrant
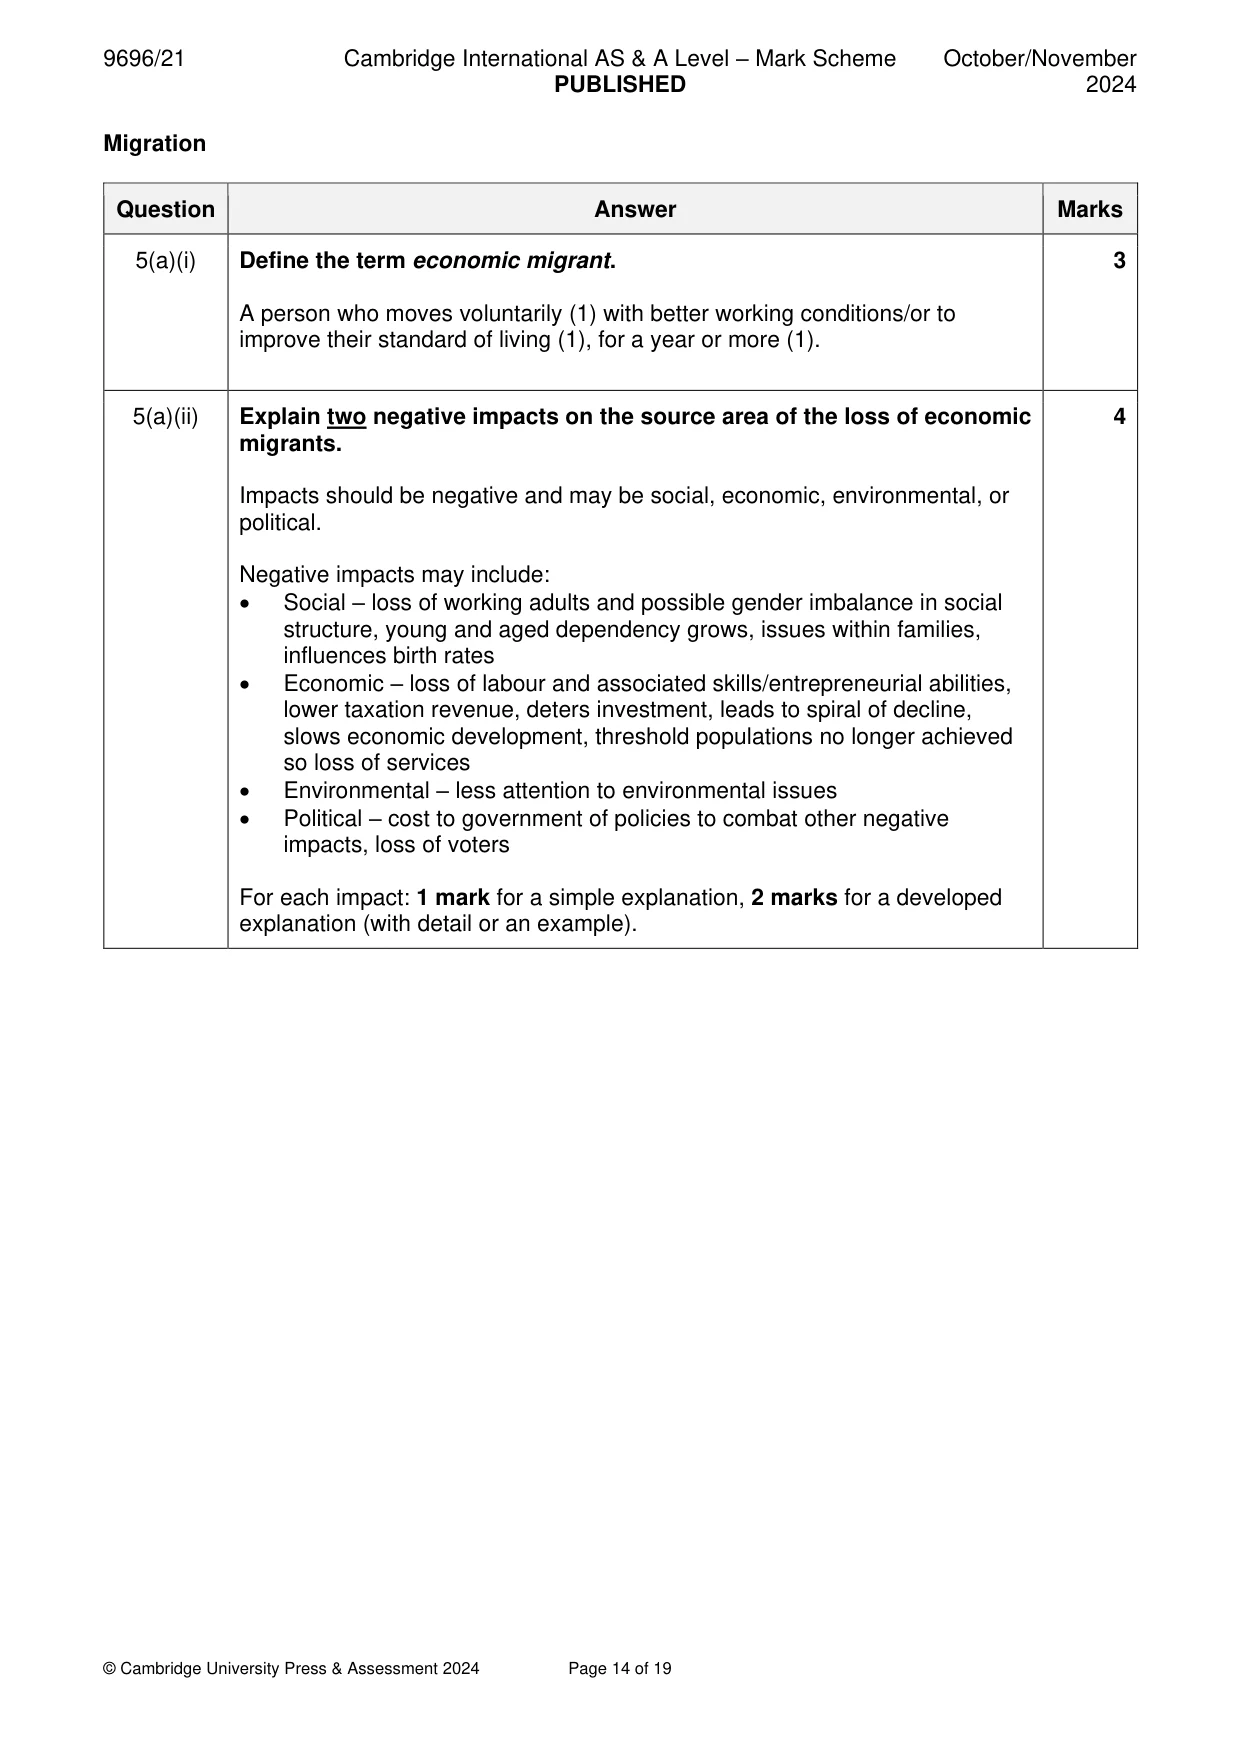
5 (a) (i) Define the term economic migrant. [3] (ii) Explain two negative impacts on the source area of the loss of economic migrants. [4] (b) Using a case study, explain the causes of one international migration stream. [8] (c) For your case study in (b), assess the extent to which the impacts on the receiving/destination areas were positive. [15] Settlement dynamics
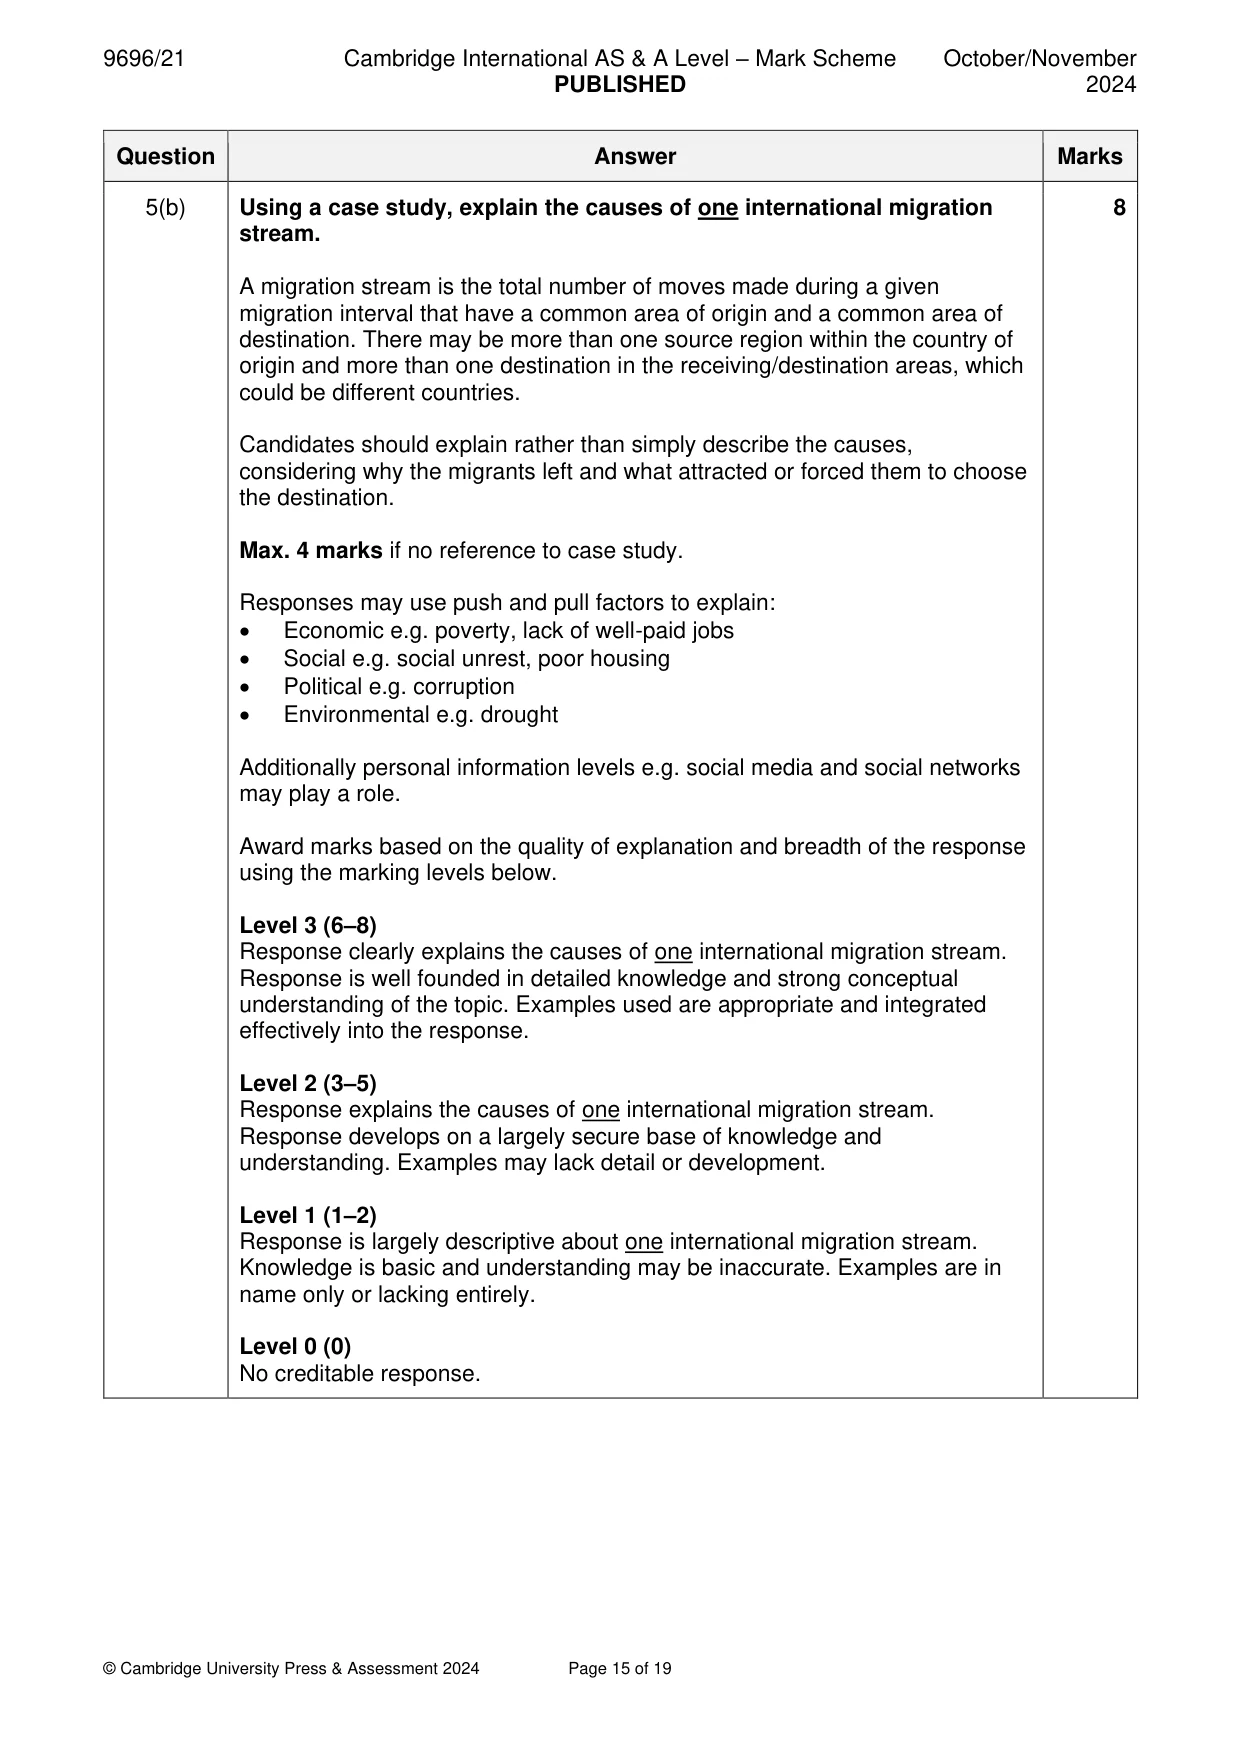
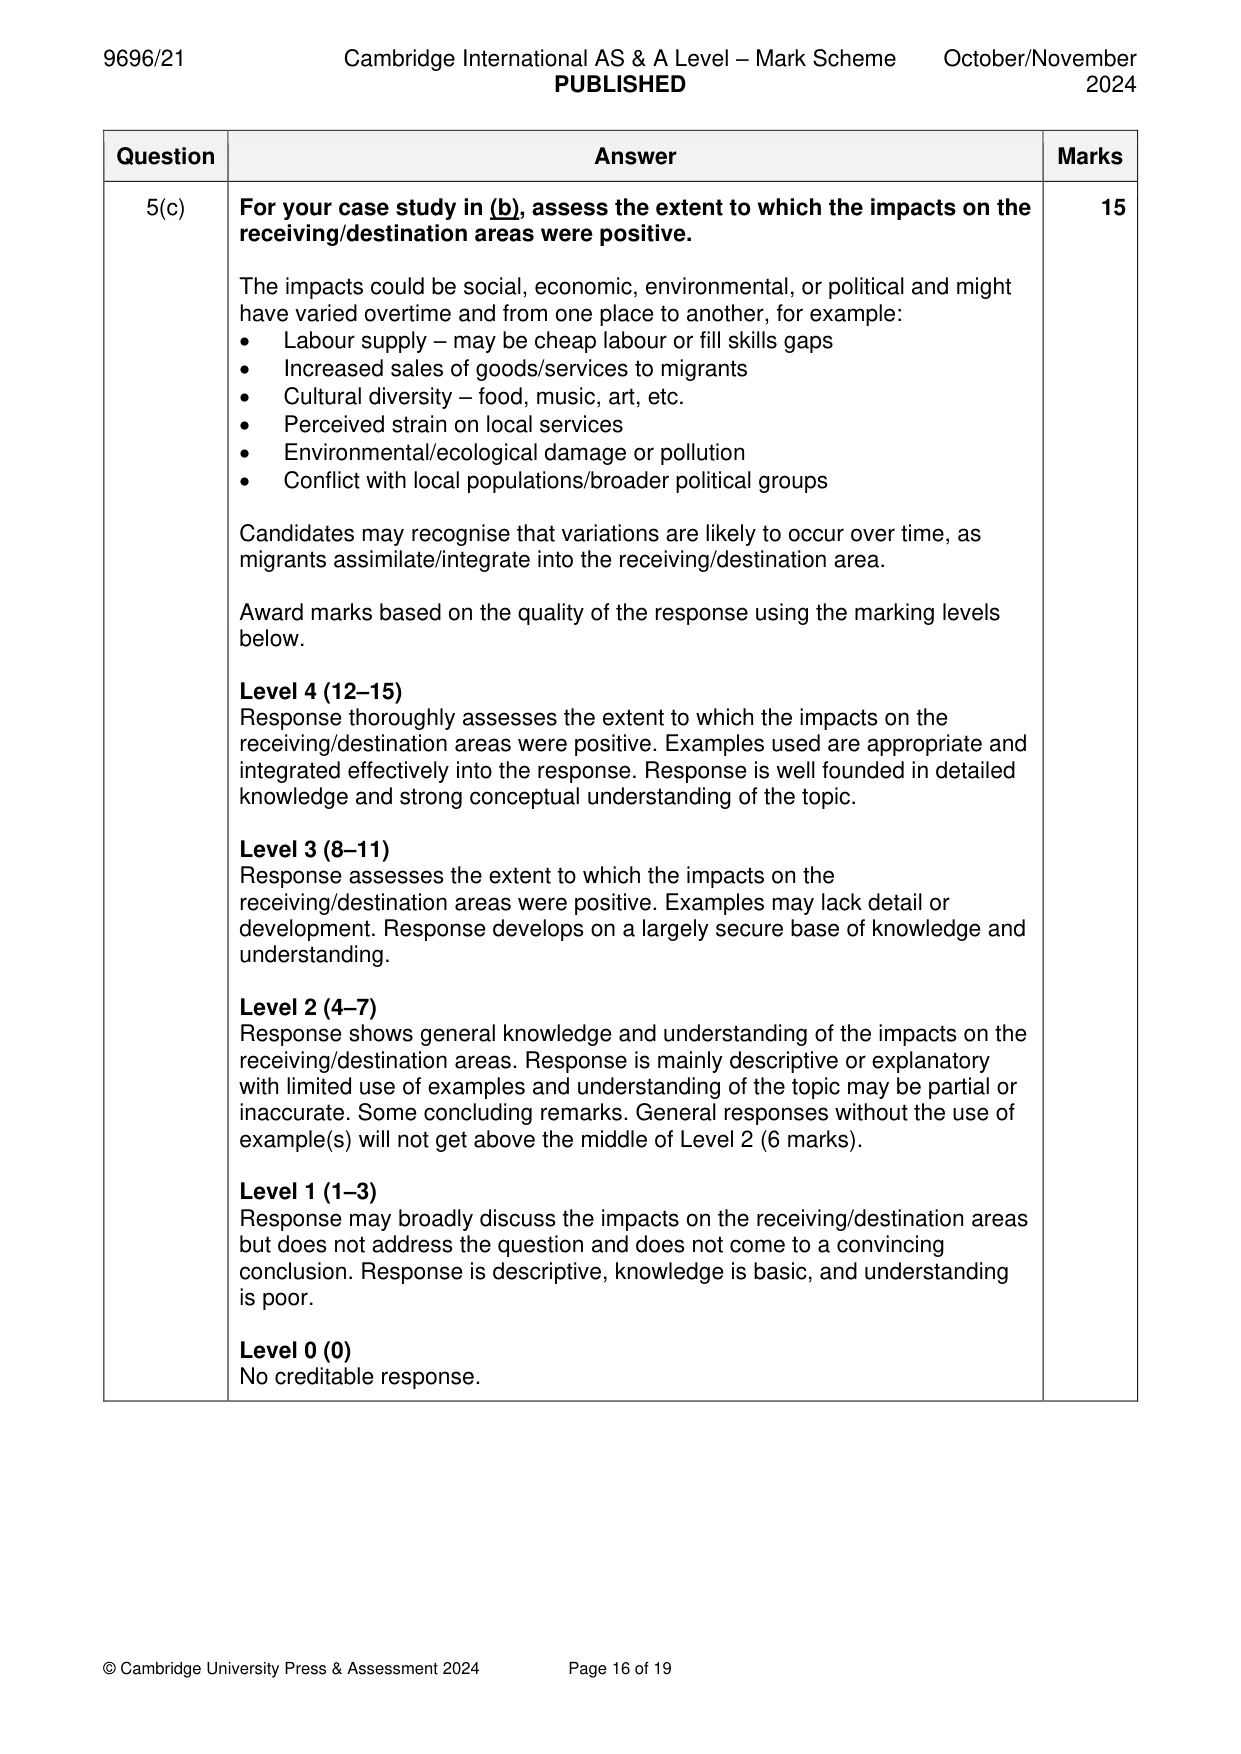
Mark scheme: 5(a)(i) Define the term economic migrant. 3 A person who moves voluntarily (1) with better working conditions/or to improve their standard of living (1), for a year or more (1). 5(a)(ii) Explain two negative impacts on the source area of the loss of economic 4 migrants. Impacts should be negative and may be social, economic, environmental, or political. Negative impacts may include: • Social – loss of working adults and possible gender imbalance in social structure, young and aged dependency grows, issues within families, influences birth rates • Economic – loss of labour and associated skills/entrepreneurial abilities, lower taxation revenue, deters investment, leads to spiral of decline, slows economic development, threshold populations no longer achieved so loss of services • Environmental – less attention to environmental issues • Political – cost to government of policies to combat other negative impacts, loss of voters For each impact: 1 mark for a simple explanation, 2 marks for a developed explanation (with detail or an example). 5(b) Using a case study, explain the causes of one international migration 8 stream. A migration stream is the total number of moves made during a given migration interval that have a common area of origin and a common area of destination. There may be more than one source region within the country of origin and more than one destination in the receiving/destination areas, which could be different countries. Candidates should explain rather than simply describe the causes, considering why the migrants left and what attracted or forced them to choose the destination. Max. 4 marks if no reference to case study. Responses may use push and pull factors to explain: • Economic e.g. poverty, lack of well-paid jobs • Social e.g. social unrest, poor housing • Political e.g. corruption • Environmental e.g. drought Additionally personal information levels e.g. social media and social networks may play a role. Award marks based on the quality of explanation and breadth of the response using the marking levels below. Level 3 (6–8) Response clearly explains the causes of one international migration stream. Response is well founded in detailed knowledge and strong conceptual understanding of the topic. Examples used are appropriate and integrated effectively into the response. Level 2 (3–5) Response explains the causes of one international migration stream. Response develops on a largely secure base of knowledge and understanding. Examples may lack detail or development. Level 1 (1–2) Response is largely descriptive about one international migration stream. Knowledge is basic and understanding may be inaccurate. Examples are in name only or lacking entirely. Level 0 (0) No creditable response. 5(c) For your case study in (b), assess the extent to which the impacts on the 15 receiving/destination areas were positive. The impacts could be social, economic, environmental, or political and might have varied overtime and from one place to another, for example: • Labour supply – may be cheap labour or fill skills gaps • Increased sales of goods/services to migrants • Cultural diversity – food, music, art, etc. • Perceived strain on local services • Environmental/ecological damage or pollution • Conflict with local populations/broader political groups Candidates may recognise that variations are likely to occur over time, as migrants assimilate/integrate into the receiving/destination area. Award marks based on the quality of the response using the marking levels below. Level 4 (12–15) Response thoroughly assesses the extent to which the impacts on the receiving/destination areas were positive. Examples used are appropriate and integrated effectively into the response. Response is well founded in detailed knowledge and strong conceptual understanding of the topic. Level 3 (8–11) Response assesses the extent to which the impacts on the receiving/destination areas were positive. Examples may lack detail or development. Response develops on a largely secure base of knowledge and understanding. Level 2 (4–7) Response shows general knowledge and understanding of the impacts on the receiving/destination areas. Response is mainly descriptive or explanatory with limited use of examples and understanding of the topic may be partial or inaccurate. Some concluding remarks. General responses without the use of example(s) will not get above the middle of Level 2 (6 marks). Level 1 (1–3) Response may broadly discuss the impacts on the receiving/destination areas but does not address the question and does not come to a convincing conclusion. Response is descriptive, knowledge is basic, and understanding is poor. Level 0 (0) No creditable response. Settlement dynamics
Q6 · Describe how the concept of bid rent results in the functional zonation of land use in…
6 (a) Describe how the concept of bid rent results in the functional zonation of land use in urban areas. [7] (b) With the aid of examples, explain the issues in the provision of services in rural settlements. [8] (c) ‘The consequences of urban growth on rural settlements are mostly negative.’ With the aid of examples, how far do you agree with this statement? [15]
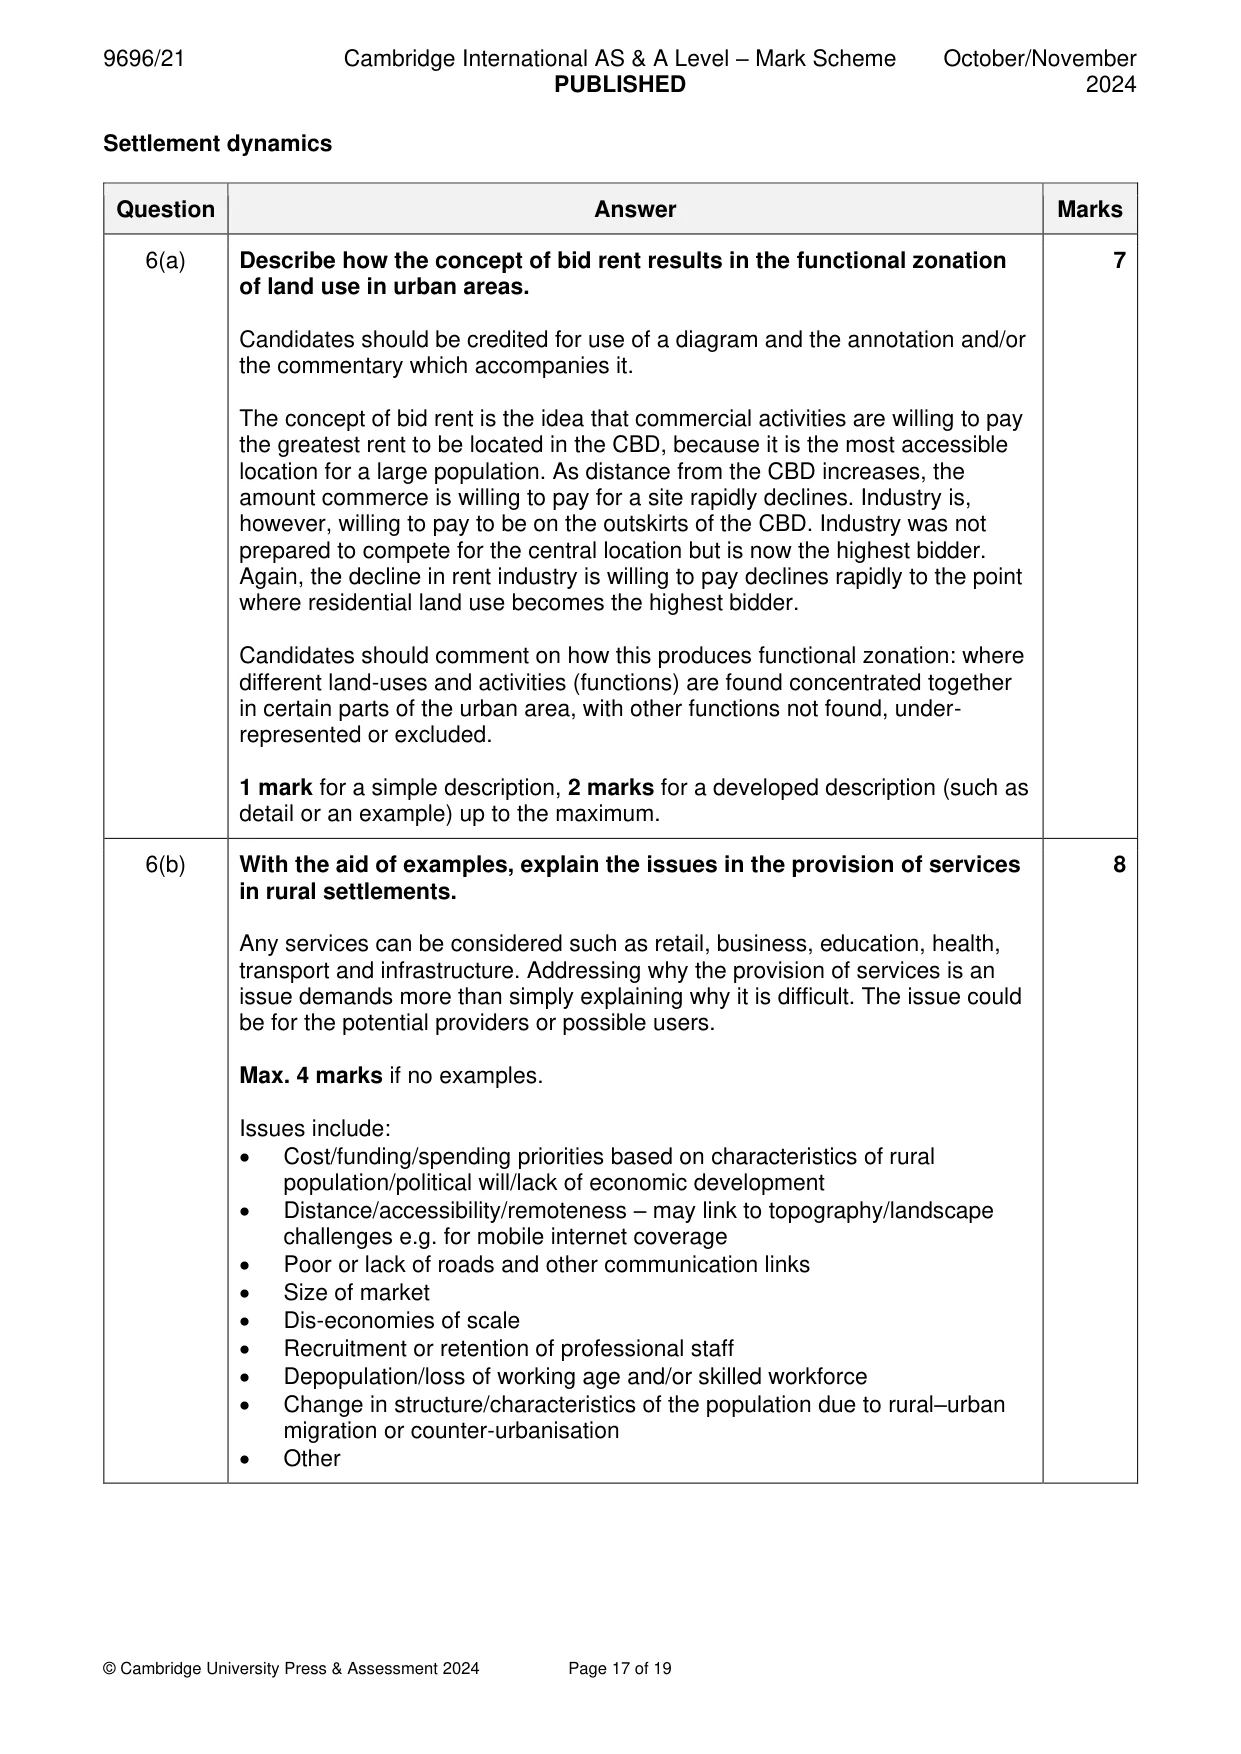
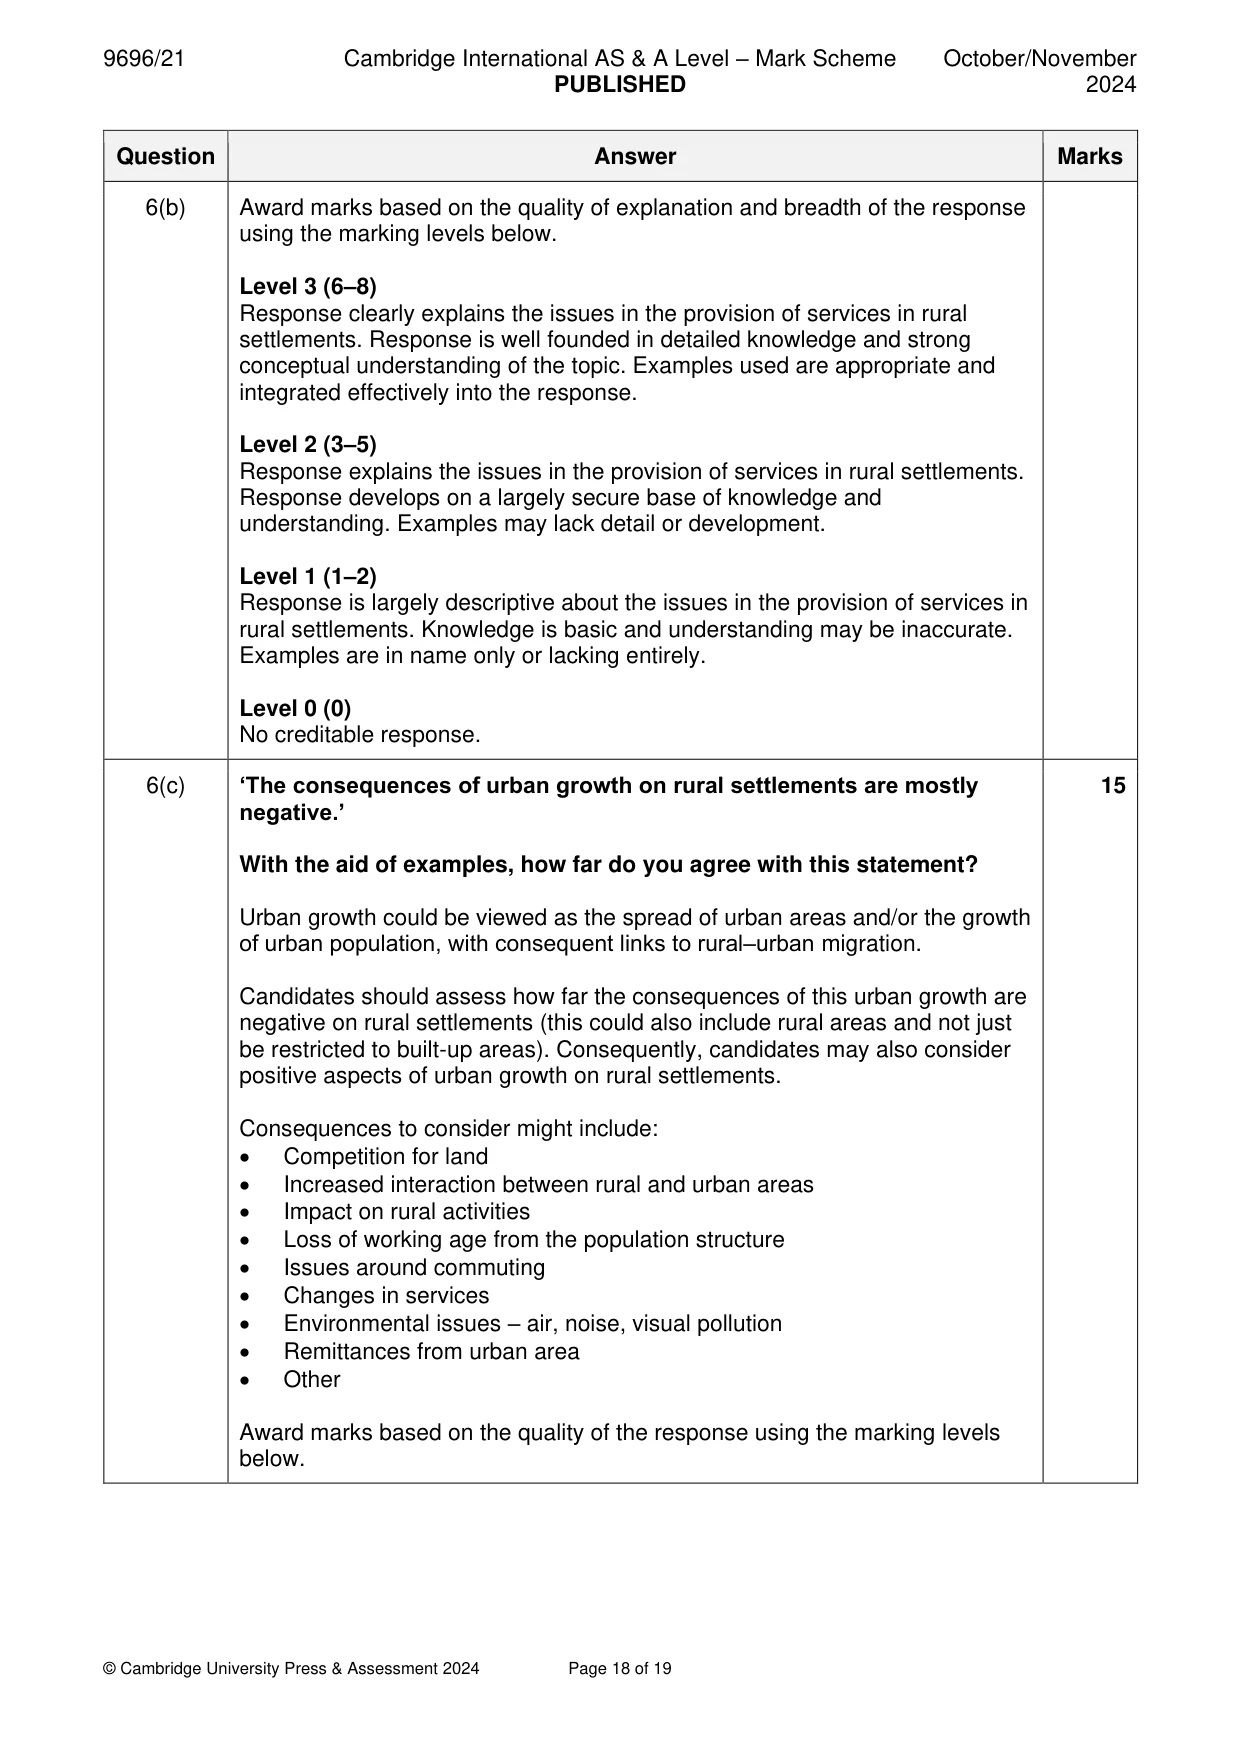
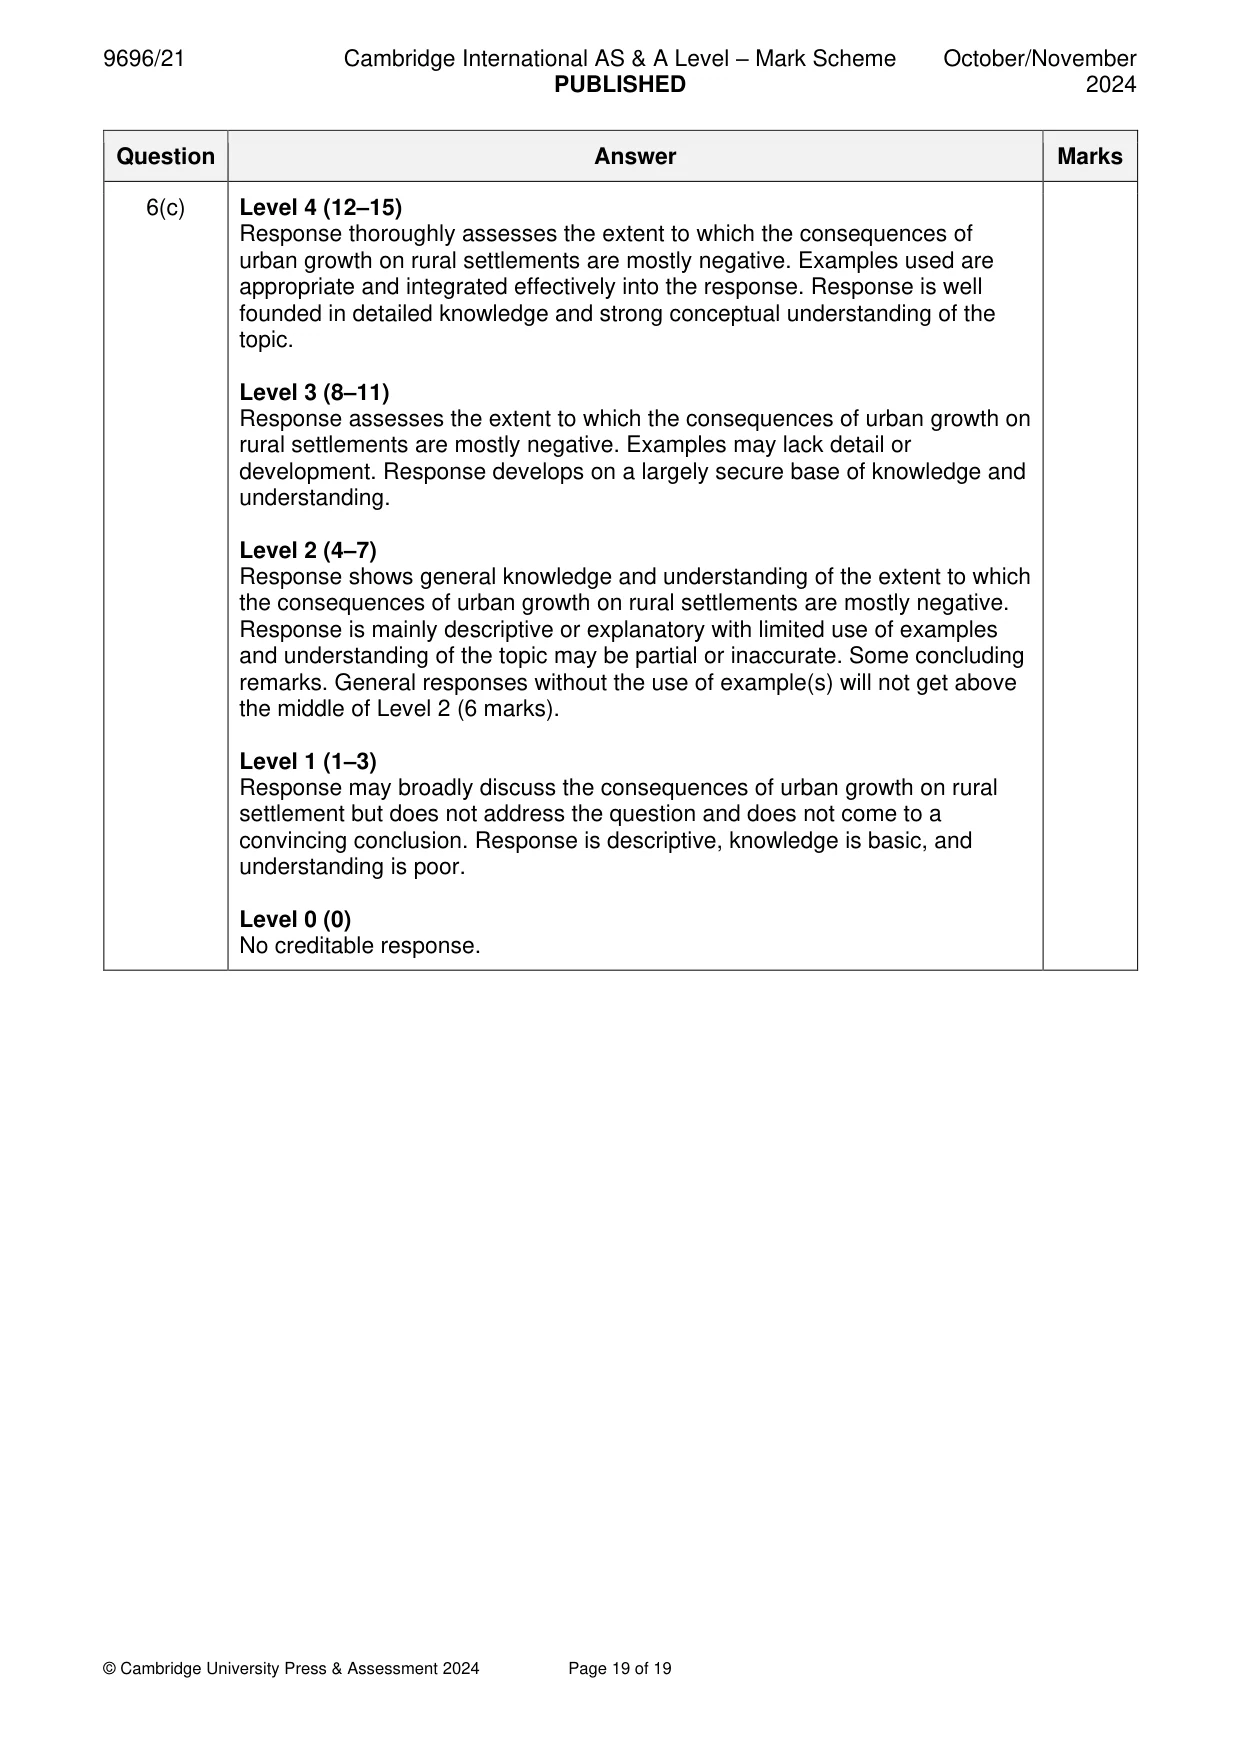
Mark scheme: 6(a) Describe how the concept of bid rent results in the functional zonation 7 of land use in urban areas. Candidates should be credited for use of a diagram and the annotation and/or the commentary which accompanies it. The concept of bid rent is the idea that commercial activities are willing to pay the greatest rent to be located in the CBD, because it is the most accessible location for a large population. As distance from the CBD increases, the amount commerce is willing to pay for a site rapidly declines. Industry is, however, willing to pay to be on the outskirts of the CBD. Industry was not prepared to compete for the central location but is now the highest bidder. Again, the decline in rent industry is willing to pay declines rapidly to the point where residential land use becomes the highest bidder. Candidates should comment on how this produces functional zonation: where different land-uses and activities (functions) are found concentrated together in certain parts of the urban area, with other functions not found, under- represented or excluded. 1 mark for a simple description, 2 marks for a developed description (such as detail or an example) up to the maximum. 6(b) With the aid of examples, explain the issues in the provision of services 8 in rural settlements. Any services can be considered such as retail, business, education, health, transport and infrastructure. Addressing why the provision of services is an issue demands more than simply explaining why it is difficult. The issue could be for the potential providers or possible users. Max. 4 marks if no examples. Issues include: • Cost/funding/spending priorities based on characteristics of rural population/political will/lack of economic development • Distance/accessibility/remoteness – may link to topography/landscape challenges e.g. for mobile internet coverage • Poor or lack of roads and other communication links • Size of market • Dis-economies of scale • Recruitment or retention of professional staff • Depopulation/loss of working age and/or skilled workforce • Change in structure/characteristics of the population due to rural–urban migration or counter-urbanisation • Other 6(b) Award marks based on the quality of explanation and breadth of the response using the marking levels below. Level 3 (6–8) Response clearly explains the issues in the provision of services in rural settlements. Response is well founded in detailed knowledge and strong conceptual understanding of the topic. Examples used are appropriate and integrated effectively into the response. Level 2 (3–5) Response explains the issues in the provision of services in rural settlements. Response develops on a largely secure base of knowledge and understanding. Examples may lack detail or development. Level 1 (1–2) Response is largely descriptive about the issues in the provision of services in rural settlements. Knowledge is basic and understanding may be inaccurate. Examples are in name only or lacking entirely. Level 0 (0) No creditable response. 6(c) ‘The consequences of urban growth on rural settlements are mostly 15 negative.’ With the aid of examples, how far do you agree with this statement? Urban growth could be viewed as the spread of urban areas and/or the growth of urban population, with consequent links to rural‒urban migration. Candidates should assess how far the consequences of this urban growth are negative on rural settlements (this could also include rural areas and not just be restricted to built-up areas). Consequently, candidates may also consider positive aspects of urban growth on rural settlements. Consequences to consider might include: • Competition for land • Increased interaction between rural and urban areas • Impact on rural activities • Loss of working age from the population structure • Issues around commuting • Changes in services • Environmental issues – air, noise, visual pollution • Remittances from urban area • Other Award marks based on the quality of the response using the marking levels below. 6(c) Level 4 (12–15) Response thoroughly assesses the extent to which the consequences of urban growth on rural settlements are mostly negative. Examples used are appropriate and integrated effectively into the response. Response is well founded in detailed knowledge and strong conceptual understanding of the topic. Level 3 (8–11) Response assesses the extent to which the consequences of urban growth on rural settlements are mostly negative. Examples may lack detail or development. Response develops on a largely secure base of knowledge and understanding. Level 2 (4–7) Response shows general knowledge and understanding of the extent to which the consequences of urban growth on rural settlements are mostly negative. Response is mainly descriptive or explanatory with limited use of examples and understanding of the topic may be partial or inaccurate. Some concluding remarks. General responses without the use of example(s) will not get above the middle of Level 2 (6 marks). Level 1 (1–3) Response may broadly discuss the consequences of urban growth on rural settlement but does not address the question and does not come to a convincing conclusion. Response is descriptive, knowledge is basic, and understanding is poor. Level 0 (0) No creditable response.
What was in this paper
The subtopics covered by these 6 questions, and how many questions each got. Open one in a new tab to see every Cambridge question on it.
What you needed in this session
Cambridge’s own grade thresholds for 2024 Oct/Nov, Paper 2 · Variant 1. A higher threshold means an easier paper — the bar moves with how the cohort did.