Cambridge A Level Geography 9696 — 2023 May/June Paper 2 · Variant 1
9696/21/M/J/23 · 6 questions · 60 marks · ≈68 min
The question paper and its mark scheme, free to read here and free to download. This is Cambridge’s own paper, exactly as it was sat.
Question paper4 pages
Mark scheme17 pages
Answers below. Sit the paper first if you are practising.
Questions as text
Q1 · The age/sex structure for the world in 1980
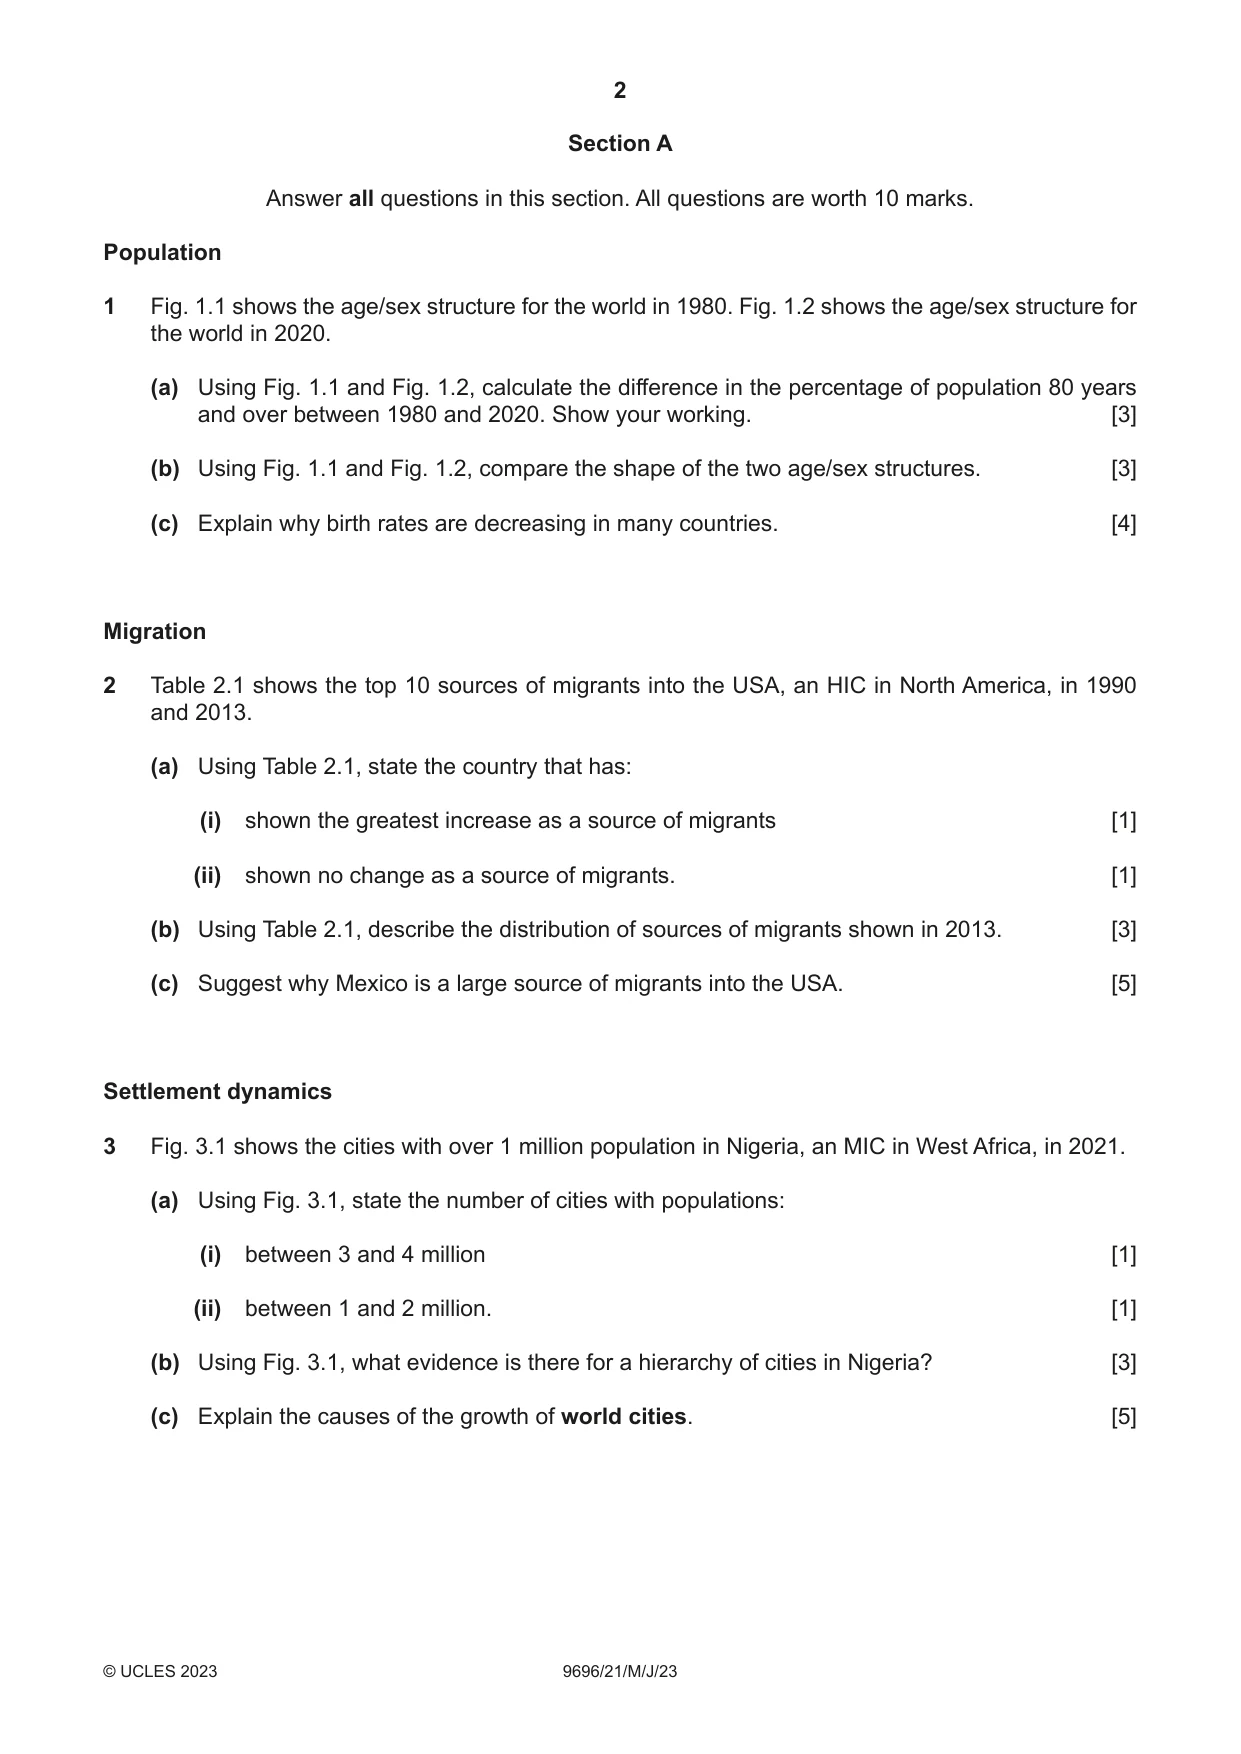
1 Fig. 1.1 shows the age/sex structure for the world in 1980. Fig. 1.2 shows the age/sex structure for the world in 2020. (a) Using Fig. 1.1 and Fig. 1.2, calculate the difference in the percentage of population 80 years and over between 1980 and 2020. Show your working. [3] (b) Using Fig. 1.1 and Fig. 1.2, compare the shape of the two age/sex structures. [3] (c) Explain why birth rates are decreasing in many countries. [4] Migration
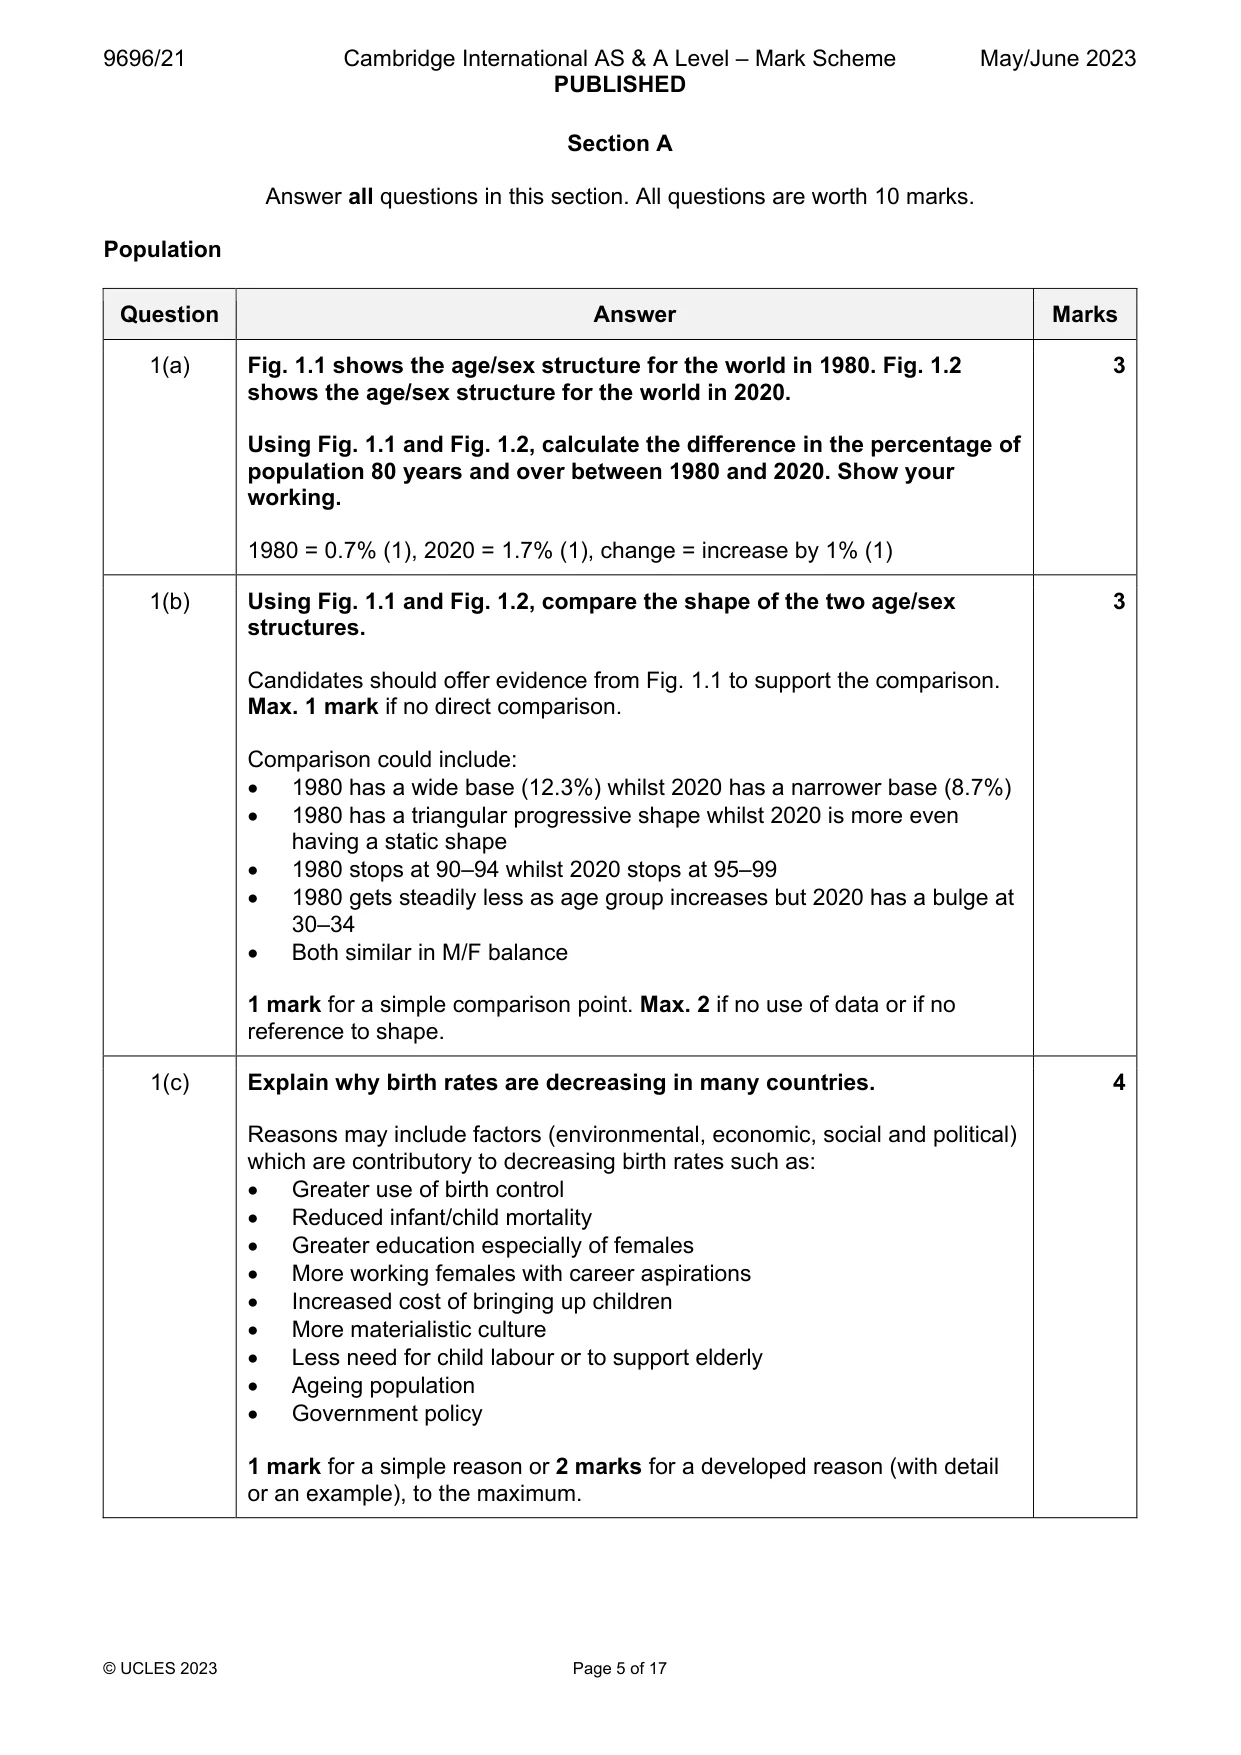
Mark scheme: Question Answer Marks 1(a) Fig. 1.1 shows the age/sex structure for the world in 1980. Fig. 1.2 3 shows the age/sex structure for the world in 2020. Using Fig. 1.1 and Fig. 1.2, calculate the difference in the percentage of population 80 years and over between 1980 and 2020. Show your working. 1980 = 0.7% (1), 2020 = 1.7% (1), change = increase by 1% (1) 1(b) Using Fig. 1.1 and Fig. 1.2, compare the shape of the two age/sex 3 structures. Candidates should offer evidence from Fig. 1.1 to support the comparison. Max. 1 mark if no direct comparison. Comparison could include: 1980 has a wide base (12.3%) whilst 2020 has a narrower base (8.7%) 1980 has a triangular progressive shape whilst 2020 is more even having a static shape 1980 stops at 90–94 whilst 2020 stops at 95–99 1980 gets steadily less as age group increases but 2020 has a bulge at 30–34 Both similar in M/F balance 1 mark for a simple comparison point. Max. 2 if no use of data or if no reference to shape. 1(c) Explain why birth rates are decreasing in many countries. 4 Reasons may include factors (environmental, economic, social and political) which are contributory to decreasing birth rates such as: Greater use of birth control Reduced infant/child mortality Greater education especially of females More working females with career aspirations Increased cost of bringing up children More materialistic culture Less need for child labour or to support elderly Ageing population Government policy 1 mark for a simple reason or 2 marks for a developed reason (with detail or an example), to the maximum. Migration
Q2 · The top 10 sources of migrants into the USA, an HIC in North America, in 1990 and 2013
2 Table 2.1 shows the top 10 sources of migrants into the USA, an HIC in North America, in 1990 and 2013. (a) Using Table 2.1, state the country that has: (i) shown the greatest increase as a source of migrants [1] (ii) shown no change as a source of migrants. [1] (b) Using Table 2.1, describe the distribution of sources of migrants shown in 2013. [3] (c) Suggest why Mexico is a large source of migrants into the USA. [5] Settlement dynamics
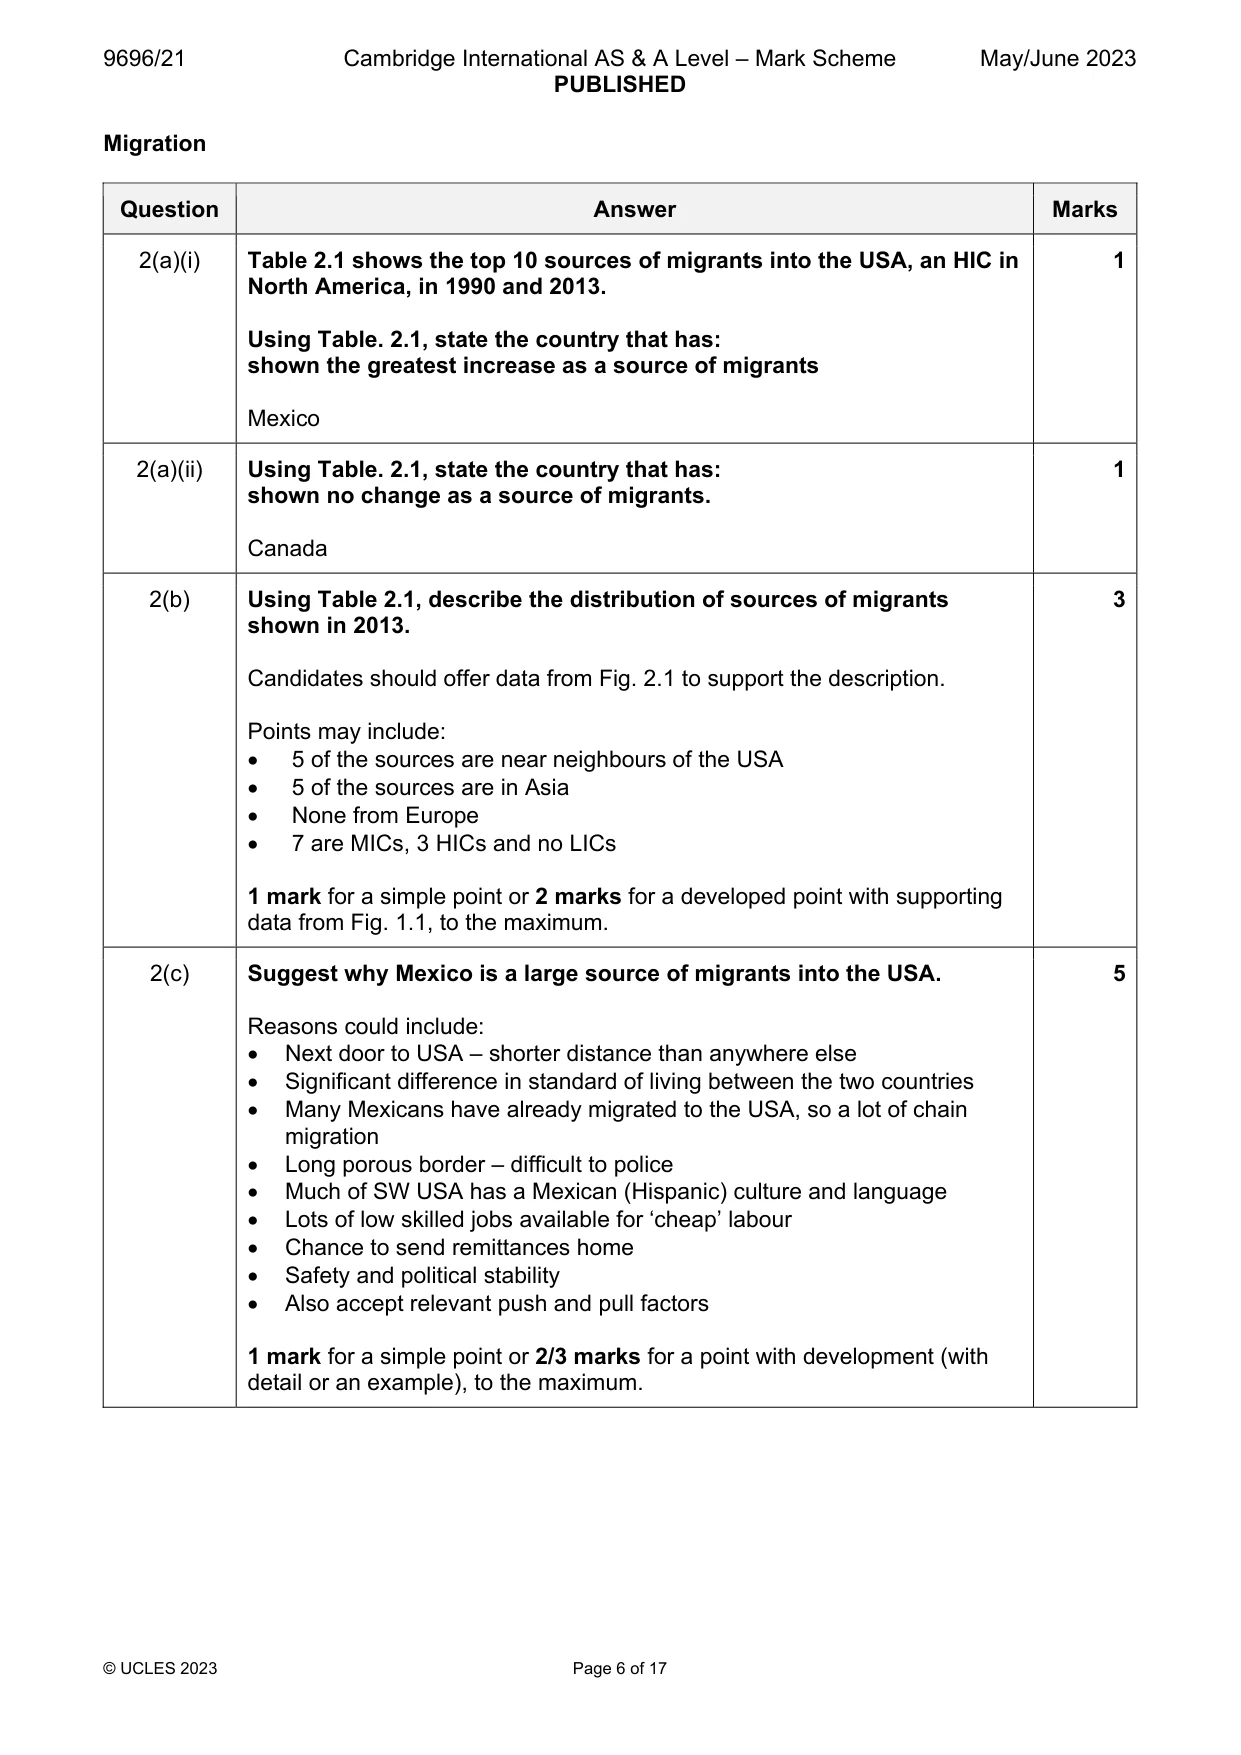
Mark scheme: 2(a)(i) Table 2.1 shows the top 10 sources of migrants into the USA, an HIC in 1 North America, in 1990 and 2013. Using Table. 2.1, state the country that has: shown the greatest increase as a source of migrants Mexico 2(a)(ii) Using Table. 2.1, state the country that has: 1 shown no change as a source of migrants. Canada 2(b) Using Table 2.1, describe the distribution of sources of migrants 3 shown in 2013. Candidates should offer data from Fig. 2.1 to support the description. Points may include: 5 of the sources are near neighbours of the USA 5 of the sources are in Asia None from Europe 7 are MICs, 3 HICs and no LICs 1 mark for a simple point or 2 marks for a developed point with supporting data from Fig. 1.1, to the maximum. 2(c) Suggest why Mexico is a large source of migrants into the USA. 5 Reasons could include: Next door to USA – shorter distance than anywhere else Significant difference in standard of living between the two countries Many Mexicans have already migrated to the USA, so a lot of chain migration Long porous border – difficult to police Much of SW USA has a Mexican (Hispanic) culture and language Lots of low skilled jobs available for ‘cheap’ labour Chance to send remittances home Safety and political stability Also accept relevant push and pull factors 1 mark for a simple point or 2/3 marks for a point with development (with detail or an example), to the maximum. Settlement dynamics
Q3 · The cities with over 1 million population in Nigeria, an MIC in West Africa, in 2021
3 Fig. 3.1 shows the cities with over 1 million population in Nigeria, an MIC in West Africa, in 2021. (a) Using Fig. 3.1, state the number of cities with populations: (i) between 3 and 4 million [1] (ii) between 1 and 2 million. [1] (b) Using Fig. 3.1, what evidence is there for a hierarchy of cities in Nigeria? [3] (c) Explain the causes of the growth of world cities. [5]
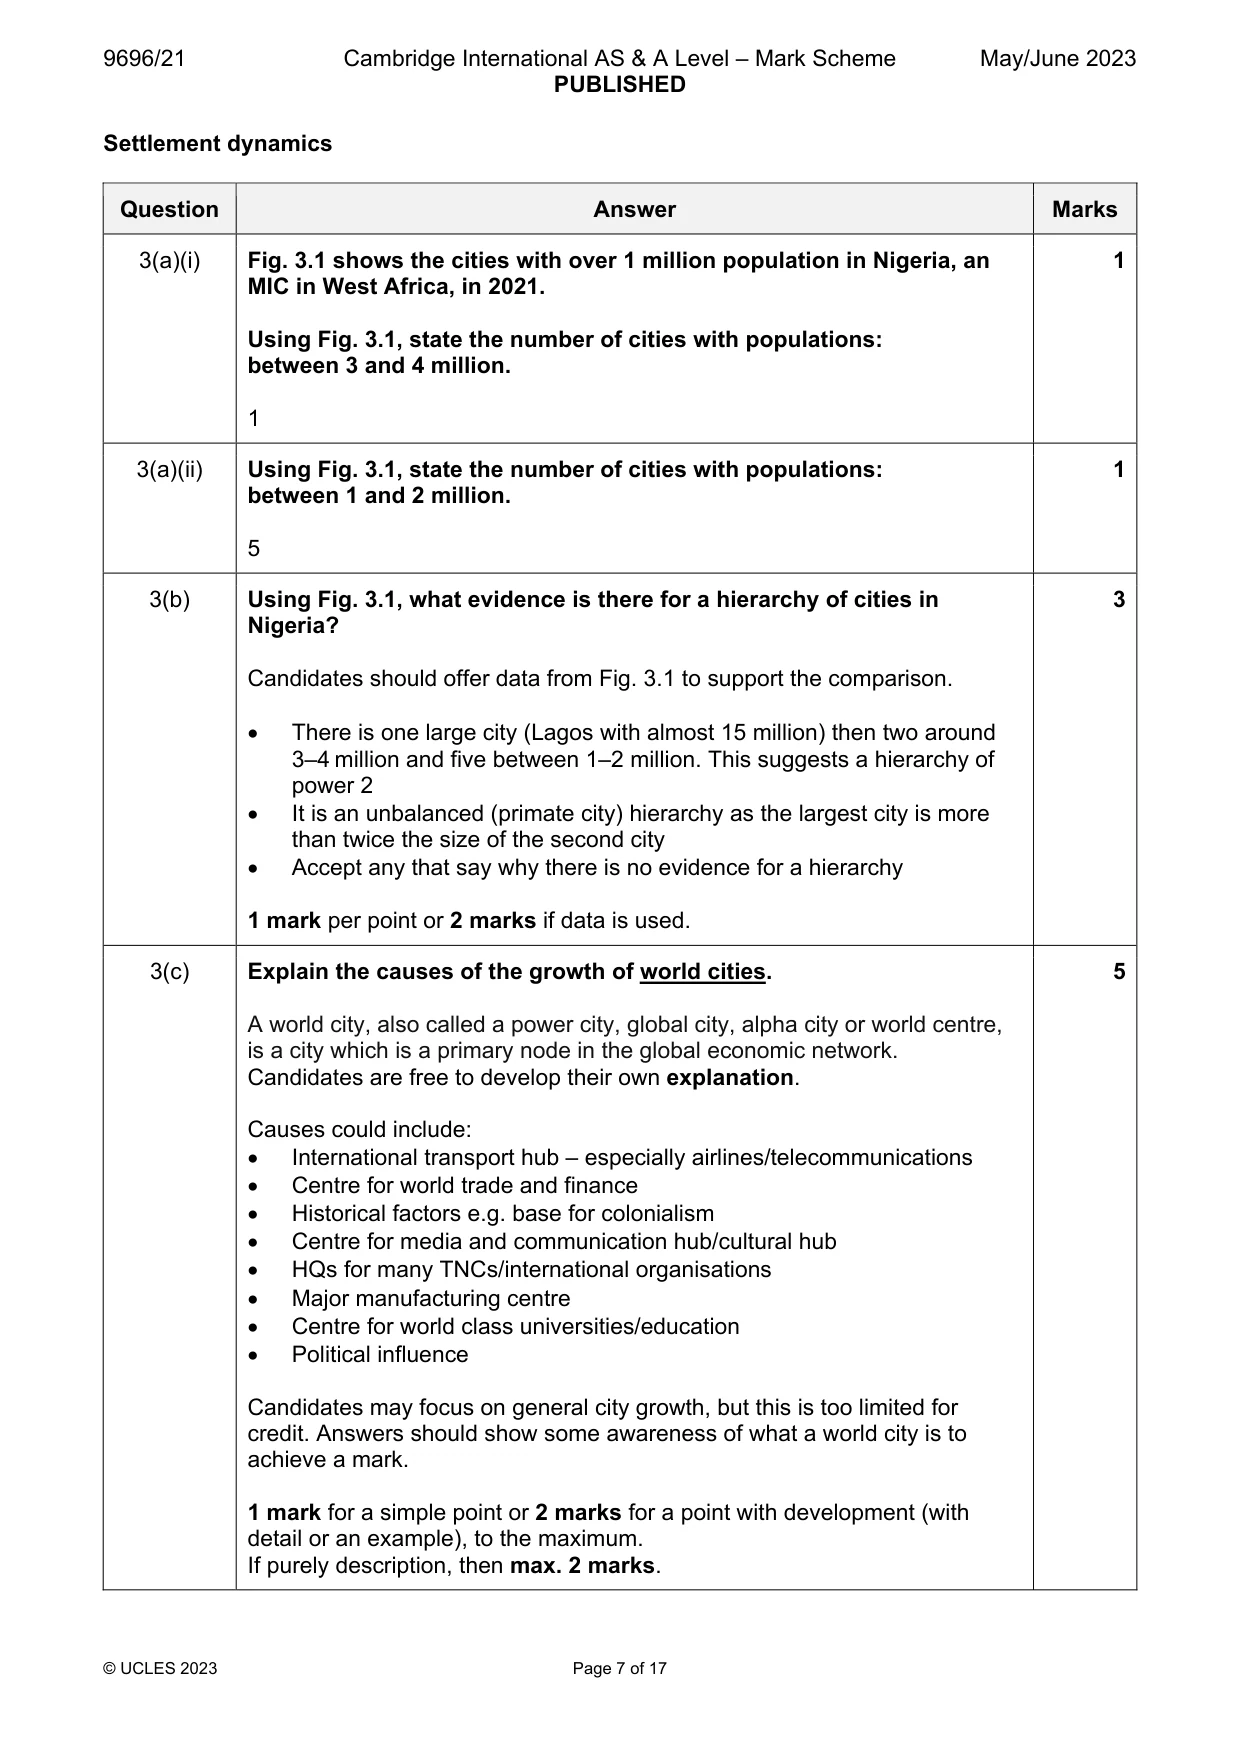
Mark scheme: 3(a)(i) Fig. 3.1 shows the cities with over 1 million population in Nigeria, an 1 MIC in West Africa, in 2021. Using Fig. 3.1, state the number of cities with populations: between 3 and 4 million. 1 3(a)(ii) Using Fig. 3.1, state the number of cities with populations: 1 between 1 and 2 million. 5 3(b) Using Fig. 3.1, what evidence is there for a hierarchy of cities in 3 Nigeria? Candidates should offer data from Fig. 3.1 to support the comparison. There is one large city (Lagos with almost 15 million) then two around 3–4 million and five between 1–2 million. This suggests a hierarchy of power 2 It is an unbalanced (primate city) hierarchy as the largest city is more than twice the size of the second city Accept any that say why there is no evidence for a hierarchy 1 mark per point or 2 marks if data is used. 3(c) Explain the causes of the growth of world cities. 5 A world city, also called a power city, global city, alpha city or world centre, is a city which is a primary node in the global economic network. Candidates are free to develop their own explanation. Causes could include: International transport hub – especially airlines/telecommunications Centre for world trade and finance Historical factors e.g. base for colonialism Centre for media and communication hub/cultural hub HQs for many TNCs/international organisations Major manufacturing centre Centre for world class universities/education Political influence Candidates may focus on general city growth, but this is too limited for credit. Answers should show some awareness of what a world city is to achieve a mark. 1 mark for a simple point or 2 marks for a point with development (with detail or an example), to the maximum. If purely description, then max. 2 marks. Section B Answer one question from this section. All questions are worth 30 marks. Population
Q4 · Outline the concepts of carrying capacity and optimum population
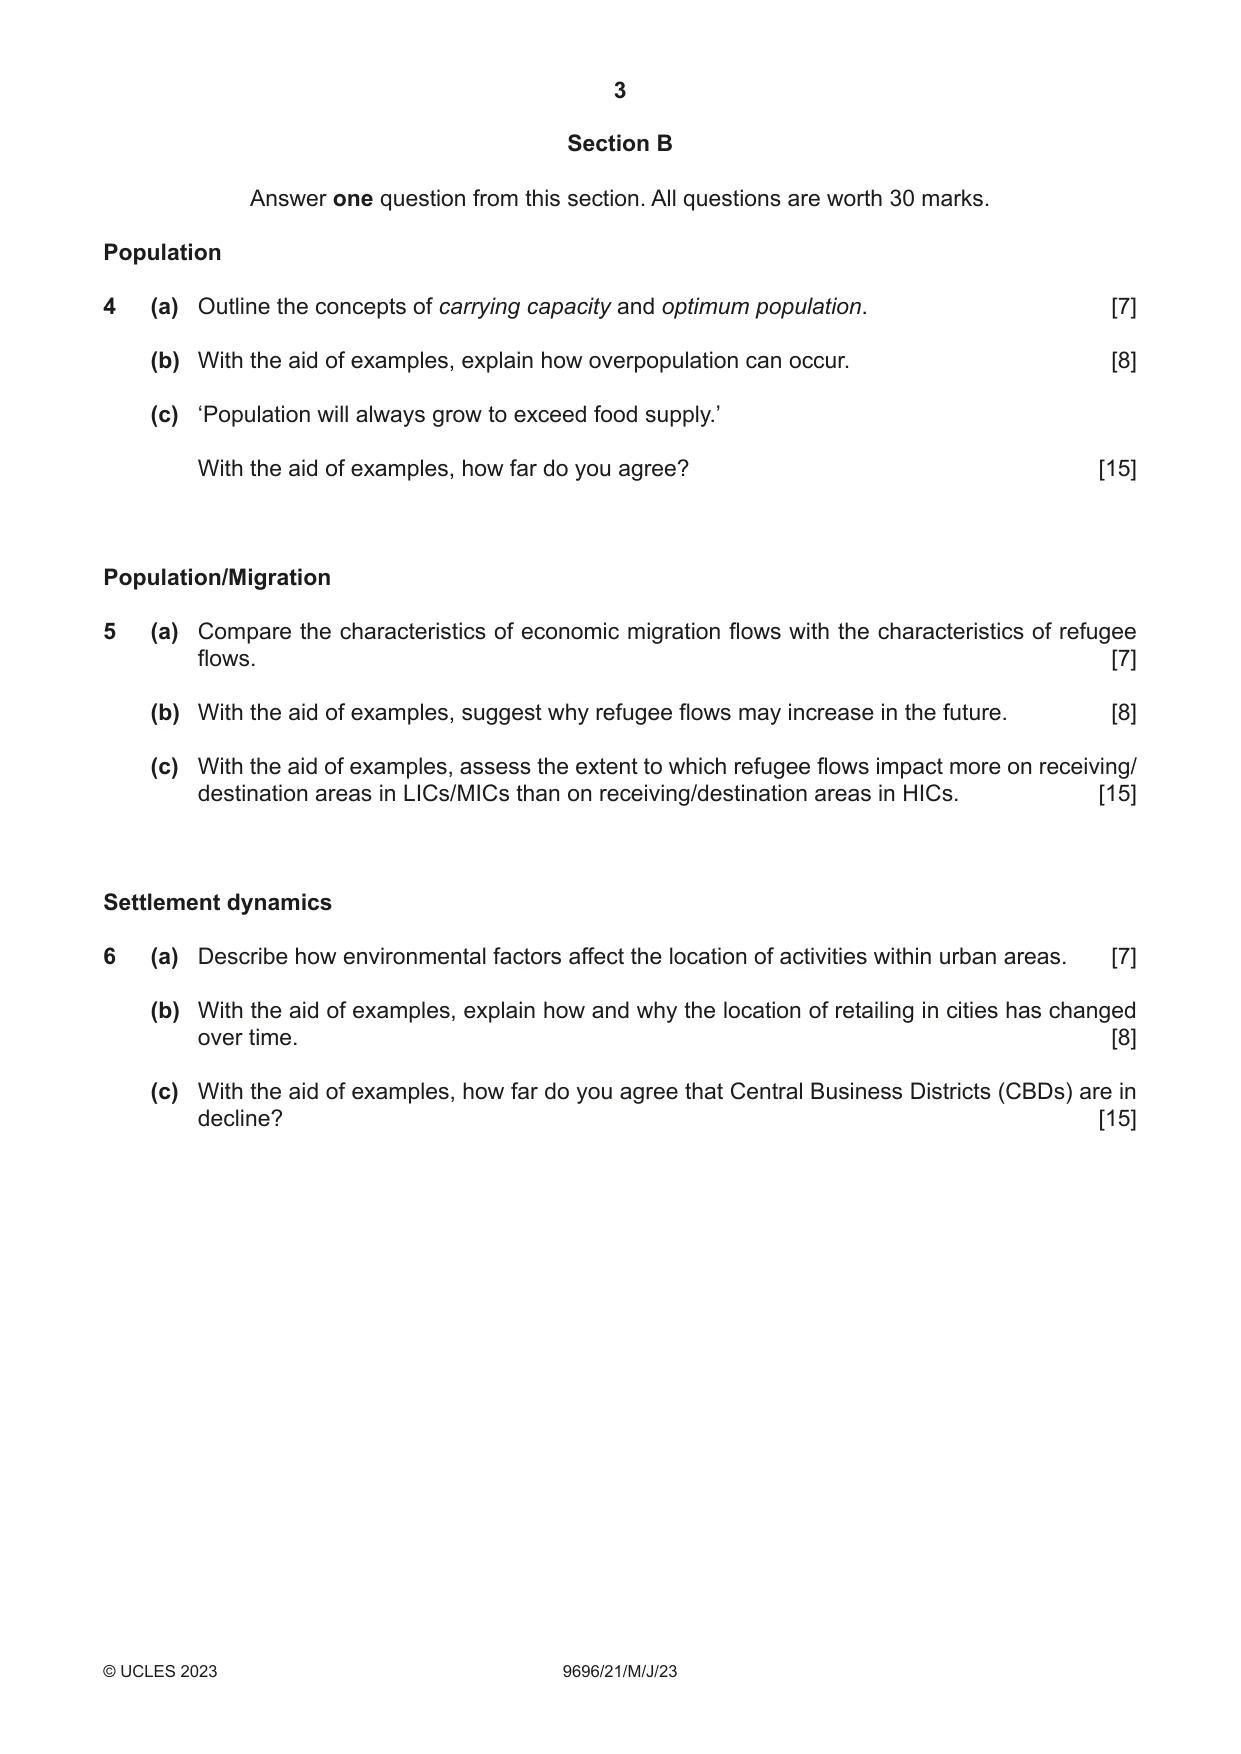
4 (a) Outline the concepts of carrying capacity and optimum population. [7] (b) With the aid of examples, explain how overpopulation can occur. [8] (c) ‘Population will always grow to exceed food supply.’ With the aid of examples, how far do you agree? [15] Population/Migration
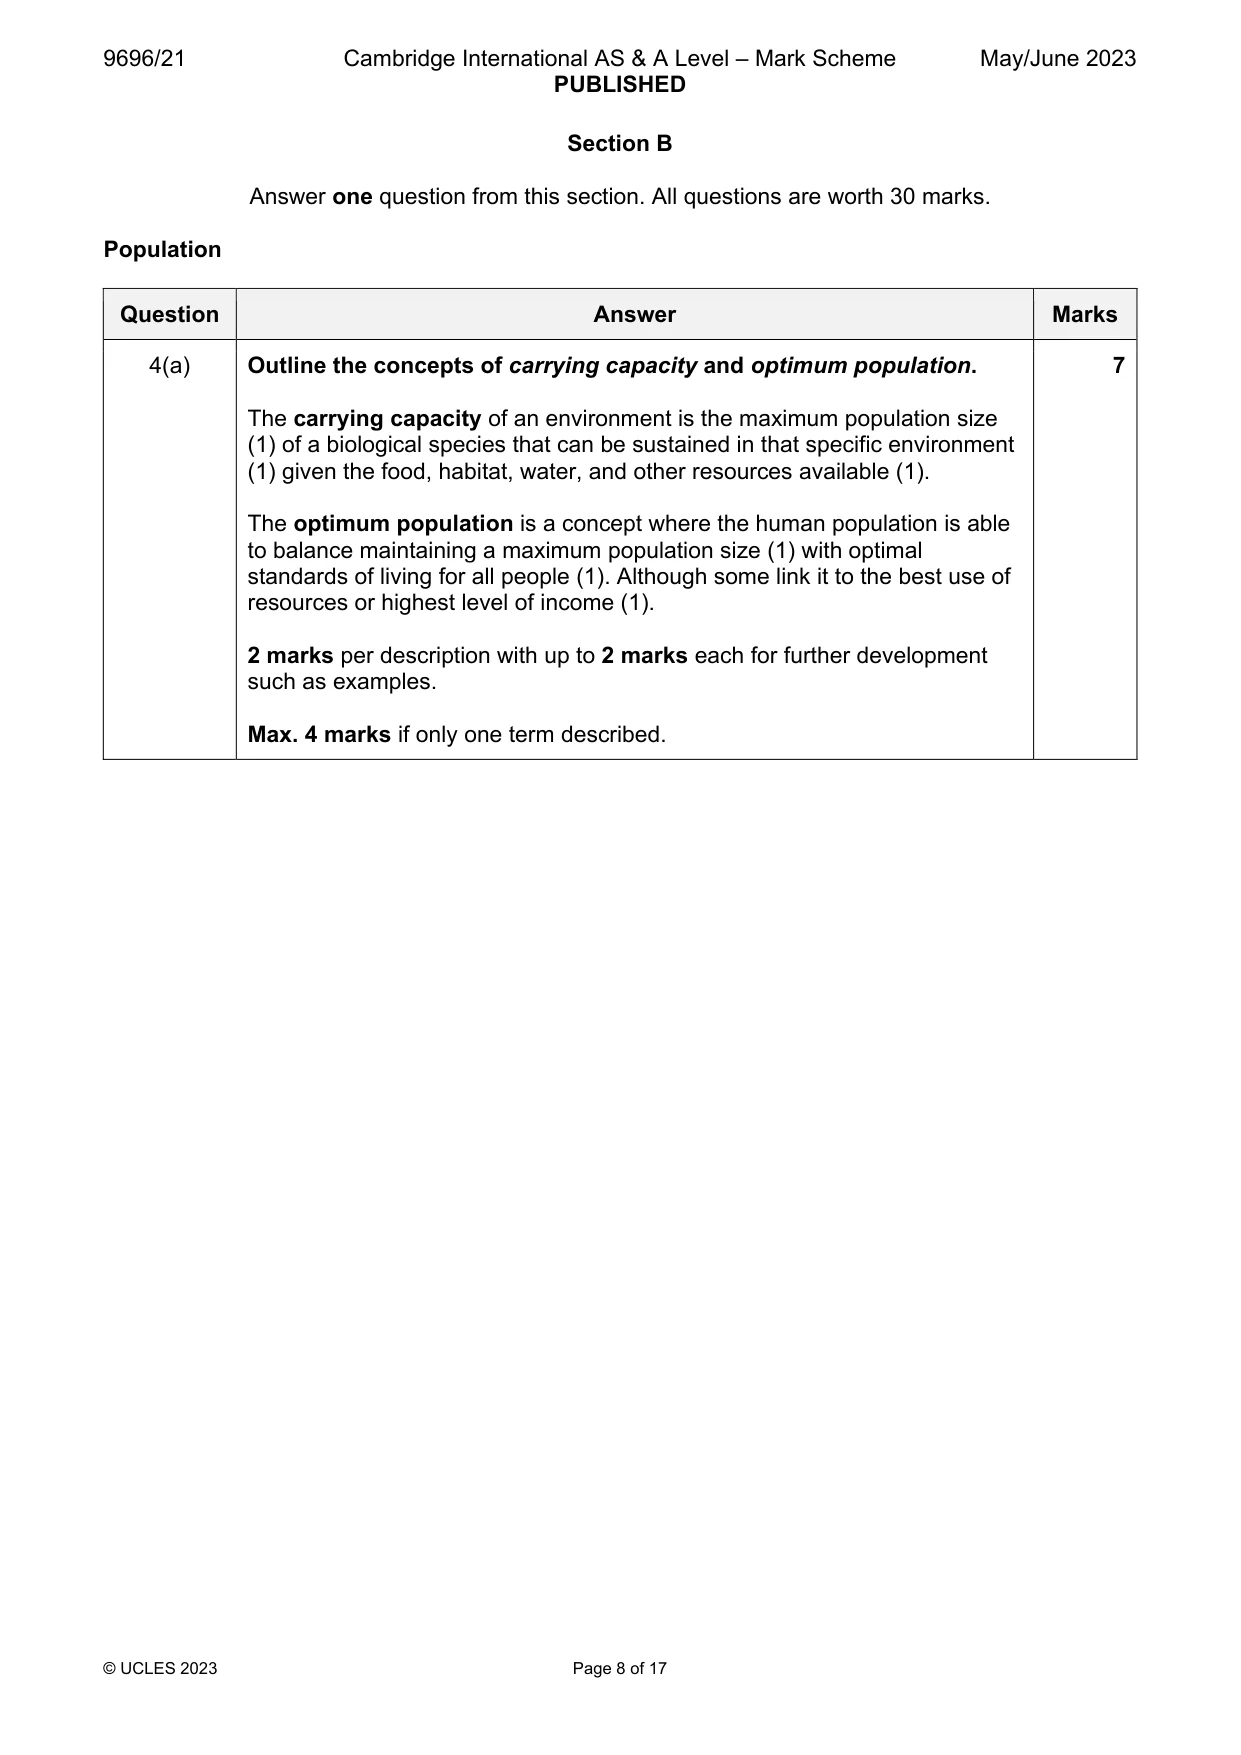
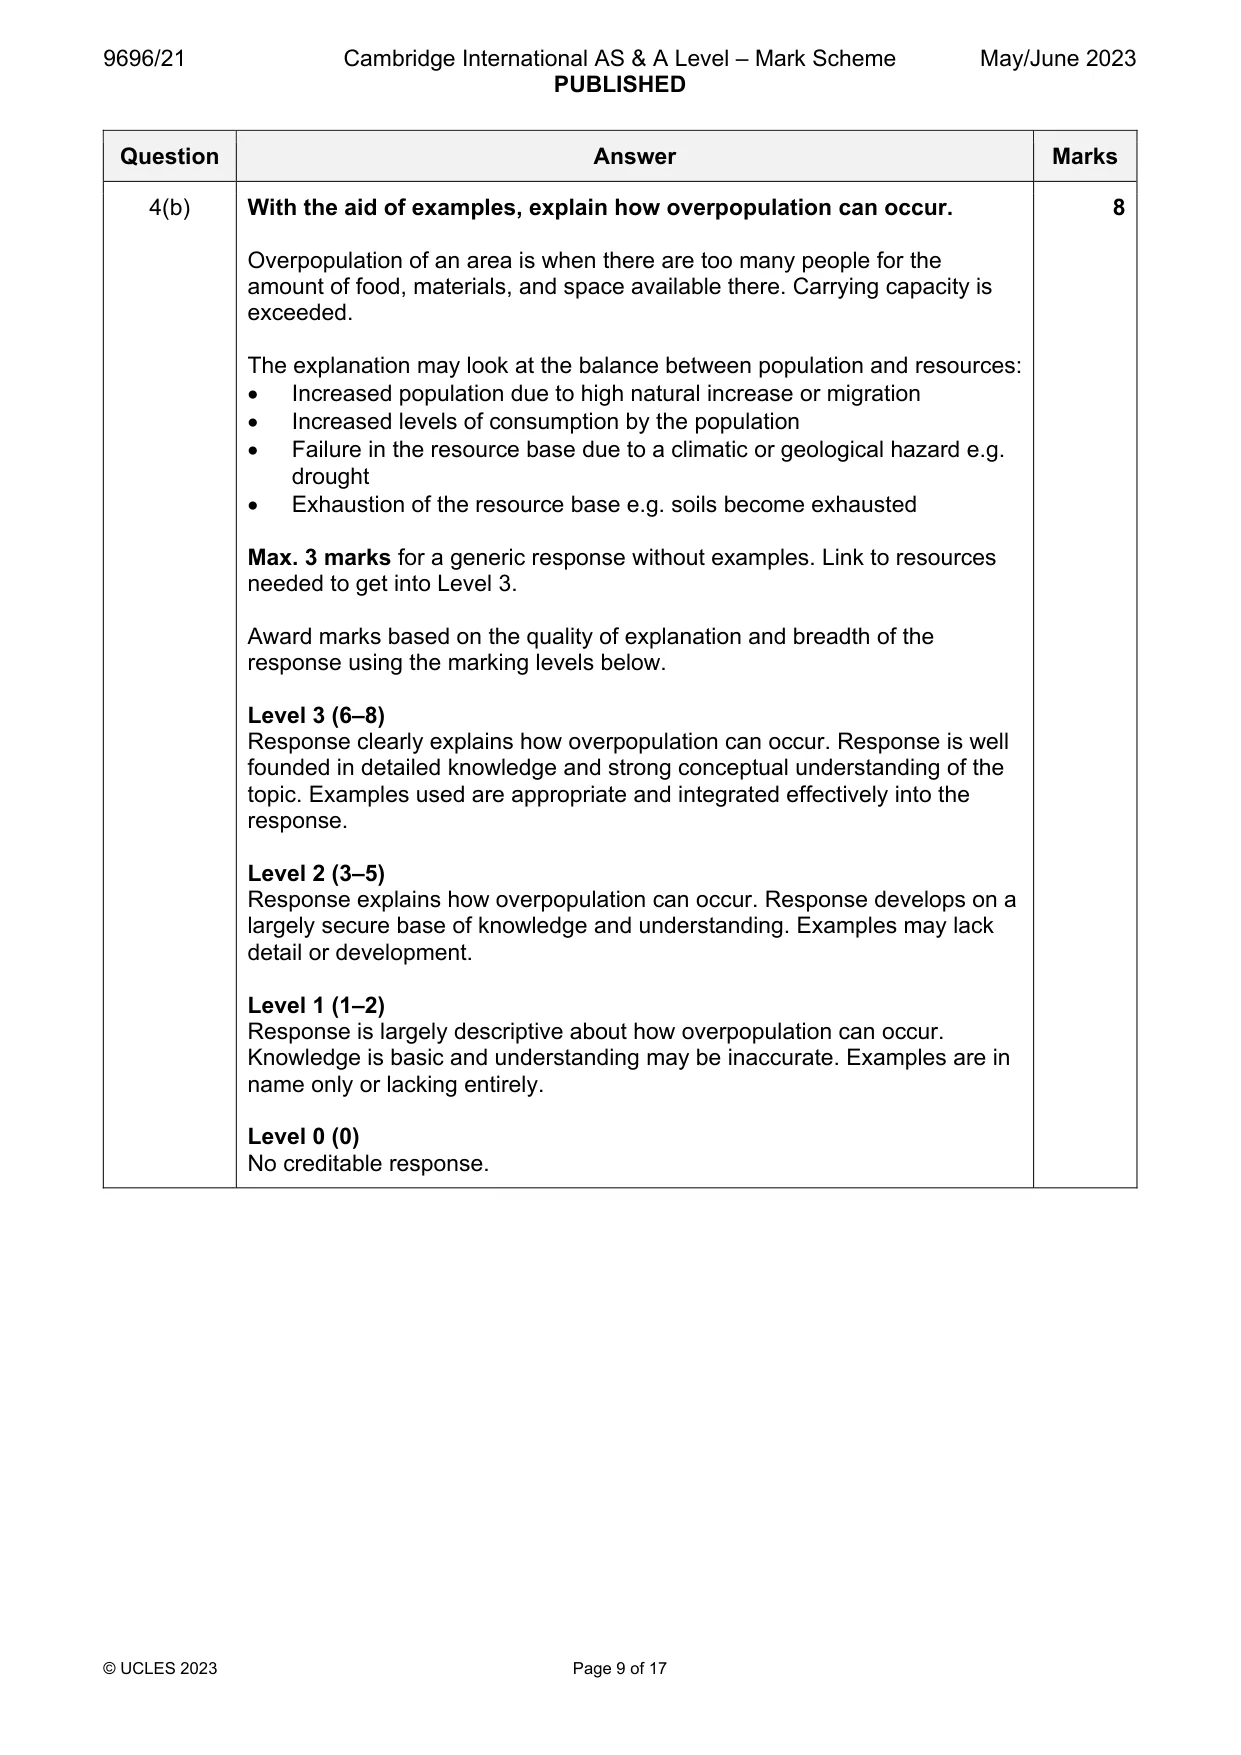
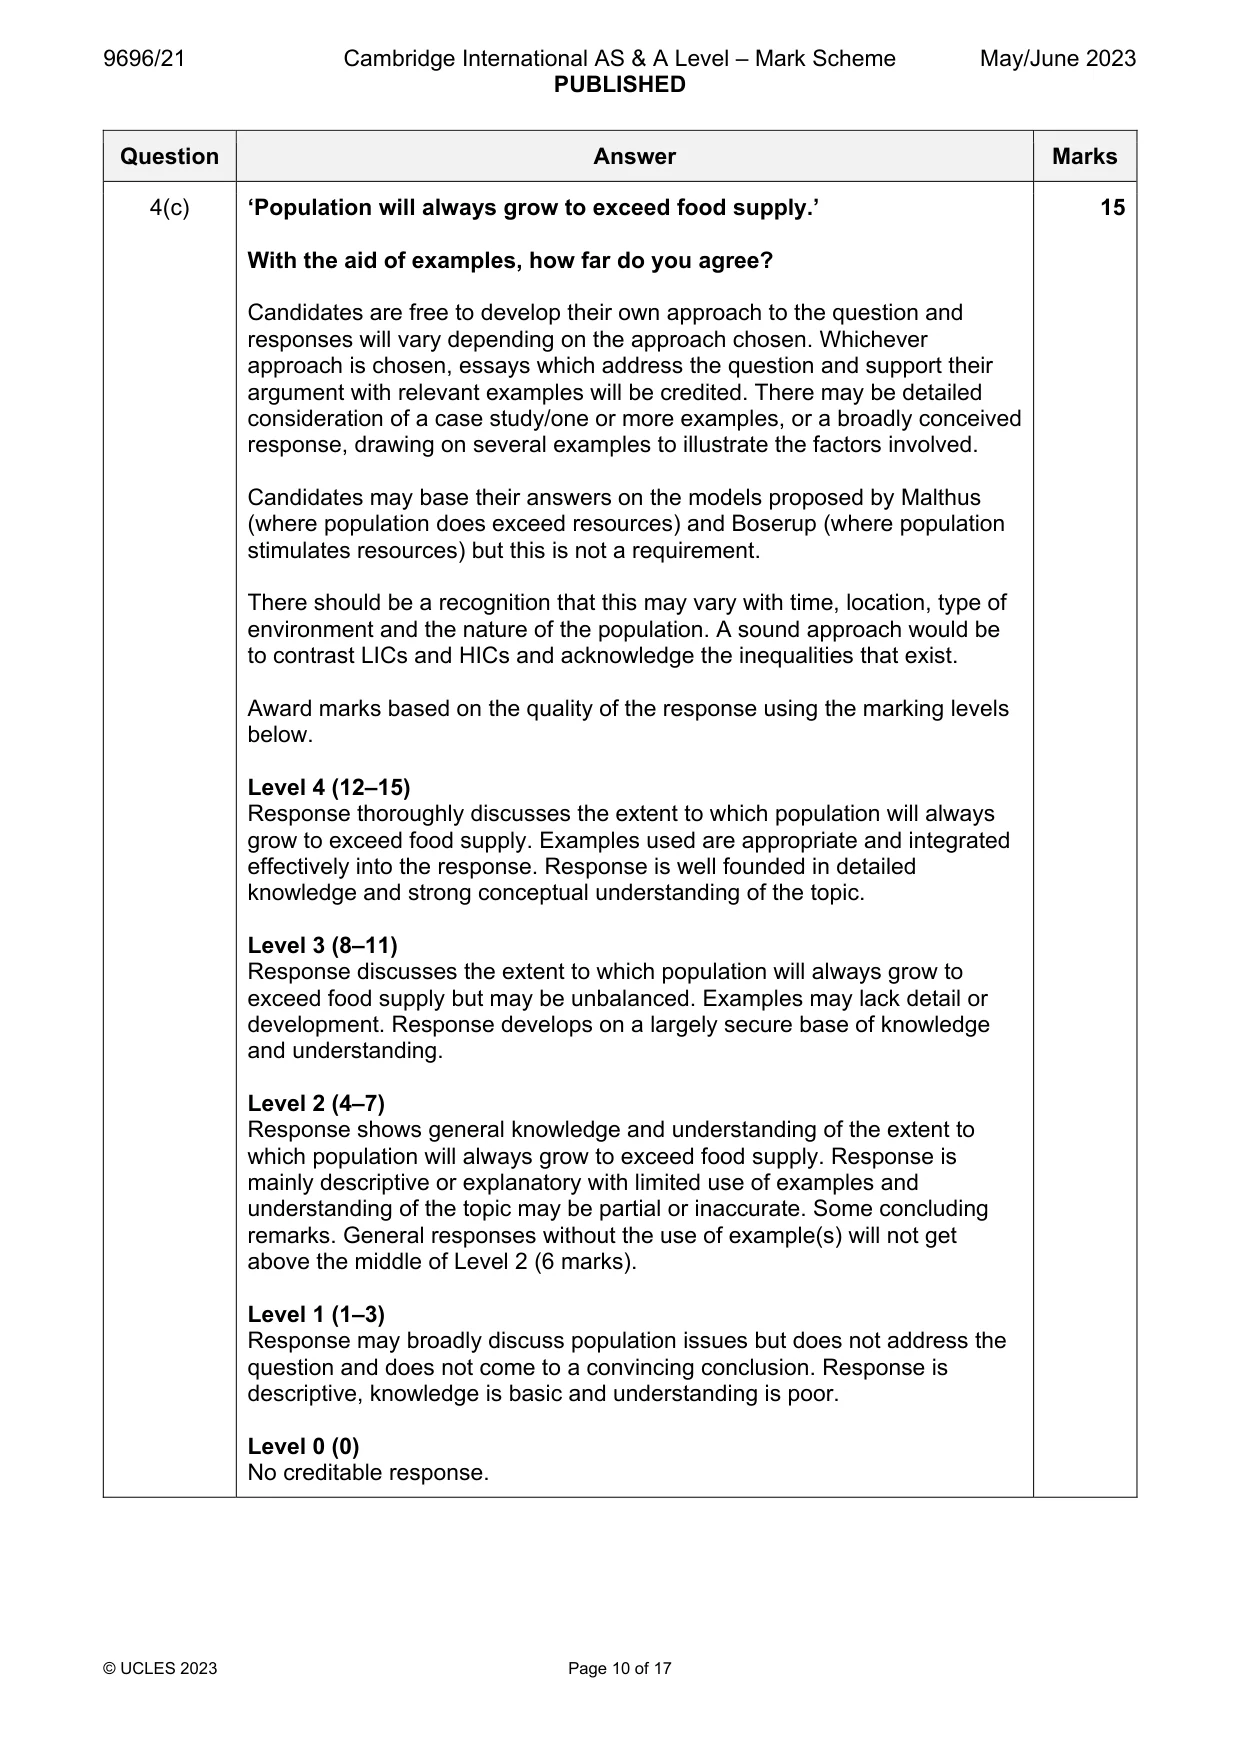
Mark scheme: 4(a) Outline the concepts of carrying capacity and optimum population. 7 The carrying capacity of an environment is the maximum population size (1) of a biological species that can be sustained in that specific environment (1) given the food, habitat, water, and other resources available (1). The optimum population is a concept where the human population is able to balance maintaining a maximum population size (1) with optimal standards of living for all people (1). Although some link it to the best use of resources or highest level of income (1). 2 marks per description with up to 2 marks each for further development such as examples. Max. 4 marks if only one term described. 4(b) With the aid of examples, explain how overpopulation can occur. 8 Overpopulation of an area is when there are too many people for the amount of food, materials, and space available there. Carrying capacity is exceeded. The explanation may look at the balance between population and resources: Increased population due to high natural increase or migration Increased levels of consumption by the population Failure in the resource base due to a climatic or geological hazard e.g. drought Exhaustion of the resource base e.g. soils become exhausted Max. 3 marks for a generic response without examples. Link to resources needed to get into Level 3. Award marks based on the quality of explanation and breadth of the response using the marking levels below. Level 3 (6–8) Response clearly explains how overpopulation can occur. Response is well founded in detailed knowledge and strong conceptual understanding of the topic. Examples used are appropriate and integrated effectively into the response. Level 2 (3–5) Response explains how overpopulation can occur. Response develops on a largely secure base of knowledge and understanding. Examples may lack detail or development. Level 1 (1–2) Response is largely descriptive about how overpopulation can occur. Knowledge is basic and understanding may be inaccurate. Examples are in name only or lacking entirely. Level 0 (0) No creditable response. 4(c) ‘Population will always grow to exceed food supply.’ 15 With the aid of examples, how far do you agree? Candidates are free to develop their own approach to the question and responses will vary depending on the approach chosen. Whichever approach is chosen, essays which address the question and support their argument with relevant examples will be credited. There may be detailed consideration of a case study/one or more examples, or a broadly conceived response, drawing on several examples to illustrate the factors involved. Candidates may base their answers on the models proposed by Malthus (where population does exceed resources) and Boserup (where population stimulates resources) but this is not a requirement. There should be a recognition that this may vary with time, location, type of environment and the nature of the population. A sound approach would be to contrast LICs and HICs and acknowledge the inequalities that exist. Award marks based on the quality of the response using the marking levels below. Level 4 (12–15) Response thoroughly discusses the extent to which population will always grow to exceed food supply. Examples used are appropriate and integrated effectively into the response. Response is well founded in detailed knowledge and strong conceptual understanding of the topic. Level 3 (8–11) Response discusses the extent to which population will always grow to exceed food supply but may be unbalanced. Examples may lack detail or development. Response develops on a largely secure base of knowledge and understanding. Level 2 (4–7) Response shows general knowledge and understanding of the extent to which population will always grow to exceed food supply. Response is mainly descriptive or explanatory with limited use of examples and understanding of the topic may be partial or inaccurate. Some concluding remarks. General responses without the use of example(s) will not get above the middle of Level 2 (6 marks). Level 1 (1–3) Response may broadly discuss population issues but does not address the question and does not come to a convincing conclusion. Response is descriptive, knowledge is basic and understanding is poor. Level 0 (0) No creditable response. Population/Migration
Q5 · Compare the characteristics of economic migration flows with the characteristics of…
5 (a) Compare the characteristics of economic migration flows with the characteristics of refugee flows. [7] (b) With the aid of examples, suggest why refugee flows may increase in the future. [8] (c) With the aid of examples, assess the extent to which refugee flows impact more on receiving/ destination areas in LICs/MICs than on receiving/destination areas in HICs. [15] Settlement dynamics
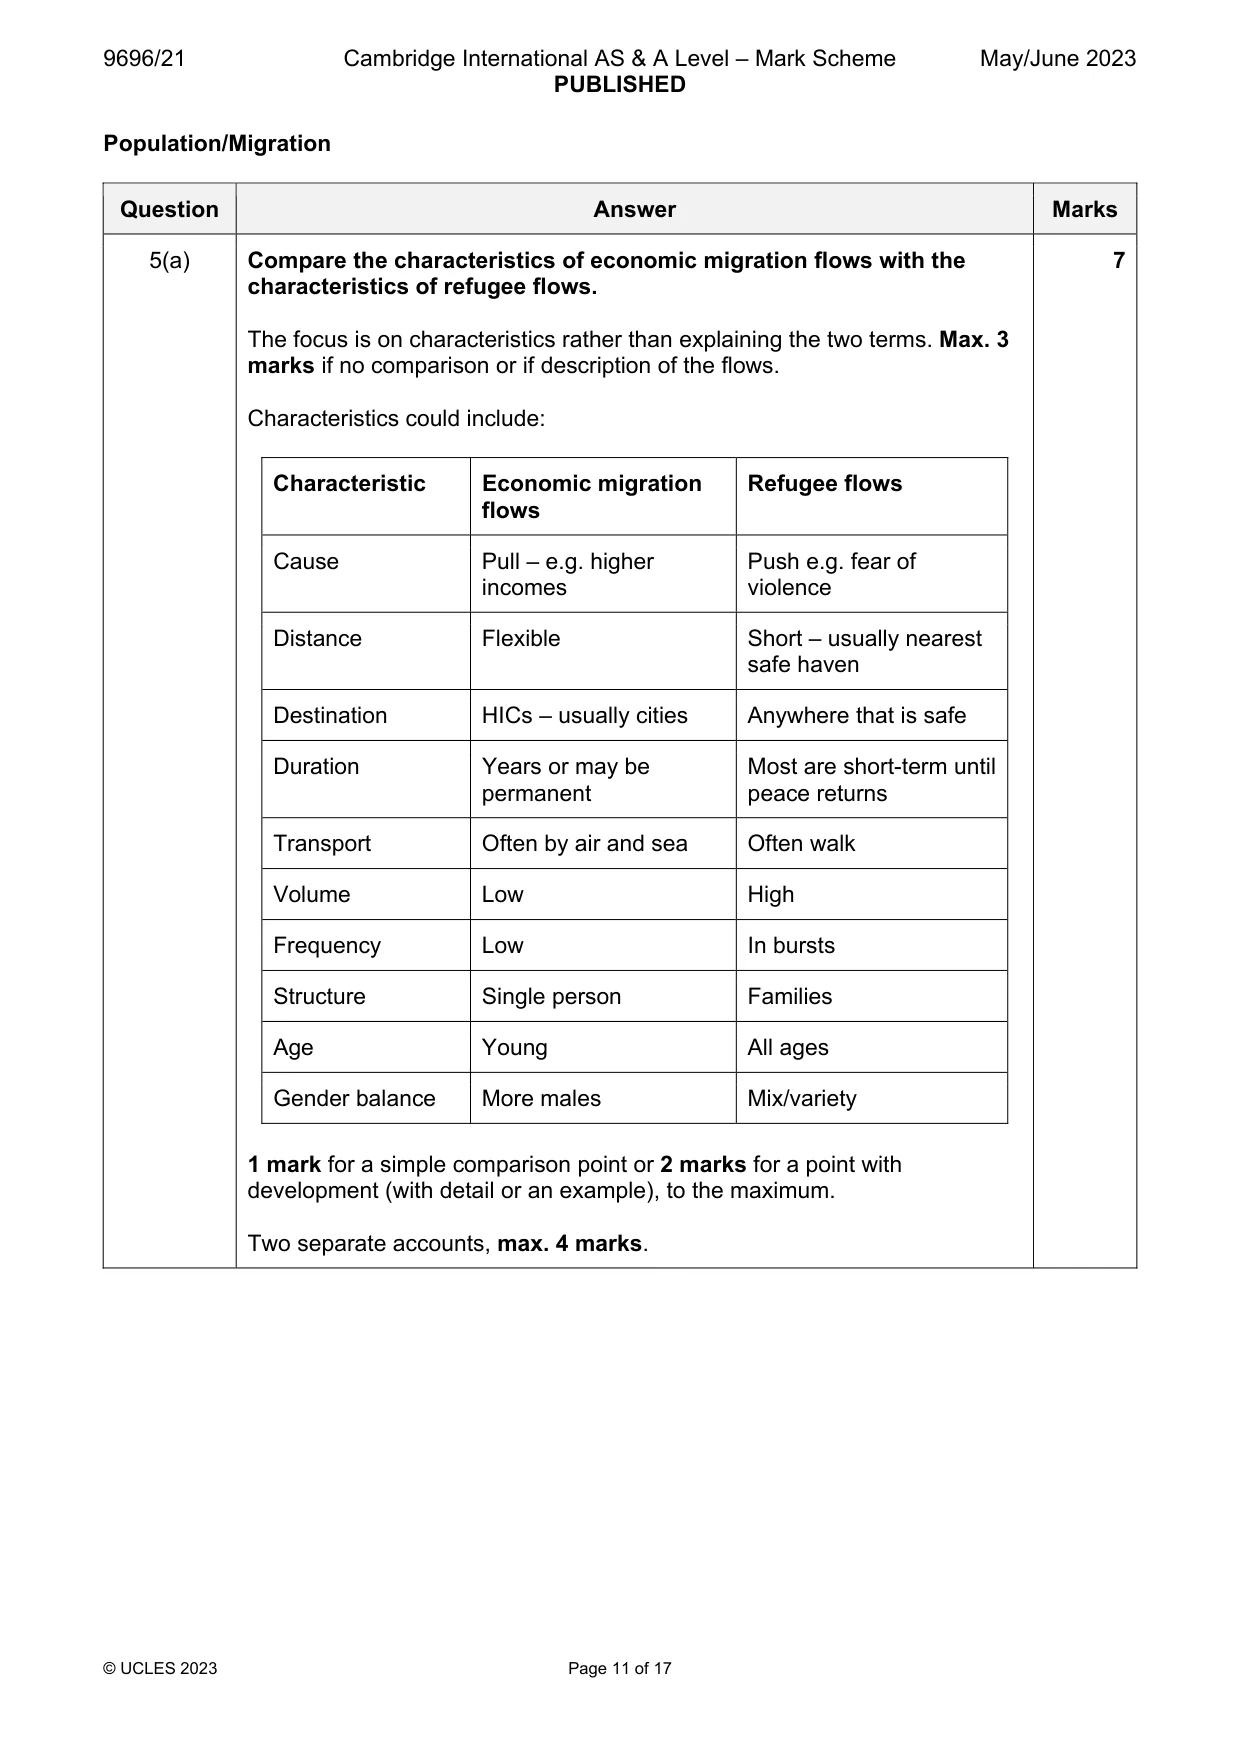
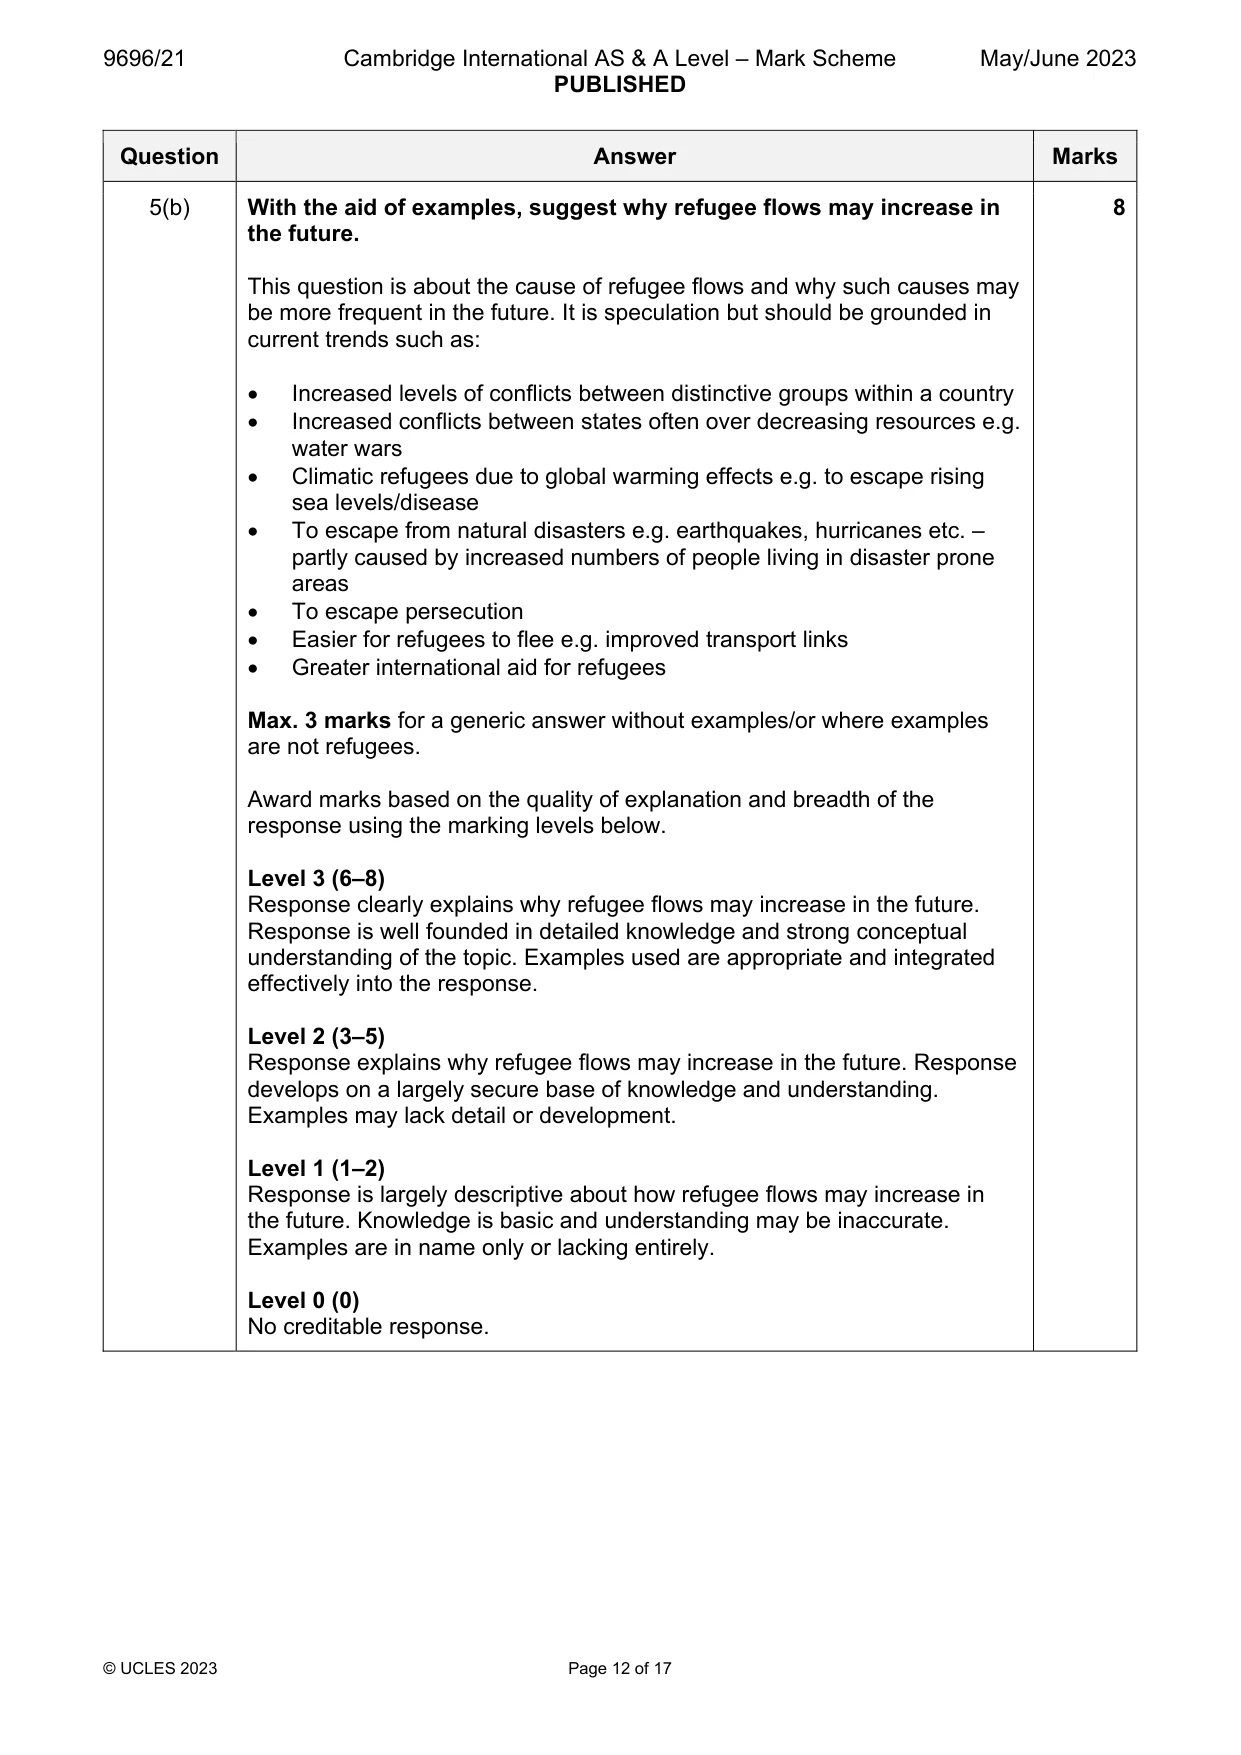
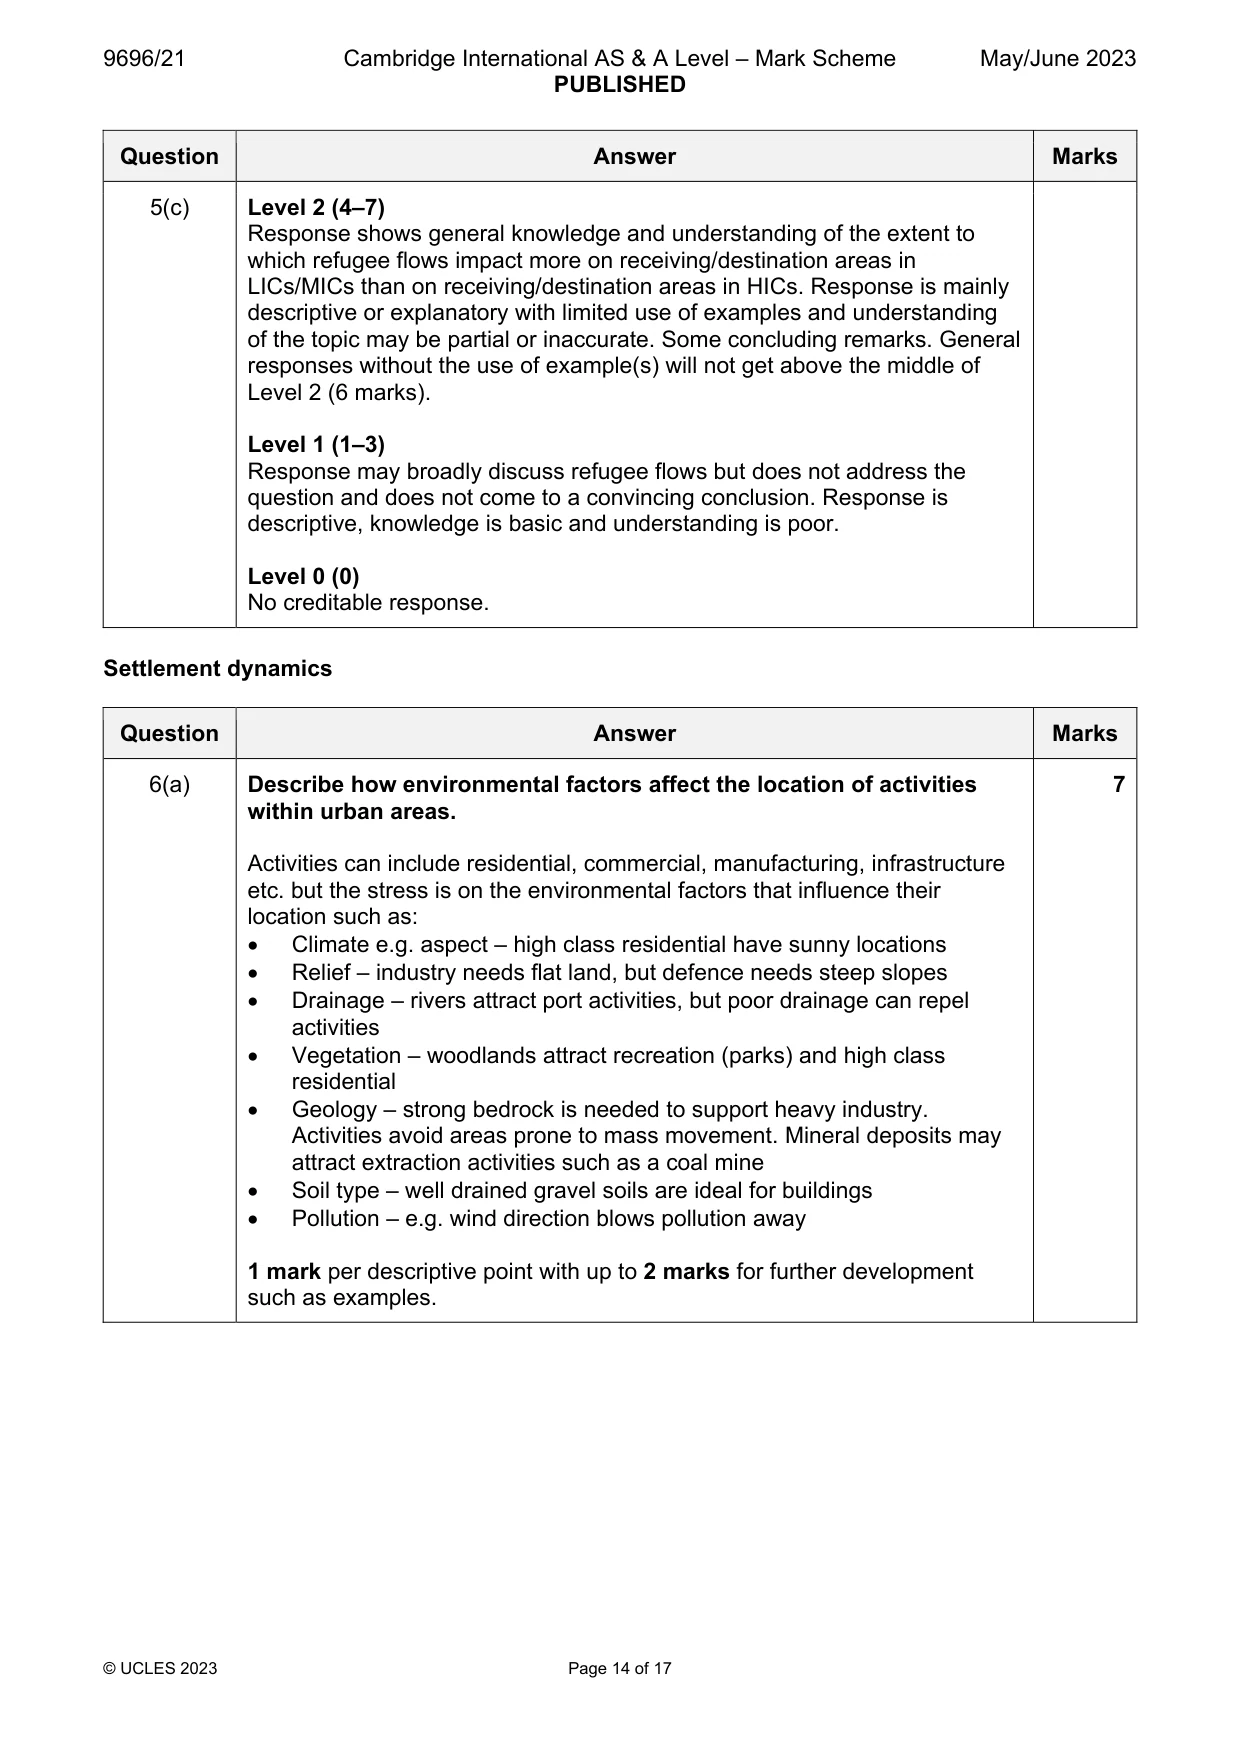
Mark scheme: 5(a) Compare the characteristics of economic migration flows with the 7 characteristics of refugee flows. The focus is on characteristics rather than explaining the two terms. Max. 3 marks if no comparison or if description of the flows. Characteristics could include: Characteristic Economic migration Refugee flows flows Cause Pull – e.g. higher Push e.g. fear of incomes violence Distance Flexible Short – usually nearest safe haven Destination HICs – usually cities Anywhere that is safe Duration Years or may be Most are short-term until permanent peace returns Transport Often by air and sea Often walk Volume Low High Frequency Low In bursts Structure Single person Families Age Young All ages Gender balance More males Mix/variety 1 mark for a simple comparison point or 2 marks for a point with development (with detail or an example), to the maximum. Two separate accounts, max. 4 marks. 5(b) With the aid of examples, suggest why refugee flows may increase in 8 the future. This question is about the cause of refugee flows and why such causes may be more frequent in the future. It is speculation but should be grounded in current trends such as: Increased levels of conflicts between distinctive groups within a country Increased conflicts between states often over decreasing resources e.g. water wars Climatic refugees due to global warming effects e.g. to escape rising sea levels/disease To escape from natural disasters e.g. earthquakes, hurricanes etc. – partly caused by increased numbers of people living in disaster prone areas To escape persecution Easier for refugees to flee e.g. improved transport links Greater international aid for refugees Max. 3 marks for a generic answer without examples/or where examples are not refugees. Award marks based on the quality of explanation and breadth of the response using the marking levels below. Level 3 (6–8) Response clearly explains why refugee flows may increase in the future. Response is well founded in detailed knowledge and strong conceptual understanding of the topic. Examples used are appropriate and integrated effectively into the response. Level 2 (3–5) Response explains why refugee flows may increase in the future. Response develops on a largely secure base of knowledge and understanding. Examples may lack detail or development. Level 1 (1–2) Response is largely descriptive about how refugee flows may increase in the future. Knowledge is basic and understanding may be inaccurate. Examples are in name only or lacking entirely. Level 0 (0) No creditable response. 5(c) With the aid of examples, assess the extent to which refugee flows 15 impact more on receiving/destination areas in LICs/MICs than on receiving/destination areas in HICs. Candidates are free to develop their own approach to the question and responses will vary depending on the approach chosen. Whichever approach is chosen, essays which address the question and support their argument with relevant examples will be credited. There may be detailed consideration of a case study/one or more examples, or a broadly conceived response, drawing on several examples to illustrate the factors involved. The impacts of refugees depend on several factors such as: Volume of refugees Characteristics of refugees Culture of refugees compared to that of receiving/destination area Wealth of receiving/destination area Resources of the receiving/destination area History of previous refugee flows to receiving/destination area Environment of the reception area Political stance of receiving government The level of impact may be considered to vary spatially, between groups of people and over time. Impacts may be demographic, economic, social, political and environmental. Award marks based on the quality of the response using the marking levels below. Level 4 (12–15) Response thoroughly discusses the extent to which refugee flows impact more on receiving/destination areas in LICs/MICs than on receiving/destination areas in HICs. Examples used are appropriate and integrated effectively into the response. Response is well founded in detailed knowledge and strong conceptual understanding of the topic. Level 3 (8–11) Response discusses the extent to which refugee flows impact more on receiving/destination areas in LICs/MICs than on receiving/destination areas in HICs but may be unbalanced. Examples may lack detail or development. Response develops on a largely secure base of knowledge and understanding. 5(c) Level 2 (4–7) Response shows general knowledge and understanding of the extent to which refugee flows impact more on receiving/destination areas in LICs/MICs than on receiving/destination areas in HICs. Response is mainly descriptive or explanatory with limited use of examples and understanding of the topic may be partial or inaccurate. Some concluding remarks. General responses without the use of example(s) will not get above the middle of Level 2 (6 marks). Level 1 (1–3) Response may broadly discuss refugee flows but does not address the question and does not come to a convincing conclusion. Response is descriptive, knowledge is basic and understanding is poor. Level 0 (0) No creditable response. Settlement dynamics
Q6 · Describe how environmental factors affect the location of activities within urban areas
6 (a) Describe how environmental factors affect the location of activities within urban areas. [7] (b) With the aid of examples, explain how and why the location of retailing in cities has changed over time. [8] (c) With the aid of examples, how far do you agree that Central Business Districts (CBDs) are in decline? [15]
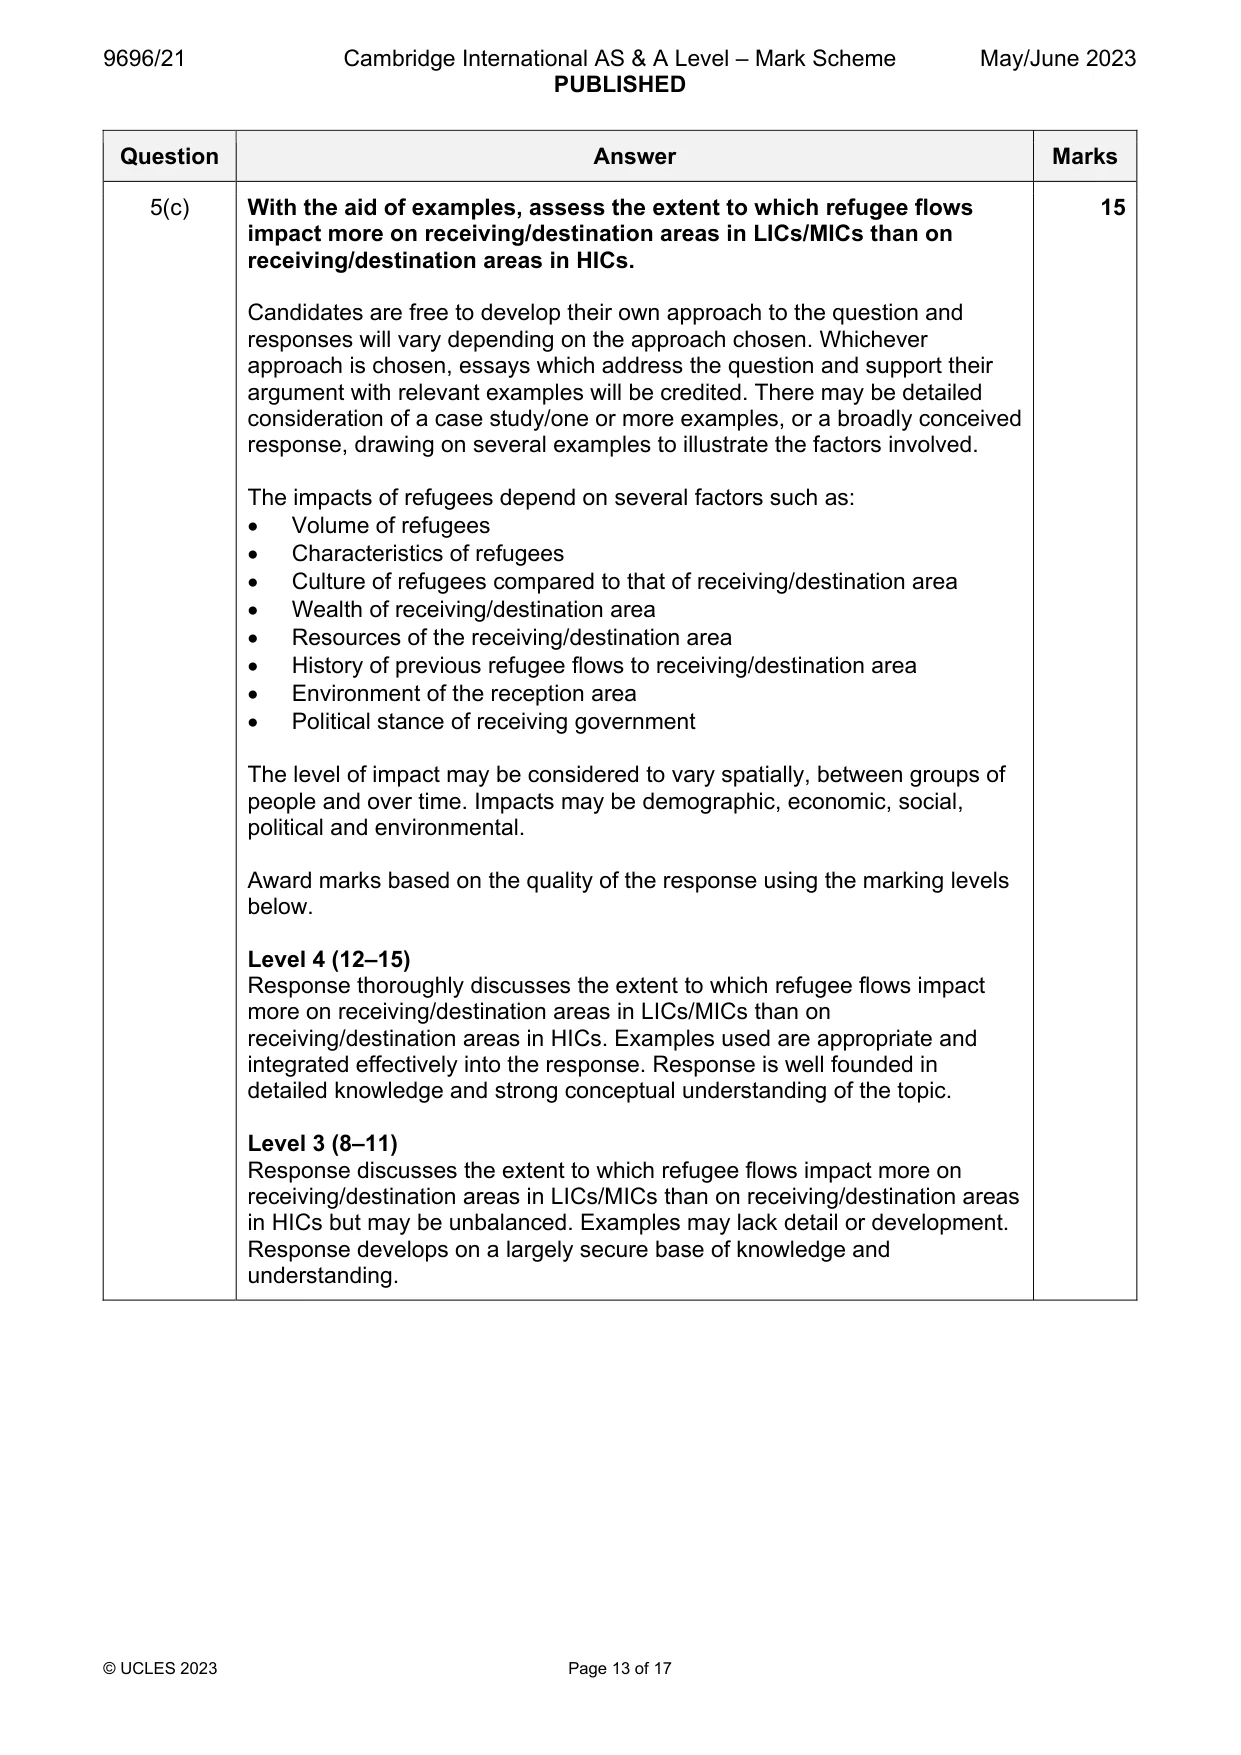
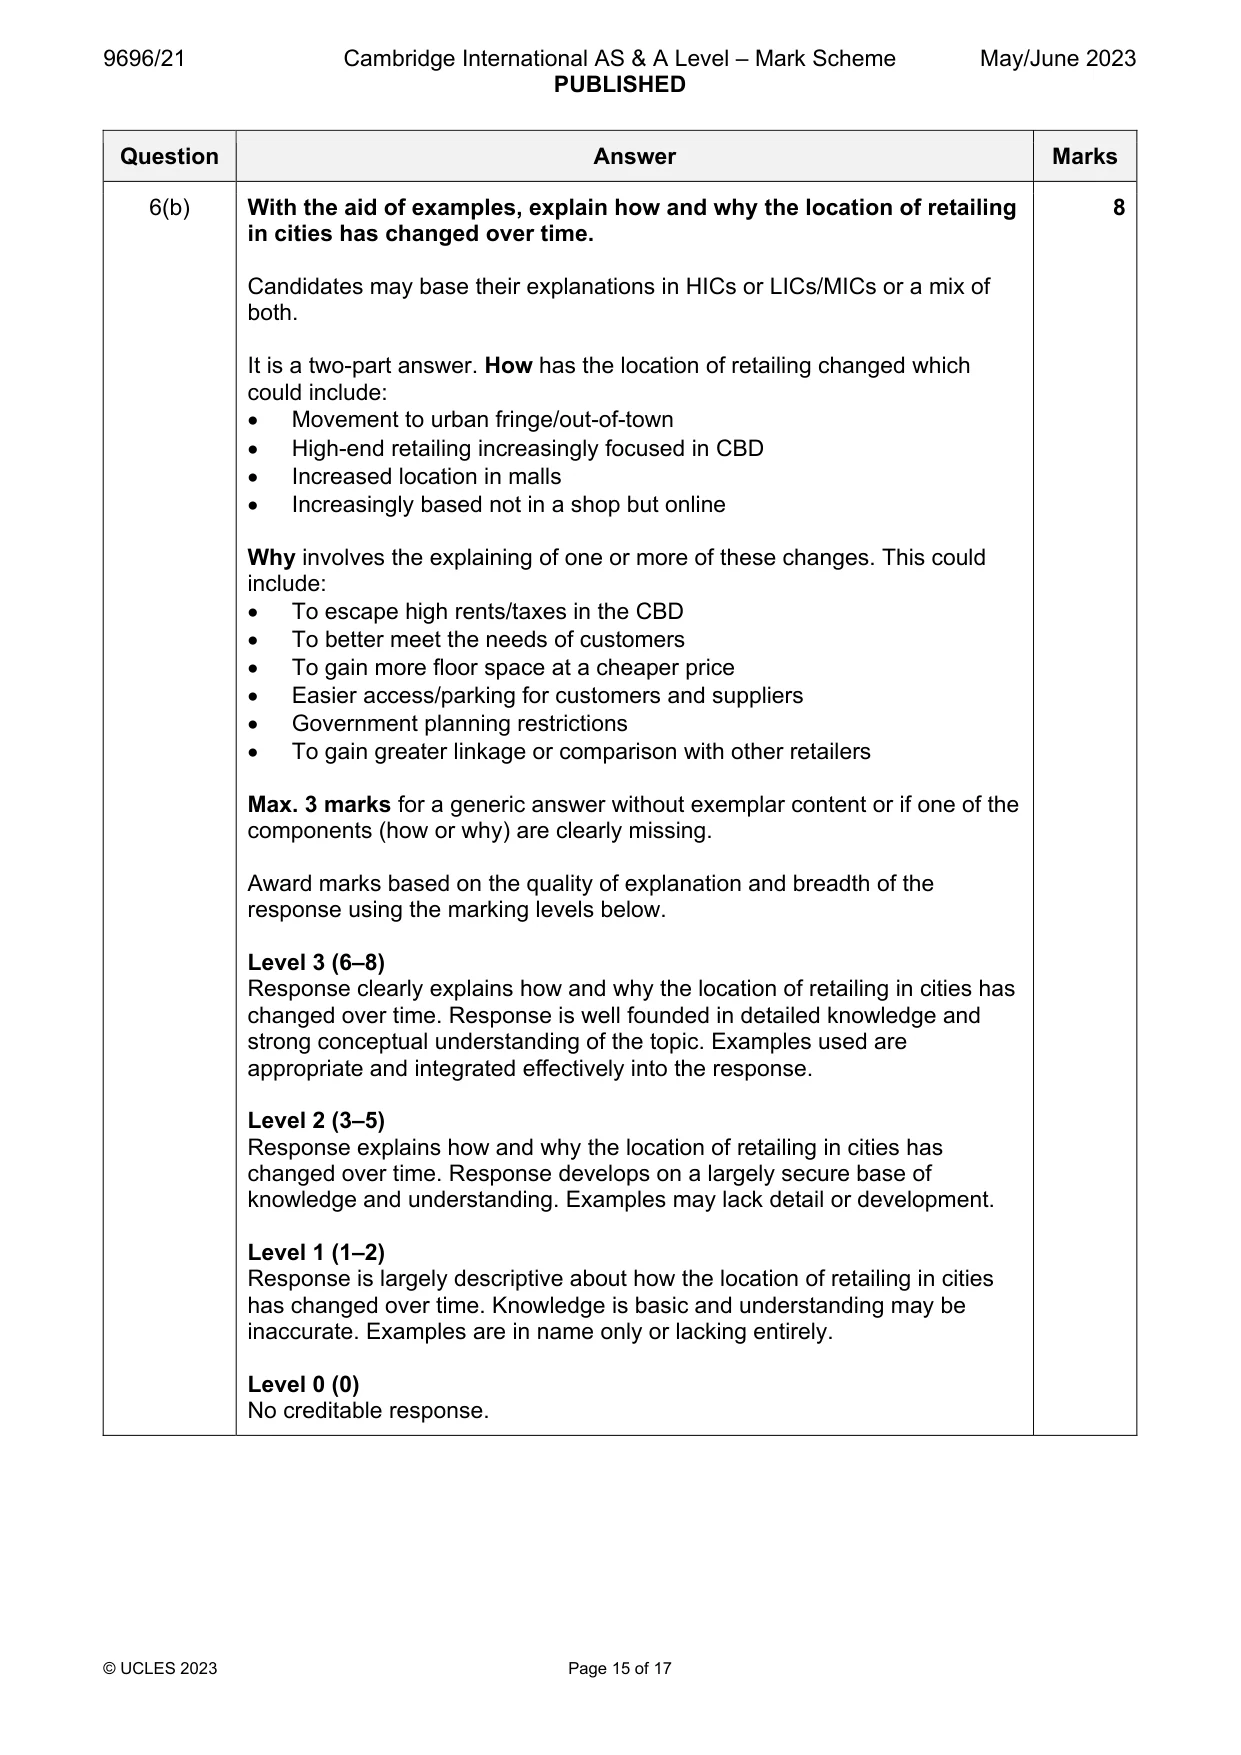
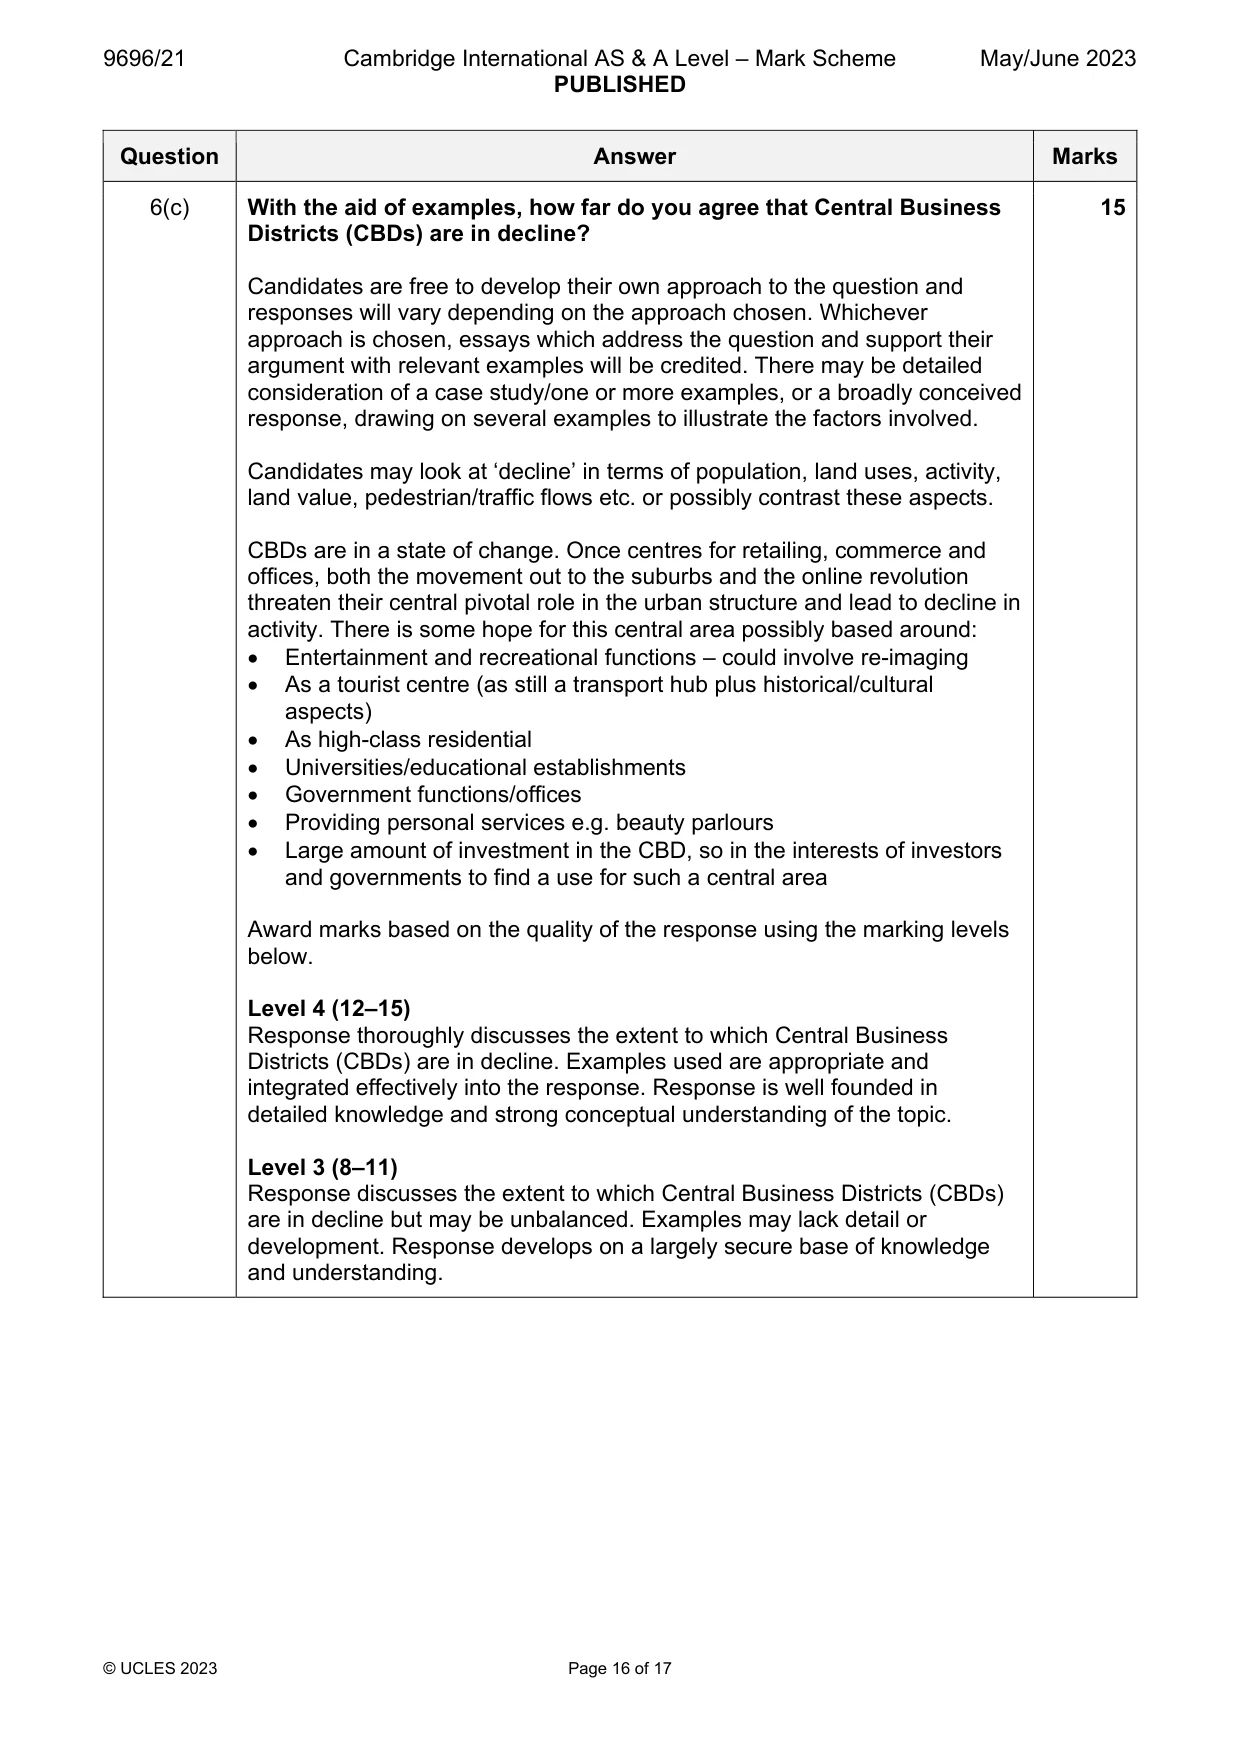
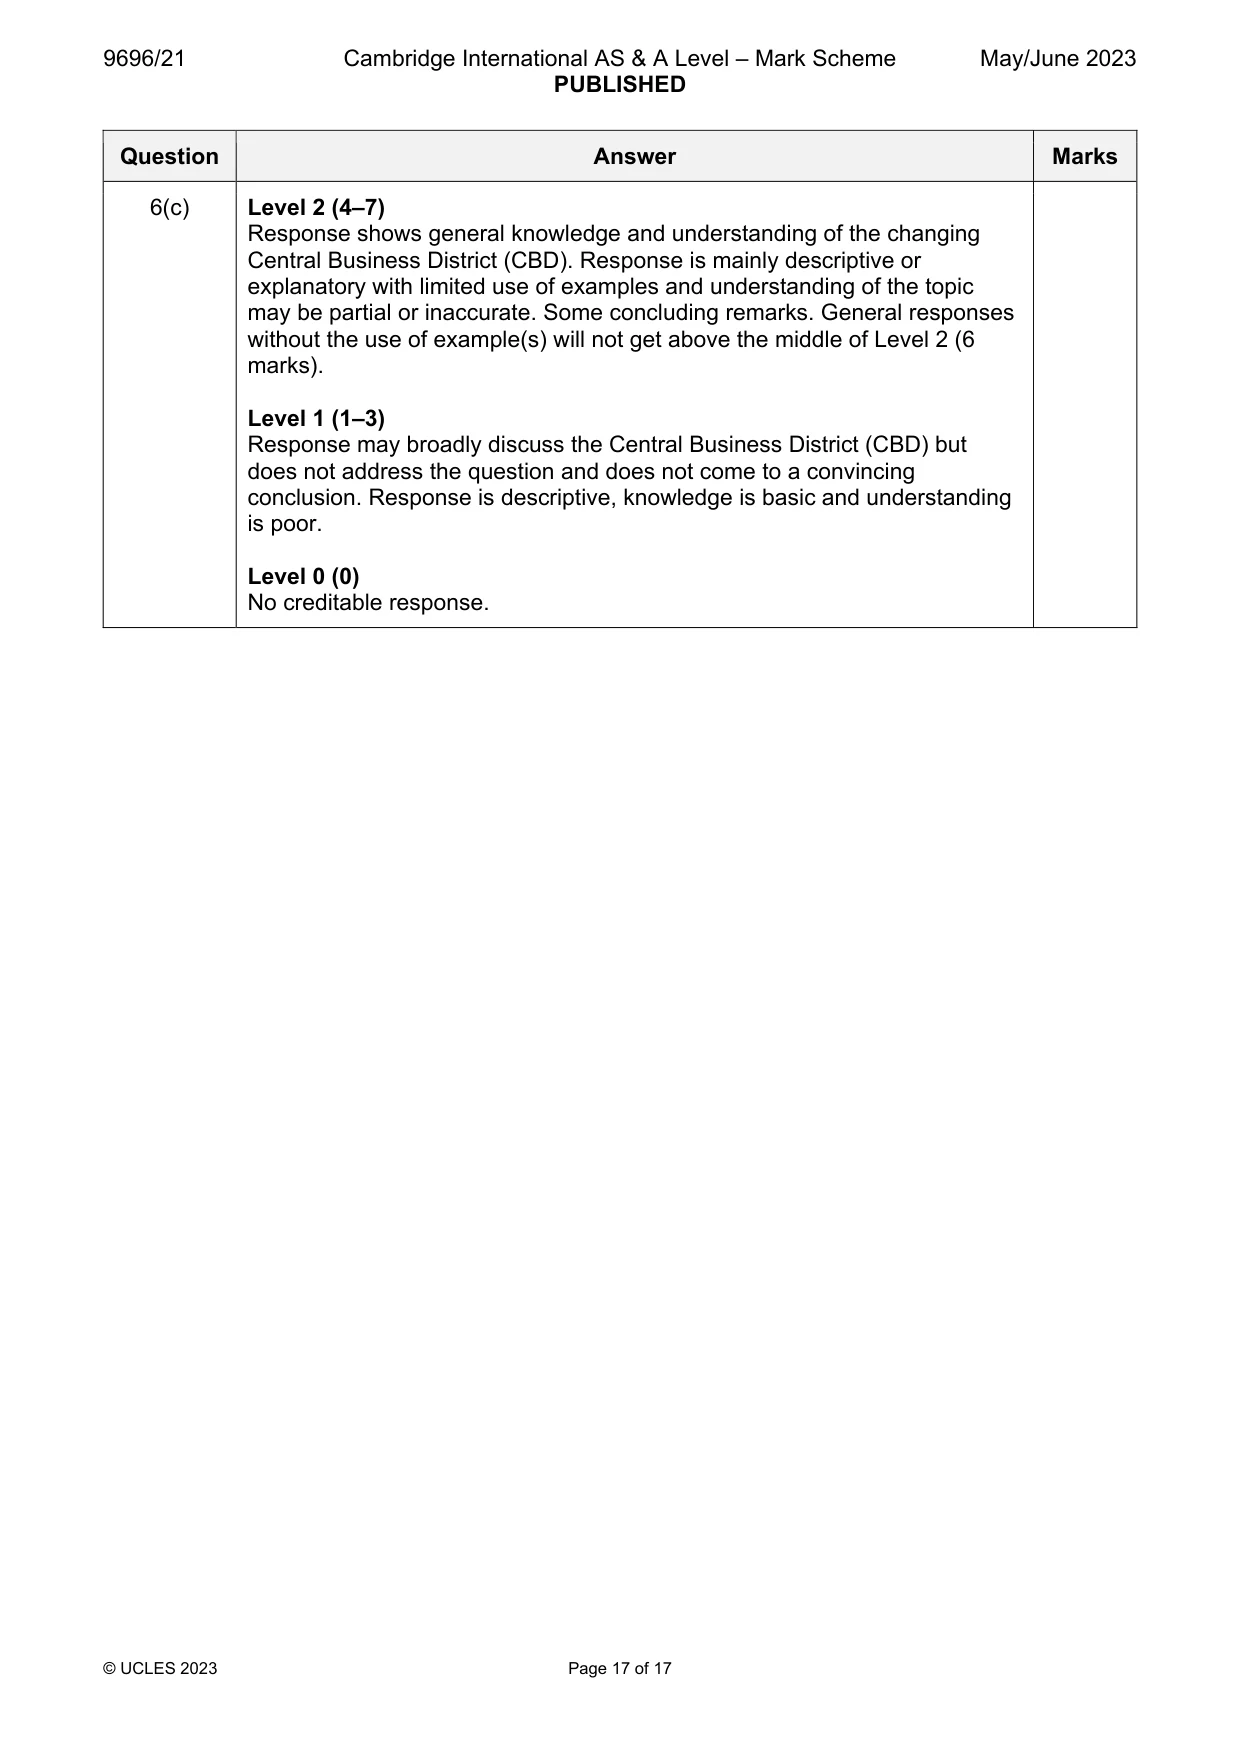
Mark scheme: 6(a) Describe how environmental factors affect the location of activities 7 within urban areas. Activities can include residential, commercial, manufacturing, infrastructure etc. but the stress is on the environmental factors that influence their location such as: Climate e.g. aspect – high class residential have sunny locations Relief – industry needs flat land, but defence needs steep slopes Drainage – rivers attract port activities, but poor drainage can repel activities Vegetation – woodlands attract recreation (parks) and high class residential Geology – strong bedrock is needed to support heavy industry. Activities avoid areas prone to mass movement. Mineral deposits may attract extraction activities such as a coal mine Soil type – well drained gravel soils are ideal for buildings Pollution – e.g. wind direction blows pollution away 1 mark per descriptive point with up to 2 marks for further development such as examples. 6(b) With the aid of examples, explain how and why the location of retailing 8 in cities has changed over time. Candidates may base their explanations in HICs or LICs/MICs or a mix of both. It is a two-part answer. How has the location of retailing changed which could include: Movement to urban fringe/out-of-town High-end retailing increasingly focused in CBD Increased location in malls Increasingly based not in a shop but online Why involves the explaining of one or more of these changes. This could include: To escape high rents/taxes in the CBD To better meet the needs of customers To gain more floor space at a cheaper price Easier access/parking for customers and suppliers Government planning restrictions To gain greater linkage or comparison with other retailers Max. 3 marks for a generic answer without exemplar content or if one of the components (how or why) are clearly missing. Award marks based on the quality of explanation and breadth of the response using the marking levels below. Level 3 (6–8) Response clearly explains how and why the location of retailing in cities has changed over time. Response is well founded in detailed knowledge and strong conceptual understanding of the topic. Examples used are appropriate and integrated effectively into the response. Level 2 (3–5) Response explains how and why the location of retailing in cities has changed over time. Response develops on a largely secure base of knowledge and understanding. Examples may lack detail or development. Level 1 (1–2) Response is largely descriptive about how the location of retailing in cities has changed over time. Knowledge is basic and understanding may be inaccurate. Examples are in name only or lacking entirely. Level 0 (0) No creditable response. 6(c) With the aid of examples, how far do you agree that Central Business 15 Districts (CBDs) are in decline? Candidates are free to develop their own approach to the question and responses will vary depending on the approach chosen. Whichever approach is chosen, essays which address the question and support their argument with relevant examples will be credited. There may be detailed consideration of a case study/one or more examples, or a broadly conceived response, drawing on several examples to illustrate the factors involved. Candidates may look at ‘decline’ in terms of population, land uses, activity, land value, pedestrian/traffic flows etc. or possibly contrast these aspects. CBDs are in a state of change. Once centres for retailing, commerce and offices, both the movement out to the suburbs and the online revolution threaten their central pivotal role in the urban structure and lead to decline in activity. There is some hope for this central area possibly based around: Entertainment and recreational functions – could involve re-imaging As a tourist centre (as still a transport hub plus historical/cultural aspects) As high-class residential Universities/educational establishments Government functions/offices Providing personal services e.g. beauty parlours Large amount of investment in the CBD, so in the interests of investors and governments to find a use for such a central area Award marks based on the quality of the response using the marking levels below. Level 4 (12–15) Response thoroughly discusses the extent to which Central Business Districts (CBDs) are in decline. Examples used are appropriate and integrated effectively into the response. Response is well founded in detailed knowledge and strong conceptual understanding of the topic. Level 3 (8–11) Response discusses the extent to which Central Business Districts (CBDs) are in decline but may be unbalanced. Examples may lack detail or development. Response develops on a largely secure base of knowledge and understanding. 6(c) Level 2 (4–7) Response shows general knowledge and understanding of the changing Central Business District (CBD). Response is mainly descriptive or explanatory with limited use of examples and understanding of the topic may be partial or inaccurate. Some concluding remarks. General responses without the use of example(s) will not get above the middle of Level 2 (6 marks). Level 1 (1–3) Response may broadly discuss the Central Business District (CBD) but does not address the question and does not come to a convincing conclusion. Response is descriptive, knowledge is basic and understanding is poor. Level 0 (0) No creditable response.
What was in this paper
The subtopics covered by these 6 questions, and how many questions each got. Open one in a new tab to see every Cambridge question on it.
What you needed in this session
Cambridge’s own grade thresholds for 2023 May/June, Paper 2 · Variant 1. A higher threshold means an easier paper — the bar moves with how the cohort did.