Cambridge A Level Geography 9696 — 2022 Oct/Nov Paper 2 · Variant 3
9696/23/O/N/22 · 6 questions · 60 marks · ≈68 min
The question paper and its mark scheme, free to read here and free to download. This is Cambridge’s own paper, exactly as it was sat.
Question paper4 pages

Mark scheme19 pages
Answers below. Sit the paper first if you are practising.



Questions as text
Q1 · Levels of threat to crops from locust swarms in parts of Africa and Asia in December 2019
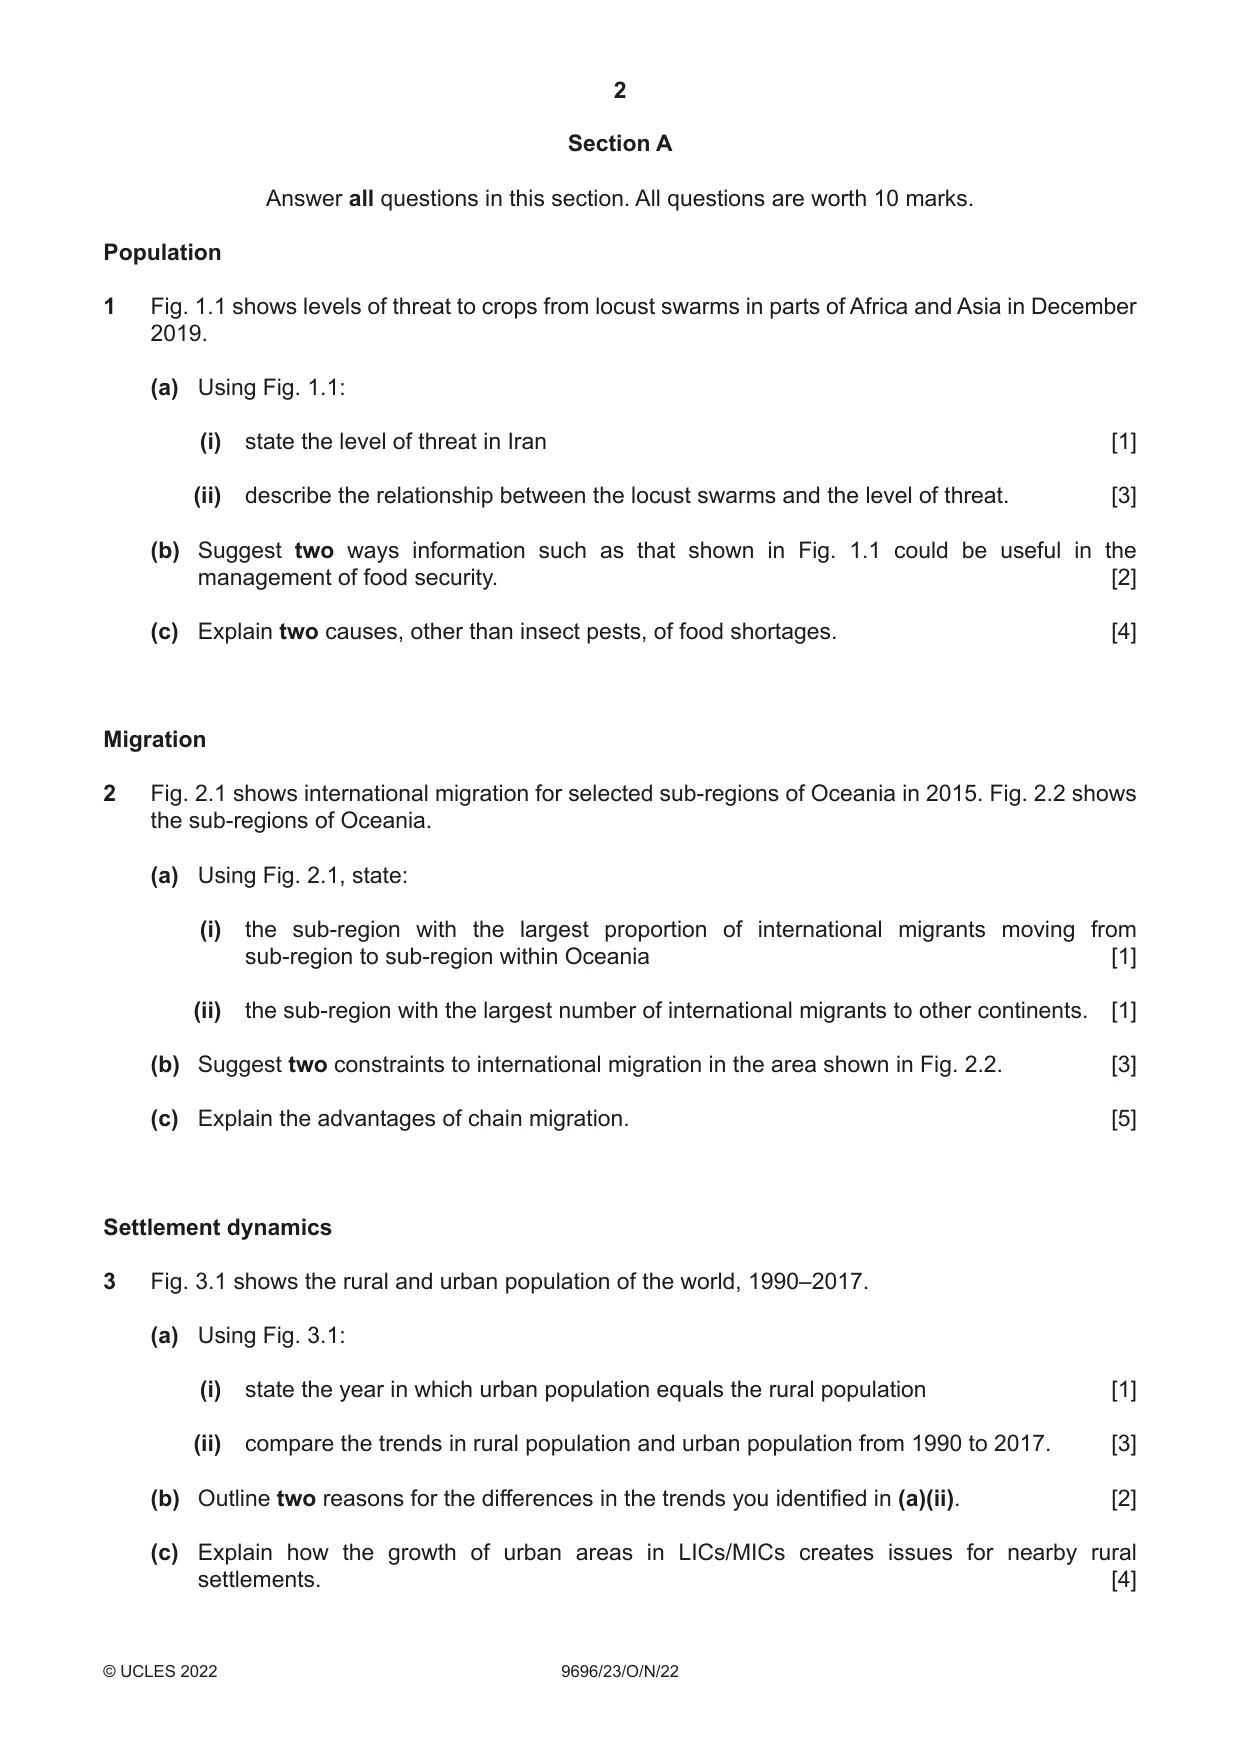
1 Fig. 1.1 shows levels of threat to crops from locust swarms in parts of Africa and Asia in December 2019. (a) Using Fig. 1.1: (i) state the level of threat in Iran [1] (ii) describe the relationship between the locust swarms and the level of threat. [3] (b) Suggest two ways information such as that shown in Fig. 1.1 could be useful in the management of food security. [2] (c) Explain two causes, other than insect pests, of food shortages. [4] Migration
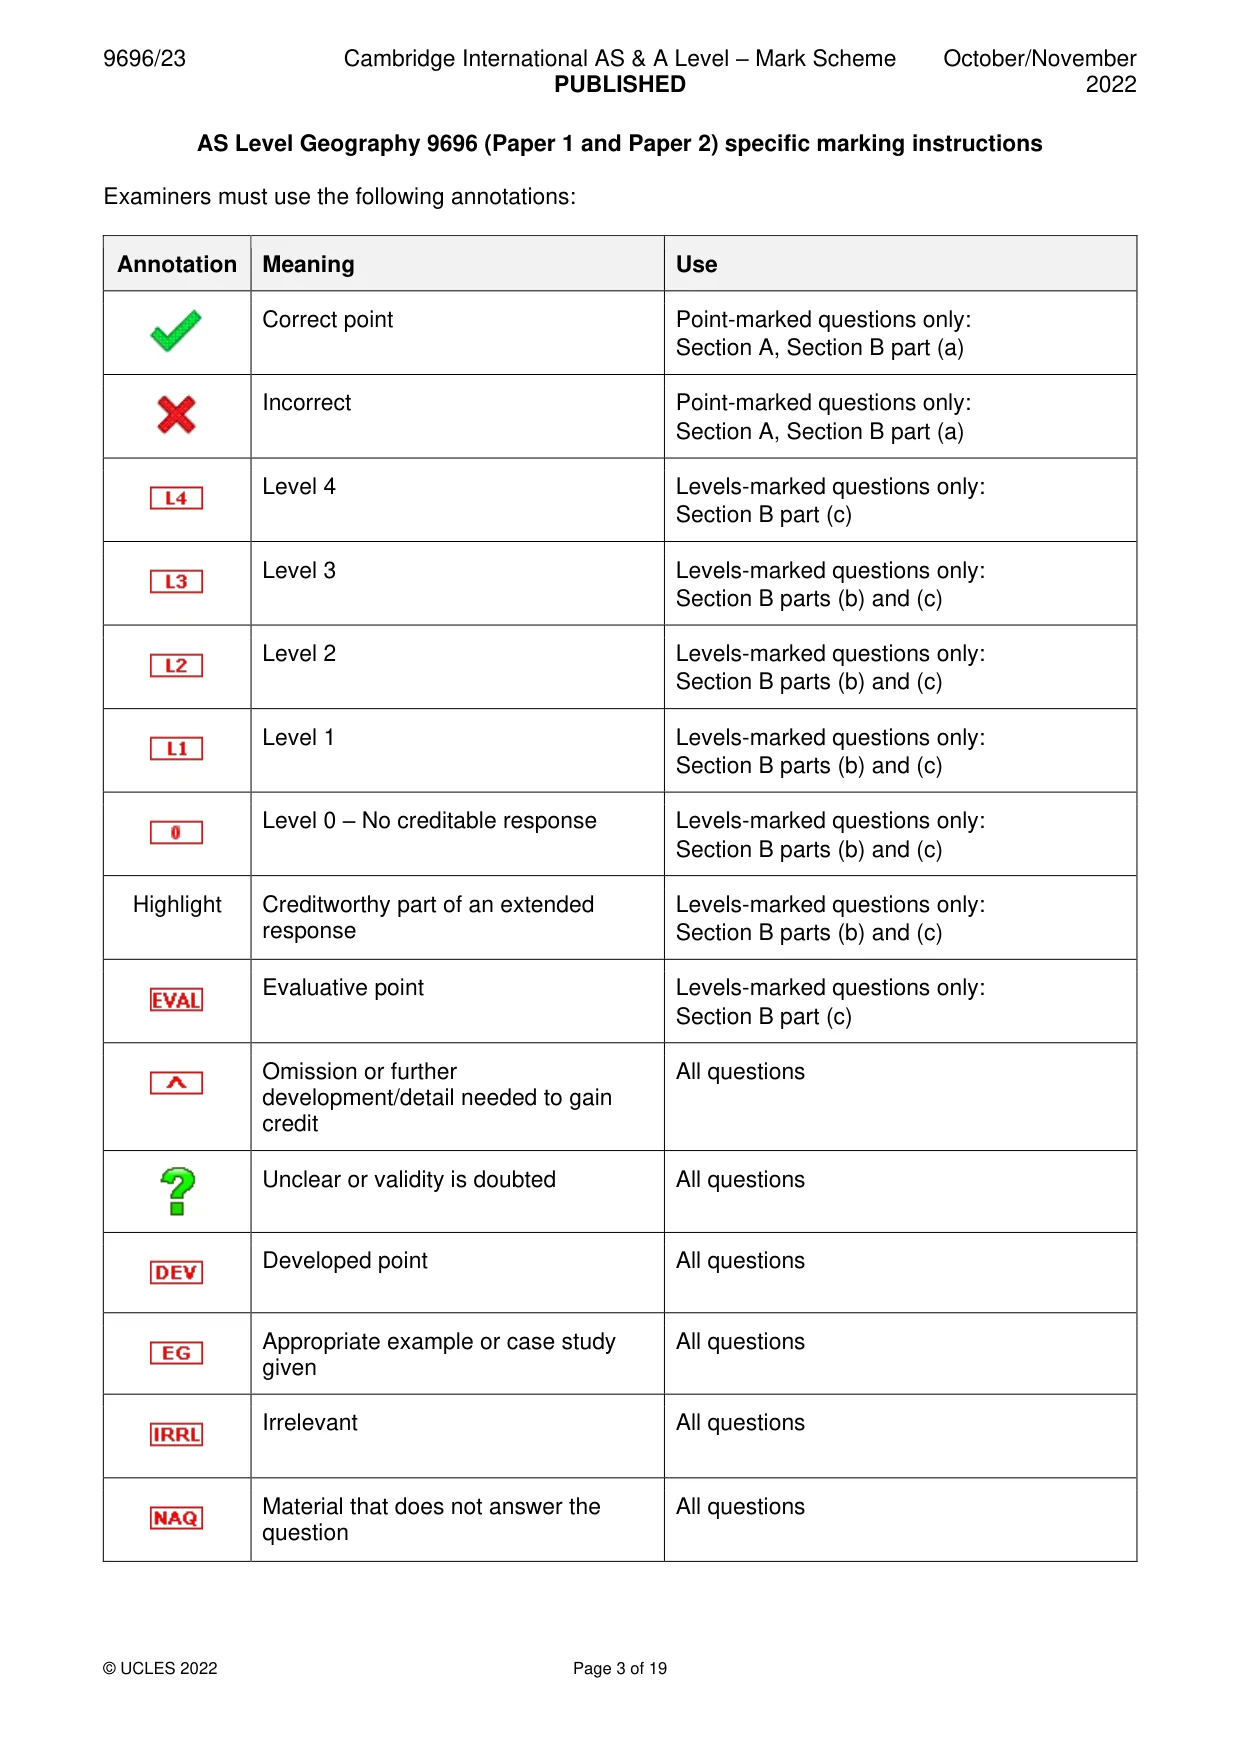
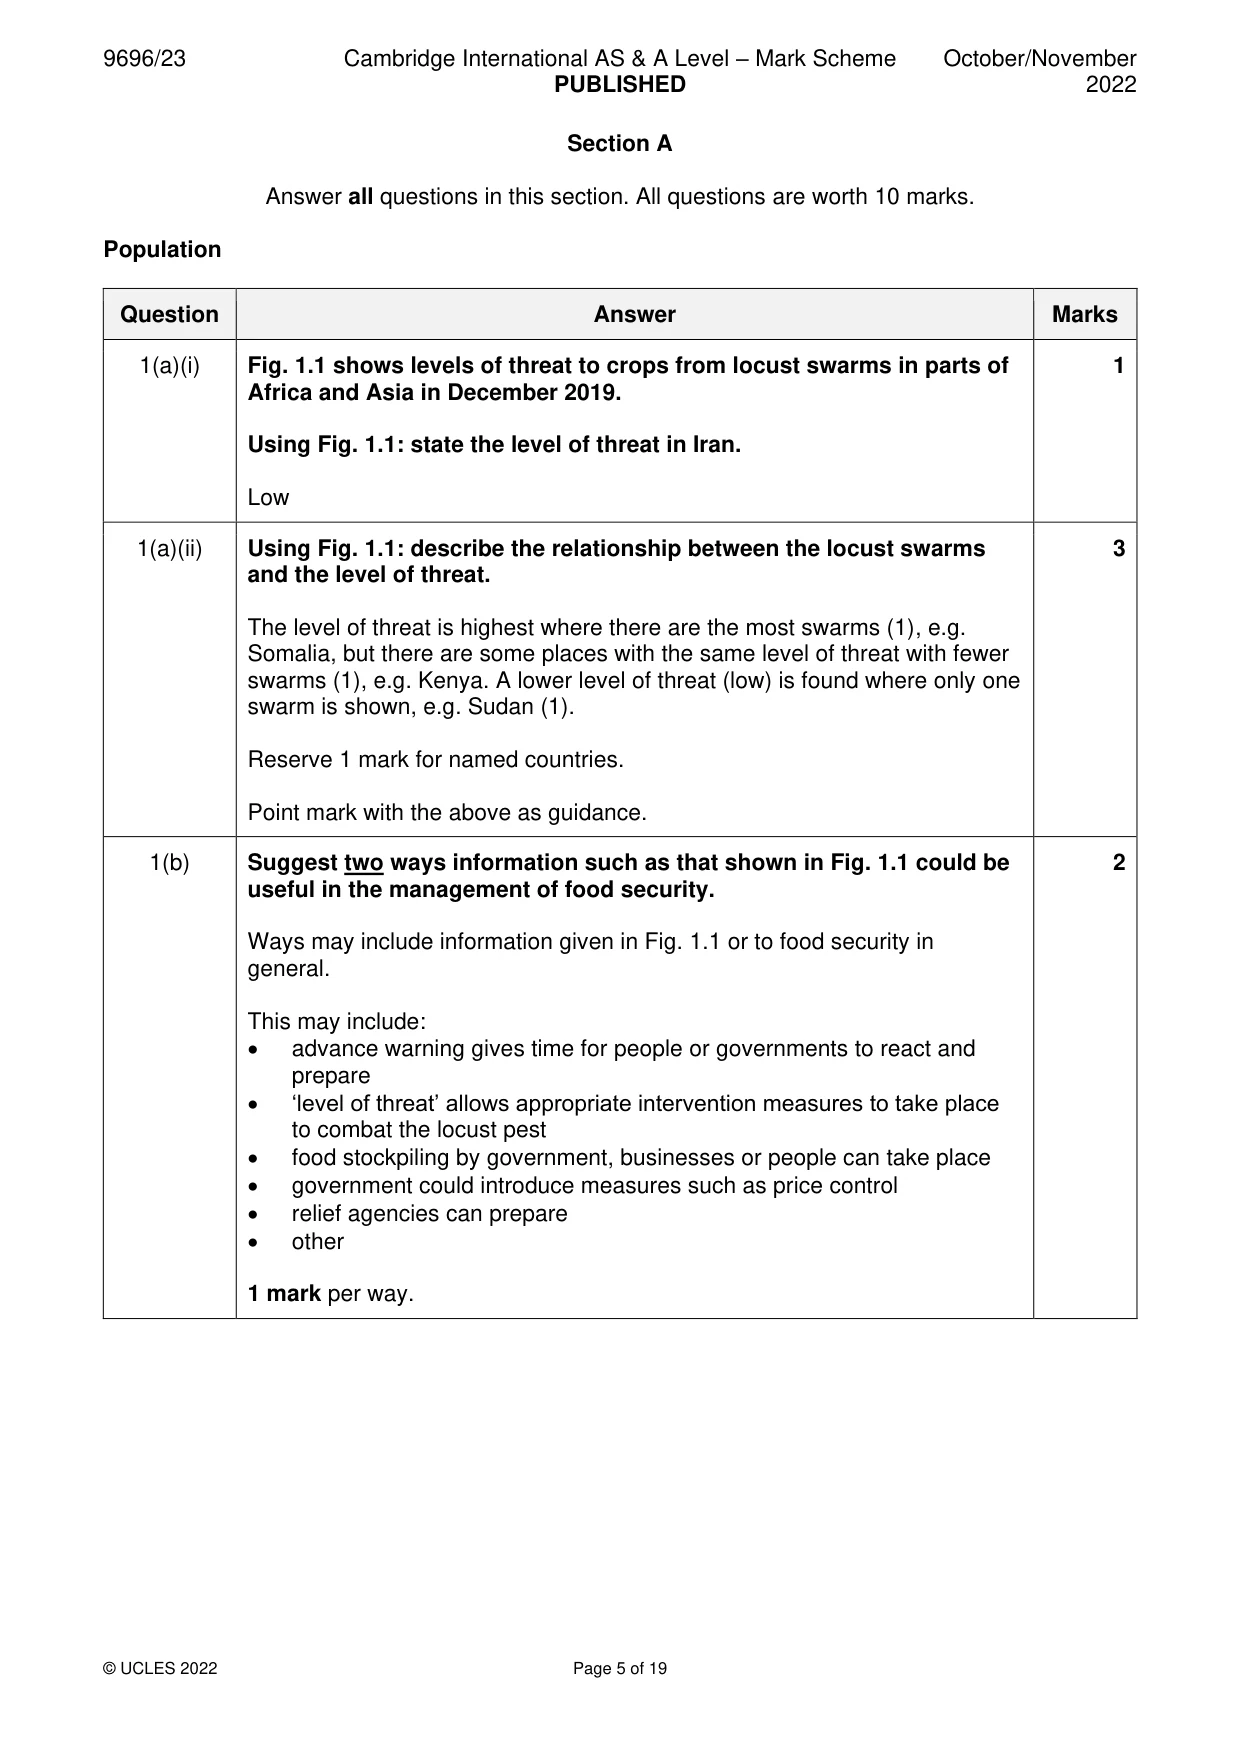
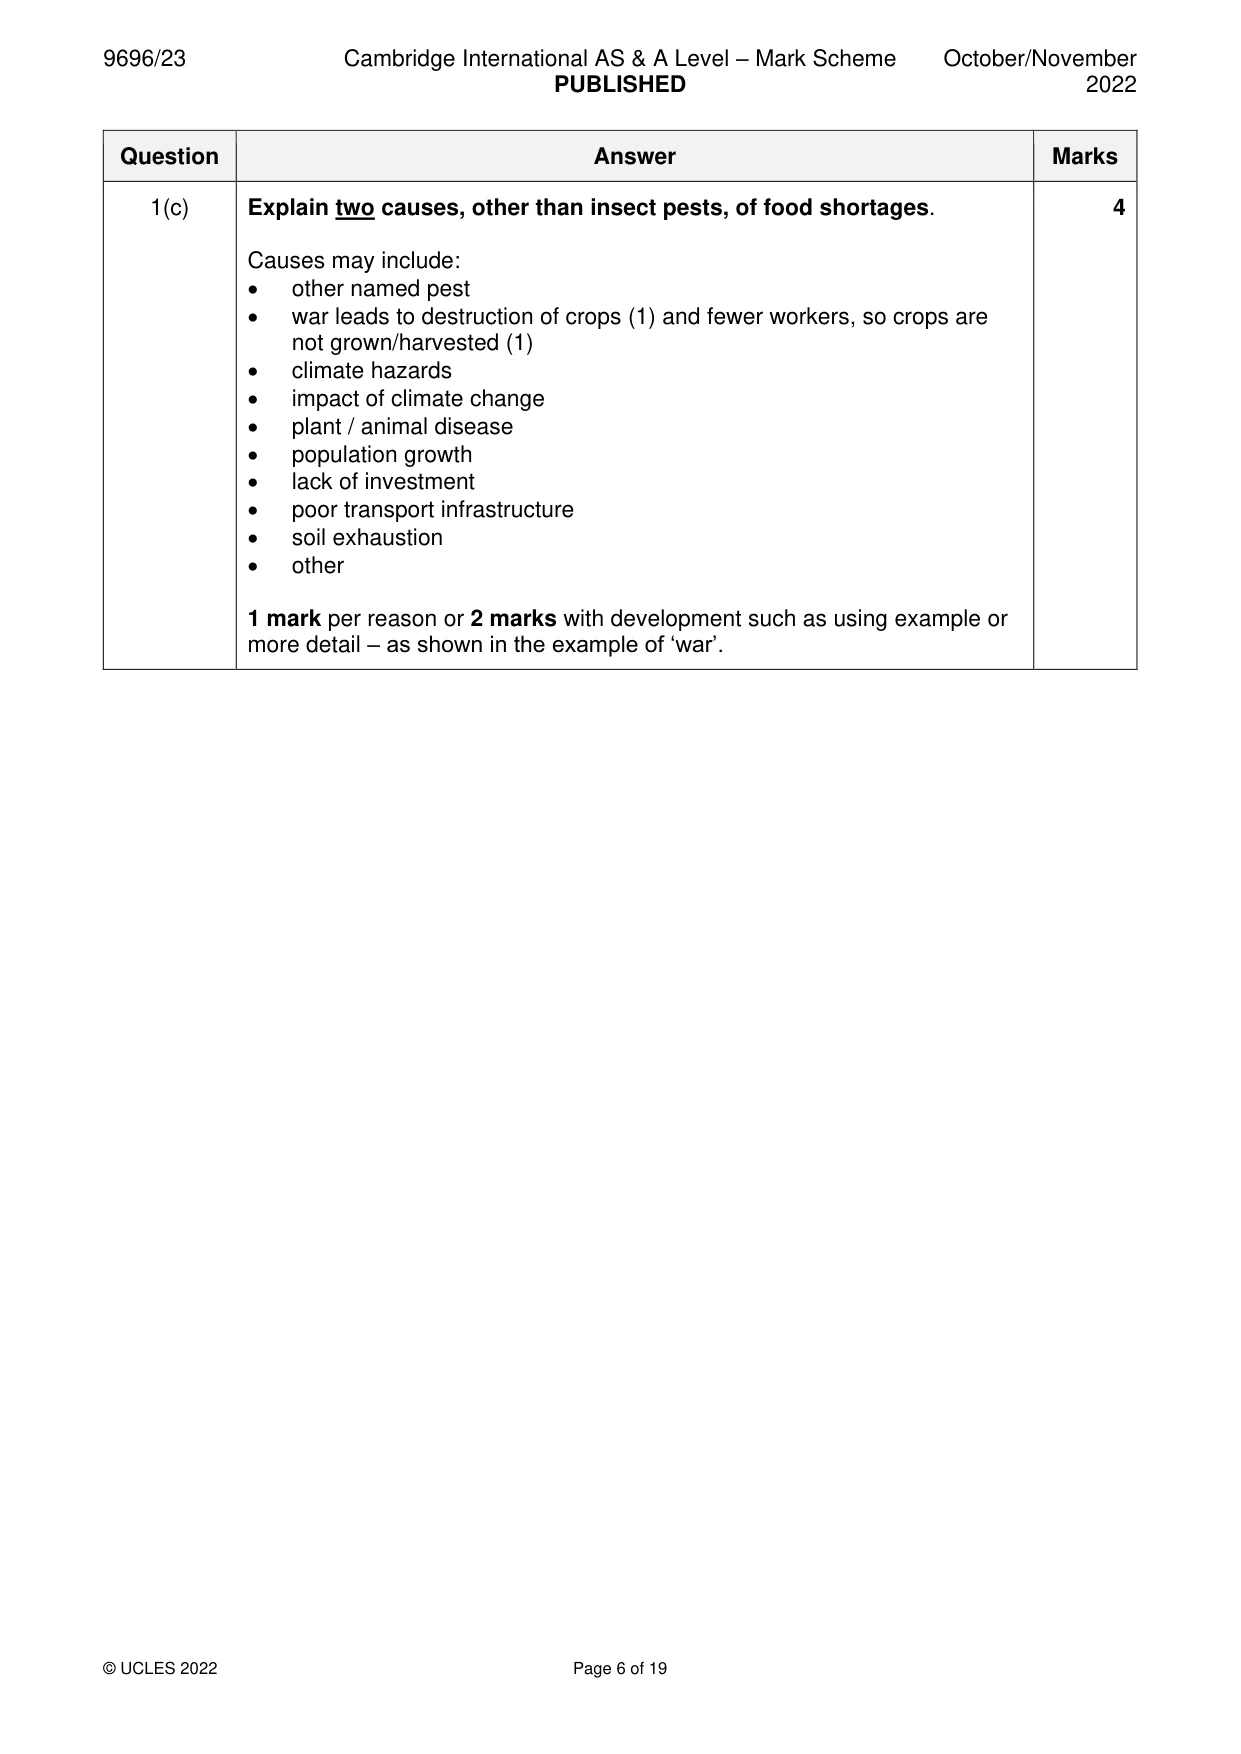
Mark scheme: Question Answer Marks 1(a)(i) Fig. 1.1 shows levels of threat to crops from locust swarms in parts of 1 Africa and Asia in December 2019. Using Fig. 1.1: state the level of threat in Iran. Low 1(a)(ii) Using Fig. 1.1: describe the relationship between the locust swarms 3 and the level of threat. The level of threat is highest where there are the most swarms (1), e.g. Somalia, but there are some places with the same level of threat with fewer swarms (1), e.g. Kenya. A lower level of threat (low) is found where only one swarm is shown, e.g. Sudan (1). Reserve 1 mark for named countries. Point mark with the above as guidance. 1(b) Suggest two ways information such as that shown in Fig. 1.1 could be 2 useful in the management of food security. Ways may include information given in Fig. 1.1 or to food security in general. This may include: • advance warning gives time for people or governments to react and prepare • ‘level of threat’ allows appropriate intervention measures to take place to combat the locust pest • food stockpiling by government, businesses or people can take place • government could introduce measures such as price control • relief agencies can prepare • other 1 mark per way. 1(c) Explain two causes, other than insect pests, of food shortages. 4 Causes may include: • other named pest • war leads to destruction of crops (1) and fewer workers, so crops are not grown/harvested (1) • climate hazards • impact of climate change • plant / animal disease • population growth • lack of investment • poor transport infrastructure • soil exhaustion • other 1 mark per reason or 2 marks with development such as using example or more detail – as shown in the example of ‘war’. Migration
Q2 · International migration for selected sub-regions of Oceania in 2015
2 Fig. 2.1 shows international migration for selected sub-regions of Oceania in 2015. Fig. 2.2 shows the sub-regions of Oceania. (a) Using Fig. 2.1, state: (i) the sub-region with the largest proportion of international migrants moving from sub-region to sub-region within Oceania [1] (ii) the sub-region with the largest number of international migrants to other continents. [1] (b) Suggest two constraints to international migration in the area shown in Fig. 2.2. [3] (c) Explain the advantages of chain migration. [5] Settlement dynamics
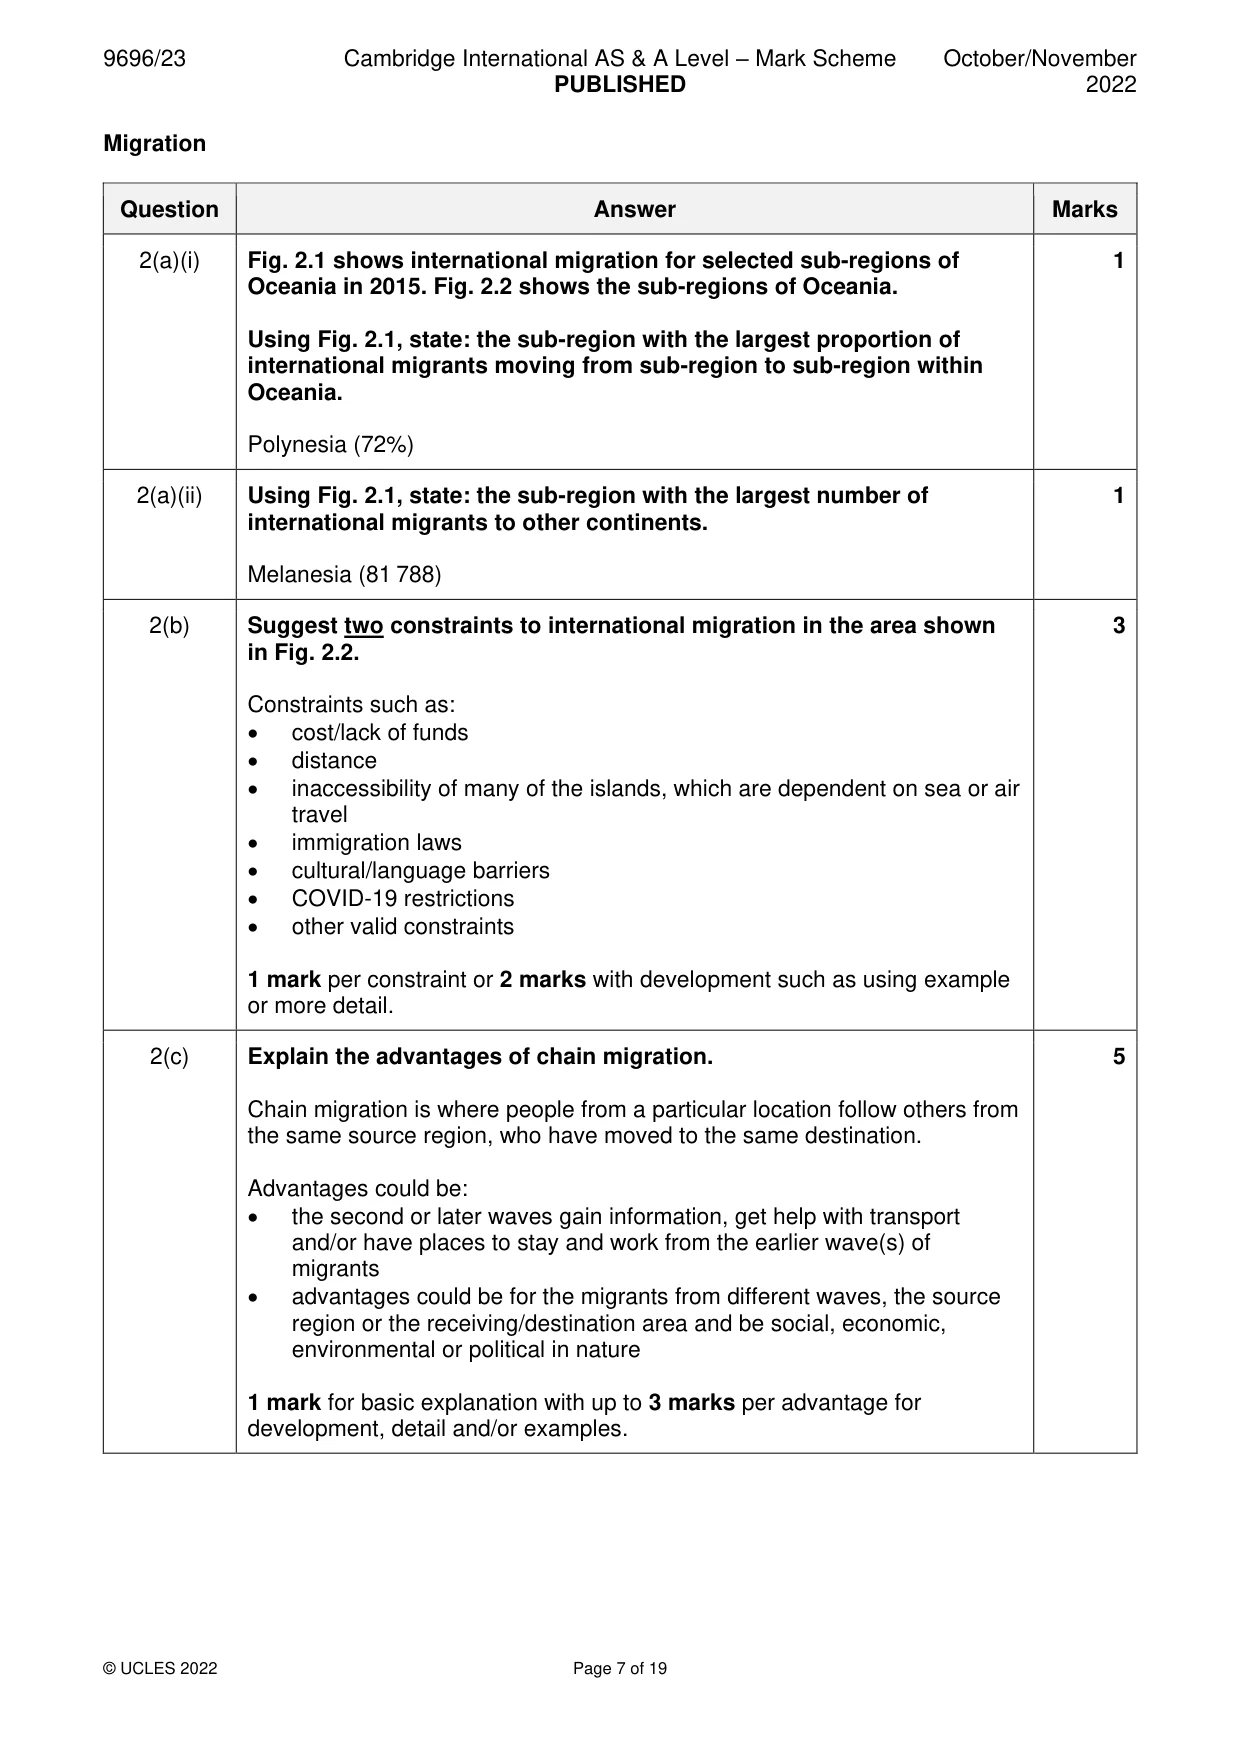
Mark scheme: 2(a)(i) Fig. 2.1 shows international migration for selected sub-regions of 1 Oceania in 2015. Fig. 2.2 shows the sub-regions of Oceania. Using Fig. 2.1, state: the sub-region with the largest proportion of international migrants moving from sub-region to sub-region within Oceania. Polynesia (72%) 2(a)(ii) Using Fig. 2.1, state: the sub-region with the largest number of 1 international migrants to other continents. Melanesia (81 788) 2(b) Suggest two constraints to international migration in the area shown 3 in Fig. 2.2. Constraints such as: • cost/lack of funds • distance • inaccessibility of many of the islands, which are dependent on sea or air travel • immigration laws • cultural/language barriers • COVID-19 restrictions • other valid constraints 1 mark per constraint or 2 marks with development such as using example or more detail. 2(c) Explain the advantages of chain migration. 5 Chain migration is where people from a particular location follow others from the same source region, who have moved to the same destination. Advantages could be: • the second or later waves gain information, get help with transport and/or have places to stay and work from the earlier wave(s) of migrants • advantages could be for the migrants from different waves, the source region or the receiving/destination area and be social, economic, environmental or political in nature 1 mark for basic explanation with up to 3 marks per advantage for development, detail and/or examples. Settlement dynamics
Q3 · The rural and urban population of the world, 1990–2017
3 Fig. 3.1 shows the rural and urban population of the world, 1990–2017. (a) Using Fig. 3.1: (i) state the year in which urban population equals the rural population [1] (ii) compare the trends in rural population and urban population from 1990 to 2017. [3] (b) Outline two reasons for the differences in the trends you identified in (a)(ii). [2] (c) Explain how the growth of urban areas in LICs/MICs creates issues for nearby rural settlements. [4]
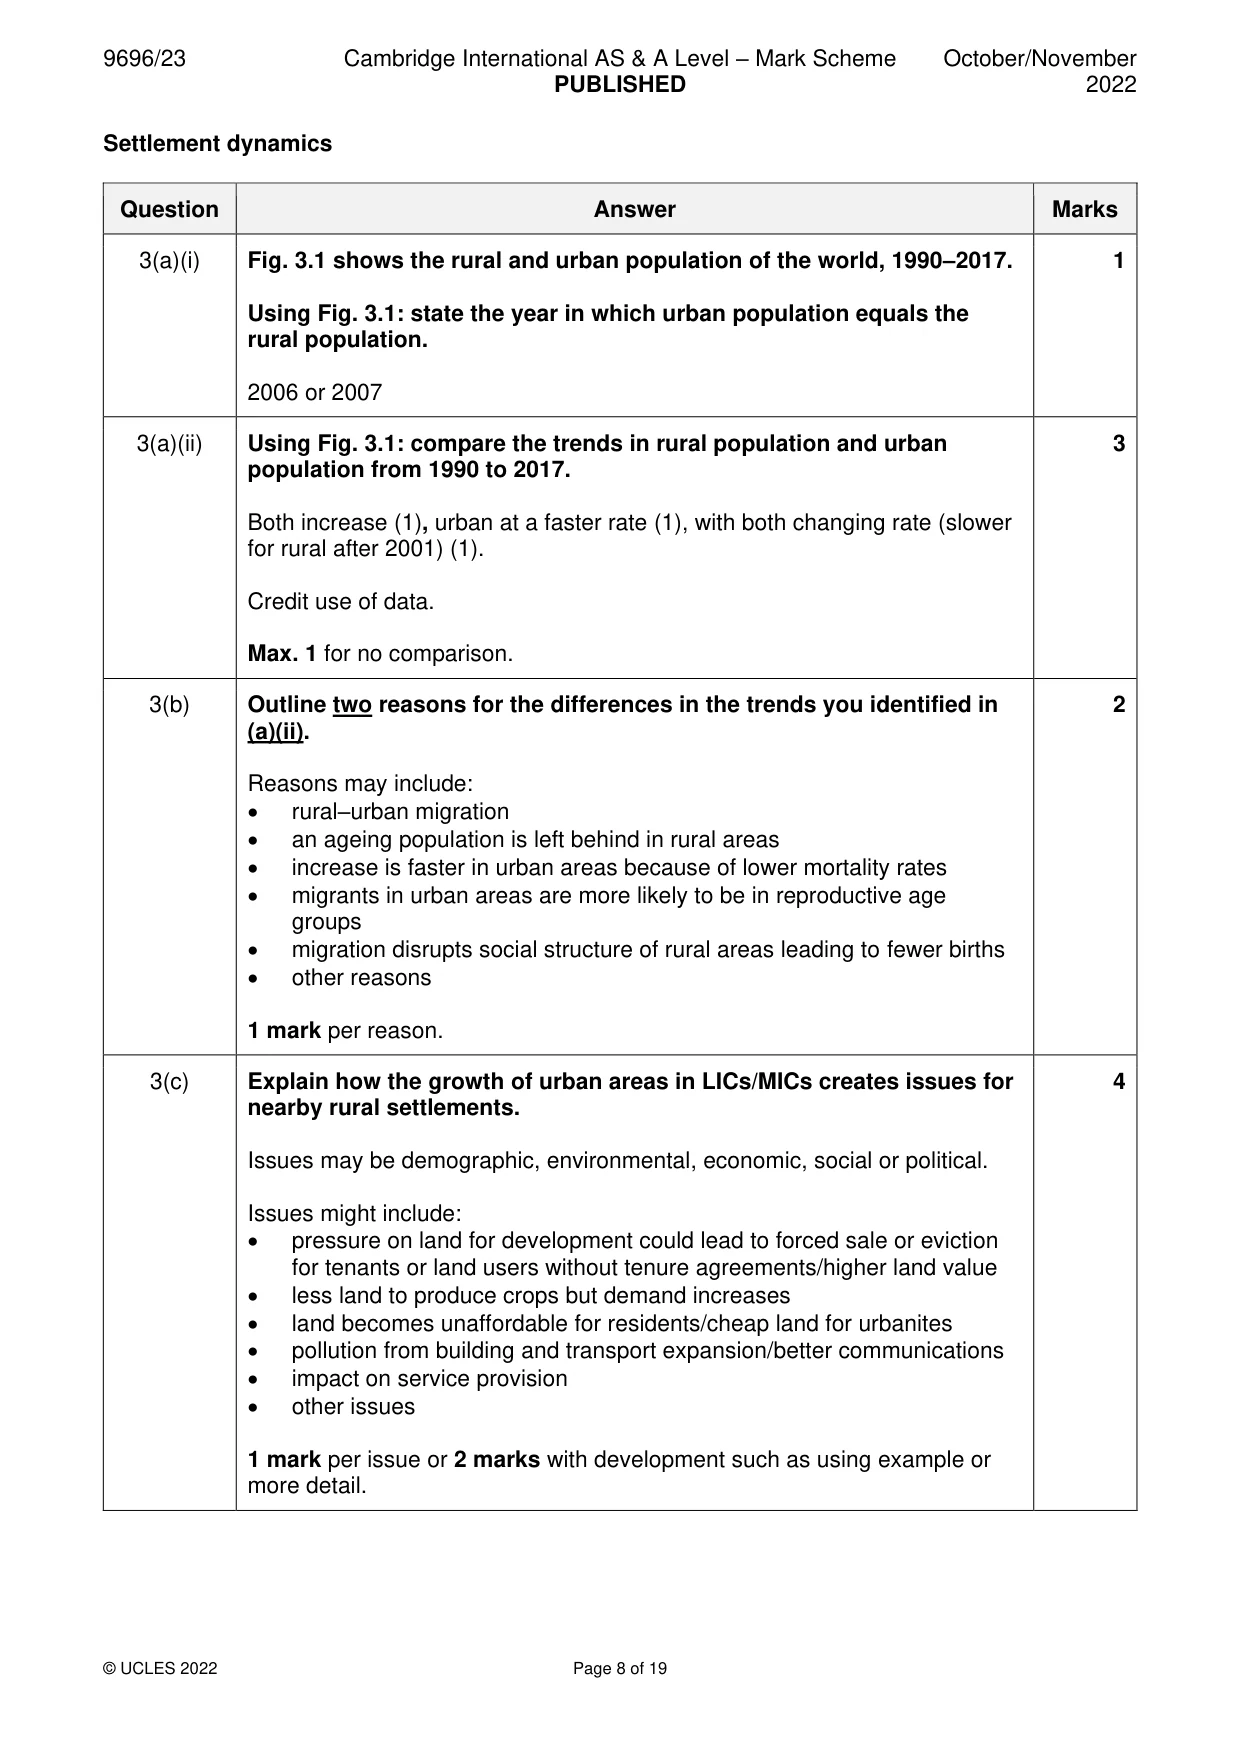
Mark scheme: 3(a)(i) Fig. 3.1 shows the rural and urban population of the world, 1990–2017. 1 Using Fig. 3.1: state the year in which urban population equals the rural population. 2006 or 2007 3(a)(ii) Using Fig. 3.1: compare the trends in rural population and urban 3 population from 1990 to 2017. Both increase (1), urban at a faster rate (1), with both changing rate (slower for rural after 2001) (1). Credit use of data. Max. 1 for no comparison. 3(b) Outline two reasons for the differences in the trends you identified in 2 (a)(ii). Reasons may include: • rural–urban migration • an ageing population is left behind in rural areas • increase is faster in urban areas because of lower mortality rates • migrants in urban areas are more likely to be in reproductive age groups • migration disrupts social structure of rural areas leading to fewer births • other reasons 1 mark per reason. 3(c) Explain how the growth of urban areas in LICs/MICs creates issues for 4 nearby rural settlements. Issues may be demographic, environmental, economic, social or political. Issues might include: • pressure on land for development could lead to forced sale or eviction for tenants or land users without tenure agreements/higher land value • less land to produce crops but demand increases • land becomes unaffordable for residents/cheap land for urbanites • pollution from building and transport expansion/better communications • impact on service provision • other issues 1 mark per issue or 2 marks with development such as using example or more detail. Section B Answer one question from this section. All questions are worth 30 marks. Population
Q4 · Define the term fertility rate
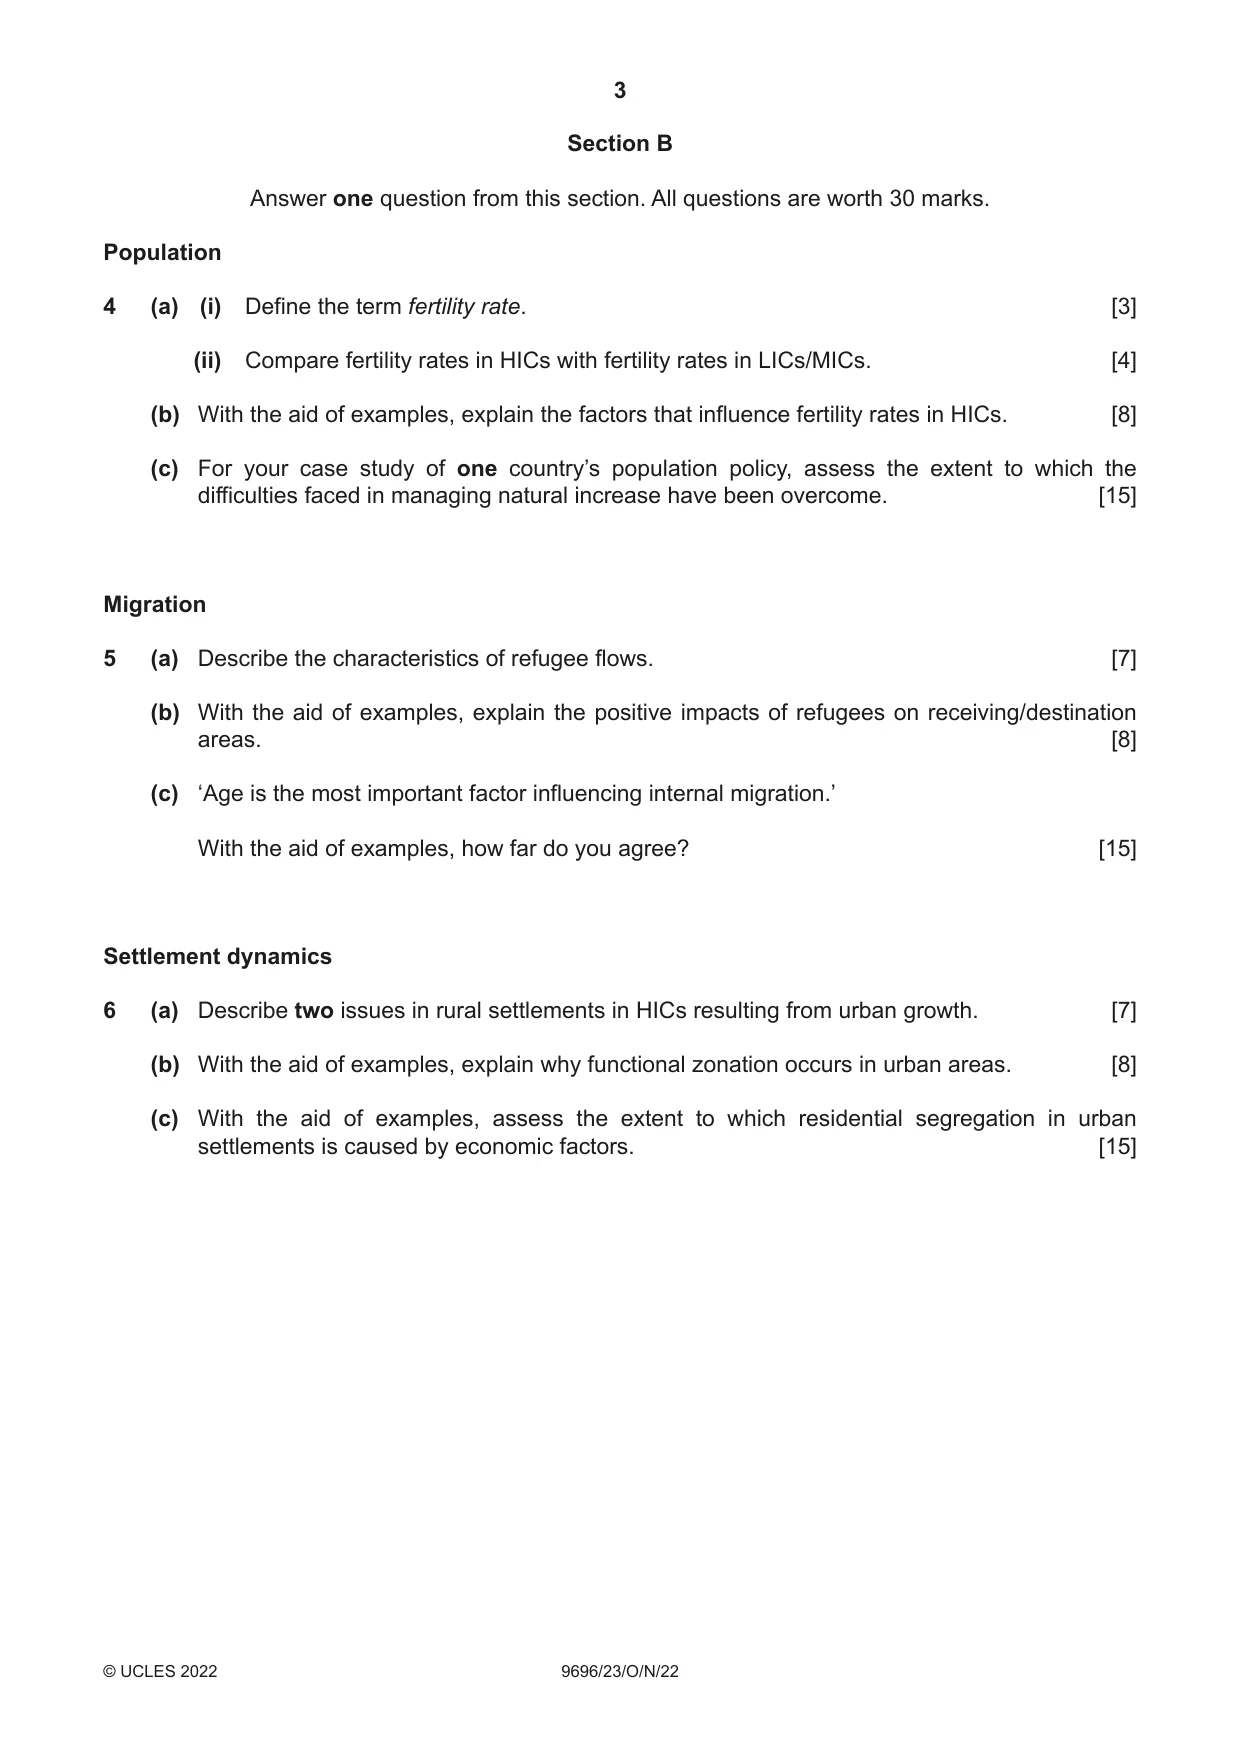
4 (a) (i) Define the term fertility rate. [3] (ii) Compare fertility rates in HICs with fertility rates in LICs/MICs. [4] (b) With the aid of examples, explain the factors that influence fertility rates in HICs. [8] (c) For your case study of one country’s population policy, assess the extent to which the difficulties faced in managing natural increase have been overcome. [15] Migration
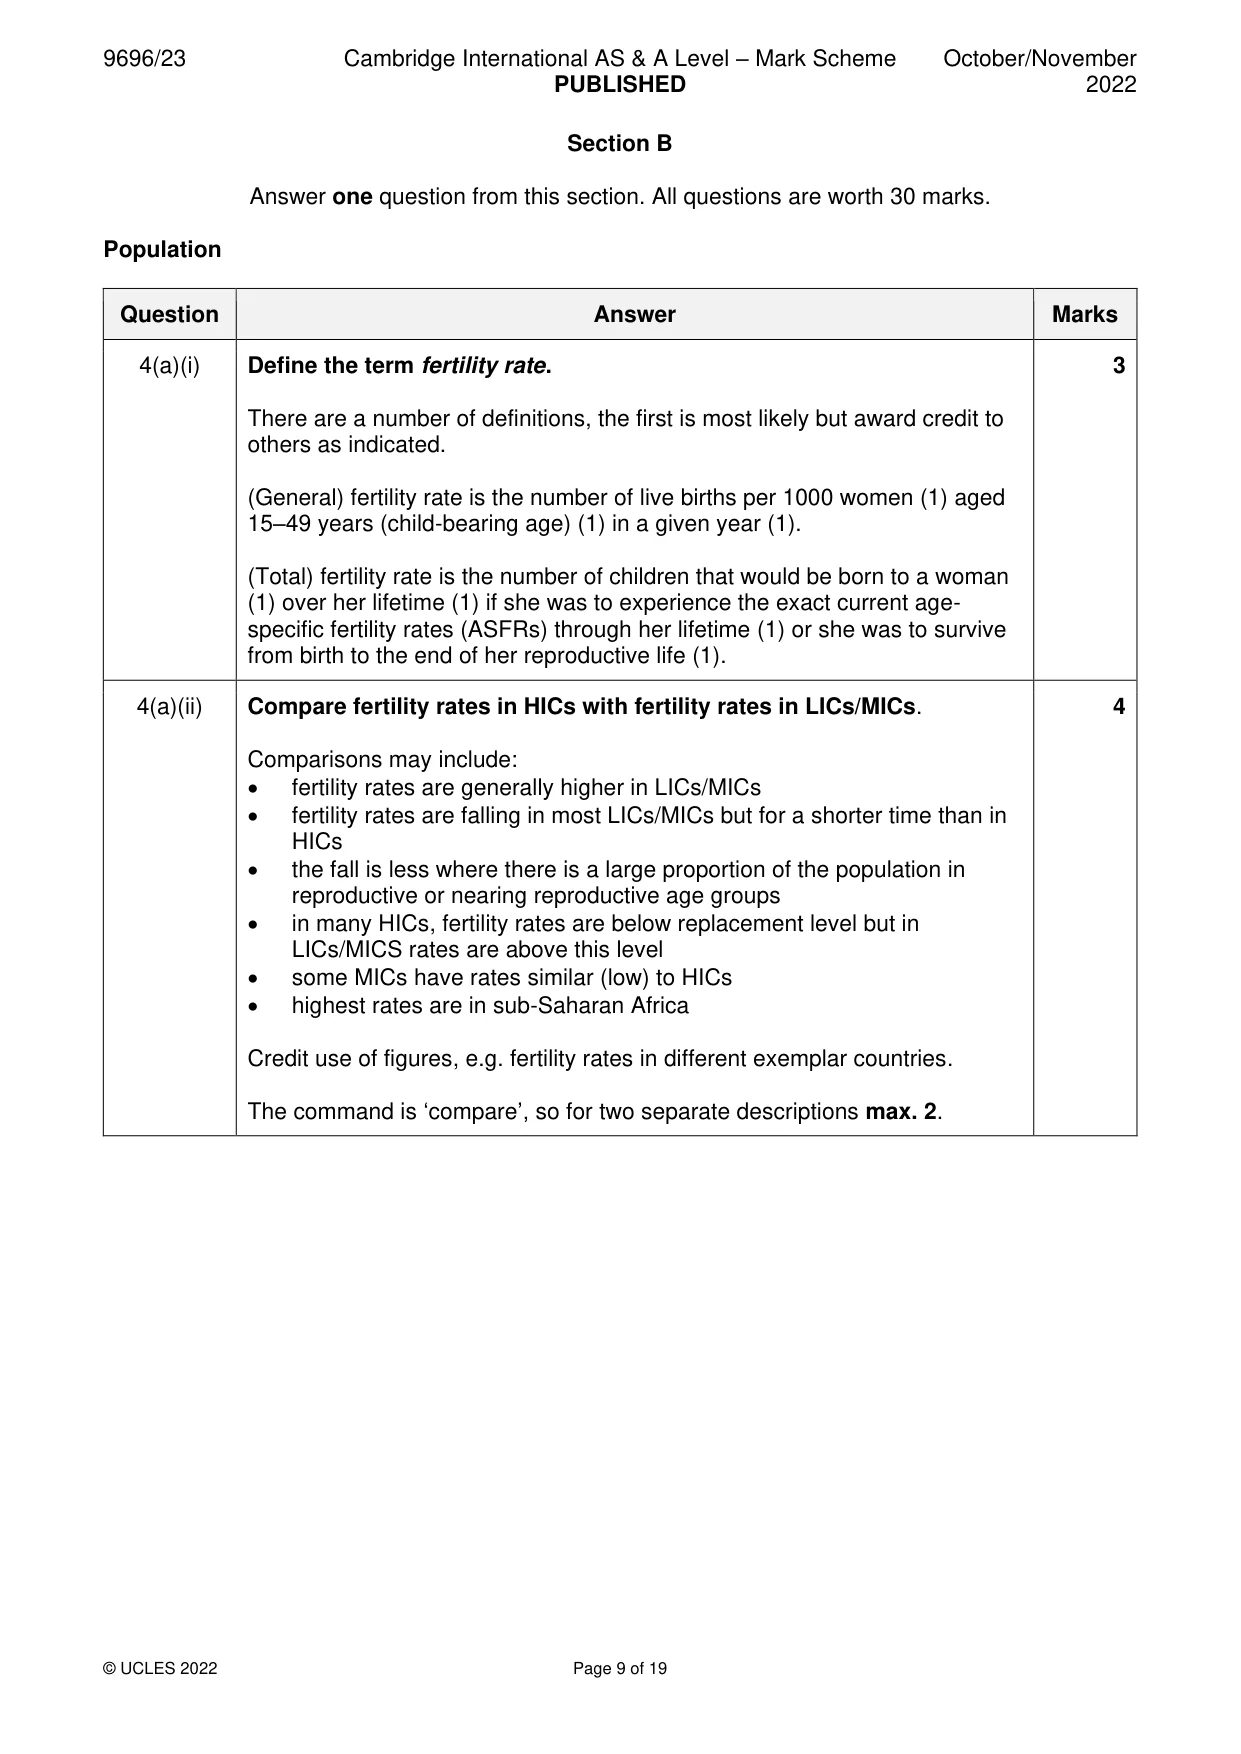
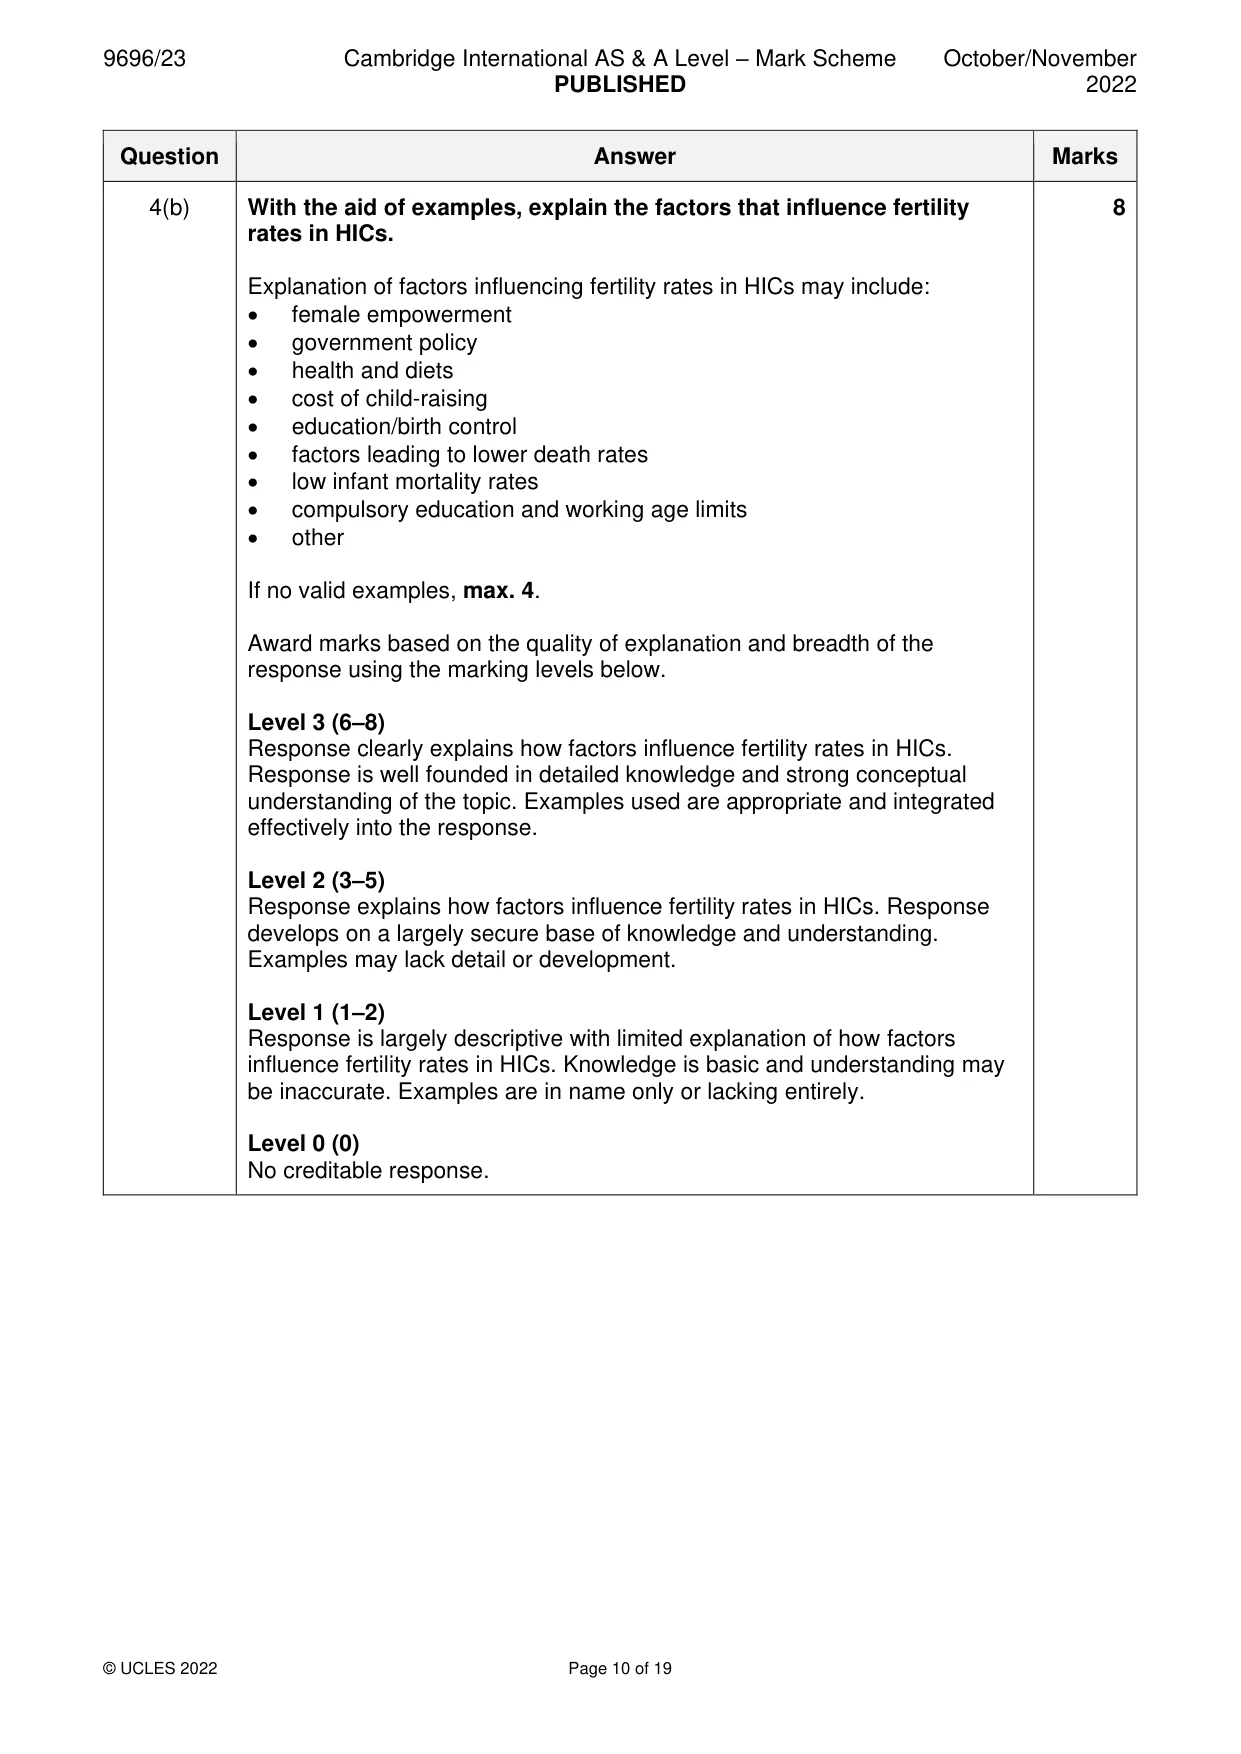
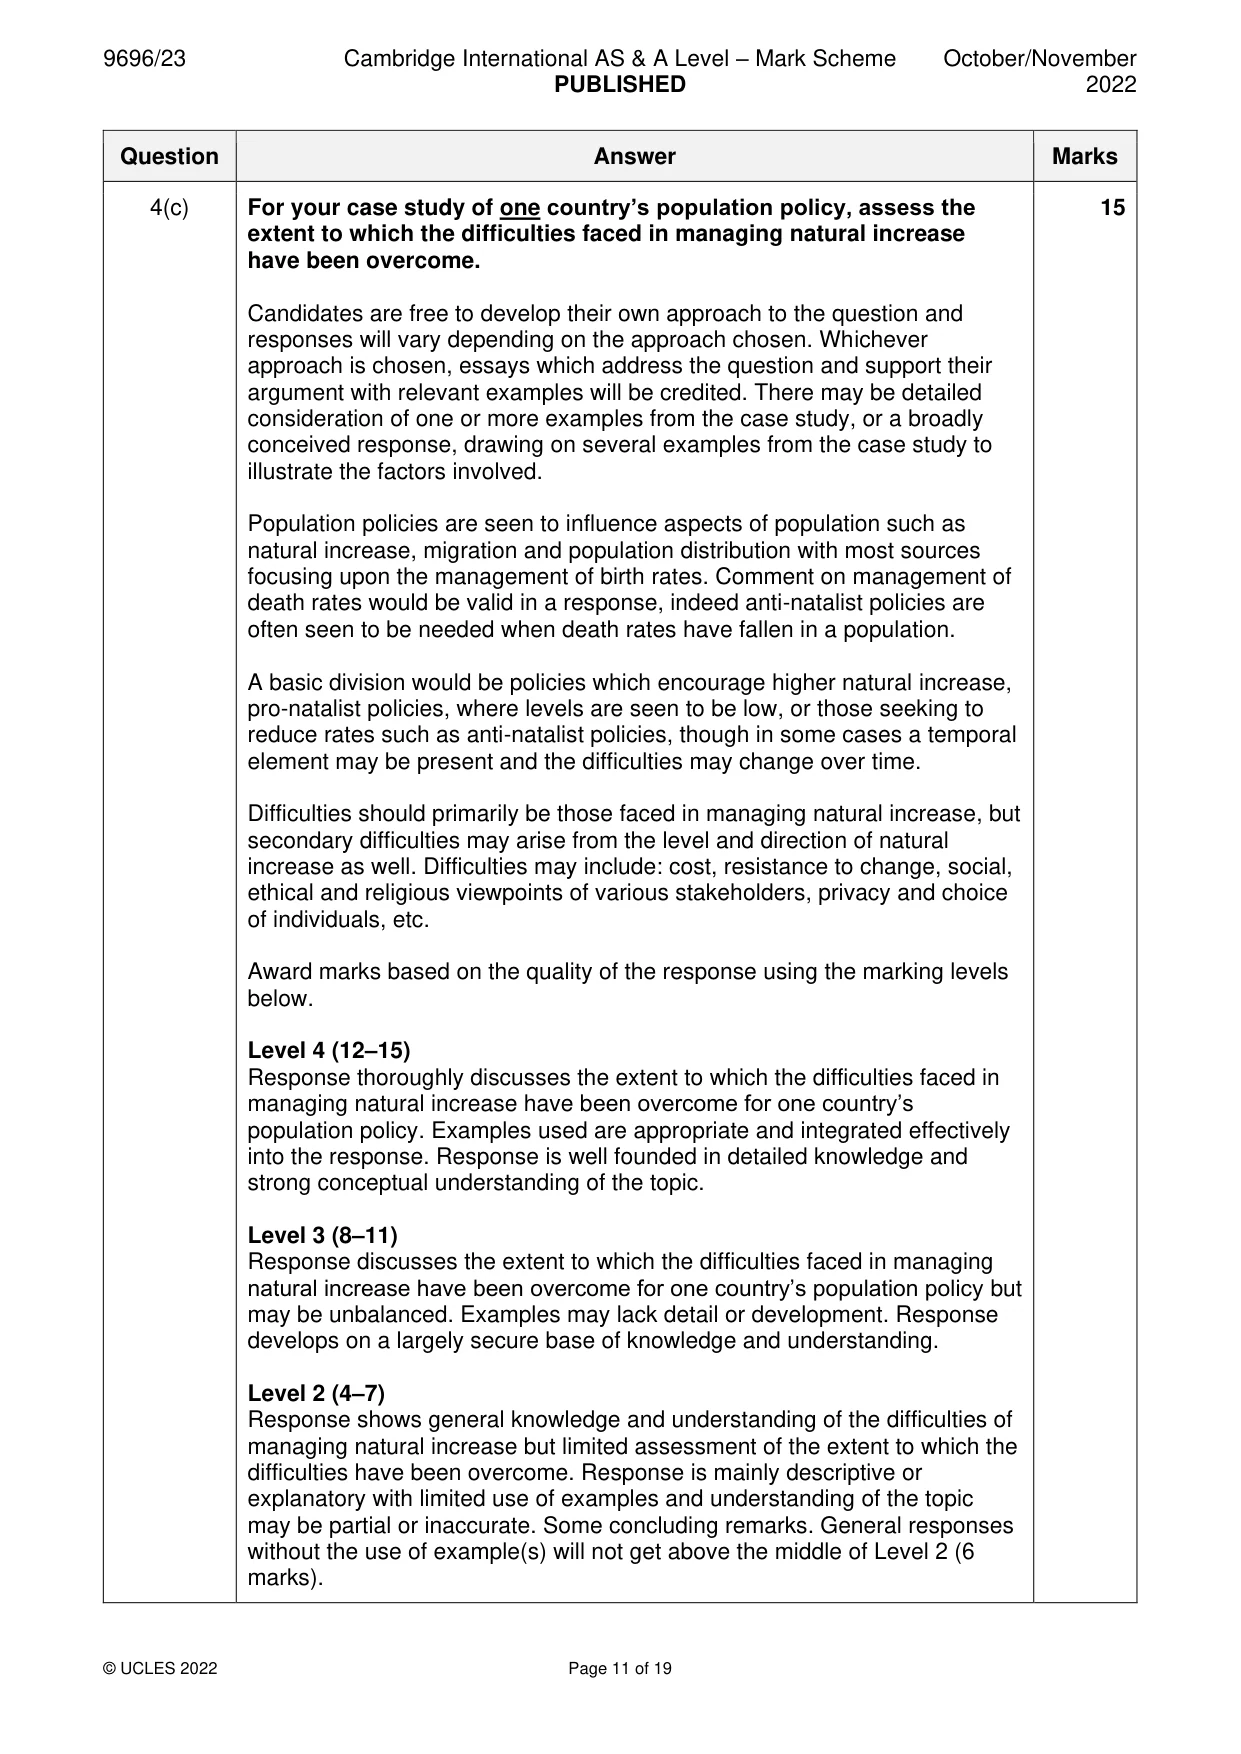
Mark scheme: 4(a)(i) Define the term fertility rate. 3 There are a number of definitions, the first is most likely but award credit to others as indicated. (General) fertility rate is the number of live births per 1000 women (1) aged 15–49 years (child-bearing age) (1) in a given year (1). (Total) fertility rate is the number of children that would be born to a woman (1) over her lifetime (1) if she was to experience the exact current age- specific fertility rates (ASFRs) through her lifetime (1) or she was to survive from birth to the end of her reproductive life (1). 4(a)(ii) Compare fertility rates in HICs with fertility rates in LICs/MICs. 4 Comparisons may include: • fertility rates are generally higher in LICs/MICs • fertility rates are falling in most LICs/MICs but for a shorter time than in HICs • the fall is less where there is a large proportion of the population in reproductive or nearing reproductive age groups • in many HICs, fertility rates are below replacement level but in LICs/MICS rates are above this level • some MICs have rates similar (low) to HICs • highest rates are in sub-Saharan Africa Credit use of figures, e.g. fertility rates in different exemplar countries. The command is ‘compare’, so for two separate descriptions max. 2. 4(b) With the aid of examples, explain the factors that influence fertility 8 rates in HICs. Explanation of factors influencing fertility rates in HICs may include: • female empowerment • government policy • health and diets • cost of child-raising • education/birth control • factors leading to lower death rates • low infant mortality rates • compulsory education and working age limits • other If no valid examples, max. 4. Award marks based on the quality of explanation and breadth of the response using the marking levels below. Level 3 (6–8) Response clearly explains how factors influence fertility rates in HICs. Response is well founded in detailed knowledge and strong conceptual understanding of the topic. Examples used are appropriate and integrated effectively into the response. Level 2 (3–5) Response explains how factors influence fertility rates in HICs. Response develops on a largely secure base of knowledge and understanding. Examples may lack detail or development. Level 1 (1–2) Response is largely descriptive with limited explanation of how factors influence fertility rates in HICs. Knowledge is basic and understanding may be inaccurate. Examples are in name only or lacking entirely. Level 0 (0) No creditable response. 4(c) For your case study of one country’s population policy, assess the 15 extent to which the difficulties faced in managing natural increase have been overcome. Candidates are free to develop their own approach to the question and responses will vary depending on the approach chosen. Whichever approach is chosen, essays which address the question and support their argument with relevant examples will be credited. There may be detailed consideration of one or more examples from the case study, or a broadly conceived response, drawing on several examples from the case study to illustrate the factors involved. Population policies are seen to influence aspects of population such as natural increase, migration and population distribution with most sources focusing upon the management of birth rates. Comment on management of death rates would be valid in a response, indeed anti-natalist policies are often seen to be needed when death rates have fallen in a population. A basic division would be policies which encourage higher natural increase, pro-natalist policies, where levels are seen to be low, or those seeking to reduce rates such as anti-natalist policies, though in some cases a temporal element may be present and the difficulties may change over time. Difficulties should primarily be those faced in managing natural increase, but secondary difficulties may arise from the level and direction of natural increase as well. Difficulties may include: cost, resistance to change, social, ethical and religious viewpoints of various stakeholders, privacy and choice of individuals, etc. Award marks based on the quality of the response using the marking levels below. Level 4 (12–15) Response thoroughly discusses the extent to which the difficulties faced in managing natural increase have been overcome for one country’s population policy. Examples used are appropriate and integrated effectively into the response. Response is well founded in detailed knowledge and strong conceptual understanding of the topic. Level 3 (8–11) Response discusses the extent to which the difficulties faced in managing natural increase have been overcome for one country’s population policy but may be unbalanced. Examples may lack detail or development. Response develops on a largely secure base of knowledge and understanding. Level 2 (4–7) Response shows general knowledge and understanding of the difficulties of managing natural increase but limited assessment of the extent to which the difficulties have been overcome. Response is mainly descriptive or explanatory with limited use of examples and understanding of the topic may be partial or inaccurate. Some concluding remarks. General responses without the use of example(s) will not get above the middle of Level 2 (6 marks). 4(c) Level 1 (1–3) Response may broadly discuss the population policy of one country but does not address the question and does not come to a convincing conclusion. Response is descriptive, knowledge is basic and understanding is poor. Level 0 (0) No creditable response. Migration
Q5 · Describe the characteristics of refugee flows
5 (a) Describe the characteristics of refugee flows. [7] (b) With the aid of examples, explain the positive impacts of refugees on receiving/destination areas. [8] (c) ‘Age is the most important factor influencing internal migration.’ With the aid of examples, how far do you agree? [15] Settlement dynamics
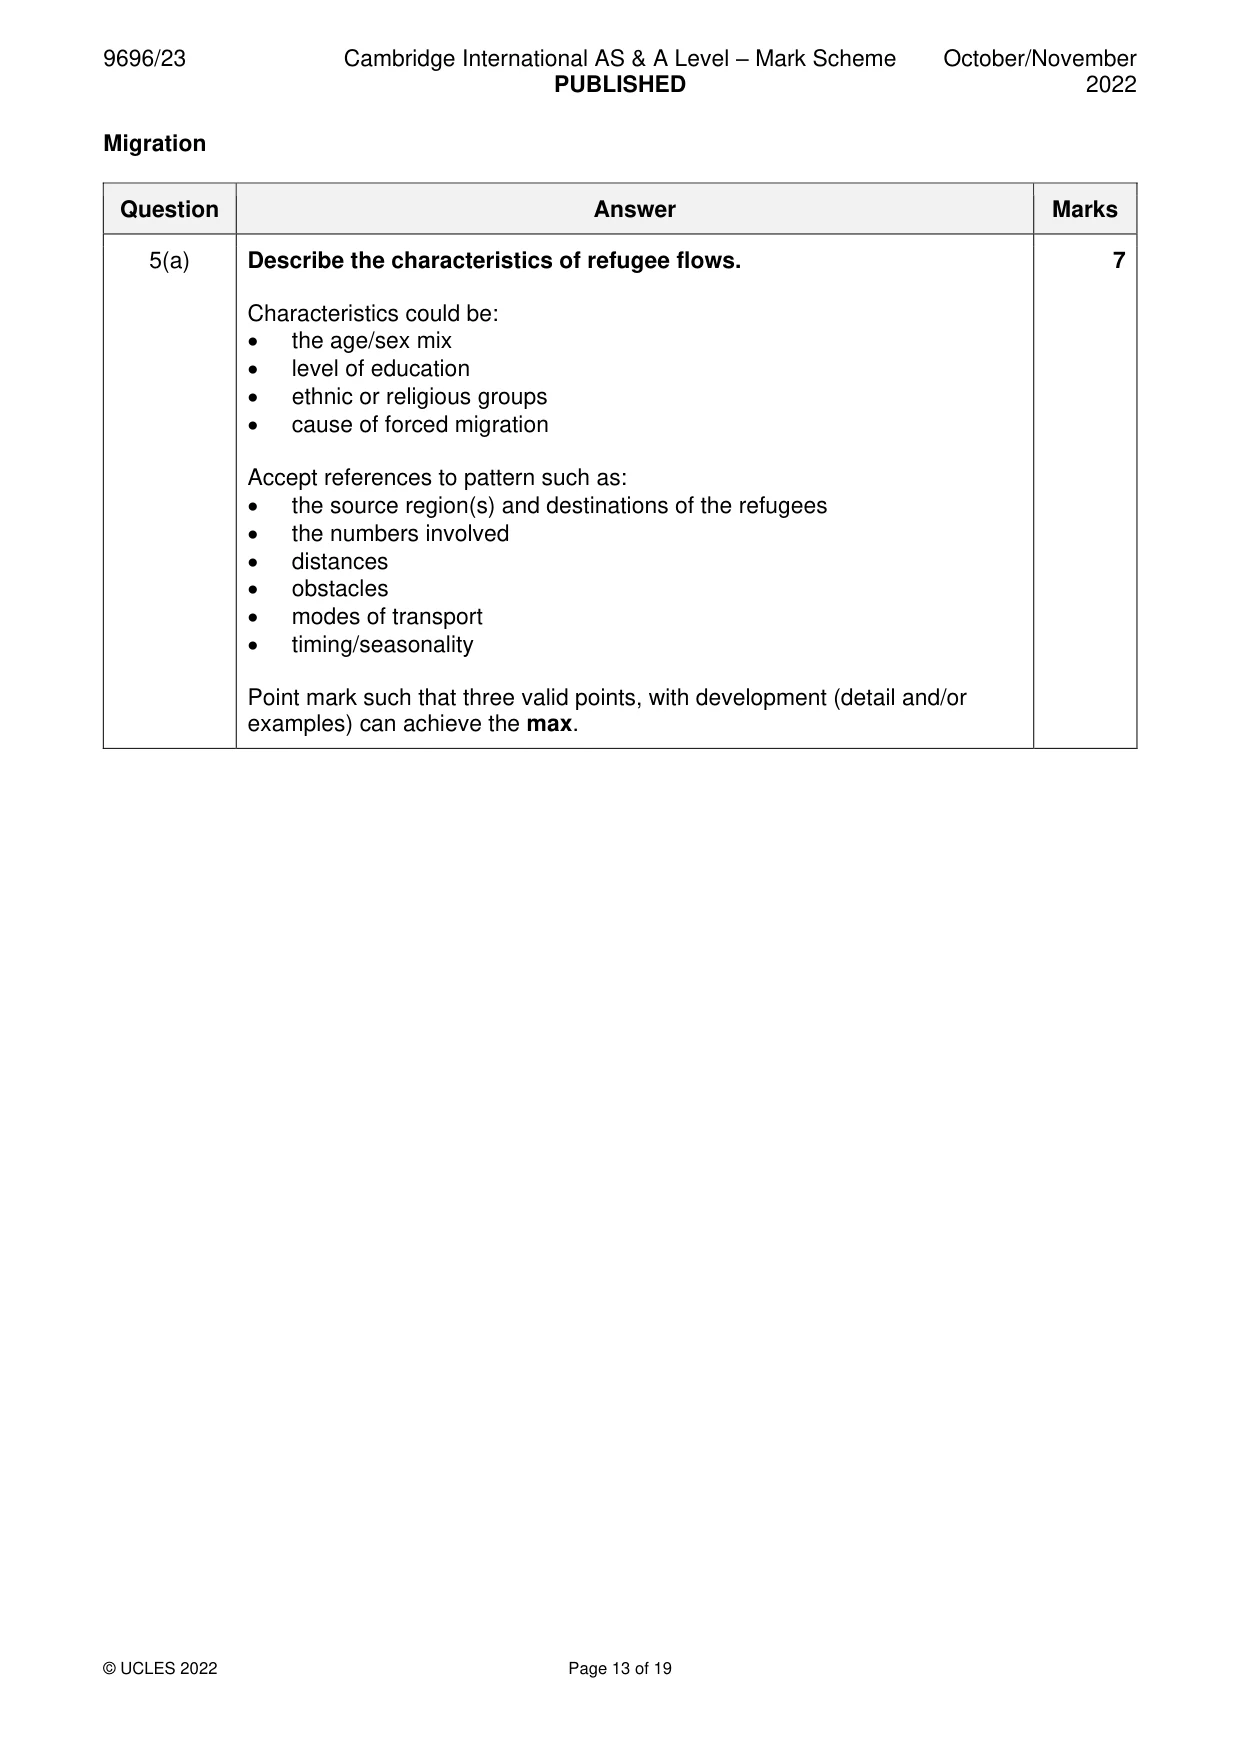
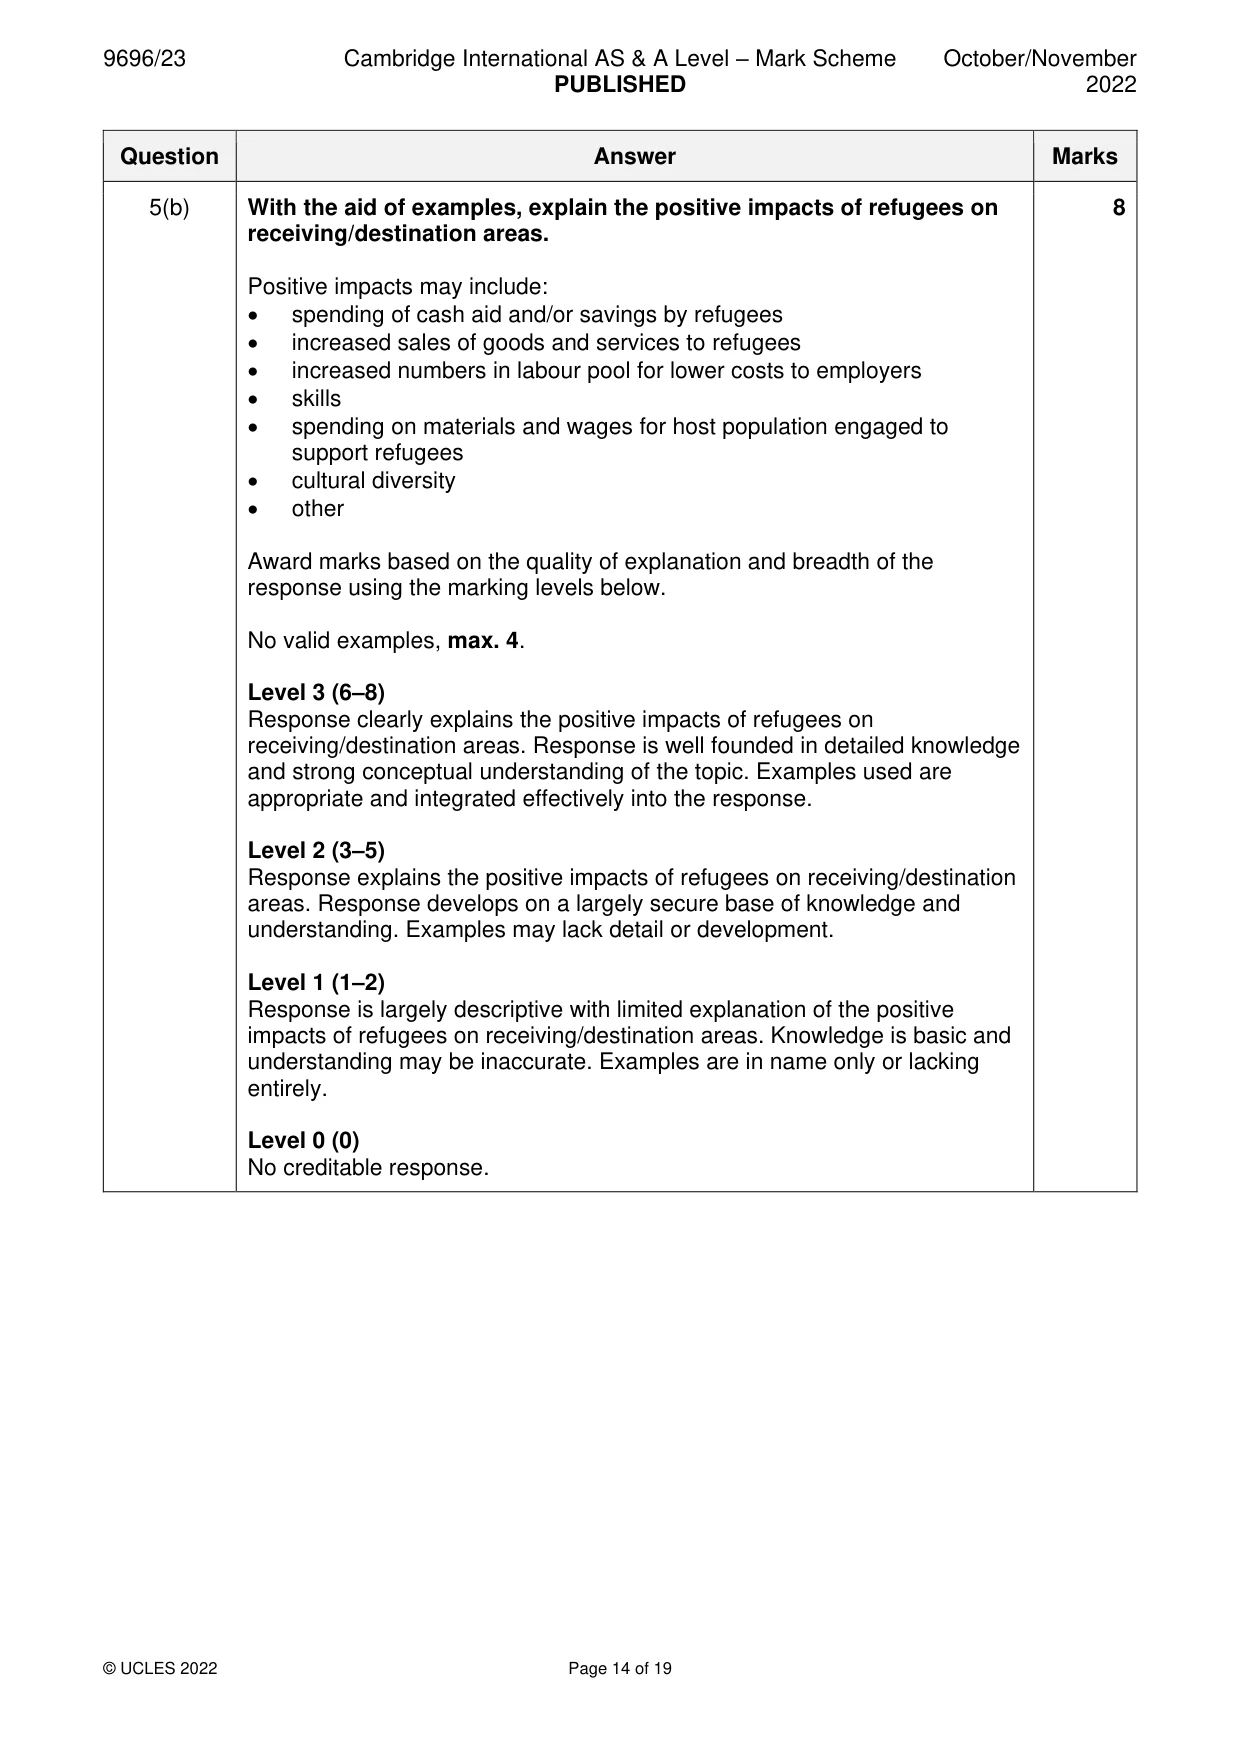
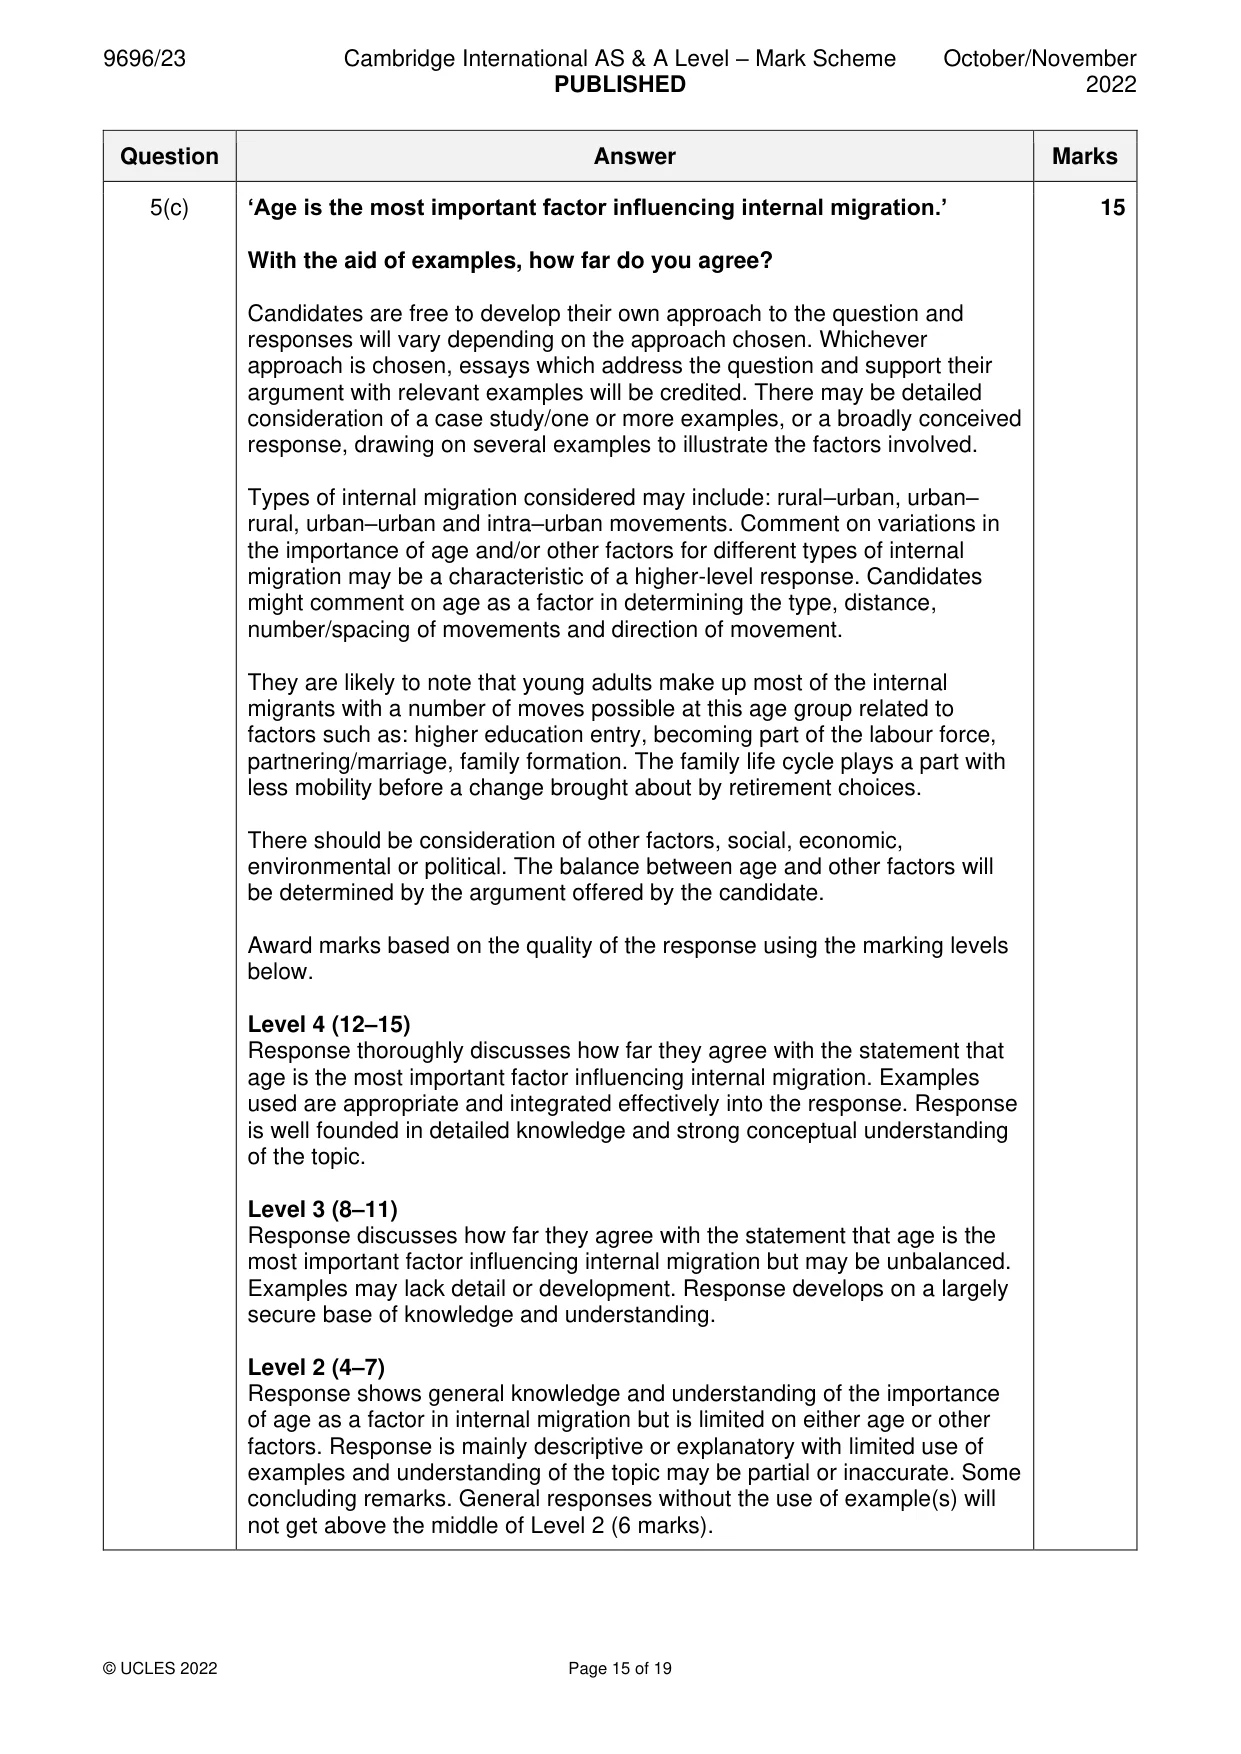
Mark scheme: 5(a) Describe the characteristics of refugee flows. 7 Characteristics could be: • the age/sex mix • level of education • ethnic or religious groups • cause of forced migration Accept references to pattern such as: • the source region(s) and destinations of the refugees • the numbers involved • distances • obstacles • modes of transport • timing/seasonality Point mark such that three valid points, with development (detail and/or examples) can achieve the max. 5(b) With the aid of examples, explain the positive impacts of refugees on 8 receiving/destination areas. Positive impacts may include: • spending of cash aid and/or savings by refugees • increased sales of goods and services to refugees • increased numbers in labour pool for lower costs to employers • skills • spending on materials and wages for host population engaged to support refugees • cultural diversity • other Award marks based on the quality of explanation and breadth of the response using the marking levels below. No valid examples, max. 4. Level 3 (6–8) Response clearly explains the positive impacts of refugees on receiving/destination areas. Response is well founded in detailed knowledge and strong conceptual understanding of the topic. Examples used are appropriate and integrated effectively into the response. Level 2 (3–5) Response explains the positive impacts of refugees on receiving/destination areas. Response develops on a largely secure base of knowledge and understanding. Examples may lack detail or development. Level 1 (1–2) Response is largely descriptive with limited explanation of the positive impacts of refugees on receiving/destination areas. Knowledge is basic and understanding may be inaccurate. Examples are in name only or lacking entirely. Level 0 (0) No creditable response. 5(c) ‘Age is the most important factor influencing internal migration.’ 15 With the aid of examples, how far do you agree? Candidates are free to develop their own approach to the question and responses will vary depending on the approach chosen. Whichever approach is chosen, essays which address the question and support their argument with relevant examples will be credited. There may be detailed consideration of a case study/one or more examples, or a broadly conceived response, drawing on several examples to illustrate the factors involved. Types of internal migration considered may include: rural–urban, urban– rural, urban–urban and intra–urban movements. Comment on variations in the importance of age and/or other factors for different types of internal migration may be a characteristic of a higher-level response. Candidates might comment on age as a factor in determining the type, distance, number/spacing of movements and direction of movement. They are likely to note that young adults make up most of the internal migrants with a number of moves possible at this age group related to factors such as: higher education entry, becoming part of the labour force, partnering/marriage, family formation. The family life cycle plays a part with less mobility before a change brought about by retirement choices. There should be consideration of other factors, social, economic, environmental or political. The balance between age and other factors will be determined by the argument offered by the candidate. Award marks based on the quality of the response using the marking levels below. Level 4 (12–15) Response thoroughly discusses how far they agree with the statement that age is the most important factor influencing internal migration. Examples used are appropriate and integrated effectively into the response. Response is well founded in detailed knowledge and strong conceptual understanding of the topic. Level 3 (8–11) Response discusses how far they agree with the statement that age is the most important factor influencing internal migration but may be unbalanced. Examples may lack detail or development. Response develops on a largely secure base of knowledge and understanding. Level 2 (4–7) Response shows general knowledge and understanding of the importance of age as a factor in internal migration but is limited on either age or other factors. Response is mainly descriptive or explanatory with limited use of examples and understanding of the topic may be partial or inaccurate. Some concluding remarks. General responses without the use of example(s) will not get above the middle of Level 2 (6 marks). 5(c) Level 1 (1–3) Response may broadly discuss internal migration but does not address the question and does not come to a convincing conclusion. Response is descriptive, knowledge is basic and understanding is poor. Level 0 (0) No creditable response. Settlement dynamics
Q6 · Describe two issues in rural settlements in HICs resulting from urban growth
6 (a) Describe two issues in rural settlements in HICs resulting from urban growth. [7] (b) With the aid of examples, explain why functional zonation occurs in urban areas. [8] (c) With the aid of examples, assess the extent to which residential segregation in urban settlements is caused by economic factors. [15]
Mark scheme: 6(a) Describe two issues in rural settlements in HICs resulting from urban 7 growth. Rural settlements vary in size from hamlets to villages and towns and in their proximity to centres of urban growth. These settlements themselves may well grow in population, area or other ways. Issues in rural settlements which are consequences of urban growth might include: • ageing population as young migrate from rural settlements and older people from growing urban areas move away from the urban areas • changes to land value and the housing market • loss of environmental quality in urban–rural fringe • traffic and pollution issues as settlements become dormitory villages • closure of traditional services • other 6(b) With the aid of examples, explain why functional zonation occurs in 8 urban areas. Functional zonation occurs in urban areas for a variety of reasons which may include: • bid-rent theory • residential zonation linked to sociological and economic theories • planning and government policy • accessibility and transport • physical factors • other factors Reference may be made to land use models. Award marks based on the quality of explanation and breadth of the response using the marking levels below. No valid examples, max. 4. Level 3 (6–8) Response clearly explains why functional zonation occurs in urban areas. Response is well founded in detailed knowledge and strong conceptual understanding of the topic. Examples used are appropriate and integrated effectively into the response. Level 2 (3–5) Response explains why functional zonation occurs in urban areas. Response develops on a largely secure base of knowledge and understanding. Examples may lack detail or development. Level 1 (1–2) Response is largely descriptive with limited explanation of why functional zonation occurs in urban areas. Knowledge is basic and understanding may be inaccurate. Examples are in name only or lacking entirely. Level 0 (0) No creditable response. 6(c) With the aid of examples, assess the extent to which residential 15 segregation in urban settlements is caused by economic factors. Candidates are free to develop their own approach to the question and responses will vary depending on the approach chosen. Whichever approach is chosen, essays which address the question and support their argument with relevant examples will be credited. There may be detailed consideration of a case study/one or more examples, or a broadly conceived response, drawing on several examples to illustrate the factors involved. Residential segregation may be caused by variations in income, race/ethnicity and by processes, e.g. operation of the housing market, influence of family and friends, culture and planning. Other factors to be considered include social, environmental and historical such that a better response will review the importance of economic factors and some other factors. These better responses may also be characterised by specific exemplar support and an understanding of the complexity of the factors and links between them. Award marks based on the quality of the response using the marking levels below. Level 4 (12–15) Response thoroughly discusses the extent to which residential segregation in urban settlements is caused by economic factors. Examples used are appropriate and integrated effectively into the response. Response is well founded in detailed knowledge and strong conceptual understanding of the topic. Level 3 (8–11) Response discusses the extent to which residential segregation in urban settlements is caused by economic factors but may be unbalanced. Examples may lack detail or development. Response develops on a largely secure base of knowledge and understanding. Level 2 (4–7) Response shows general knowledge and understanding of residential segregation in urban settlements. Response is mainly descriptive or explanatory with limited use of examples and understanding of the topic may be partial or inaccurate. Some concluding remarks. General responses without the use of example(s) will not get above the middle of Level 2 (6 marks). Level 1 (1–3) Response may broadly discuss residential segregation in urban settlements but does not address the question and does not come to a convincing conclusion. Response is descriptive, knowledge is basic and understanding is poor. Level 0 (0) No creditable response.
What was in this paper
The subtopics covered by these 6 questions, and how many questions each got. Open one in a new tab to see every Cambridge question on it.
What you needed in this session
Cambridge’s own grade thresholds for 2022 Oct/Nov, Paper 2 · Variant 3. A higher threshold means an easier paper — the bar moves with how the cohort did.