Cambridge A Level Geography 9696 — 2024 May/June Paper 2 · Variant 1
9696/21/M/J/24 · 6 questions · 60 marks · ≈68 min
The question paper and its mark scheme, free to read here and free to download. This is Cambridge’s own paper, exactly as it was sat.
Question paper4 pages

Mark scheme16 pages
Answers below. Sit the paper first if you are practising.

Questions as text
Q1 · The global pattern of average annual rate of population change (%), 2015–2020
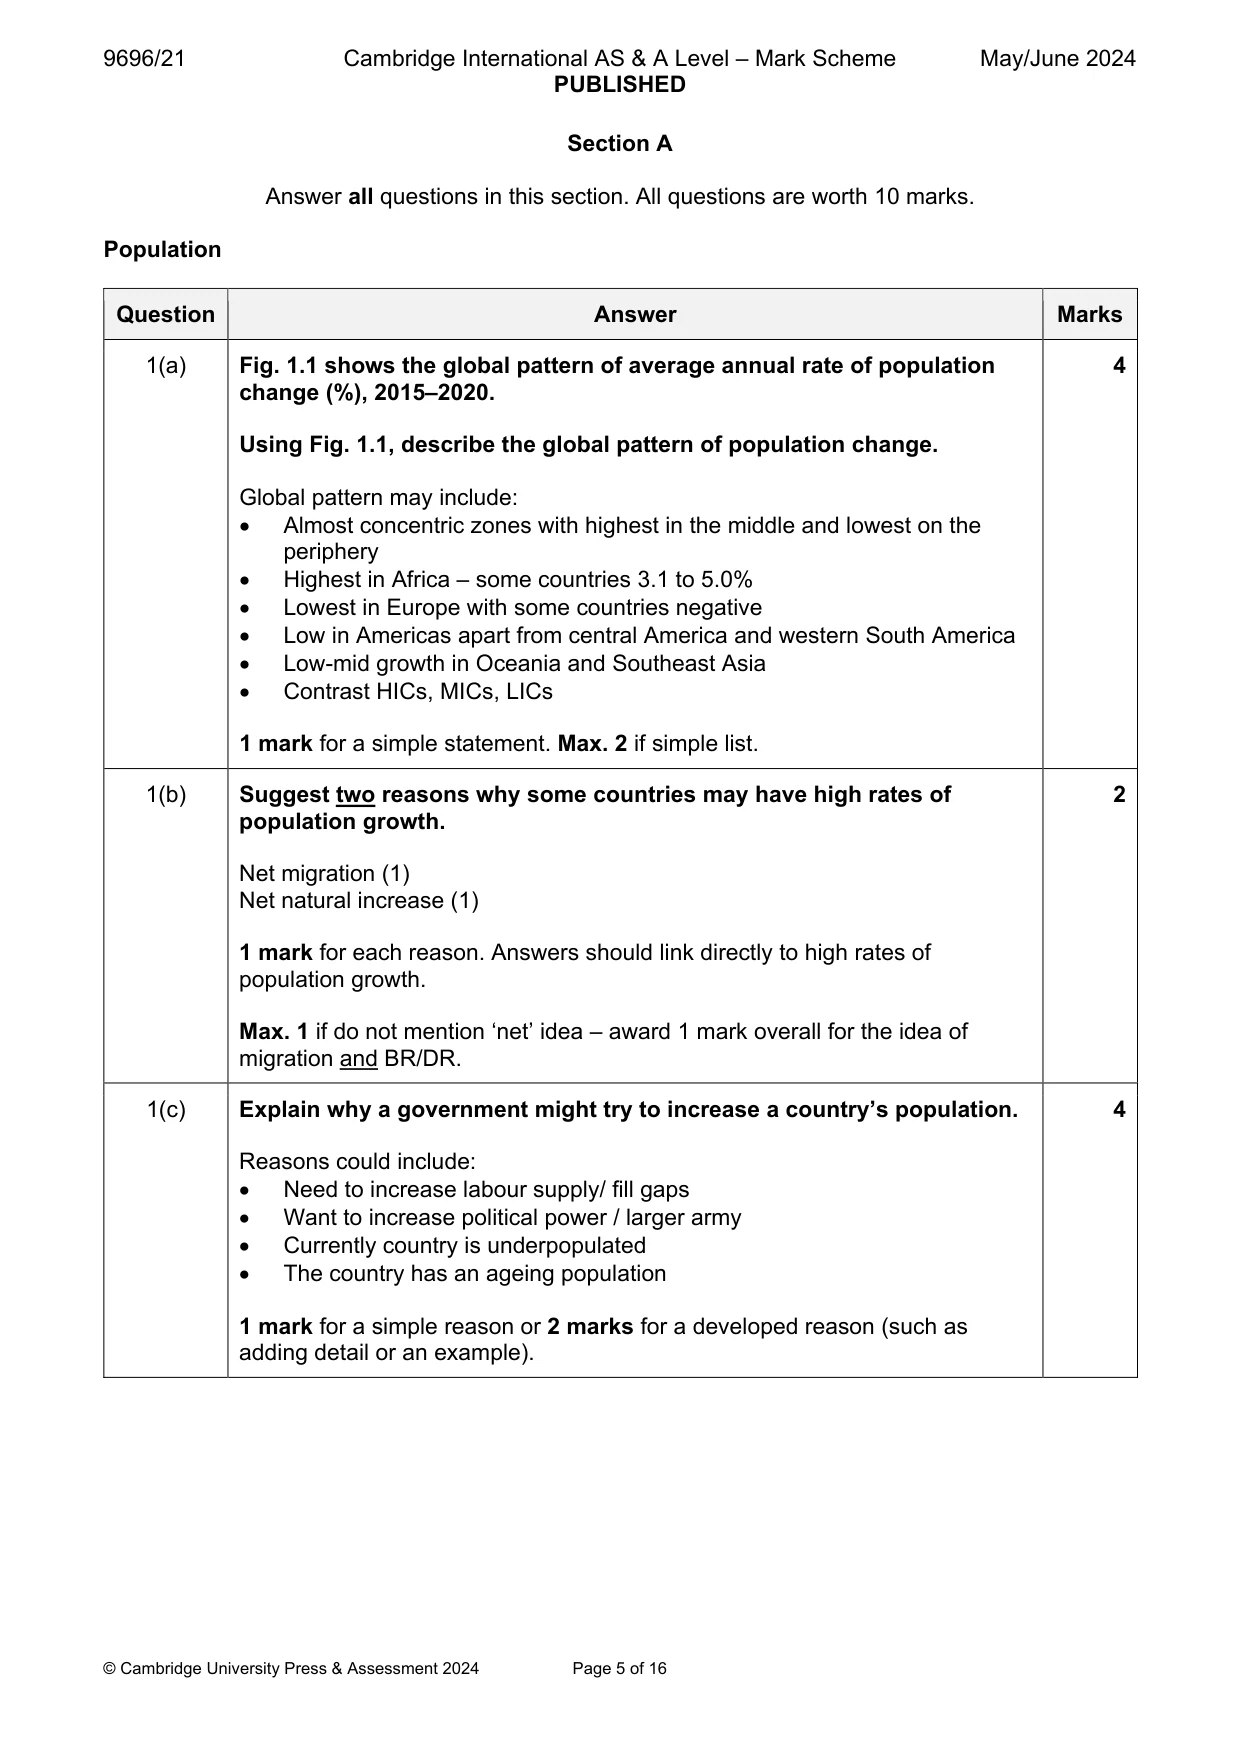
1 Fig. 1.1 shows the global pattern of average annual rate of population change (%), 2015–2020. (a) Using Fig. 1.1, describe the global pattern of population change. [4] (b) Suggest two reasons why some countries may have high rates of population growth. [2] (c) Explain why a government might try to increase a country’s population. [4] Migration
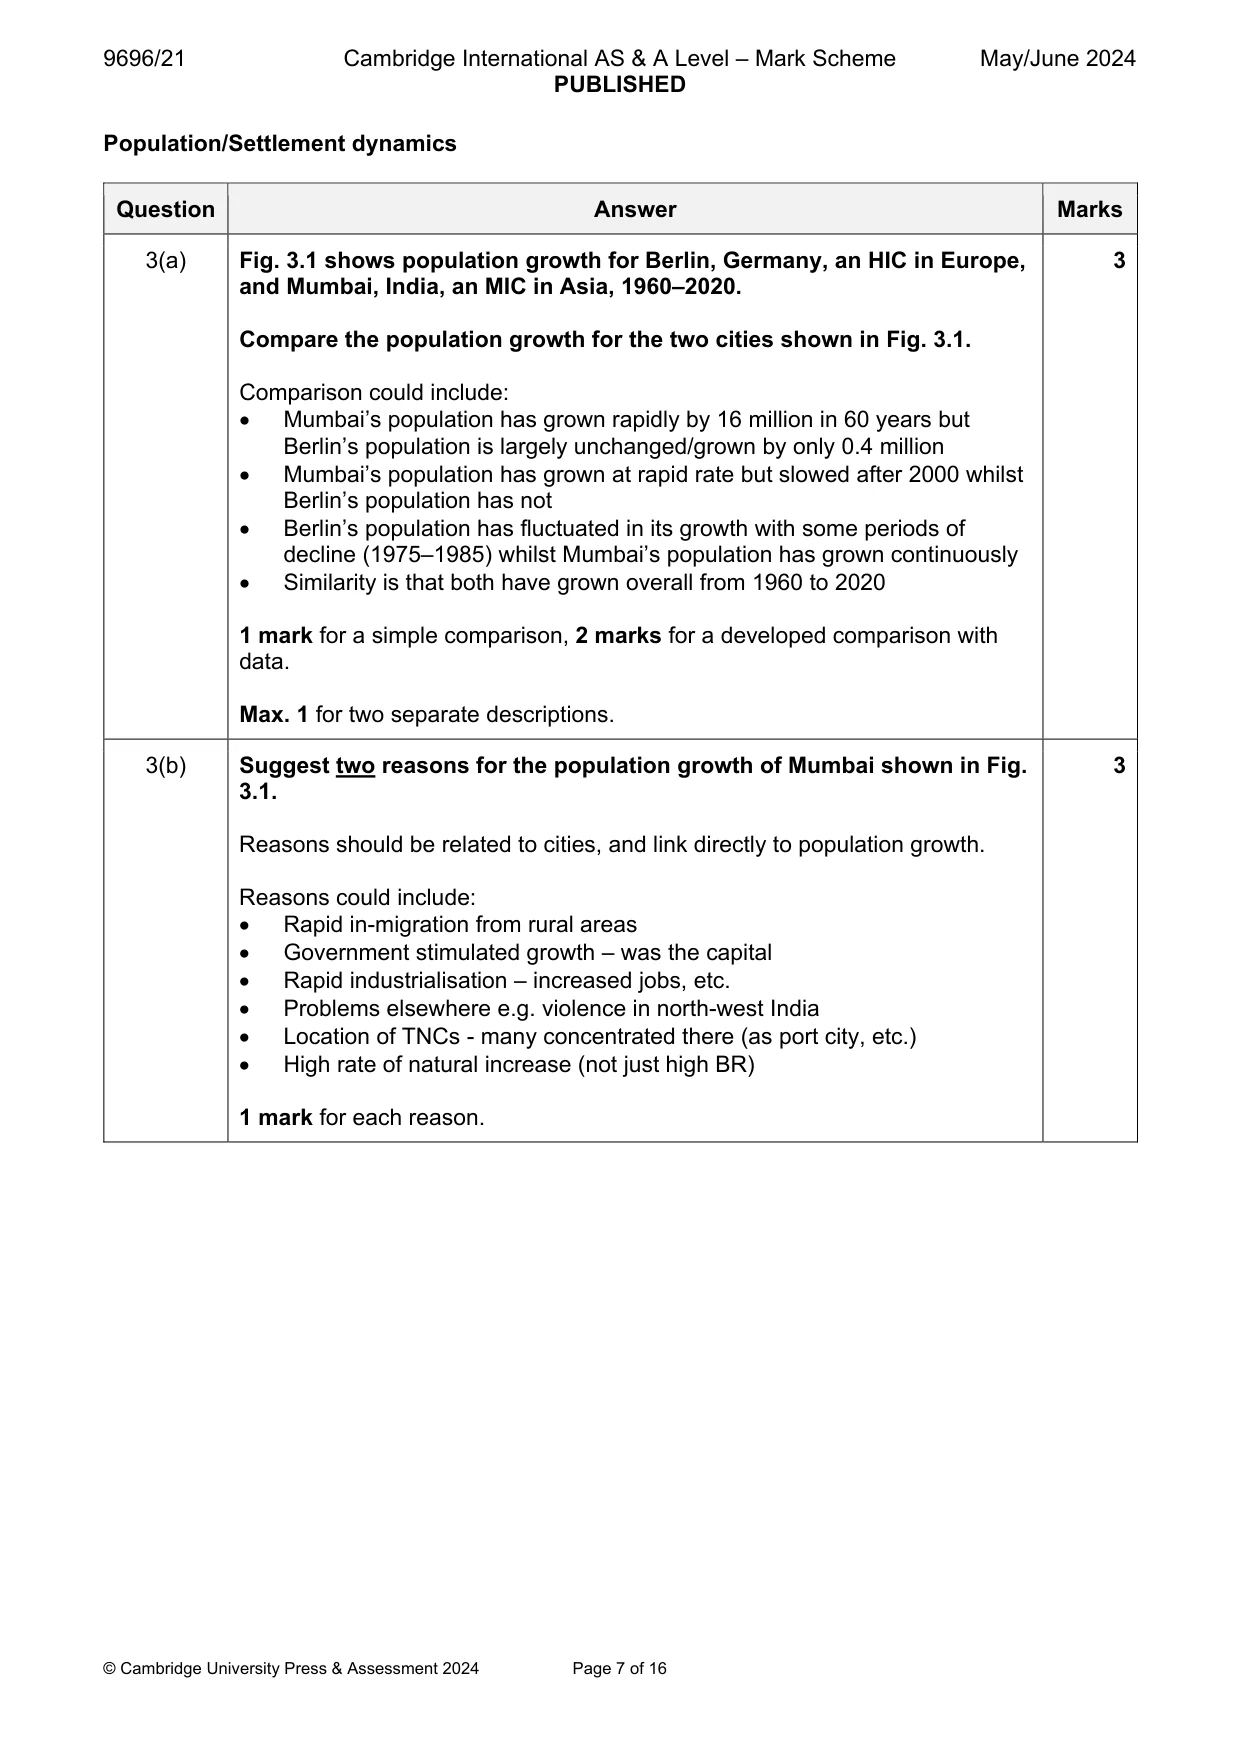
Mark scheme: Question Answer Marks 1(a) Fig. 1.1 shows the global pattern of average annual rate of population 4 change (%), 2015–2020. Using Fig. 1.1, describe the global pattern of population change. Global pattern may include: Almost concentric zones with highest in the middle and lowest on the periphery Highest in Africa – some countries 3.1 to 5.0% Lowest in Europe with some countries negative Low in Americas apart from central America and western South America Low-mid growth in Oceania and Southeast Asia Contrast HICs, MICs, LICs 1 mark for a simple statement. Max. 2 if simple list. 1(b) Suggest two reasons why some countries may have high rates of 2 population growth. Net migration (1) Net natural increase (1) 1 mark for each reason. Answers should link directly to high rates of population growth. Max. 1 if do not mention ‘net’ idea – award 1 mark overall for the idea of migration and BR/DR. 1(c) Explain why a government might try to increase a country’s population. 4 Reasons could include: Need to increase labour supply/ fill gaps Want to increase political power / larger army Currently country is underpopulated The country has an ageing population 1 mark for a simple reason or 2 marks for a developed reason (such as adding detail or an example). Migration
Q2 · Part of a refugee camp in Syria, an LIC in Asia, 2019
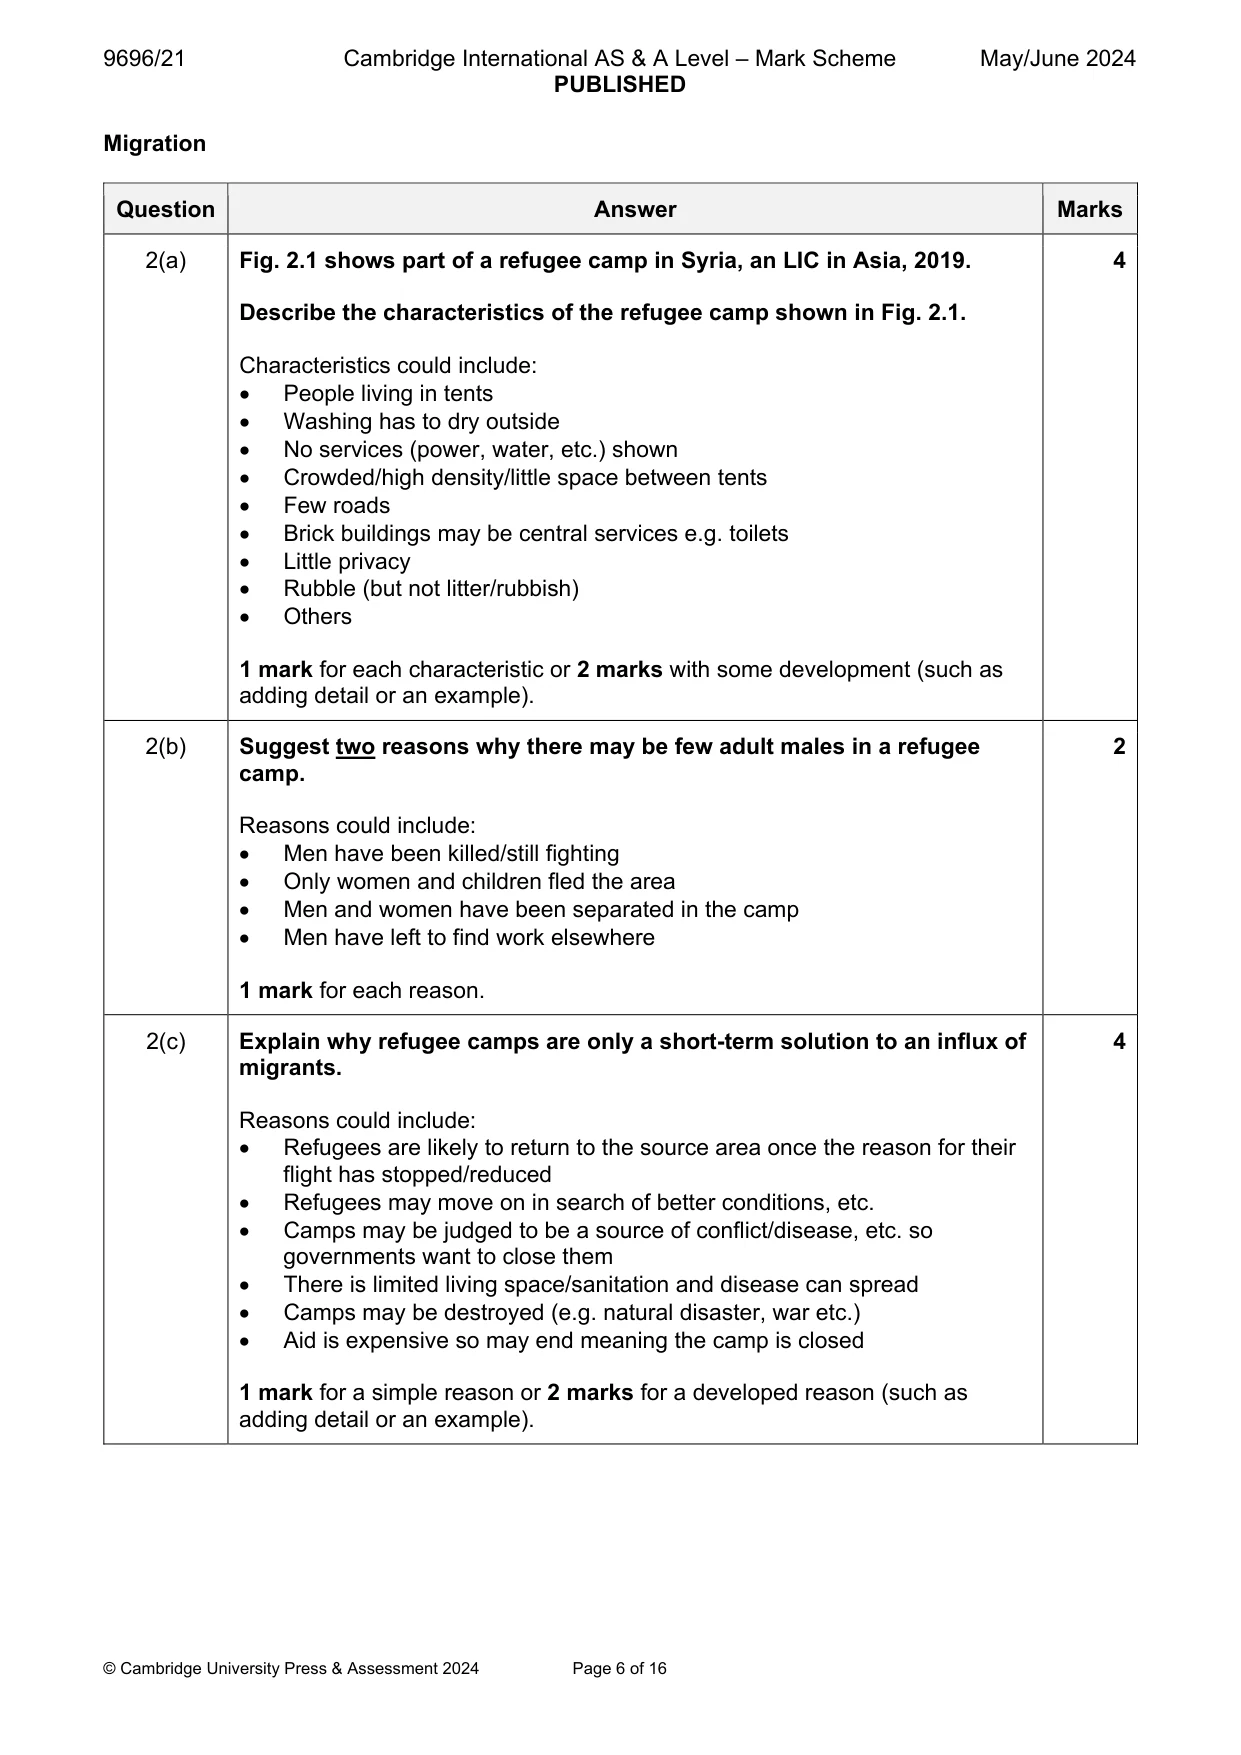
2 Fig. 2.1 shows part of a refugee camp in Syria, an LIC in Asia, 2019. (a) Describe the characteristics of the refugee camp shown in Fig. 2.1. [4] (b) Suggest two reasons why there may be few adult males in a refugee camp. [2] (c) Explain why refugee camps are only a short-term solution to an influx of migrants. [4] Population/Settlement dynamics
Mark scheme: 2(a) Fig. 2.1 shows part of a refugee camp in Syria, an LIC in Asia, 2019. 4 Describe the characteristics of the refugee camp shown in Fig. 2.1. Characteristics could include: People living in tents Washing has to dry outside No services (power, water, etc.) shown Crowded/high density/little space between tents Few roads Brick buildings may be central services e.g. toilets Little privacy Rubble (but not litter/rubbish) Others 1 mark for each characteristic or 2 marks with some development (such as adding detail or an example). 2(b) Suggest two reasons why there may be few adult males in a refugee 2 camp. Reasons could include: Men have been killed/still fighting Only women and children fled the area Men and women have been separated in the camp Men have left to find work elsewhere 1 mark for each reason. 2(c) Explain why refugee camps are only a short-term solution to an influx of 4 migrants. Reasons could include: Refugees are likely to return to the source area once the reason for their flight has stopped/reduced Refugees may move on in search of better conditions, etc. Camps may be judged to be a source of conflict/disease, etc. so governments want to close them There is limited living space/sanitation and disease can spread Camps may be destroyed (e.g. natural disaster, war etc.) Aid is expensive so may end meaning the camp is closed 1 mark for a simple reason or 2 marks for a developed reason (such as adding detail or an example). Population/Settlement dynamics
Q3 · Population growth for Berlin, Germany, an HIC in Europe, and Mumbai, India, an MIC in…
3 Fig. 3.1 shows population growth for Berlin, Germany, an HIC in Europe, and Mumbai, India, an MIC in Asia, 1960–2020. (a) Compare the population growth for the two cities shown in Fig. 3.1. [3] (b) Suggest two reasons for the population growth of Mumbai shown in Fig. 3.1. [3] (c) Explain why many cities in HICs are declining in population. [4]
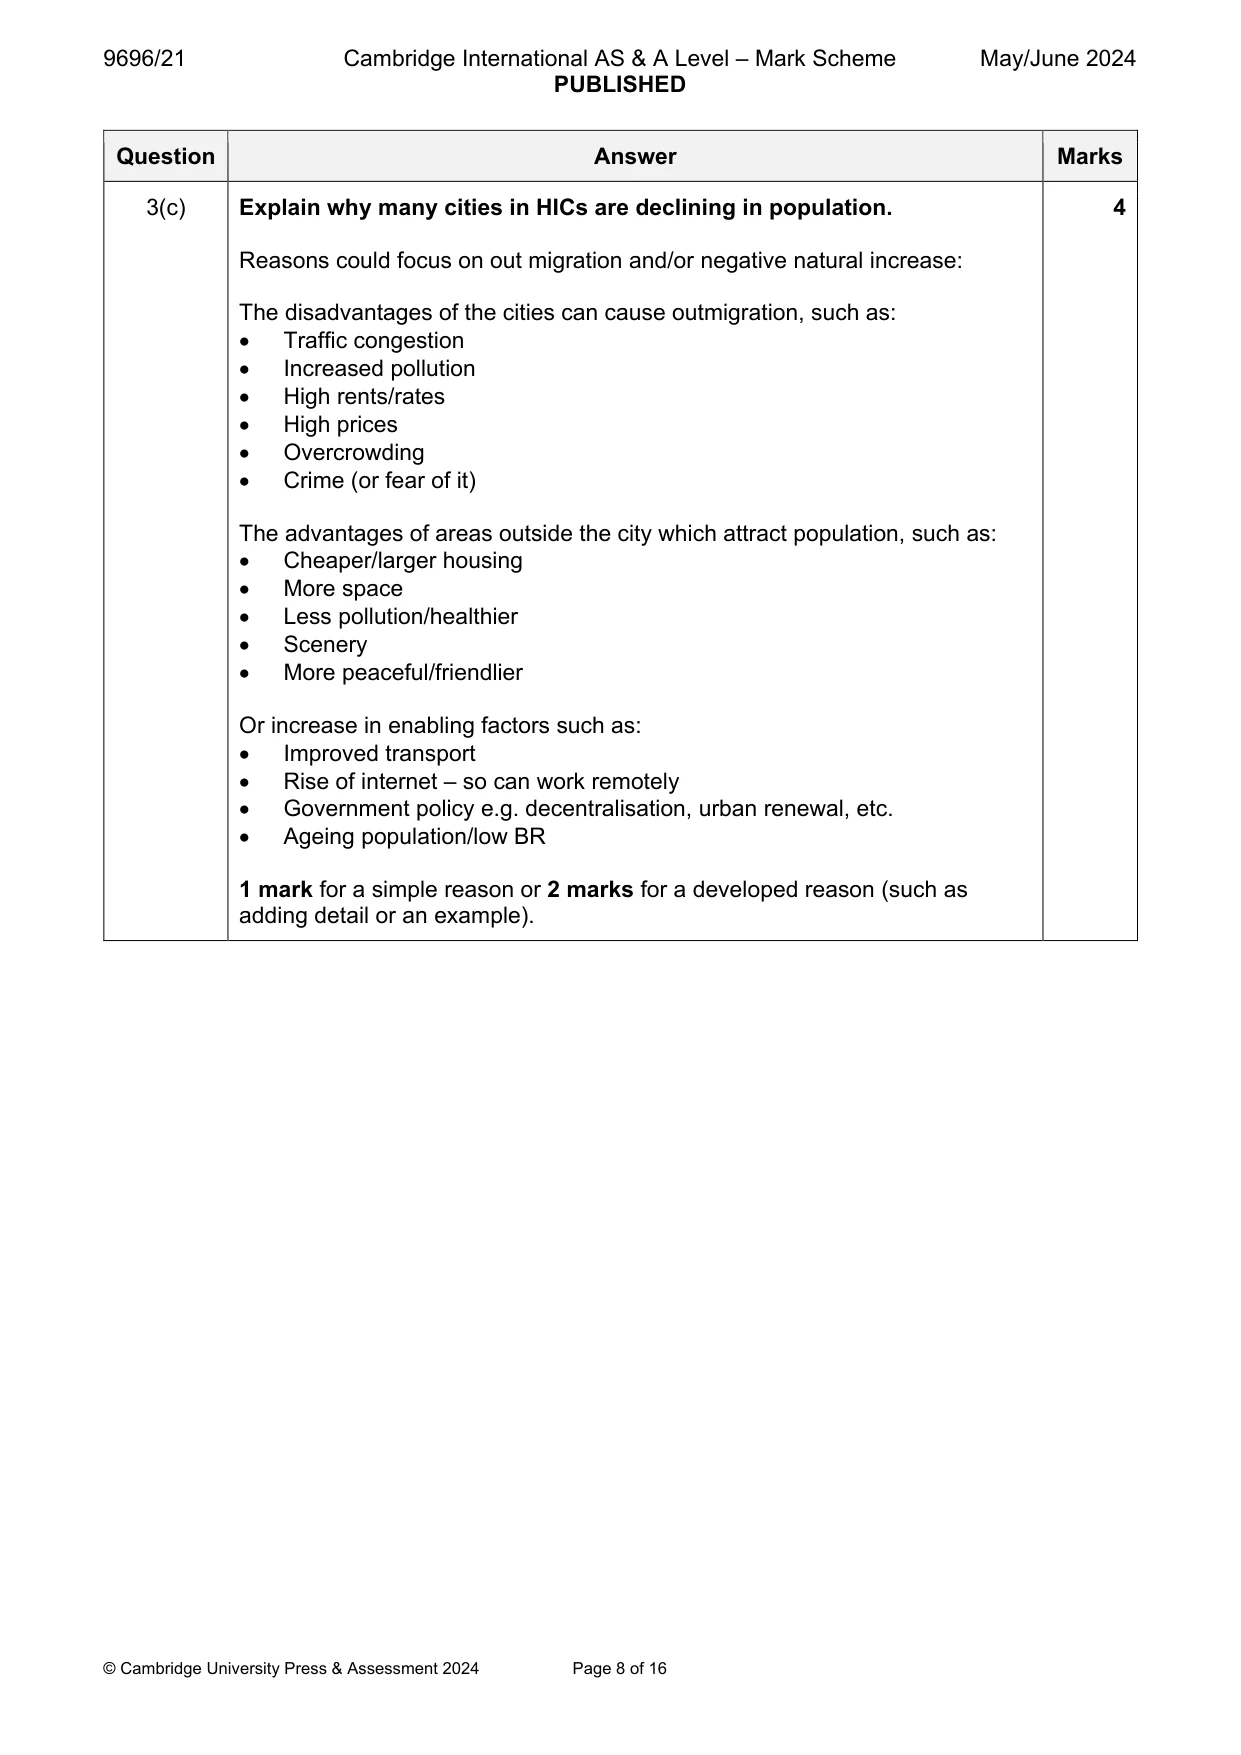
Mark scheme: 3(a) Fig. 3.1 shows population growth for Berlin, Germany, an HIC in Europe, 3 and Mumbai, India, an MIC in Asia, 1960–2020. Compare the population growth for the two cities shown in Fig. 3.1. Comparison could include: Mumbai’s population has grown rapidly by 16 million in 60 years but Berlin’s population is largely unchanged/grown by only 0.4 million Mumbai’s population has grown at rapid rate but slowed after 2000 whilst Berlin’s population has not Berlin’s population has fluctuated in its growth with some periods of decline (1975–1985) whilst Mumbai’s population has grown continuously Similarity is that both have grown overall from 1960 to 2020 1 mark for a simple comparison, 2 marks for a developed comparison with data. Max. 1 for two separate descriptions. 3(b) Suggest two reasons for the population growth of Mumbai shown in Fig. 3 3.1. Reasons should be related to cities, and link directly to population growth. Reasons could include: Rapid in-migration from rural areas Government stimulated growth – was the capital Rapid industrialisation – increased jobs, etc. Problems elsewhere e.g. violence in north-west India Location of TNCs - many concentrated there (as port city, etc.) High rate of natural increase (not just high BR) 1 mark for each reason. 3(c) Explain why many cities in HICs are declining in population. 4 Reasons could focus on out migration and/or negative natural increase: The disadvantages of the cities can cause outmigration, such as: Traffic congestion Increased pollution High rents/rates High prices Overcrowding Crime (or fear of it) The advantages of areas outside the city which attract population, such as: Cheaper/larger housing More space Less pollution/healthier Scenery More peaceful/friendlier Or increase in enabling factors such as: Improved transport Rise of internet – so can work remotely Government policy e.g. decentralisation, urban renewal, etc. Ageing population/low BR 1 mark for a simple reason or 2 marks for a developed reason (such as adding detail or an example). Section B Answer one question from this section. All questions are worth 30 marks. Population
Q4 · Describe the causes of food shortages
4 (a) Describe the causes of food shortages. [7] (b) With the aid of examples, explain the consequences of food shortages. [8] (c) With the aid of examples, assess the extent to which technology is the solution to food shortages in LICs/MICs. [15] Population/Migration
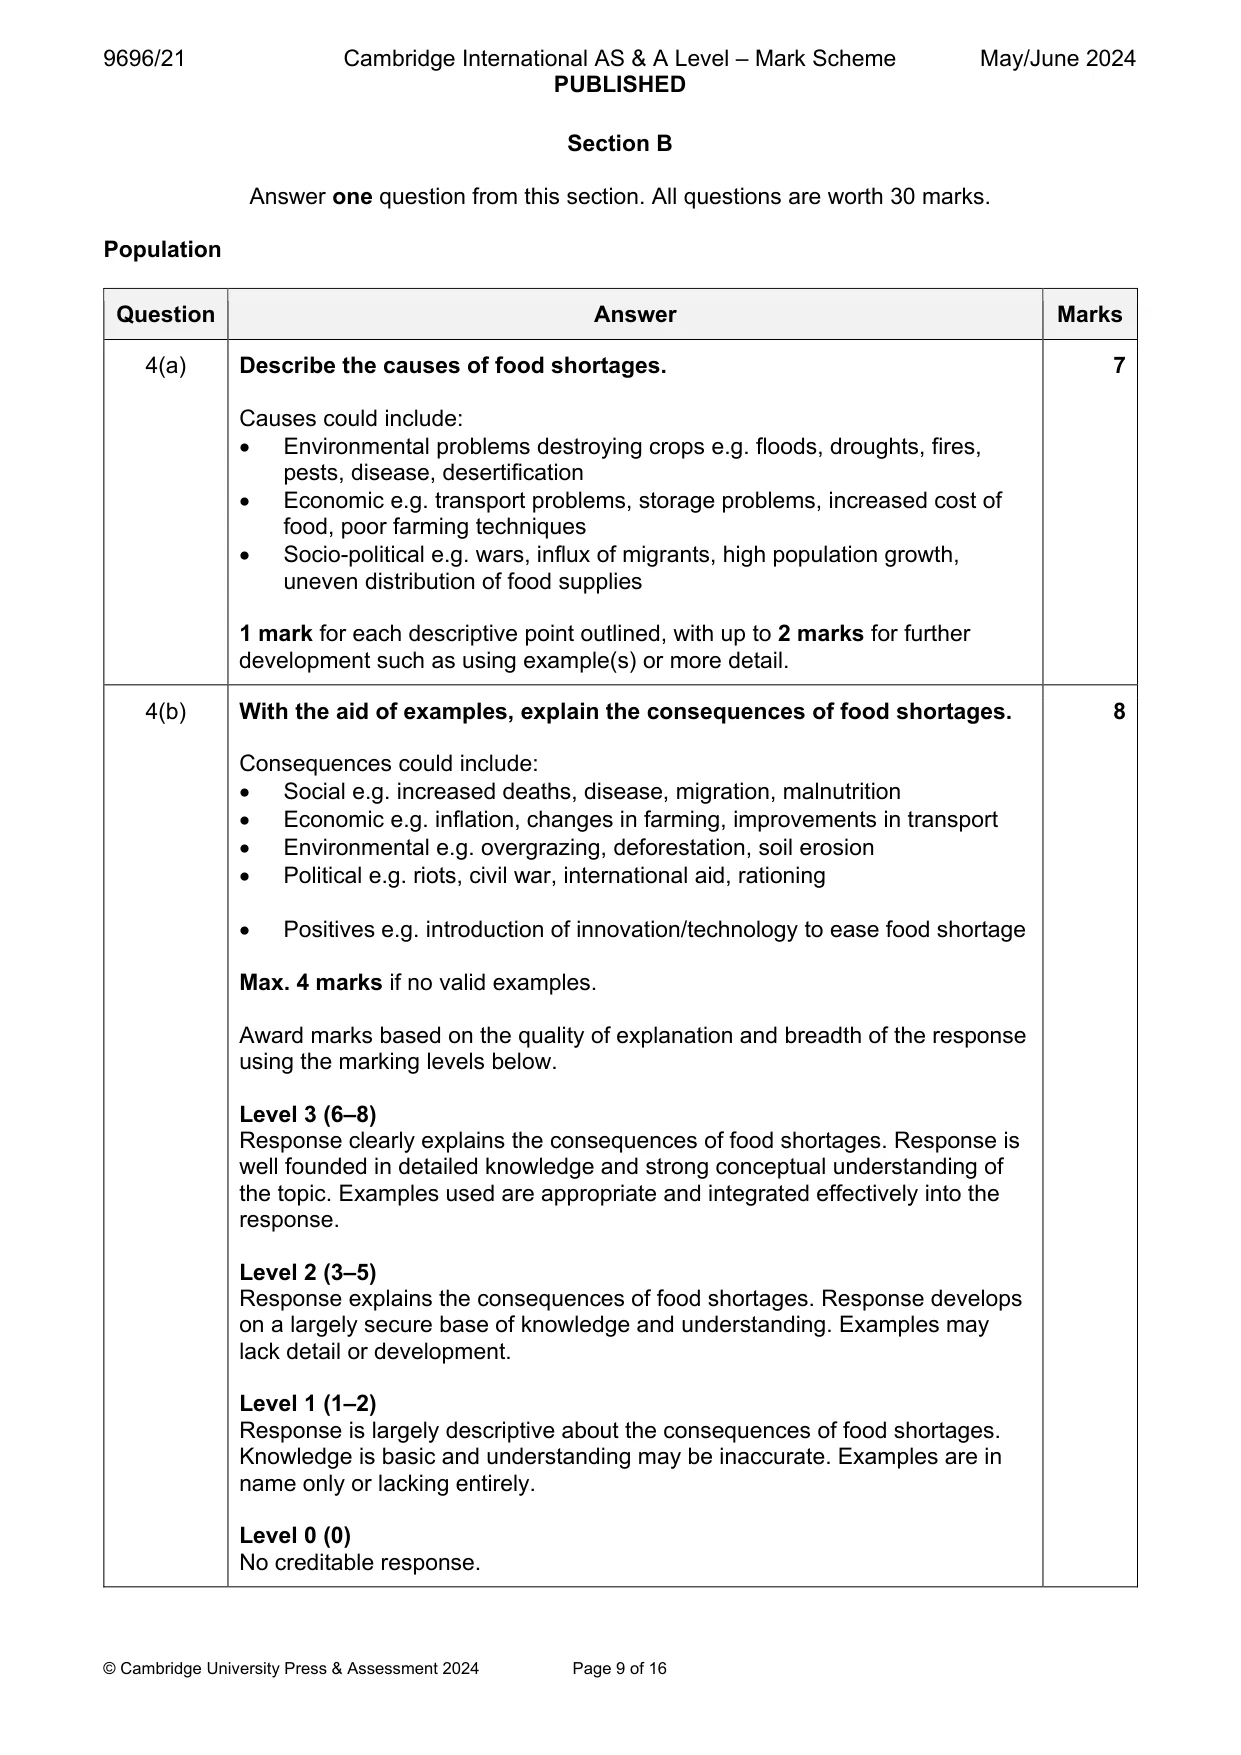
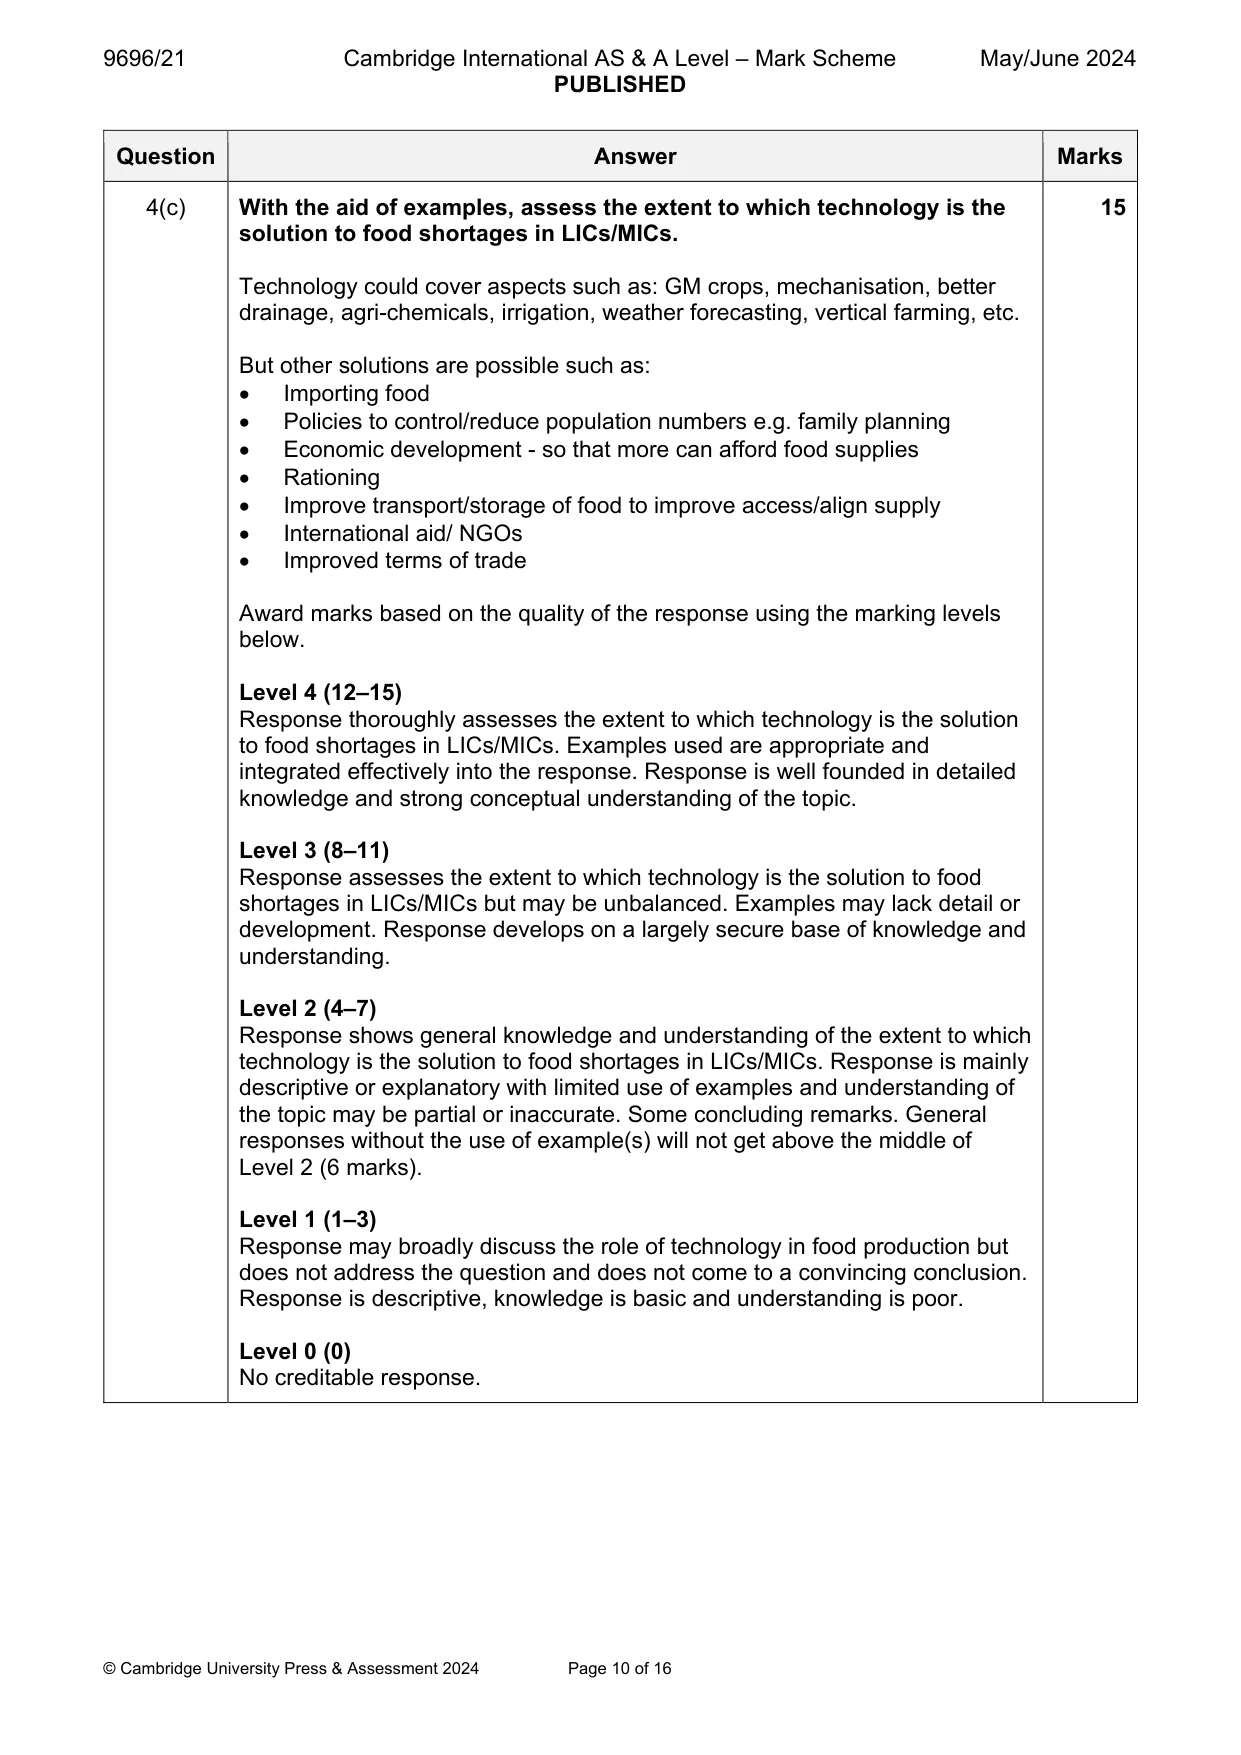
Mark scheme: 4(a) Describe the causes of food shortages. 7 Causes could include: Environmental problems destroying crops e.g. floods, droughts, fires, pests, disease, desertification Economic e.g. transport problems, storage problems, increased cost of food, poor farming techniques Socio-political e.g. wars, influx of migrants, high population growth, uneven distribution of food supplies 1 mark for each descriptive point outlined, with up to 2 marks for further development such as using example(s) or more detail. 4(b) With the aid of examples, explain the consequences of food shortages. 8 Consequences could include: Social e.g. increased deaths, disease, migration, malnutrition Economic e.g. inflation, changes in farming, improvements in transport Environmental e.g. overgrazing, deforestation, soil erosion Political e.g. riots, civil war, international aid, rationing Positives e.g. introduction of innovation/technology to ease food shortage Max. 4 marks if no valid examples. Award marks based on the quality of explanation and breadth of the response using the marking levels below. Level 3 (6–8) Response clearly explains the consequences of food shortages. Response is well founded in detailed knowledge and strong conceptual understanding of the topic. Examples used are appropriate and integrated effectively into the response. Level 2 (3–5) Response explains the consequences of food shortages. Response develops on a largely secure base of knowledge and understanding. Examples may lack detail or development. Level 1 (1–2) Response is largely descriptive about the consequences of food shortages. Knowledge is basic and understanding may be inaccurate. Examples are in name only or lacking entirely. Level 0 (0) No creditable response. 4(c) With the aid of examples, assess the extent to which technology is the 15 solution to food shortages in LICs/MICs. Technology could cover aspects such as: GM crops, mechanisation, better drainage, agri-chemicals, irrigation, weather forecasting, vertical farming, etc. But other solutions are possible such as: Importing food Policies to control/reduce population numbers e.g. family planning Economic development - so that more can afford food supplies Rationing Improve transport/storage of food to improve access/align supply International aid/ NGOs Improved terms of trade Award marks based on the quality of the response using the marking levels below. Level 4 (12–15) Response thoroughly assesses the extent to which technology is the solution to food shortages in LICs/MICs. Examples used are appropriate and integrated effectively into the response. Response is well founded in detailed knowledge and strong conceptual understanding of the topic. Level 3 (8–11) Response assesses the extent to which technology is the solution to food shortages in LICs/MICs but may be unbalanced. Examples may lack detail or development. Response develops on a largely secure base of knowledge and understanding. Level 2 (4–7) Response shows general knowledge and understanding of the extent to which technology is the solution to food shortages in LICs/MICs. Response is mainly descriptive or explanatory with limited use of examples and understanding of the topic may be partial or inaccurate. Some concluding remarks. General responses without the use of example(s) will not get above the middle of Level 2 (6 marks). Level 1 (1–3) Response may broadly discuss the role of technology in food production but does not address the question and does not come to a convincing conclusion. Response is descriptive, knowledge is basic and understanding is poor. Level 0 (0) No creditable response. Population/Migration
Q5 · With the aid of examples, describe the difference between obstacles, constraints and…
5 (a) With the aid of examples, describe the difference between obstacles, constraints and barriers to migration. [7] (b) With the aid of examples, explain why governments might attempt to control internal migration. [8] (c) ‘Improvements in transport is the main reason for the global increase in international migration.’ With the aid of examples, how far do you agree with this view? [15] Population/Migration/Settlement dynamics
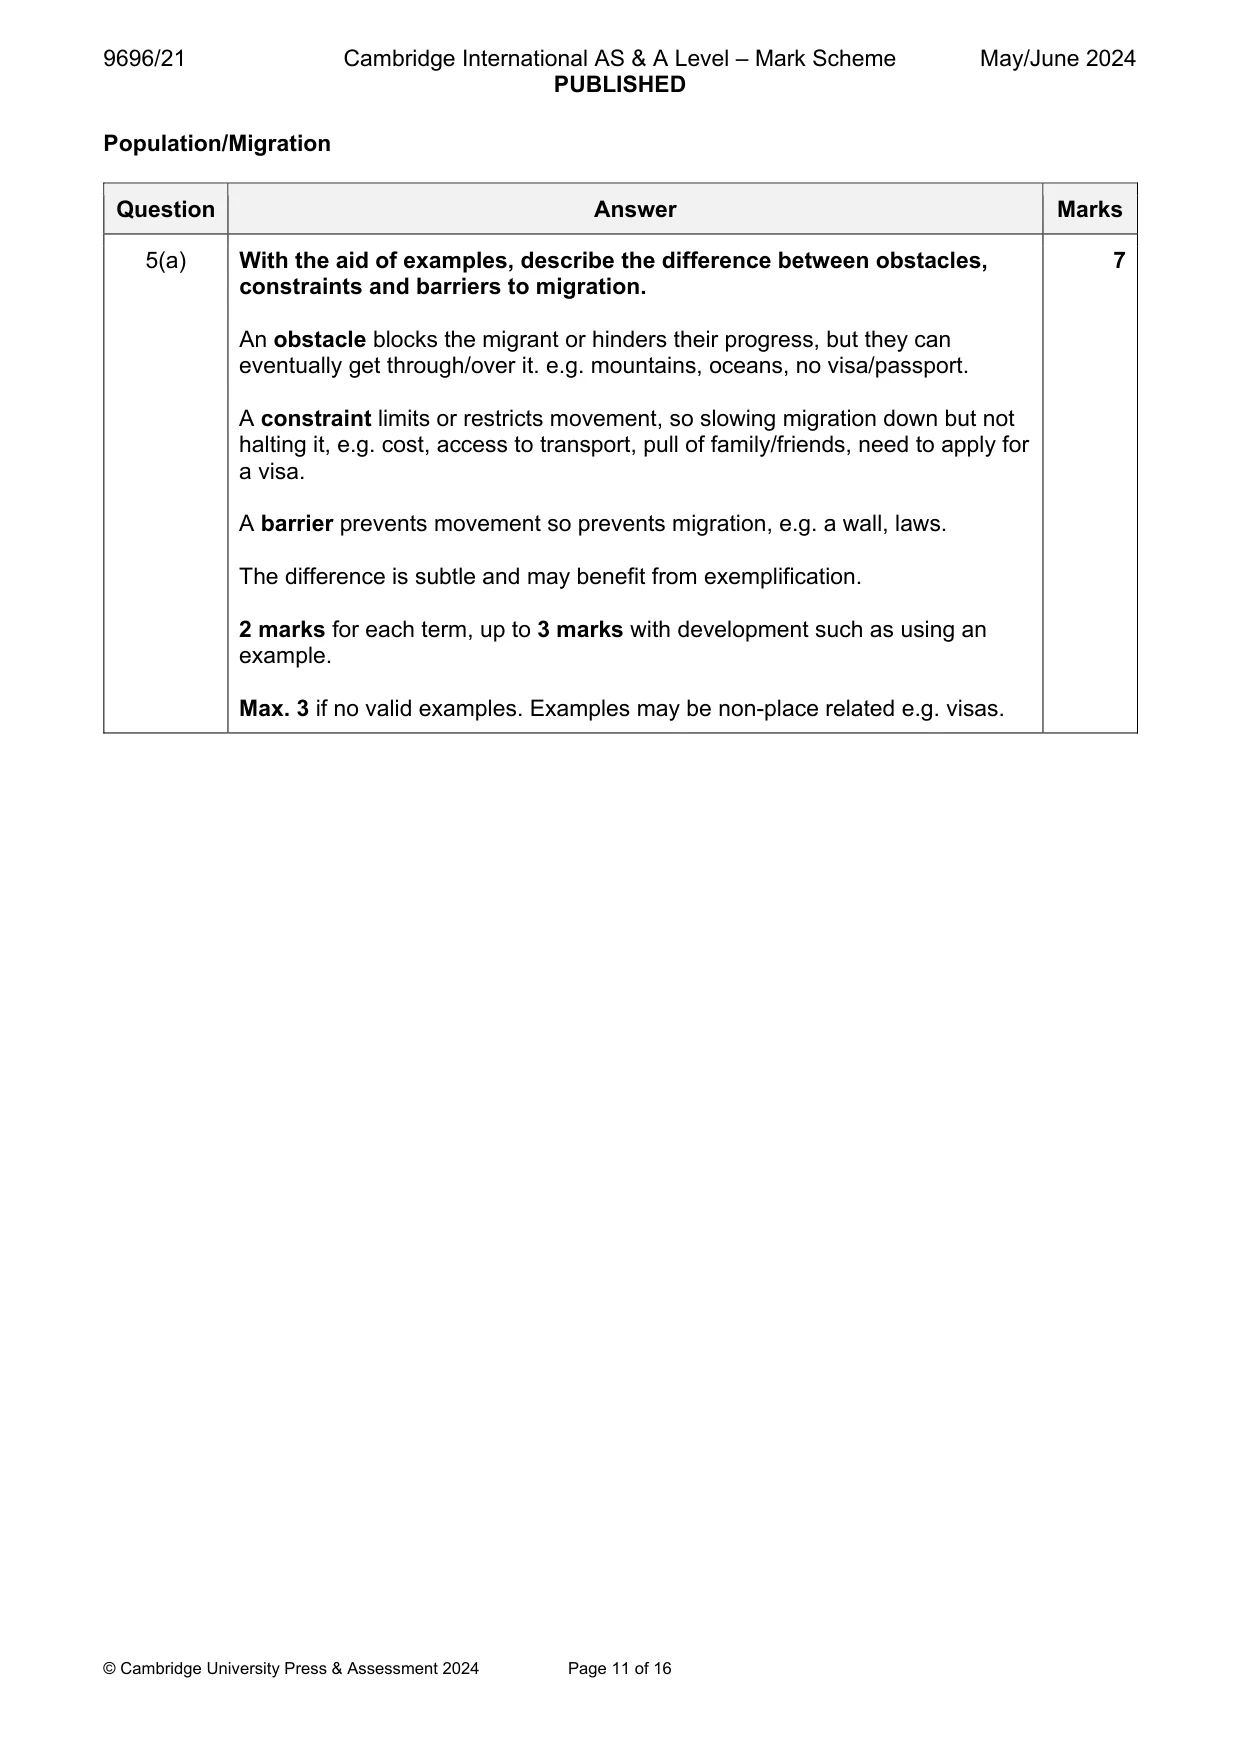
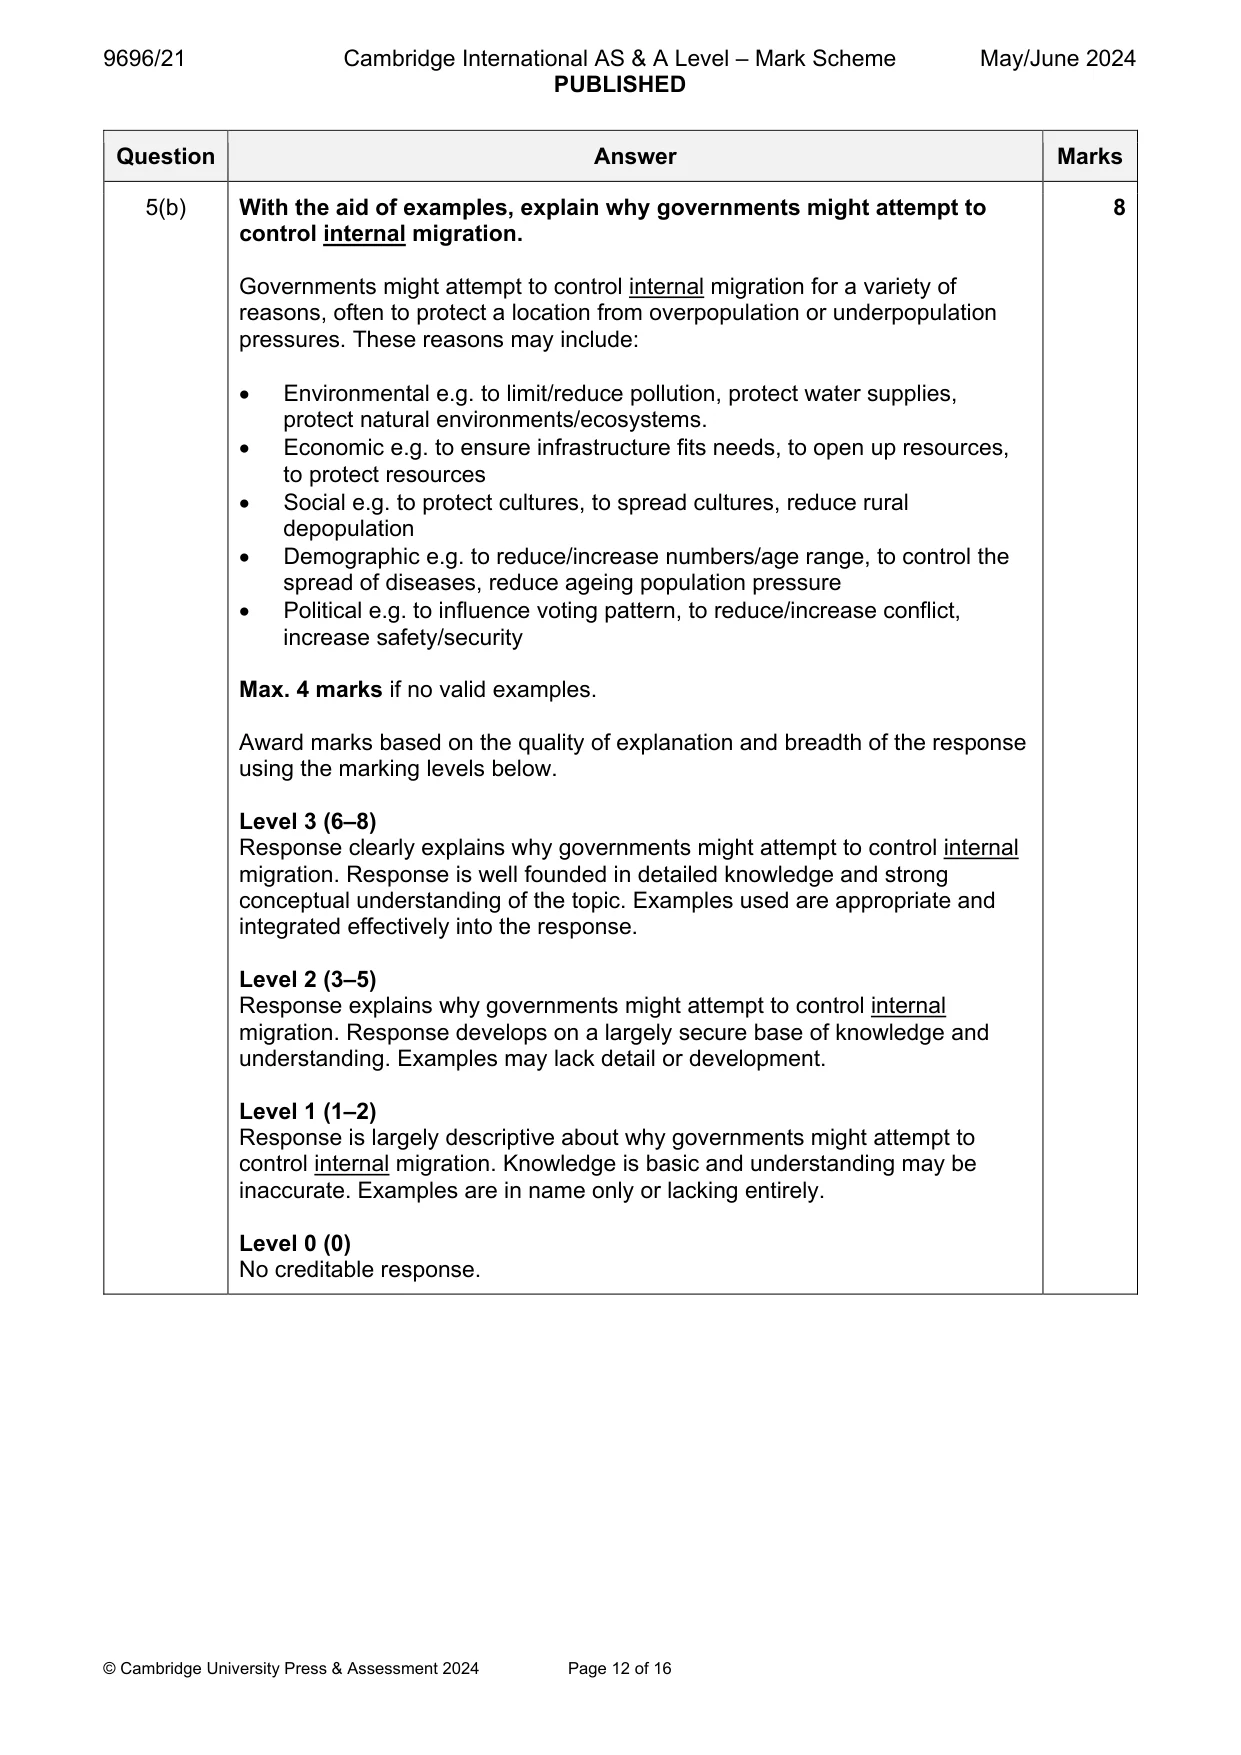
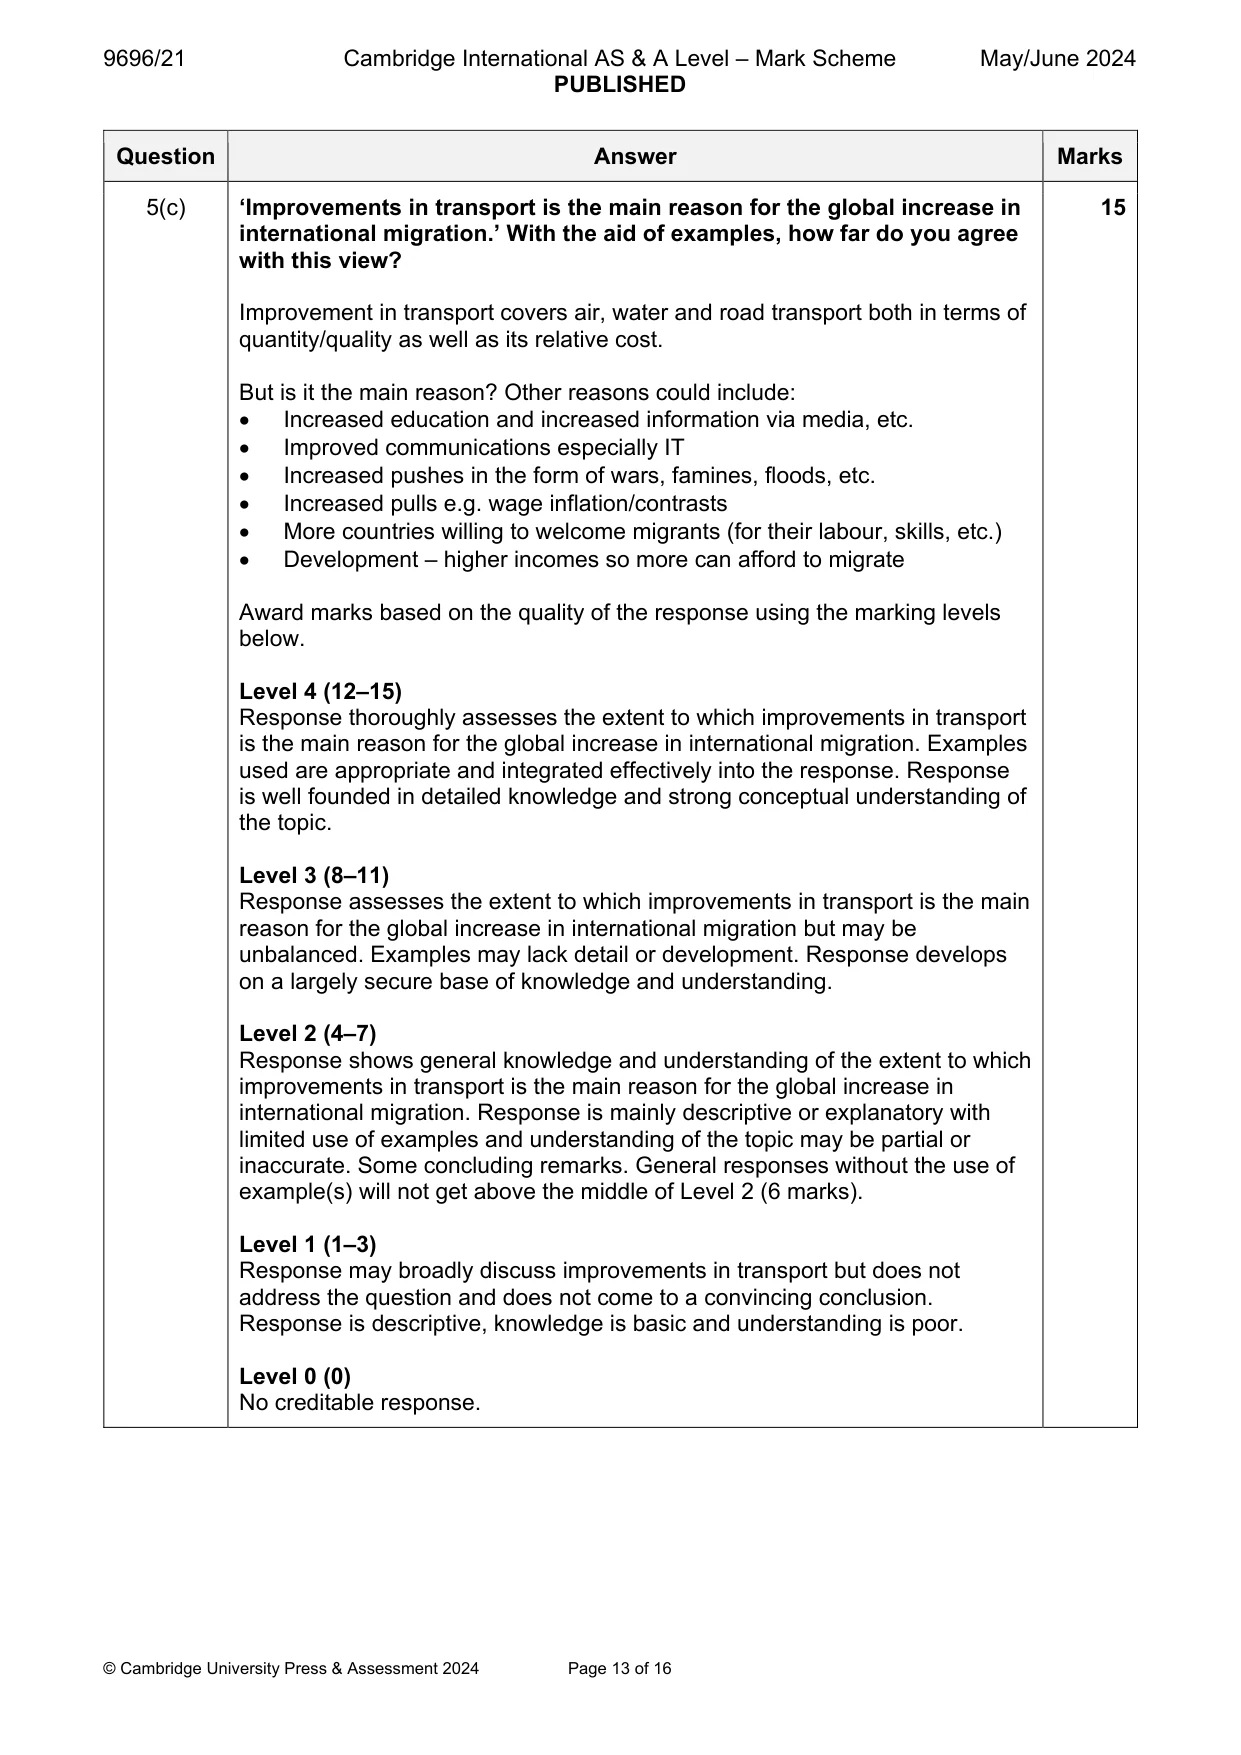
Mark scheme: 5(a) With the aid of examples, describe the difference between obstacles, 7 constraints and barriers to migration. An obstacle blocks the migrant or hinders their progress, but they can eventually get through/over it. e.g. mountains, oceans, no visa/passport. A constraint limits or restricts movement, so slowing migration down but not halting it, e.g. cost, access to transport, pull of family/friends, need to apply for a visa. A barrier prevents movement so prevents migration, e.g. a wall, laws. The difference is subtle and may benefit from exemplification. 2 marks for each term, up to 3 marks with development such as using an example. Max. 3 if no valid examples. Examples may be non-place related e.g. visas. 5(b) With the aid of examples, explain why governments might attempt to 8 control internal migration. Governments might attempt to control internal migration for a variety of reasons, often to protect a location from overpopulation or underpopulation pressures. These reasons may include: Environmental e.g. to limit/reduce pollution, protect water supplies, protect natural environments/ecosystems. Economic e.g. to ensure infrastructure fits needs, to open up resources, to protect resources Social e.g. to protect cultures, to spread cultures, reduce rural depopulation Demographic e.g. to reduce/increase numbers/age range, to control the spread of diseases, reduce ageing population pressure Political e.g. to influence voting pattern, to reduce/increase conflict, increase safety/security Max. 4 marks if no valid examples. Award marks based on the quality of explanation and breadth of the response using the marking levels below. Level 3 (6–8) Response clearly explains why governments might attempt to control internal migration. Response is well founded in detailed knowledge and strong conceptual understanding of the topic. Examples used are appropriate and integrated effectively into the response. Level 2 (3–5) Response explains why governments might attempt to control internal migration. Response develops on a largely secure base of knowledge and understanding. Examples may lack detail or development. Level 1 (1–2) Response is largely descriptive about why governments might attempt to control internal migration. Knowledge is basic and understanding may be inaccurate. Examples are in name only or lacking entirely. Level 0 (0) No creditable response. 5(c) ‘Improvements in transport is the main reason for the global increase in 15 international migration.’ With the aid of examples, how far do you agree with this view? Improvement in transport covers air, water and road transport both in terms of quantity/quality as well as its relative cost. But is it the main reason? Other reasons could include: Increased education and increased information via media, etc. Improved communications especially IT Increased pushes in the form of wars, famines, floods, etc. Increased pulls e.g. wage inflation/contrasts More countries willing to welcome migrants (for their labour, skills, etc.) Development – higher incomes so more can afford to migrate Award marks based on the quality of the response using the marking levels below. Level 4 (12–15) Response thoroughly assesses the extent to which improvements in transport is the main reason for the global increase in international migration. Examples used are appropriate and integrated effectively into the response. Response is well founded in detailed knowledge and strong conceptual understanding of the topic. Level 3 (8–11) Response assesses the extent to which improvements in transport is the main reason for the global increase in international migration but may be unbalanced. Examples may lack detail or development. Response develops on a largely secure base of knowledge and understanding. Level 2 (4–7) Response shows general knowledge and understanding of the extent to which improvements in transport is the main reason for the global increase in international migration. Response is mainly descriptive or explanatory with limited use of examples and understanding of the topic may be partial or inaccurate. Some concluding remarks. General responses without the use of example(s) will not get above the middle of Level 2 (6 marks). Level 1 (1–3) Response may broadly discuss improvements in transport but does not address the question and does not come to a convincing conclusion. Response is descriptive, knowledge is basic and understanding is poor. Level 0 (0) No creditable response. Population/Migration/Settlement dynamics
Q6 · With the aid of examples, describe the functional zonation that may occur in cities in…
6 (a) With the aid of examples, describe the functional zonation that may occur in cities in HICs. [7] (b) With the aid of examples, explain the causes of functional zonation in cities. [8] (c) ‘Very large cities in LICs/MICs often have negative consequences for countries.’ With the aid of examples, how far do you agree? [15]
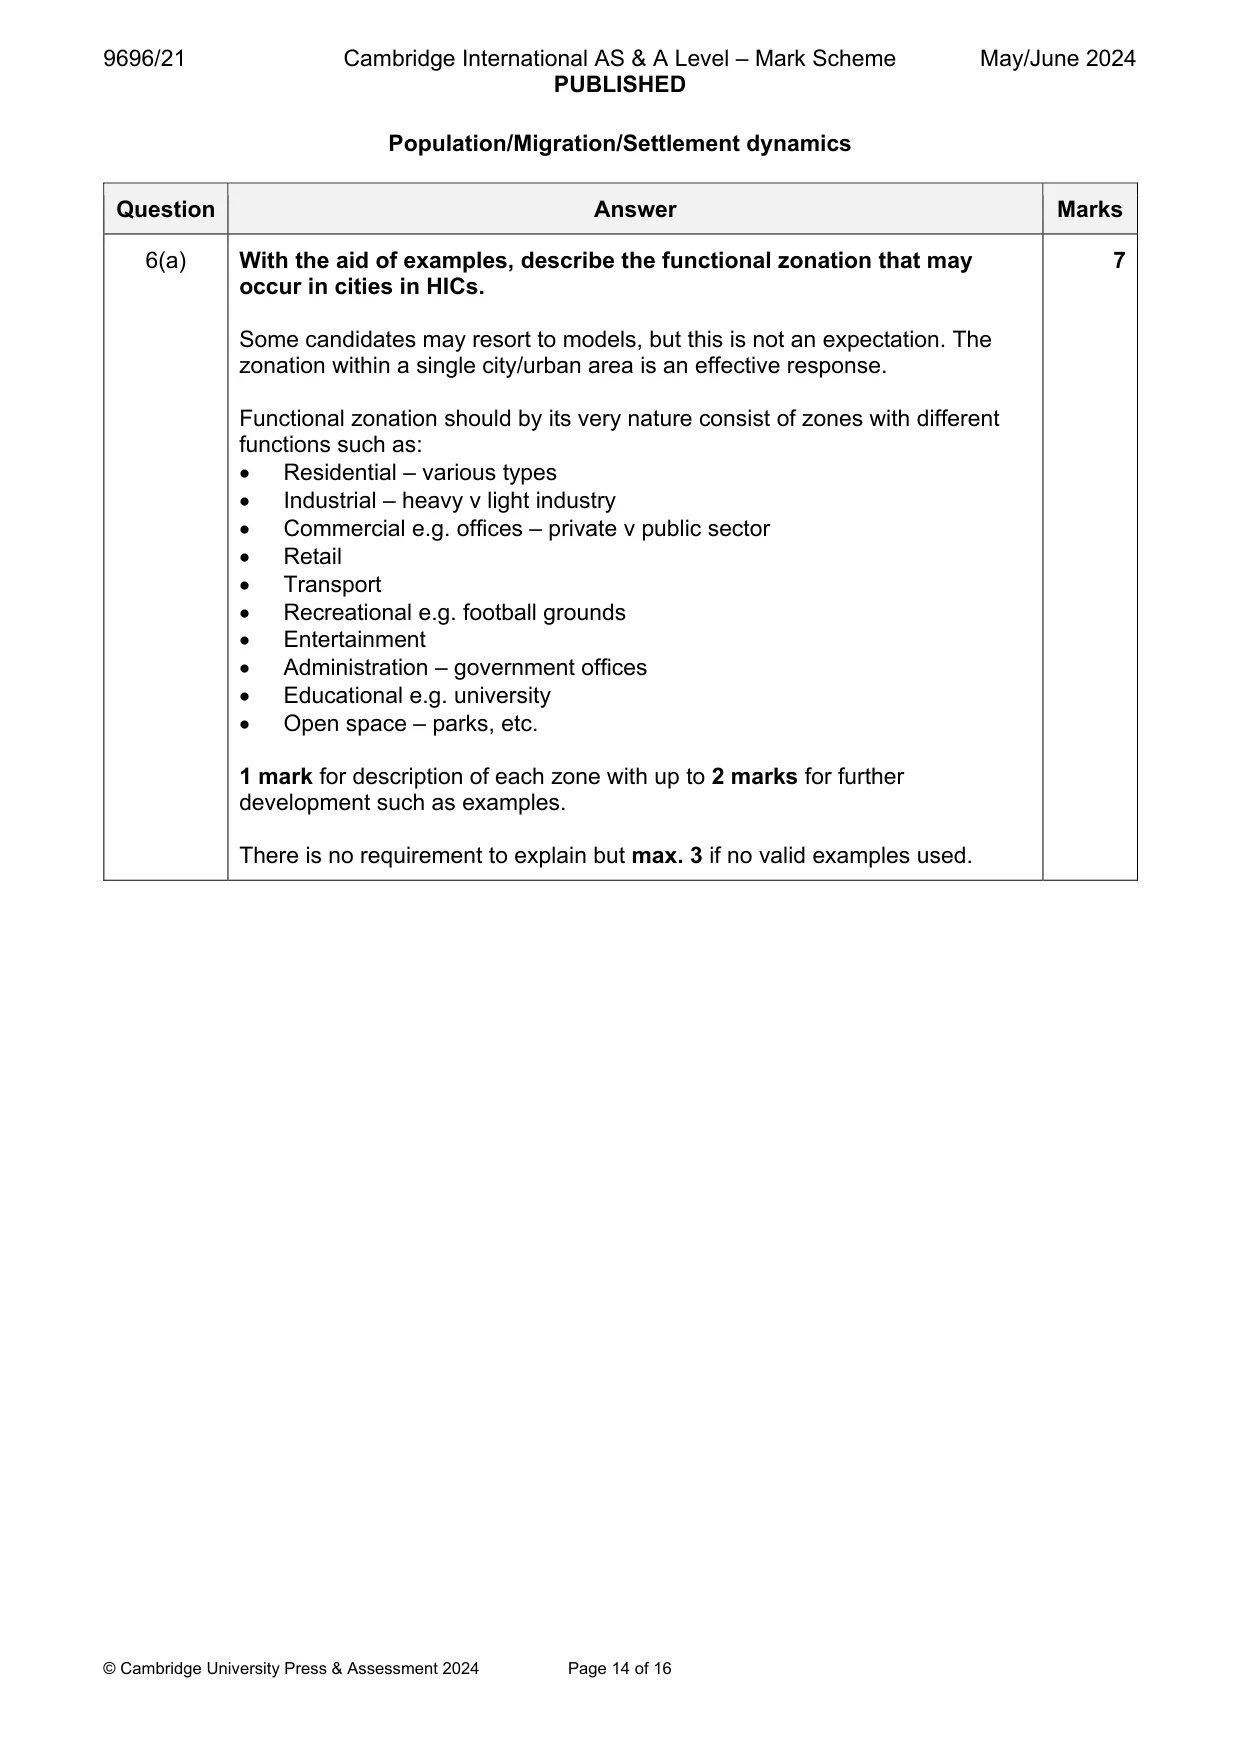
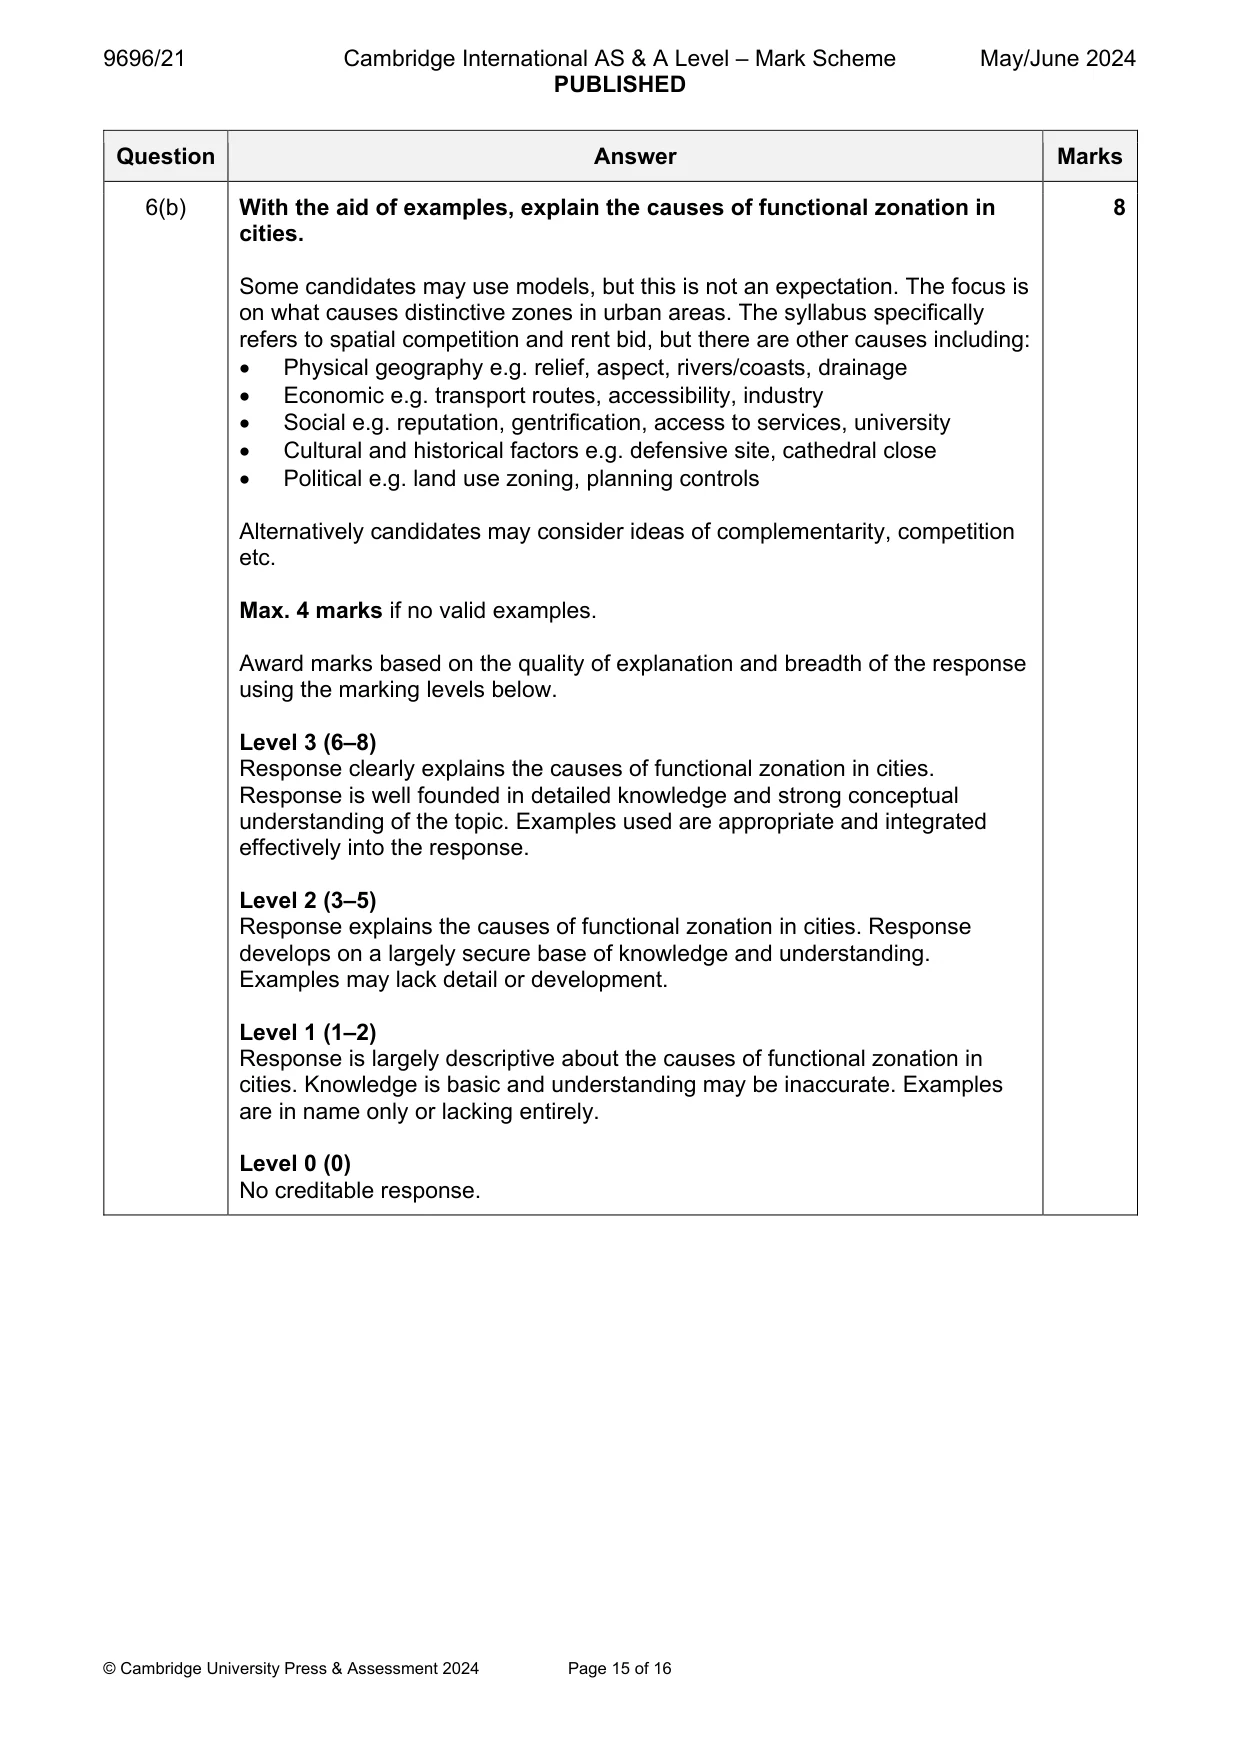
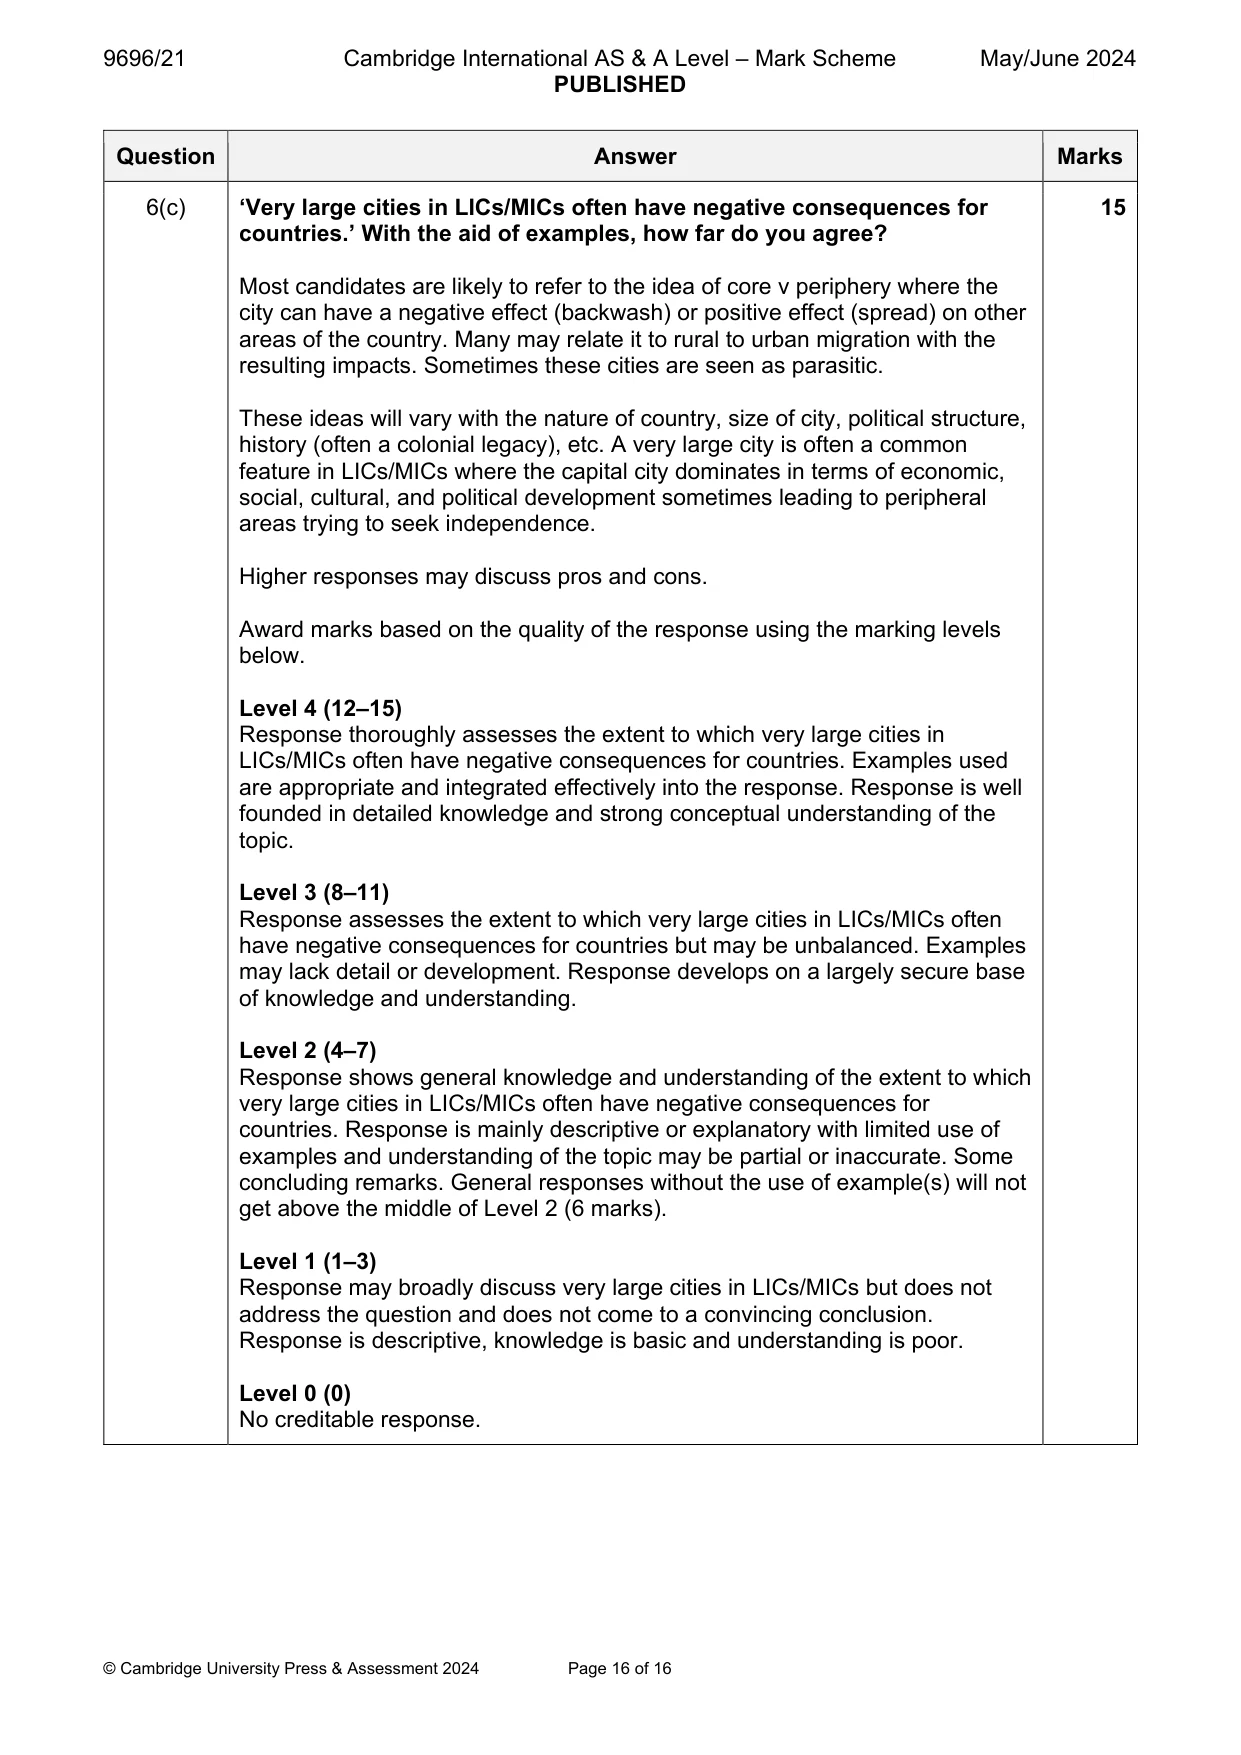
Mark scheme: 6(a) With the aid of examples, describe the functional zonation that may 7 occur in cities in HICs. Some candidates may resort to models, but this is not an expectation. The zonation within a single city/urban area is an effective response. Functional zonation should by its very nature consist of zones with different functions such as: Residential – various types Industrial – heavy v light industry Commercial e.g. offices – private v public sector Retail Transport Recreational e.g. football grounds Entertainment Administration – government offices Educational e.g. university Open space – parks, etc. 1 mark for description of each zone with up to 2 marks for further development such as examples. There is no requirement to explain but max. 3 if no valid examples used. 6(b) With the aid of examples, explain the causes of functional zonation in 8 cities. Some candidates may use models, but this is not an expectation. The focus is on what causes distinctive zones in urban areas. The syllabus specifically refers to spatial competition and rent bid, but there are other causes including: Physical geography e.g. relief, aspect, rivers/coasts, drainage Economic e.g. transport routes, accessibility, industry Social e.g. reputation, gentrification, access to services, university Cultural and historical factors e.g. defensive site, cathedral close Political e.g. land use zoning, planning controls Alternatively candidates may consider ideas of complementarity, competition etc. Max. 4 marks if no valid examples. Award marks based on the quality of explanation and breadth of the response using the marking levels below. Level 3 (6–8) Response clearly explains the causes of functional zonation in cities. Response is well founded in detailed knowledge and strong conceptual understanding of the topic. Examples used are appropriate and integrated effectively into the response. Level 2 (3–5) Response explains the causes of functional zonation in cities. Response develops on a largely secure base of knowledge and understanding. Examples may lack detail or development. Level 1 (1–2) Response is largely descriptive about the causes of functional zonation in cities. Knowledge is basic and understanding may be inaccurate. Examples are in name only or lacking entirely. Level 0 (0) No creditable response. 6(c) ‘Very large cities in LICs/MICs often have negative consequences for 15 countries.’ With the aid of examples, how far do you agree? Most candidates are likely to refer to the idea of core v periphery where the city can have a negative effect (backwash) or positive effect (spread) on other areas of the country. Many may relate it to rural to urban migration with the resulting impacts. Sometimes these cities are seen as parasitic. These ideas will vary with the nature of country, size of city, political structure, history (often a colonial legacy), etc. A very large city is often a common feature in LICs/MICs where the capital city dominates in terms of economic, social, cultural, and political development sometimes leading to peripheral areas trying to seek independence. Higher responses may discuss pros and cons. Award marks based on the quality of the response using the marking levels below. Level 4 (12–15) Response thoroughly assesses the extent to which very large cities in LICs/MICs often have negative consequences for countries. Examples used are appropriate and integrated effectively into the response. Response is well founded in detailed knowledge and strong conceptual understanding of the topic. Level 3 (8–11) Response assesses the extent to which very large cities in LICs/MICs often have negative consequences for countries but may be unbalanced. Examples may lack detail or development. Response develops on a largely secure base of knowledge and understanding. Level 2 (4–7) Response shows general knowledge and understanding of the extent to which very large cities in LICs/MICs often have negative consequences for countries. Response is mainly descriptive or explanatory with limited use of examples and understanding of the topic may be partial or inaccurate. Some concluding remarks. General responses without the use of example(s) will not get above the middle of Level 2 (6 marks). Level 1 (1–3) Response may broadly discuss very large cities in LICs/MICs but does not address the question and does not come to a convincing conclusion. Response is descriptive, knowledge is basic and understanding is poor. Level 0 (0) No creditable response.
What was in this paper
The subtopics covered by these 6 questions, and how many questions each got. Open one in a new tab to see every Cambridge question on it.
What you needed in this session
Cambridge’s own grade thresholds for 2024 May/June, Paper 2 · Variant 1. A higher threshold means an easier paper — the bar moves with how the cohort did.