Cambridge A Level Geography 9696 — 2023 Oct/Nov Paper 2 · Variant 1
9696/21/O/N/23 · 6 questions · 60 marks · ≈68 min
The question paper and its mark scheme, free to read here and free to download. This is Cambridge’s own paper, exactly as it was sat.
Question paper4 pages

Mark scheme15 pages
Answers below. Sit the paper first if you are practising.

Questions as text
Q1 · The projected increase in world population, by country and continent, 2019–2050
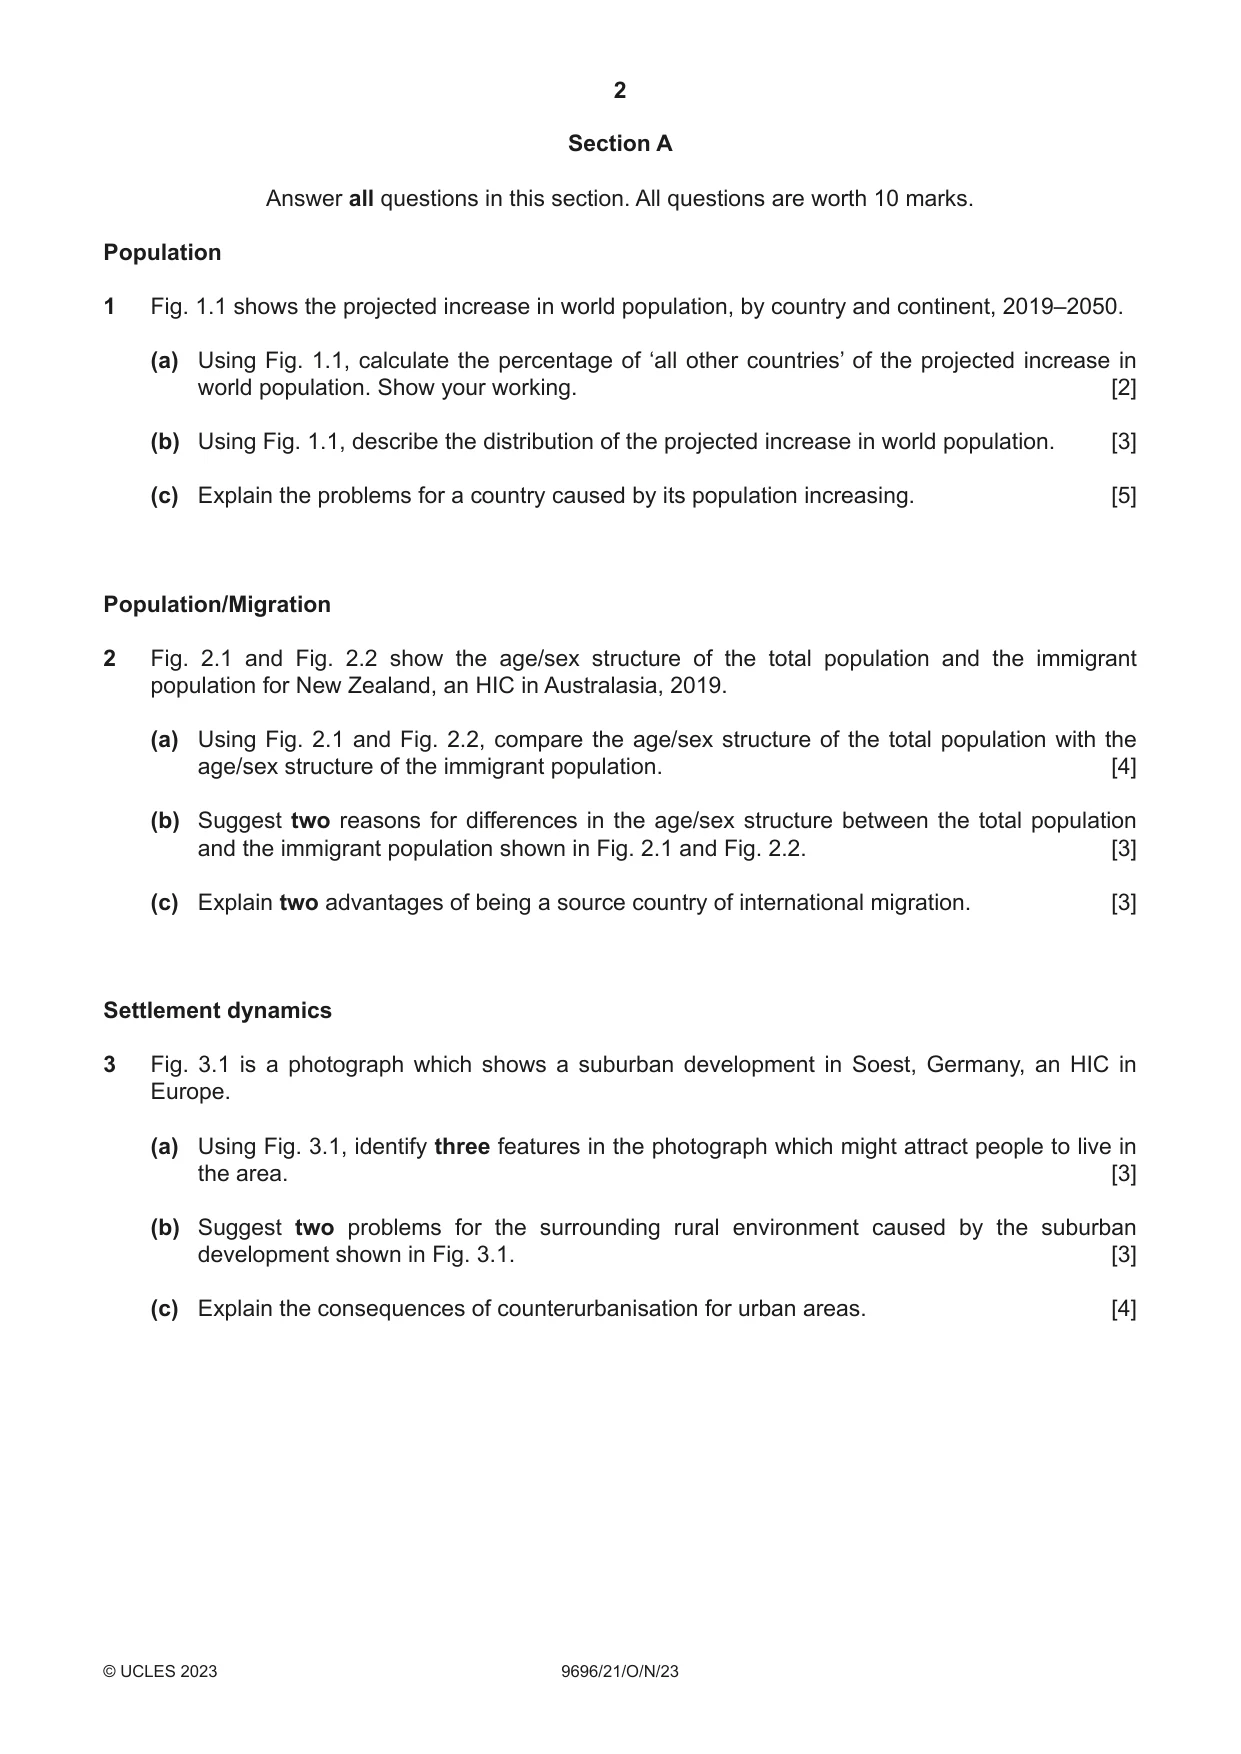
1 Fig. 1.1 shows the projected increase in world population, by country and continent, 2019–2050. (a) Using Fig. 1.1, calculate the percentage of ‘all other countries’ of the projected increase in world population. Show your working. [2] (b) Using Fig. 1.1, describe the distribution of the projected increase in world population. [3] (c) Explain the problems for a country caused by its population increasing. [5] Population/Migration
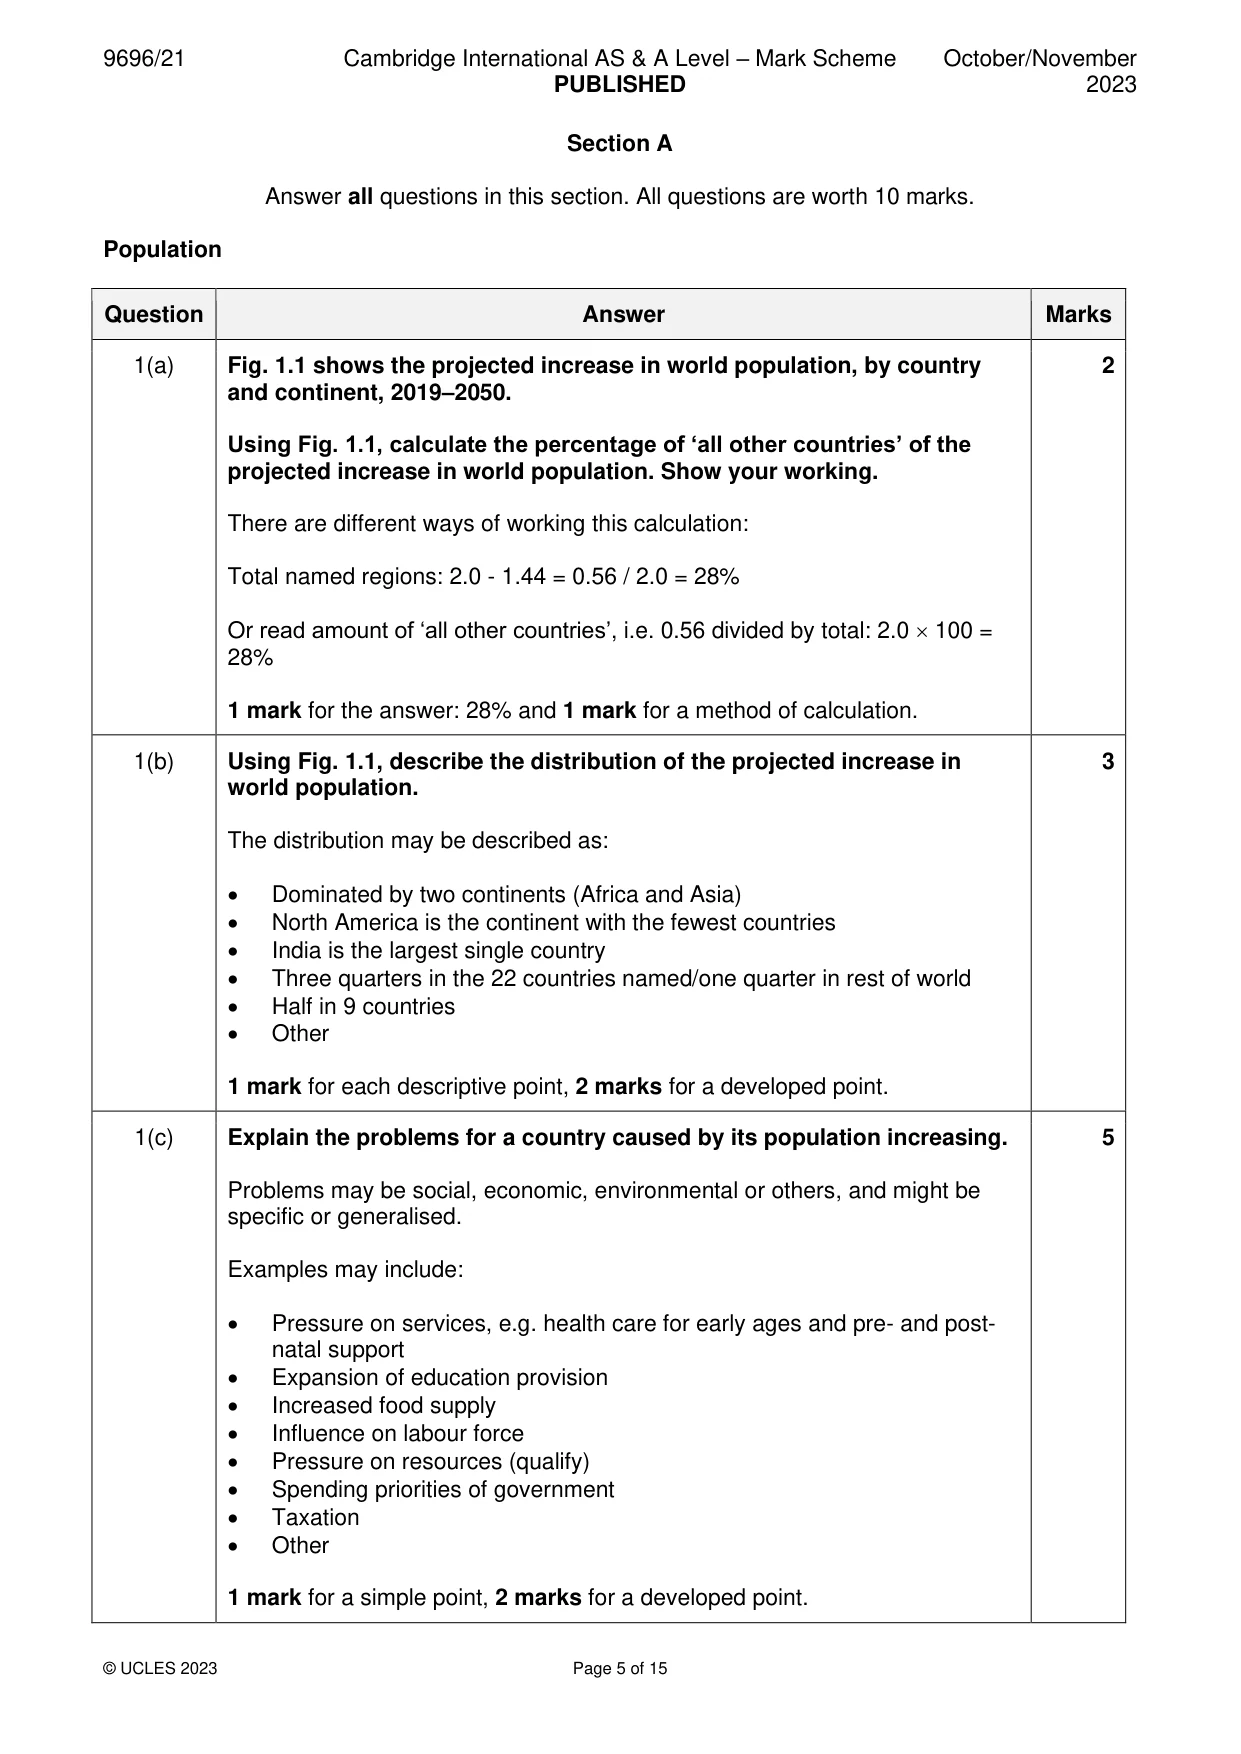
Mark scheme: Question Answer Marks 1(a) Fig. 1.1 shows the projected increase in world population, by country 2 and continent, 2019–2050. Using Fig. 1.1, calculate the percentage of ‘all other countries’ of the projected increase in world population. Show your working. There are different ways of working this calculation: Total named regions: 2.0 - 1.44 = 0.56 / 2.0 = 28% Or read amount of ‘all other countries’, i.e. 0.56 divided by total: 2.0 100 = 28% 1 mark for the answer: 28% and 1 mark for a method of calculation. 1(b) Using Fig. 1.1, describe the distribution of the projected increase in 3 world population. The distribution may be described as: • Dominated by two continents (Africa and Asia) • North America is the continent with the fewest countries • India is the largest single country • Three quarters in the 22 countries named/one quarter in rest of world • Half in 9 countries • Other 1 mark for each descriptive point, 2 marks for a developed point. 1(c) Explain the problems for a country caused by its population increasing. 5 Problems may be social, economic, environmental or others, and might be specific or generalised. Examples may include: • Pressure on services, e.g. health care for early ages and pre- and post- natal support • Expansion of education provision • Increased food supply • Influence on labour force • Pressure on resources (qualify) • Spending priorities of government • Taxation • Other 1 mark for a simple point, 2 marks for a developed point. Population/Migration
Question 2
2 Fig. 2.1 and Fig. 2.2 show the age/sex structure of the total population and the immigrant population for New Zealand, an HIC in Australasia, 2019. (a) Using Fig. 2.1 and Fig. 2.2, compare the age/sex structure of the total population with the age/sex structure of the immigrant population. [4] (b) Suggest two reasons for differences in the age/sex structure between the total population and the immigrant population shown in Fig. 2.1 and Fig. 2.2. [3] (c) Explain two advantages of being a source country of international migration. [3] Settlement dynamics
Mark scheme: 2(a) Fig. 2.1 and Fig. 2.2 show the age/sex structure of the total population 4 and the immigrant population for New Zealand, an HIC in Australasia, 2019. Using Fig. 2.1 and Fig. 2.2, compare the age/sex structure of the total population with the age/sex structure of the immigrant population. Comparisons could include: • Lower numbers from 0–19 years, but less difference with each age group up to 19 • Higher numbers from 20–59; gap declines from 55 • Similar from 59 upwards but not consistent, e.g. males 75+ higher • Some gender variations, e.g. 25–55 more females; the difference more pronounced in earlier groups of this range • Other For each simple comparison 1 mark, with a second mark for development. Four simple comparisons are valid for 4 marks. Max. 2 if no comparison. 2(b) Suggest two reasons for differences in the age/sex structure between 3 the total population and the immigrant population shown in Fig. 2.1 and Fig. 2.2. Reasons for the differences may include: • Movement for retirement • Movement for employment opportunities • International migrants are more likely to move with older rather than young children • Immigration policies (encouraging certain age groups) of the government • Other 1 mark for a simple point, 2 marks for a developed point. 2(c) Explain two advantages of being a source country of international 3 migration. Advantages may include: • Remittances • Reduces population pressure on differing sectors of economy and society • Reduces unemployment and underemployment • Return migrants may bring new skills, ideas and money • Other 1 mark for a simple explanation, 2 marks for a developed explanation (with detail or an example). Settlement dynamics
Q3 · A photograph which shows a suburban development in Soest, Germany, an HIC in Europe
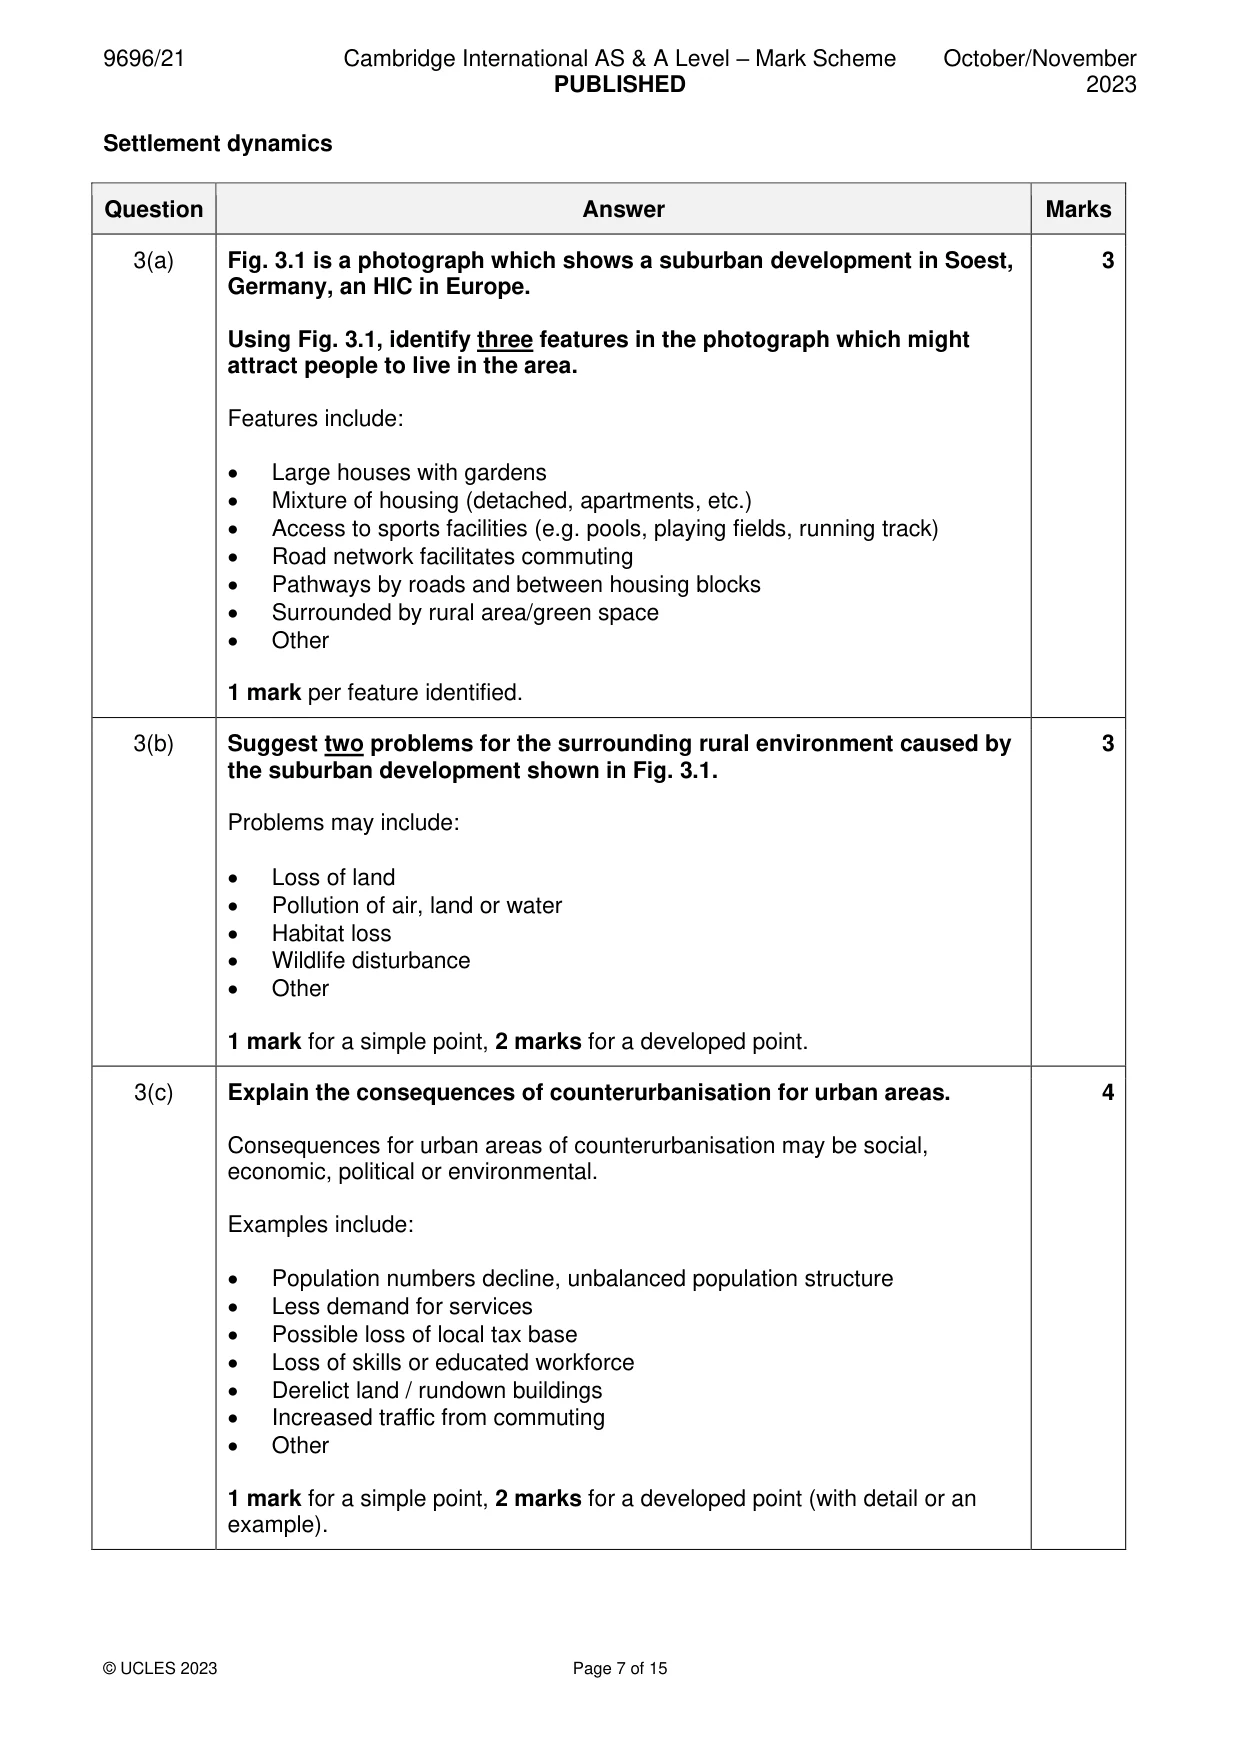
3 Fig. 3.1 is a photograph which shows a suburban development in Soest, Germany, an HIC in Europe. (a) Using Fig. 3.1, identify three features in the photograph which might attract people to live in the area. [3] (b) Suggest two problems for the surrounding rural environment caused by the suburban development shown in Fig. 3.1. [3] (c) Explain the consequences of counterurbanisation for urban areas. [4]
Mark scheme: 3(a) Fig. 3.1 is a photograph which shows a suburban development in Soest, 3 Germany, an HIC in Europe. Using Fig. 3.1, identify three features in the photograph which might attract people to live in the area. Features include: • Large houses with gardens • Mixture of housing (detached, apartments, etc.) • Access to sports facilities (e.g. pools, playing fields, running track) • Road network facilitates commuting • Pathways by roads and between housing blocks • Surrounded by rural area/green space • Other 1 mark per feature identified. 3(b) Suggest two problems for the surrounding rural environment caused by 3 the suburban development shown in Fig. 3.1. Problems may include: • Loss of land • Pollution of air, land or water • Habitat loss • Wildlife disturbance • Other 1 mark for a simple point, 2 marks for a developed point. 3(c) Explain the consequences of counterurbanisation for urban areas. 4 Consequences for urban areas of counterurbanisation may be social, economic, political or environmental. Examples include: • Population numbers decline, unbalanced population structure • Less demand for services • Possible loss of local tax base • Loss of skills or educated workforce • Derelict land / rundown buildings • Increased traffic from commuting • Other 1 mark for a simple point, 2 marks for a developed point (with detail or an example). Section B Answer one question from this section. All questions are worth 30 marks. Population
Q4 · Describe the problems for countries caused by underpopulation
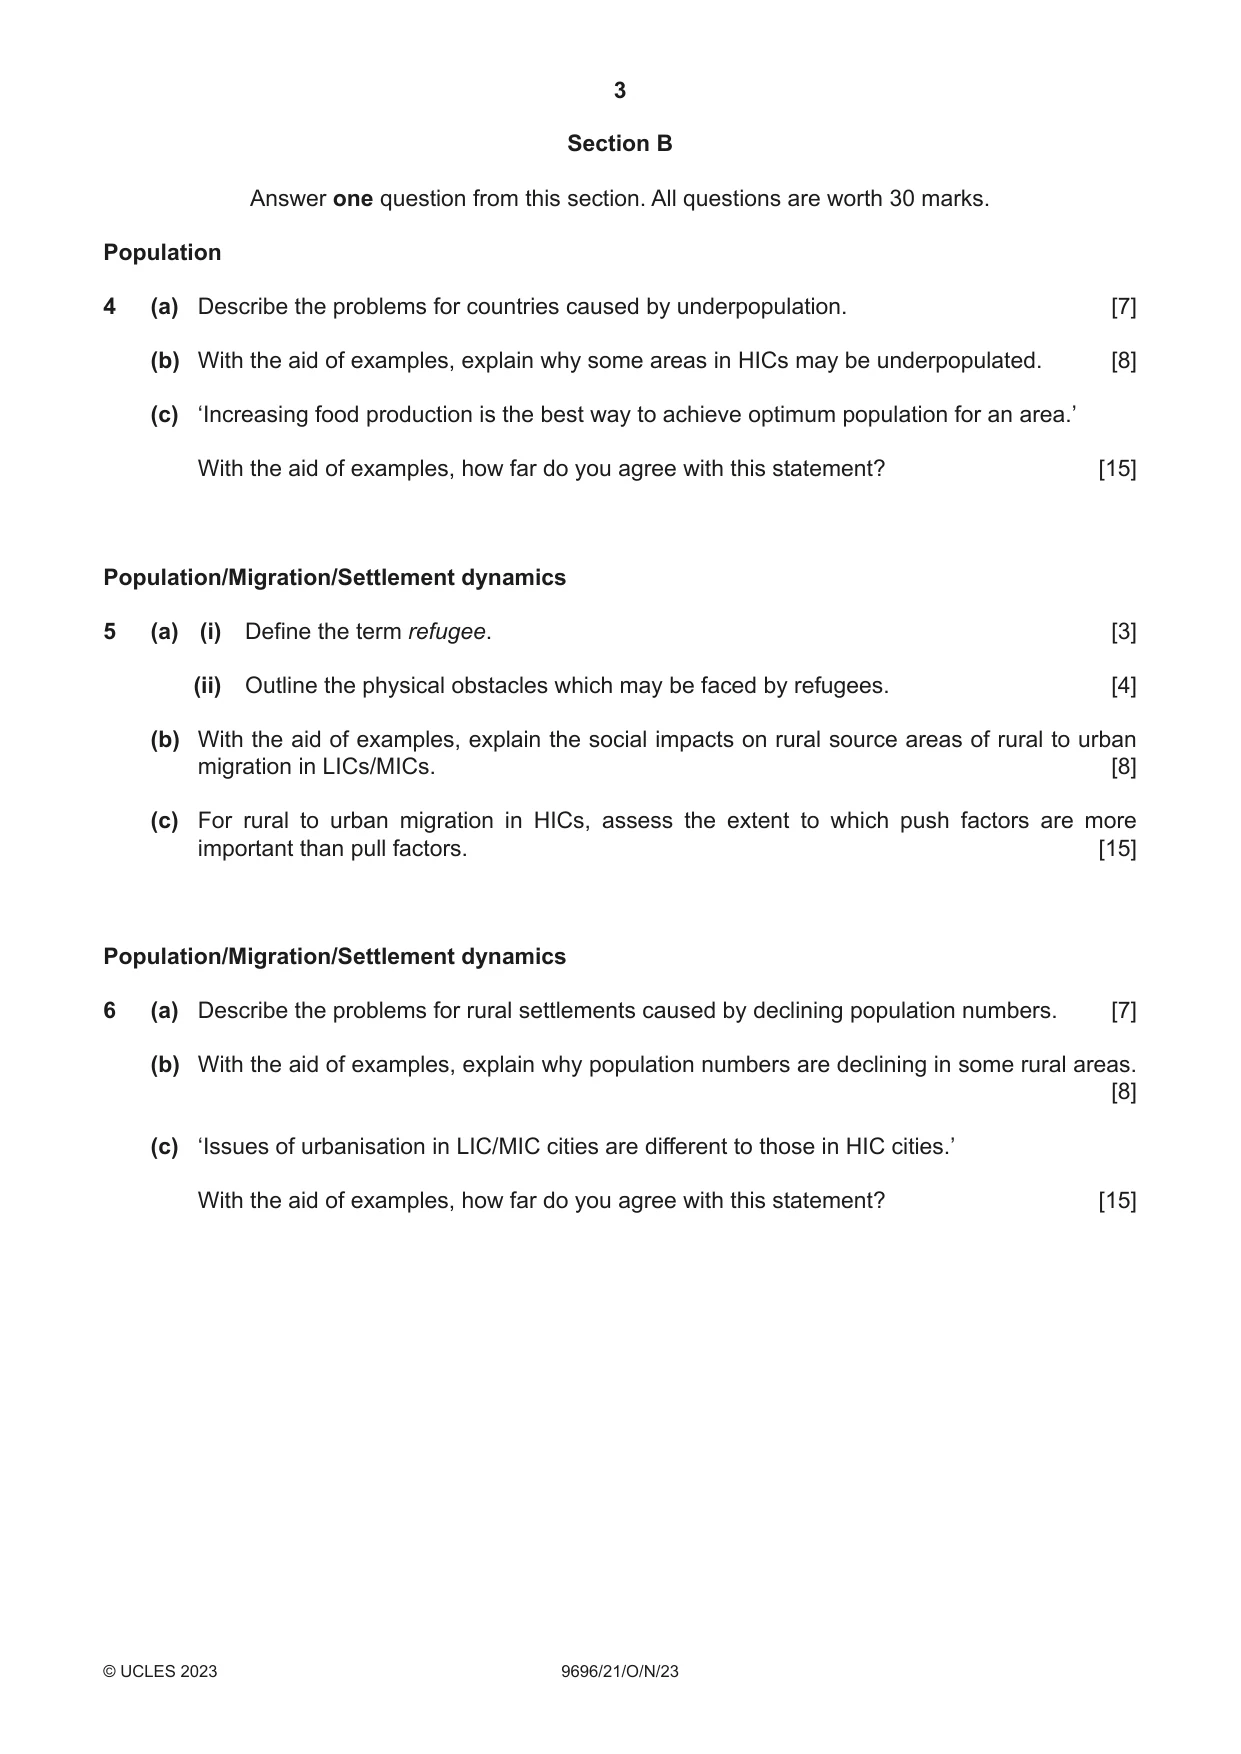
4 (a) Describe the problems for countries caused by underpopulation. [7] (b) With the aid of examples, explain why some areas in HICs may be underpopulated. [8] (c) ‘Increasing food production is the best way to achieve optimum population for an area.’ With the aid of examples, how far do you agree with this statement? [15] Population/Migration/Settlement dynamics
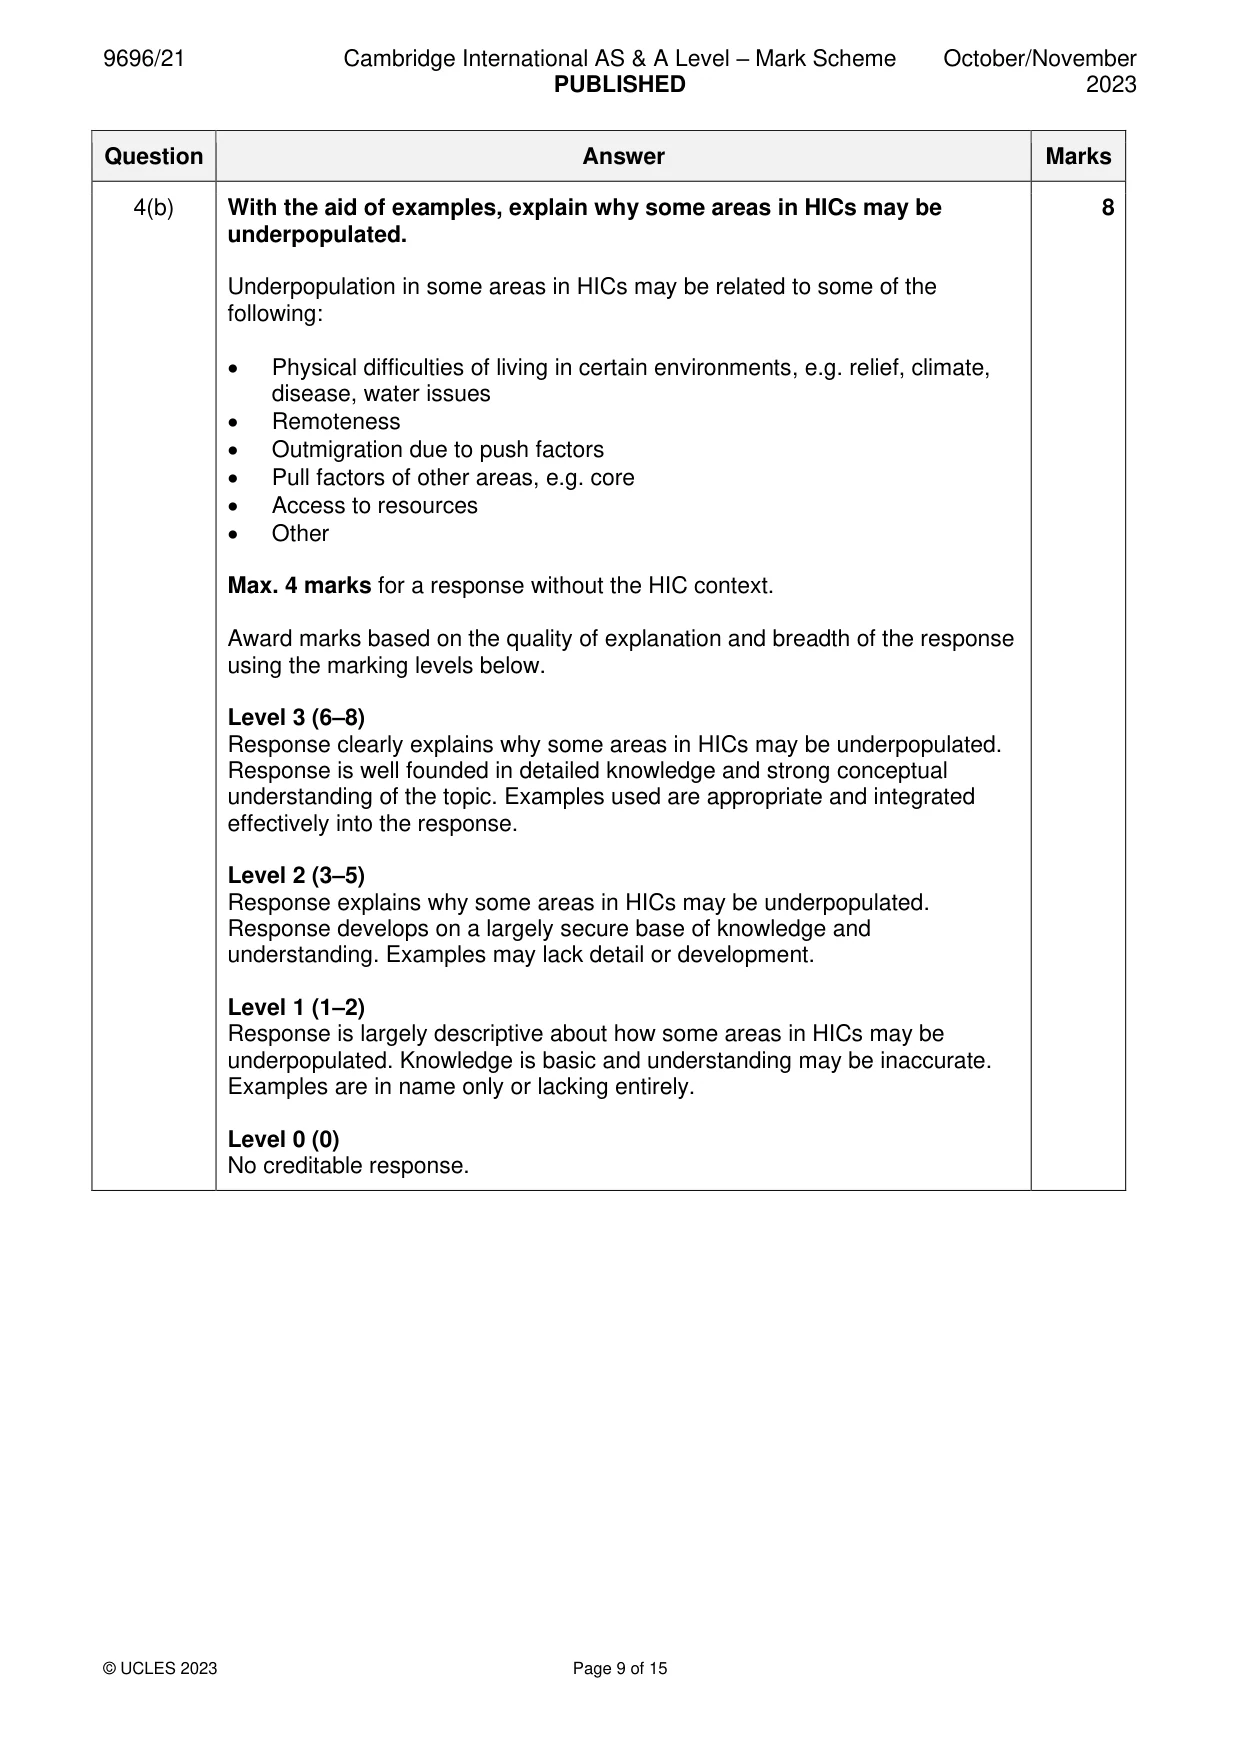
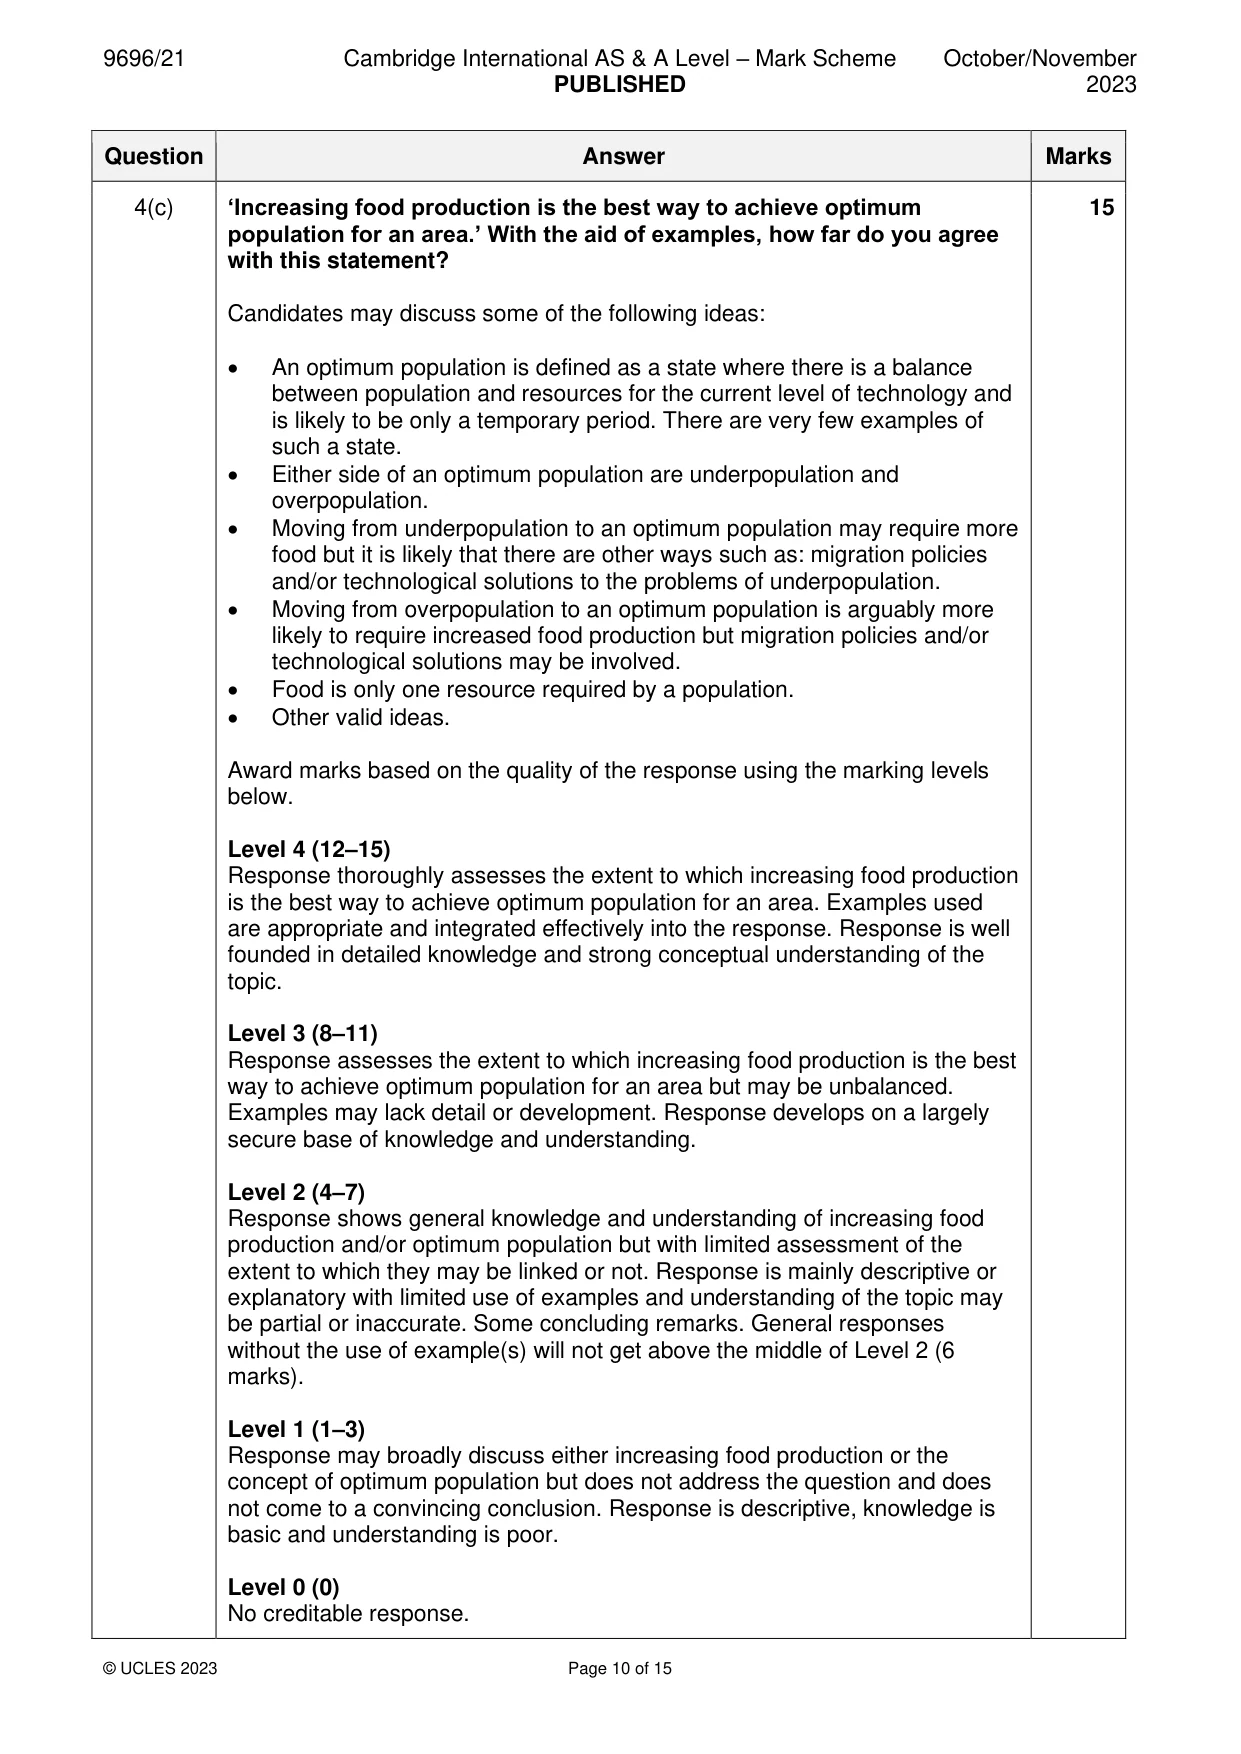
Mark scheme: 4(a) Describe the problems for countries caused by underpopulation. 7 Problems caused by underpopulation may include: • Underutilisation of resources • Labour shortages/high costs • Increased immigration to fill labour shortages and consequent impact on economy and society • Low service provision • Other 1 mark for each descriptive point. A minimum of two problems should be described with max. 4 marks for one problem. Max. 2 marks for a list. 4(b) With the aid of examples, explain why some areas in HICs may be 8 underpopulated. Underpopulation in some areas in HICs may be related to some of the following: • Physical difficulties of living in certain environments, e.g. relief, climate, disease, water issues • Remoteness • Outmigration due to push factors • Pull factors of other areas, e.g. core • Access to resources • Other Max. 4 marks for a response without the HIC context. Award marks based on the quality of explanation and breadth of the response using the marking levels below. Level 3 (6–8) Response clearly explains why some areas in HICs may be underpopulated. Response is well founded in detailed knowledge and strong conceptual understanding of the topic. Examples used are appropriate and integrated effectively into the response. Level 2 (3–5) Response explains why some areas in HICs may be underpopulated. Response develops on a largely secure base of knowledge and understanding. Examples may lack detail or development. Level 1 (1–2) Response is largely descriptive about how some areas in HICs may be underpopulated. Knowledge is basic and understanding may be inaccurate. Examples are in name only or lacking entirely. Level 0 (0) No creditable response. 4(c) ‘Increasing food production is the best way to achieve optimum 15 population for an area.’ With the aid of examples, how far do you agree with this statement? Candidates may discuss some of the following ideas: • An optimum population is defined as a state where there is a balance between population and resources for the current level of technology and is likely to be only a temporary period. There are very few examples of such a state. • Either side of an optimum population are underpopulation and overpopulation. • Moving from underpopulation to an optimum population may require more food but it is likely that there are other ways such as: migration policies and/or technological solutions to the problems of underpopulation. • Moving from overpopulation to an optimum population is arguably more likely to require increased food production but migration policies and/or technological solutions may be involved. • Food is only one resource required by a population. • Other valid ideas. Award marks based on the quality of the response using the marking levels below. Level 4 (12–15) Response thoroughly assesses the extent to which increasing food production is the best way to achieve optimum population for an area. Examples used are appropriate and integrated effectively into the response. Response is well founded in detailed knowledge and strong conceptual understanding of the topic. Level 3 (8–11) Response assesses the extent to which increasing food production is the best way to achieve optimum population for an area but may be unbalanced. Examples may lack detail or development. Response develops on a largely secure base of knowledge and understanding. Level 2 (4–7) Response shows general knowledge and understanding of increasing food production and/or optimum population but with limited assessment of the extent to which they may be linked or not. Response is mainly descriptive or explanatory with limited use of examples and understanding of the topic may be partial or inaccurate. Some concluding remarks. General responses without the use of example(s) will not get above the middle of Level 2 (6 marks). Level 1 (1–3) Response may broadly discuss either increasing food production or the concept of optimum population but does not address the question and does not come to a convincing conclusion. Response is descriptive, knowledge is basic and understanding is poor. Level 0 (0) No creditable response. Population/Migration/Settlement dynamics
Q5 · Define the term refugee
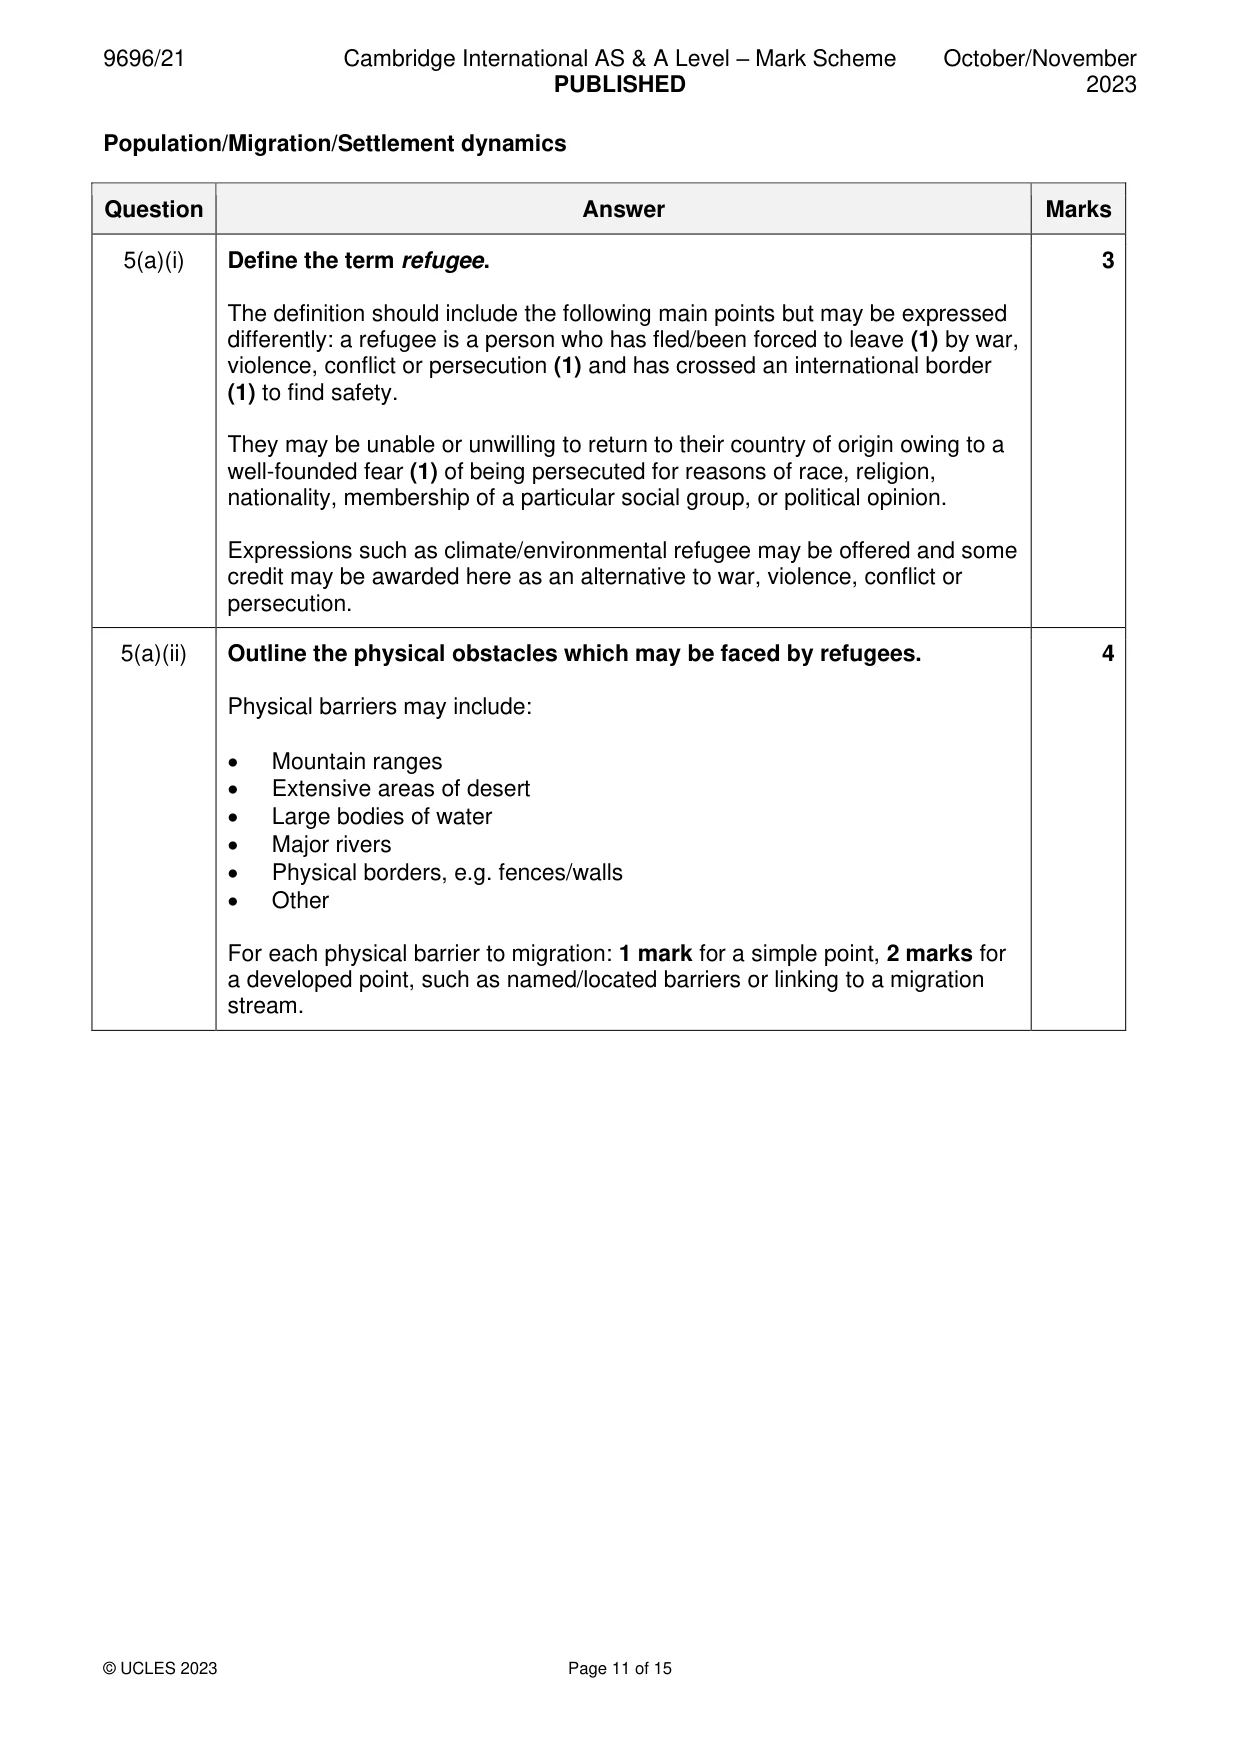
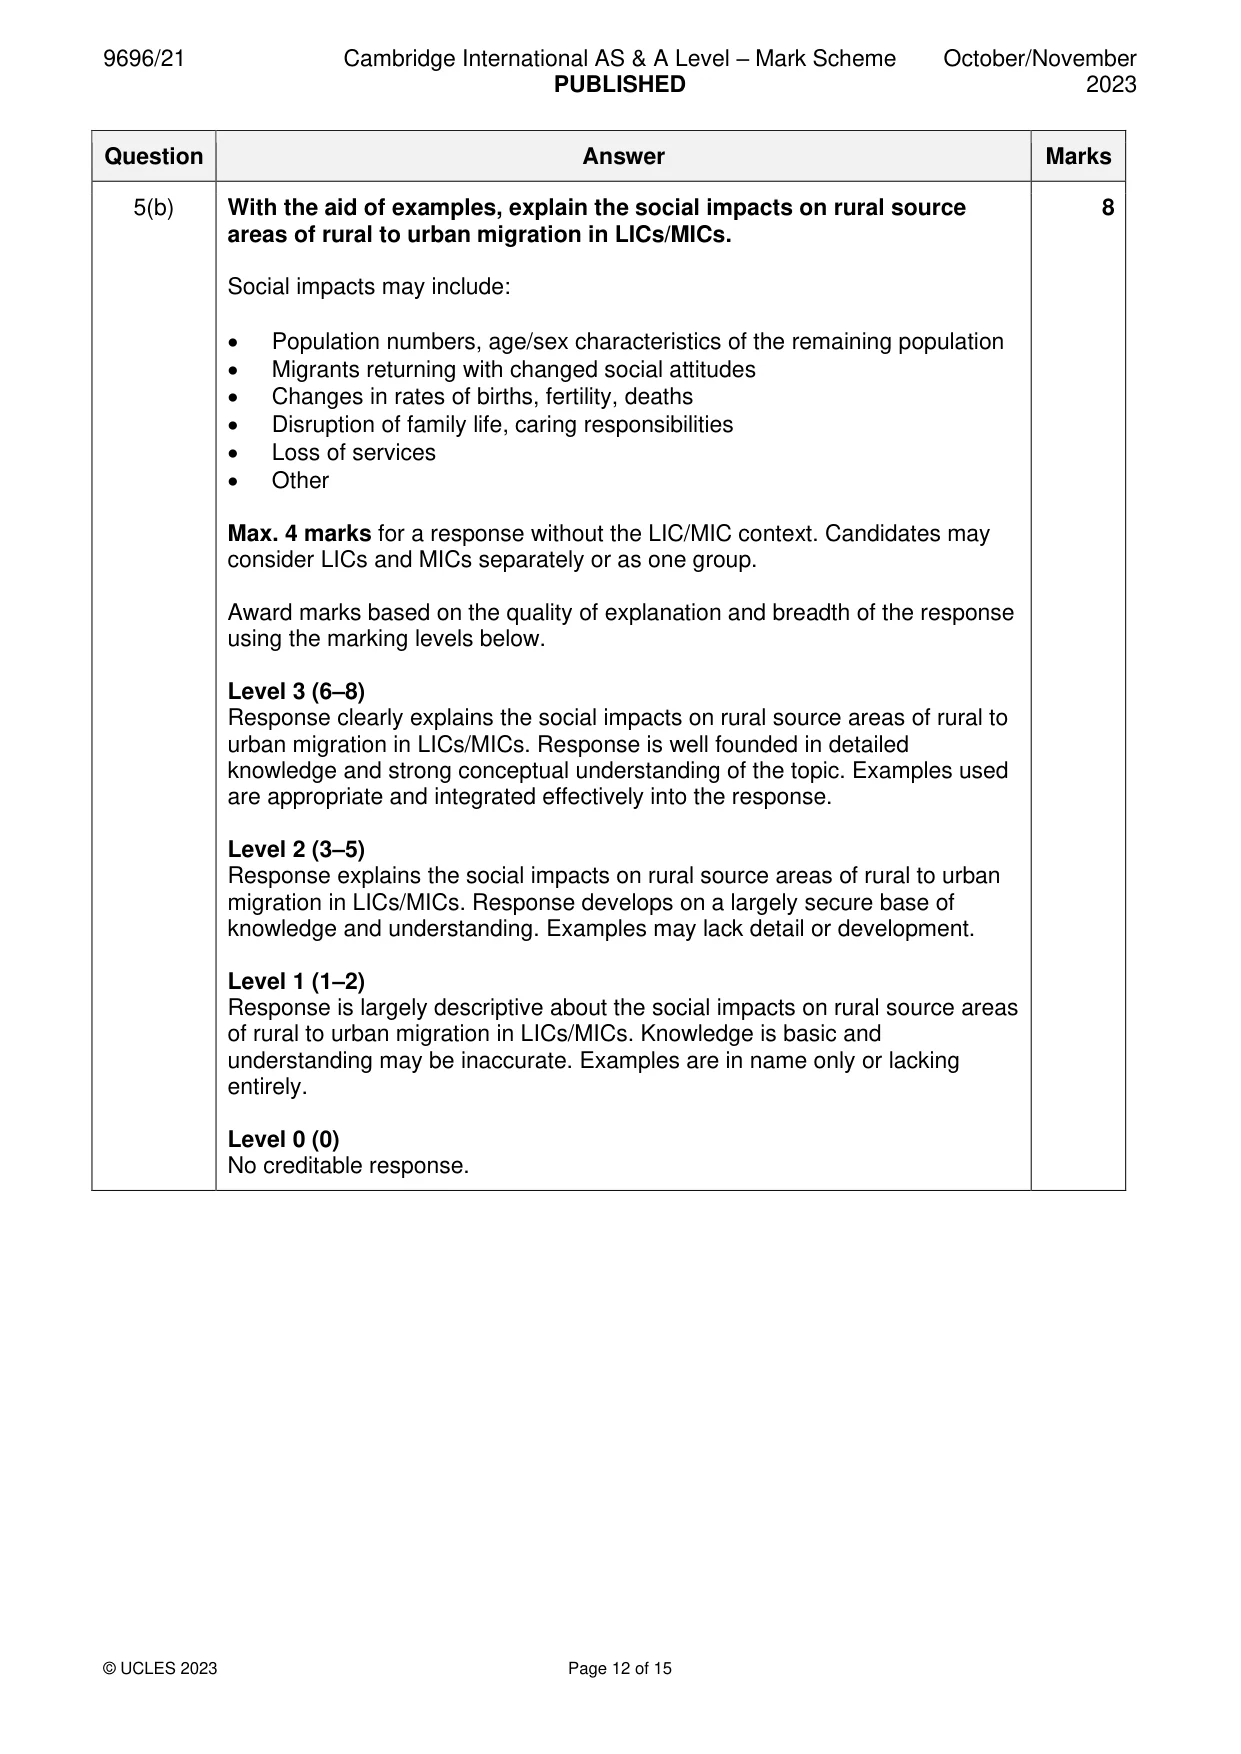
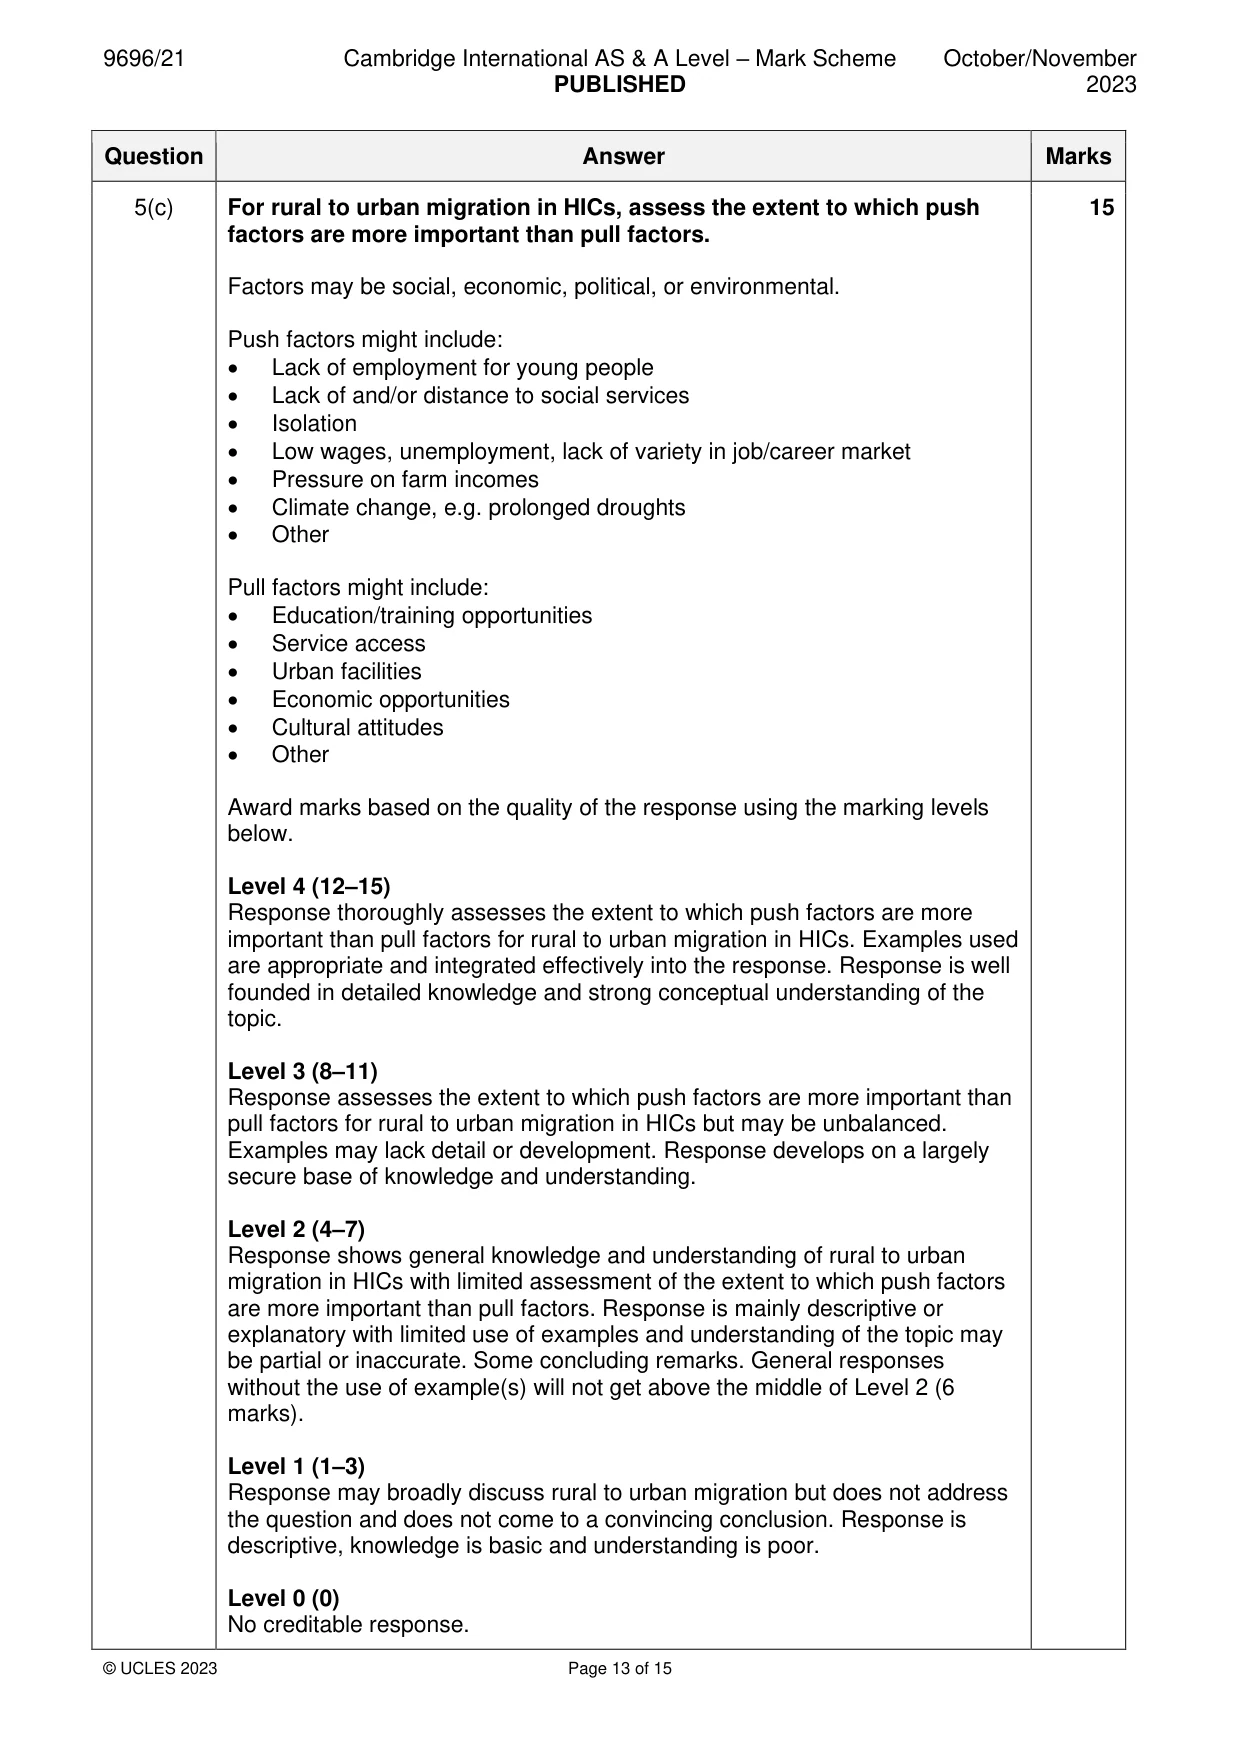
5 (a) (i) Define the term refugee. [3] (ii) Outline the physical obstacles which may be faced by refugees. [4] (b) With the aid of examples, explain the social impacts on rural source areas of rural to urban migration in LICs/MICs. [8] (c) For rural to urban migration in HICs, assess the extent to which push factors are more important than pull factors. [15] Population/Migration/Settlement dynamics
Mark scheme: 5(a)(i) Define the term refugee. 3 The definition should include the following main points but may be expressed differently: a refugee is a person who has fled/been forced to leave (1) by war, violence, conflict or persecution (1) and has crossed an international border (1) to find safety. They may be unable or unwilling to return to their country of origin owing to a well-founded fear (1) of being persecuted for reasons of race, religion, nationality, membership of a particular social group, or political opinion. Expressions such as climate/environmental refugee may be offered and some credit may be awarded here as an alternative to war, violence, conflict or persecution. 5(a)(ii) Outline the physical obstacles which may be faced by refugees. 4 Physical barriers may include: • Mountain ranges • Extensive areas of desert • Large bodies of water • Major rivers • Physical borders, e.g. fences/walls • Other For each physical barrier to migration: 1 mark for a simple point, 2 marks for a developed point, such as named/located barriers or linking to a migration stream. 5(b) With the aid of examples, explain the social impacts on rural source 8 areas of rural to urban migration in LICs/MICs. Social impacts may include: • Population numbers, age/sex characteristics of the remaining population • Migrants returning with changed social attitudes • Changes in rates of births, fertility, deaths • Disruption of family life, caring responsibilities • Loss of services • Other Max. 4 marks for a response without the LIC/MIC context. Candidates may consider LICs and MICs separately or as one group. Award marks based on the quality of explanation and breadth of the response using the marking levels below. Level 3 (6–8) Response clearly explains the social impacts on rural source areas of rural to urban migration in LICs/MICs. Response is well founded in detailed knowledge and strong conceptual understanding of the topic. Examples used are appropriate and integrated effectively into the response. Level 2 (3–5) Response explains the social impacts on rural source areas of rural to urban migration in LICs/MICs. Response develops on a largely secure base of knowledge and understanding. Examples may lack detail or development. Level 1 (1–2) Response is largely descriptive about the social impacts on rural source areas of rural to urban migration in LICs/MICs. Knowledge is basic and understanding may be inaccurate. Examples are in name only or lacking entirely. Level 0 (0) No creditable response. 5(c) For rural to urban migration in HICs, assess the extent to which push 15 factors are more important than pull factors. Factors may be social, economic, political, or environmental. Push factors might include: • Lack of employment for young people • Lack of and/or distance to social services • Isolation • Low wages, unemployment, lack of variety in job/career market • Pressure on farm incomes • Climate change, e.g. prolonged droughts • Other Pull factors might include: • Education/training opportunities • Service access • Urban facilities • Economic opportunities • Cultural attitudes • Other Award marks based on the quality of the response using the marking levels below. Level 4 (12–15) Response thoroughly assesses the extent to which push factors are more important than pull factors for rural to urban migration in HICs. Examples used are appropriate and integrated effectively into the response. Response is well founded in detailed knowledge and strong conceptual understanding of the topic. Level 3 (8–11) Response assesses the extent to which push factors are more important than pull factors for rural to urban migration in HICs but may be unbalanced. Examples may lack detail or development. Response develops on a largely secure base of knowledge and understanding. Level 2 (4–7) Response shows general knowledge and understanding of rural to urban migration in HICs with limited assessment of the extent to which push factors are more important than pull factors. Response is mainly descriptive or explanatory with limited use of examples and understanding of the topic may be partial or inaccurate. Some concluding remarks. General responses without the use of example(s) will not get above the middle of Level 2 (6 marks). Level 1 (1–3) Response may broadly discuss rural to urban migration but does not address the question and does not come to a convincing conclusion. Response is descriptive, knowledge is basic and understanding is poor. Level 0 (0) No creditable response. Population/Migration/Settlement dynamics
Q6 · Describe the problems for rural settlements caused by declining population numbers
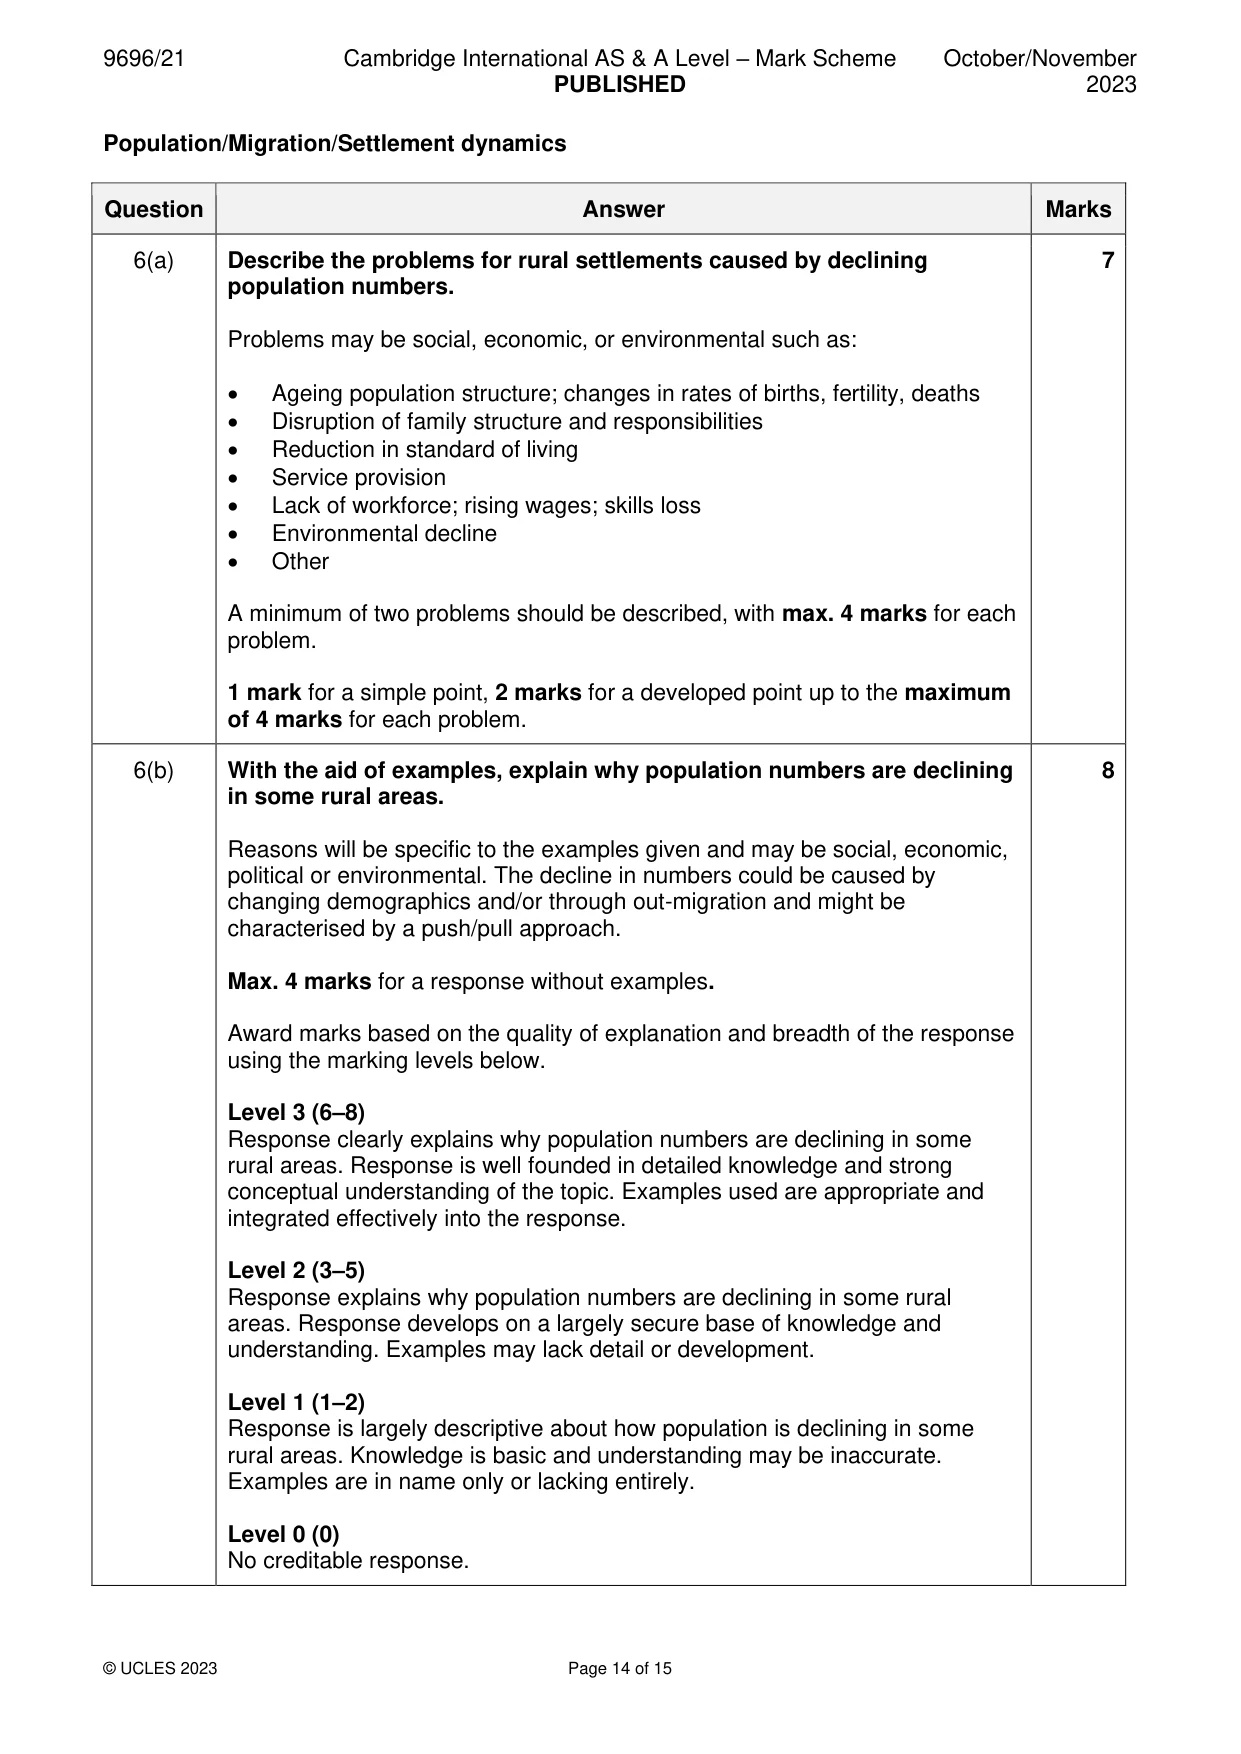
6 (a) Describe the problems for rural settlements caused by declining population numbers. [7] (b) With the aid of examples, explain why population numbers are declining in some rural areas. [8] (c) ‘Issues of urbanisation in LIC/MIC cities are different to those in HIC cities.’ With the aid of examples, how far do you agree with this statement? [15]
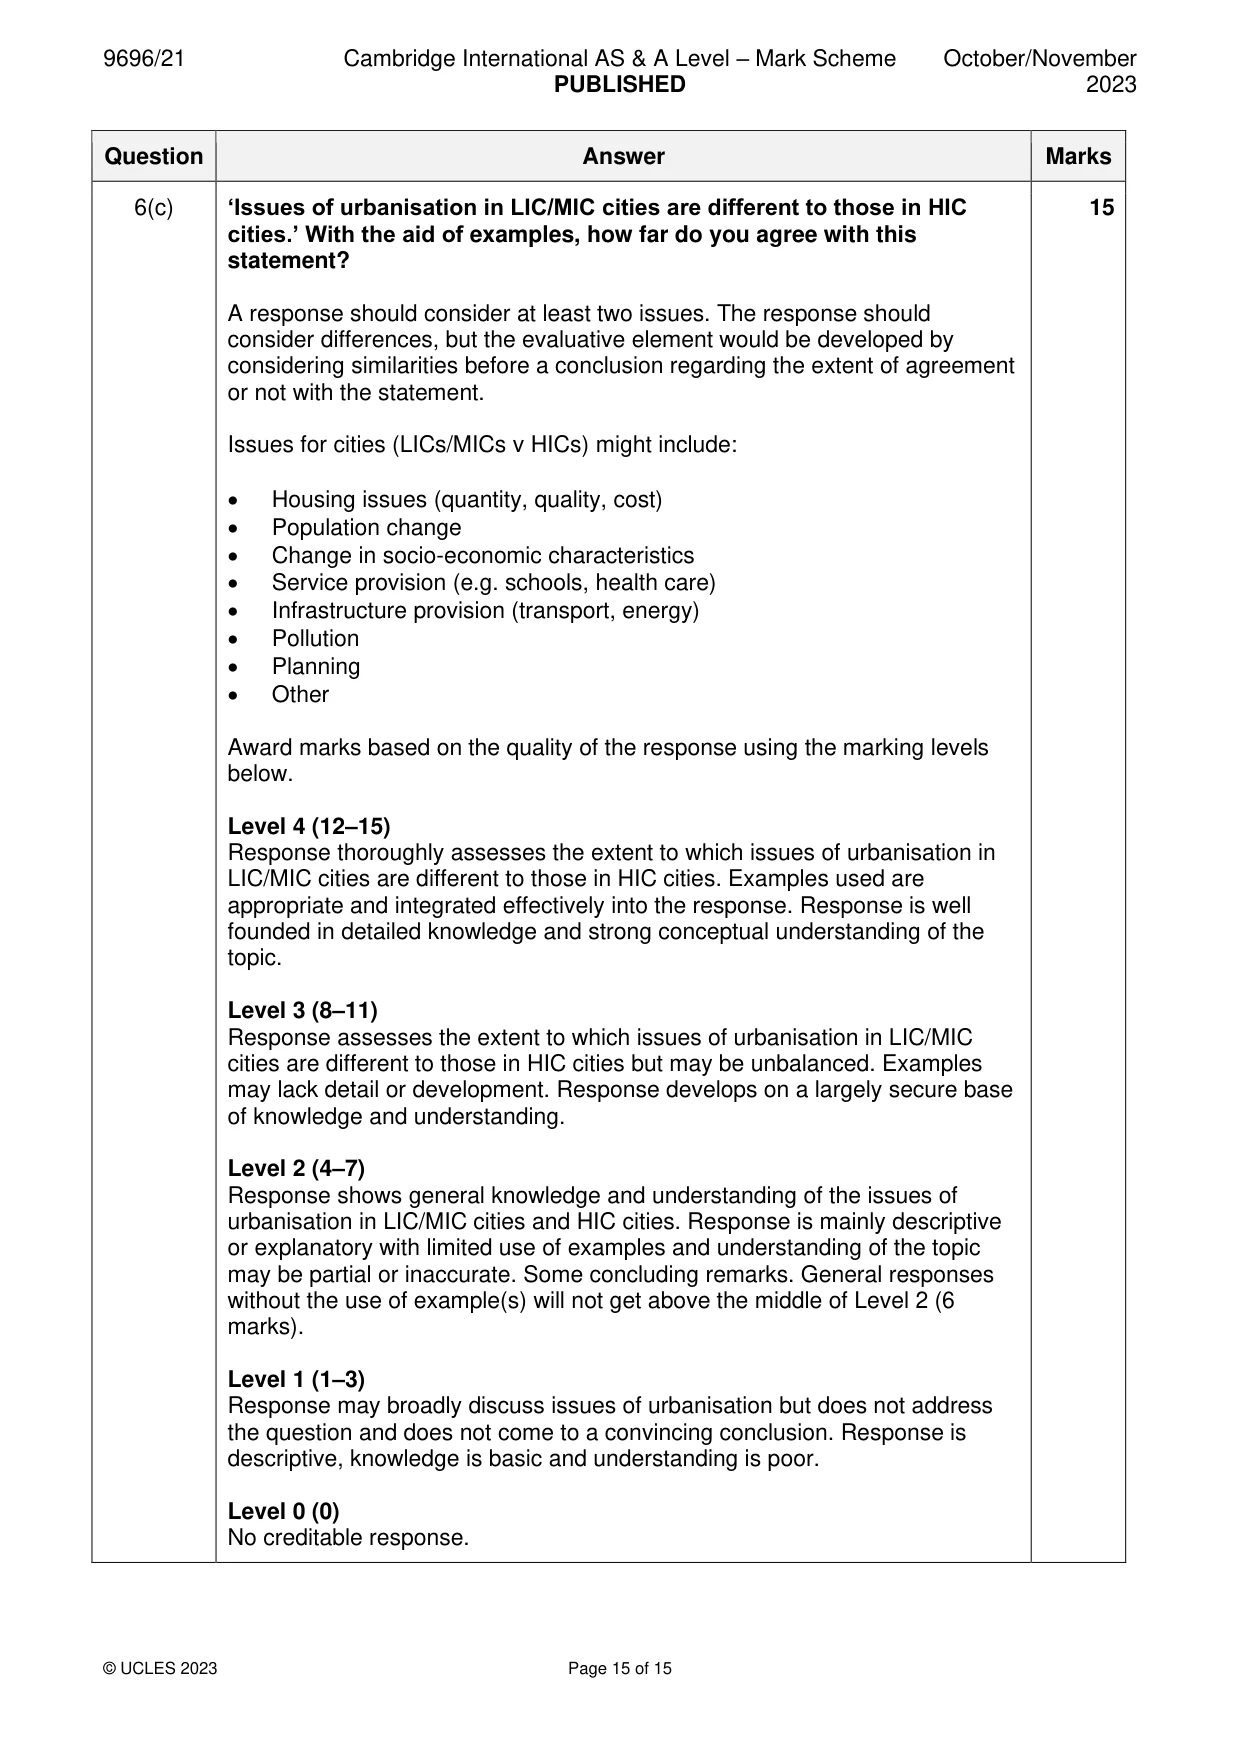
Mark scheme: 6(a) Describe the problems for rural settlements caused by declining 7 population numbers. Problems may be social, economic, or environmental such as: • Ageing population structure; changes in rates of births, fertility, deaths • Disruption of family structure and responsibilities • Reduction in standard of living • Service provision • Lack of workforce; rising wages; skills loss • Environmental decline • Other A minimum of two problems should be described, with max. 4 marks for each problem. 1 mark for a simple point, 2 marks for a developed point up to the maximum of 4 marks for each problem. 6(b) With the aid of examples, explain why population numbers are declining 8 in some rural areas. Reasons will be specific to the examples given and may be social, economic, political or environmental. The decline in numbers could be caused by changing demographics and/or through out-migration and might be characterised by a push/pull approach. Max. 4 marks for a response without examples. Award marks based on the quality of explanation and breadth of the response using the marking levels below. Level 3 (6–8) Response clearly explains why population numbers are declining in some rural areas. Response is well founded in detailed knowledge and strong conceptual understanding of the topic. Examples used are appropriate and integrated effectively into the response. Level 2 (3–5) Response explains why population numbers are declining in some rural areas. Response develops on a largely secure base of knowledge and understanding. Examples may lack detail or development. Level 1 (1–2) Response is largely descriptive about how population is declining in some rural areas. Knowledge is basic and understanding may be inaccurate. Examples are in name only or lacking entirely. Level 0 (0) No creditable response. 6(c) ‘Issues of urbanisation in LIC/MIC cities are different to those in HIC 15 cities.’ With the aid of examples, how far do you agree with this statement? A response should consider at least two issues. The response should consider differences, but the evaluative element would be developed by considering similarities before a conclusion regarding the extent of agreement or not with the statement. Issues for cities (LICs/MICs v HICs) might include: • Housing issues (quantity, quality, cost) • Population change • Change in socio-economic characteristics • Service provision (e.g. schools, health care) • Infrastructure provision (transport, energy) • Pollution • Planning • Other Award marks based on the quality of the response using the marking levels below. Level 4 (12–15) Response thoroughly assesses the extent to which issues of urbanisation in LIC/MIC cities are different to those in HIC cities. Examples used are appropriate and integrated effectively into the response. Response is well founded in detailed knowledge and strong conceptual understanding of the topic. Level 3 (8–11) Response assesses the extent to which issues of urbanisation in LIC/MIC cities are different to those in HIC cities but may be unbalanced. Examples may lack detail or development. Response develops on a largely secure base of knowledge and understanding. Level 2 (4–7) Response shows general knowledge and understanding of the issues of urbanisation in LIC/MIC cities and HIC cities. Response is mainly descriptive or explanatory with limited use of examples and understanding of the topic may be partial or inaccurate. Some concluding remarks. General responses without the use of example(s) will not get above the middle of Level 2 (6 marks). Level 1 (1–3) Response may broadly discuss issues of urbanisation but does not address the question and does not come to a convincing conclusion. Response is descriptive, knowledge is basic and understanding is poor. Level 0 (0) No creditable response.
What was in this paper
The subtopics covered by these 6 questions, and how many questions each got. Open one in a new tab to see every Cambridge question on it.
What you needed in this session
Cambridge’s own grade thresholds for 2023 Oct/Nov, Paper 2 · Variant 1. A higher threshold means an easier paper — the bar moves with how the cohort did.