Cambridge A Level Geography 9696 — 2025 May/June Paper 2 · Variant 1
9696/21/M/J/25 · 6 questions · 60 marks · ≈68 min
The question paper and its mark scheme, free to read here and free to download. This is Cambridge’s own paper, exactly as it was sat.
Question paper4 pages
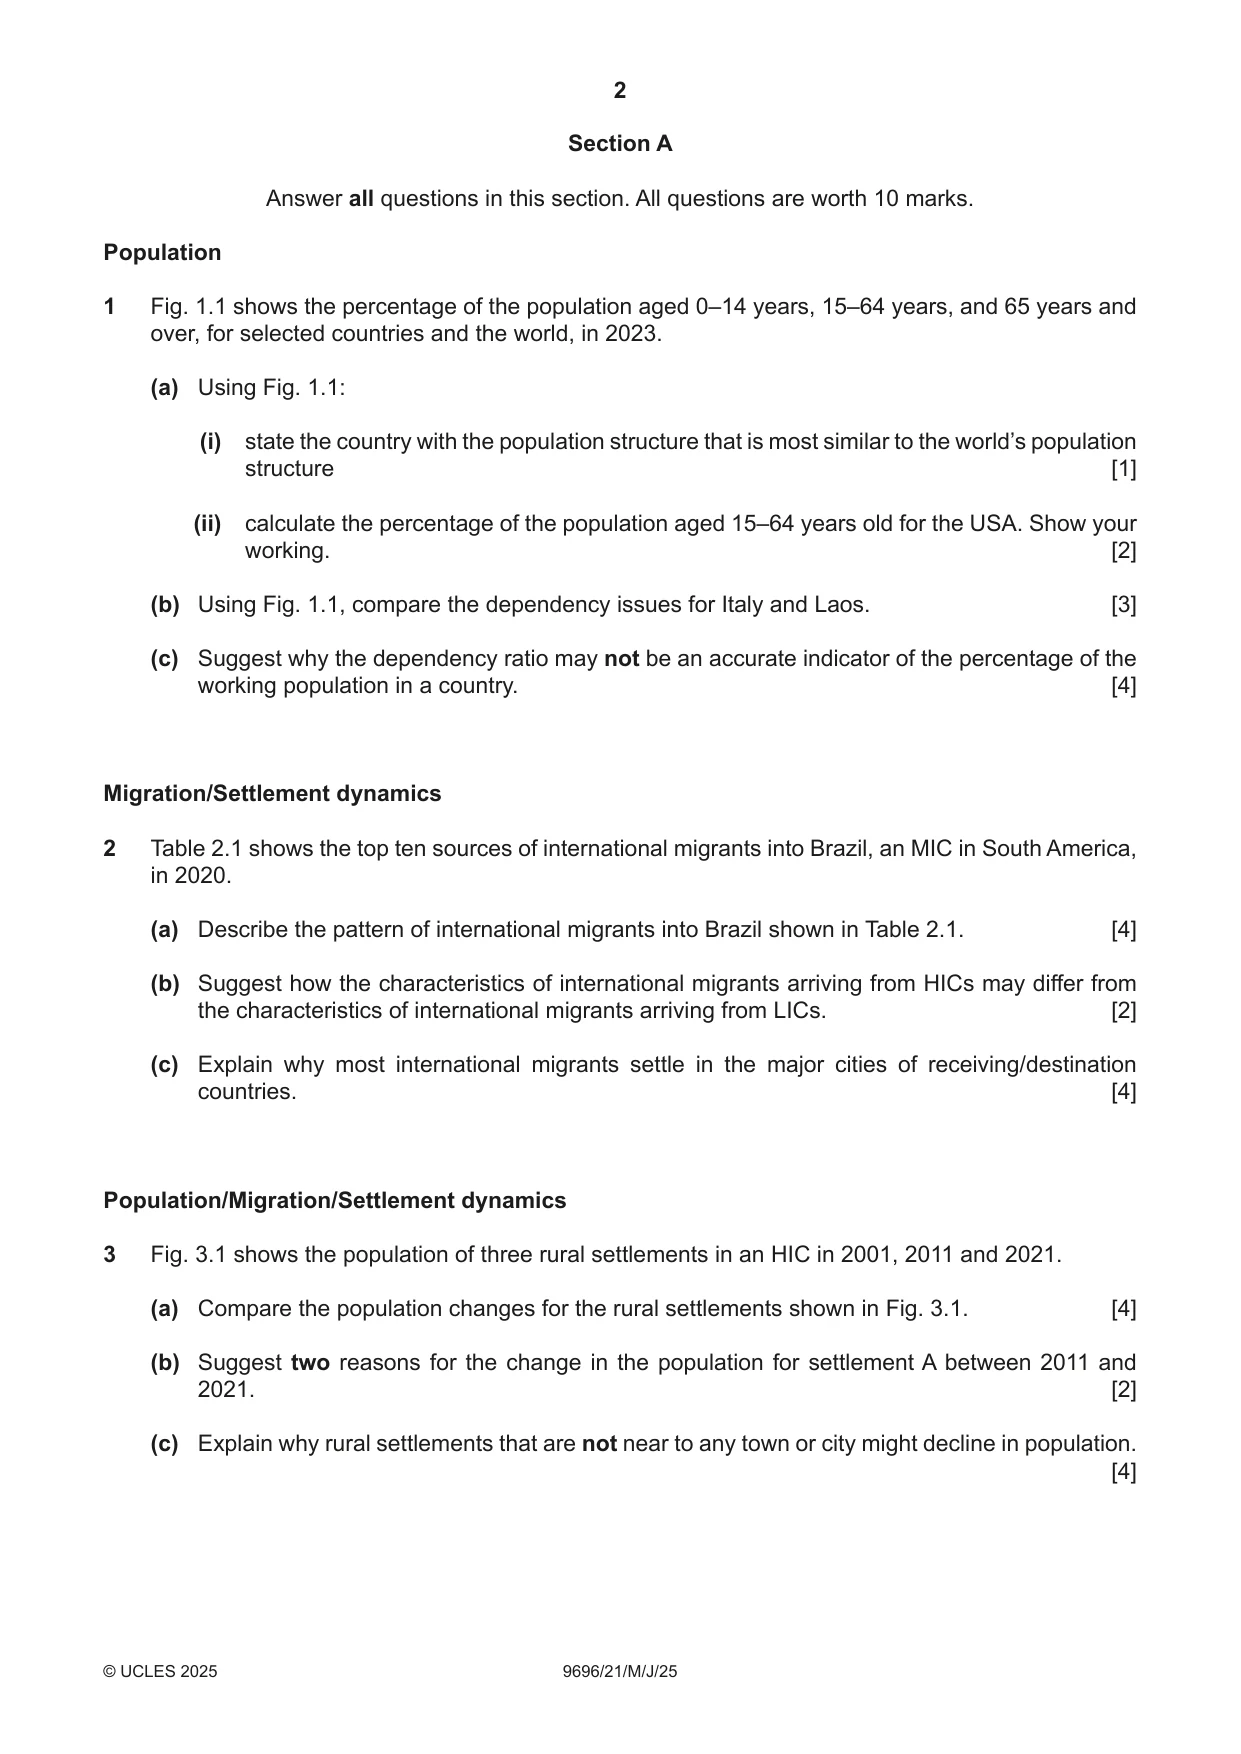
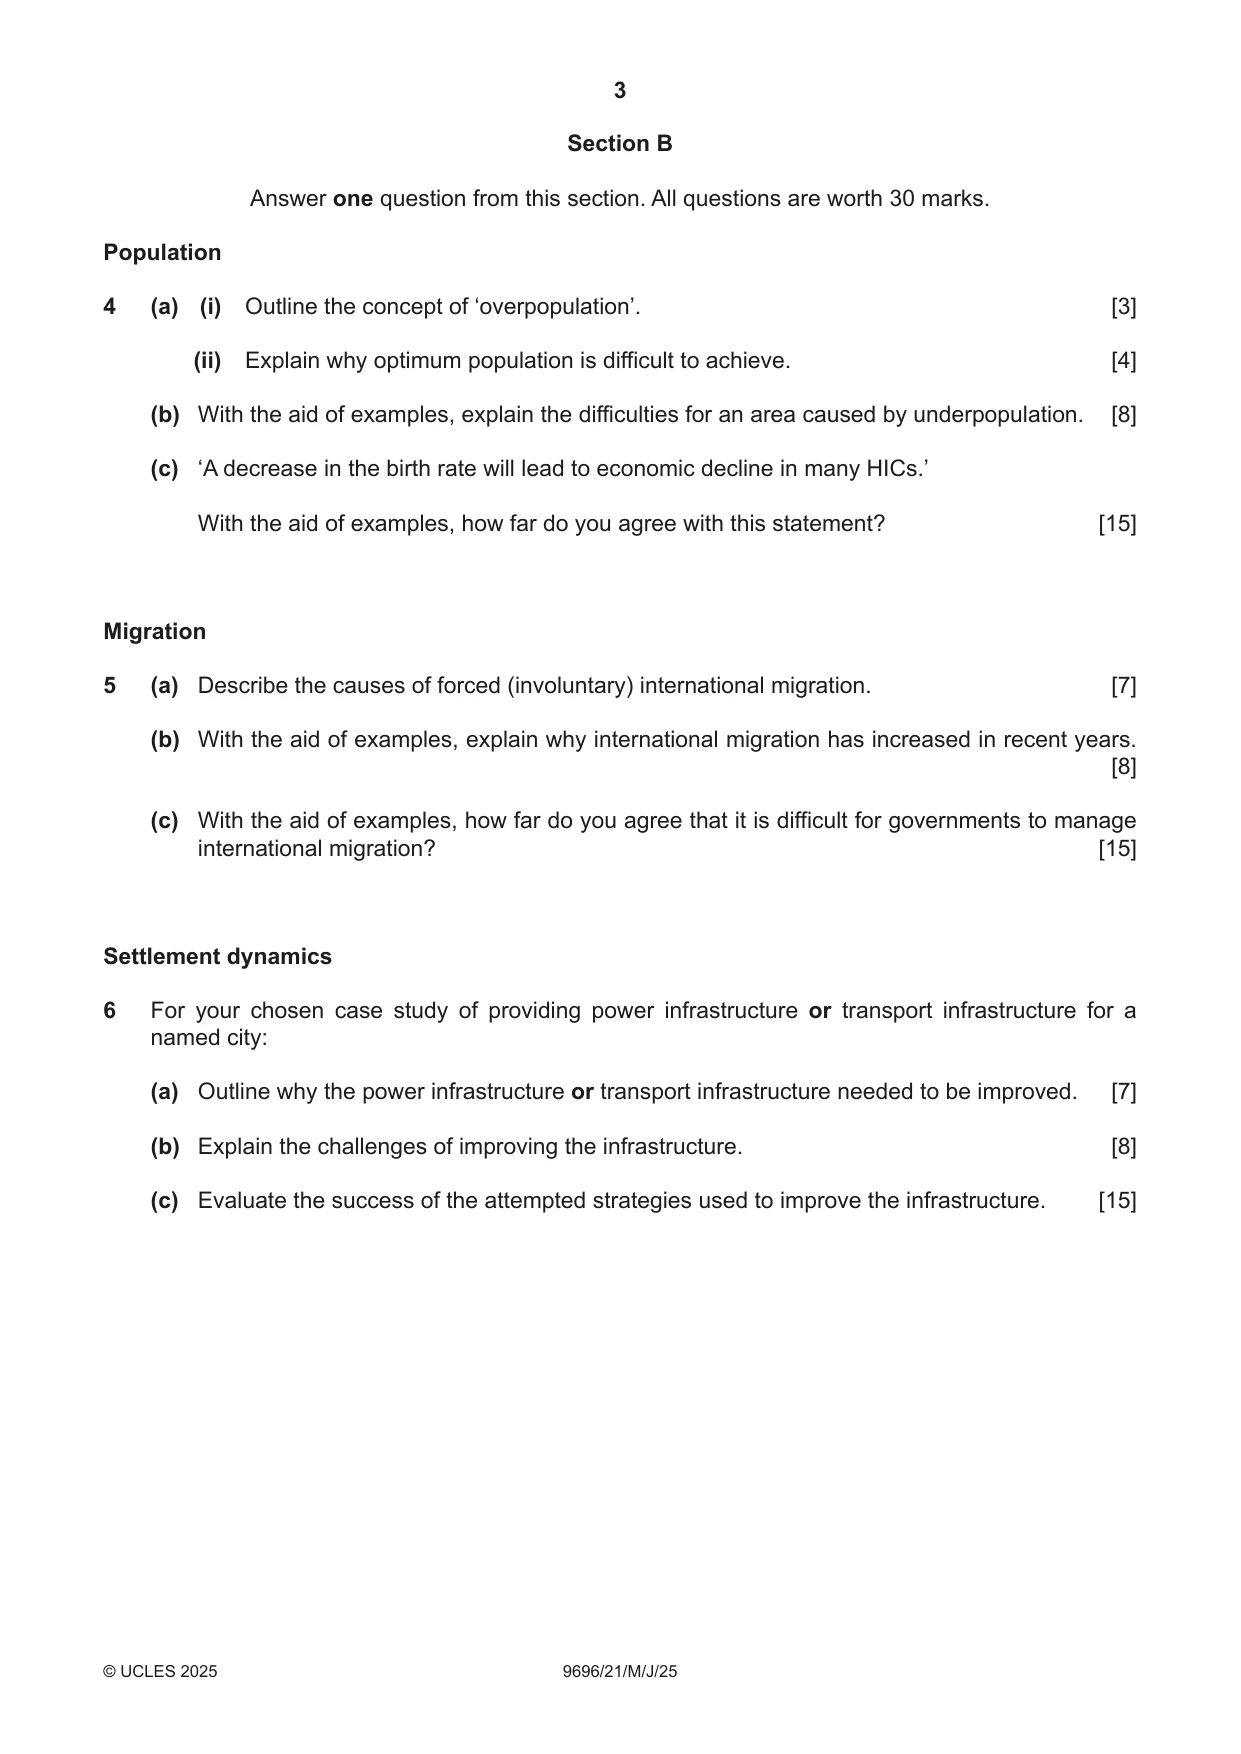

Mark scheme20 pages
Answers below. Sit the paper first if you are practising.

Questions as text
Q1 · The percentage of the population aged 0–14 years, 15–64 years, and 65 years and over, for…
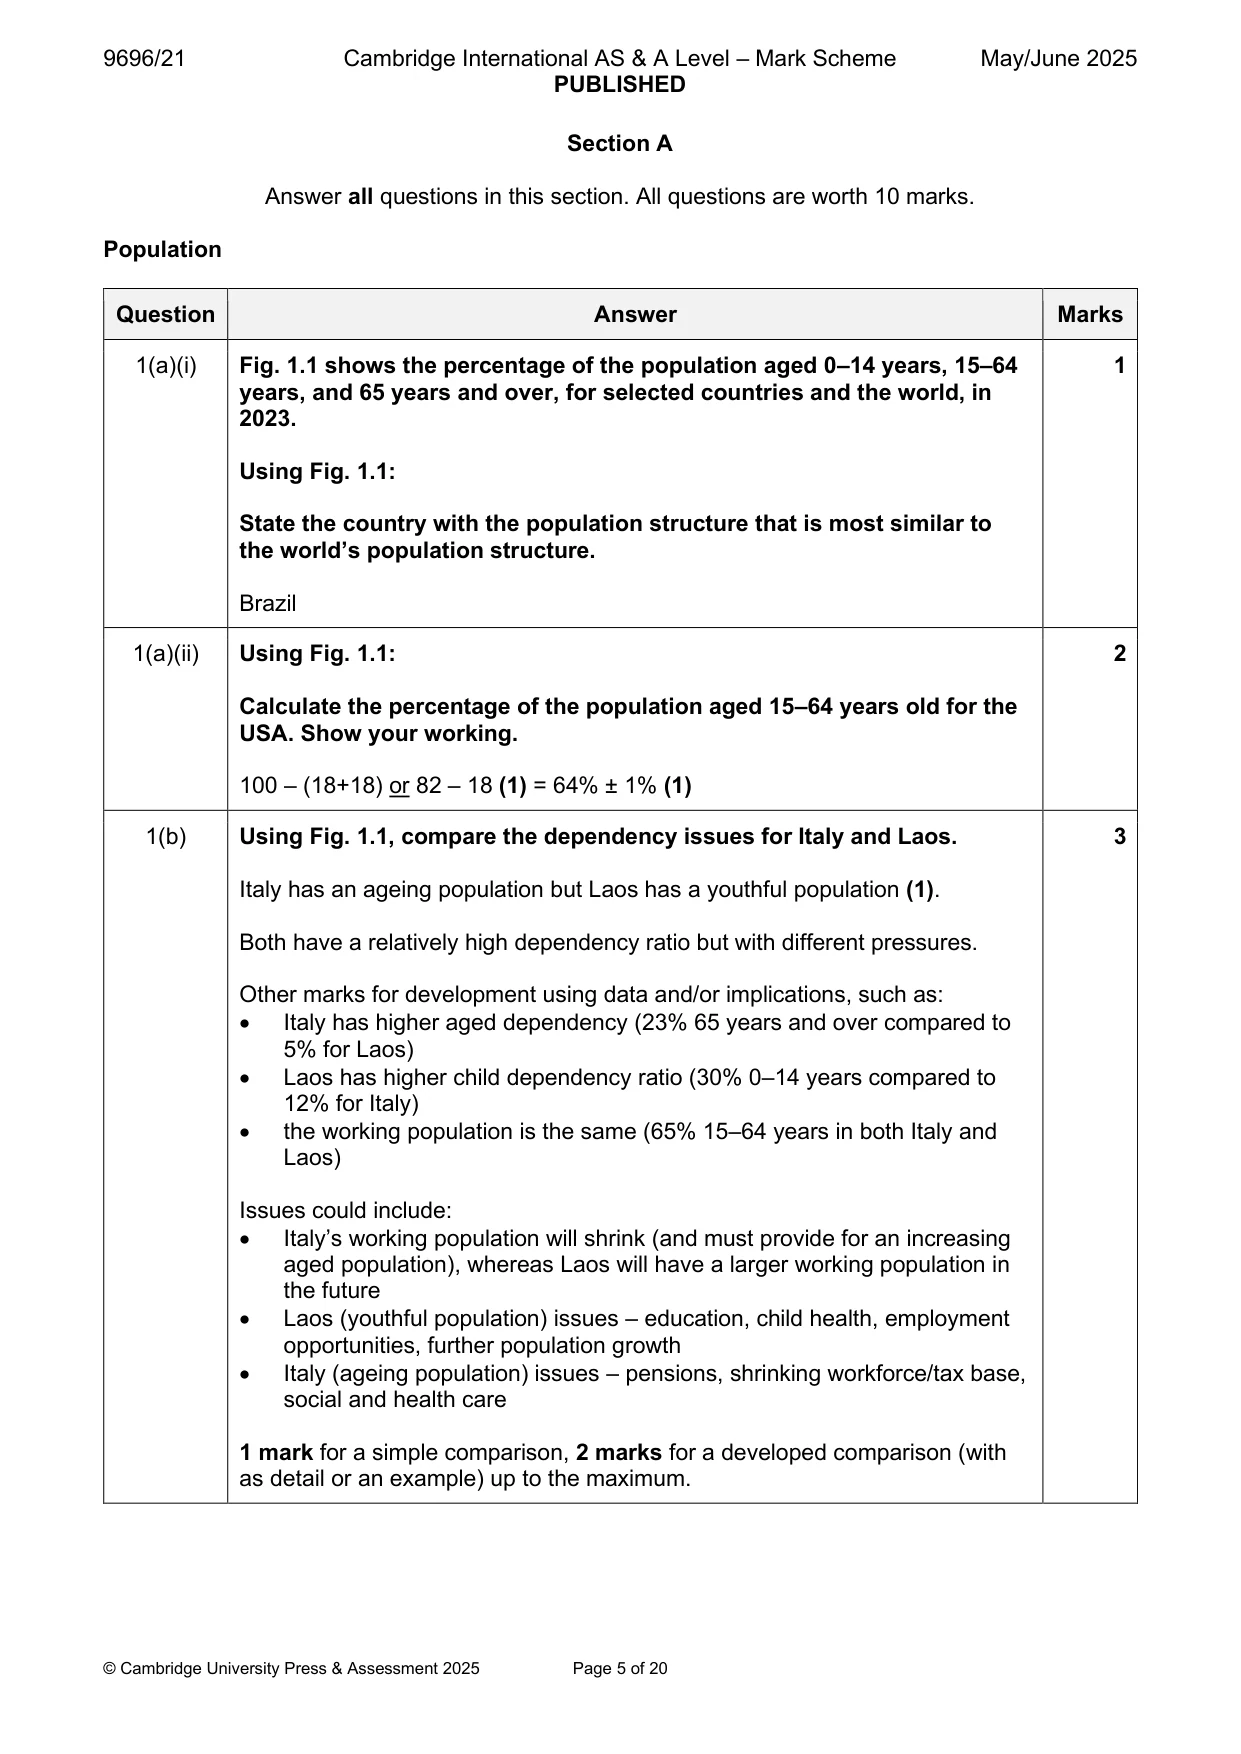
1 Fig. 1.1 shows the percentage of the population aged 0–14 years, 15–64 years, and 65 years and over, for selected countries and the world, in 2023. (a) Using Fig. 1.1: (i) state the country with the population structure that is most similar to the world’s population structure [1] (ii) calculate the percentage of the population aged 15–64 years old for the USA. Show your working. [2] (b) Using Fig. 1.1, compare the dependency issues for Italy and Laos. [3] (c) Suggest why the dependency ratio may not be an accurate indicator of the percentage of the working population in a country. [4] Migration/Settlement dynamics
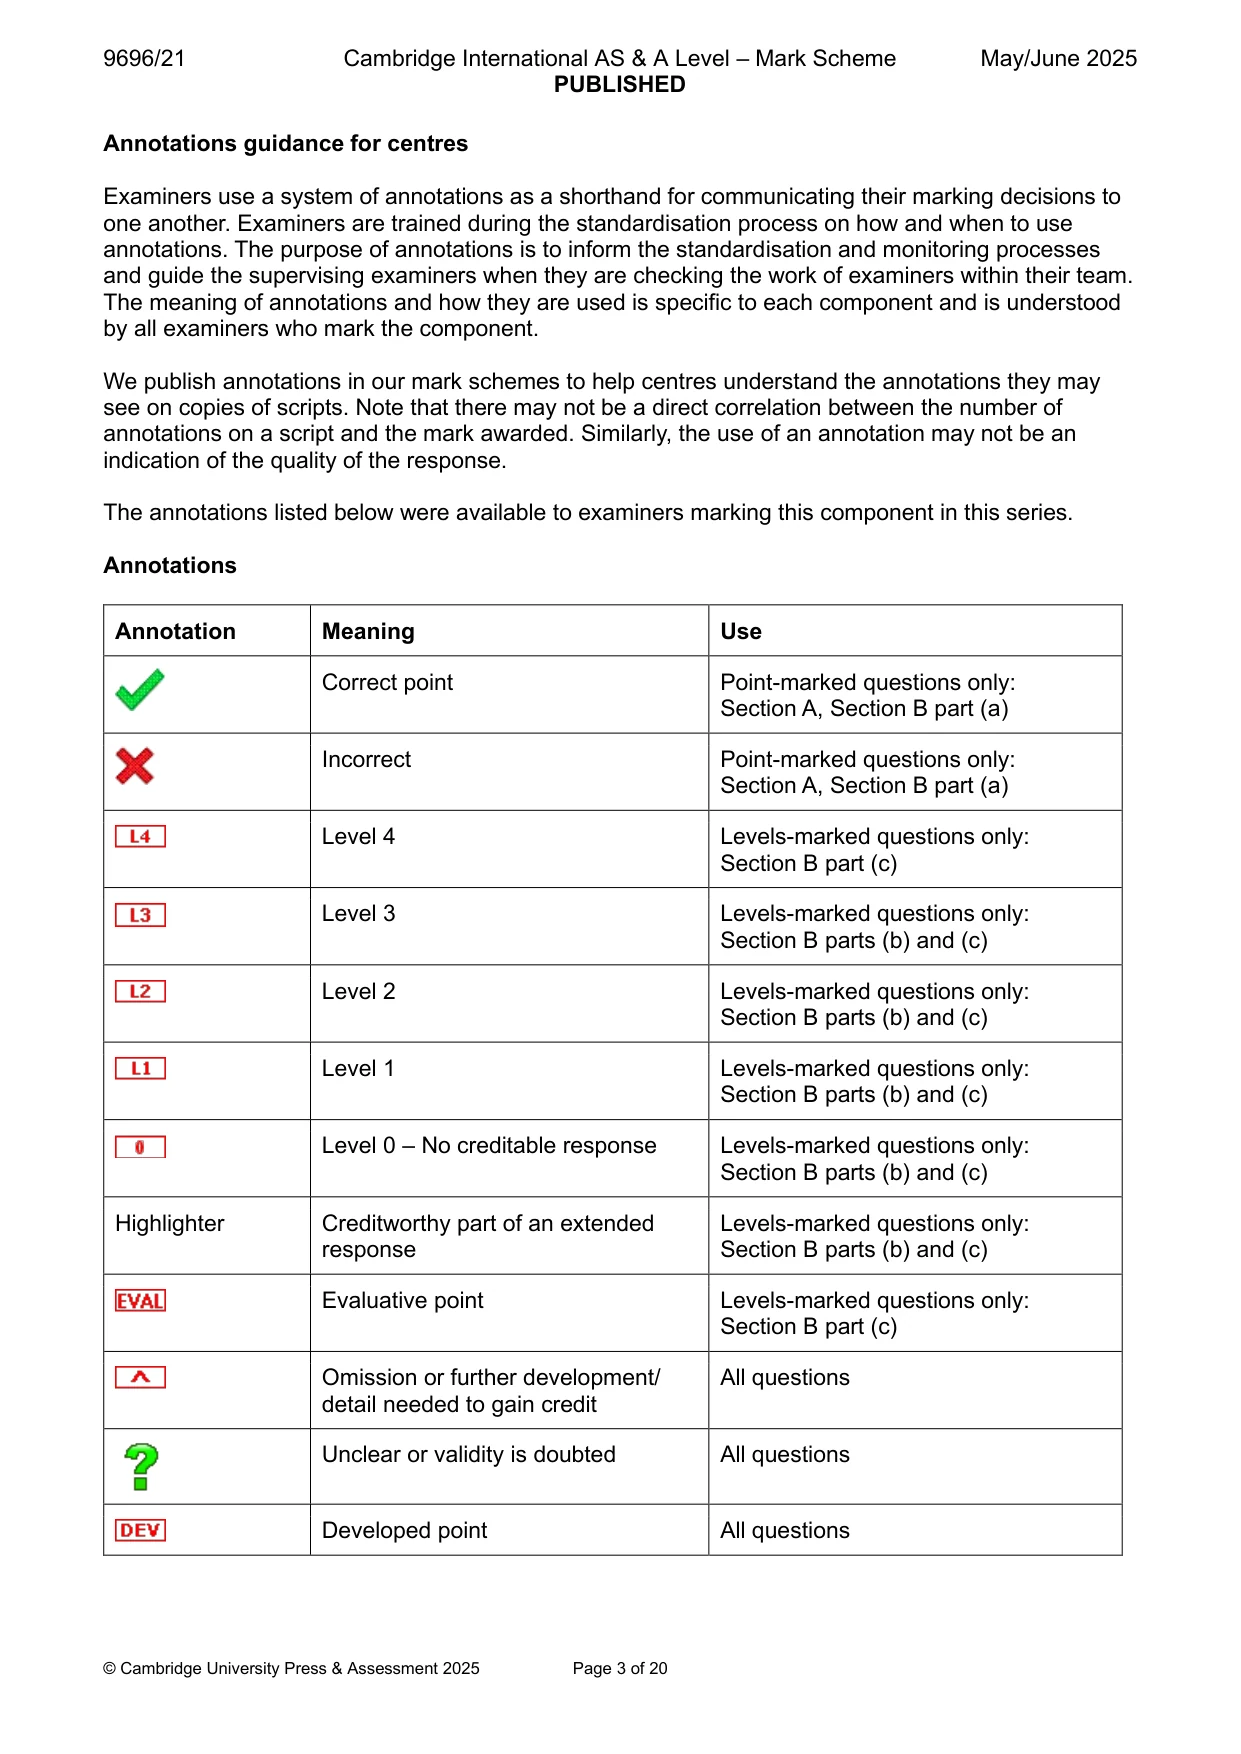
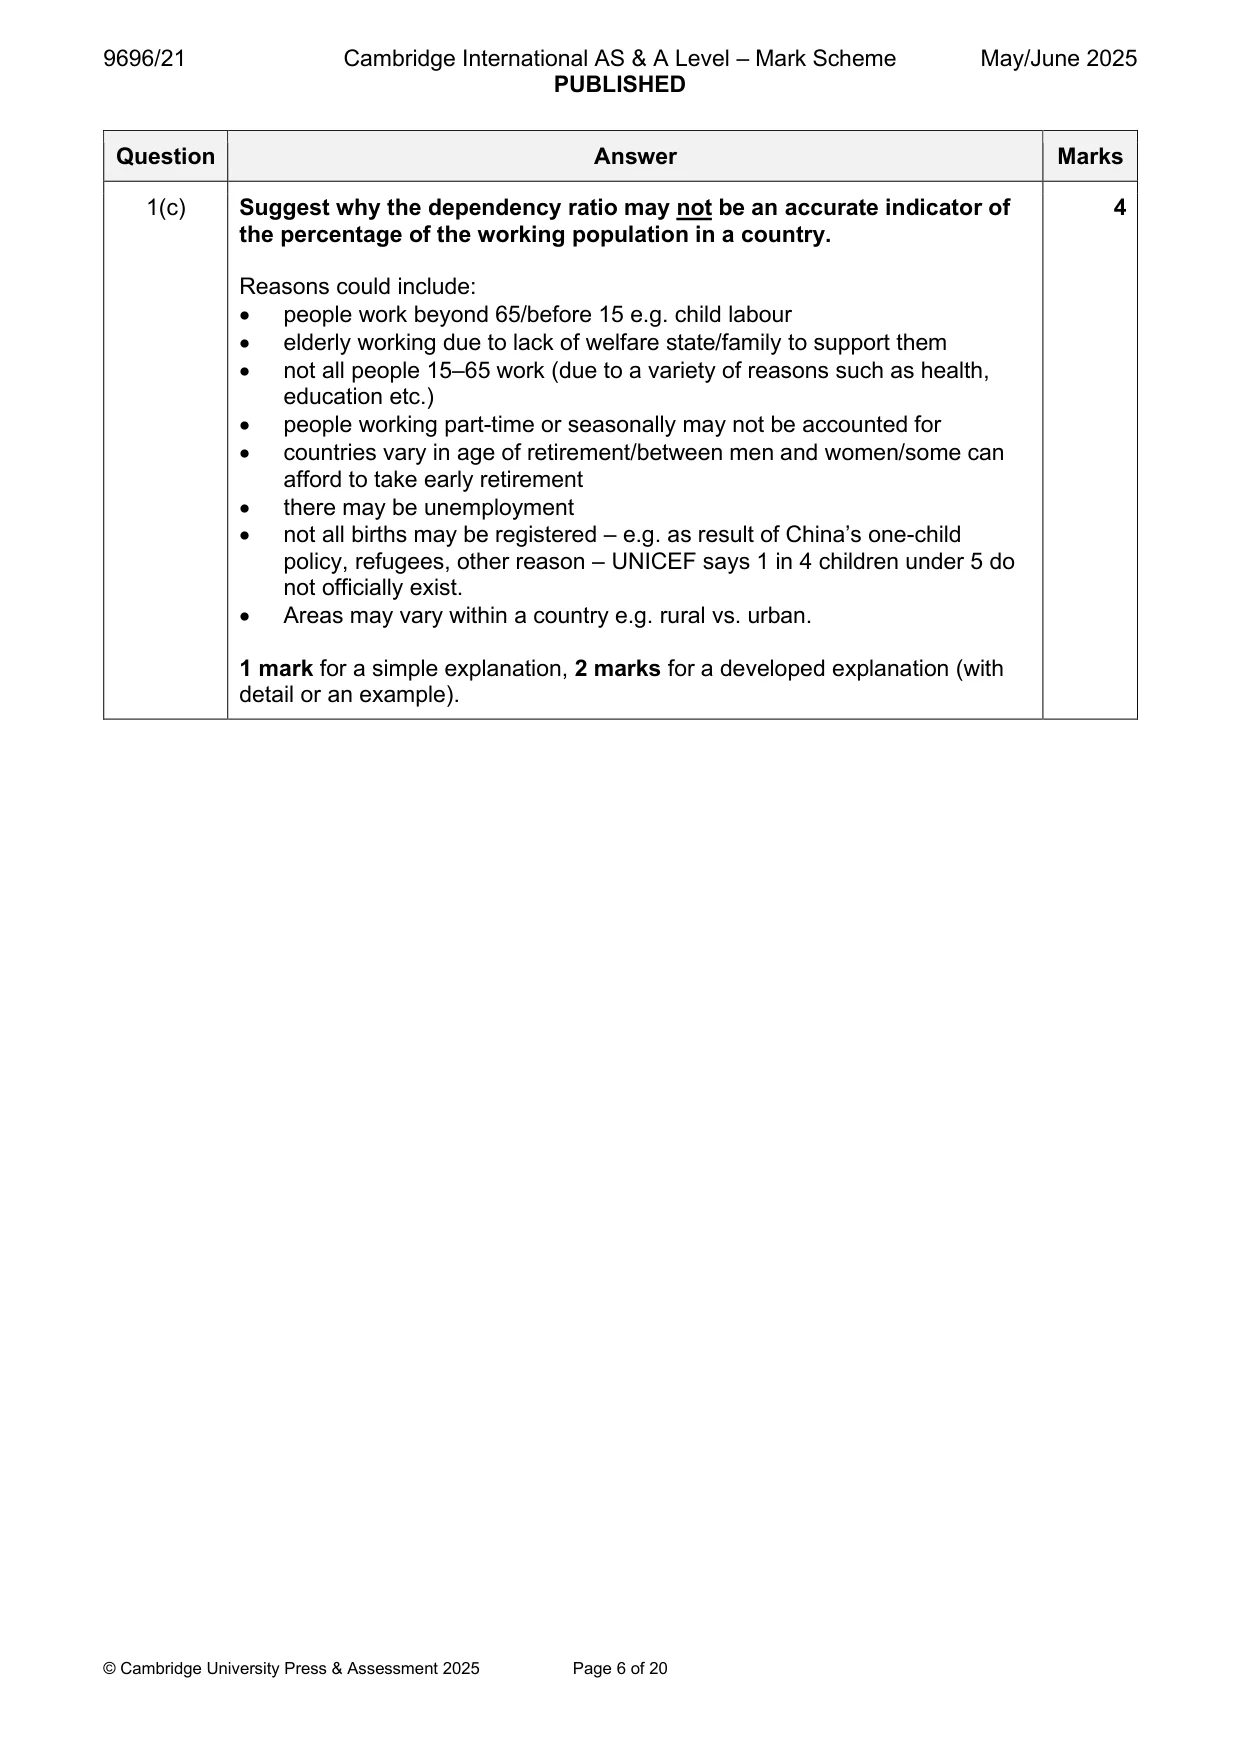
Mark scheme: Question Answer Marks 1(a)(i) Fig. 1.1 shows the percentage of the population aged 0–14 years, 15–64 1 years, and 65 years and over, for selected countries and the world, in 2023. Using Fig. 1.1: State the country with the population structure that is most similar to the world’s population structure. Brazil 1(a)(ii) Using Fig. 1.1: 2 Calculate the percentage of the population aged 15–64 years old for the USA. Show your working. 100 – (18+18) or 82 – 18 (1) = 64% ± 1% (1) 1(b) Using Fig. 1.1, compare the dependency issues for Italy and Laos. 3 Italy has an ageing population but Laos has a youthful population (1). Both have a relatively high dependency ratio but with different pressures. Other marks for development using data and/or implications, such as: • Italy has higher aged dependency (23% 65 years and over compared to 5% for Laos) • Laos has higher child dependency ratio (30% 0–14 years compared to 12% for Italy) • the working population is the same (65% 15–64 years in both Italy and Laos) Issues could include: • Italy’s working population will shrink (and must provide for an increasing aged population), whereas Laos will have a larger working population in the future • Laos (youthful population) issues – education, child health, employment opportunities, further population growth • Italy (ageing population) issues – pensions, shrinking workforce/tax base, social and health care 1 mark for a simple comparison, 2 marks for a developed comparison (with as detail or an example) up to the maximum. 1(c) Suggest why the dependency ratio may not be an accurate indicator of 4 the percentage of the working population in a country. Reasons could include: • people work beyond 65/before 15 e.g. child labour • elderly working due to lack of welfare state/family to support them • not all people 15–65 work (due to a variety of reasons such as health, education etc.) • people working part-time or seasonally may not be accounted for • countries vary in age of retirement/between men and women/some can afford to take early retirement • there may be unemployment • not all births may be registered – e.g. as result of China’s one-child policy, refugees, other reason – UNICEF says 1 in 4 children under 5 do not officially exist. • Areas may vary within a country e.g. rural vs. urban. 1 mark for a simple explanation, 2 marks for a developed explanation (with detail or an example). Migration/Settlement dynamics
Q2 · The top ten sources of international migrants into Brazil, an MIC in South America, in…
2 Table 2.1 shows the top ten sources of international migrants into Brazil, an MIC in South America, in 2020. (a) Describe the pattern of international migrants into Brazil shown in Table 2.1. [4] (b) Suggest how the characteristics of international migrants arriving from HICs may differ from the characteristics of international migrants arriving from LICs. [2] (c) Explain why most international migrants settle in the major cities of receiving/destination countries. [4] Population/Migration/Settlement dynamics
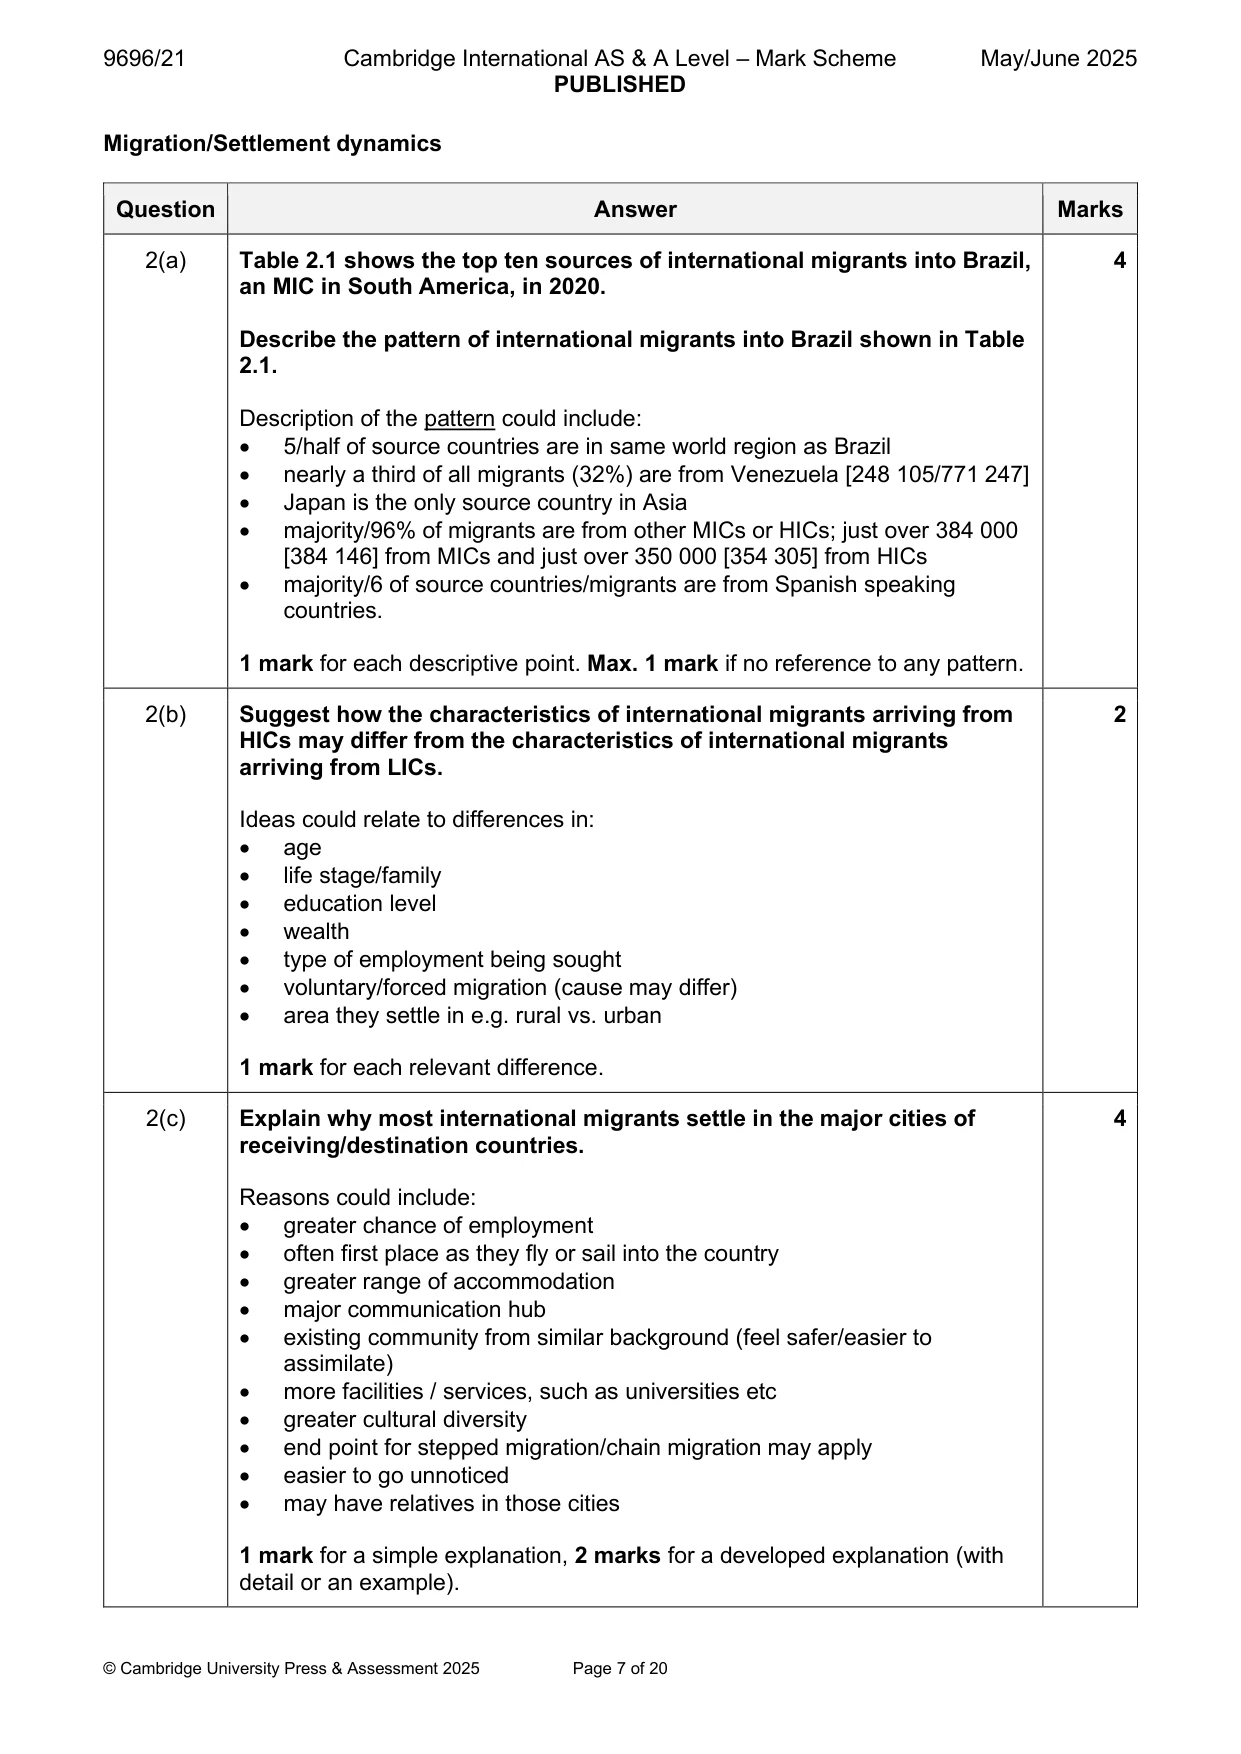
Mark scheme: 2(a) Table 2.1 shows the top ten sources of international migrants into Brazil, 4 an MIC in South America, in 2020. Describe the pattern of international migrants into Brazil shown in Table 2.1. Description of the pattern could include: • 5/half of source countries are in same world region as Brazil • nearly a third of all migrants (32%) are from Venezuela [248 105/771 247] • Japan is the only source country in Asia • majority/96% of migrants are from other MICs or HICs; just over 384 000 [384 146] from MICs and just over 350 000 [354 305] from HICs • majority/6 of source countries/migrants are from Spanish speaking countries. 1 mark for each descriptive point. Max. 1 mark if no reference to any pattern. 2(b) Suggest how the characteristics of international migrants arriving from 2 HICs may differ from the characteristics of international migrants arriving from LICs. Ideas could relate to differences in: • age • life stage/family • education level • wealth • type of employment being sought • voluntary/forced migration (cause may differ) • area they settle in e.g. rural vs. urban 1 mark for each relevant difference. 2(c) Explain why most international migrants settle in the major cities of 4 receiving/destination countries. Reasons could include: • greater chance of employment • often first place as they fly or sail into the country • greater range of accommodation • major communication hub • existing community from similar background (feel safer/easier to assimilate) • more facilities / services, such as universities etc • greater cultural diversity • end point for stepped migration/chain migration may apply • easier to go unnoticed • may have relatives in those cities 1 mark for a simple explanation, 2 marks for a developed explanation (with detail or an example). Population/Migration/Settlement dynamics
Q3 · The population of three rural settlements in an HIC in 2001, 2011 and 2021
3 Fig. 3.1 shows the population of three rural settlements in an HIC in 2001, 2011 and 2021. (a) Compare the population changes for the rural settlements shown in Fig. 3.1. [4] (b) Suggest two reasons for the change in the population for settlement A between 2011 and 2021. [2] (c) Explain why rural settlements that are not near to any town or city might decline in population. [4]
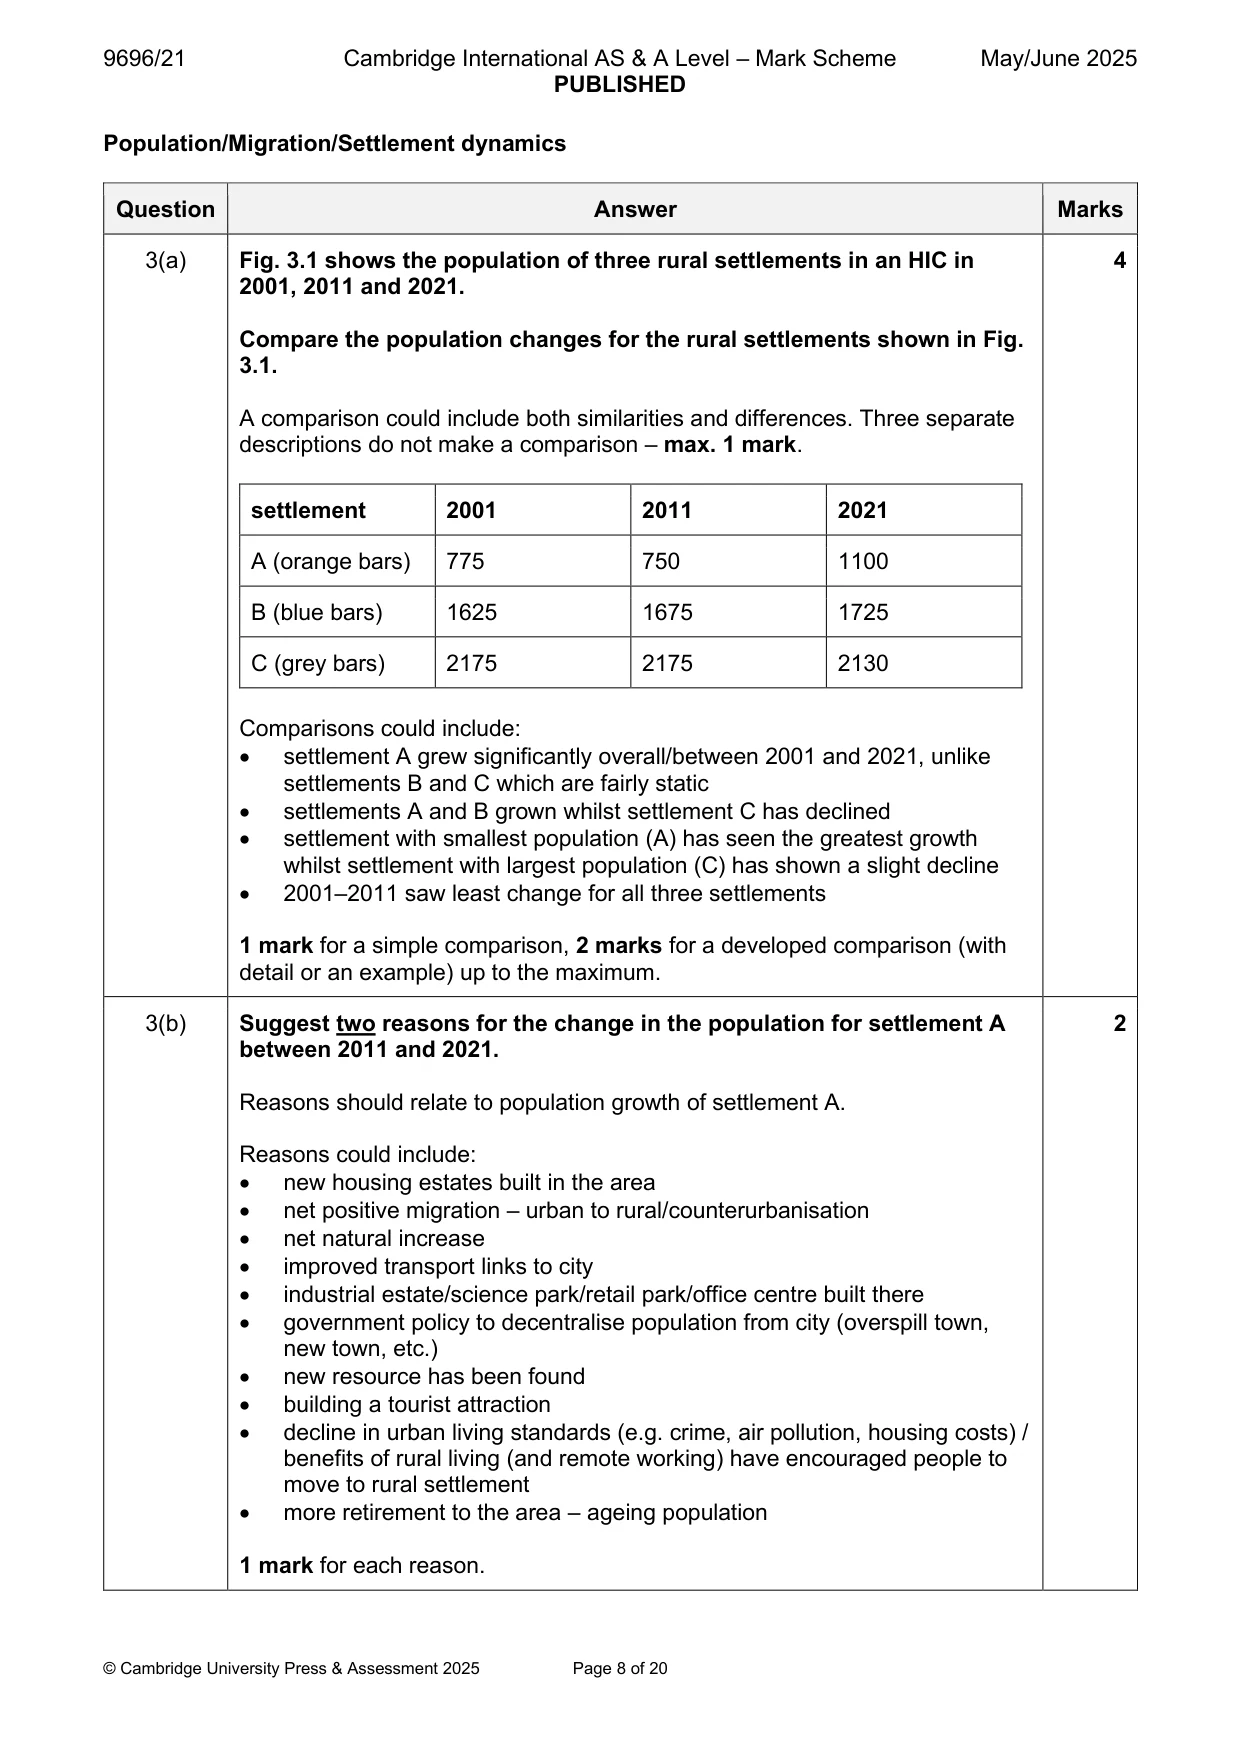
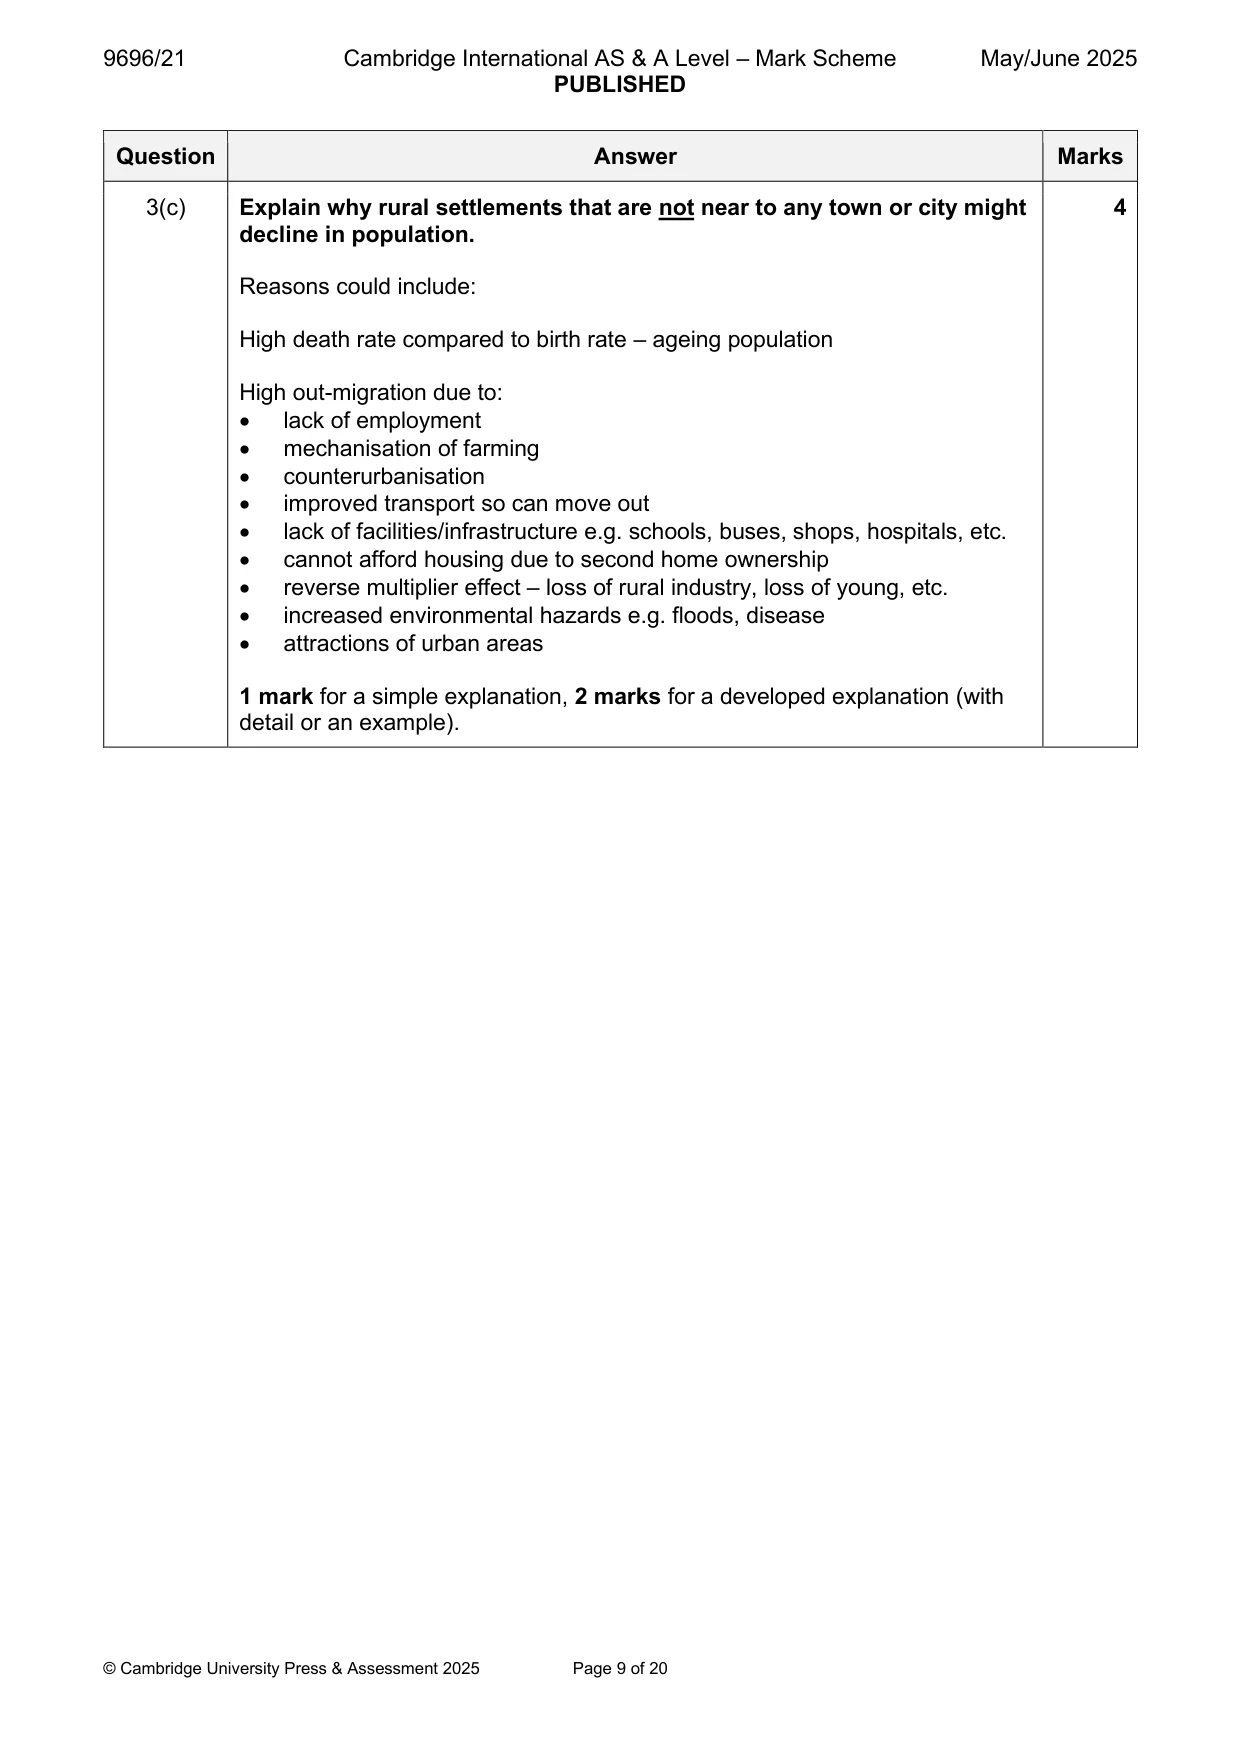
Mark scheme: 3(a) Fig. 3.1 shows the population of three rural settlements in an HIC in 4 2001, 2011 and 2021. Compare the population changes for the rural settlements shown in Fig. 3.1. A comparison could include both similarities and differences. Three separate descriptions do not make a comparison – max. 1 mark. settlement 2001 2011 2021 A (orange bars) 775 750 1100 B (blue bars) 1625 1675 1725 C (grey bars) 2175 2175 2130 Comparisons could include: • settlement A grew significantly overall/between 2001 and 2021, unlike settlements B and C which are fairly static • settlements A and B grown whilst settlement C has declined • settlement with smallest population (A) has seen the greatest growth whilst settlement with largest population (C) has shown a slight decline • 2001–2011 saw least change for all three settlements 1 mark for a simple comparison, 2 marks for a developed comparison (with detail or an example) up to the maximum. 3(b) Suggest two reasons for the change in the population for settlement A 2 between 2011 and 2021. Reasons should relate to population growth of settlement A. Reasons could include: • new housing estates built in the area • net positive migration – urban to rural/counterurbanisation • net natural increase • improved transport links to city • industrial estate/science park/retail park/office centre built there • government policy to decentralise population from city (overspill town, new town, etc.) • new resource has been found • building a tourist attraction • decline in urban living standards (e.g. crime, air pollution, housing costs) / benefits of rural living (and remote working) have encouraged people to move to rural settlement • more retirement to the area – ageing population 1 mark for each reason. 3(c) Explain why rural settlements that are not near to any town or city might 4 decline in population. Reasons could include: High death rate compared to birth rate – ageing population High out-migration due to: • lack of employment • mechanisation of farming • counterurbanisation • improved transport so can move out • lack of facilities/infrastructure e.g. schools, buses, shops, hospitals, etc. • cannot afford housing due to second home ownership • reverse multiplier effect – loss of rural industry, loss of young, etc. • increased environmental hazards e.g. floods, disease • attractions of urban areas 1 mark for a simple explanation, 2 marks for a developed explanation (with detail or an example). Section B Answer one question from this section. All questions are worth 30 marks. Population
Q4 · Outline the concept of ‘overpopulation’
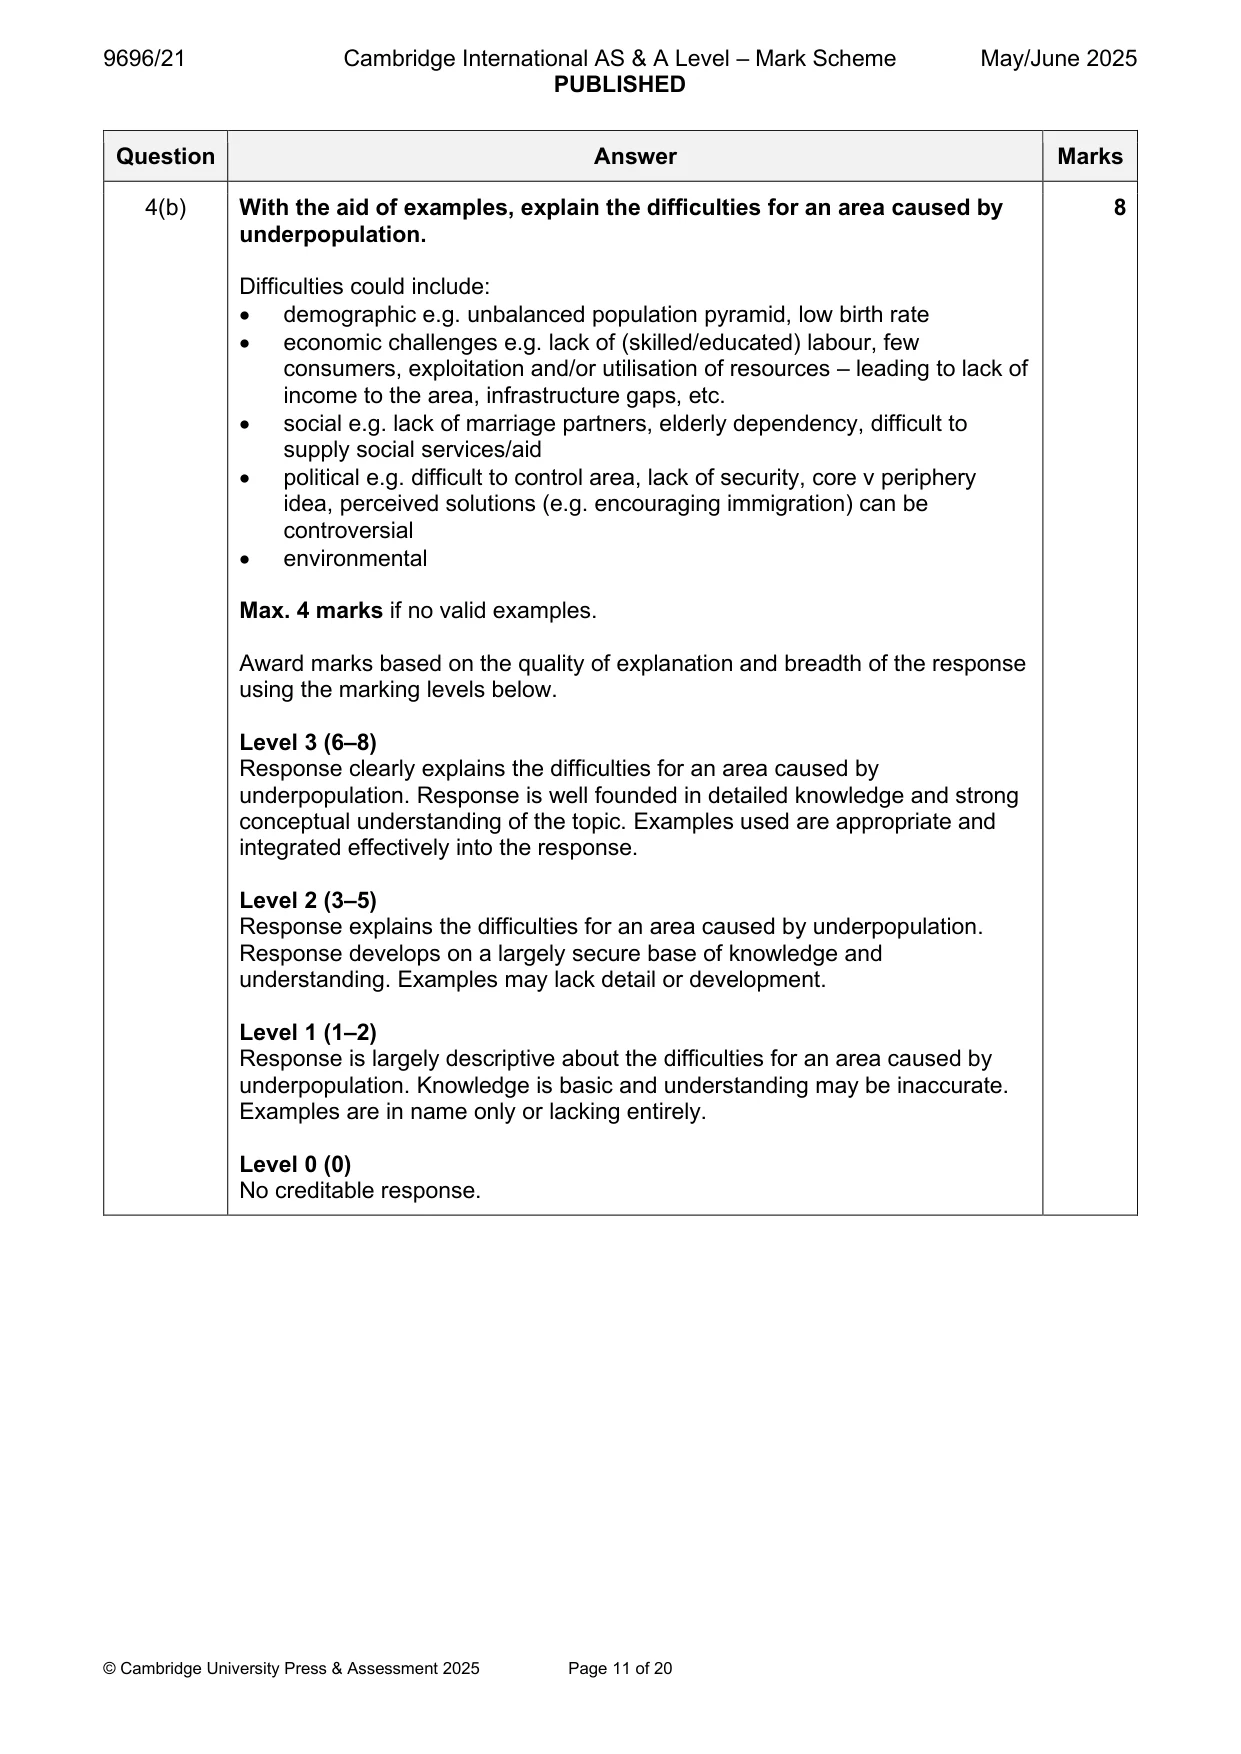
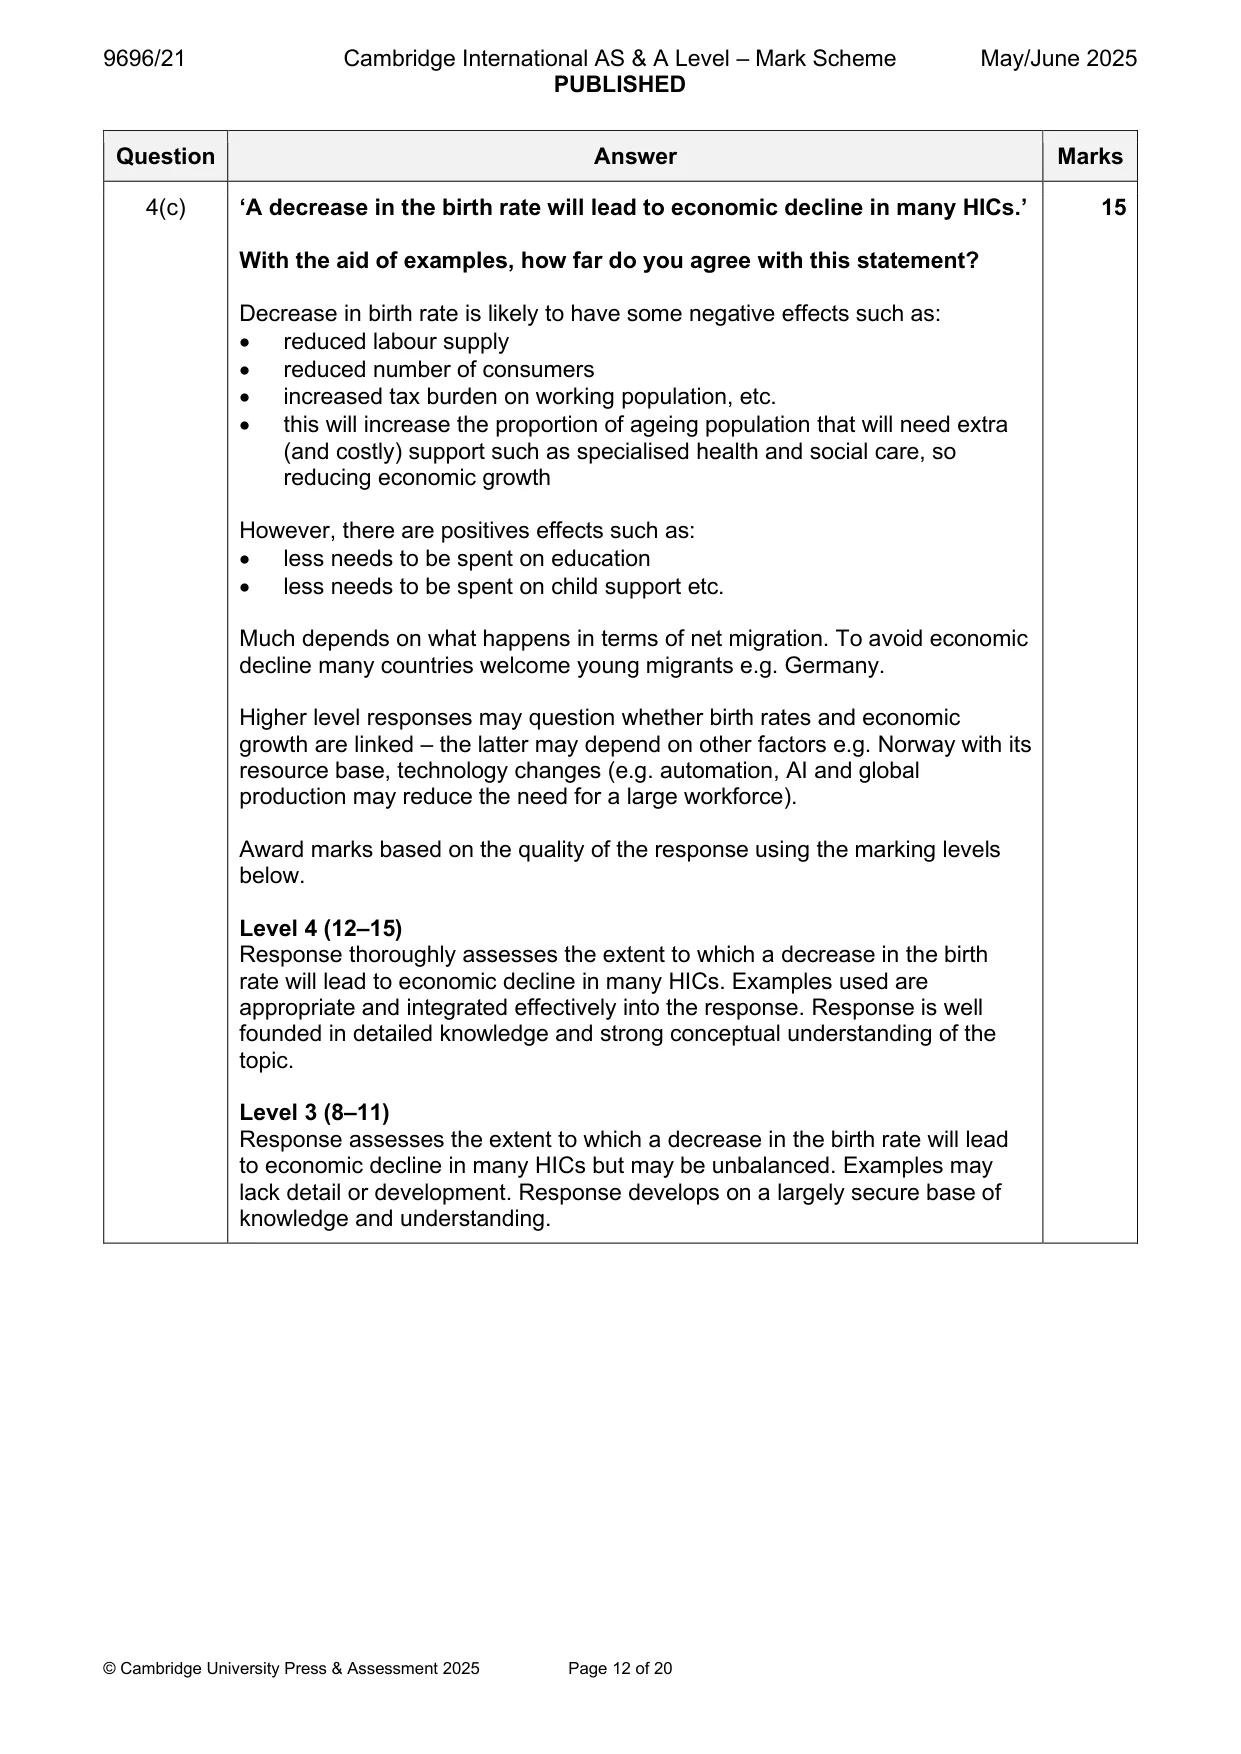
4 (a) (i) Outline the concept of ‘overpopulation’. [3] (ii) Explain why optimum population is difficult to achieve. [4] (b) With the aid of examples, explain the difficulties for an area caused by underpopulation. [8] (c) ‘A decrease in the birth rate will lead to economic decline in many HICs.’ With the aid of examples, how far do you agree with this statement? [15] Migration
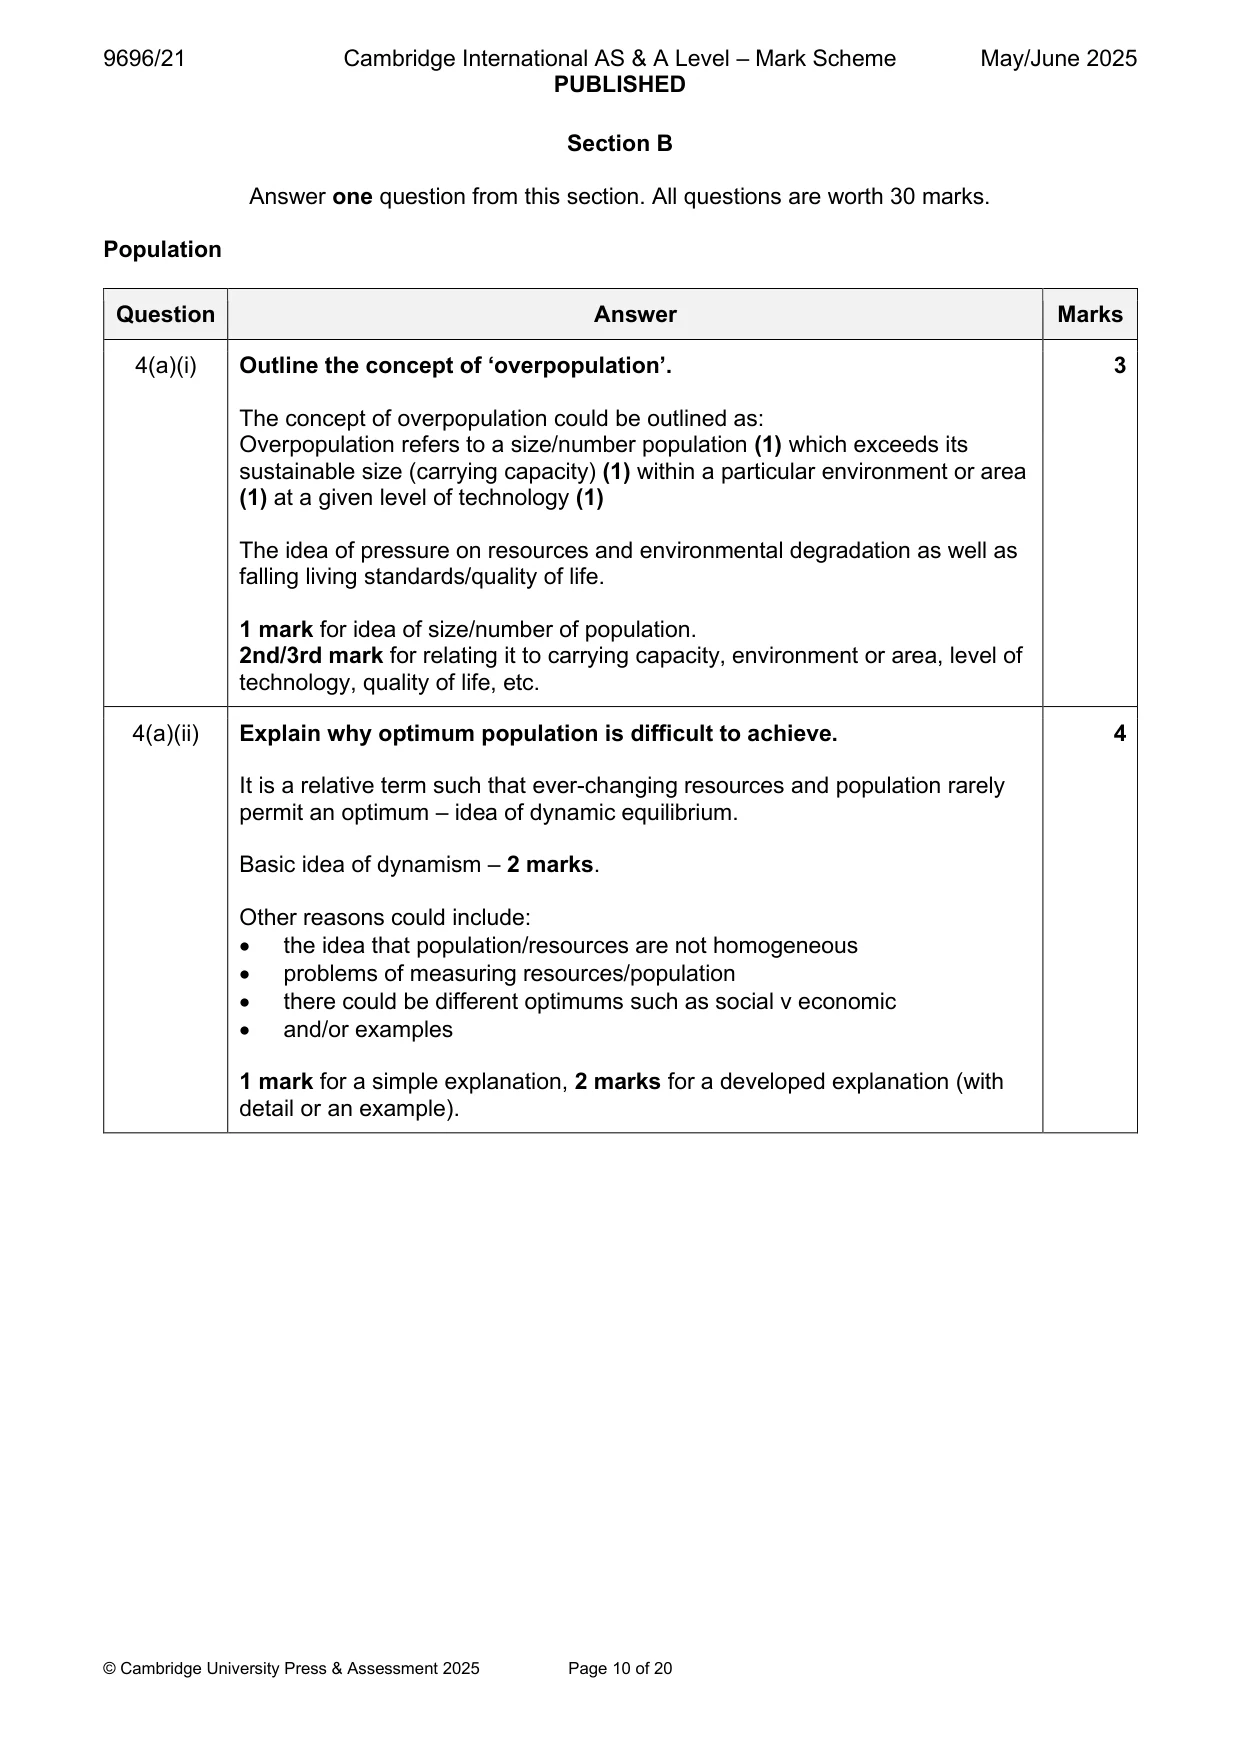
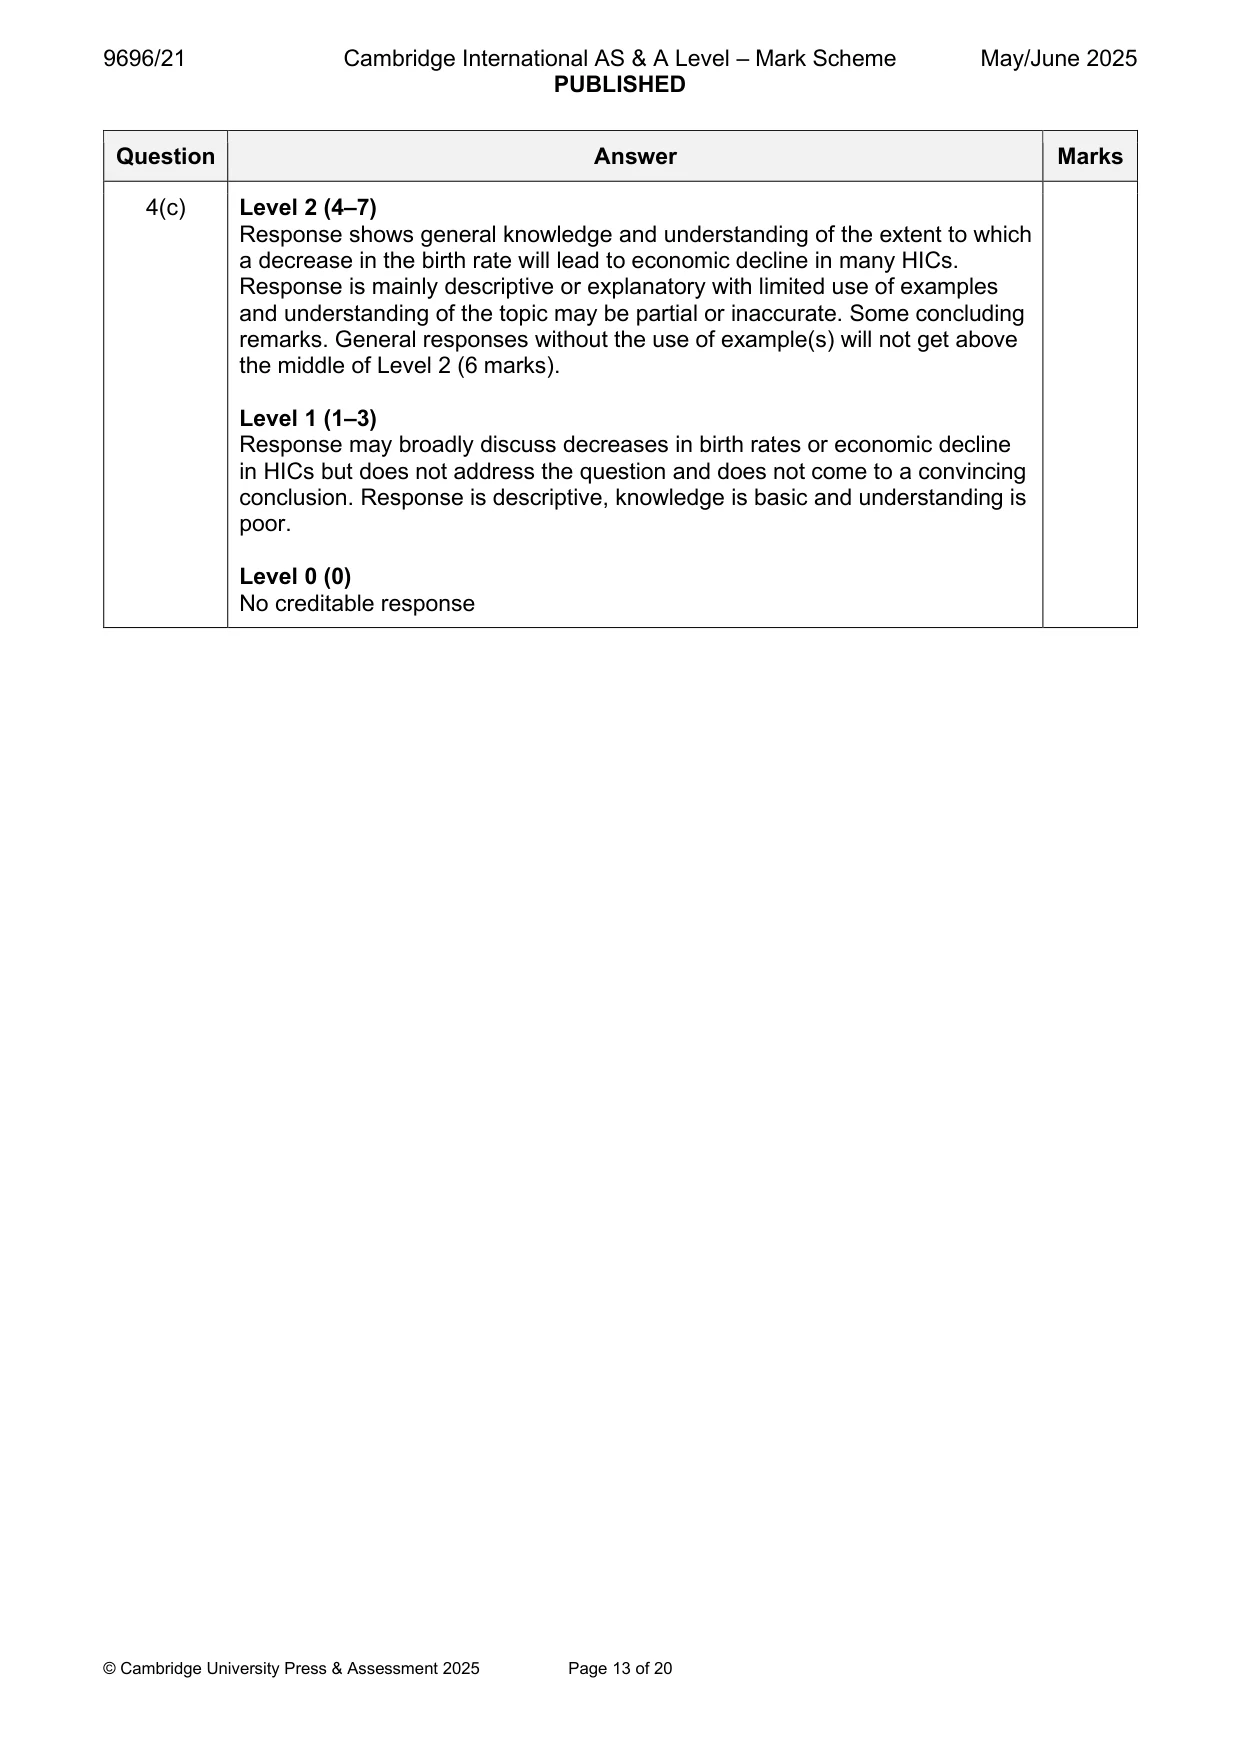
Mark scheme: 4(a)(i) Outline the concept of ‘overpopulation’. 3 The concept of overpopulation could be outlined as: Overpopulation refers to a size/number population (1) which exceeds its sustainable size (carrying capacity) (1) within a particular environment or area (1) at a given level of technology (1) The idea of pressure on resources and environmental degradation as well as falling living standards/quality of life. 1 mark for idea of size/number of population. 2nd/3rd mark for relating it to carrying capacity, environment or area, level of technology, quality of life, etc. 4(a)(ii) Explain why optimum population is difficult to achieve. 4 It is a relative term such that ever-changing resources and population rarely permit an optimum – idea of dynamic equilibrium. Basic idea of dynamism – 2 marks. Other reasons could include: • the idea that population/resources are not homogeneous • problems of measuring resources/population • there could be different optimums such as social v economic • and/or examples 1 mark for a simple explanation, 2 marks for a developed explanation (with detail or an example). 4(b) With the aid of examples, explain the difficulties for an area caused by 8 underpopulation. Difficulties could include: • demographic e.g. unbalanced population pyramid, low birth rate • economic challenges e.g. lack of (skilled/educated) labour, few consumers, exploitation and/or utilisation of resources – leading to lack of income to the area, infrastructure gaps, etc. • social e.g. lack of marriage partners, elderly dependency, difficult to supply social services/aid • political e.g. difficult to control area, lack of security, core v periphery idea, perceived solutions (e.g. encouraging immigration) can be controversial • environmental Max. 4 marks if no valid examples. Award marks based on the quality of explanation and breadth of the response using the marking levels below. Level 3 (6–8) Response clearly explains the difficulties for an area caused by underpopulation. Response is well founded in detailed knowledge and strong conceptual understanding of the topic. Examples used are appropriate and integrated effectively into the response. Level 2 (3–5) Response explains the difficulties for an area caused by underpopulation. Response develops on a largely secure base of knowledge and understanding. Examples may lack detail or development. Level 1 (1–2) Response is largely descriptive about the difficulties for an area caused by underpopulation. Knowledge is basic and understanding may be inaccurate. Examples are in name only or lacking entirely. Level 0 (0) No creditable response. 4(c) ‘A decrease in the birth rate will lead to economic decline in many HICs.’ 15 With the aid of examples, how far do you agree with this statement? Decrease in birth rate is likely to have some negative effects such as: • reduced labour supply • reduced number of consumers • increased tax burden on working population, etc. • this will increase the proportion of ageing population that will need extra (and costly) support such as specialised health and social care, so reducing economic growth However, there are positives effects such as: • less needs to be spent on education • less needs to be spent on child support etc. Much depends on what happens in terms of net migration. To avoid economic decline many countries welcome young migrants e.g. Germany. Higher level responses may question whether birth rates and economic growth are linked – the latter may depend on other factors e.g. Norway with its resource base, technology changes (e.g. automation, AI and global production may reduce the need for a large workforce). Award marks based on the quality of the response using the marking levels below. Level 4 (12–15) Response thoroughly assesses the extent to which a decrease in the birth rate will lead to economic decline in many HICs. Examples used are appropriate and integrated effectively into the response. Response is well founded in detailed knowledge and strong conceptual understanding of the topic. Level 3 (8–11) Response assesses the extent to which a decrease in the birth rate will lead to economic decline in many HICs but may be unbalanced. Examples may lack detail or development. Response develops on a largely secure base of knowledge and understanding. 4(c) Level 2 (4–7) Response shows general knowledge and understanding of the extent to which a decrease in the birth rate will lead to economic decline in many HICs. Response is mainly descriptive or explanatory with limited use of examples and understanding of the topic may be partial or inaccurate. Some concluding remarks. General responses without the use of example(s) will not get above the middle of Level 2 (6 marks). Level 1 (1–3) Response may broadly discuss decreases in birth rates or economic decline in HICs but does not address the question and does not come to a convincing conclusion. Response is descriptive, knowledge is basic and understanding is poor. Level 0 (0) No creditable response Migration
Q5 · Describe the causes of forced (involuntary) international migration
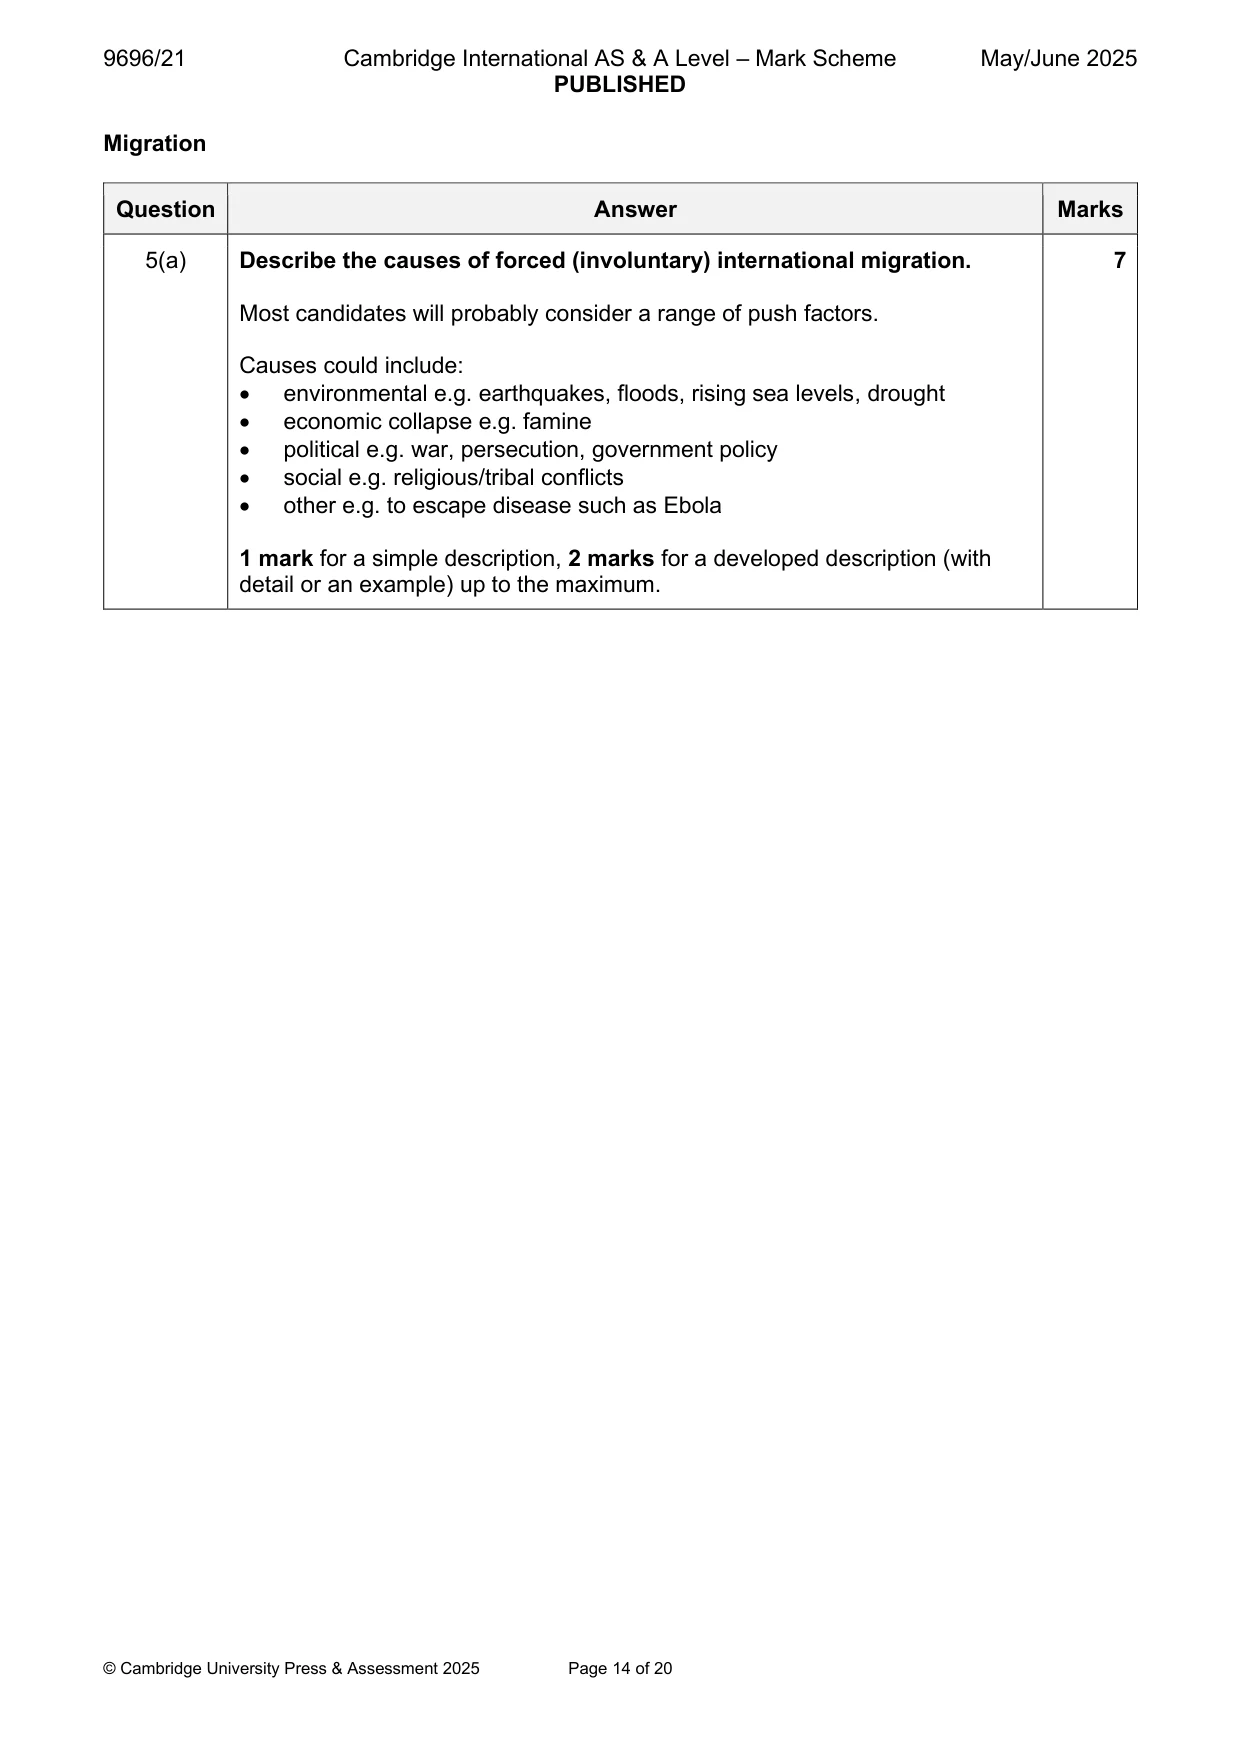
5 (a) Describe the causes of forced (involuntary) international migration. [7] (b) With the aid of examples, explain why international migration has increased in recent years. [8] (c) With the aid of examples, how far do you agree that it is difficult for governments to manage international migration? [15] Settlement dynamics
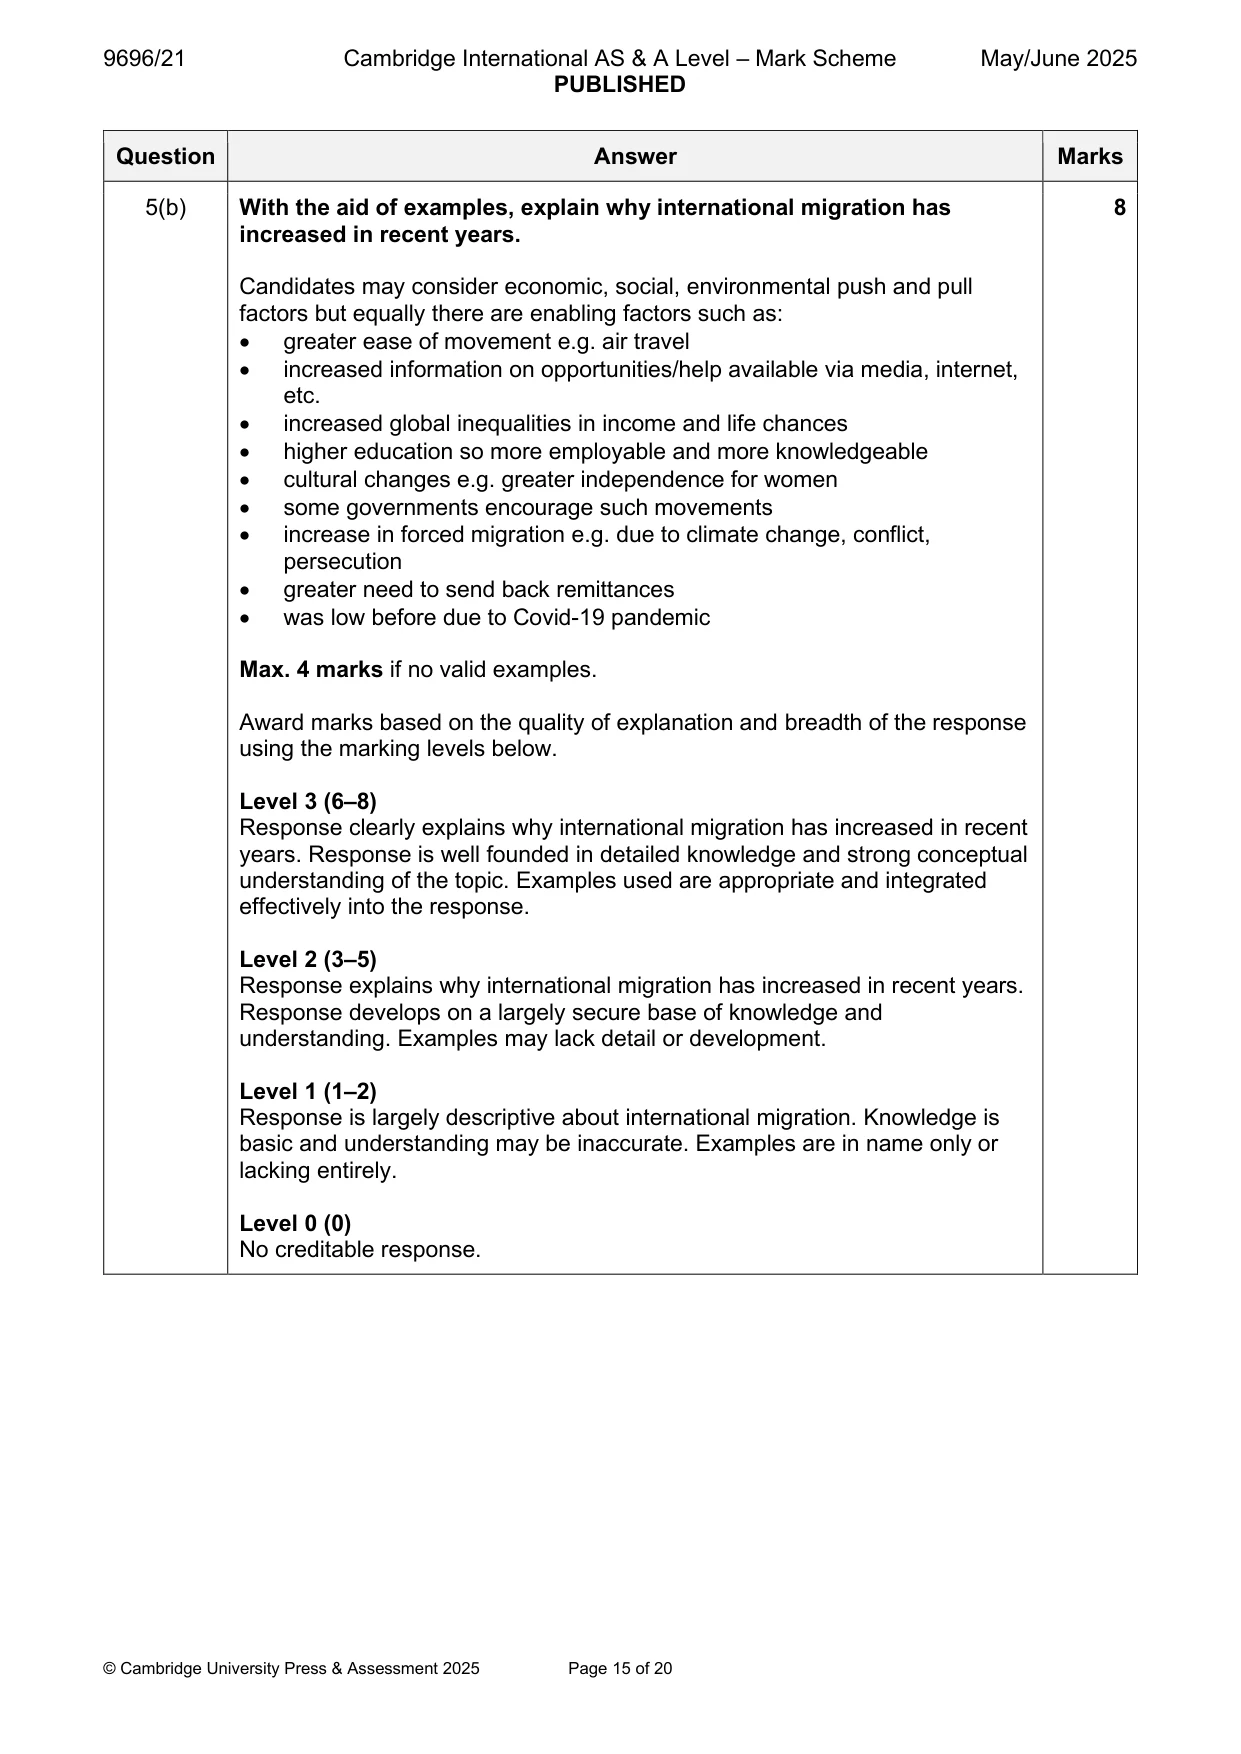
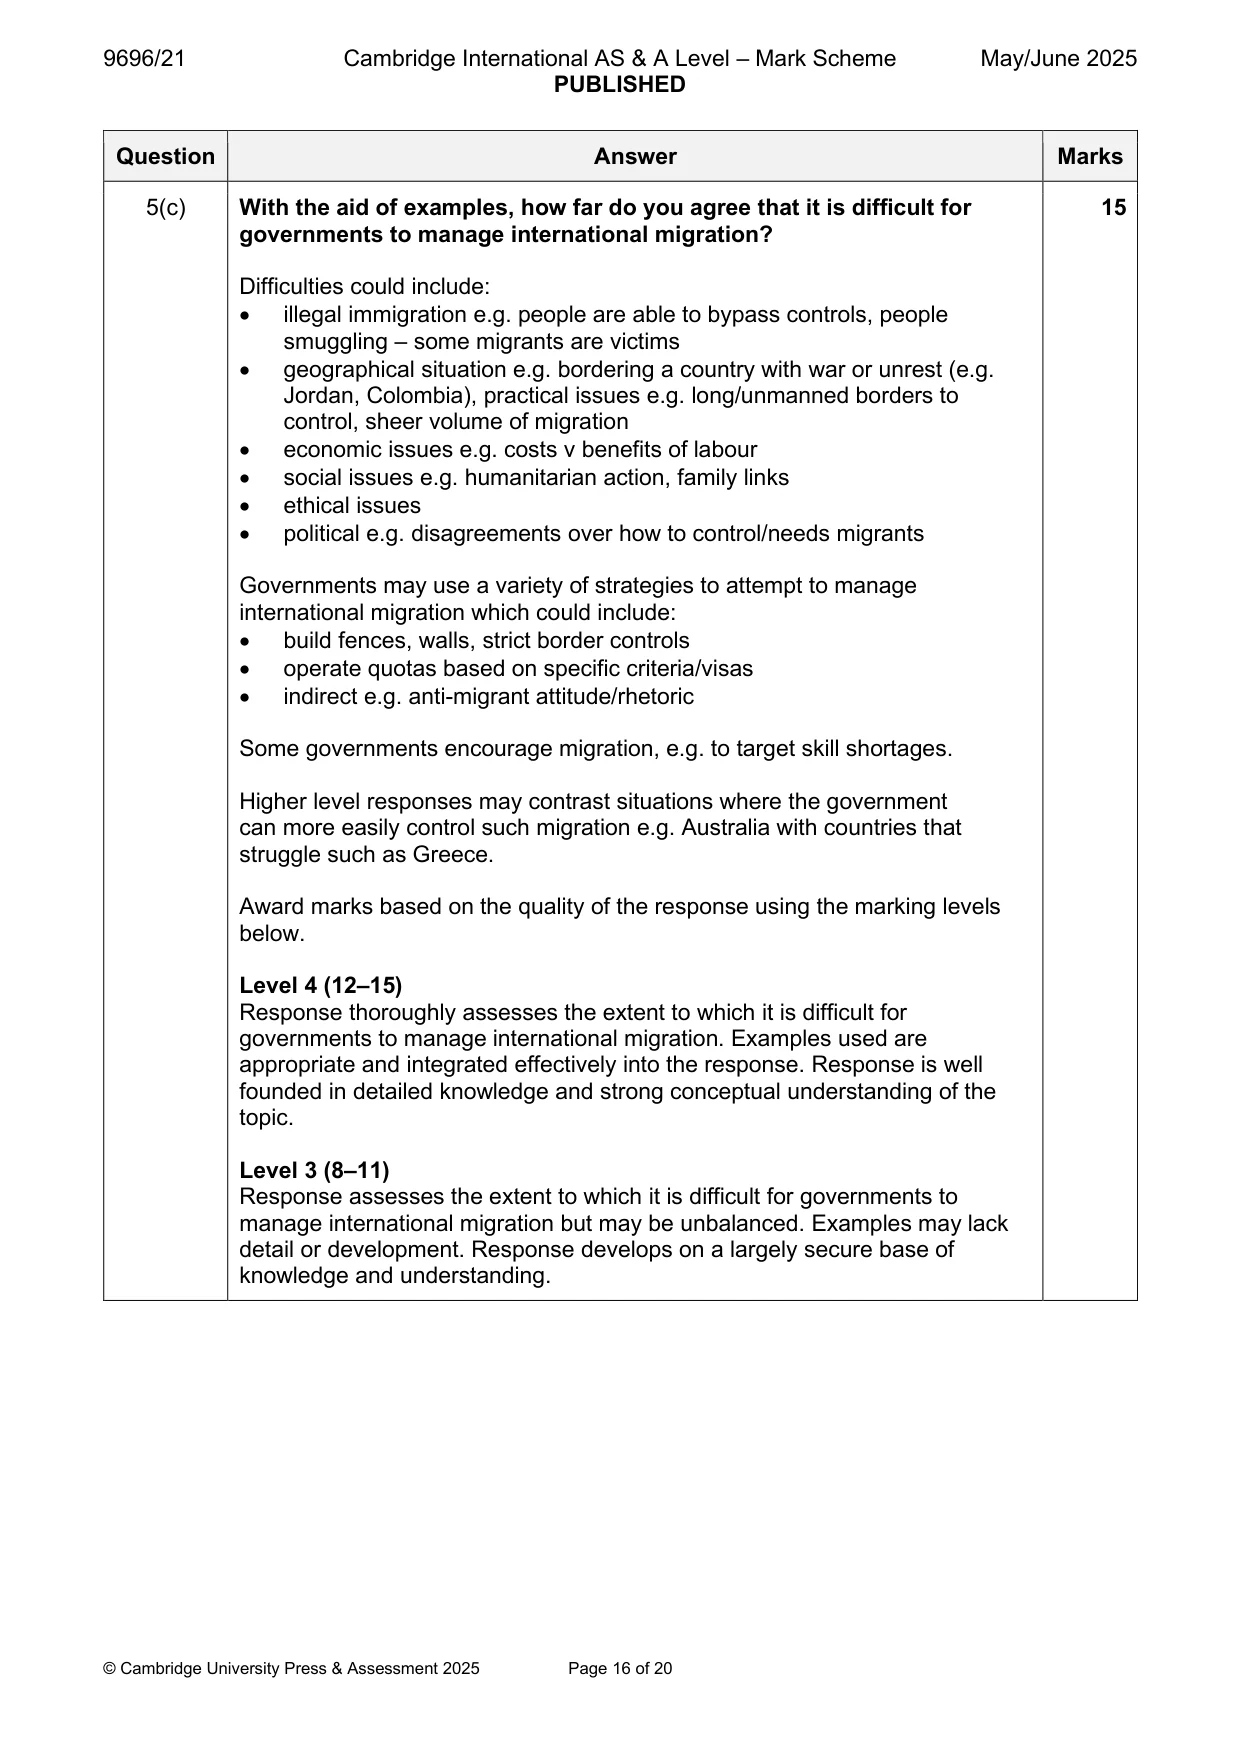
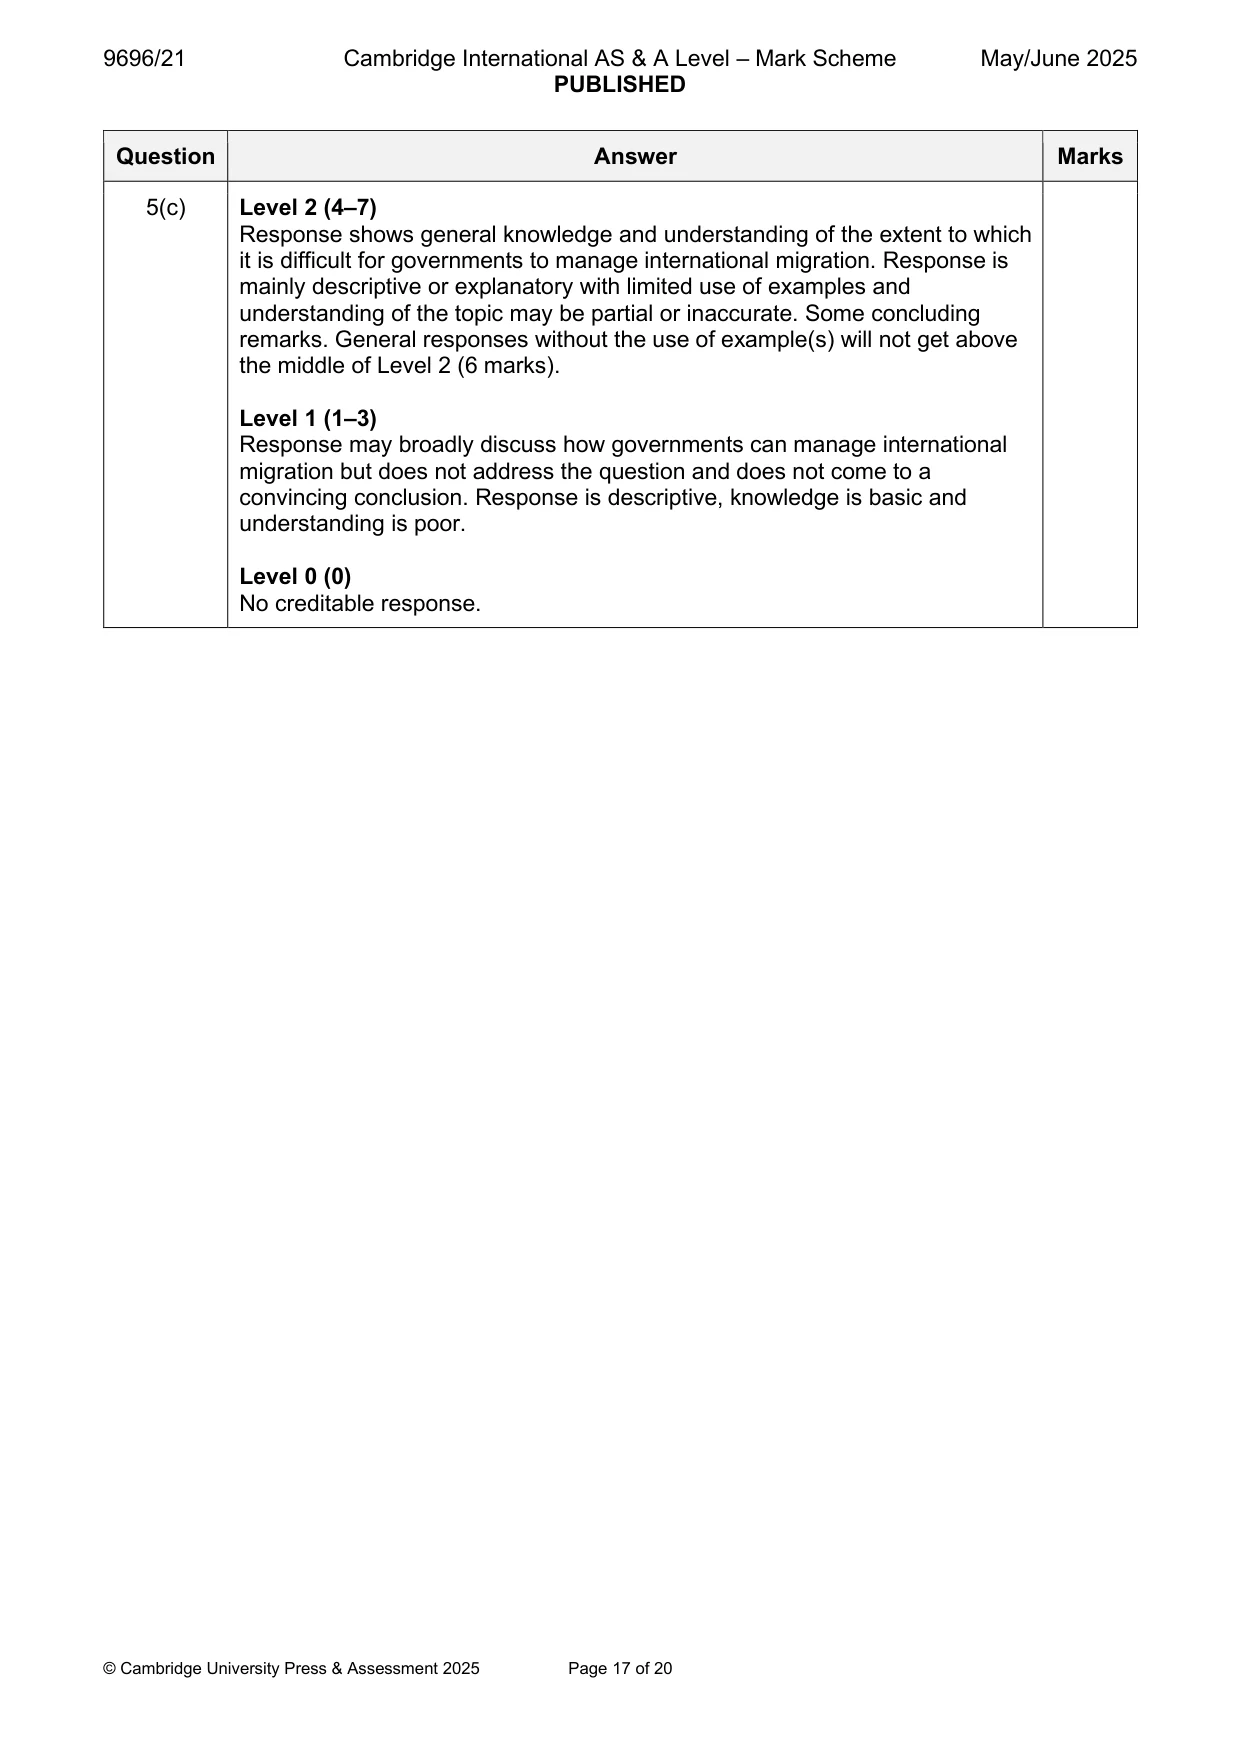
Mark scheme: 5(a) Describe the causes of forced (involuntary) international migration. 7 Most candidates will probably consider a range of push factors. Causes could include: • environmental e.g. earthquakes, floods, rising sea levels, drought • economic collapse e.g. famine • political e.g. war, persecution, government policy • social e.g. religious/tribal conflicts • other e.g. to escape disease such as Ebola 1 mark for a simple description, 2 marks for a developed description (with detail or an example) up to the maximum. 5(b) With the aid of examples, explain why international migration has 8 increased in recent years. Candidates may consider economic, social, environmental push and pull factors but equally there are enabling factors such as: • greater ease of movement e.g. air travel • increased information on opportunities/help available via media, internet, etc. • increased global inequalities in income and life chances • higher education so more employable and more knowledgeable • cultural changes e.g. greater independence for women • some governments encourage such movements • increase in forced migration e.g. due to climate change, conflict, persecution • greater need to send back remittances • was low before due to Covid-19 pandemic Max. 4 marks if no valid examples. Award marks based on the quality of explanation and breadth of the response using the marking levels below. Level 3 (6–8) Response clearly explains why international migration has increased in recent years. Response is well founded in detailed knowledge and strong conceptual understanding of the topic. Examples used are appropriate and integrated effectively into the response. Level 2 (3–5) Response explains why international migration has increased in recent years. Response develops on a largely secure base of knowledge and understanding. Examples may lack detail or development. Level 1 (1–2) Response is largely descriptive about international migration. Knowledge is basic and understanding may be inaccurate. Examples are in name only or lacking entirely. Level 0 (0) No creditable response. 5(c) With the aid of examples, how far do you agree that it is difficult for 15 governments to manage international migration? Difficulties could include: • illegal immigration e.g. people are able to bypass controls, people smuggling – some migrants are victims • geographical situation e.g. bordering a country with war or unrest (e.g. Jordan, Colombia), practical issues e.g. long/unmanned borders to control, sheer volume of migration • economic issues e.g. costs v benefits of labour • social issues e.g. humanitarian action, family links • ethical issues • political e.g. disagreements over how to control/needs migrants Governments may use a variety of strategies to attempt to manage international migration which could include: • build fences, walls, strict border controls • operate quotas based on specific criteria/visas • indirect e.g. anti-migrant attitude/rhetoric Some governments encourage migration, e.g. to target skill shortages. Higher level responses may contrast situations where the government can more easily control such migration e.g. Australia with countries that struggle such as Greece. Award marks based on the quality of the response using the marking levels below. Level 4 (12–15) Response thoroughly assesses the extent to which it is difficult for governments to manage international migration. Examples used are appropriate and integrated effectively into the response. Response is well founded in detailed knowledge and strong conceptual understanding of the topic. Level 3 (8–11) Response assesses the extent to which it is difficult for governments to manage international migration but may be unbalanced. Examples may lack detail or development. Response develops on a largely secure base of knowledge and understanding. 5(c) Level 2 (4–7) Response shows general knowledge and understanding of the extent to which it is difficult for governments to manage international migration. Response is mainly descriptive or explanatory with limited use of examples and understanding of the topic may be partial or inaccurate. Some concluding remarks. General responses without the use of example(s) will not get above the middle of Level 2 (6 marks). Level 1 (1–3) Response may broadly discuss how governments can manage international migration but does not address the question and does not come to a convincing conclusion. Response is descriptive, knowledge is basic and understanding is poor. Level 0 (0) No creditable response. Settlement dynamics
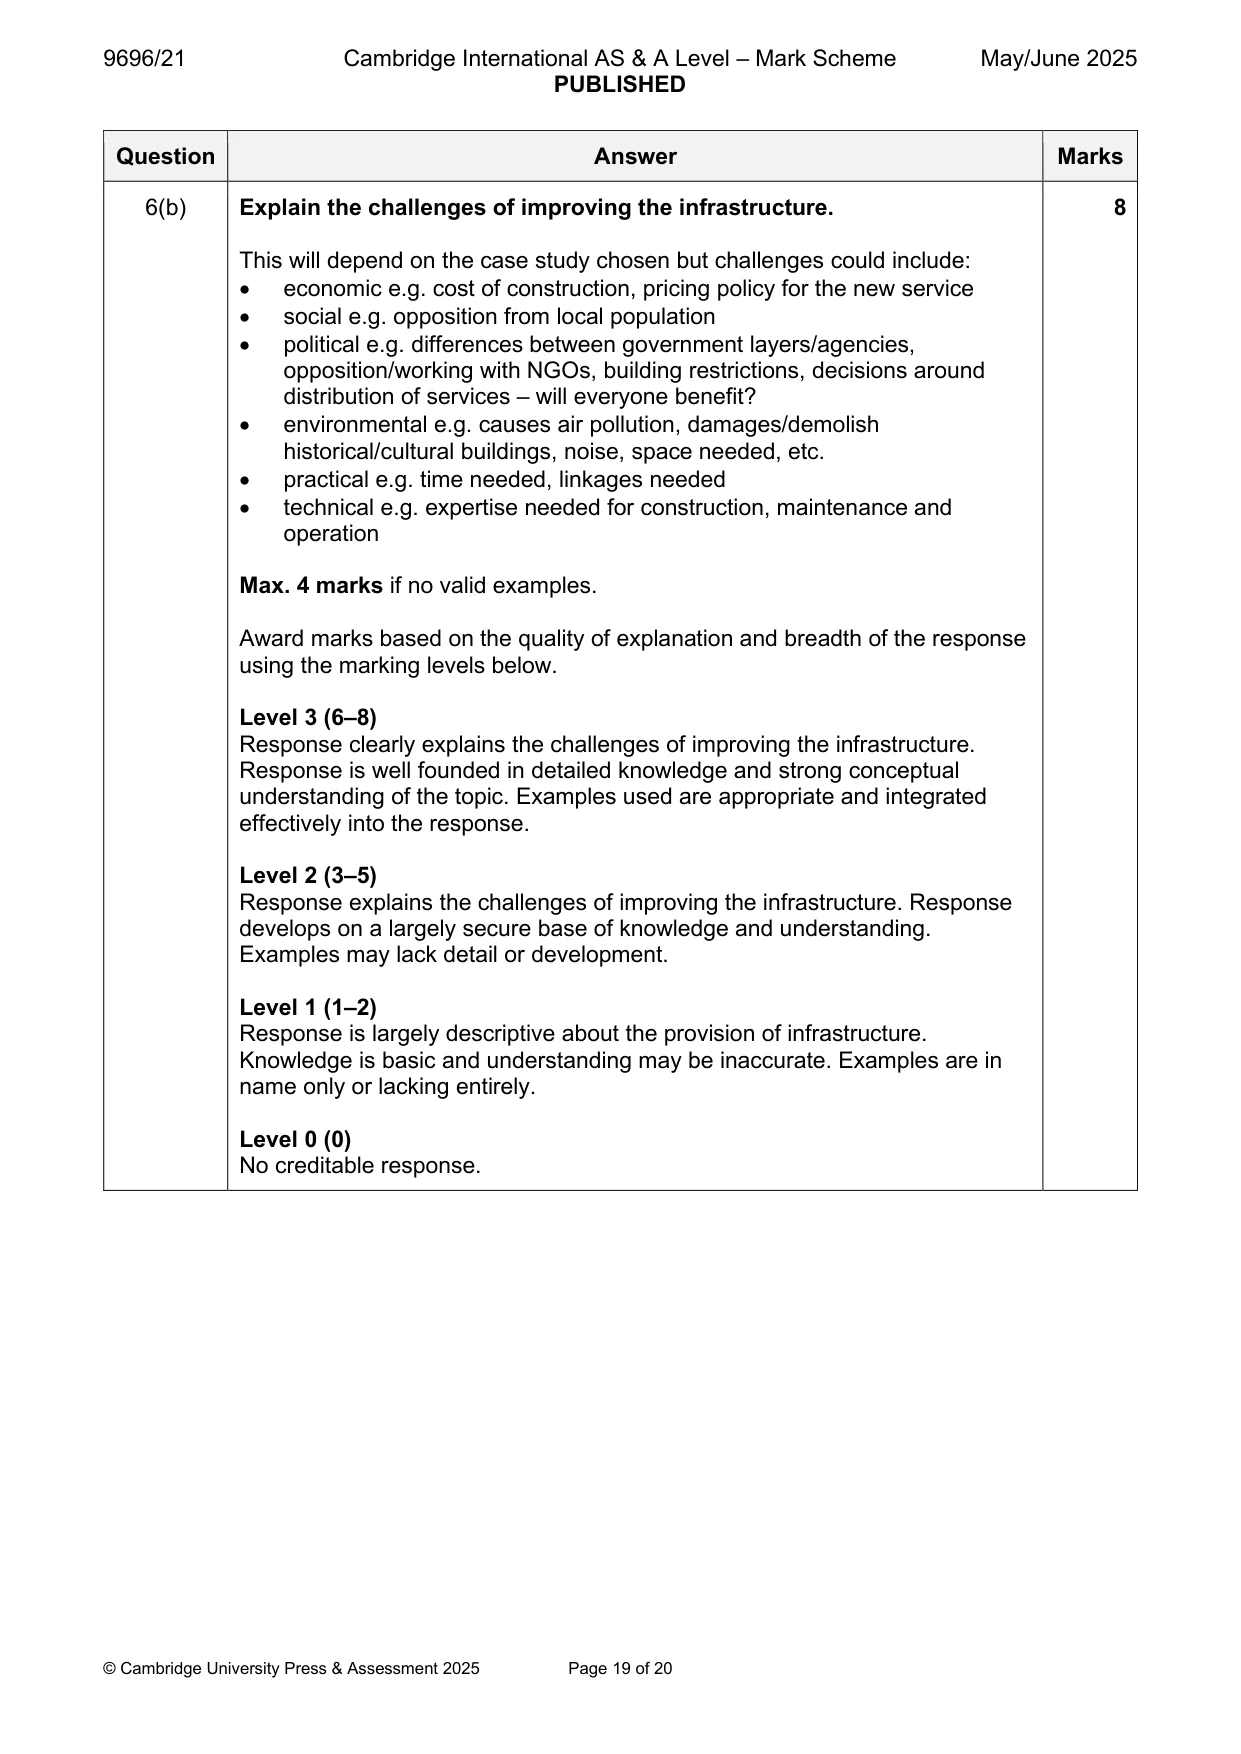
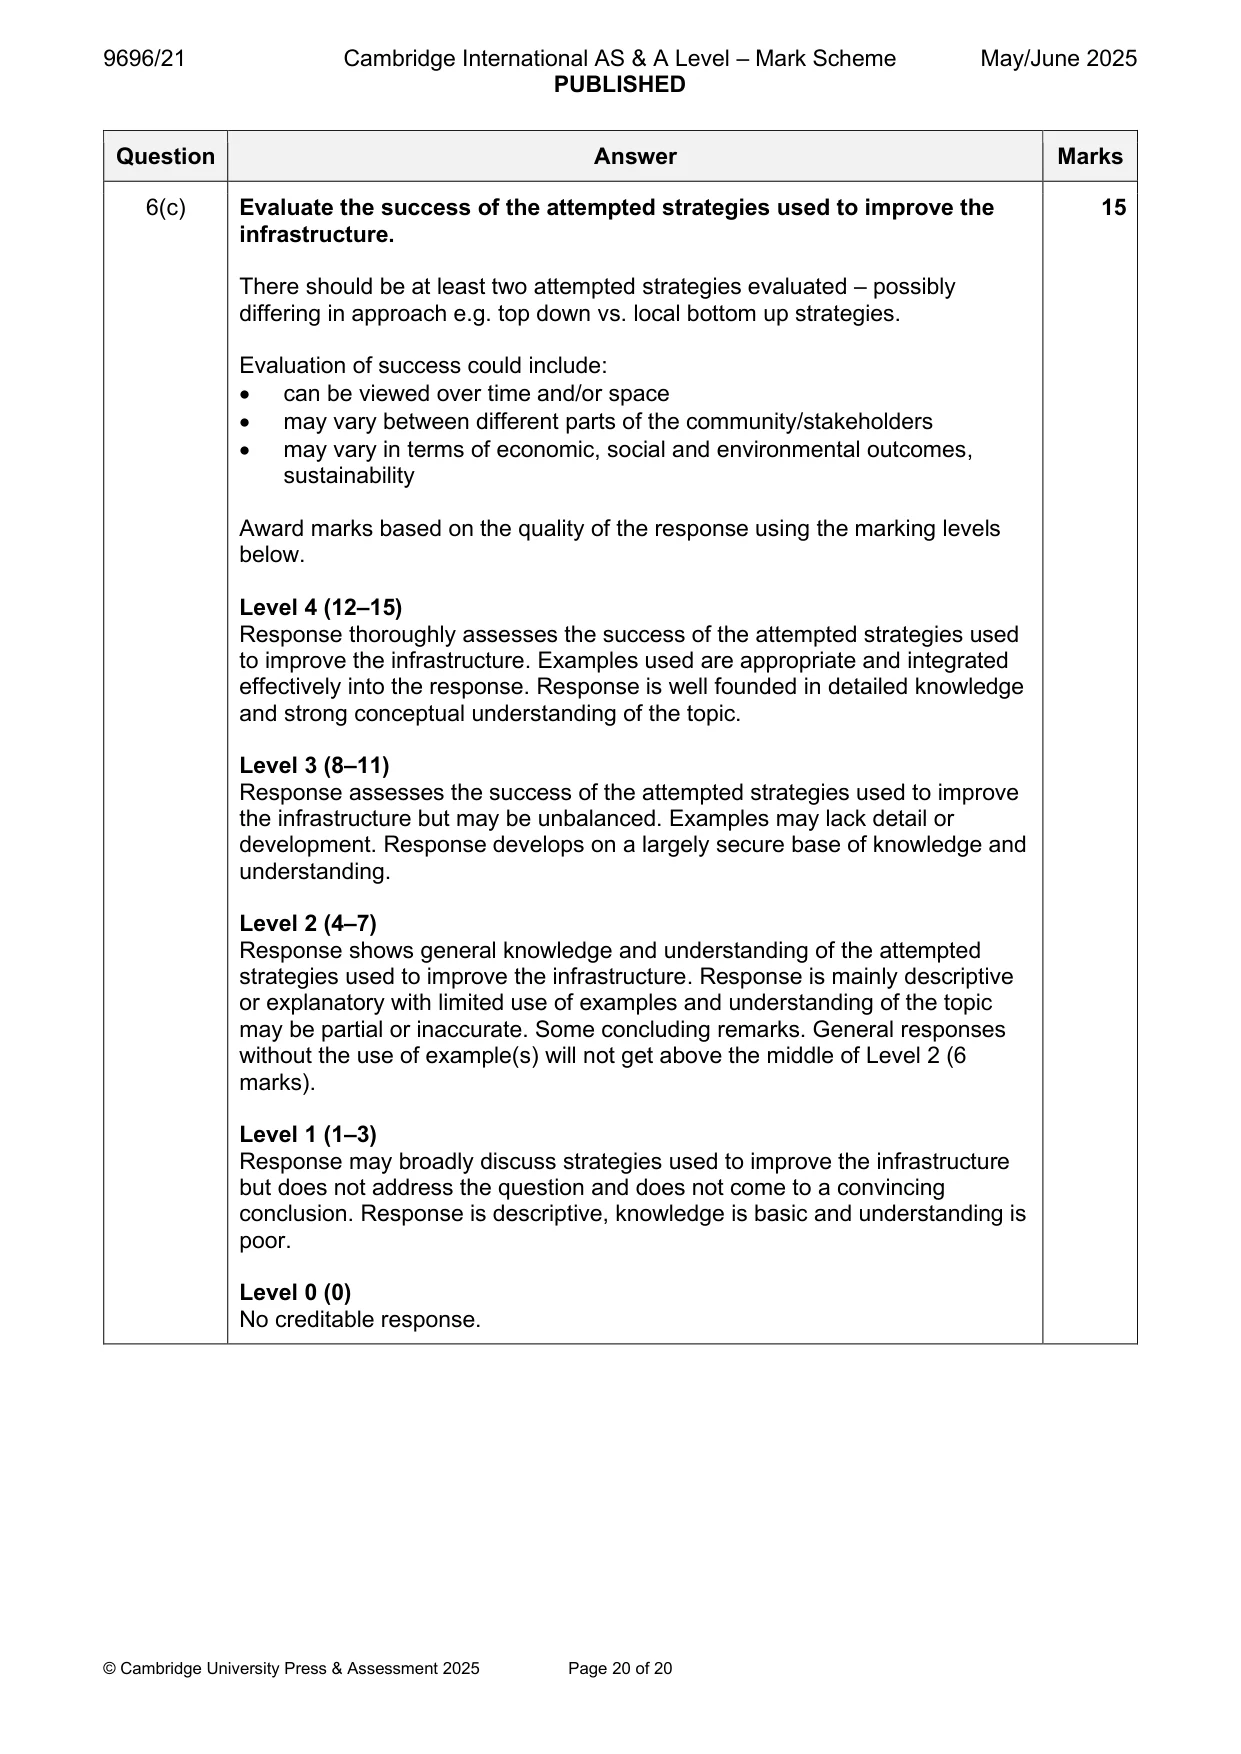
Q6 · For your chosen case study of providing power infrastructure or transport infrastructure…
6 For your chosen case study of providing power infrastructure or transport infrastructure for a named city: (a) Outline why the power infrastructure or transport infrastructure needed to be improved. [7] (b) Explain the challenges of improving the infrastructure. [8] (c) Evaluate the success of the attempted strategies used to improve the infrastructure. [15]
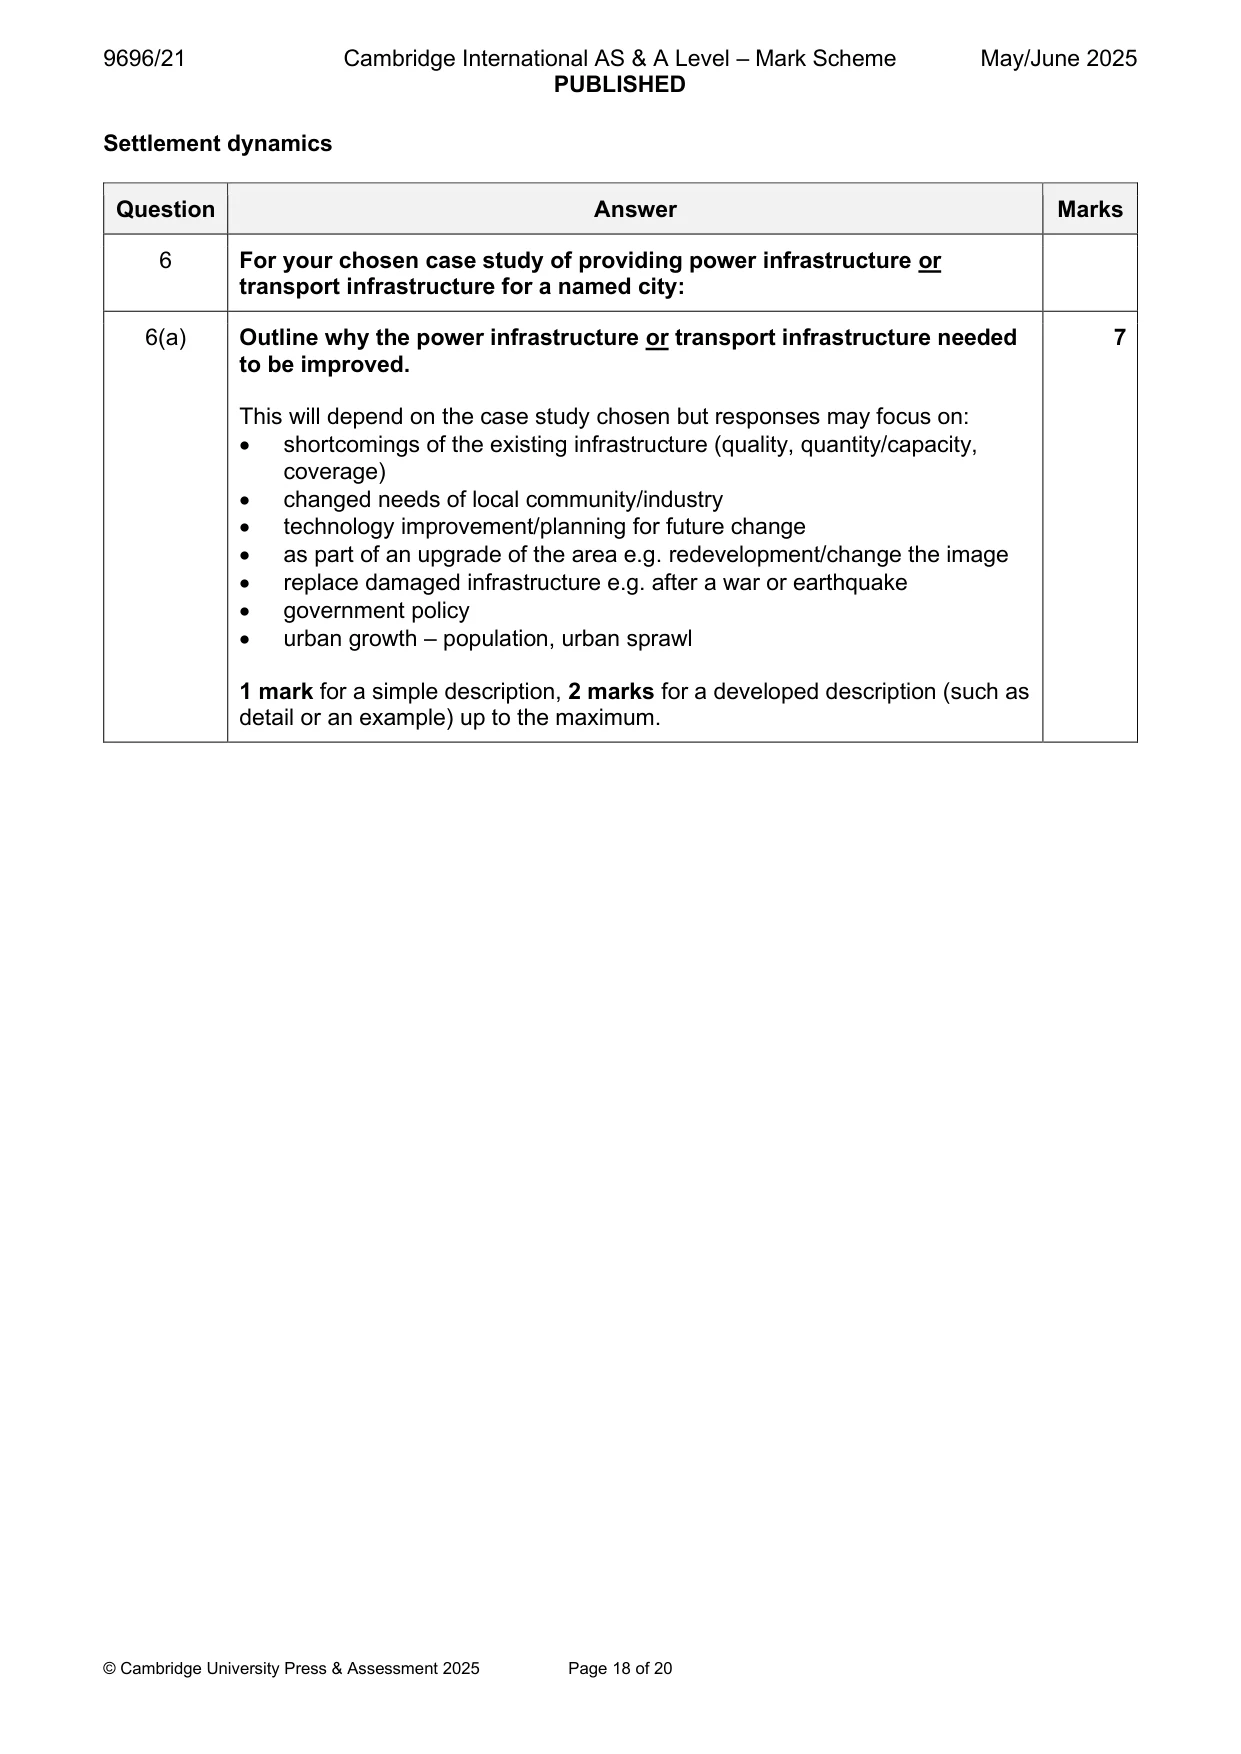
Mark scheme: 6 For your chosen case study of providing power infrastructure or transport infrastructure for a named city: 6(a) Outline why the power infrastructure or transport infrastructure needed 7 to be improved. This will depend on the case study chosen but responses may focus on: • shortcomings of the existing infrastructure (quality, quantity/capacity, coverage) • changed needs of local community/industry • technology improvement/planning for future change • as part of an upgrade of the area e.g. redevelopment/change the image • replace damaged infrastructure e.g. after a war or earthquake • government policy • urban growth – population, urban sprawl 1 mark for a simple description, 2 marks for a developed description (such as detail or an example) up to the maximum. 6(b) Explain the challenges of improving the infrastructure. 8 This will depend on the case study chosen but challenges could include: • economic e.g. cost of construction, pricing policy for the new service • social e.g. opposition from local population • political e.g. differences between government layers/agencies, opposition/working with NGOs, building restrictions, decisions around distribution of services – will everyone benefit? • environmental e.g. causes air pollution, damages/demolish historical/cultural buildings, noise, space needed, etc. • practical e.g. time needed, linkages needed • technical e.g. expertise needed for construction, maintenance and operation Max. 4 marks if no valid examples. Award marks based on the quality of explanation and breadth of the response using the marking levels below. Level 3 (6–8) Response clearly explains the challenges of improving the infrastructure. Response is well founded in detailed knowledge and strong conceptual understanding of the topic. Examples used are appropriate and integrated effectively into the response. Level 2 (3–5) Response explains the challenges of improving the infrastructure. Response develops on a largely secure base of knowledge and understanding. Examples may lack detail or development. Level 1 (1–2) Response is largely descriptive about the provision of infrastructure. Knowledge is basic and understanding may be inaccurate. Examples are in name only or lacking entirely. Level 0 (0) No creditable response. 6(c) Evaluate the success of the attempted strategies used to improve the 15 infrastructure. There should be at least two attempted strategies evaluated – possibly differing in approach e.g. top down vs. local bottom up strategies. Evaluation of success could include: • can be viewed over time and/or space • may vary between different parts of the community/stakeholders • may vary in terms of economic, social and environmental outcomes, sustainability Award marks based on the quality of the response using the marking levels below. Level 4 (12–15) Response thoroughly assesses the success of the attempted strategies used to improve the infrastructure. Examples used are appropriate and integrated effectively into the response. Response is well founded in detailed knowledge and strong conceptual understanding of the topic. Level 3 (8–11) Response assesses the success of the attempted strategies used to improve the infrastructure but may be unbalanced. Examples may lack detail or development. Response develops on a largely secure base of knowledge and understanding. Level 2 (4–7) Response shows general knowledge and understanding of the attempted strategies used to improve the infrastructure. Response is mainly descriptive or explanatory with limited use of examples and understanding of the topic may be partial or inaccurate. Some concluding remarks. General responses without the use of example(s) will not get above the middle of Level 2 (6 marks). Level 1 (1–3) Response may broadly discuss strategies used to improve the infrastructure but does not address the question and does not come to a convincing conclusion. Response is descriptive, knowledge is basic and understanding is poor. Level 0 (0) No creditable response.
What was in this paper
The subtopics covered by these 6 questions, and how many questions each got. Open one in a new tab to see every Cambridge question on it.
What you needed in this session
Cambridge’s own grade thresholds for 2025 May/June, Paper 2 · Variant 1. A higher threshold means an easier paper — the bar moves with how the cohort did.