Cambridge A Level Geography 9696 — 2021 Oct/Nov Paper 2 · Variant 1
9696/21/O/N/21 · 6 questions · 60 marks · ≈68 min
The question paper and its mark scheme, free to read here and free to download. This is Cambridge’s own paper, exactly as it was sat.
Question paper4 pages
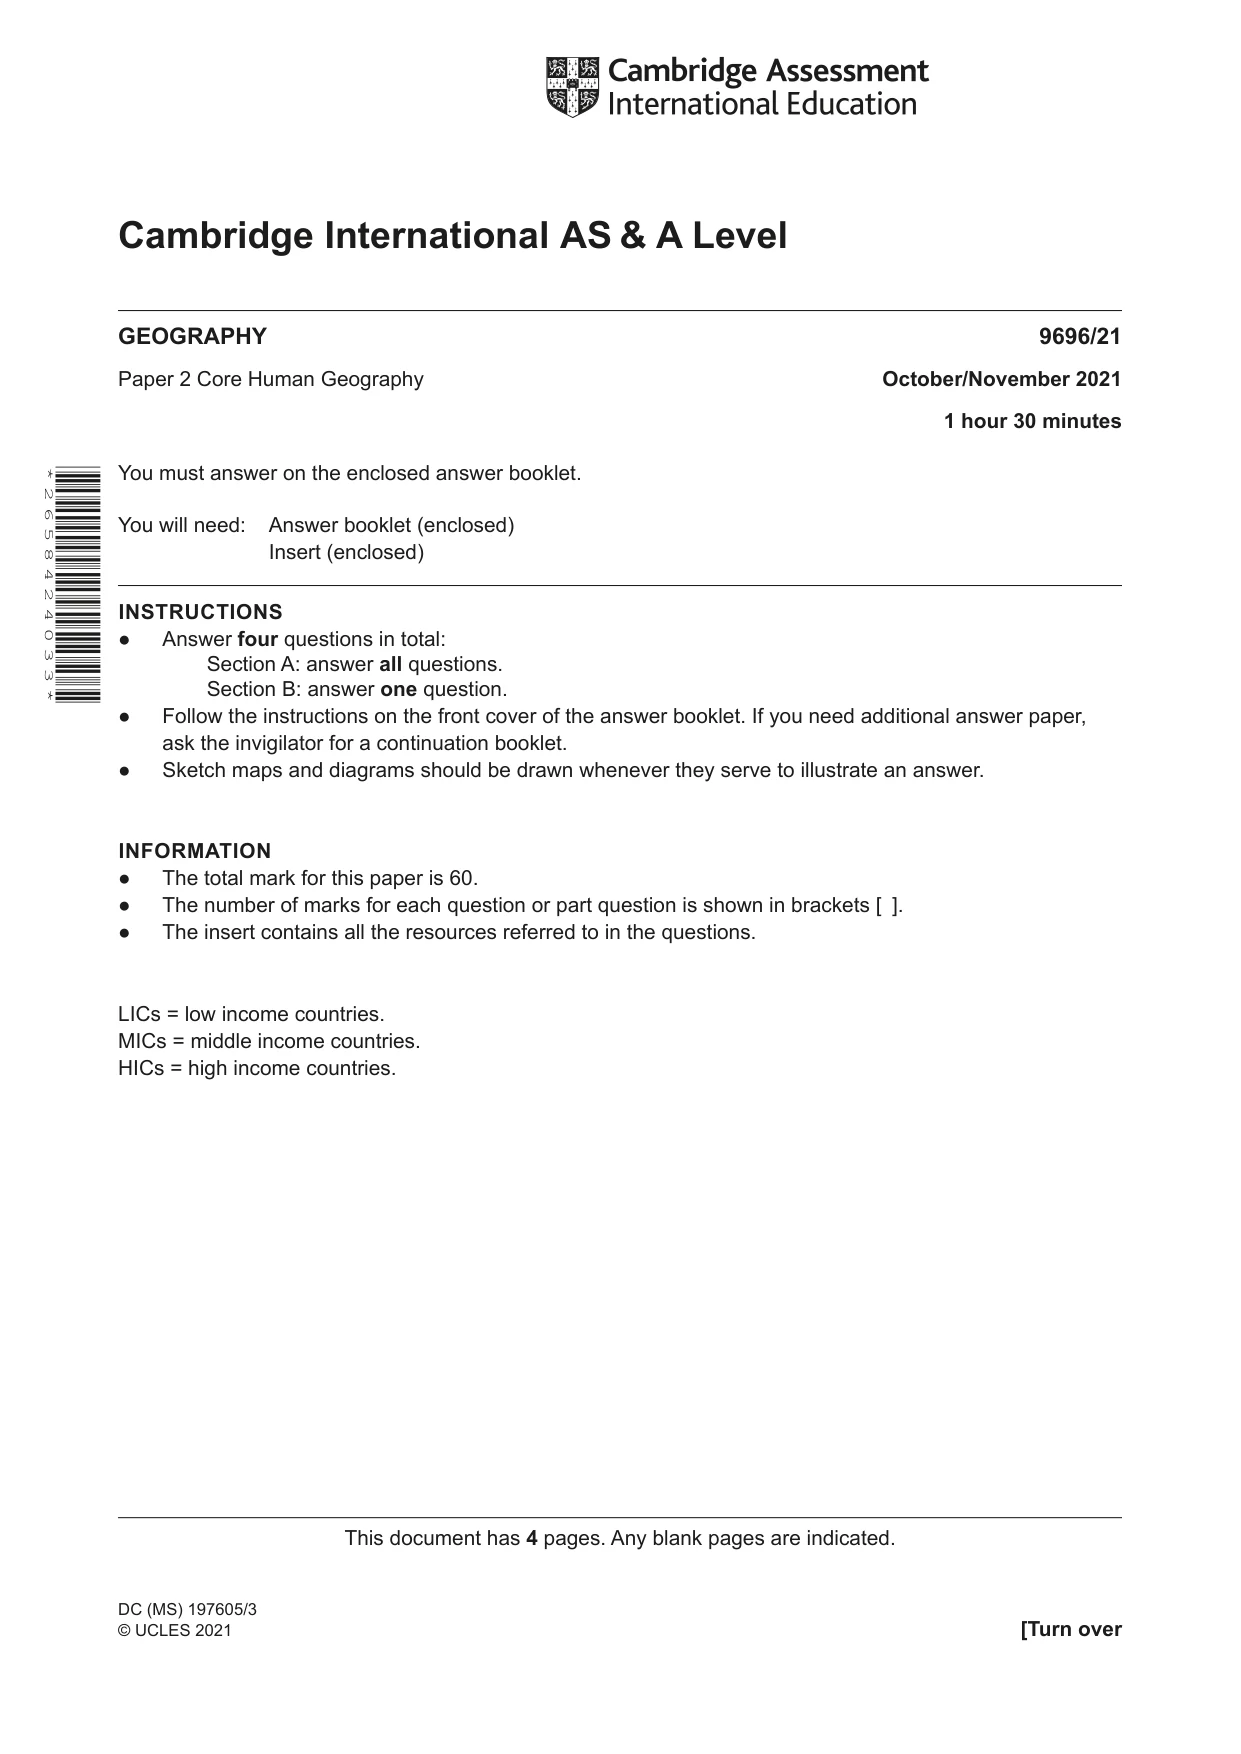
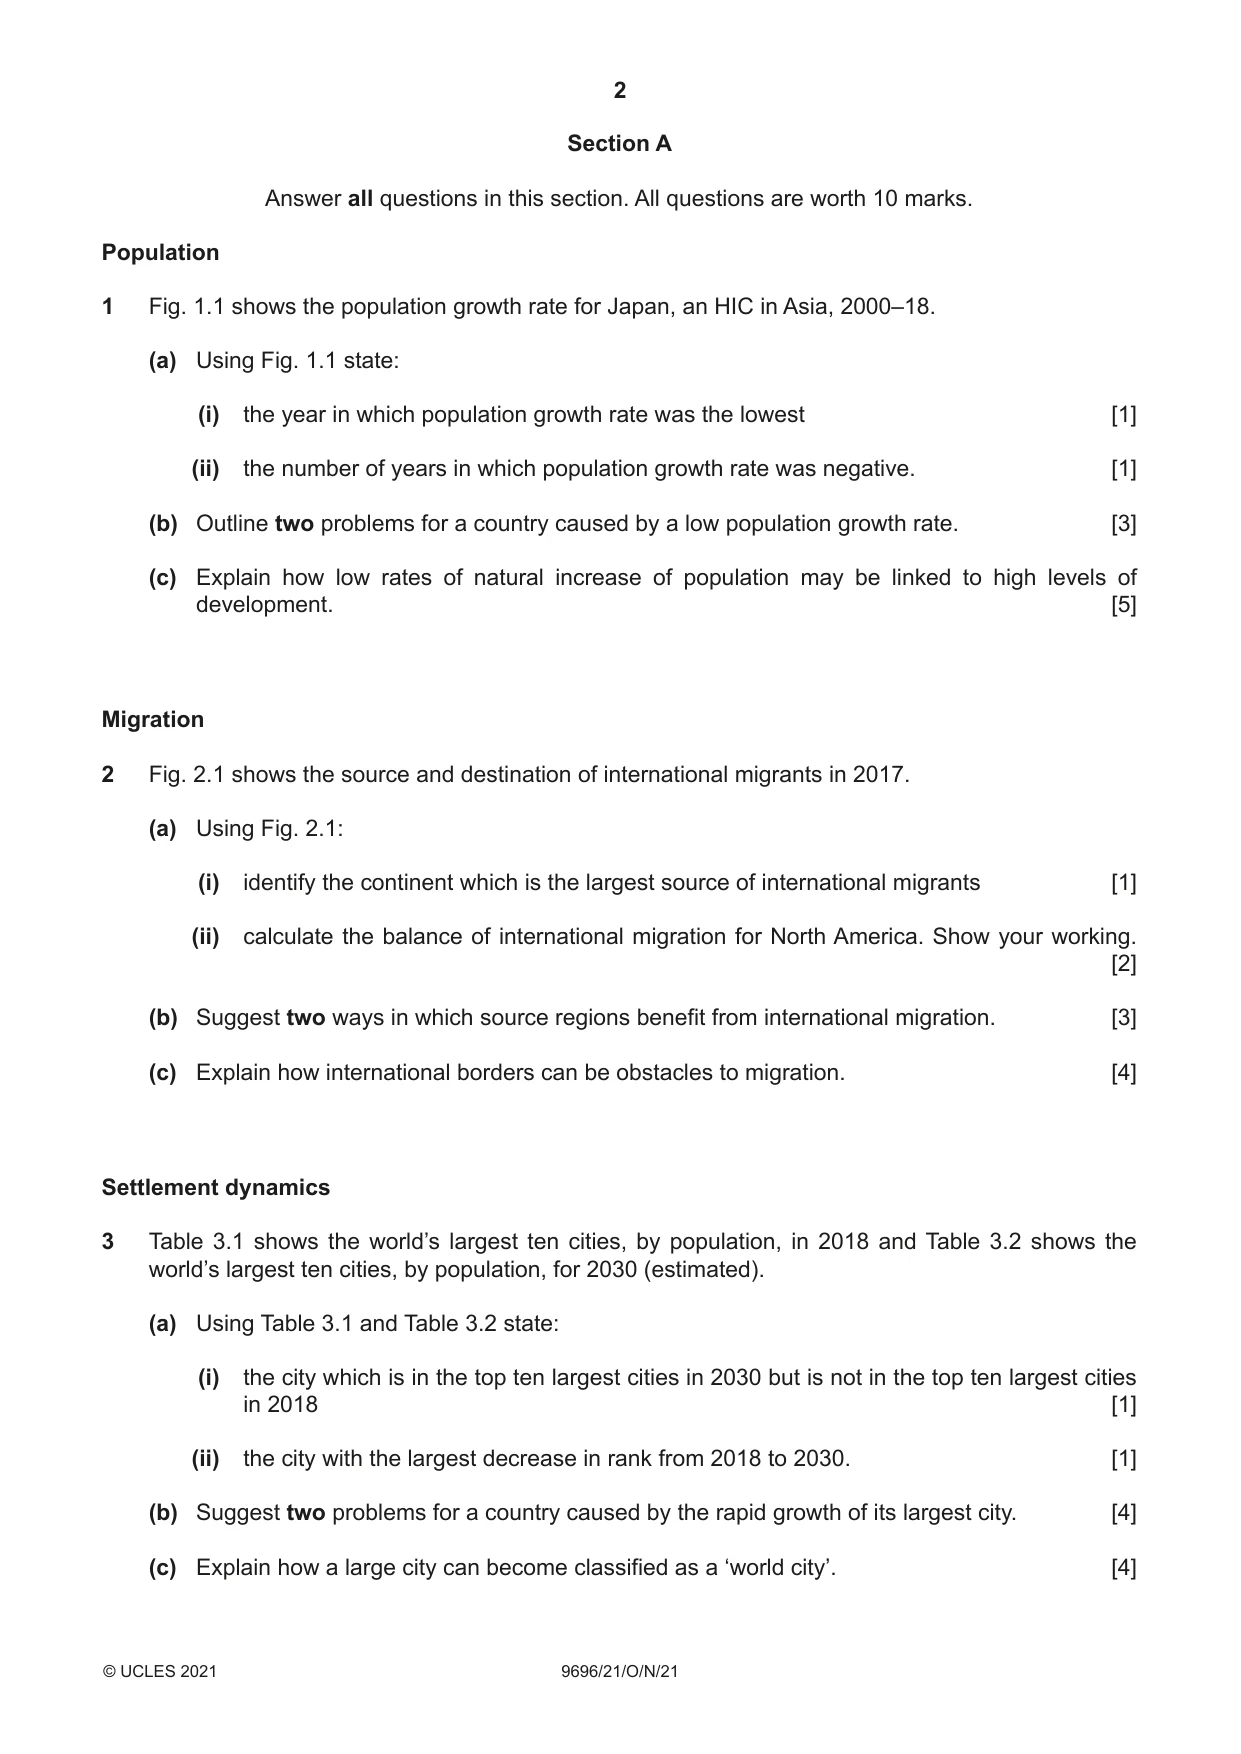
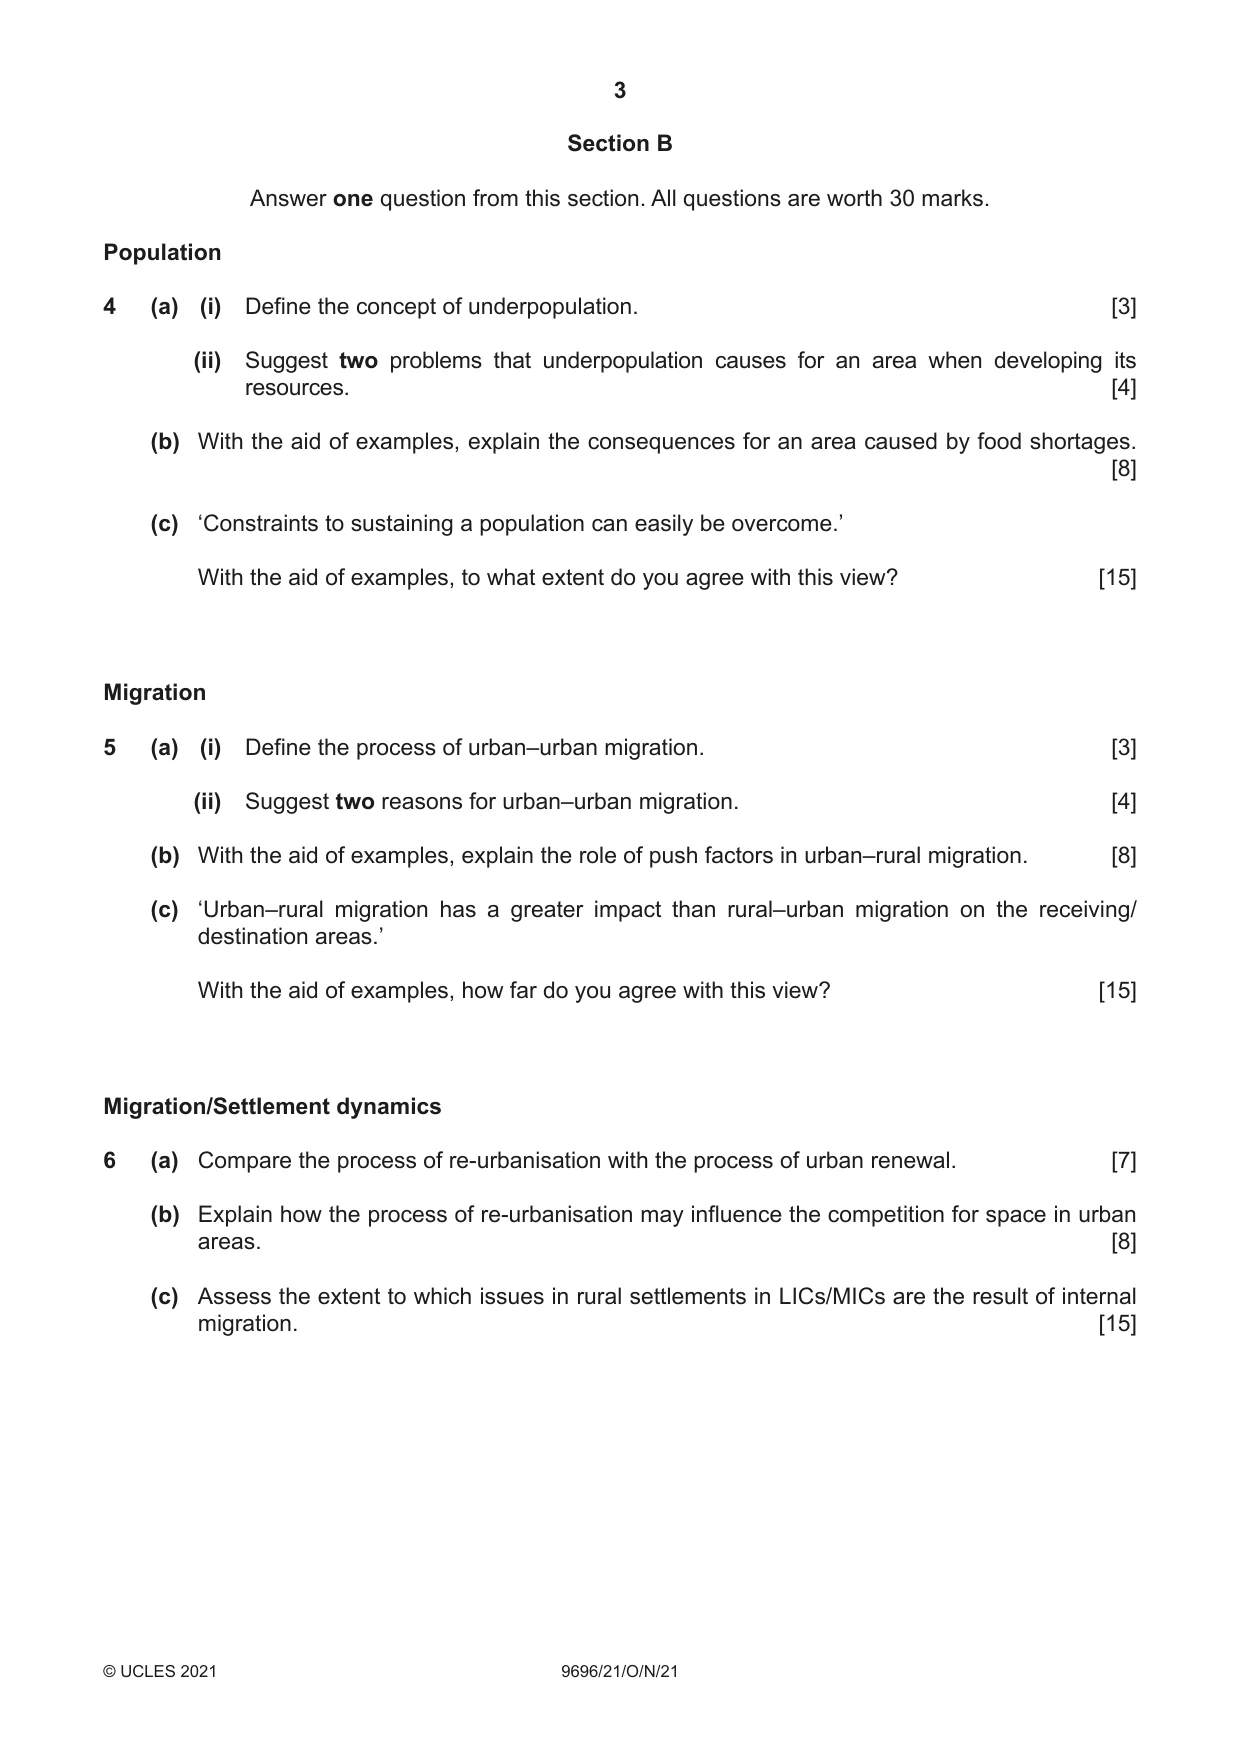

Mark scheme16 pages
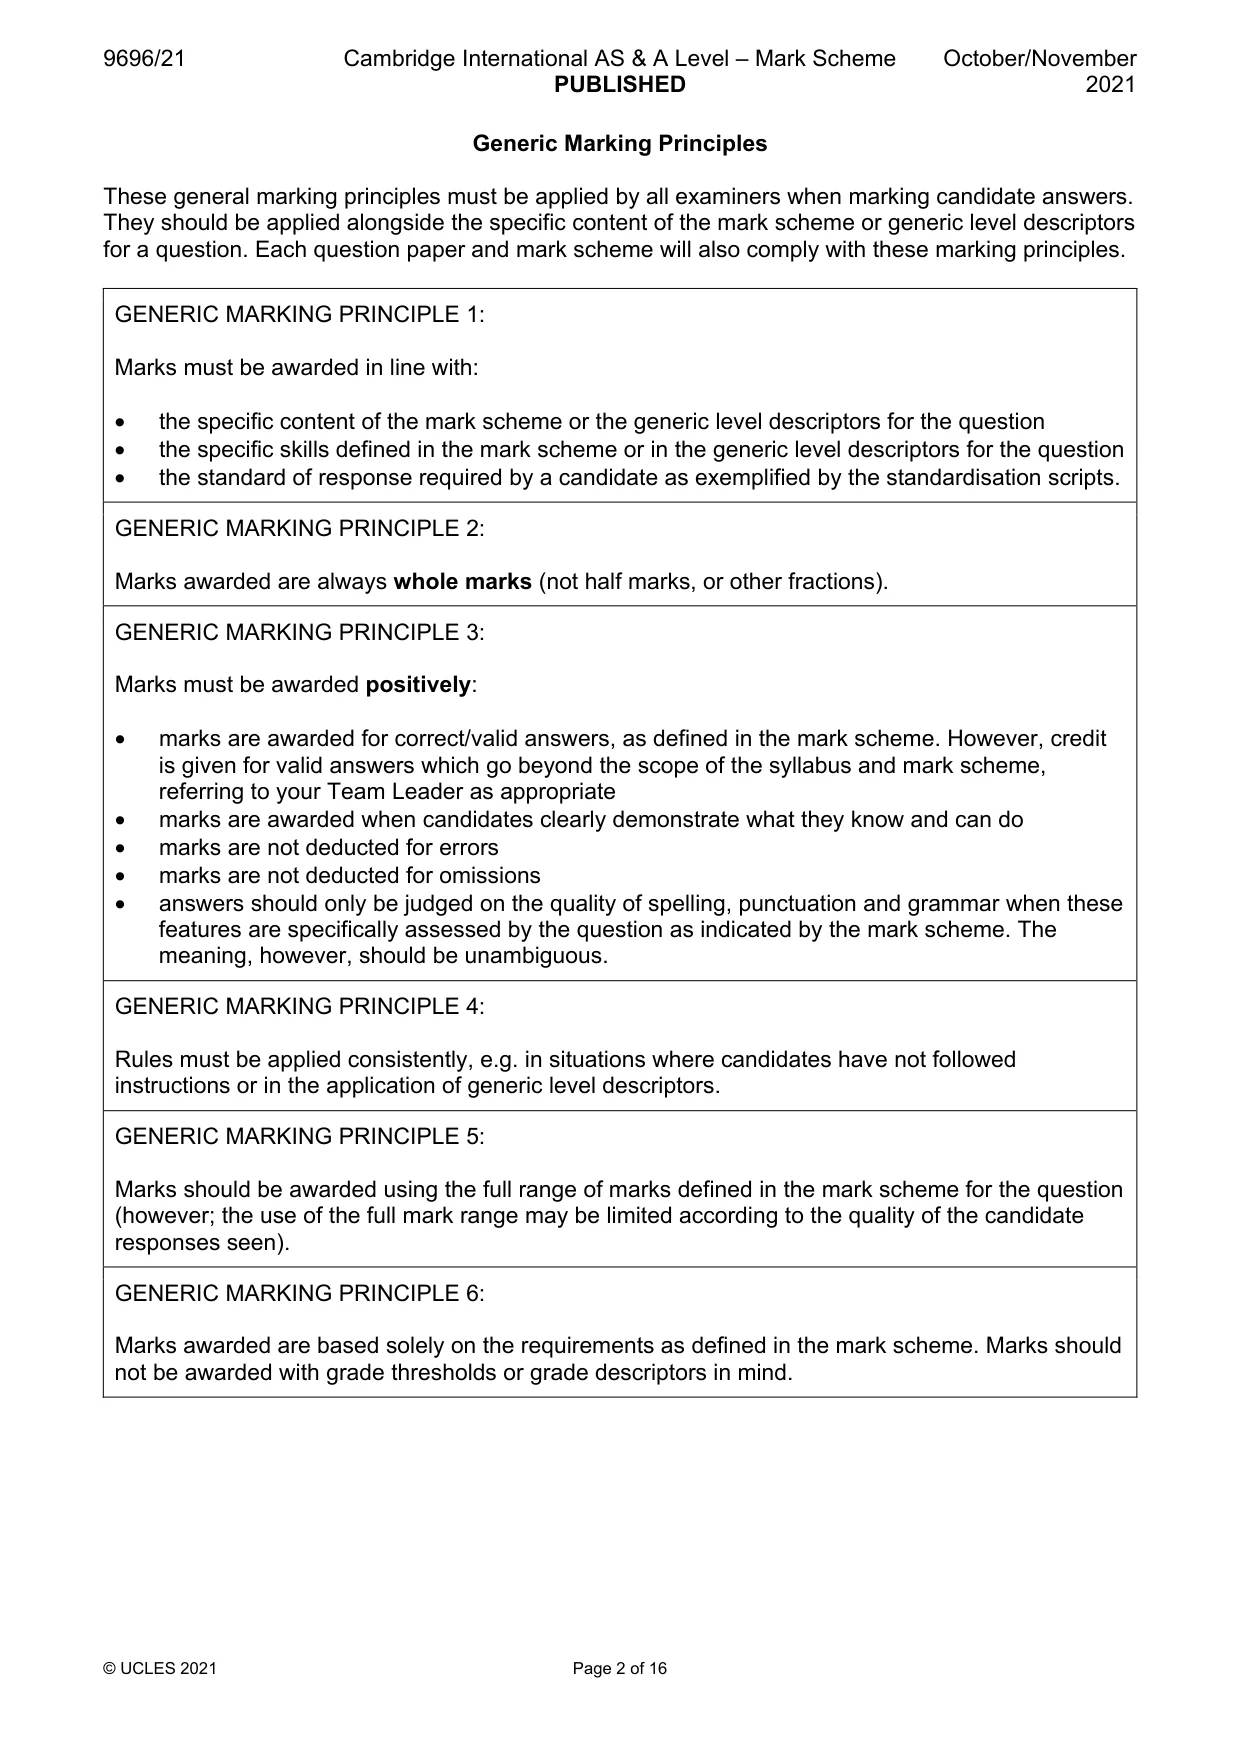
Answers below. Sit the paper first if you are practising.
Questions as text
Q1 · The population growth rate for Japan, an HIC in Asia, 2000–18
1 Fig. 1.1 shows the population growth rate for Japan, an HIC in Asia, 2000–18. (a) Using Fig. 1.1 state: (i) the year in which population growth rate was the lowest [1] (ii) the number of years in which population growth rate was negative. [1] (b) Outline two problems for a country caused by a low population growth rate. [3] (c) Explain how low rates of natural increase of population may be linked to high levels of development. [5] Migration
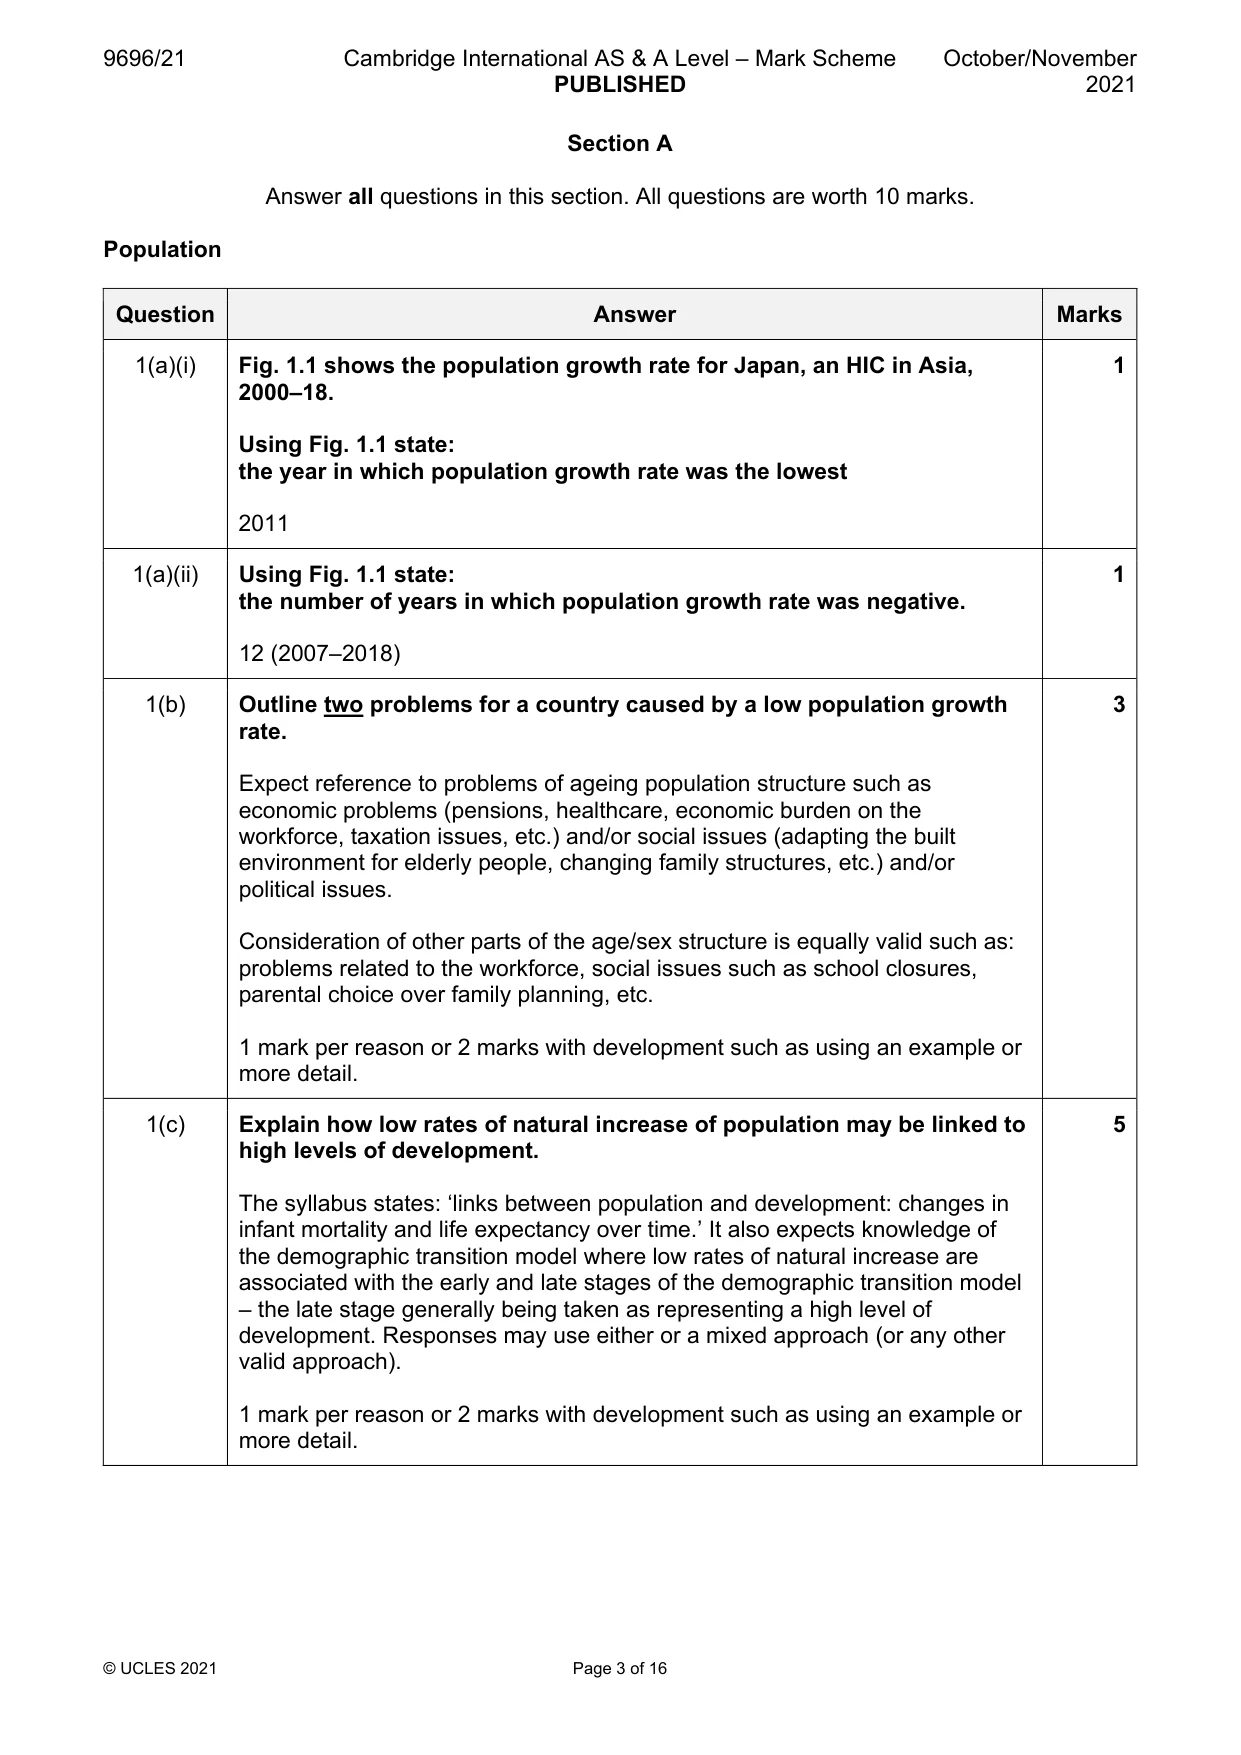
Mark scheme: Question Answer Marks 1(a)(i) Fig. 1.1 shows the population growth rate for Japan, an HIC in Asia, 1 2000–18. Using Fig. 1.1 state: the year in which population growth rate was the lowest 2011 1(a)(ii) Using Fig. 1.1 state: 1 the number of years in which population growth rate was negative. 12 (2007–2018) 1(b) Outline two problems for a country caused by a low population growth 3 rate. Expect reference to problems of ageing population structure such as economic problems (pensions, healthcare, economic burden on the workforce, taxation issues, etc.) and/or social issues (adapting the built environment for elderly people, changing family structures, etc.) and/or political issues. Consideration of other parts of the age/sex structure is equally valid such as: problems related to the workforce, social issues such as school closures, parental choice over family planning, etc. 1 mark per reason or 2 marks with development such as using an example or more detail. 1(c) Explain how low rates of natural increase of population may be linked to 5 high levels of development. The syllabus states: ‘links between population and development: changes in infant mortality and life expectancy over time.’ It also expects knowledge of the demographic transition model where low rates of natural increase are associated with the early and late stages of the demographic transition model – the late stage generally being taken as representing a high level of development. Responses may use either or a mixed approach (or any other valid approach). 1 mark per reason or 2 marks with development such as using an example or more detail. Migration
Q2 · The source and destination of international migrants in 2017
2 Fig. 2.1 shows the source and destination of international migrants in 2017. (a) Using Fig. 2.1: (i) identify the continent which is the largest source of international migrants [1] (ii) calculate the balance of international migration for North America. Show your working. [2] (b) Suggest two ways in which source regions benefit from international migration. [3] (c) Explain how international borders can be obstacles to migration. [4] Settlement dynamics
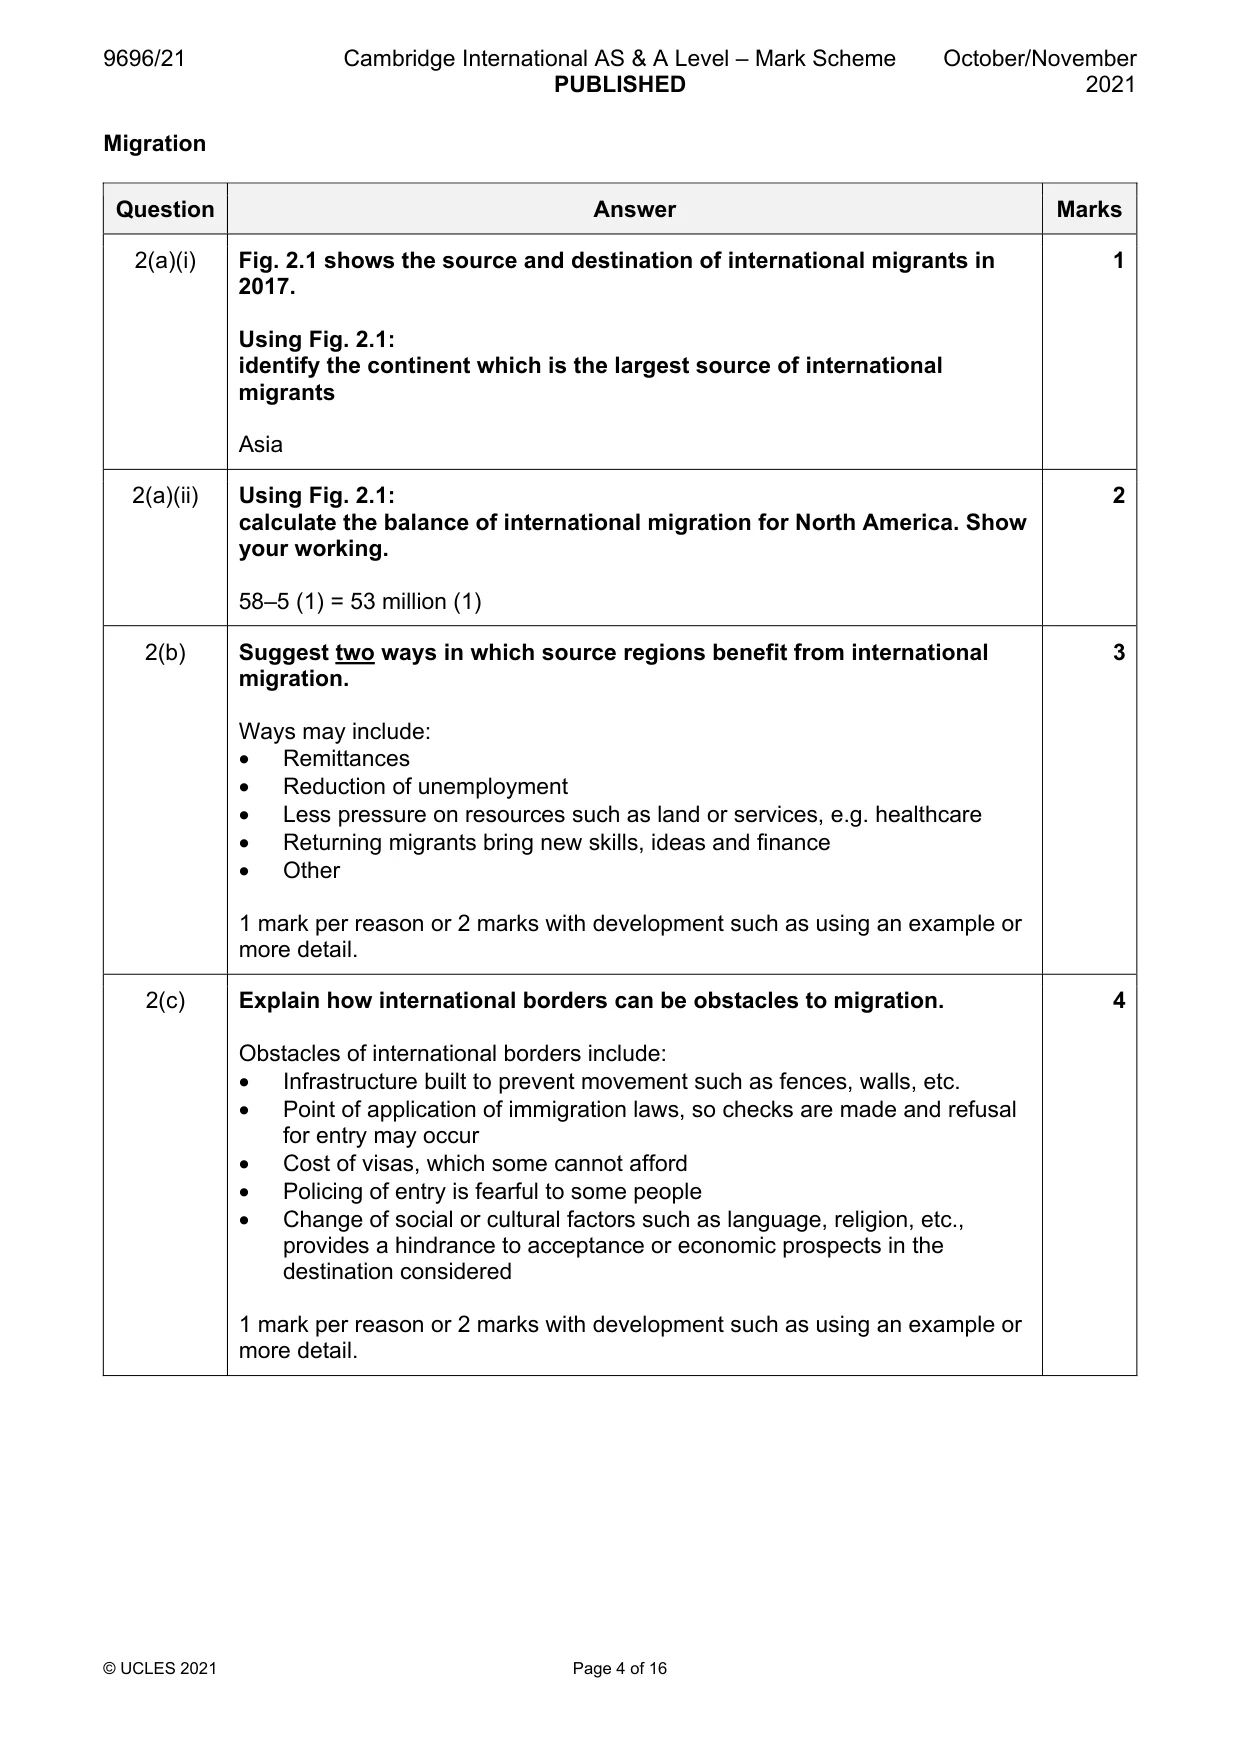
Mark scheme: 2(a)(i) Fig. 2.1 shows the source and destination of international migrants in 1 2017. Using Fig. 2.1: identify the continent which is the largest source of international migrants Asia 2(a)(ii) Using Fig. 2.1: 2 calculate the balance of international migration for North America. Show your working. 58–5 (1) = 53 million (1) 2(b) Suggest two ways in which source regions benefit from international 3 migration. Ways may include: • Remittances • Reduction of unemployment • Less pressure on resources such as land or services, e.g. healthcare • Returning migrants bring new skills, ideas and finance • Other 1 mark per reason or 2 marks with development such as using an example or more detail. 2(c) Explain how international borders can be obstacles to migration. 4 Obstacles of international borders include: • Infrastructure built to prevent movement such as fences, walls, etc. • Point of application of immigration laws, so checks are made and refusal for entry may occur • Cost of visas, which some cannot afford • Policing of entry is fearful to some people • Change of social or cultural factors such as language, religion, etc., provides a hindrance to acceptance or economic prospects in the destination considered 1 mark per reason or 2 marks with development such as using an example or more detail. Settlement dynamics
Q3 · The world’s largest ten cities, by population, in 2018 and Table 3.2 shows the world’s…
3 Table 3.1 shows the world’s largest ten cities, by population, in 2018 and Table 3.2 shows the world’s largest ten cities, by population, for 2030 (estimated). (a) Using Table 3.1 and Table 3.2 state: (i) the city which is in the top ten largest cities in 2030 but is not in the top ten largest cities in 2018 [1] (ii) the city with the largest decrease in rank from 2018 to 2030. [1] (b) Suggest two problems for a country caused by the rapid growth of its largest city. [4] (c) Explain how a large city can become classified as a ‘world city’. [4]
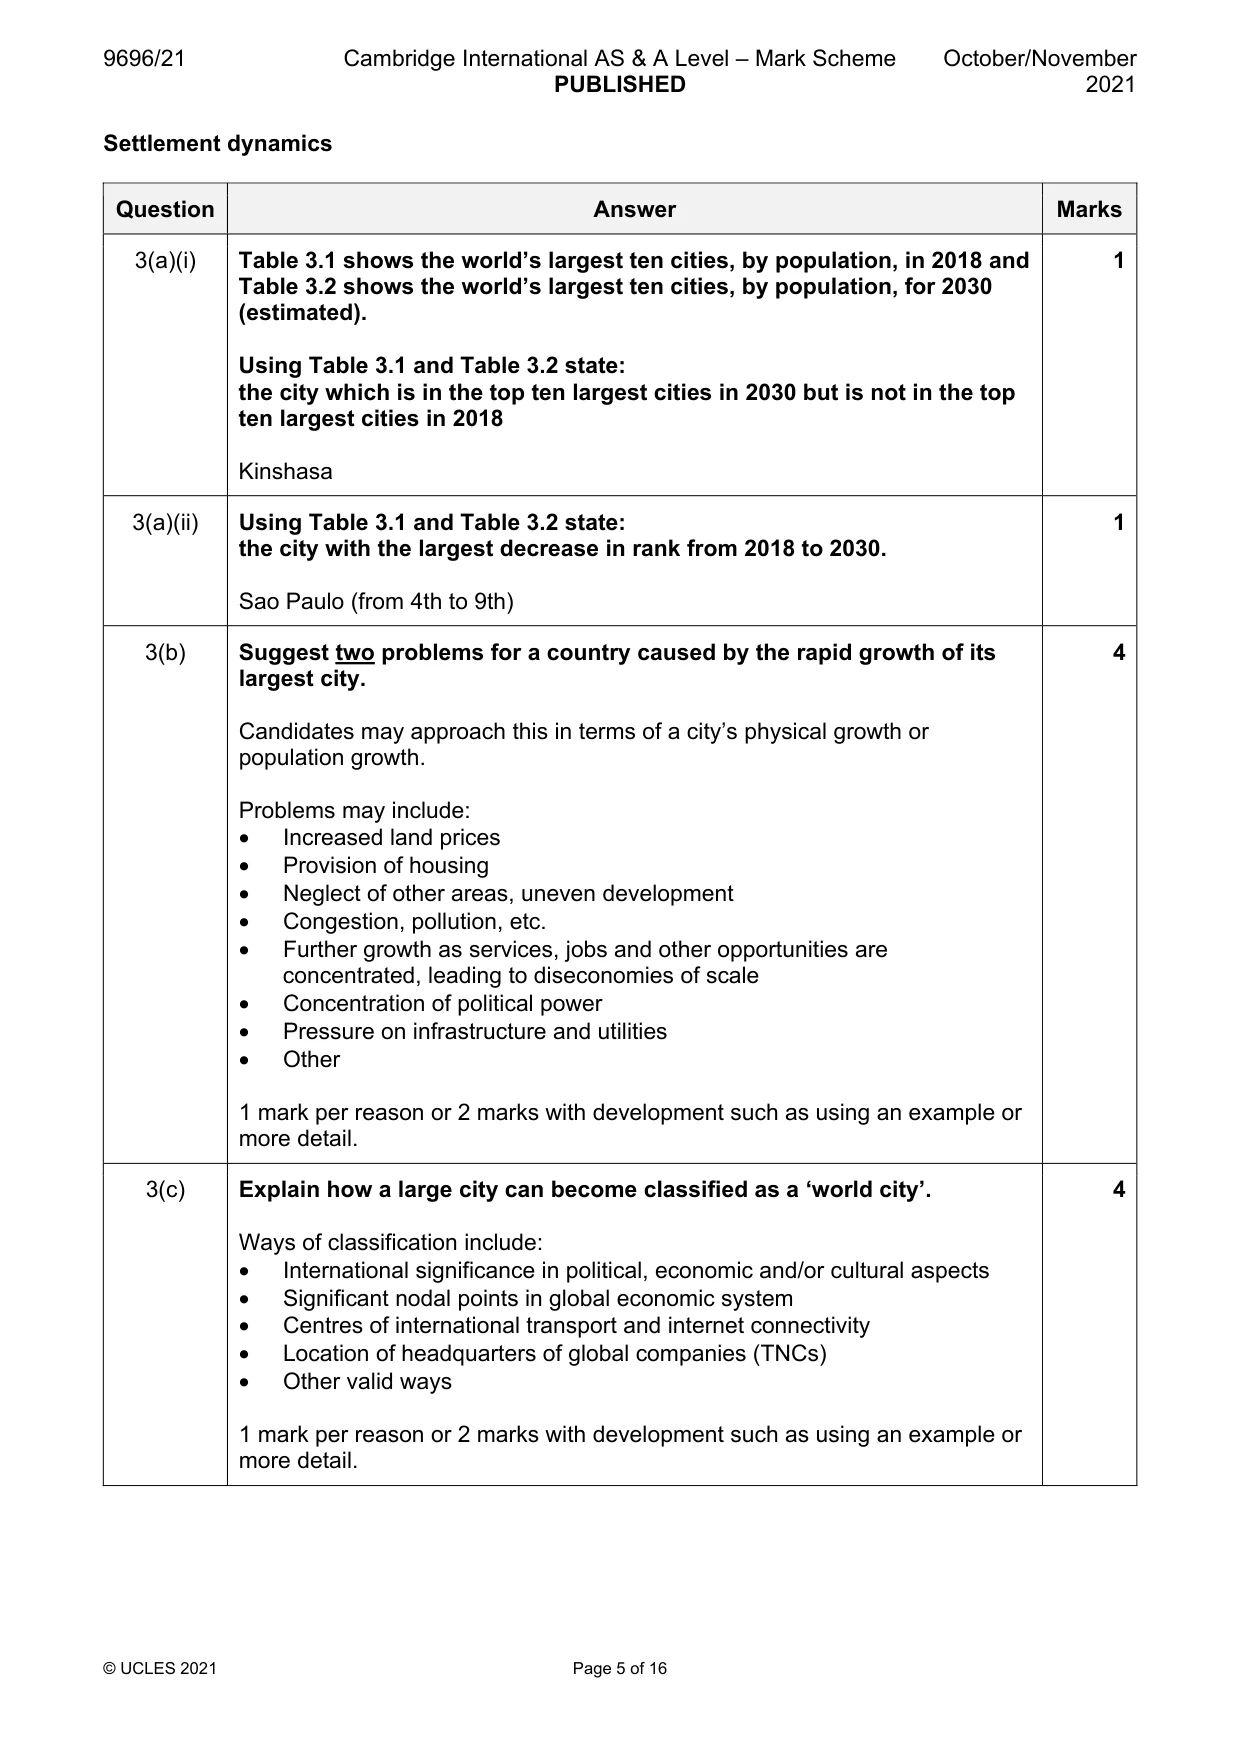
Mark scheme: 3(a)(i) Table 3.1 shows the world’s largest ten cities, by population, in 2018 and 1 Table 3.2 shows the world’s largest ten cities, by population, for 2030 (estimated). Using Table 3.1 and Table 3.2 state: the city which is in the top ten largest cities in 2030 but is not in the top ten largest cities in 2018 Kinshasa 3(a)(ii) Using Table 3.1 and Table 3.2 state: 1 the city with the largest decrease in rank from 2018 to 2030. Sao Paulo (from 4th to 9th) 3(b) Suggest two problems for a country caused by the rapid growth of its 4 largest city. Candidates may approach this in terms of a city’s physical growth or population growth. Problems may include: • Increased land prices • Provision of housing • Neglect of other areas, uneven development • Congestion, pollution, etc. • Further growth as services, jobs and other opportunities are concentrated, leading to diseconomies of scale • Concentration of political power • Pressure on infrastructure and utilities • Other 1 mark per reason or 2 marks with development such as using an example or more detail. 3(c) Explain how a large city can become classified as a ‘world city’. 4 Ways of classification include: • International significance in political, economic and/or cultural aspects • Significant nodal points in global economic system • Centres of international transport and internet connectivity • Location of headquarters of global companies (TNCs) • Other valid ways 1 mark per reason or 2 marks with development such as using an example or more detail. Section B Answer one question from this section. All questions are worth 30 marks. Population
Q4 · Define the concept of underpopulation
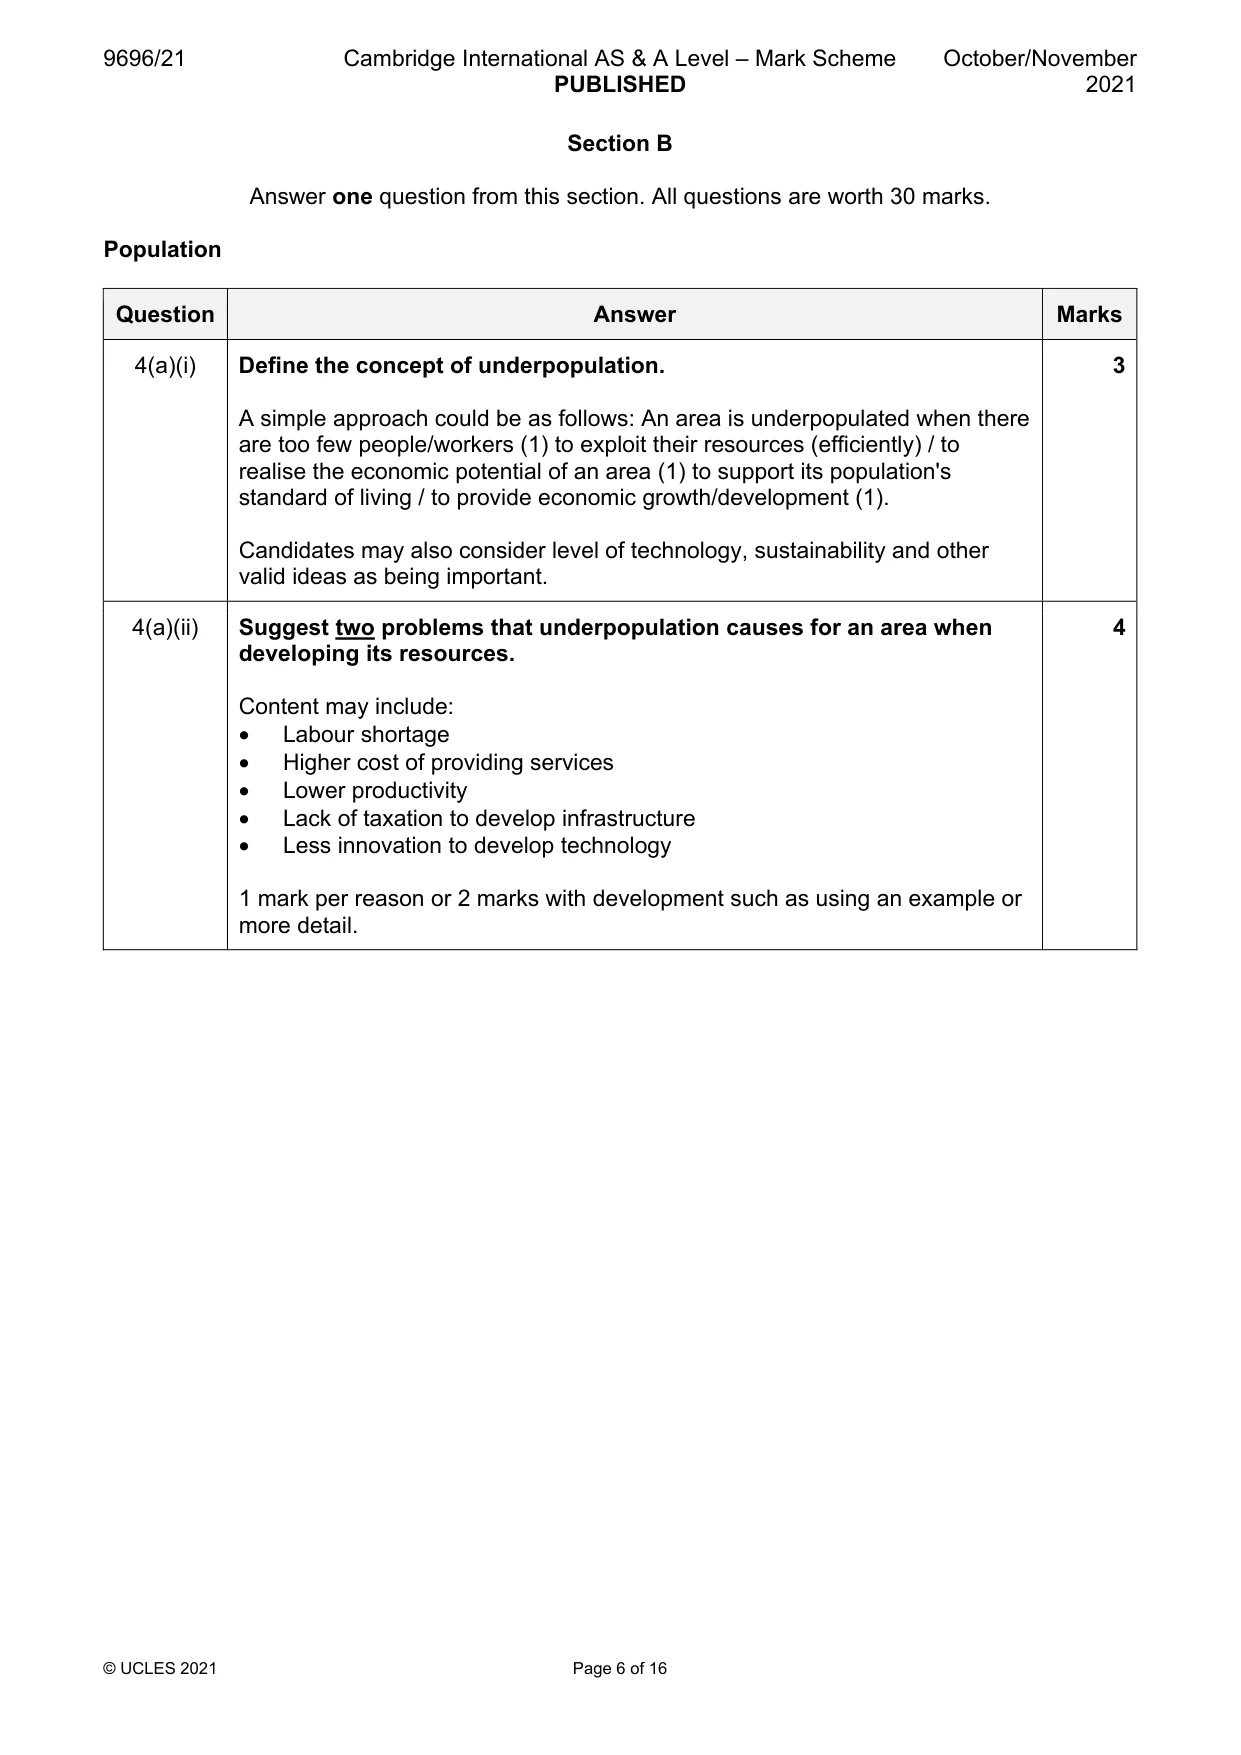
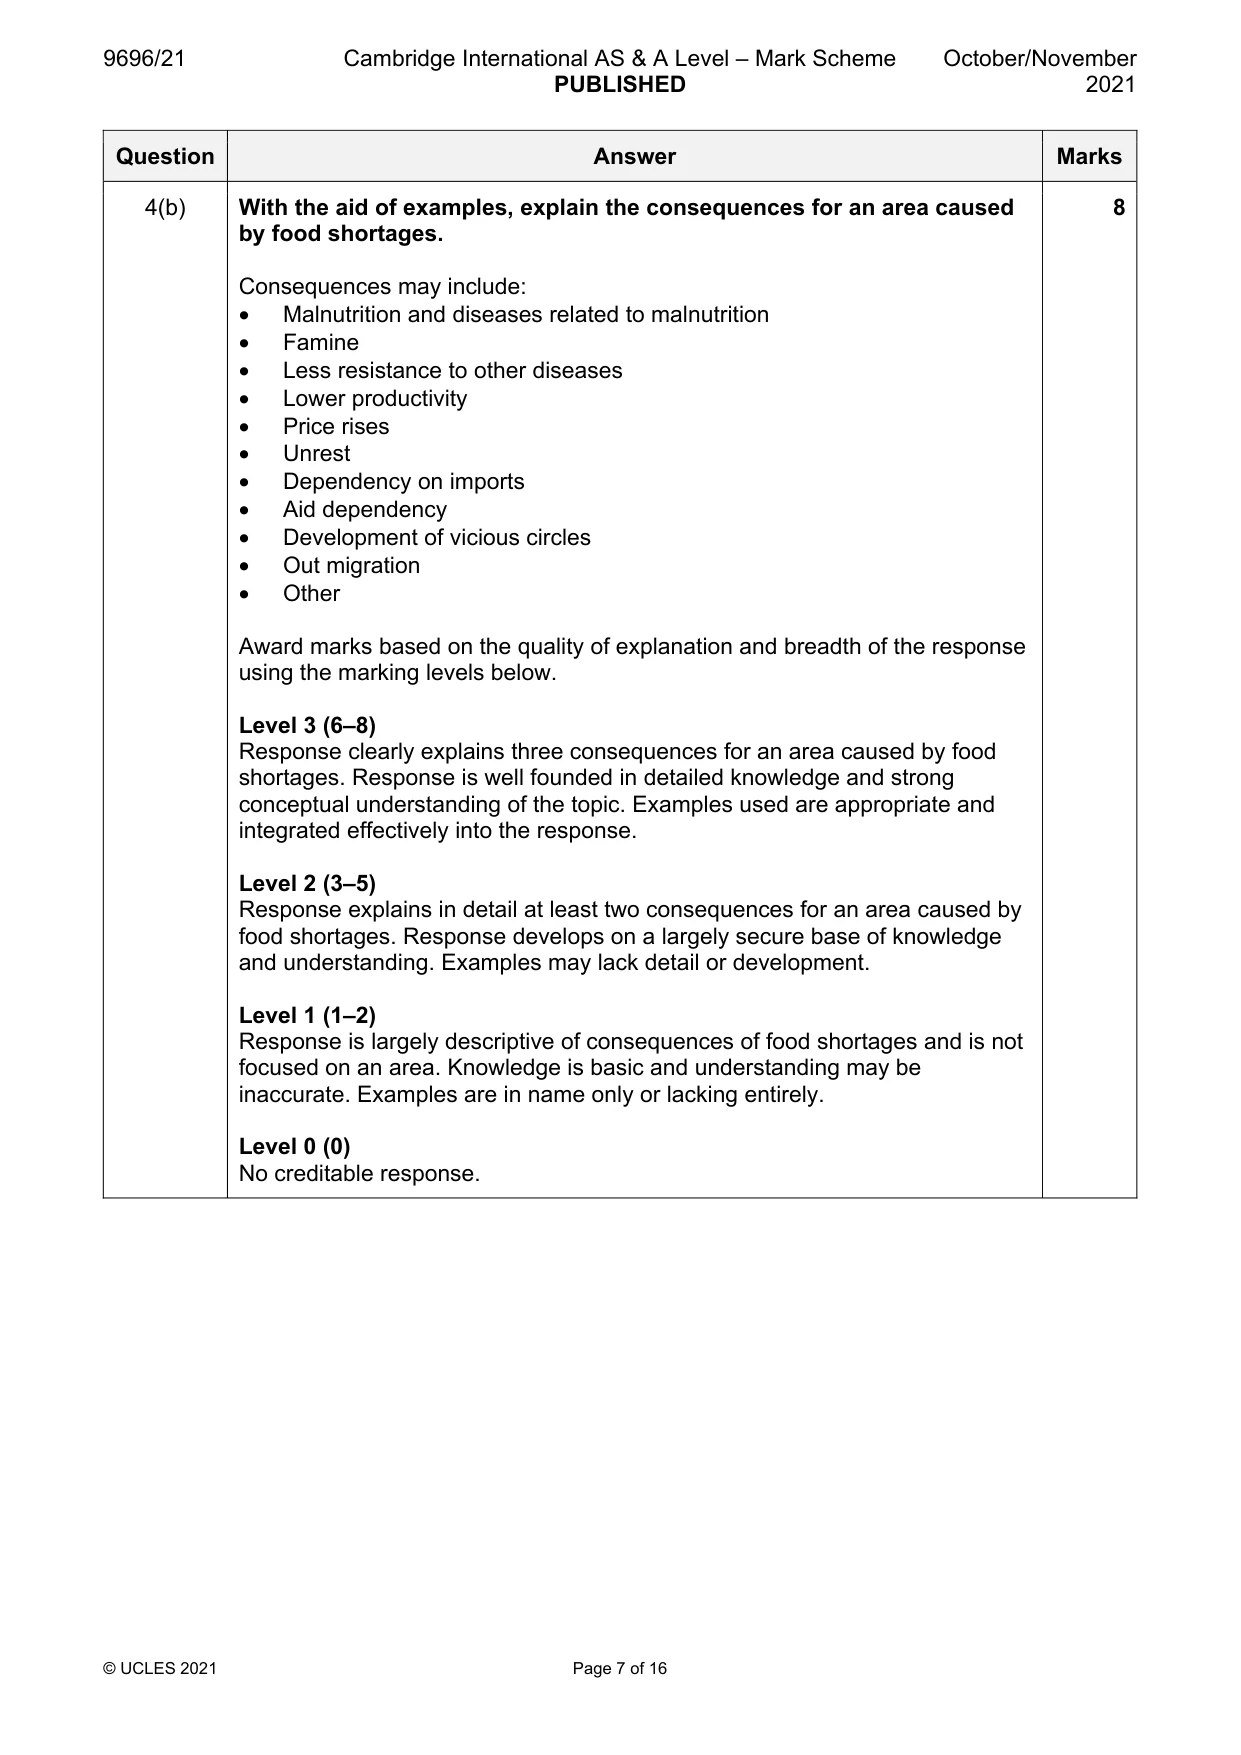
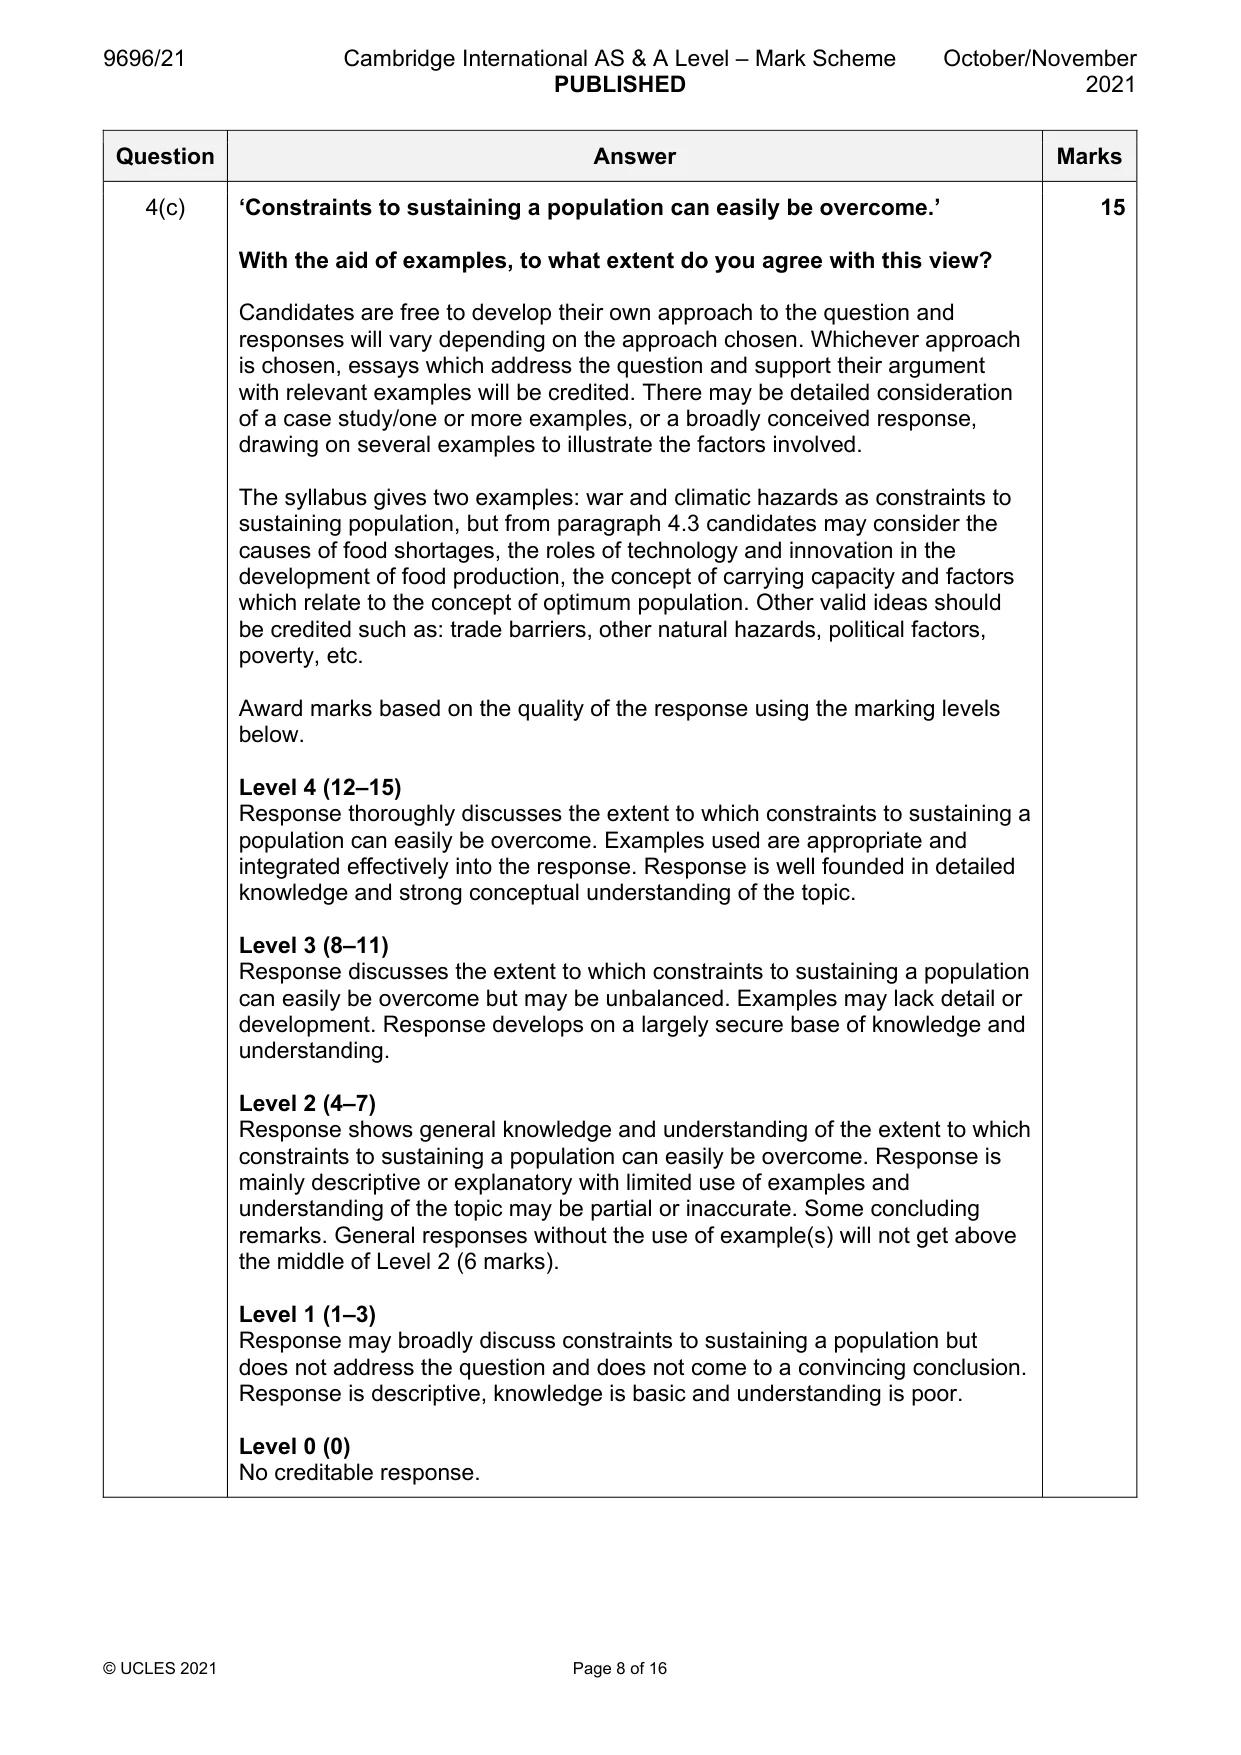
4 (a) (i) Define the concept of underpopulation. [3] (ii) Suggest two problems that underpopulation causes for an area when developing its resources. [4] (b) With the aid of examples, explain the consequences for an area caused by food shortages. [8] (c) ‘Constraints to sustaining a population can easily be overcome.’ With the aid of examples, to what extent do you agree with this view? [15] Migration
Mark scheme: 4(a)(i) Define the concept of underpopulation. 3 A simple approach could be as follows: An area is underpopulated when there are too few people/workers (1) to exploit their resources (efficiently) / to realise the economic potential of an area (1) to support its population's standard of living / to provide economic growth/development (1). Candidates may also consider level of technology, sustainability and other valid ideas as being important. 4(a)(ii) Suggest two problems that underpopulation causes for an area when 4 developing its resources. Content may include: • Labour shortage • Higher cost of providing services • Lower productivity • Lack of taxation to develop infrastructure • Less innovation to develop technology 1 mark per reason or 2 marks with development such as using an example or more detail. 4(b) With the aid of examples, explain the consequences for an area caused 8 by food shortages. Consequences may include: • Malnutrition and diseases related to malnutrition • Famine • Less resistance to other diseases • Lower productivity • Price rises • Unrest • Dependency on imports • Aid dependency • Development of vicious circles • Out migration • Other Award marks based on the quality of explanation and breadth of the response using the marking levels below. Level 3 (6–8) Response clearly explains three consequences for an area caused by food shortages. Response is well founded in detailed knowledge and strong conceptual understanding of the topic. Examples used are appropriate and integrated effectively into the response. Level 2 (3–5) Response explains in detail at least two consequences for an area caused by food shortages. Response develops on a largely secure base of knowledge and understanding. Examples may lack detail or development. Level 1 (1–2) Response is largely descriptive of consequences of food shortages and is not focused on an area. Knowledge is basic and understanding may be inaccurate. Examples are in name only or lacking entirely. Level 0 (0) No creditable response. 4(c) ‘Constraints to sustaining a population can easily be overcome.’ 15 With the aid of examples, to what extent do you agree with this view? Candidates are free to develop their own approach to the question and responses will vary depending on the approach chosen. Whichever approach is chosen, essays which address the question and support their argument with relevant examples will be credited. There may be detailed consideration of a case study/one or more examples, or a broadly conceived response, drawing on several examples to illustrate the factors involved. The syllabus gives two examples: war and climatic hazards as constraints to sustaining population, but from paragraph 4.3 candidates may consider the causes of food shortages, the roles of technology and innovation in the development of food production, the concept of carrying capacity and factors which relate to the concept of optimum population. Other valid ideas should be credited such as: trade barriers, other natural hazards, political factors, poverty, etc. Award marks based on the quality of the response using the marking levels below. Level 4 (12–15) Response thoroughly discusses the extent to which constraints to sustaining a population can easily be overcome. Examples used are appropriate and integrated effectively into the response. Response is well founded in detailed knowledge and strong conceptual understanding of the topic. Level 3 (8–11) Response discusses the extent to which constraints to sustaining a population can easily be overcome but may be unbalanced. Examples may lack detail or development. Response develops on a largely secure base of knowledge and understanding. Level 2 (4–7) Response shows general knowledge and understanding of the extent to which constraints to sustaining a population can easily be overcome. Response is mainly descriptive or explanatory with limited use of examples and understanding of the topic may be partial or inaccurate. Some concluding remarks. General responses without the use of example(s) will not get above the middle of Level 2 (6 marks). Level 1 (1–3) Response may broadly discuss constraints to sustaining a population but does not address the question and does not come to a convincing conclusion. Response is descriptive, knowledge is basic and understanding is poor. Level 0 (0) No creditable response. Migration
Q5 · Define the process of urban‒urban migration
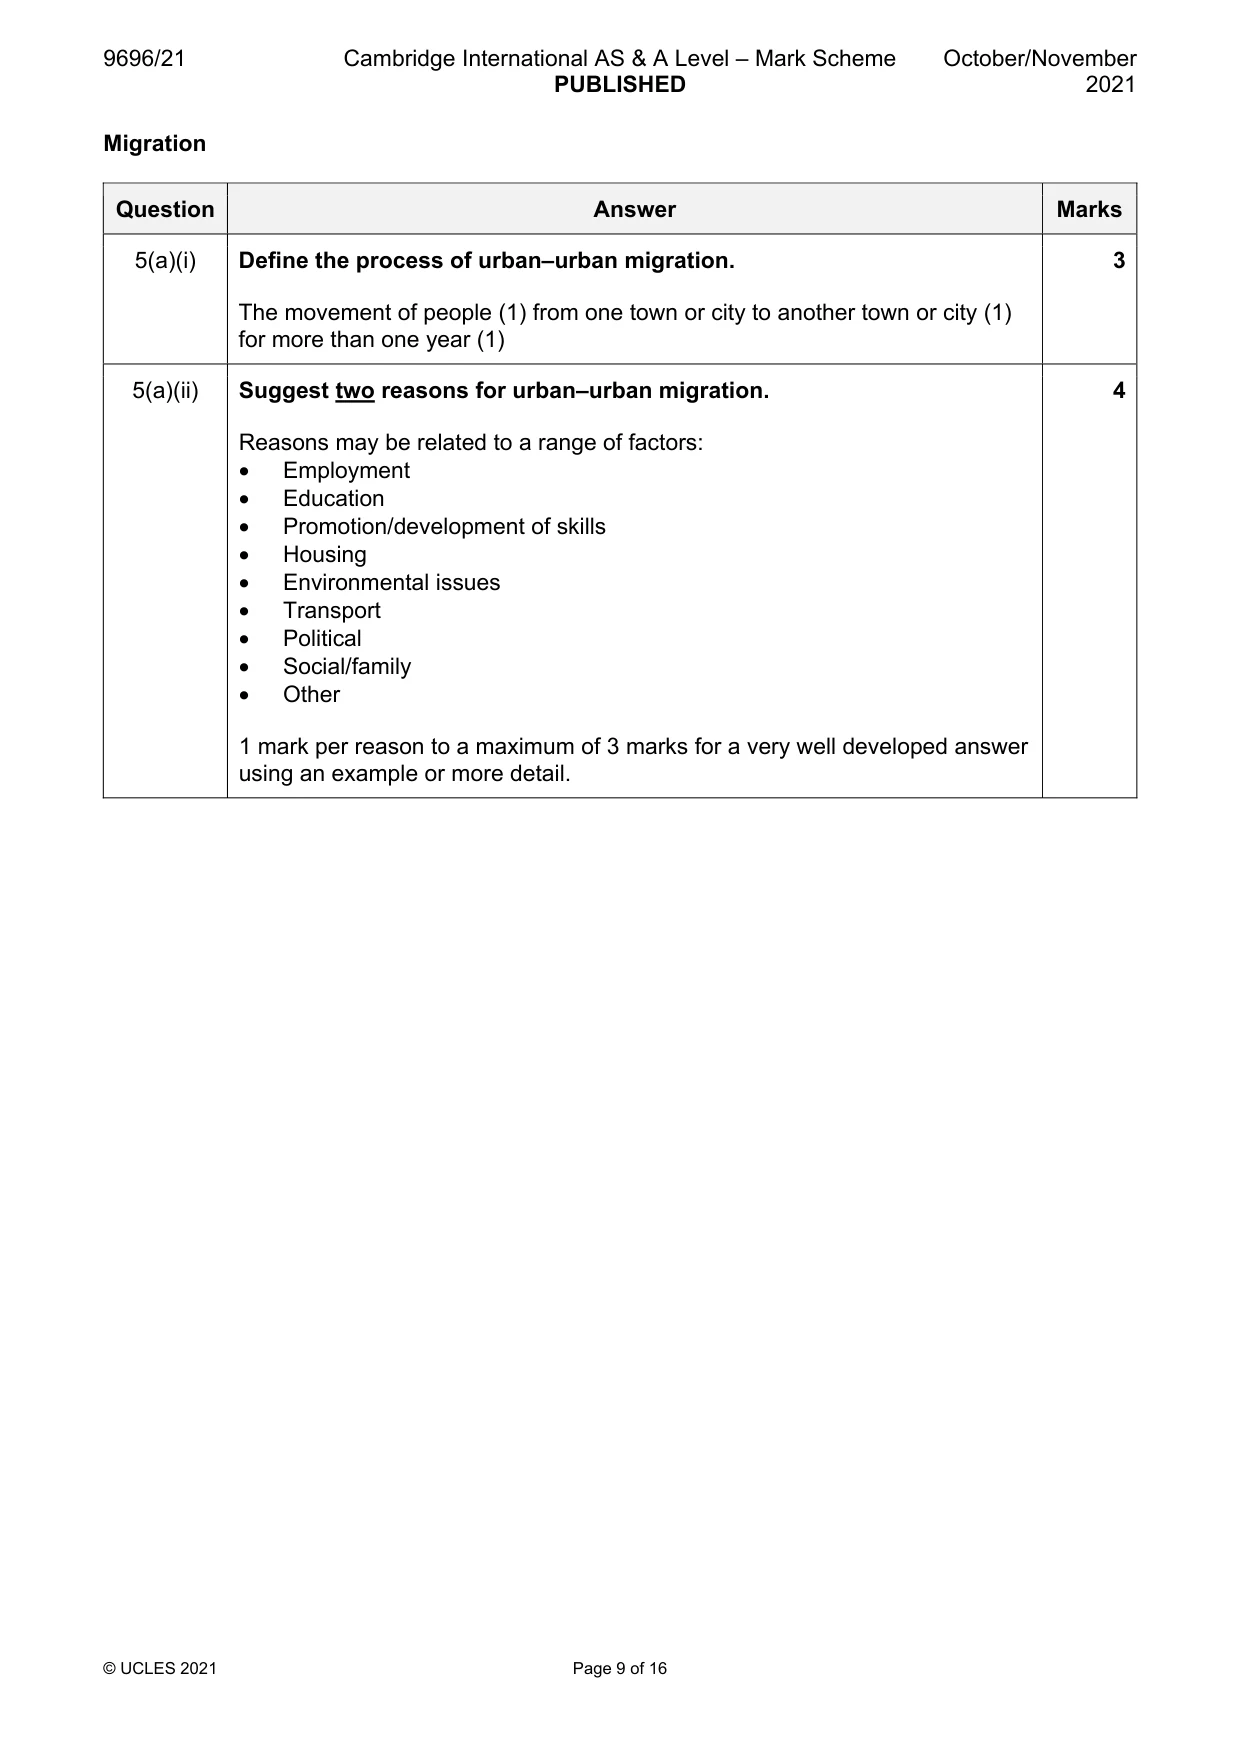
5 (a) (i) Define the process of urban‒urban migration. [3] (ii) Suggest two reasons for urban‒urban migration. [4] (b) With the aid of examples, explain the role of push factors in urban‒rural migration. [8] (c) ‘Urban‒rural migration has a greater impact than rural‒urban migration on the receiving/ destination areas.’ With the aid of examples, how far do you agree with this view? [15] Migration/Settlement dynamics
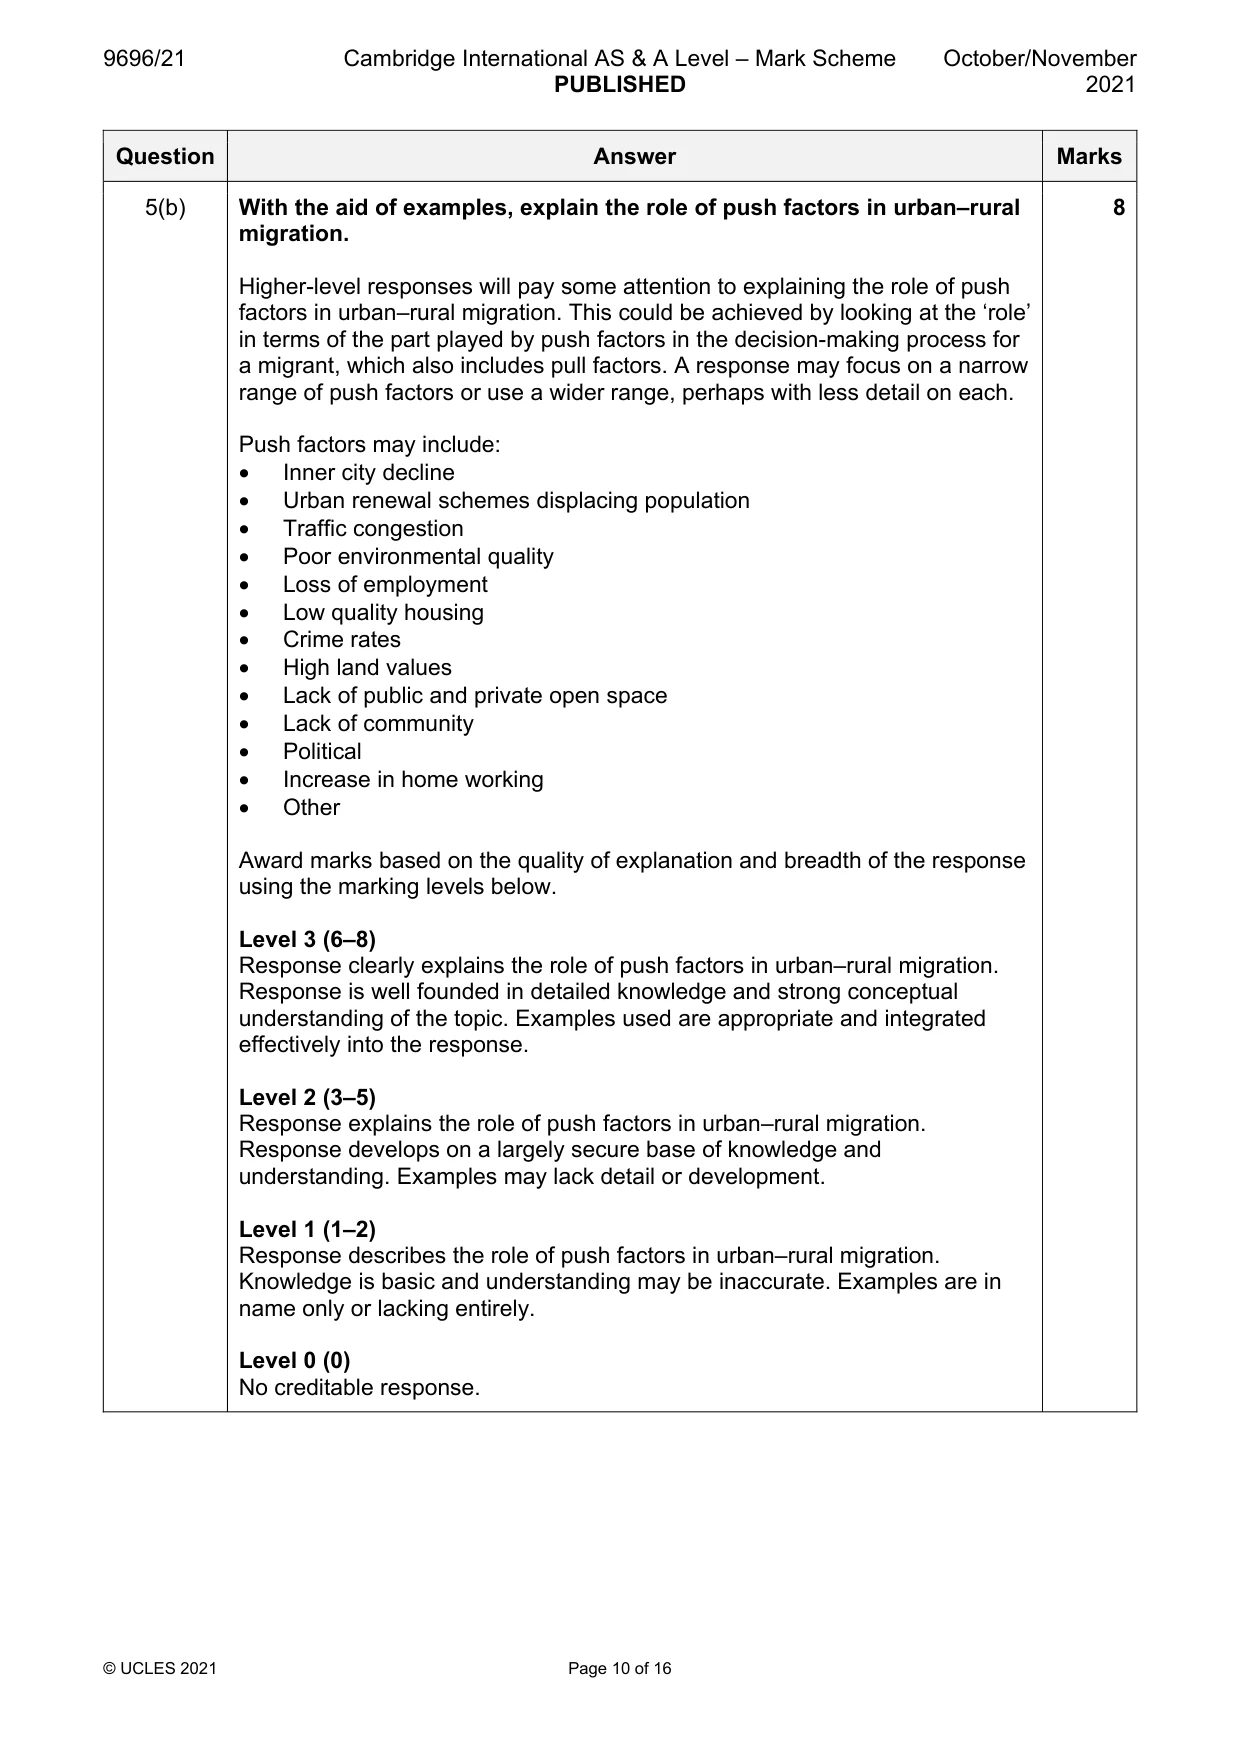
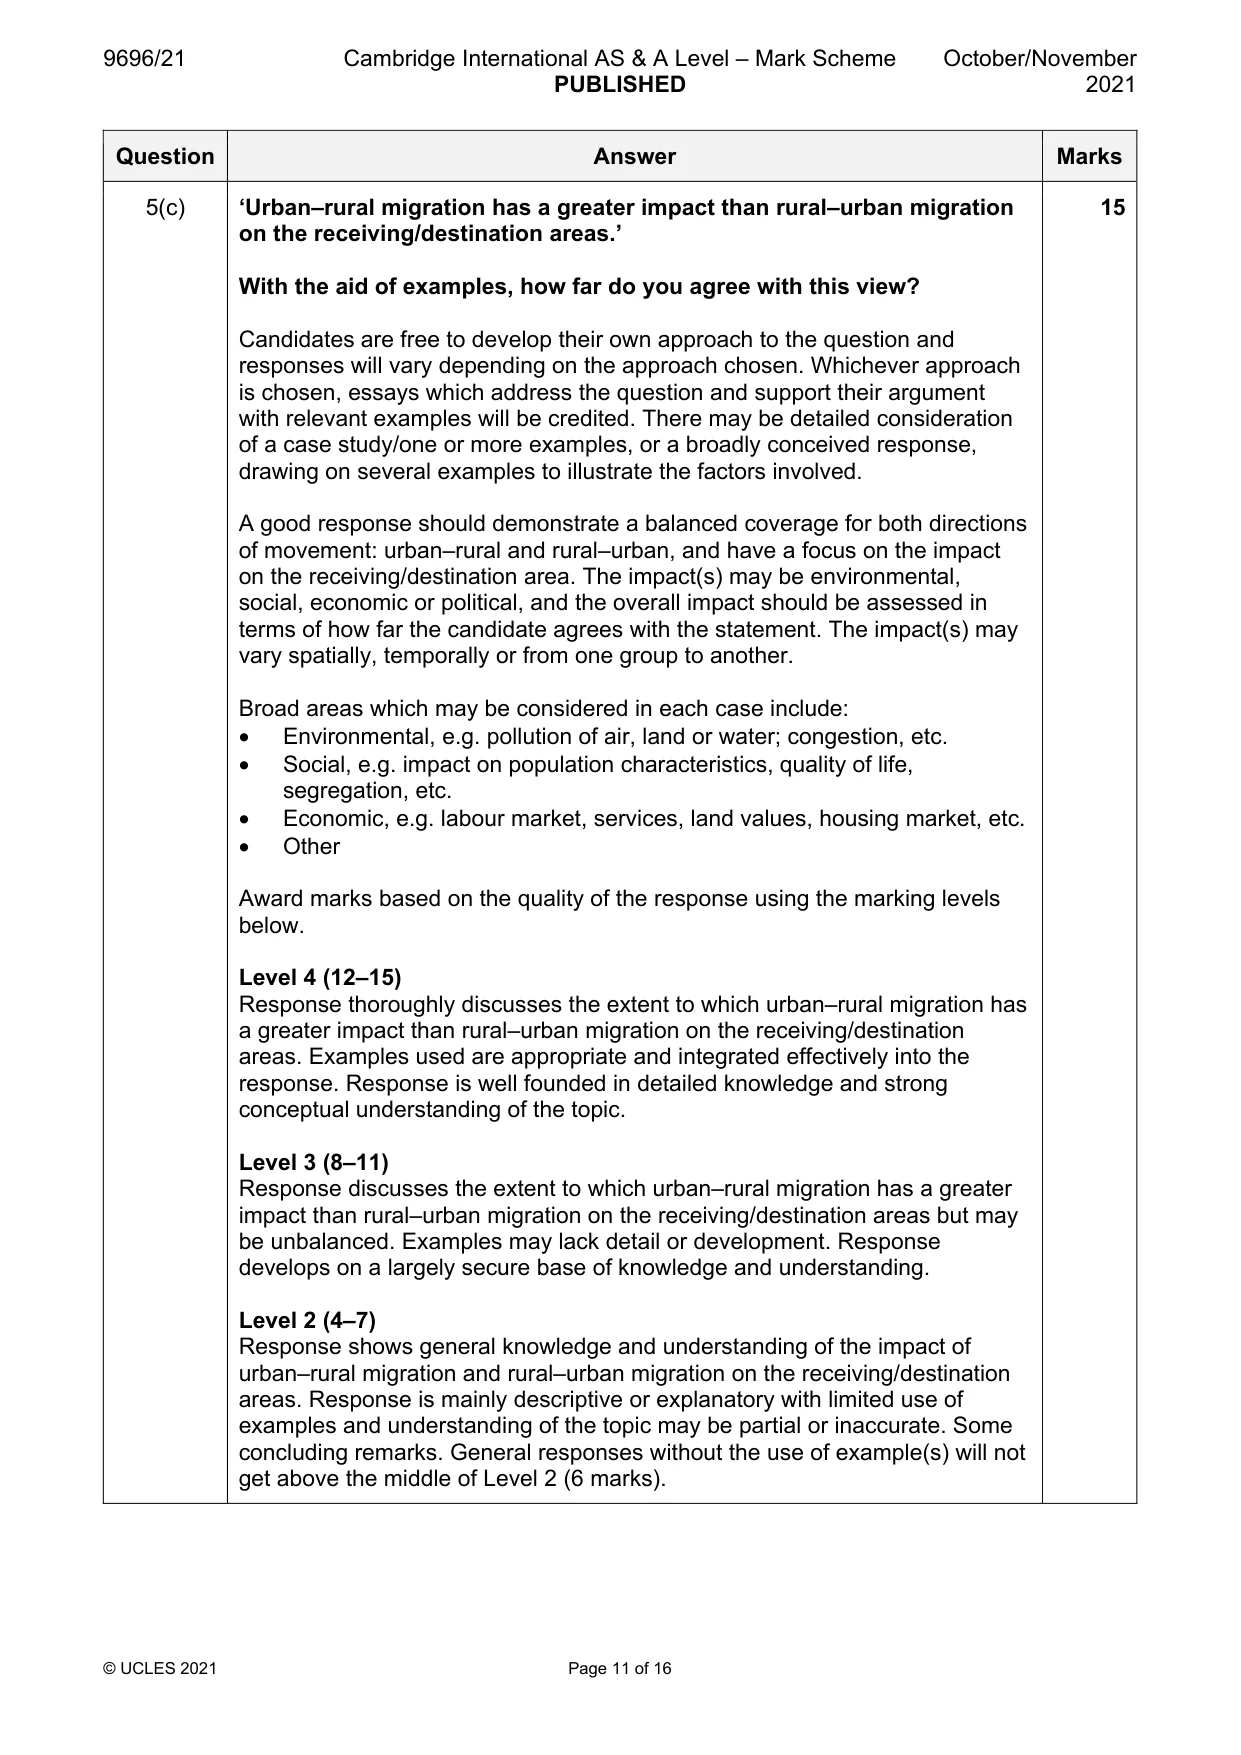
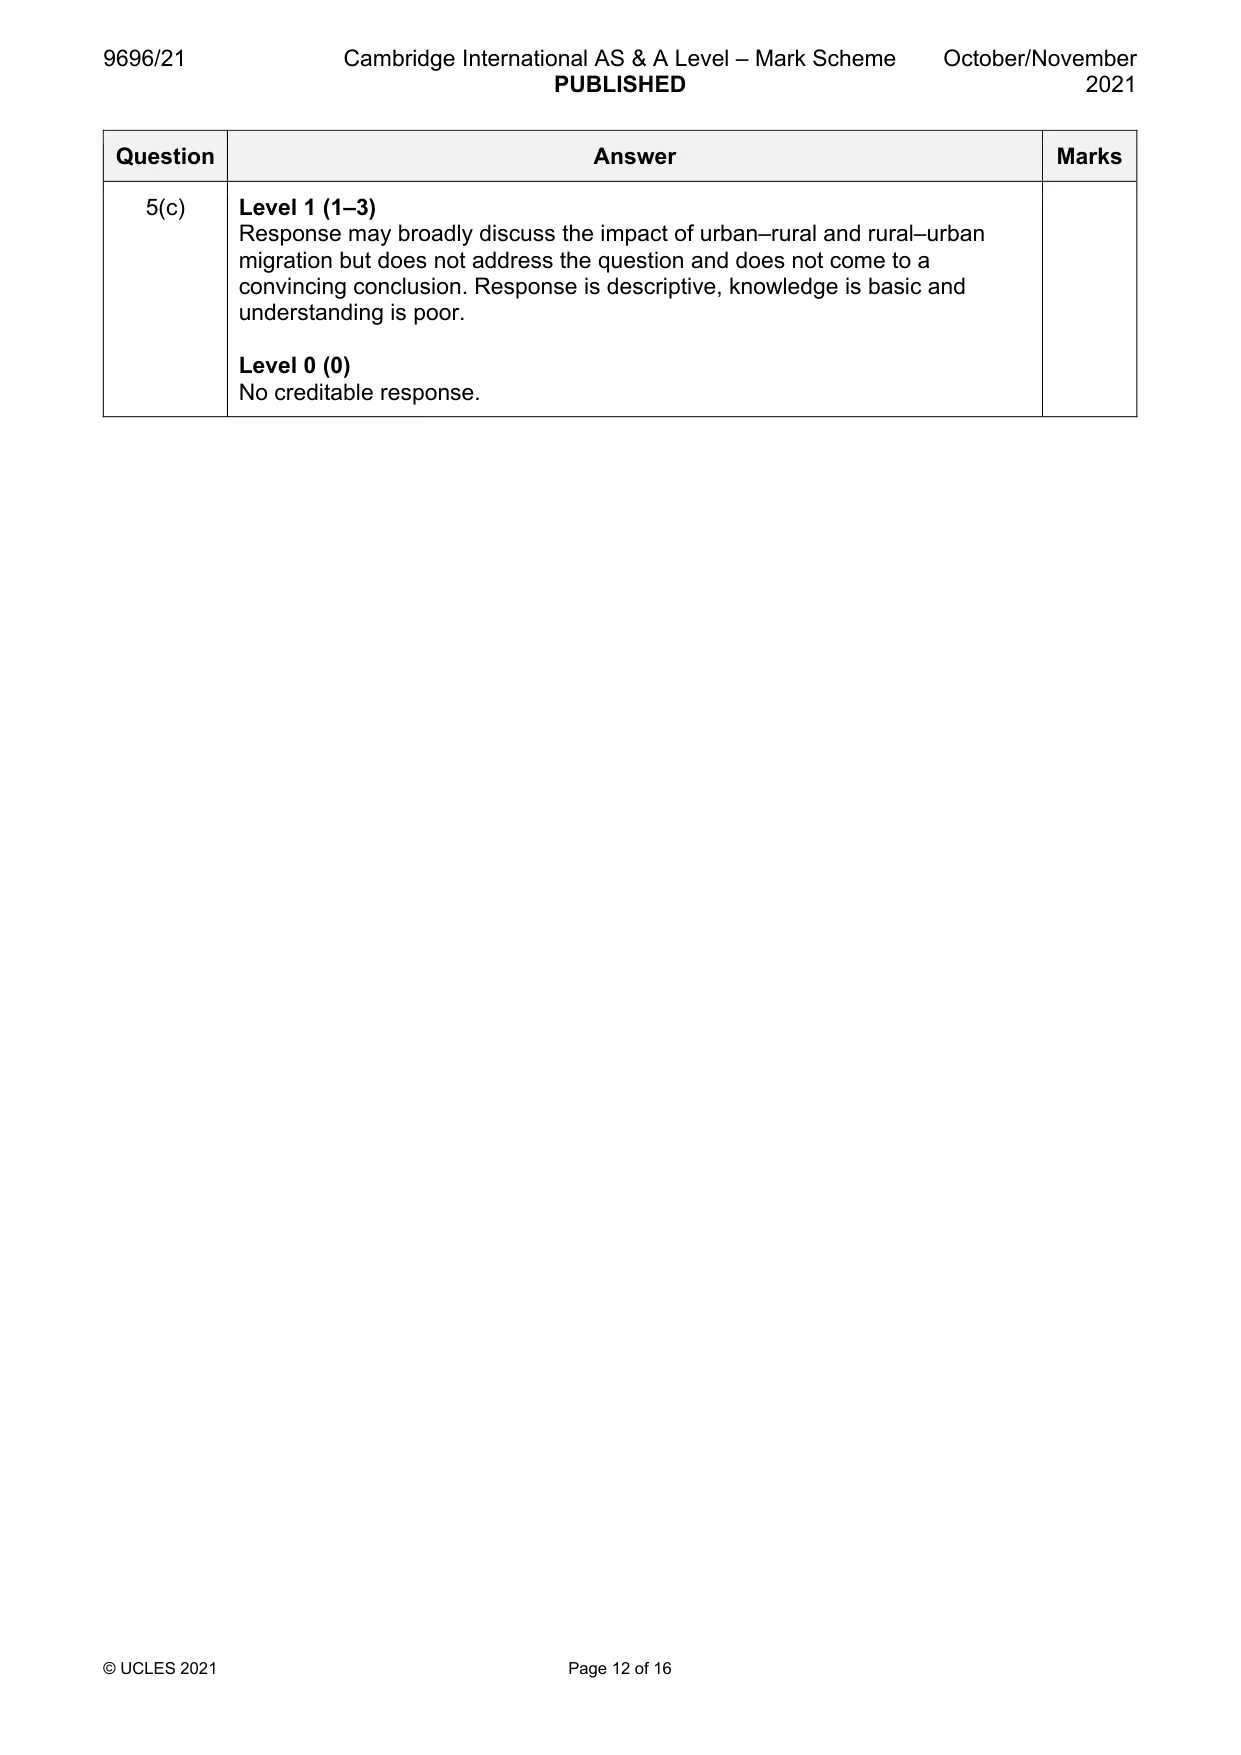
Mark scheme: 5(a)(i) Define the process of urban‒urban migration. 3 The movement of people (1) from one town or city to another town or city (1) for more than one year (1) 5(a)(ii) Suggest two reasons for urban‒urban migration. 4 Reasons may be related to a range of factors: • Employment • Education • Promotion/development of skills • Housing • Environmental issues • Transport • Political • Social/family • Other 1 mark per reason to a maximum of 3 marks for a very well developed answer using an example or more detail. 5(b) With the aid of examples, explain the role of push factors in urban‒rural 8 migration. Higher-level responses will pay some attention to explaining the role of push factors in urban‒rural migration. This could be achieved by looking at the ‘role’ in terms of the part played by push factors in the decision-making process for a migrant, which also includes pull factors. A response may focus on a narrow range of push factors or use a wider range, perhaps with less detail on each. Push factors may include: • Inner city decline • Urban renewal schemes displacing population • Traffic congestion • Poor environmental quality • Loss of employment • Low quality housing • Crime rates • High land values • Lack of public and private open space • Lack of community • Political • Increase in home working • Other Award marks based on the quality of explanation and breadth of the response using the marking levels below. Level 3 (6–8) Response clearly explains the role of push factors in urban‒rural migration. Response is well founded in detailed knowledge and strong conceptual understanding of the topic. Examples used are appropriate and integrated effectively into the response. Level 2 (3–5) Response explains the role of push factors in urban‒rural migration. Response develops on a largely secure base of knowledge and understanding. Examples may lack detail or development. Level 1 (1–2) Response describes the role of push factors in urban‒rural migration. Knowledge is basic and understanding may be inaccurate. Examples are in name only or lacking entirely. Level 0 (0) No creditable response. 5(c) ‘Urban‒rural migration has a greater impact than rural‒urban migration 15 on the receiving/destination areas.’ With the aid of examples, how far do you agree with this view? Candidates are free to develop their own approach to the question and responses will vary depending on the approach chosen. Whichever approach is chosen, essays which address the question and support their argument with relevant examples will be credited. There may be detailed consideration of a case study/one or more examples, or a broadly conceived response, drawing on several examples to illustrate the factors involved. A good response should demonstrate a balanced coverage for both directions of movement: urban‒rural and rural‒urban, and have a focus on the impact on the receiving/destination area. The impact(s) may be environmental, social, economic or political, and the overall impact should be assessed in terms of how far the candidate agrees with the statement. The impact(s) may vary spatially, temporally or from one group to another. Broad areas which may be considered in each case include: • Environmental, e.g. pollution of air, land or water; congestion, etc. • Social, e.g. impact on population characteristics, quality of life, segregation, etc. • Economic, e.g. labour market, services, land values, housing market, etc. • Other Award marks based on the quality of the response using the marking levels below. Level 4 (12–15) Response thoroughly discusses the extent to which urban–rural migration has a greater impact than rural–urban migration on the receiving/destination areas. Examples used are appropriate and integrated effectively into the response. Response is well founded in detailed knowledge and strong conceptual understanding of the topic. Level 3 (8–11) Response discusses the extent to which urban–rural migration has a greater impact than rural–urban migration on the receiving/destination areas but may be unbalanced. Examples may lack detail or development. Response develops on a largely secure base of knowledge and understanding. Level 2 (4–7) Response shows general knowledge and understanding of the impact of urban–rural migration and rural–urban migration on the receiving/destination areas. Response is mainly descriptive or explanatory with limited use of examples and understanding of the topic may be partial or inaccurate. Some concluding remarks. General responses without the use of example(s) will not get above the middle of Level 2 (6 marks). 5(c) Level 1 (1–3) Response may broadly discuss the impact of urban–rural and rural–urban migration but does not address the question and does not come to a convincing conclusion. Response is descriptive, knowledge is basic and understanding is poor. Level 0 (0) No creditable response. Migration/Settlement dynamics
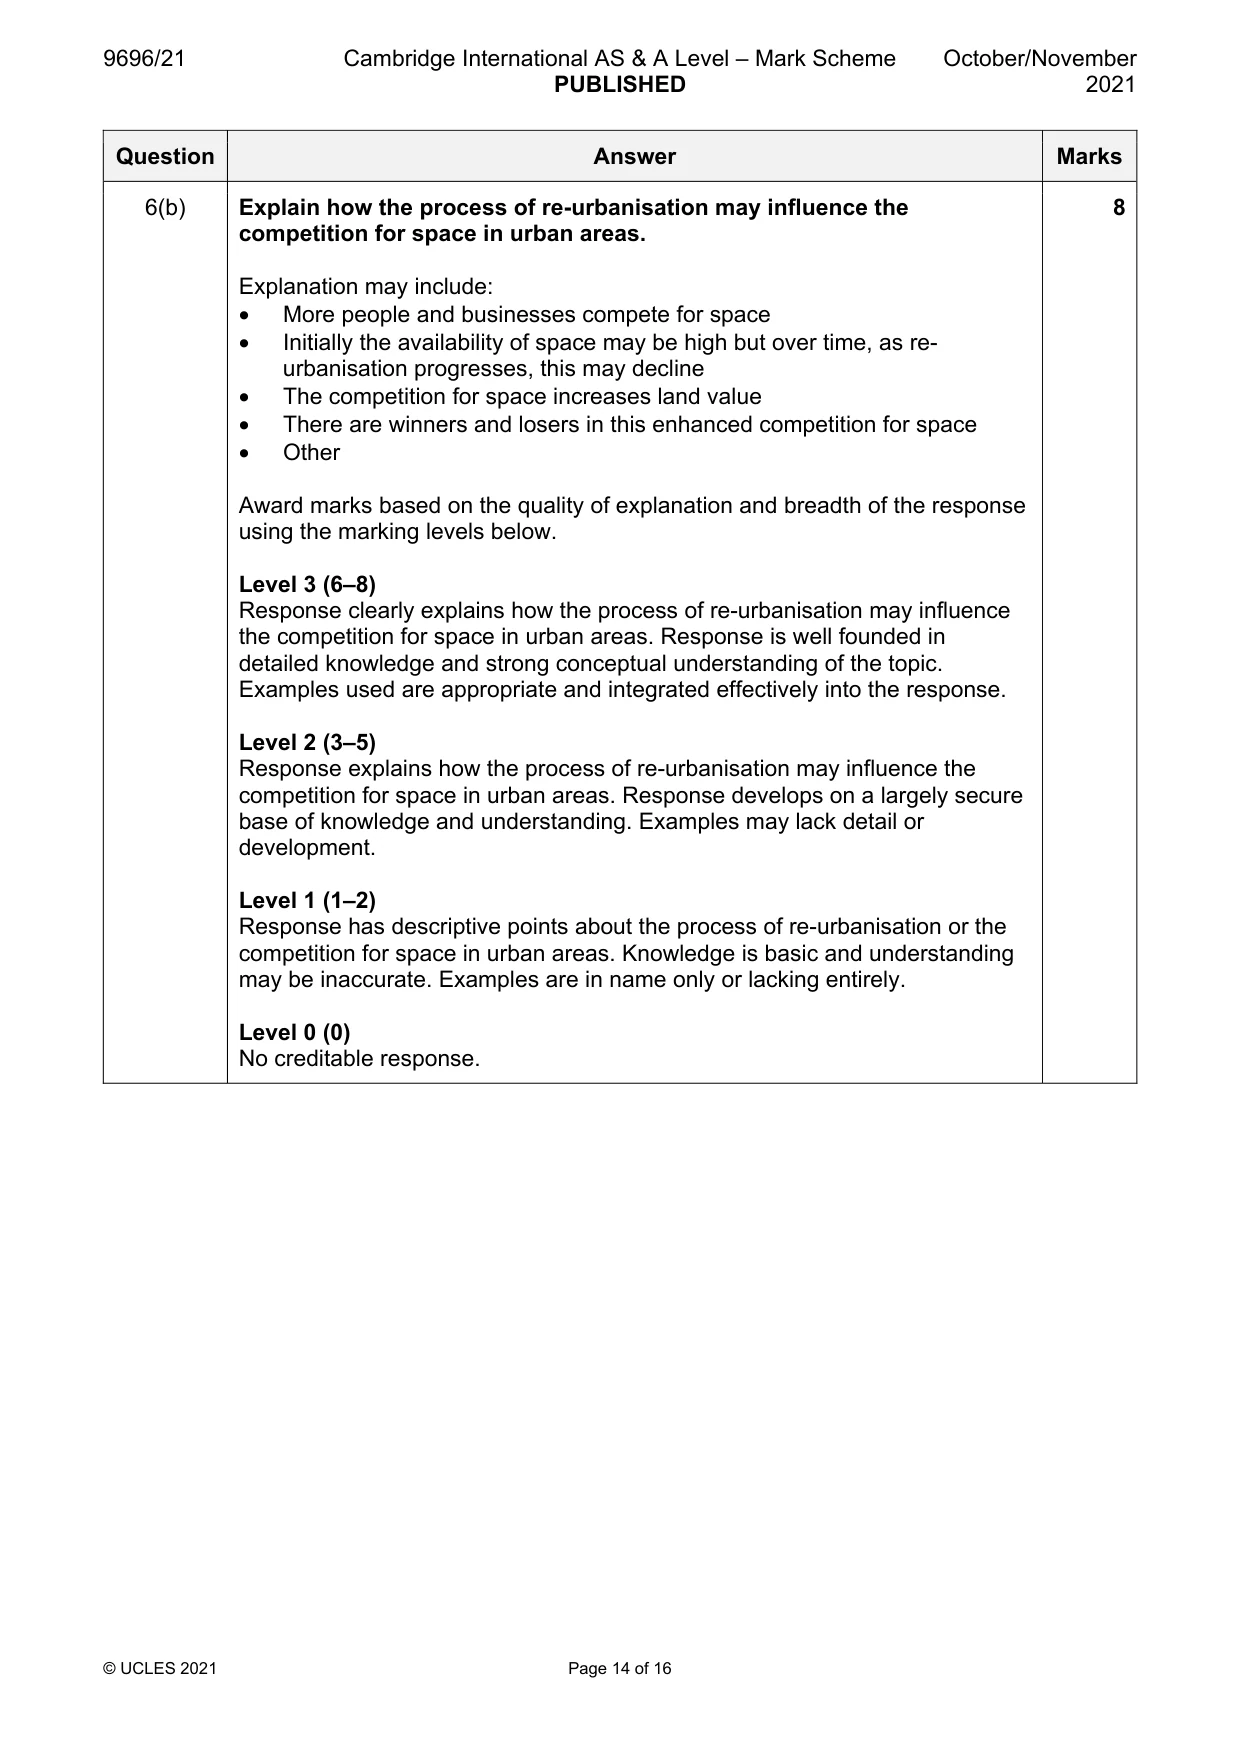
Q6 · Compare the process of re-urbanisation with the process of urban renewal
6 (a) Compare the process of re-urbanisation with the process of urban renewal. [7] (b) Explain how the process of re-urbanisation may influence the competition for space in urban areas. [8] (c) Assess the extent to which issues in rural settlements in LICs/MICs are the result of internal migration. [15]
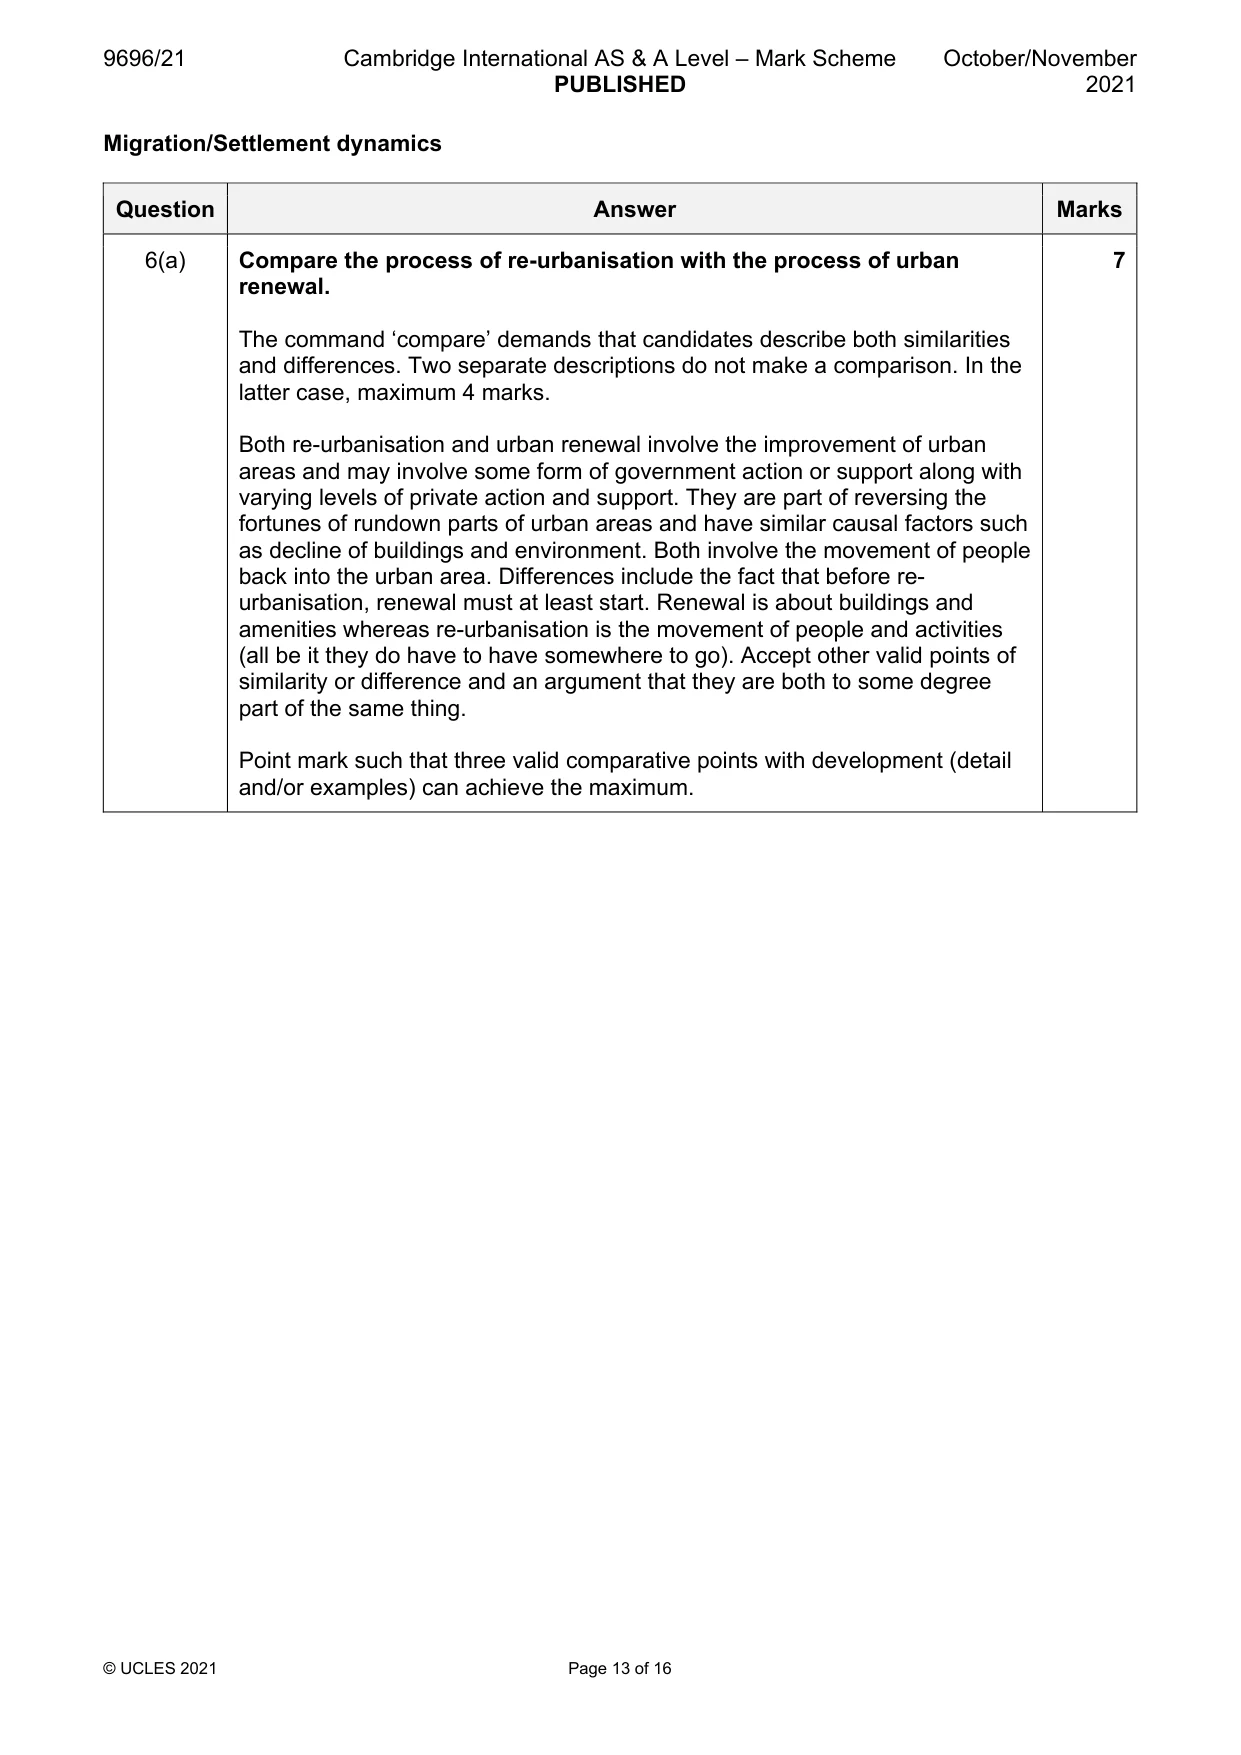
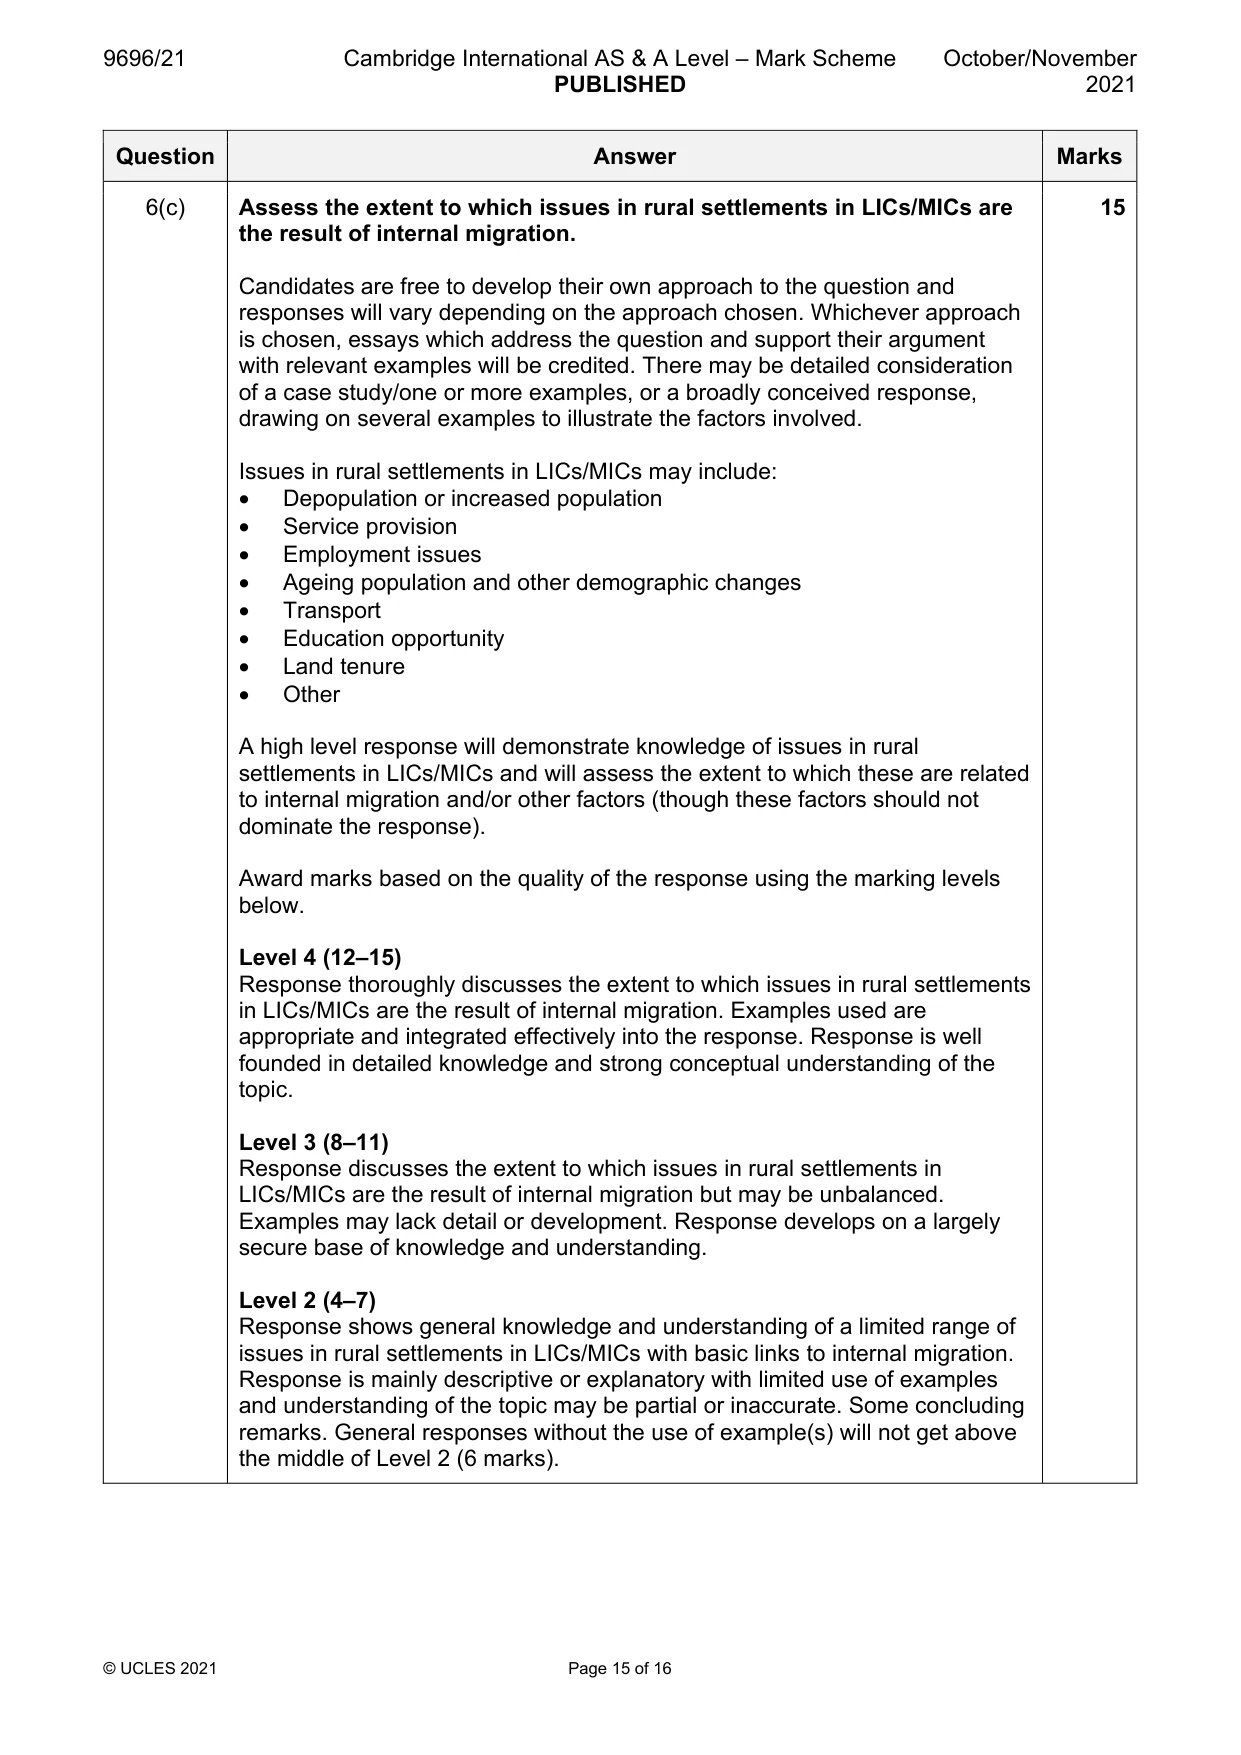
Mark scheme: 6(a) Compare the process of re-urbanisation with the process of urban 7 renewal. The command ‘compare’ demands that candidates describe both similarities and differences. Two separate descriptions do not make a comparison. In the latter case, maximum 4 marks. Both re-urbanisation and urban renewal involve the improvement of urban areas and may involve some form of government action or support along with varying levels of private action and support. They are part of reversing the fortunes of rundown parts of urban areas and have similar causal factors such as decline of buildings and environment. Both involve the movement of people back into the urban area. Differences include the fact that before re- urbanisation, renewal must at least start. Renewal is about buildings and amenities whereas re-urbanisation is the movement of people and activities (all be it they do have to have somewhere to go). Accept other valid points of similarity or difference and an argument that they are both to some degree part of the same thing. Point mark such that three valid comparative points with development (detail and/or examples) can achieve the maximum. 6(b) Explain how the process of re-urbanisation may influence the 8 competition for space in urban areas. Explanation may include: • More people and businesses compete for space • Initially the availability of space may be high but over time, as re- urbanisation progresses, this may decline • The competition for space increases land value • There are winners and losers in this enhanced competition for space • Other Award marks based on the quality of explanation and breadth of the response using the marking levels below. Level 3 (6–8) Response clearly explains how the process of re-urbanisation may influence the competition for space in urban areas. Response is well founded in detailed knowledge and strong conceptual understanding of the topic. Examples used are appropriate and integrated effectively into the response. Level 2 (3–5) Response explains how the process of re-urbanisation may influence the competition for space in urban areas. Response develops on a largely secure base of knowledge and understanding. Examples may lack detail or development. Level 1 (1–2) Response has descriptive points about the process of re-urbanisation or the competition for space in urban areas. Knowledge is basic and understanding may be inaccurate. Examples are in name only or lacking entirely. Level 0 (0) No creditable response. 6(c) Assess the extent to which issues in rural settlements in LICs/MICs are 15 the result of internal migration. Candidates are free to develop their own approach to the question and responses will vary depending on the approach chosen. Whichever approach is chosen, essays which address the question and support their argument with relevant examples will be credited. There may be detailed consideration of a case study/one or more examples, or a broadly conceived response, drawing on several examples to illustrate the factors involved. Issues in rural settlements in LICs/MICs may include: • Depopulation or increased population • Service provision • Employment issues • Ageing population and other demographic changes • Transport • Education opportunity • Land tenure • Other A high level response will demonstrate knowledge of issues in rural settlements in LICs/MICs and will assess the extent to which these are related to internal migration and/or other factors (though these factors should not dominate the response). Award marks based on the quality of the response using the marking levels below. Level 4 (12–15) Response thoroughly discusses the extent to which issues in rural settlements in LICs/MICs are the result of internal migration. Examples used are appropriate and integrated effectively into the response. Response is well founded in detailed knowledge and strong conceptual understanding of the topic. Level 3 (8–11) Response discusses the extent to which issues in rural settlements in LICs/MICs are the result of internal migration but may be unbalanced. Examples may lack detail or development. Response develops on a largely secure base of knowledge and understanding. Level 2 (4–7) Response shows general knowledge and understanding of a limited range of issues in rural settlements in LICs/MICs with basic links to internal migration. Response is mainly descriptive or explanatory with limited use of examples and understanding of the topic may be partial or inaccurate. Some concluding remarks. General responses without the use of example(s) will not get above the middle of Level 2 (6 marks). 6(c) Level 1 (1–3) Response may broadly discuss issues in rural settlements in LICs/MICs without considering links to internal migration but does not address the question and does not come to a convincing conclusion. Response is descriptive, knowledge is basic and understanding is poor. Level 0 (0) No creditable response.
What was in this paper
The subtopics covered by these 6 questions, and how many questions each got. Open one in a new tab to see every Cambridge question on it.
What you needed in this session
Cambridge’s own grade thresholds for 2021 Oct/Nov, Paper 2 · Variant 1. A higher threshold means an easier paper — the bar moves with how the cohort did.