Cambridge A Level Geography 9696 — 2021 Oct/Nov Paper 2 · Variant 2
9696/22/O/N/21 · 6 questions · 60 marks · ≈68 min
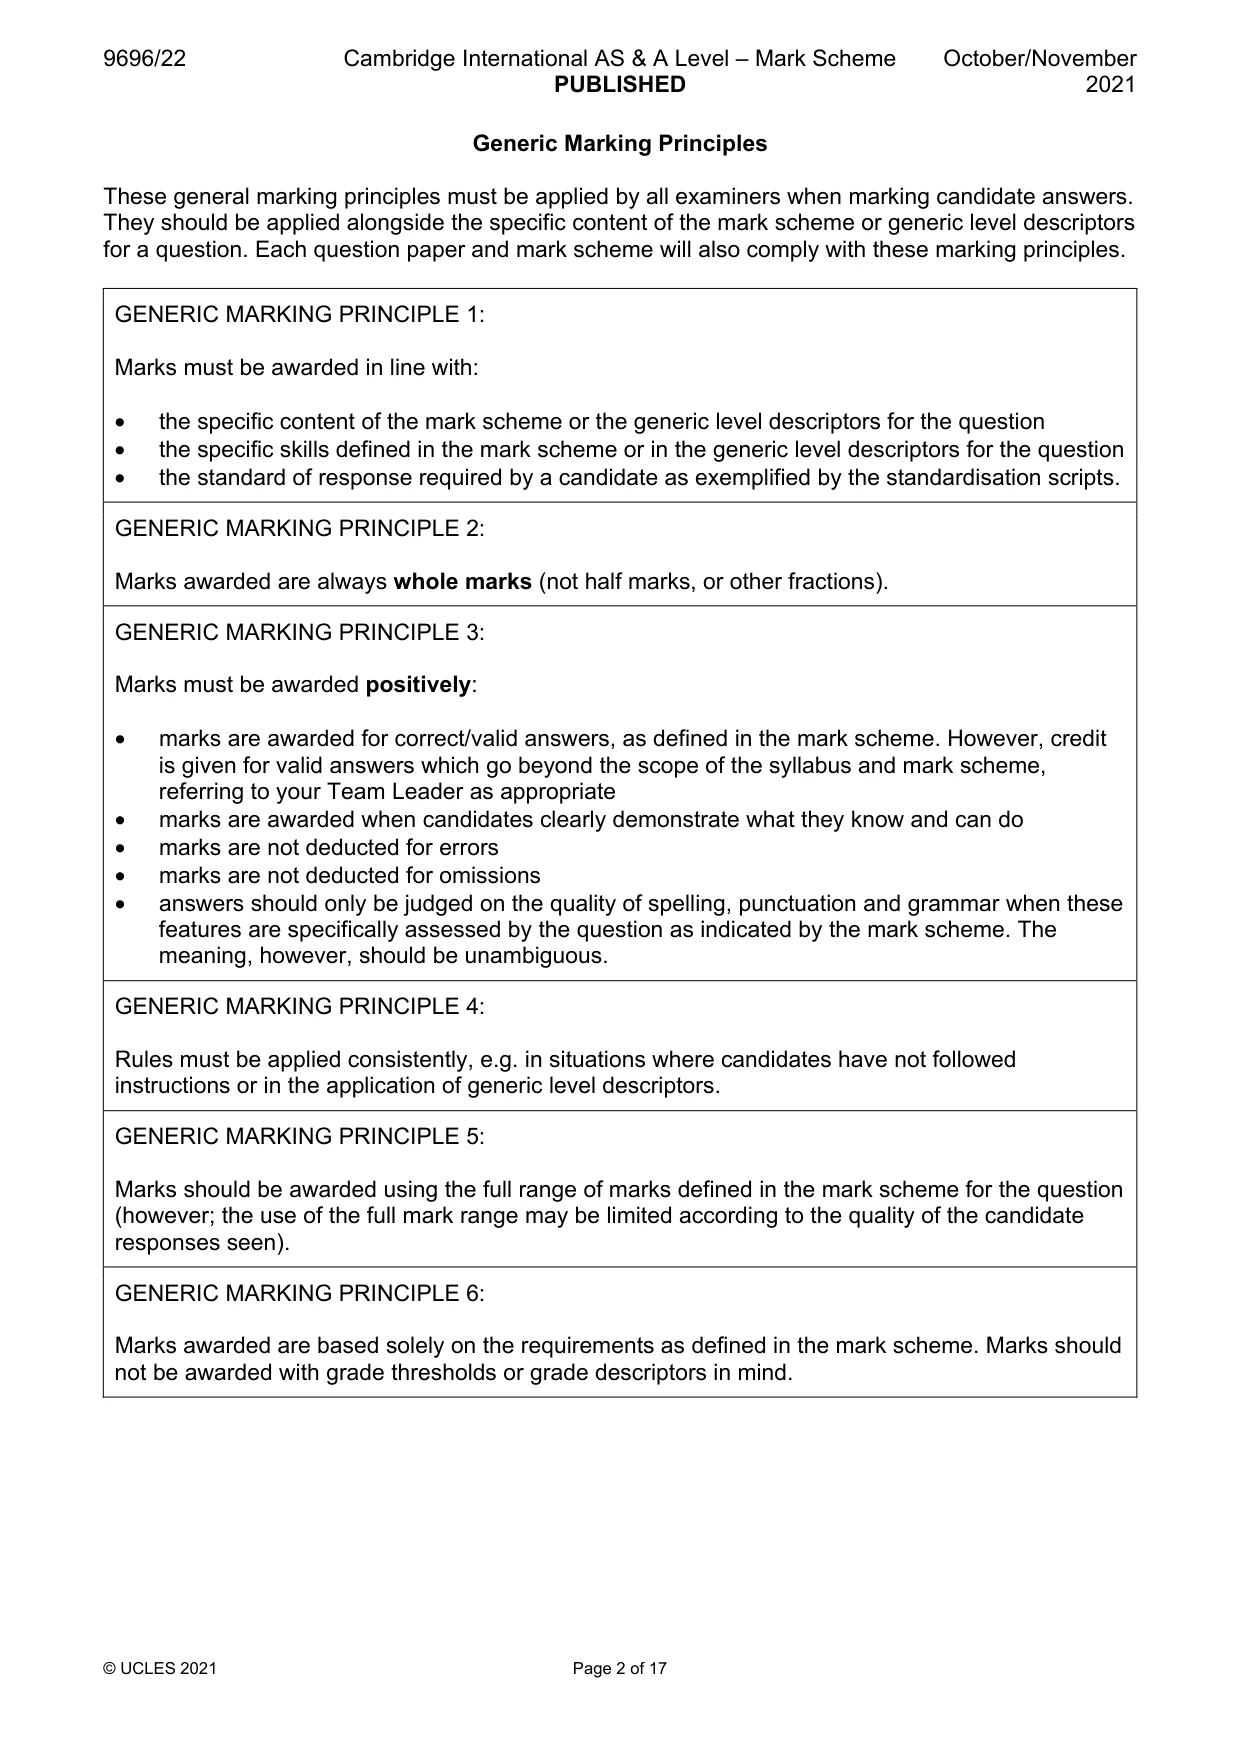
The question paper and its mark scheme, free to read here and free to download. This is Cambridge’s own paper, exactly as it was sat.
Question paper4 pages

Mark scheme17 pages
Answers below. Sit the paper first if you are practising.
Questions as text
Q1 · Life expectancy at birth in Kenya, an MIC in Africa, 2000–18
1 Fig. 1.1 shows life expectancy at birth in Kenya, an MIC in Africa, 2000–18. (a) Using Fig. 1.1, calculate the increase in life expectancy at birth from 2000 to 2018. Show your working. [2] (b) Suggest two reasons for the increase in life expectancy at birth shown in Fig. 1.1. [3] (c) Explain how low life expectancy of the population may be linked to low levels of development. [5] Migration
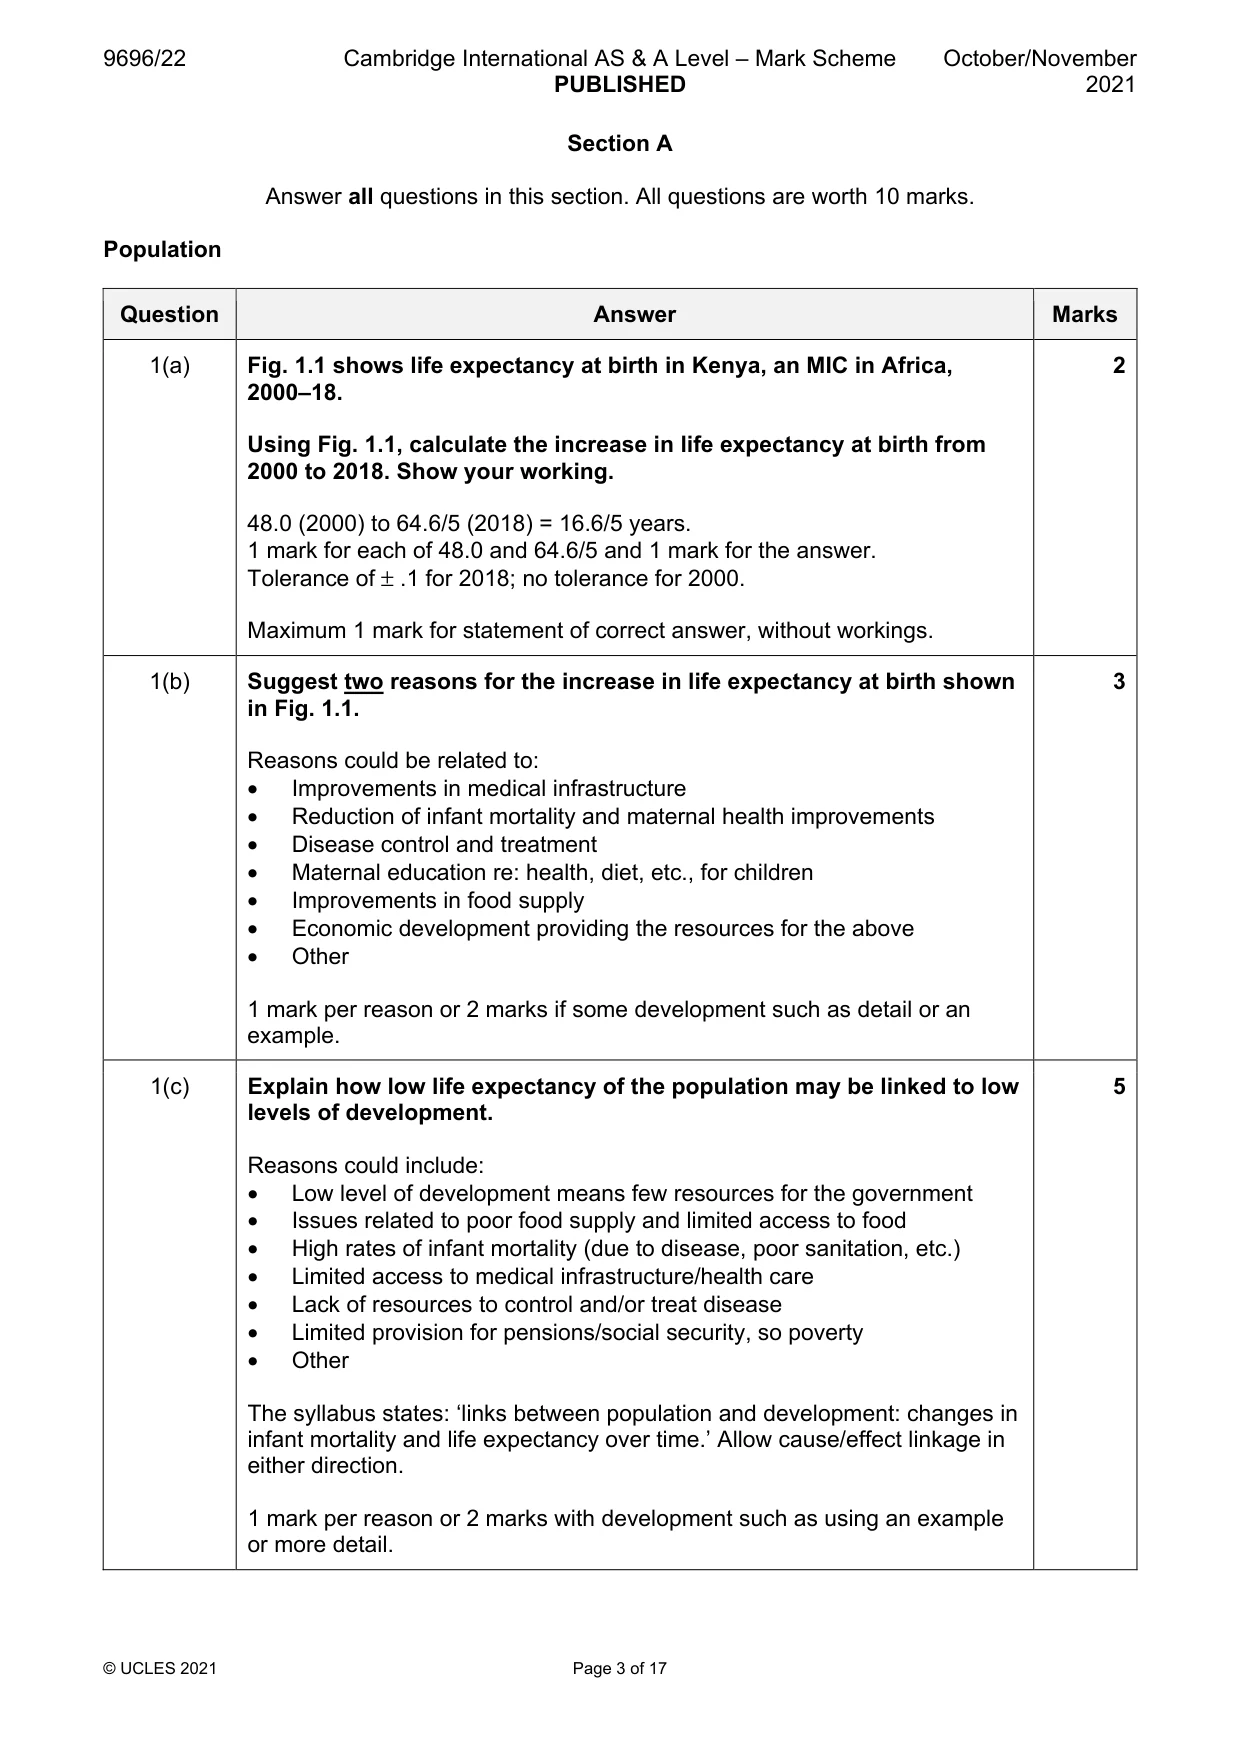
Mark scheme: Question Answer Marks 1(a) Fig. 1.1 shows life expectancy at birth in Kenya, an MIC in Africa, 2 2000–18. Using Fig. 1.1, calculate the increase in life expectancy at birth from 2000 to 2018. Show your working. 48.0 (2000) to 64.6/5 (2018) = 16.6/5 years. 1 mark for each of 48.0 and 64.6/5 and 1 mark for the answer. Tolerance of ± .1 for 2018; no tolerance for 2000. Maximum 1 mark for statement of correct answer, without workings. 1(b) Suggest two reasons for the increase in life expectancy at birth shown 3 in Fig. 1.1. Reasons could be related to: • Improvements in medical infrastructure • Reduction of infant mortality and maternal health improvements • Disease control and treatment • Maternal education re: health, diet, etc., for children • Improvements in food supply • Economic development providing the resources for the above • Other 1 mark per reason or 2 marks if some development such as detail or an example. 1(c) Explain how low life expectancy of the population may be linked to low 5 levels of development. Reasons could include: • Low level of development means few resources for the government • Issues related to poor food supply and limited access to food • High rates of infant mortality (due to disease, poor sanitation, etc.) • Limited access to medical infrastructure/health care • Lack of resources to control and/or treat disease • Limited provision for pensions/social security, so poverty • Other The syllabus states: ‘links between population and development: changes in infant mortality and life expectancy over time.’ Allow cause/effect linkage in either direction. 1 mark per reason or 2 marks with development such as using an example or more detail. Migration
Q2 · The causes of internal displacements of people in 2017
2 Fig. 2.1 shows the causes of internal displacements of people in 2017. (a) Using Fig. 2.1: (i) state the largest cause of internal displacement of people in 2017 [1] (ii) calculate the percentage of internal displacement caused by weather-related events. Show your working. [2] (b) Suggest two pull factors why internally displaced people may return to their source area. [3] (c) Explain how forced internal migration may have negative impacts on receiving/destination areas. [4] Settlement dynamics
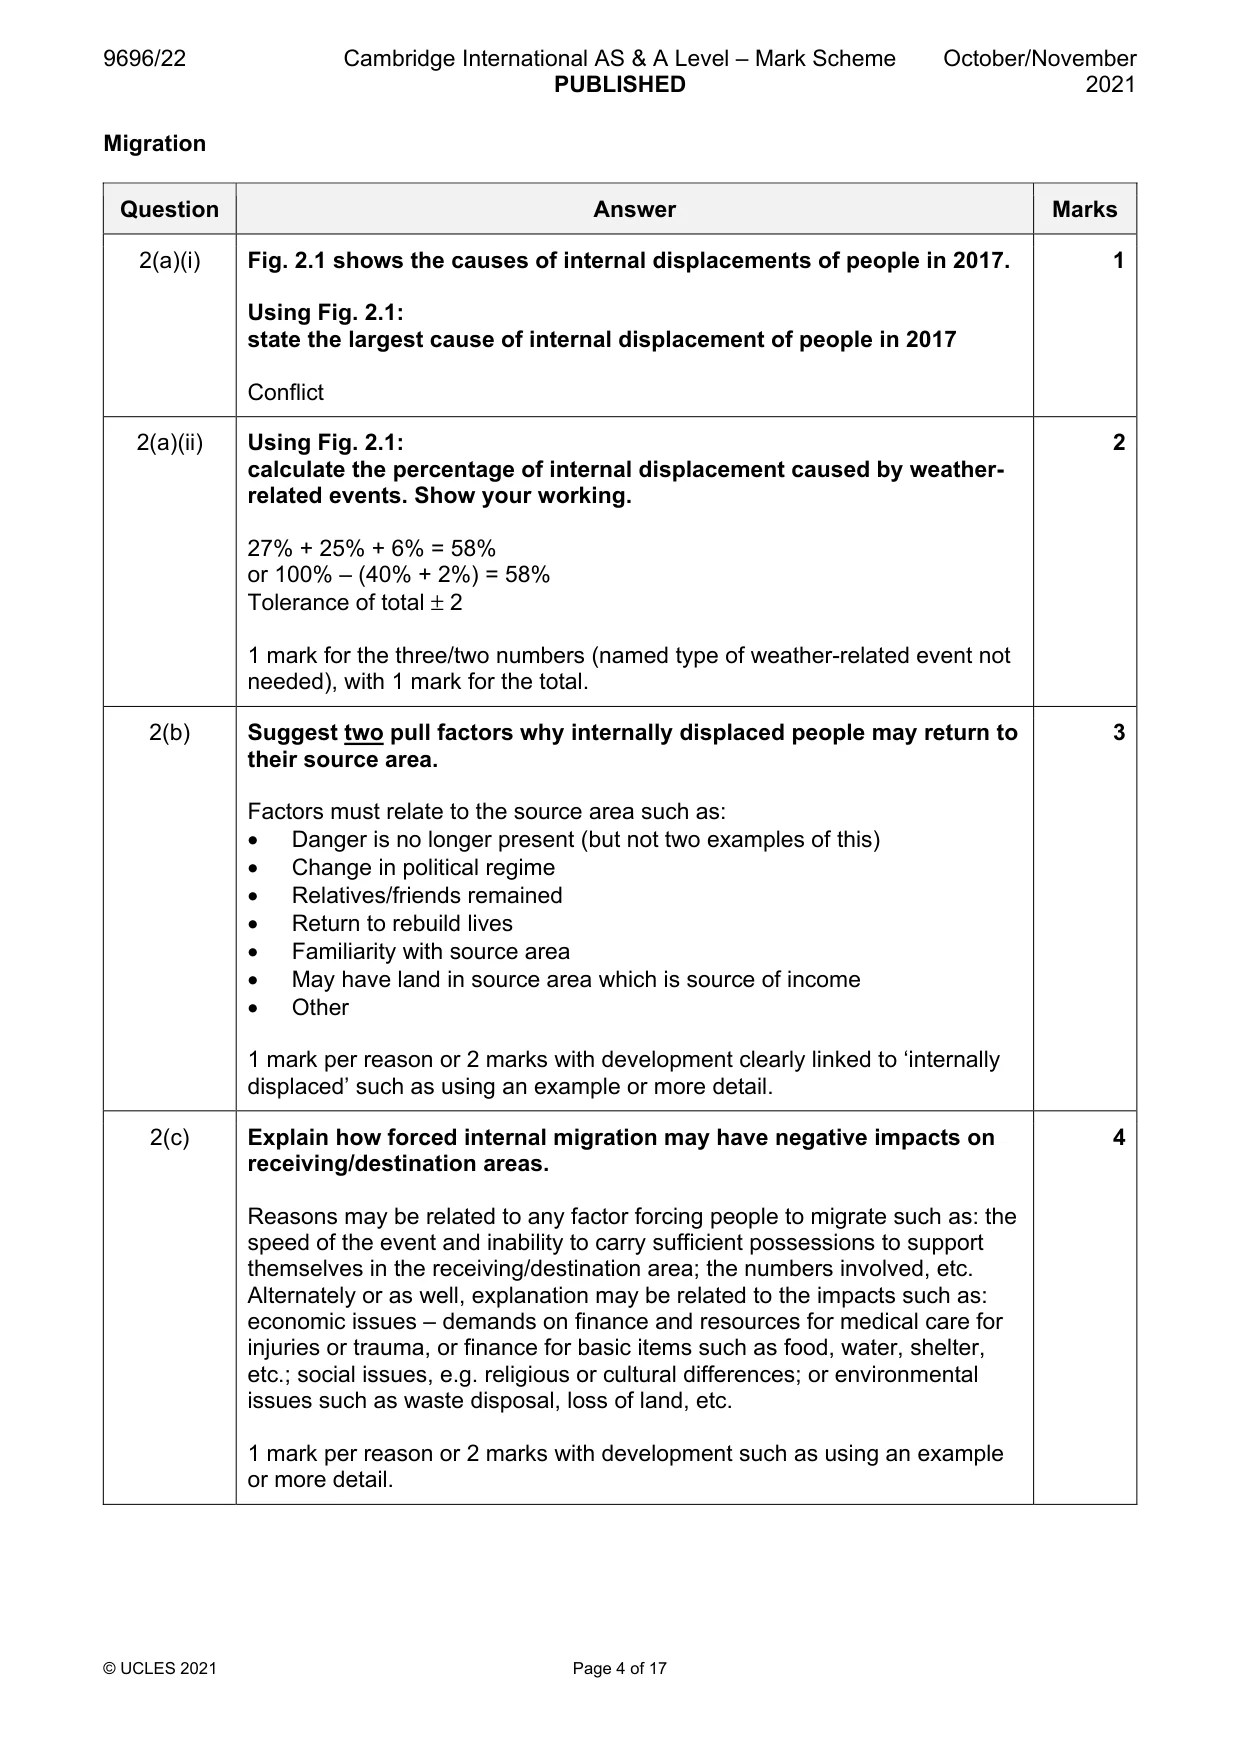
Mark scheme: 2(a)(i) Fig. 2.1 shows the causes of internal displacements of people in 2017. 1 Using Fig. 2.1: state the largest cause of internal displacement of people in 2017 Conflict 2(a)(ii) Using Fig. 2.1: 2 calculate the percentage of internal displacement caused by weather- related events. Show your working. 27% + 25% + 6% = 58% or 100% – (40% + 2%) = 58% Tolerance of total ± 2 1 mark for the three/two numbers (named type of weather-related event not needed), with 1 mark for the total. 2(b) Suggest two pull factors why internally displaced people may return to 3 their source area. Factors must relate to the source area such as: • Danger is no longer present (but not two examples of this) • Change in political regime • Relatives/friends remained • Return to rebuild lives • Familiarity with source area • May have land in source area which is source of income • Other 1 mark per reason or 2 marks with development clearly linked to ‘internally displaced’ such as using an example or more detail. 2(c) Explain how forced internal migration may have negative impacts on 4 receiving/destination areas. Reasons may be related to any factor forcing people to migrate such as: the speed of the event and inability to carry sufficient possessions to support themselves in the receiving/destination area; the numbers involved, etc. Alternately or as well, explanation may be related to the impacts such as: economic issues – demands on finance and resources for medical care for injuries or trauma, or finance for basic items such as food, water, shelter, etc.; social issues, e.g. religious or cultural differences; or environmental issues such as waste disposal, loss of land, etc. 1 mark per reason or 2 marks with development such as using an example or more detail. Settlement dynamics
Q3 · New megacities predicted for 2030
3 Fig. 3.1 shows new megacities predicted for 2030. (a) Describe the distribution of the new megacities predicted for 2030 shown in Fig. 3.1. [3] (b) Outline two benefits of megacities for the provision of services. [2] (c) Explain the challenges of providing either power infrastructure or transport infrastructure for large cities. [5]
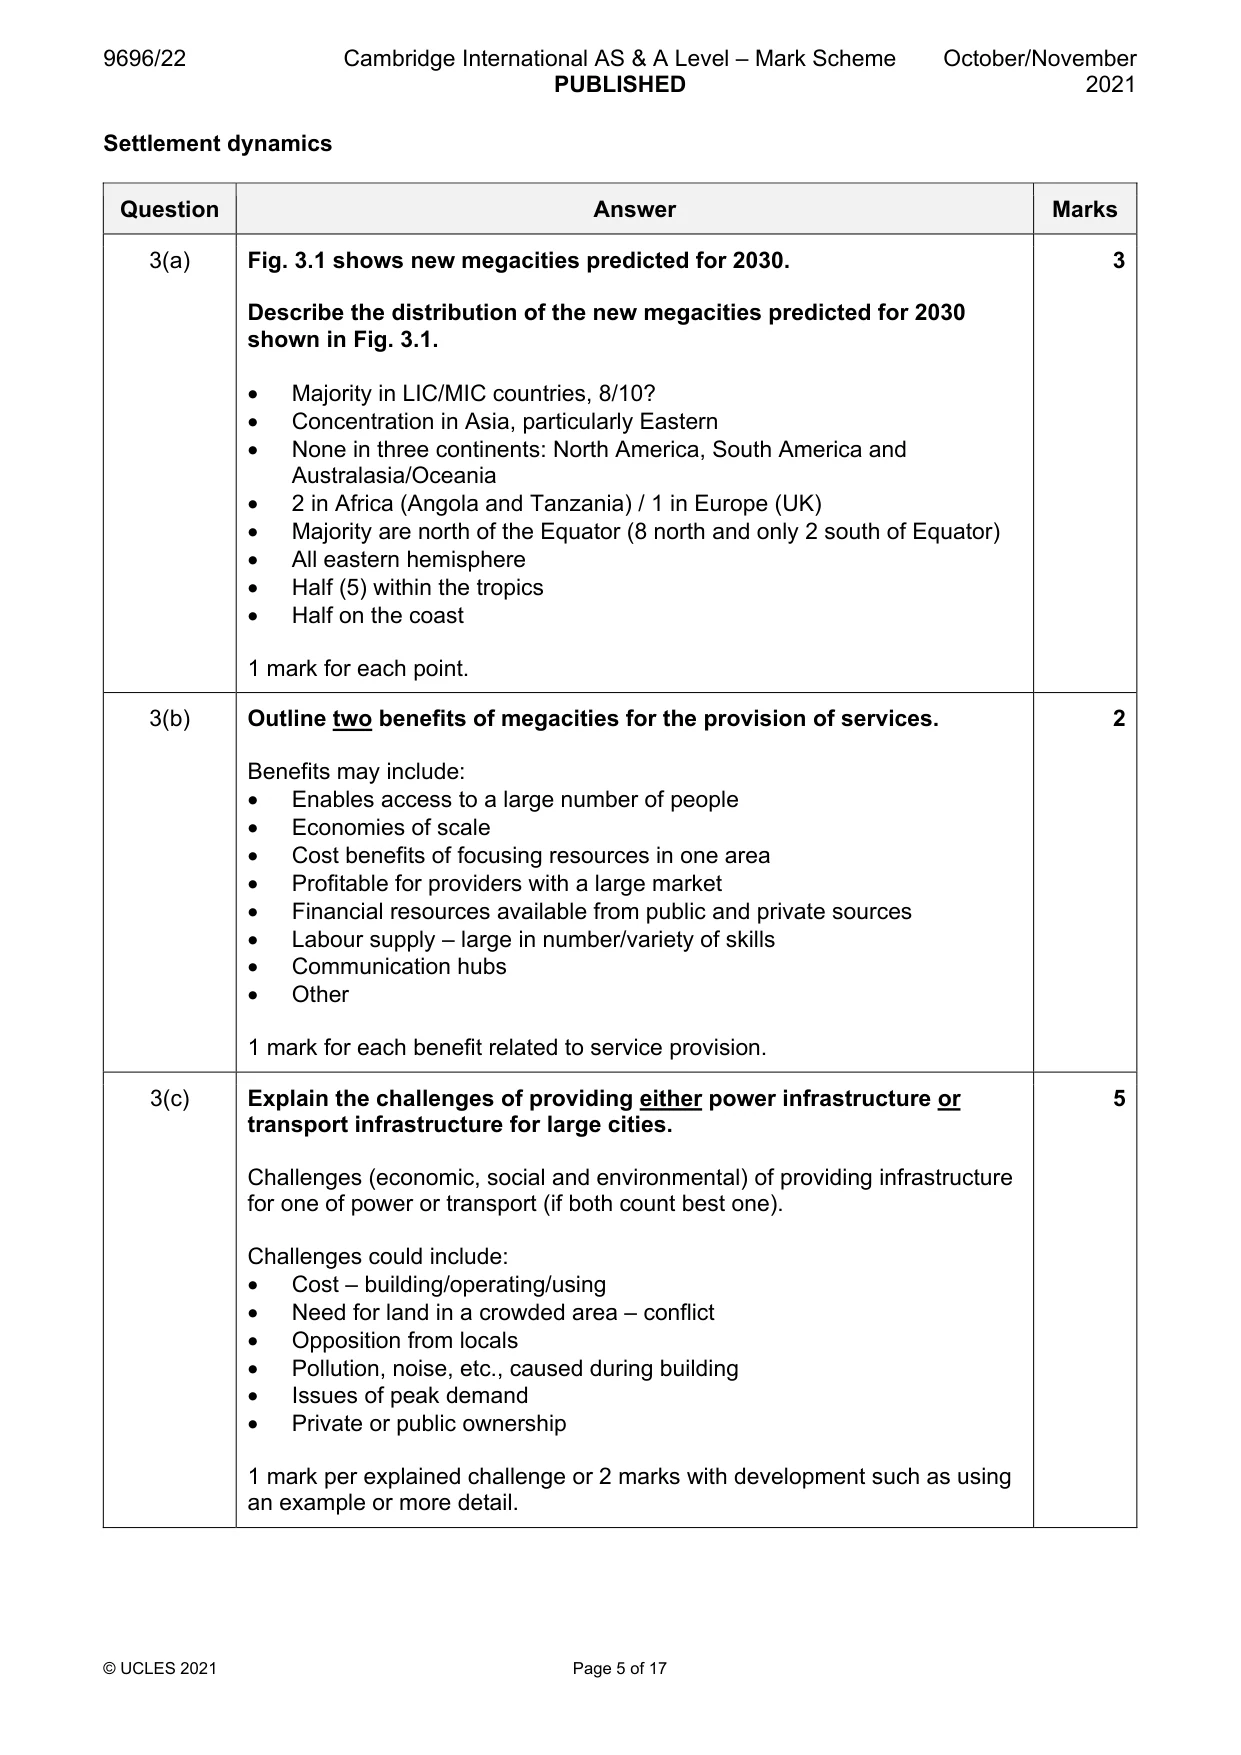
Mark scheme: 3(a) Fig. 3.1 shows new megacities predicted for 2030. 3 Describe the distribution of the new megacities predicted for 2030 shown in Fig. 3.1. • Majority in LIC/MIC countries, 8/10? • Concentration in Asia, particularly Eastern • None in three continents: North America, South America and Australasia/Oceania • 2 in Africa (Angola and Tanzania) / 1 in Europe (UK) • Majority are north of the Equator (8 north and only 2 south of Equator) • All eastern hemisphere • Half (5) within the tropics • Half on the coast 1 mark for each point. 3(b) Outline two benefits of megacities for the provision of services. 2 Benefits may include: • Enables access to a large number of people • Economies of scale • Cost benefits of focusing resources in one area • Profitable for providers with a large market • Financial resources available from public and private sources • Labour supply – large in number/variety of skills • Communication hubs • Other 1 mark for each benefit related to service provision. 3(c) Explain the challenges of providing either power infrastructure or 5 transport infrastructure for large cities. Challenges (economic, social and environmental) of providing infrastructure for one of power or transport (if both count best one). Challenges could include: • Cost – building/operating/using • Need for land in a crowded area – conflict • Opposition from locals • Pollution, noise, etc., caused during building • Issues of peak demand • Private or public ownership 1 mark per explained challenge or 2 marks with development such as using an example or more detail. Section B Answer one question from this section. All questions are worth 30 marks. Population
Q4 · Give the meaning of the term overpopulation
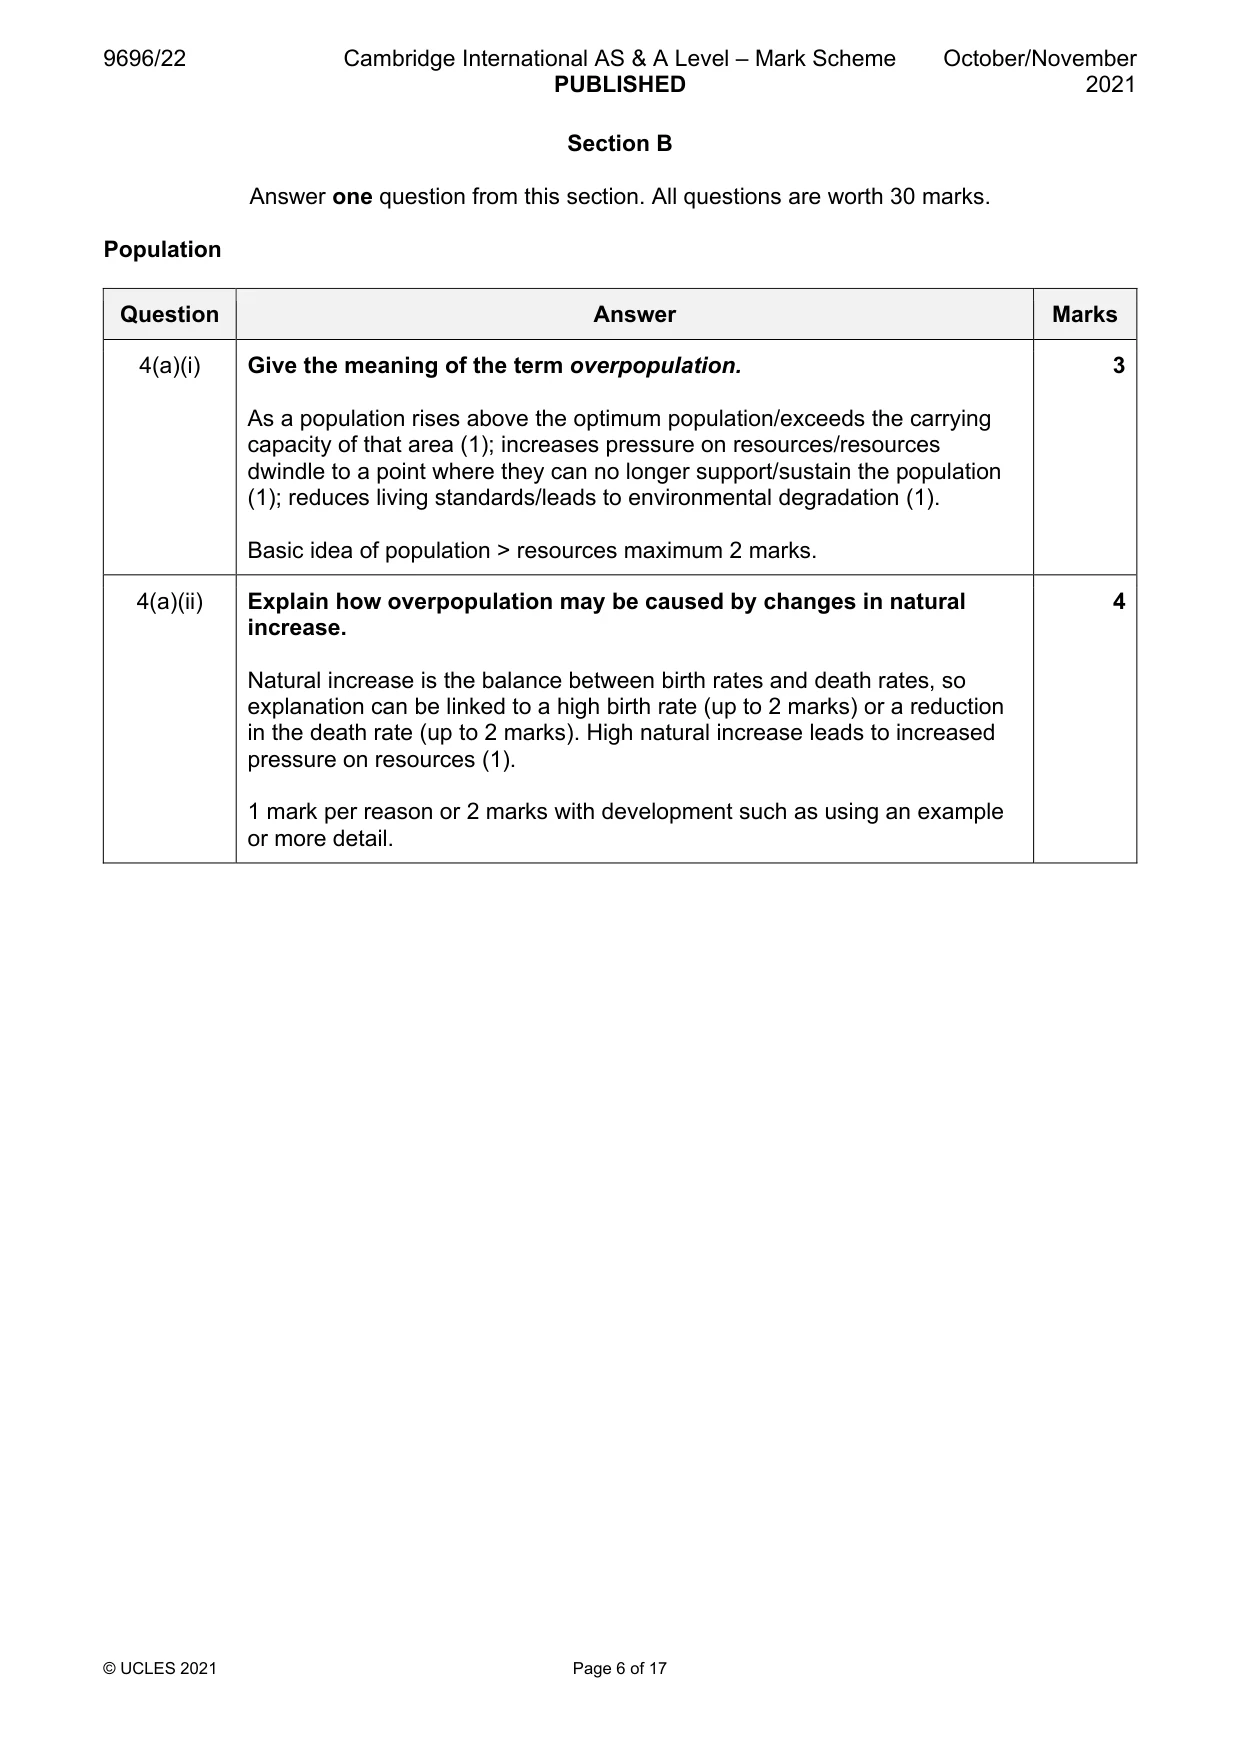
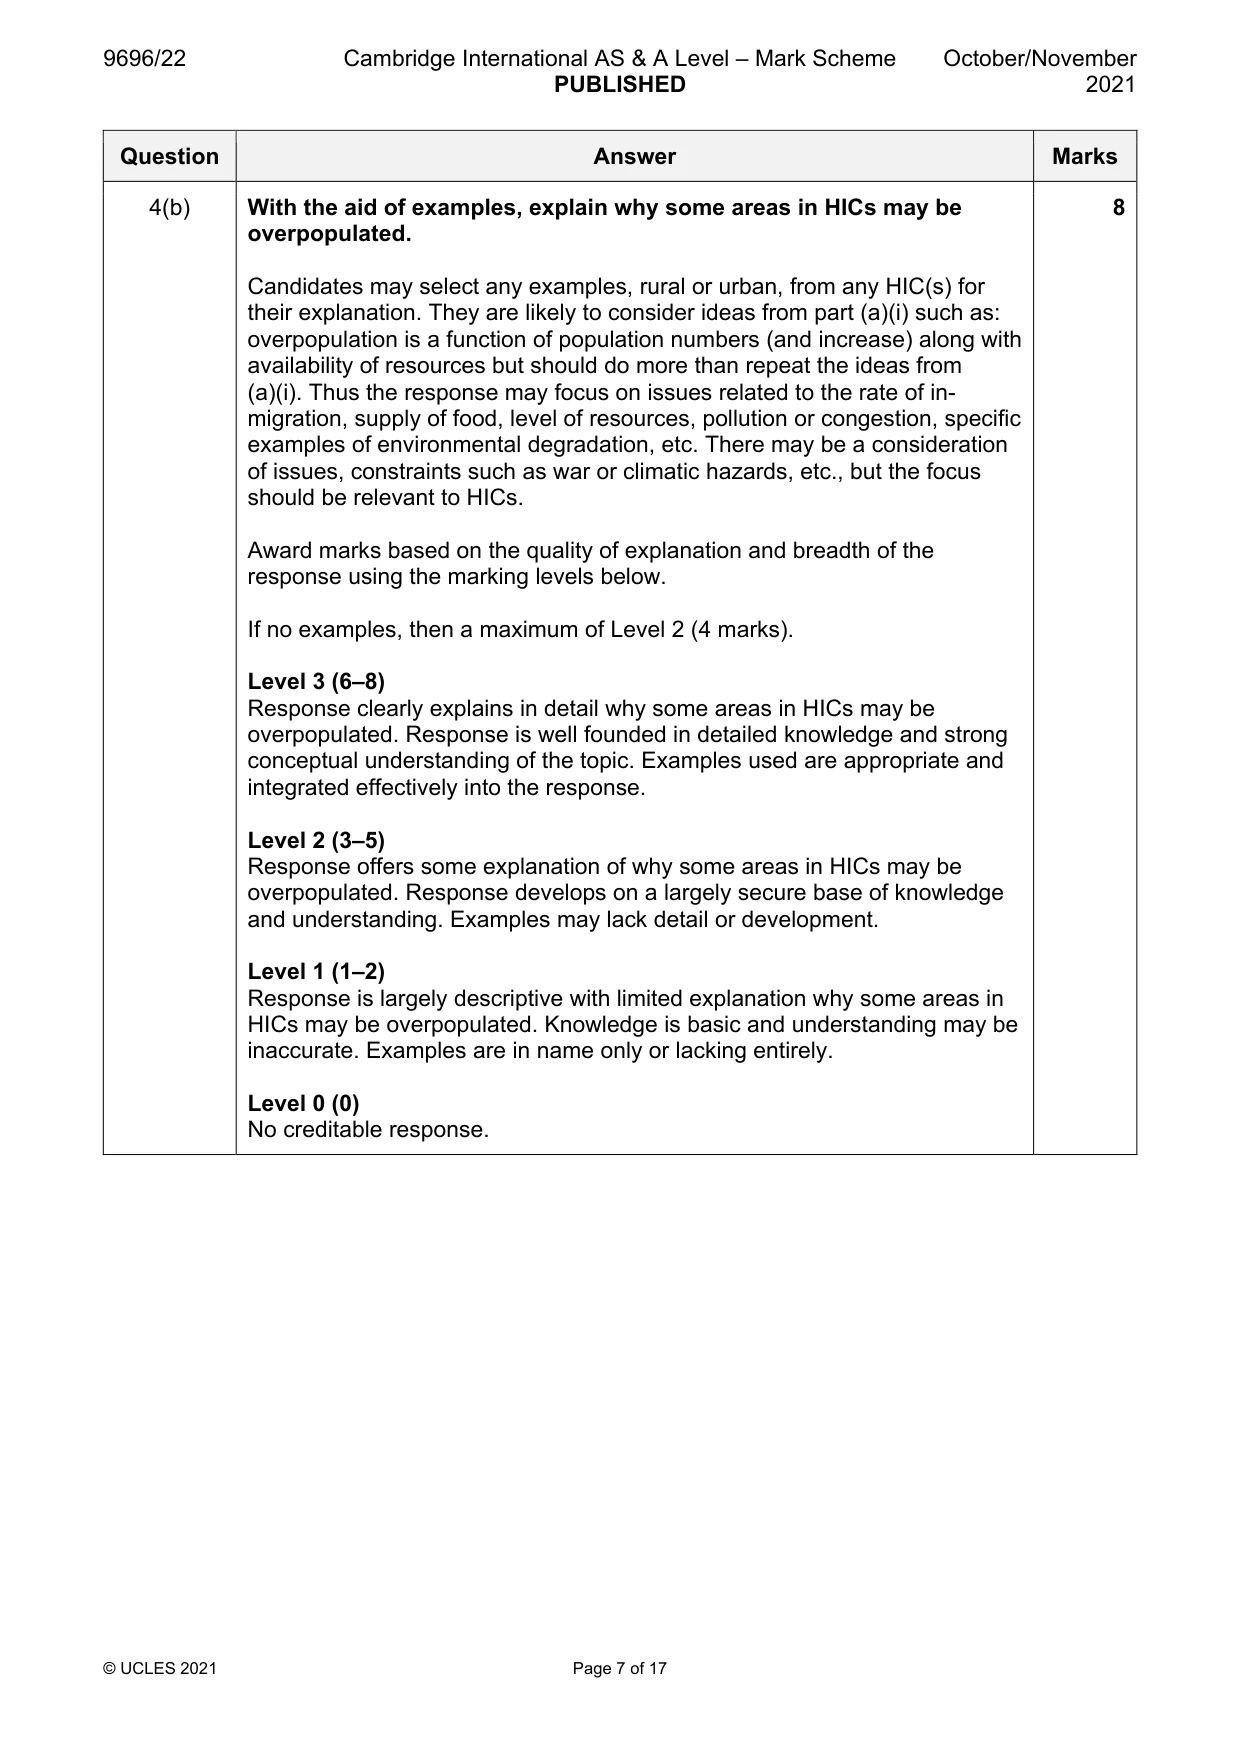
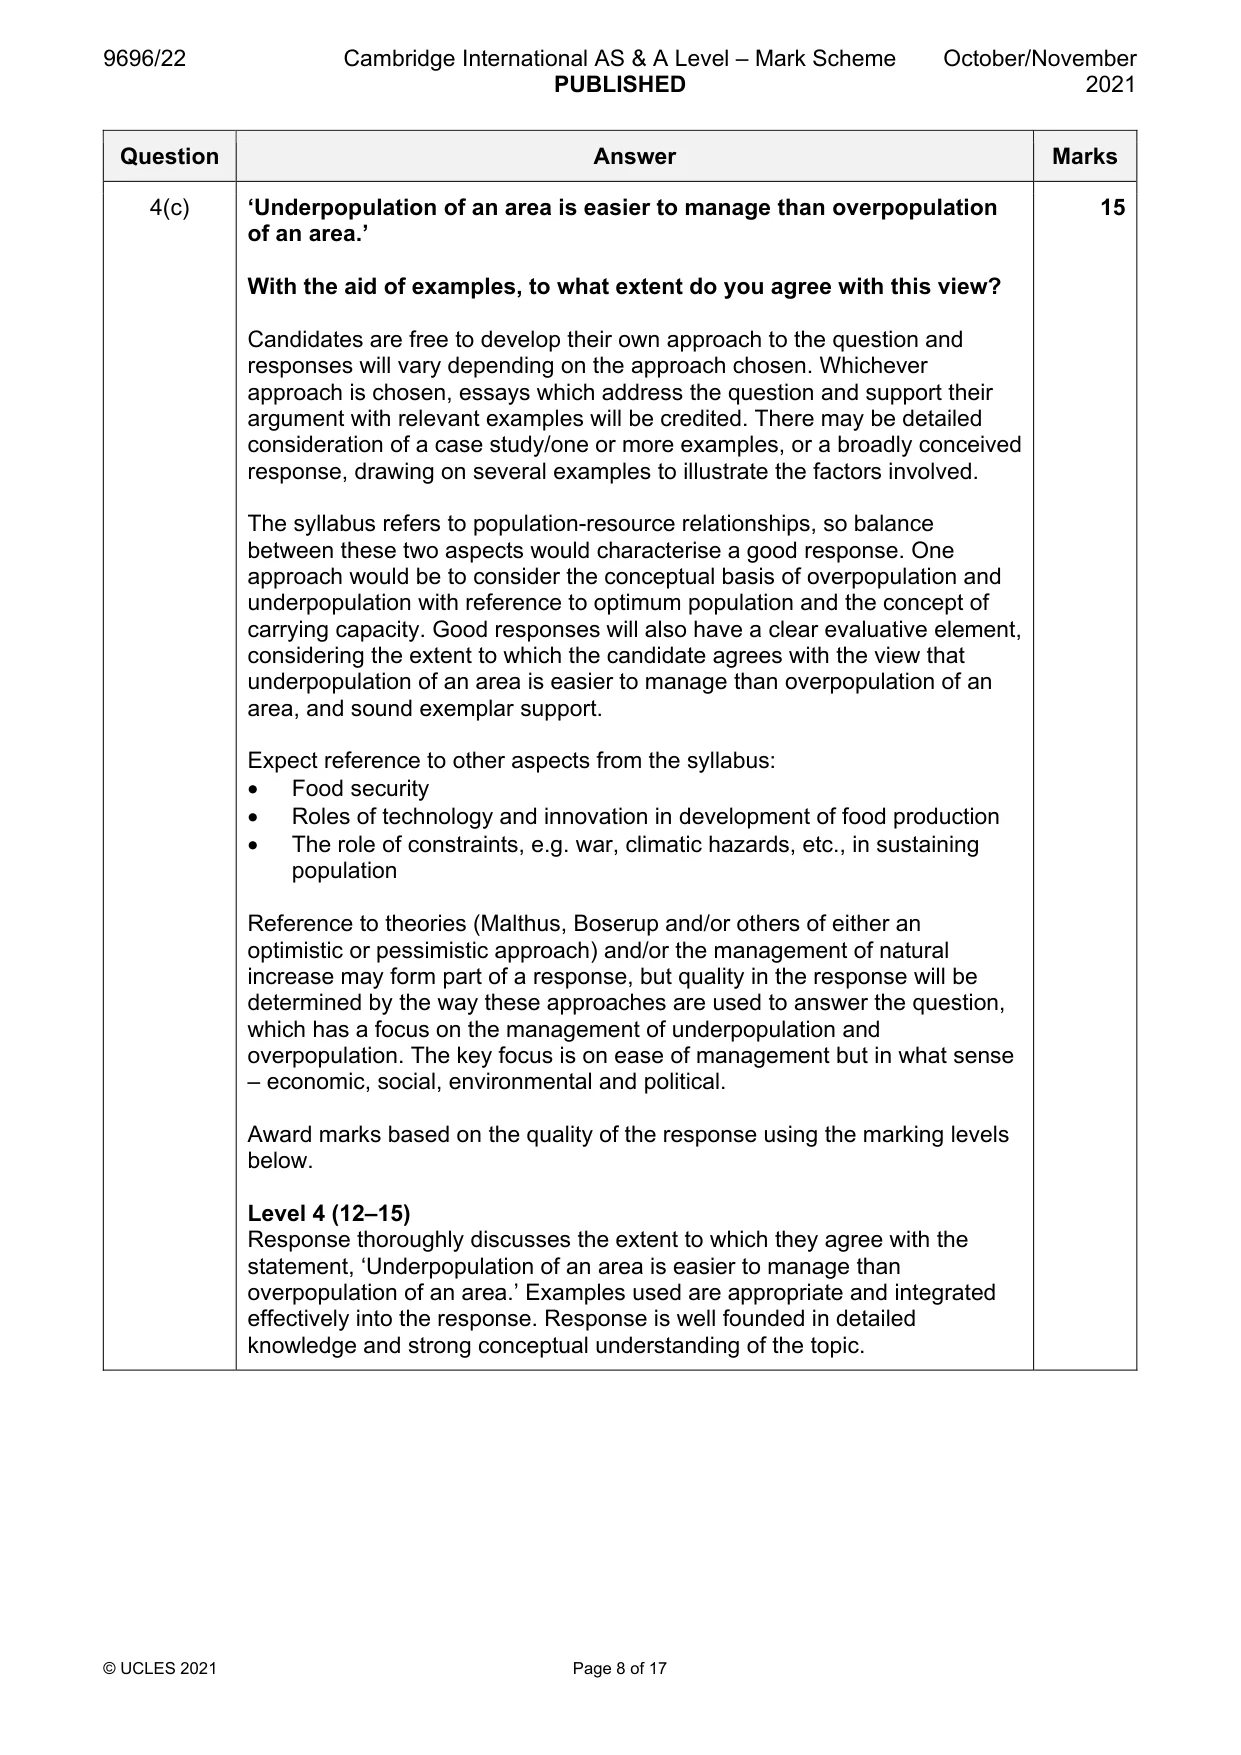
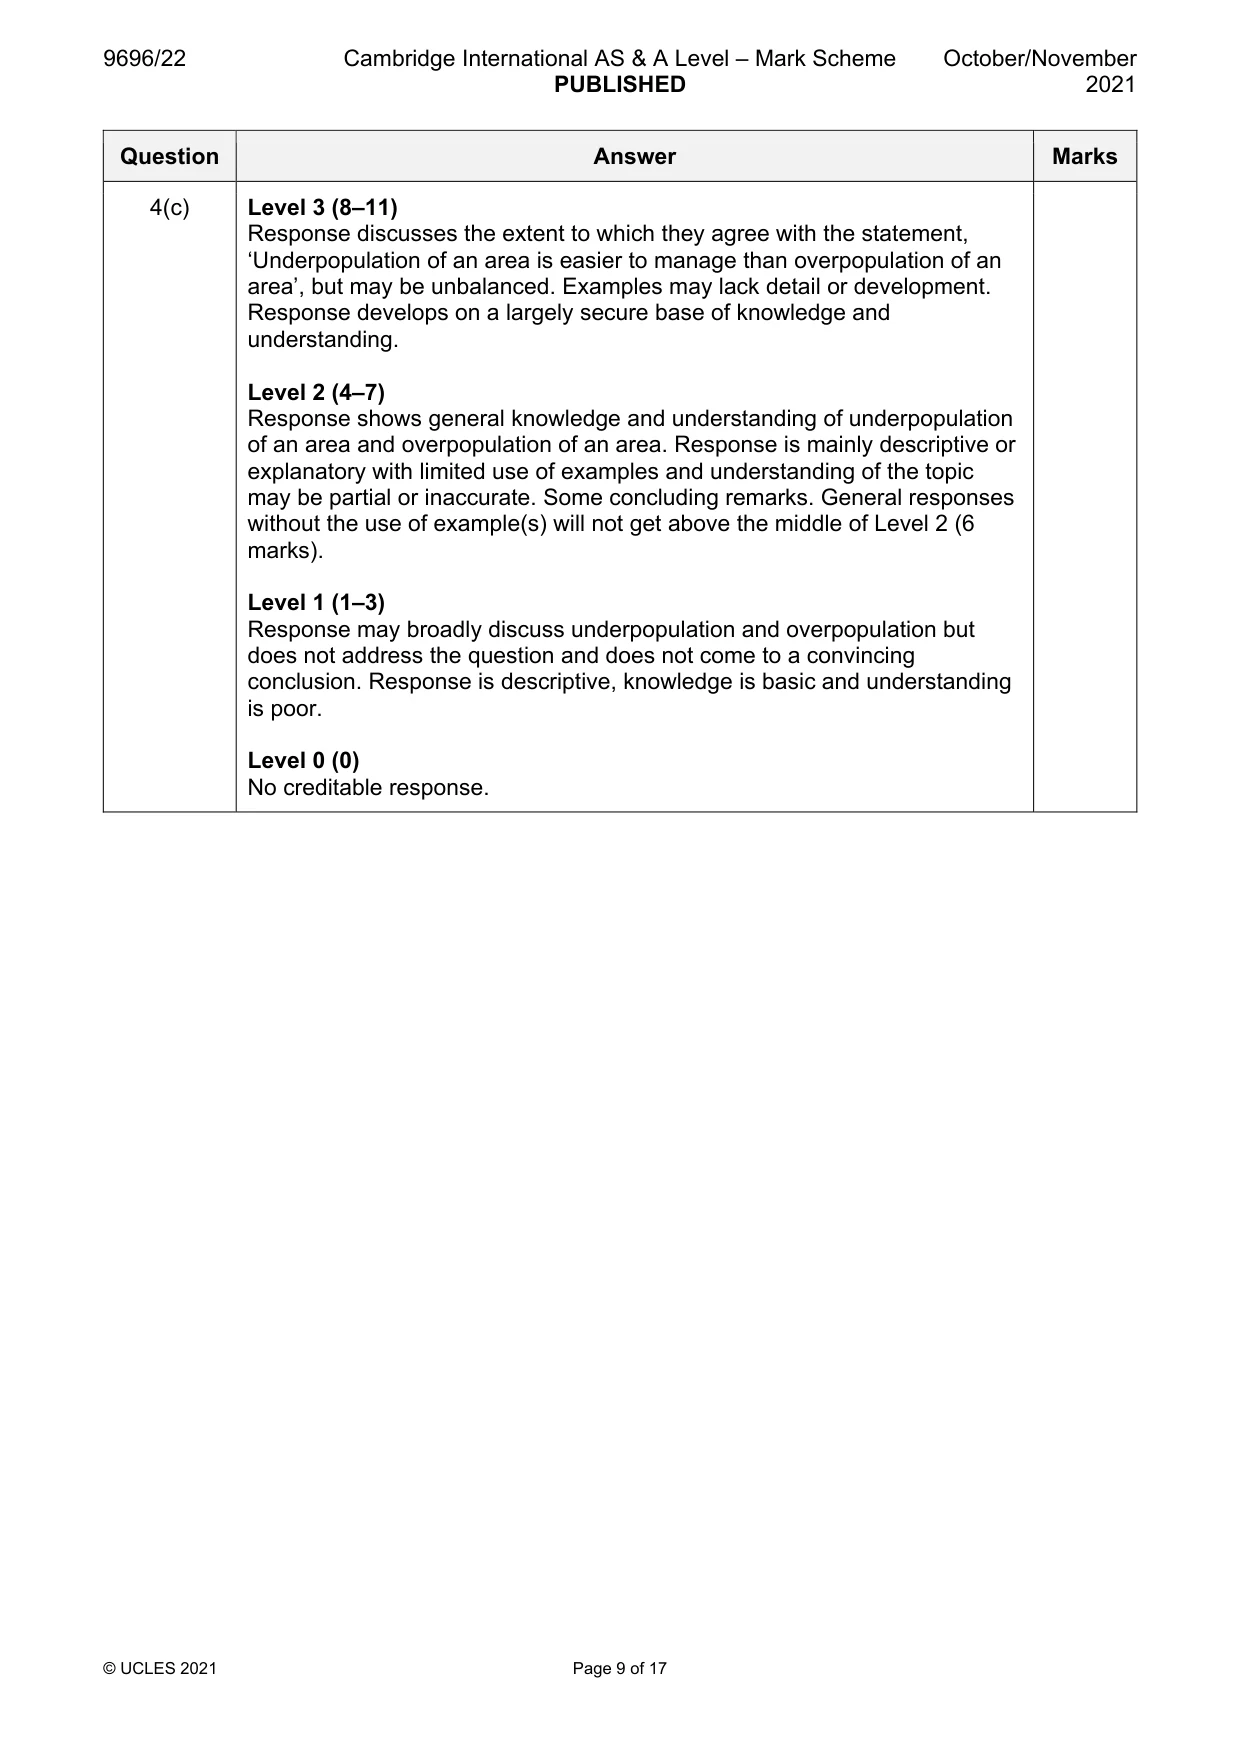
4 (a) (i) Give the meaning of the term overpopulation. [3] (ii) Explain how overpopulation may be caused by changes in natural increase. [4] (b) With the aid of examples, explain why some areas in HICs may be overpopulated. [8] (c) ‘Underpopulation of an area is easier to manage than overpopulation of an area.’ With the aid of examples, to what extent do you agree with this view? [15] Population/Migration
Mark scheme: 4(a)(i) Give the meaning of the term overpopulation. 3 As a population rises above the optimum population/exceeds the carrying capacity of that area (1); increases pressure on resources/resources dwindle to a point where they can no longer support/sustain the population (1); reduces living standards/leads to environmental degradation (1). Basic idea of population > resources maximum 2 marks. 4(a)(ii) Explain how overpopulation may be caused by changes in natural 4 increase. Natural increase is the balance between birth rates and death rates, so explanation can be linked to a high birth rate (up to 2 marks) or a reduction in the death rate (up to 2 marks). High natural increase leads to increased pressure on resources (1). 1 mark per reason or 2 marks with development such as using an example or more detail. 4(b) With the aid of examples, explain why some areas in HICs may be 8 overpopulated. Candidates may select any examples, rural or urban, from any HIC(s) for their explanation. They are likely to consider ideas from part (a)(i) such as: overpopulation is a function of population numbers (and increase) along with availability of resources but should do more than repeat the ideas from (a)(i). Thus the response may focus on issues related to the rate of in- migration, supply of food, level of resources, pollution or congestion, specific examples of environmental degradation, etc. There may be a consideration of issues, constraints such as war or climatic hazards, etc., but the focus should be relevant to HICs. Award marks based on the quality of explanation and breadth of the response using the marking levels below. If no examples, then a maximum of Level 2 (4 marks). Level 3 (6–8) Response clearly explains in detail why some areas in HICs may be overpopulated. Response is well founded in detailed knowledge and strong conceptual understanding of the topic. Examples used are appropriate and integrated effectively into the response. Level 2 (3–5) Response offers some explanation of why some areas in HICs may be overpopulated. Response develops on a largely secure base of knowledge and understanding. Examples may lack detail or development. Level 1 (1–2) Response is largely descriptive with limited explanation why some areas in HICs may be overpopulated. Knowledge is basic and understanding may be inaccurate. Examples are in name only or lacking entirely. Level 0 (0) No creditable response. 4(c) ‘Underpopulation of an area is easier to manage than overpopulation 15 of an area.’ With the aid of examples, to what extent do you agree with this view? Candidates are free to develop their own approach to the question and responses will vary depending on the approach chosen. Whichever approach is chosen, essays which address the question and support their argument with relevant examples will be credited. There may be detailed consideration of a case study/one or more examples, or a broadly conceived response, drawing on several examples to illustrate the factors involved. The syllabus refers to population-resource relationships, so balance between these two aspects would characterise a good response. One approach would be to consider the conceptual basis of overpopulation and underpopulation with reference to optimum population and the concept of carrying capacity. Good responses will also have a clear evaluative element, considering the extent to which the candidate agrees with the view that underpopulation of an area is easier to manage than overpopulation of an area, and sound exemplar support. Expect reference to other aspects from the syllabus: • Food security • Roles of technology and innovation in development of food production • The role of constraints, e.g. war, climatic hazards, etc., in sustaining population Reference to theories (Malthus, Boserup and/or others of either an optimistic or pessimistic approach) and/or the management of natural increase may form part of a response, but quality in the response will be determined by the way these approaches are used to answer the question, which has a focus on the management of underpopulation and overpopulation. The key focus is on ease of management but in what sense – economic, social, environmental and political. Award marks based on the quality of the response using the marking levels below. Level 4 (12–15) Response thoroughly discusses the extent to which they agree with the statement, ‘Underpopulation of an area is easier to manage than overpopulation of an area.’ Examples used are appropriate and integrated effectively into the response. Response is well founded in detailed knowledge and strong conceptual understanding of the topic. 4(c) Level 3 (8–11) Response discusses the extent to which they agree with the statement, ‘Underpopulation of an area is easier to manage than overpopulation of an area’, but may be unbalanced. Examples may lack detail or development. Response develops on a largely secure base of knowledge and understanding. Level 2 (4–7) Response shows general knowledge and understanding of underpopulation of an area and overpopulation of an area. Response is mainly descriptive or explanatory with limited use of examples and understanding of the topic may be partial or inaccurate. Some concluding remarks. General responses without the use of example(s) will not get above the middle of Level 2 (6 marks). Level 1 (1–3) Response may broadly discuss underpopulation and overpopulation but does not address the question and does not come to a convincing conclusion. Response is descriptive, knowledge is basic and understanding is poor. Level 0 (0) No creditable response. Population/Migration
Q5 · With the aid of examples, describe how the age of migrants may impact on the population…
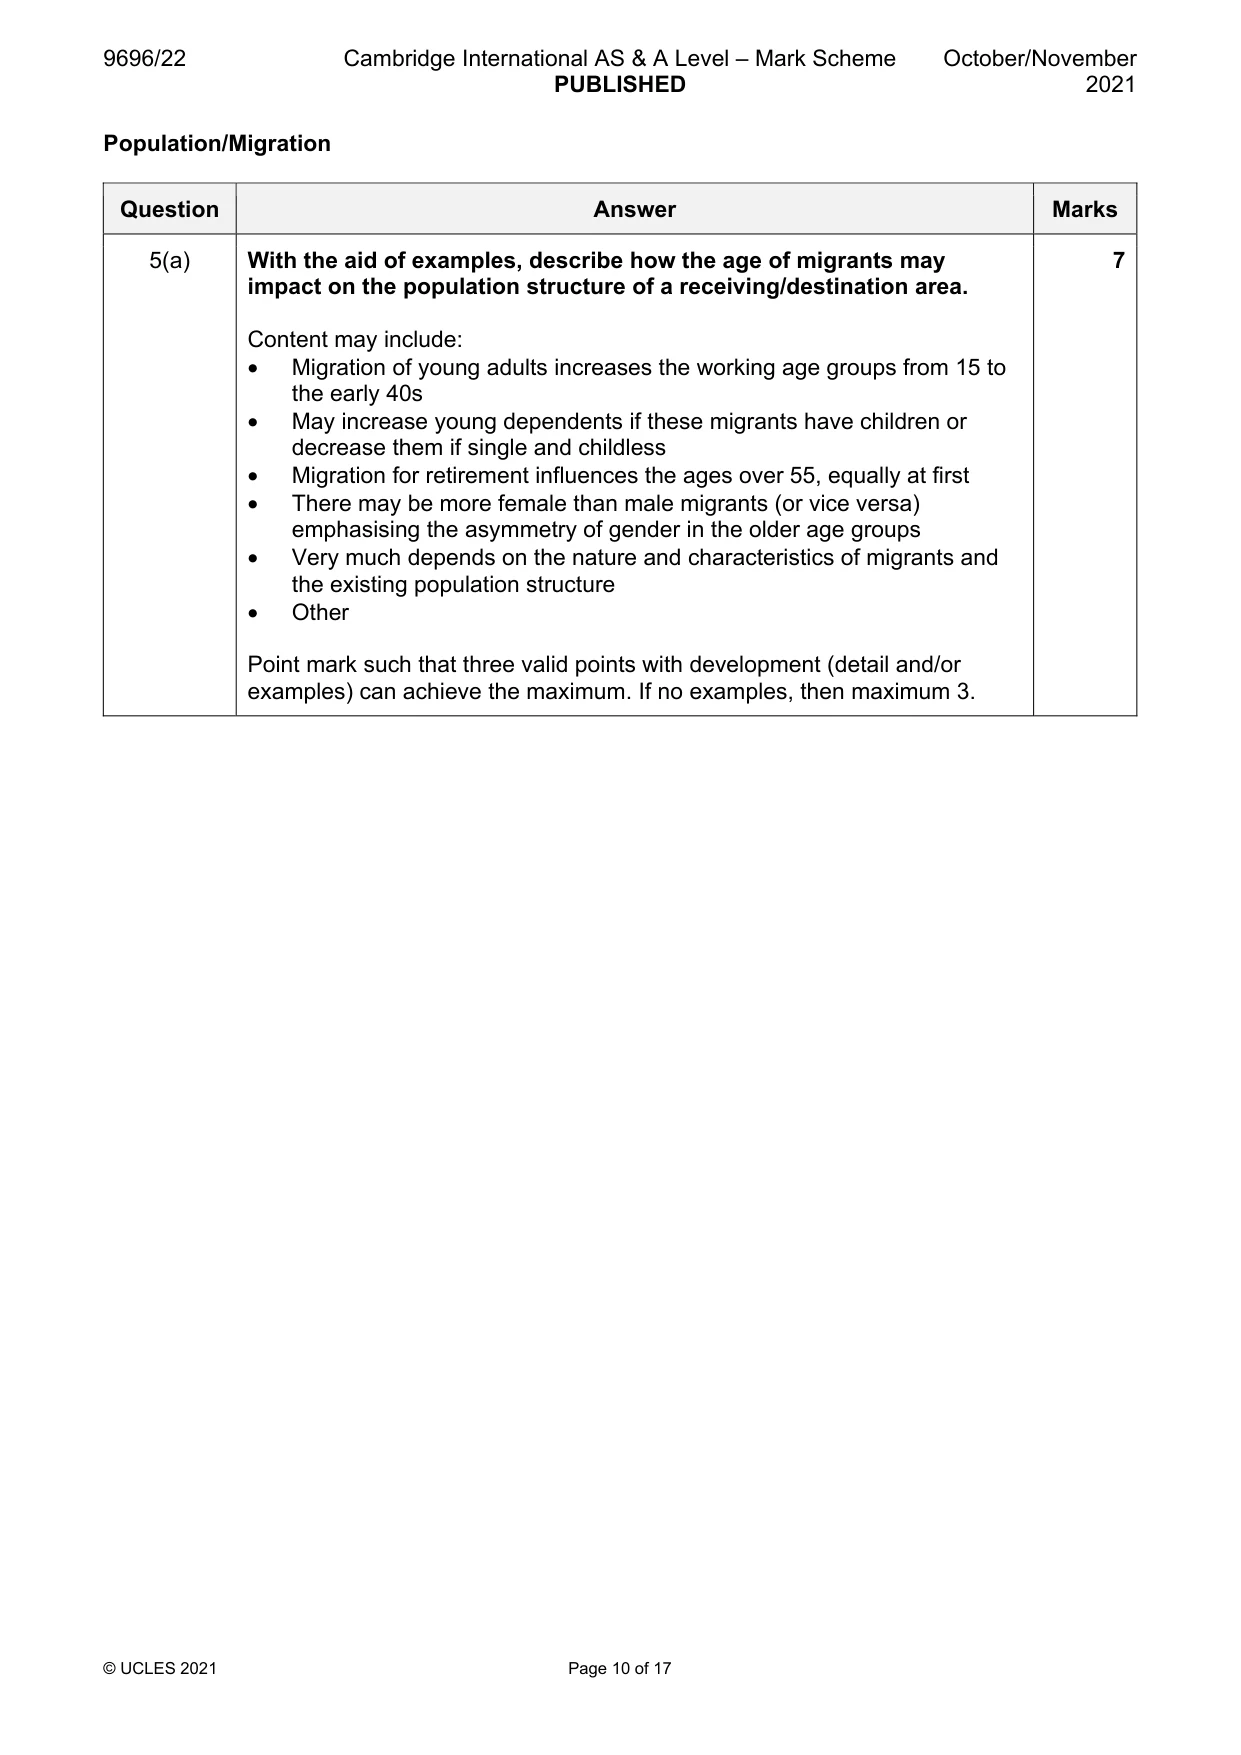
5 (a) With the aid of examples, describe how the age of migrants may impact on the population structure of a receiving/destination area. [7] (b) For your case study of one international migration stream, explain the causes of the migration. [8] (c) For the international migration stream chosen in (b), how far would you agree that the source areas have benefited more than the receiving/destination areas? [15] Migration/Settlement dynamics
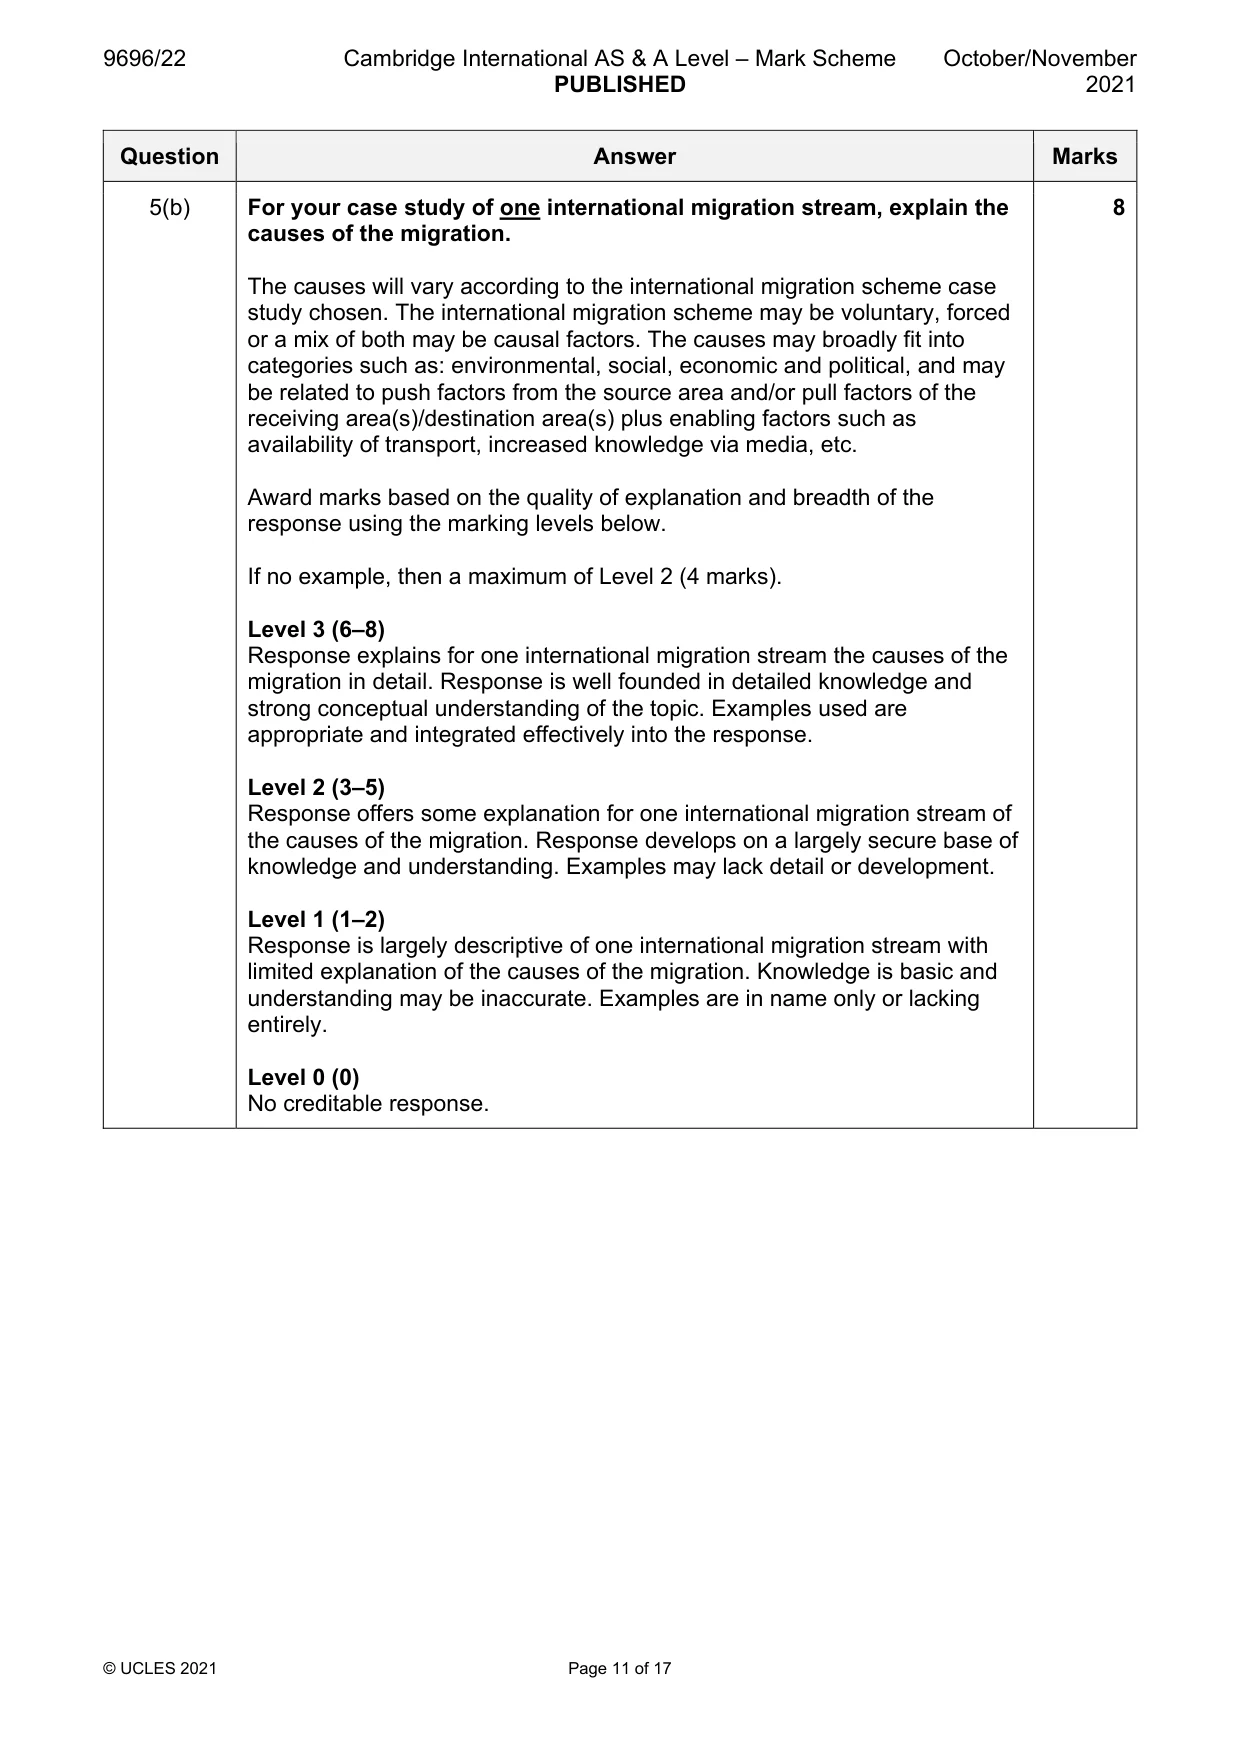
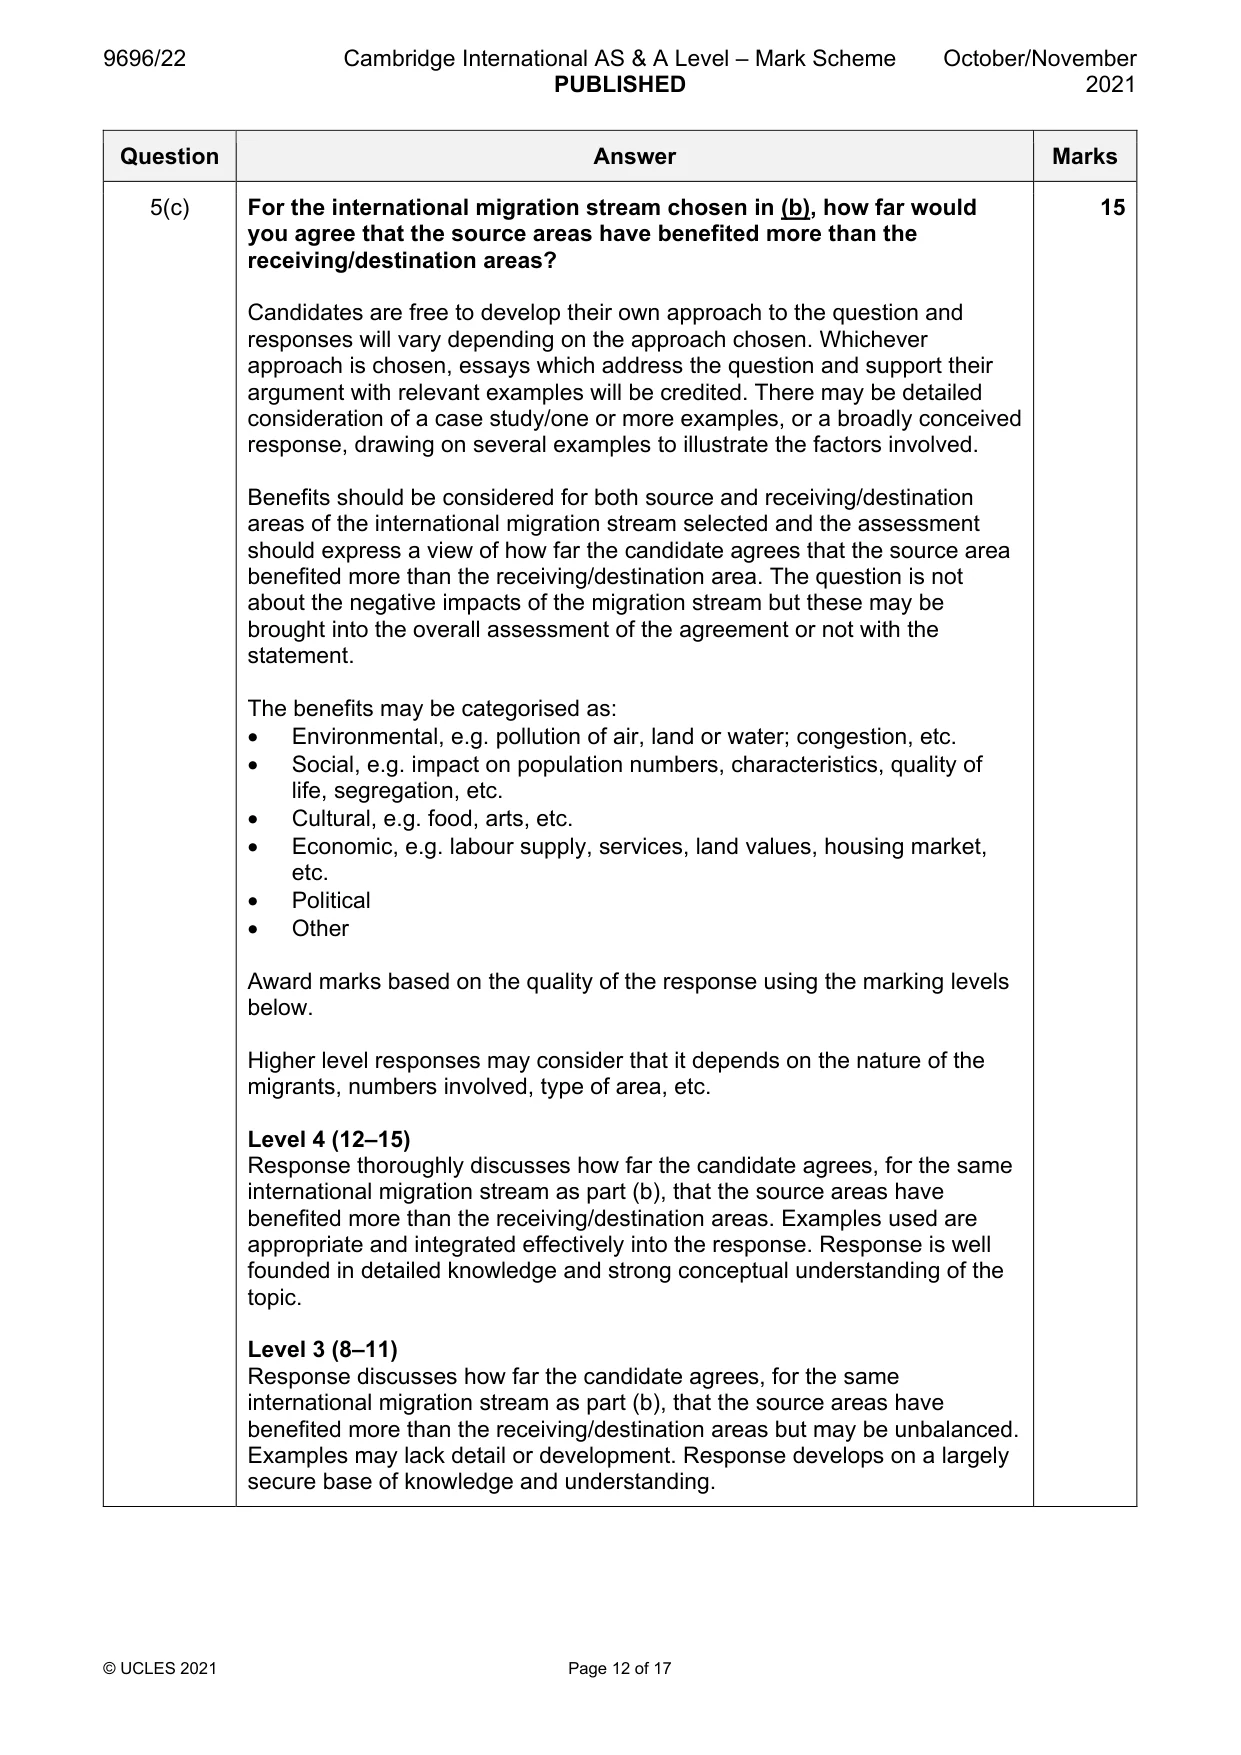
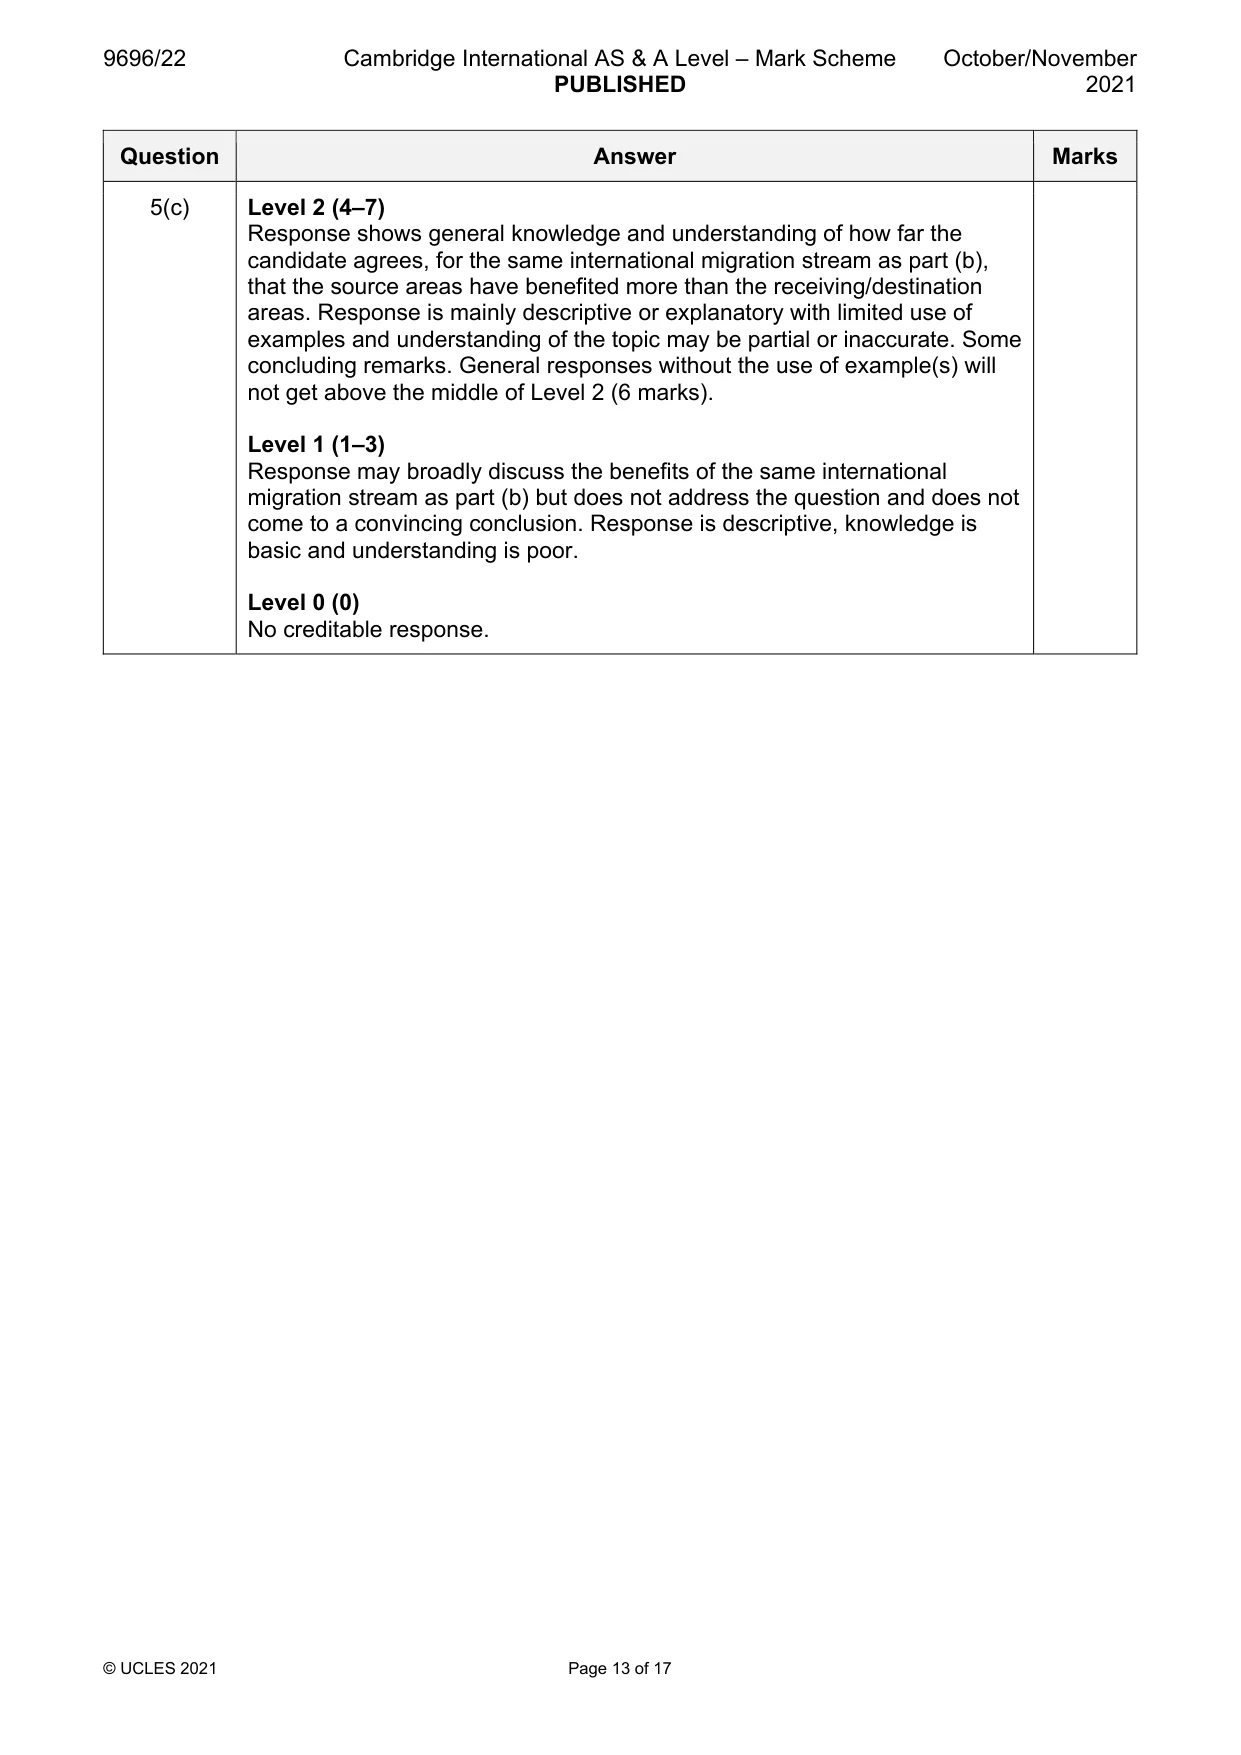
Mark scheme: 5(a) With the aid of examples, describe how the age of migrants may 7 impact on the population structure of a receiving/destination area. Content may include: • Migration of young adults increases the working age groups from 15 to the early 40s • May increase young dependents if these migrants have children or decrease them if single and childless • Migration for retirement influences the ages over 55, equally at first • There may be more female than male migrants (or vice versa) emphasising the asymmetry of gender in the older age groups • Very much depends on the nature and characteristics of migrants and the existing population structure • Other Point mark such that three valid points with development (detail and/or examples) can achieve the maximum. If no examples, then maximum 3. 5(b) For your case study of one international migration stream, explain the 8 causes of the migration. The causes will vary according to the international migration scheme case study chosen. The international migration scheme may be voluntary, forced or a mix of both may be causal factors. The causes may broadly fit into categories such as: environmental, social, economic and political, and may be related to push factors from the source area and/or pull factors of the receiving area(s)/destination area(s) plus enabling factors such as availability of transport, increased knowledge via media, etc. Award marks based on the quality of explanation and breadth of the response using the marking levels below. If no example, then a maximum of Level 2 (4 marks). Level 3 (6–8) Response explains for one international migration stream the causes of the migration in detail. Response is well founded in detailed knowledge and strong conceptual understanding of the topic. Examples used are appropriate and integrated effectively into the response. Level 2 (3–5) Response offers some explanation for one international migration stream of the causes of the migration. Response develops on a largely secure base of knowledge and understanding. Examples may lack detail or development. Level 1 (1–2) Response is largely descriptive of one international migration stream with limited explanation of the causes of the migration. Knowledge is basic and understanding may be inaccurate. Examples are in name only or lacking entirely. Level 0 (0) No creditable response. 5(c) For the international migration stream chosen in (b), how far would 15 you agree that the source areas have benefited more than the receiving/destination areas? Candidates are free to develop their own approach to the question and responses will vary depending on the approach chosen. Whichever approach is chosen, essays which address the question and support their argument with relevant examples will be credited. There may be detailed consideration of a case study/one or more examples, or a broadly conceived response, drawing on several examples to illustrate the factors involved. Benefits should be considered for both source and receiving/destination areas of the international migration stream selected and the assessment should express a view of how far the candidate agrees that the source area benefited more than the receiving/destination area. The question is not about the negative impacts of the migration stream but these may be brought into the overall assessment of the agreement or not with the statement. The benefits may be categorised as: • Environmental, e.g. pollution of air, land or water; congestion, etc. • Social, e.g. impact on population numbers, characteristics, quality of life, segregation, etc. • Cultural, e.g. food, arts, etc. • Economic, e.g. labour supply, services, land values, housing market, etc. • Political • Other Award marks based on the quality of the response using the marking levels below. Higher level responses may consider that it depends on the nature of the migrants, numbers involved, type of area, etc. Level 4 (12–15) Response thoroughly discusses how far the candidate agrees, for the same international migration stream as part (b), that the source areas have benefited more than the receiving/destination areas. Examples used are appropriate and integrated effectively into the response. Response is well founded in detailed knowledge and strong conceptual understanding of the topic. Level 3 (8–11) Response discusses how far the candidate agrees, for the same international migration stream as part (b), that the source areas have benefited more than the receiving/destination areas but may be unbalanced. Examples may lack detail or development. Response develops on a largely secure base of knowledge and understanding. 5(c) Level 2 (4–7) Response shows general knowledge and understanding of how far the candidate agrees, for the same international migration stream as part (b), that the source areas have benefited more than the receiving/destination areas. Response is mainly descriptive or explanatory with limited use of examples and understanding of the topic may be partial or inaccurate. Some concluding remarks. General responses without the use of example(s) will not get above the middle of Level 2 (6 marks). Level 1 (1–3) Response may broadly discuss the benefits of the same international migration stream as part (b) but does not address the question and does not come to a convincing conclusion. Response is descriptive, knowledge is basic and understanding is poor. Level 0 (0) No creditable response. Migration/Settlement dynamics
Q6 · With the aid of examples, describe three ways in which Central Business Districts (CBDs)…
6 (a) With the aid of examples, describe three ways in which Central Business Districts (CBDs) are changing. [7] (b) Explain why urban renewal is happening in some urban areas. [8] (c) With the aid of examples, assess the extent to which internal migration (within a country) influences the residential structure of urban settlements. [15]
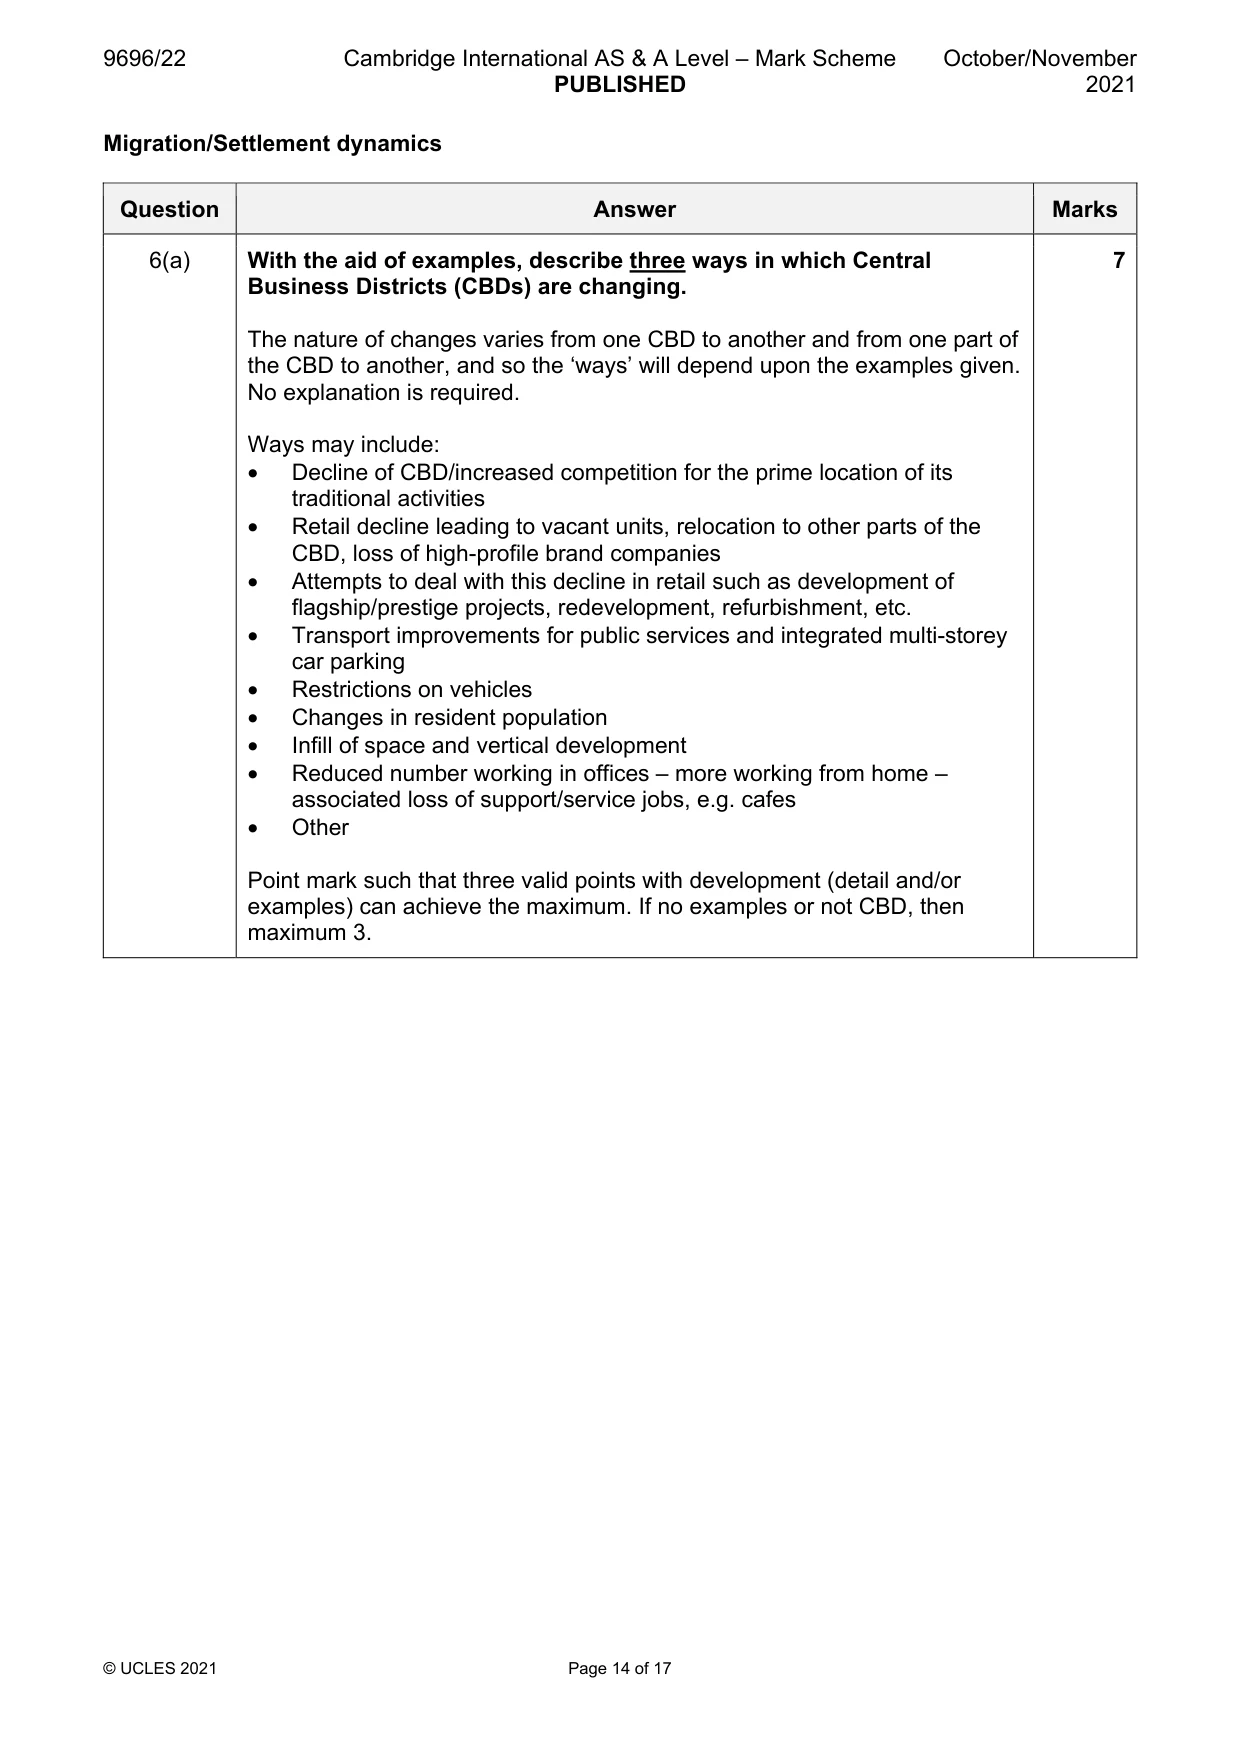
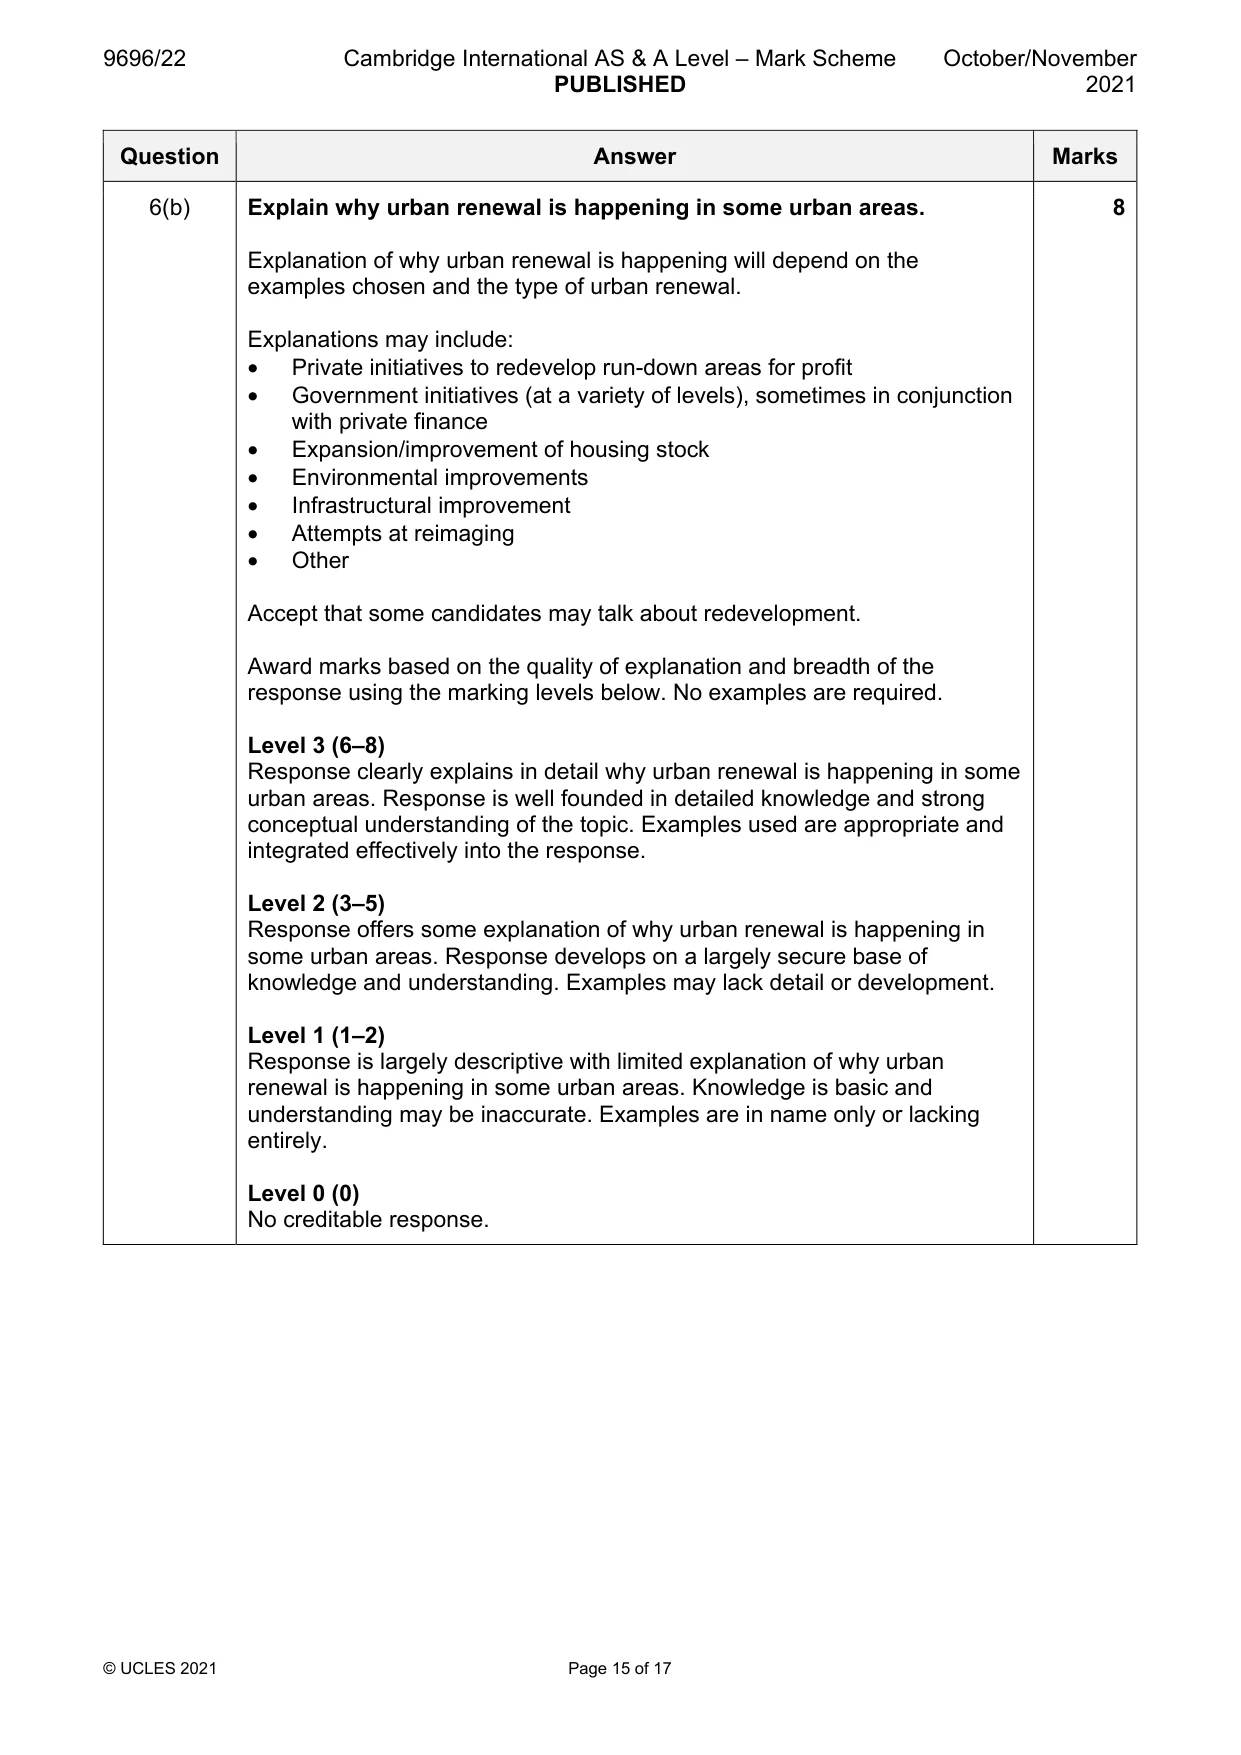
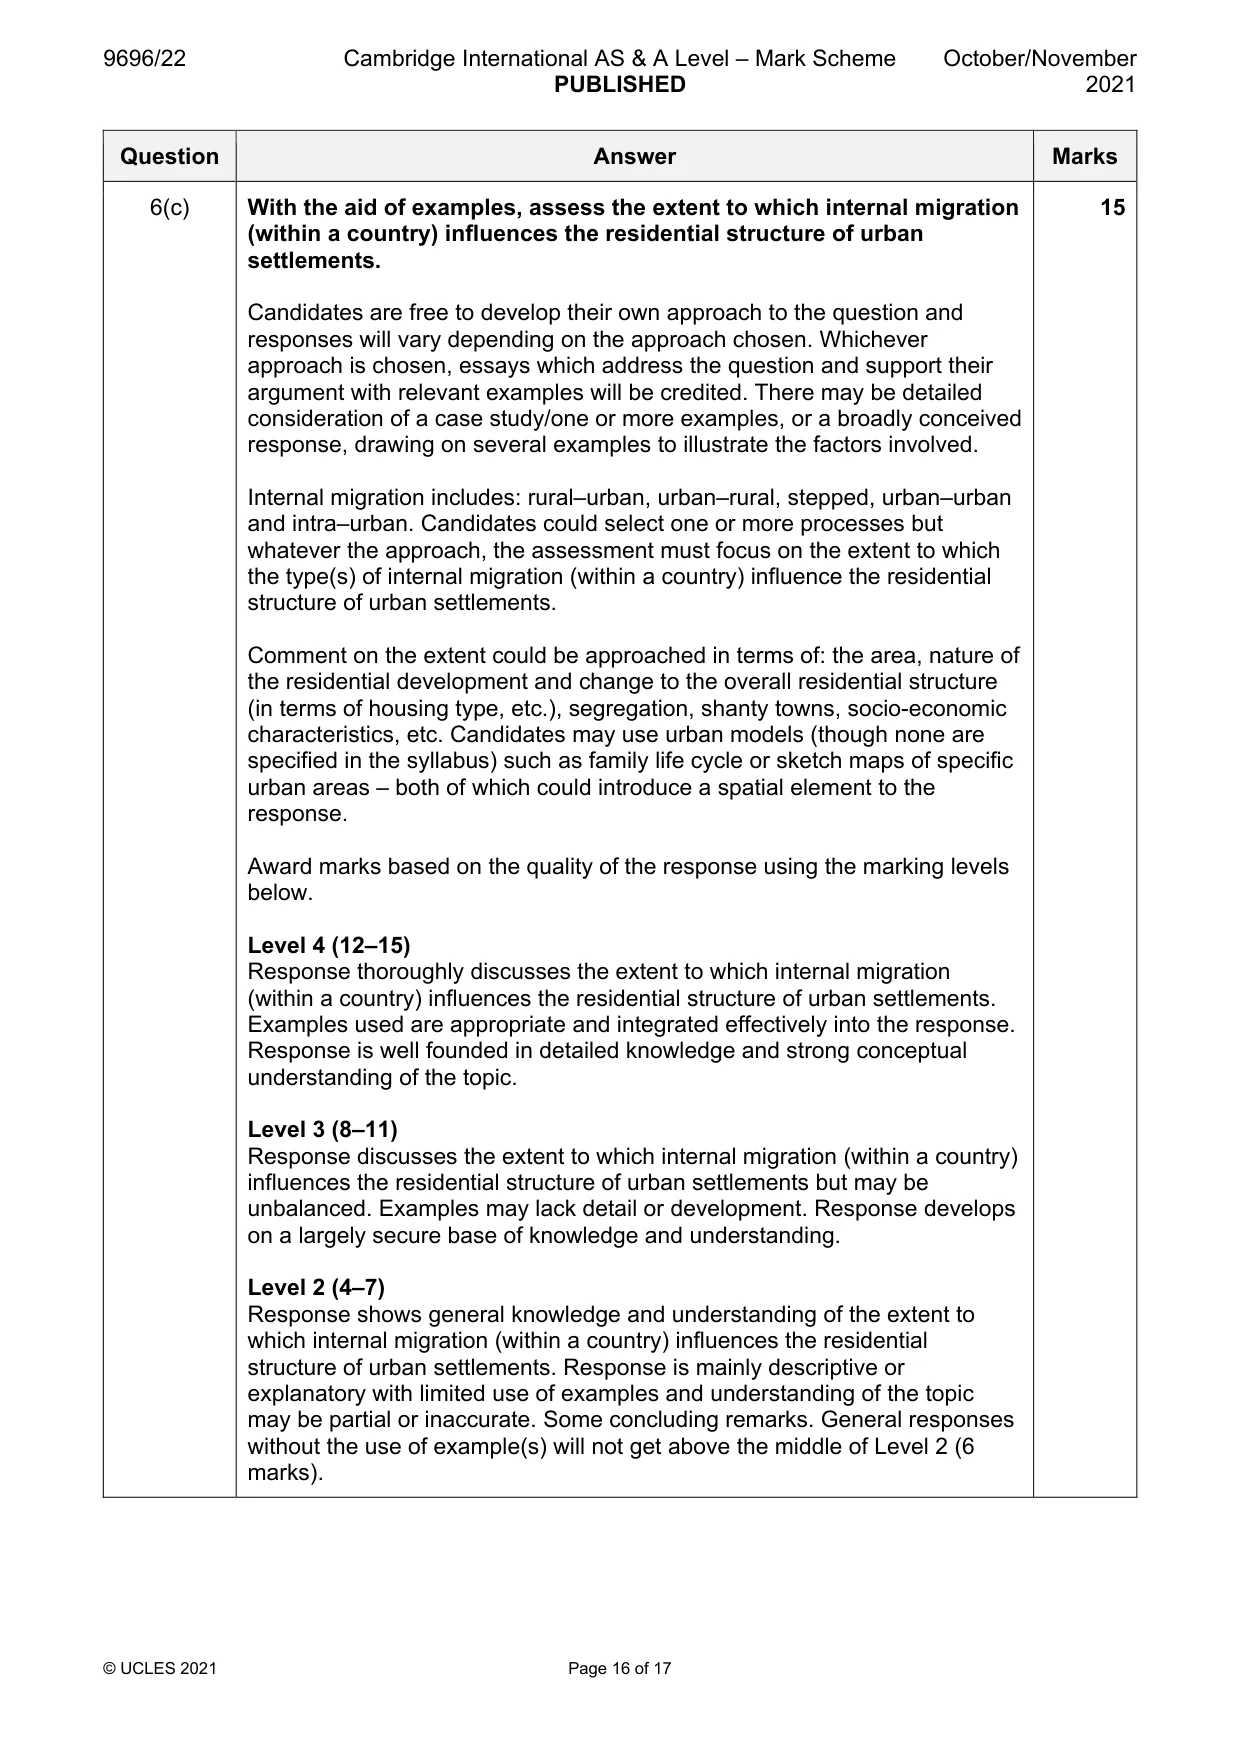
Mark scheme: 6(a) With the aid of examples, describe three ways in which Central 7 Business Districts (CBDs) are changing. The nature of changes varies from one CBD to another and from one part of the CBD to another, and so the ‘ways’ will depend upon the examples given. No explanation is required. Ways may include: • Decline of CBD/increased competition for the prime location of its traditional activities • Retail decline leading to vacant units, relocation to other parts of the CBD, loss of high-profile brand companies • Attempts to deal with this decline in retail such as development of flagship/prestige projects, redevelopment, refurbishment, etc. • Transport improvements for public services and integrated multi-storey car parking • Restrictions on vehicles • Changes in resident population • Infill of space and vertical development • Reduced number working in offices – more working from home – associated loss of support/service jobs, e.g. cafes • Other Point mark such that three valid points with development (detail and/or examples) can achieve the maximum. If no examples or not CBD, then maximum 3. 6(b) Explain why urban renewal is happening in some urban areas. 8 Explanation of why urban renewal is happening will depend on the examples chosen and the type of urban renewal. Explanations may include: • Private initiatives to redevelop run-down areas for profit • Government initiatives (at a variety of levels), sometimes in conjunction with private finance • Expansion/improvement of housing stock • Environmental improvements • Infrastructural improvement • Attempts at reimaging • Other Accept that some candidates may talk about redevelopment. Award marks based on the quality of explanation and breadth of the response using the marking levels below. No examples are required. Level 3 (6–8) Response clearly explains in detail why urban renewal is happening in some urban areas. Response is well founded in detailed knowledge and strong conceptual understanding of the topic. Examples used are appropriate and integrated effectively into the response. Level 2 (3–5) Response offers some explanation of why urban renewal is happening in some urban areas. Response develops on a largely secure base of knowledge and understanding. Examples may lack detail or development. Level 1 (1–2) Response is largely descriptive with limited explanation of why urban renewal is happening in some urban areas. Knowledge is basic and understanding may be inaccurate. Examples are in name only or lacking entirely. Level 0 (0) No creditable response. 6(c) With the aid of examples, assess the extent to which internal migration 15 (within a country) influences the residential structure of urban settlements. Candidates are free to develop their own approach to the question and responses will vary depending on the approach chosen. Whichever approach is chosen, essays which address the question and support their argument with relevant examples will be credited. There may be detailed consideration of a case study/one or more examples, or a broadly conceived response, drawing on several examples to illustrate the factors involved. Internal migration includes: rural–urban, urban–rural, stepped, urban–urban and intra–urban. Candidates could select one or more processes but whatever the approach, the assessment must focus on the extent to which the type(s) of internal migration (within a country) influence the residential structure of urban settlements. Comment on the extent could be approached in terms of: the area, nature of the residential development and change to the overall residential structure (in terms of housing type, etc.), segregation, shanty towns, socio-economic characteristics, etc. Candidates may use urban models (though none are specified in the syllabus) such as family life cycle or sketch maps of specific urban areas – both of which could introduce a spatial element to the response. Award marks based on the quality of the response using the marking levels below. Level 4 (12–15) Response thoroughly discusses the extent to which internal migration (within a country) influences the residential structure of urban settlements. Examples used are appropriate and integrated effectively into the response. Response is well founded in detailed knowledge and strong conceptual understanding of the topic. Level 3 (8–11) Response discusses the extent to which internal migration (within a country) influences the residential structure of urban settlements but may be unbalanced. Examples may lack detail or development. Response develops on a largely secure base of knowledge and understanding. Level 2 (4–7) Response shows general knowledge and understanding of the extent to which internal migration (within a country) influences the residential structure of urban settlements. Response is mainly descriptive or explanatory with limited use of examples and understanding of the topic may be partial or inaccurate. Some concluding remarks. General responses without the use of example(s) will not get above the middle of Level 2 (6 marks). 6(c) Level 1 (1–3) Response may broadly discuss internal migration (within a country) and the residential structure of urban settlements but does not address the question and does not come to a convincing conclusion. Response is descriptive, knowledge is basic and understanding is poor. Level 0 (0) No creditable response.
What was in this paper
The subtopics covered by these 6 questions, and how many questions each got. Open one in a new tab to see every Cambridge question on it.
What you needed in this session
Cambridge’s own grade thresholds for 2021 Oct/Nov, Paper 2 · Variant 2. A higher threshold means an easier paper — the bar moves with how the cohort did.