Cambridge A Level Geography 9696 — 2021 Oct/Nov Paper 2 · Variant 3
9696/23/O/N/21 · 6 questions · 60 marks · ≈68 min
The question paper and its mark scheme, free to read here and free to download. This is Cambridge’s own paper, exactly as it was sat.
Question paper4 pages

Mark scheme15 pages
Answers below. Sit the paper first if you are practising.
Questions as text
Q1 · Life expectancy at birth in Europe in 2017
1 Fig. 1.1 shows life expectancy at birth in Europe in 2017. (a) Describe the pattern of life expectancy at birth shown in Fig. 1.1. [3] (b) Outline two problems for a country caused by a high life expectancy of its population. [2] (c) Explain how high life expectancy of the population is linked to high levels of economic development. [5] Migration
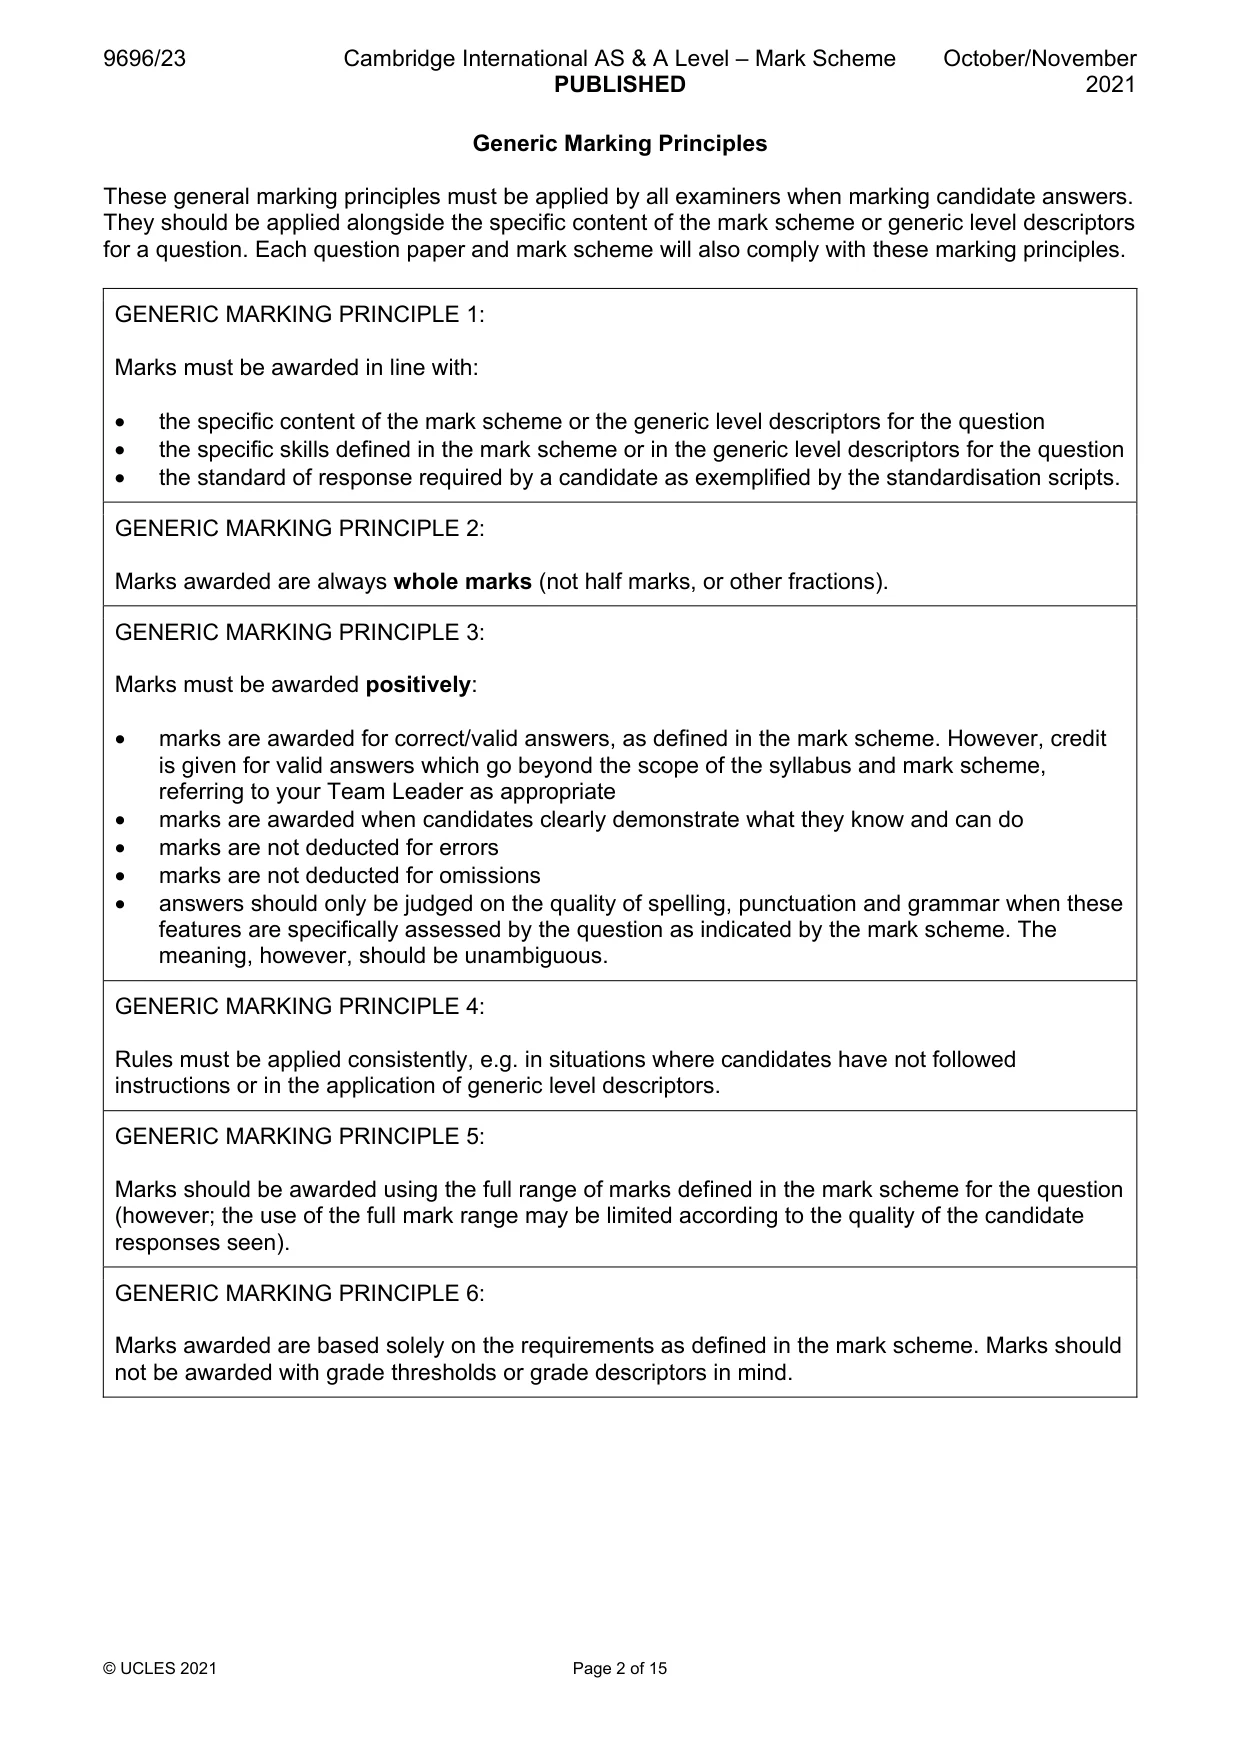
Mark scheme: Question Answer Marks 1(a) Fig. 1.1 shows life expectancy at birth in Europe in 2017. 3 Describe the pattern of life expectancy at birth shown in Fig. 1.1. • Life expectancy declines west to east • Exceptions such as Portugal ‒ lower than surrounding countries • Exceptions such as Greece ‒ higher than surrounding countries • The pattern is more complicated in the area between the highest and lowest categories/central area • Other valid statements 1 mark per statement. 1(b) Outline two problems for a country caused by a high life expectancy of 2 its population. Problems may include: • Pressure on healthcare systems • Economic cost of support for elderly • Increased taxation • Raising pension age • Poverty for the elderly • Increased responsibility for younger generation • Other valid problems 1 mark per statement. 1(c) Explain how high life expectancy of the population is linked to high 5 levels of economic development. Reasons may include: • Stable food supply and better nutrition as economy develops • Higher incomes giving more choice to improve lifestyle and health • Better working conditions, e.g. as manual labour is replaced by mechanisation • Taxation able to cover cost of public services and health care • Reduction in infant mortality as more wealth is created • Other Credit a simple reason 1 mark, or for a developed reason (with detail or an example) 2/3 marks to the maximum. Migration
Q2 · Number and percentage of world international migrants, 1980–2015
2 Fig. 2.1 shows number and percentage of world international migrants, 1980–2015. (a) Using Fig. 2.1 state: (i) the number of world international migrants in 2015 [1] (ii) between which two years the fastest percentage growth of international migrants took place. [1] (b) Compare the trend in number of world international migrants with the trend in percentage of world population shown in Fig. 2.1. [3] (c) Explain two ways in which physical factors can act as obstacles to international migration. [5] Settlement dynamics
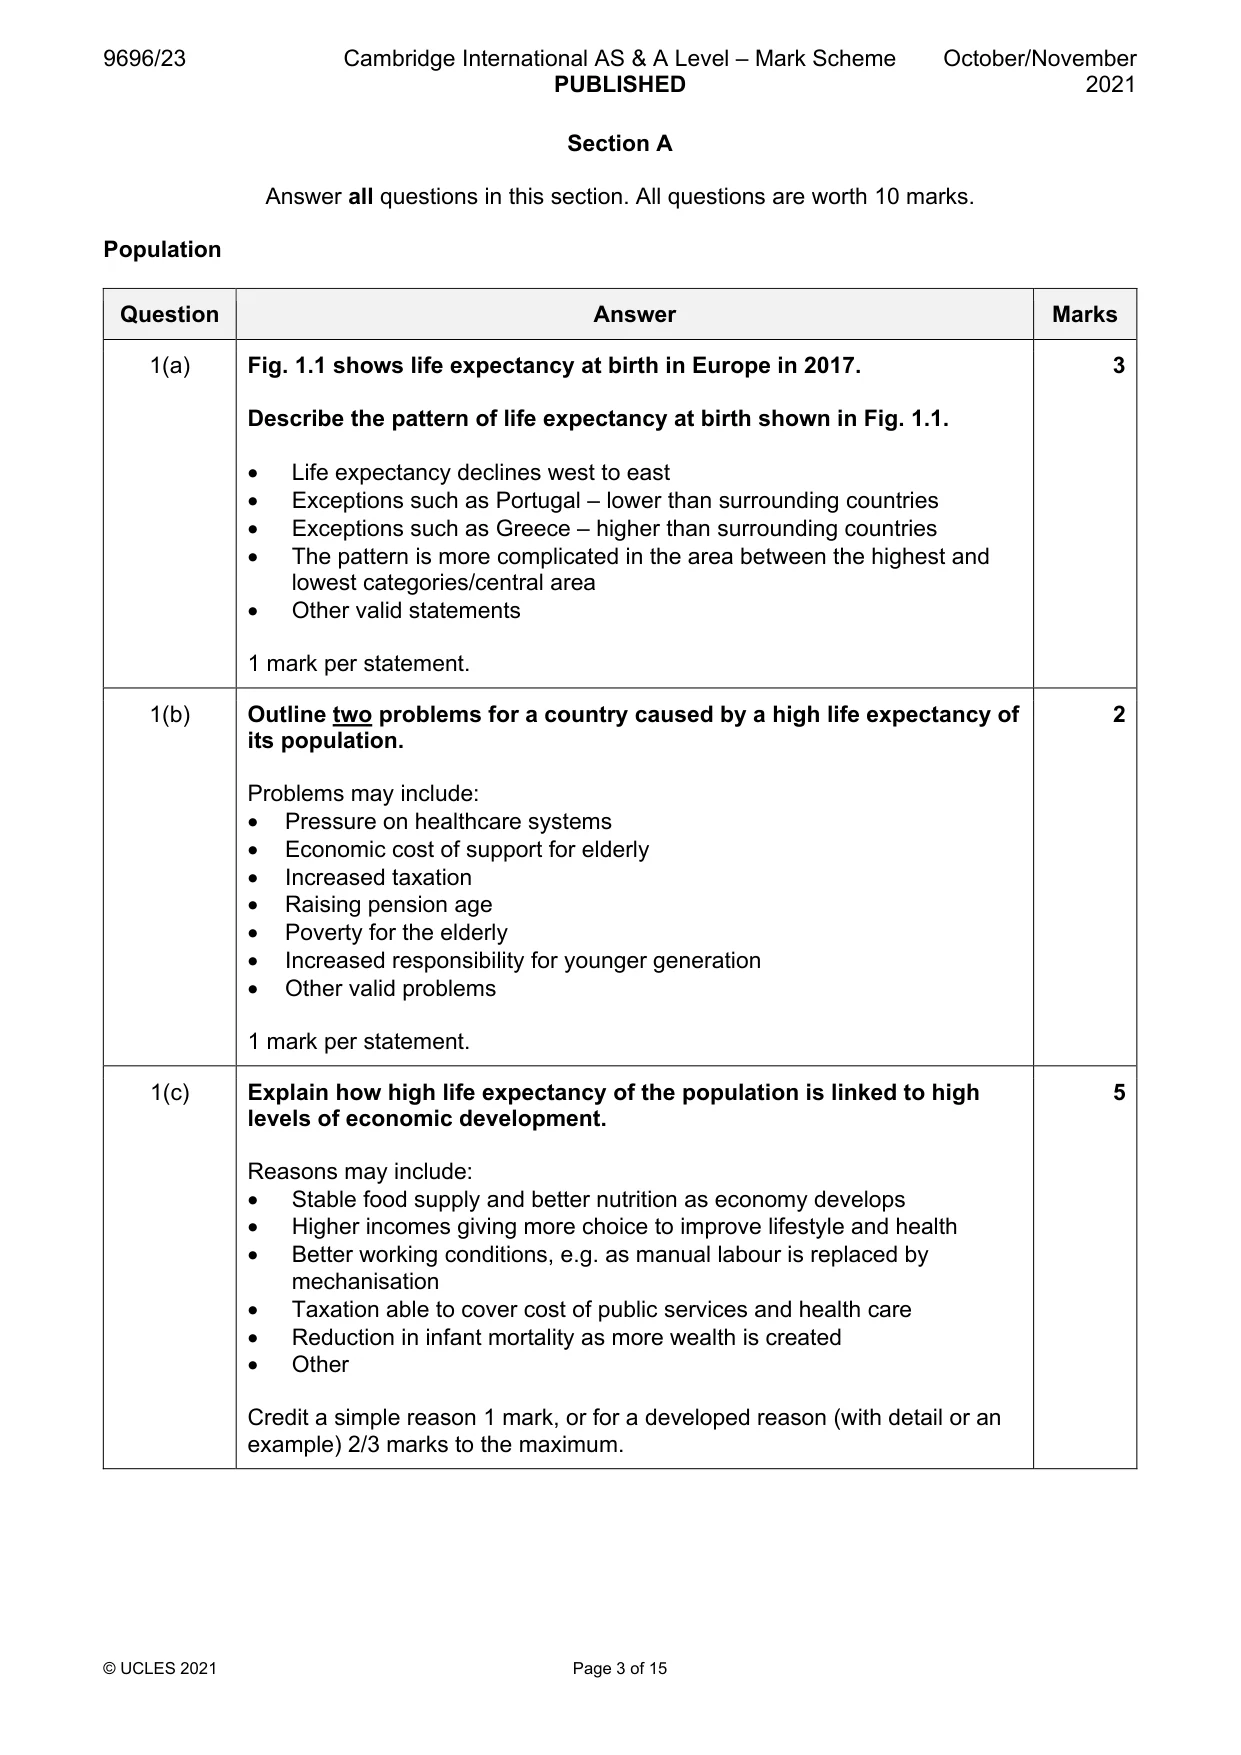
Mark scheme: 2(a)(i) Fig. 2.1 shows number and percentage of world international migrants, 1 1980–2015. Using Fig. 2.1 state: the number of world international migrants in 2015 250 million 2(a)(ii) Using Fig. 2.1 state: 1 between which two years the fastest percentage growth of international migrants took place. 1985 and 1990 2(b) Compare the trend in number of world international migrants with the 3 trend in percentage of world population shown in Fig. 2.1. • The trend in number (of international migrants) continually rises but the trend in percentage (of international migrants as a percentage of world population) does not (1) • Exemplified by 1990–1995 when the percentage falls/remains steady from 1995–2000 (1) • Both generally rise from 1980–2015 (1) • The fastest growth in both coincides from 1985–1990 (1) • Other valid comparisons are possible 1 mark per comment and a second mark for supporting data as illustrated above. Maximum 2 marks for no use of data, or no clear comparison. 2(c) Explain two ways in which physical factors can act as obstacles to 5 international migration. Candidates may consider one or more physical factors (seas, lakes or rivers, arid areas, mountain ranges, etc.) and explain how the physical factor is an obstacle with comment on the size and the conditions which have to be overcome. Allow distance as a factor if treated as an obstacle. Credit a simple reason 1 mark, or for a developed reason (with detail or an example) 2/3 marks to the maximum. Settlement dynamics
Q3 · The average annual population growth rate of cities, by continent, 2000–18
3 Fig. 3.1 shows the average annual population growth rate of cities, by continent, 2000–18. (a) Using Fig. 3.1, state: (i) the continent with the fastest growing city [1] (ii) the continent which has only positive growth rates. [1] (b) Suggest two reasons why some cities are experiencing population decline. [4] (c) Explain how a rapid rate of population growth can influence competition for land within a city. [4]
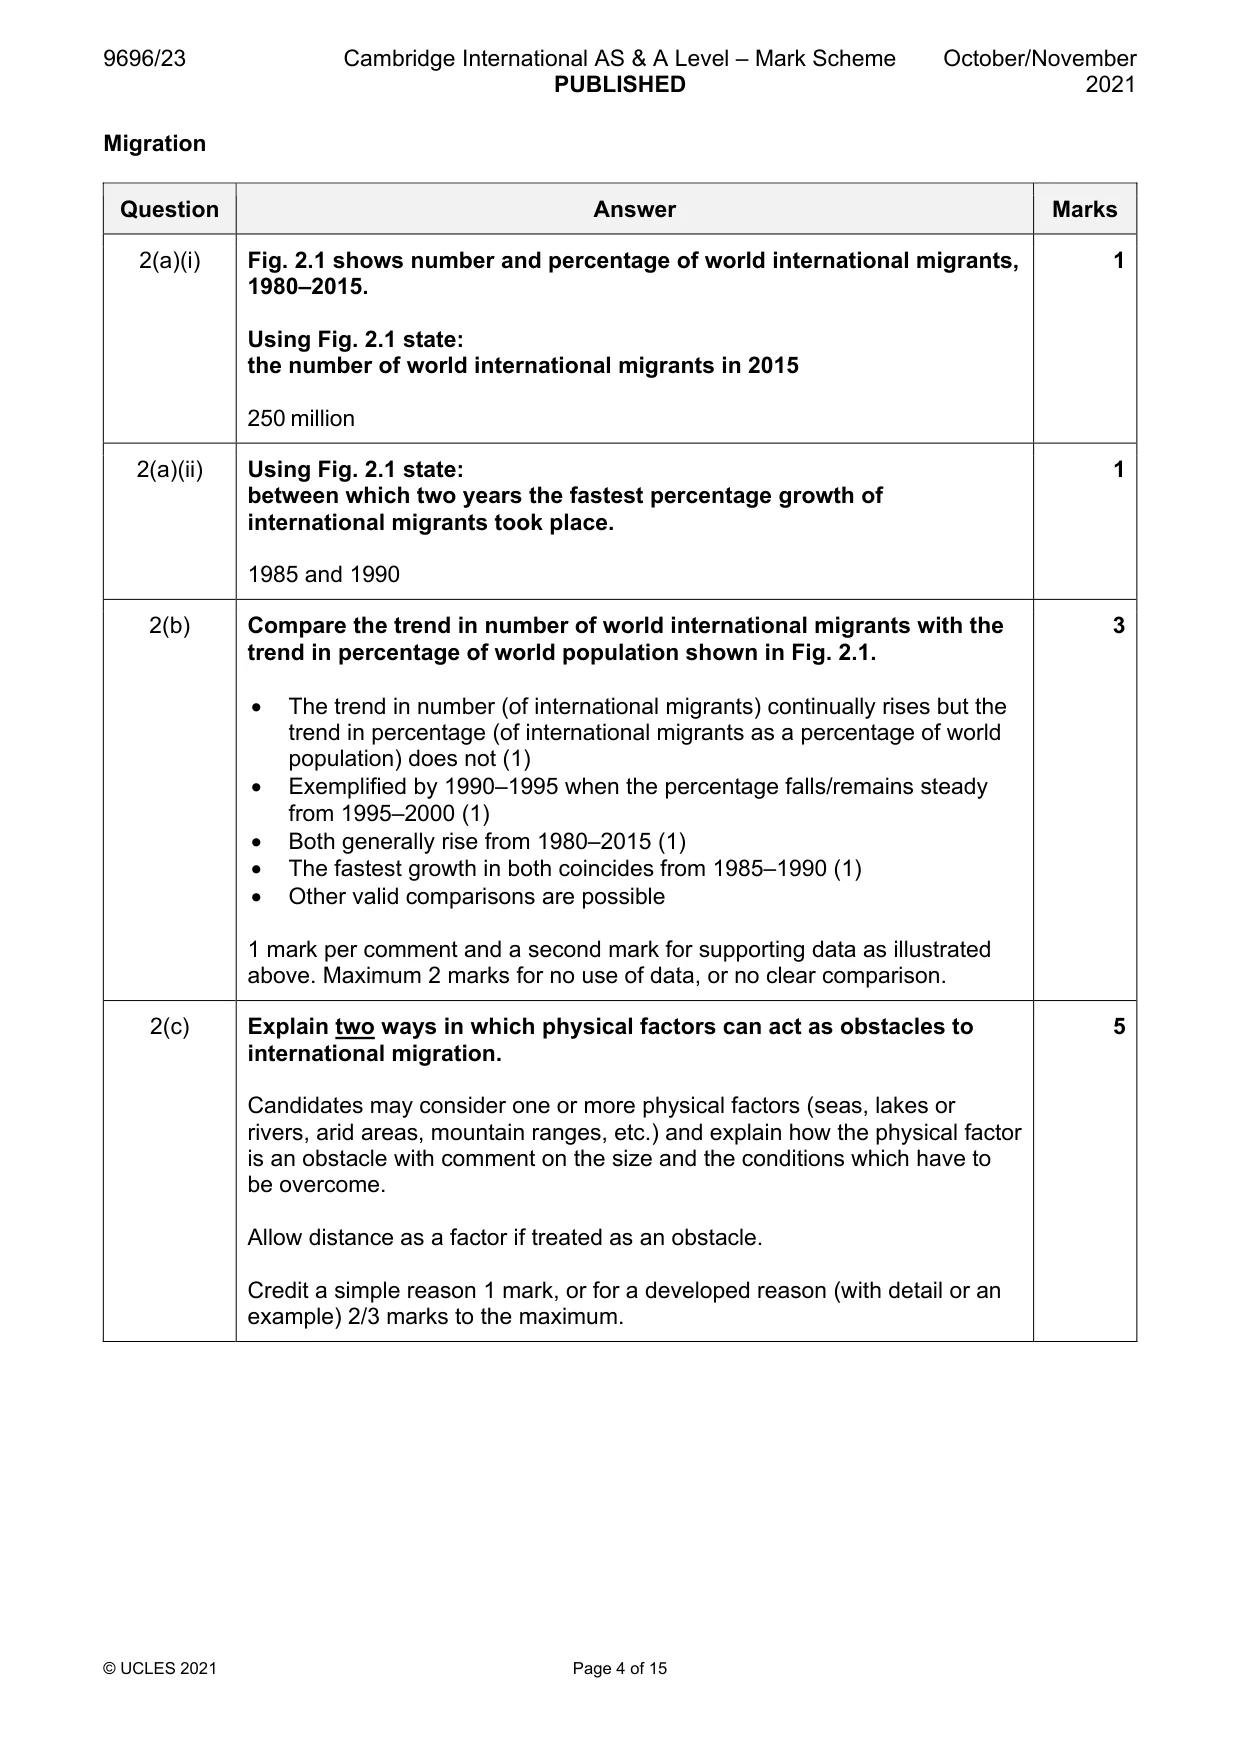
Mark scheme: 3(a)(i) Fig. 3.1 shows the average annual population growth rate of cities, by 1 continent, 2000–18. Using Fig. 3.1, state: the continent with the fastest growing city Asia 3(a)(ii) Using Fig. 3.1, state: 1 the continent which has only positive growth rates. Australasia 3(b) Suggest two reasons why some cities are experiencing population 4 decline. Responses may be given in terms of pushes and pulls. Reasons may include: • Environmental issues such as pollution • Employment loss/economic decline • Crime • High cost of land • Development of/attraction of other cities, smaller towns/rural areas • Improvements in transport and personal mobility • Impact of internet on location of workplaces • Natural decrease • Other 1 mark per reason or 2 marks with development such as using an example or more detail. 3(c) Explain how a rapid rate of population growth can influence 4 competition for land within a city. Competition for land should be within the existing city. Explanation may refer to: • Land values rise • Activities and/or people who can afford these increases may obtain the land • There will be winners and losers – some benefit from selling land which has risen in value while others are ‘forced’ out as rents rise • Building may become higher in density and or height • Pressure on open spaces • Other 1 mark per reason or 2 marks with development such as using an example or more detail. Section B Answer one question from this section. All questions are worth 30 marks. Population
Q4 · Describe how the gender balance varies in the age/sex structure of a typical HIC
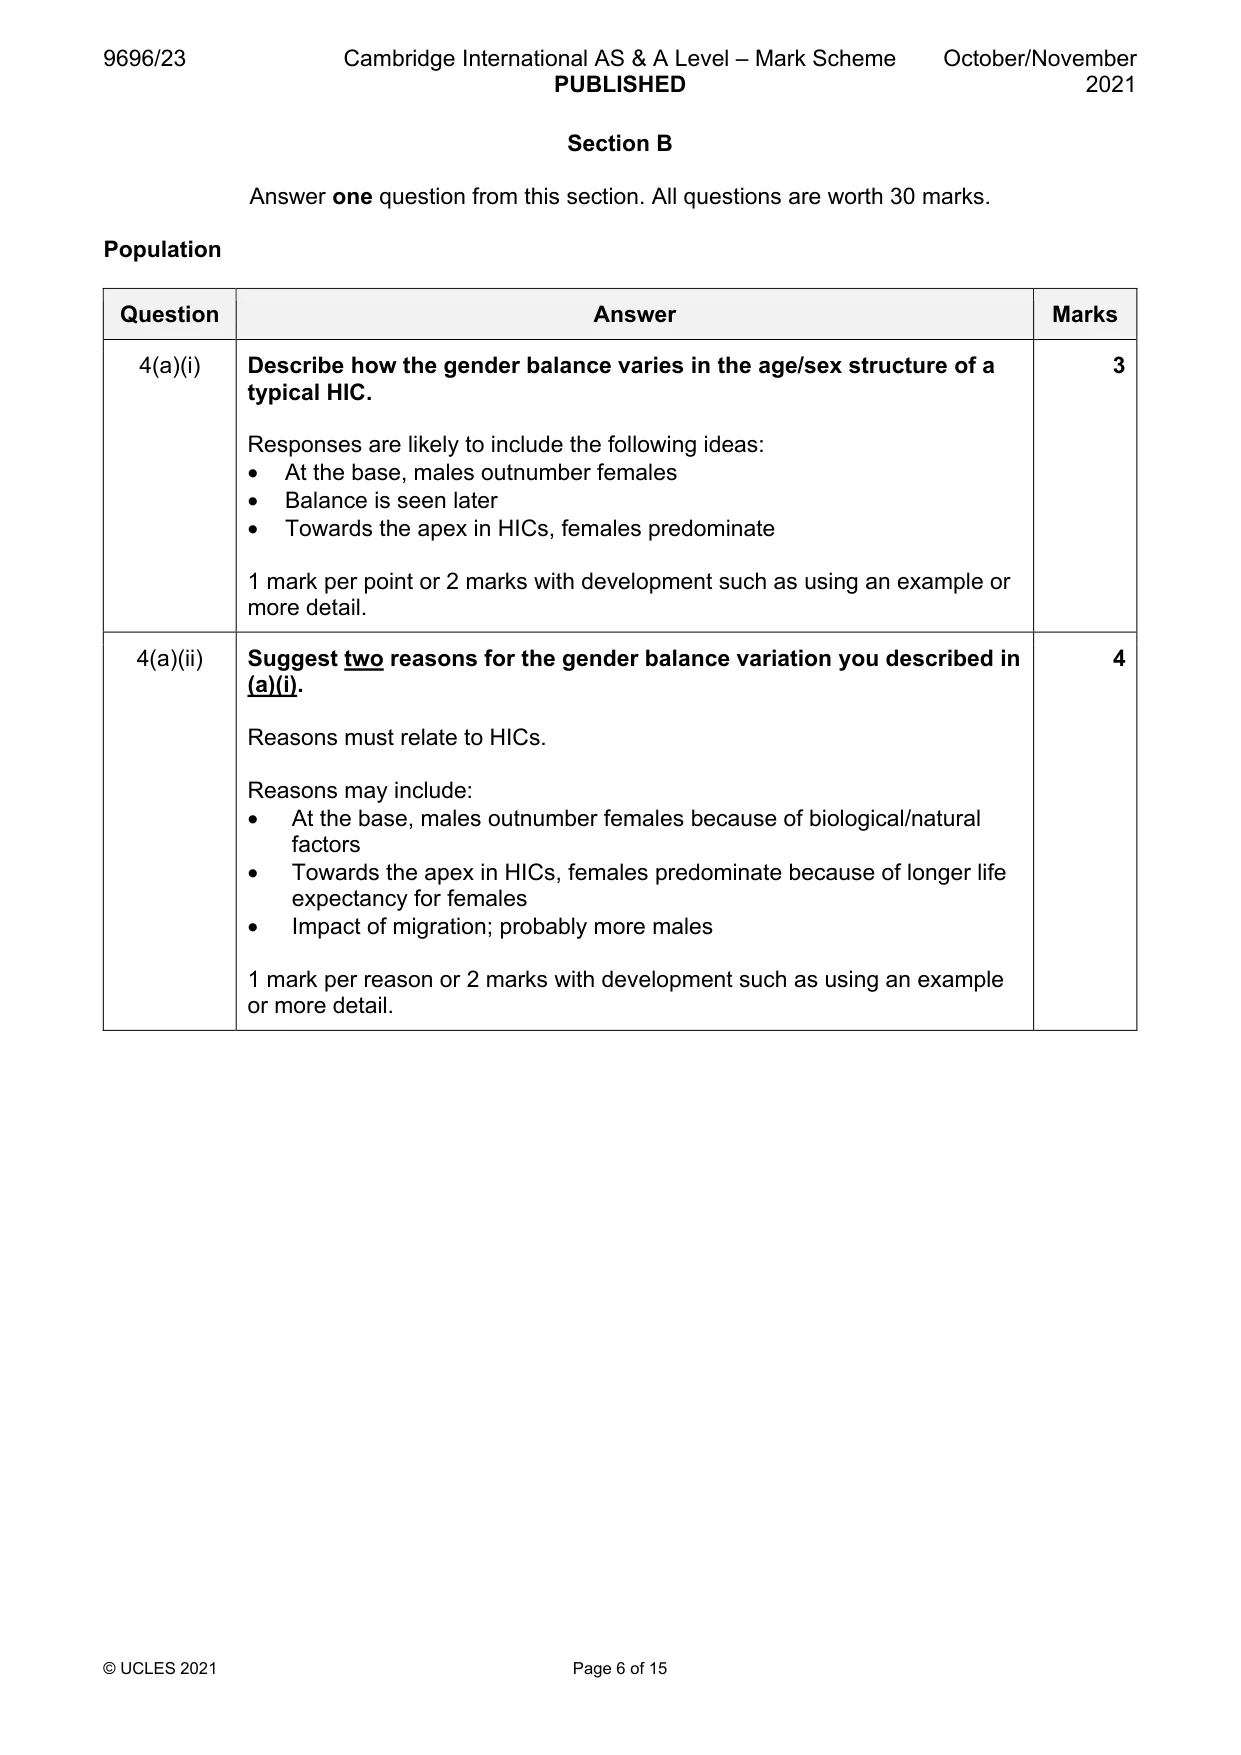
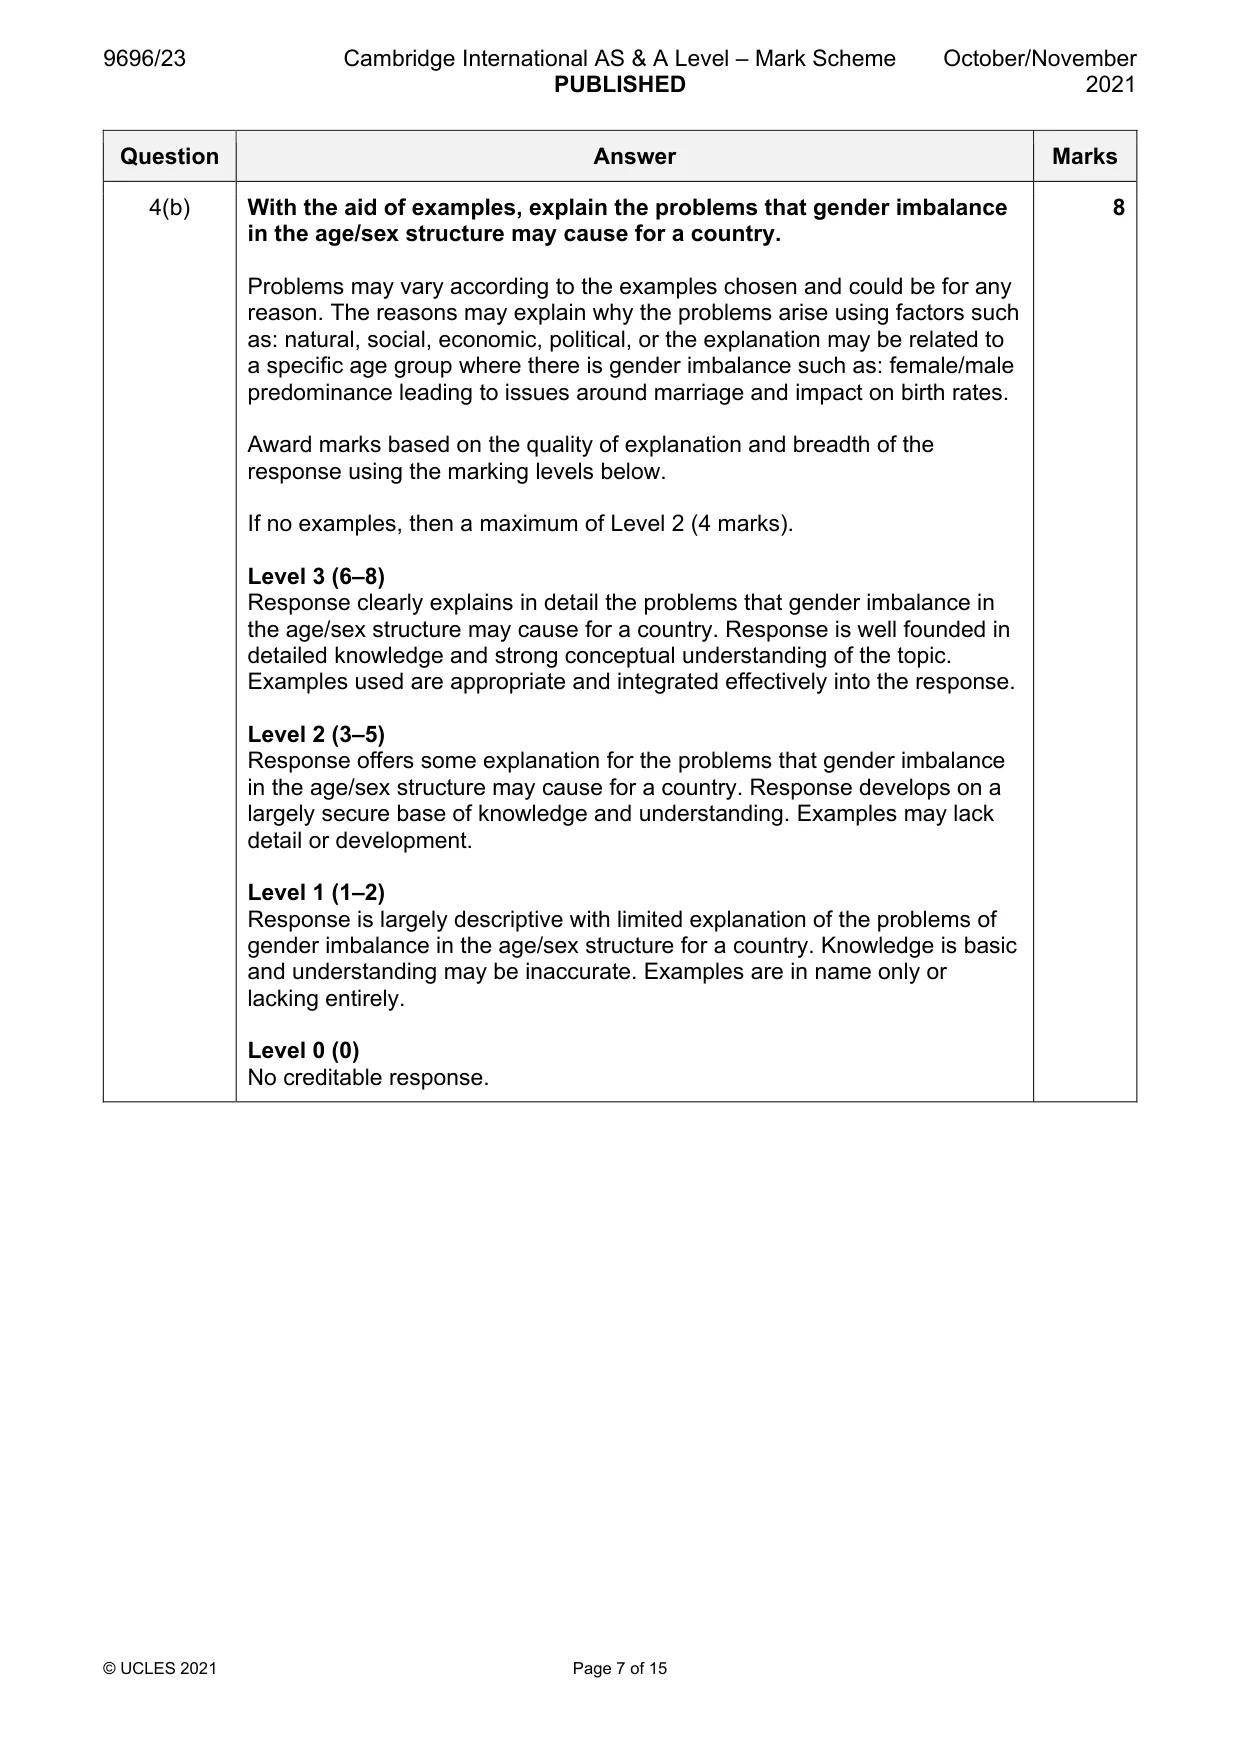
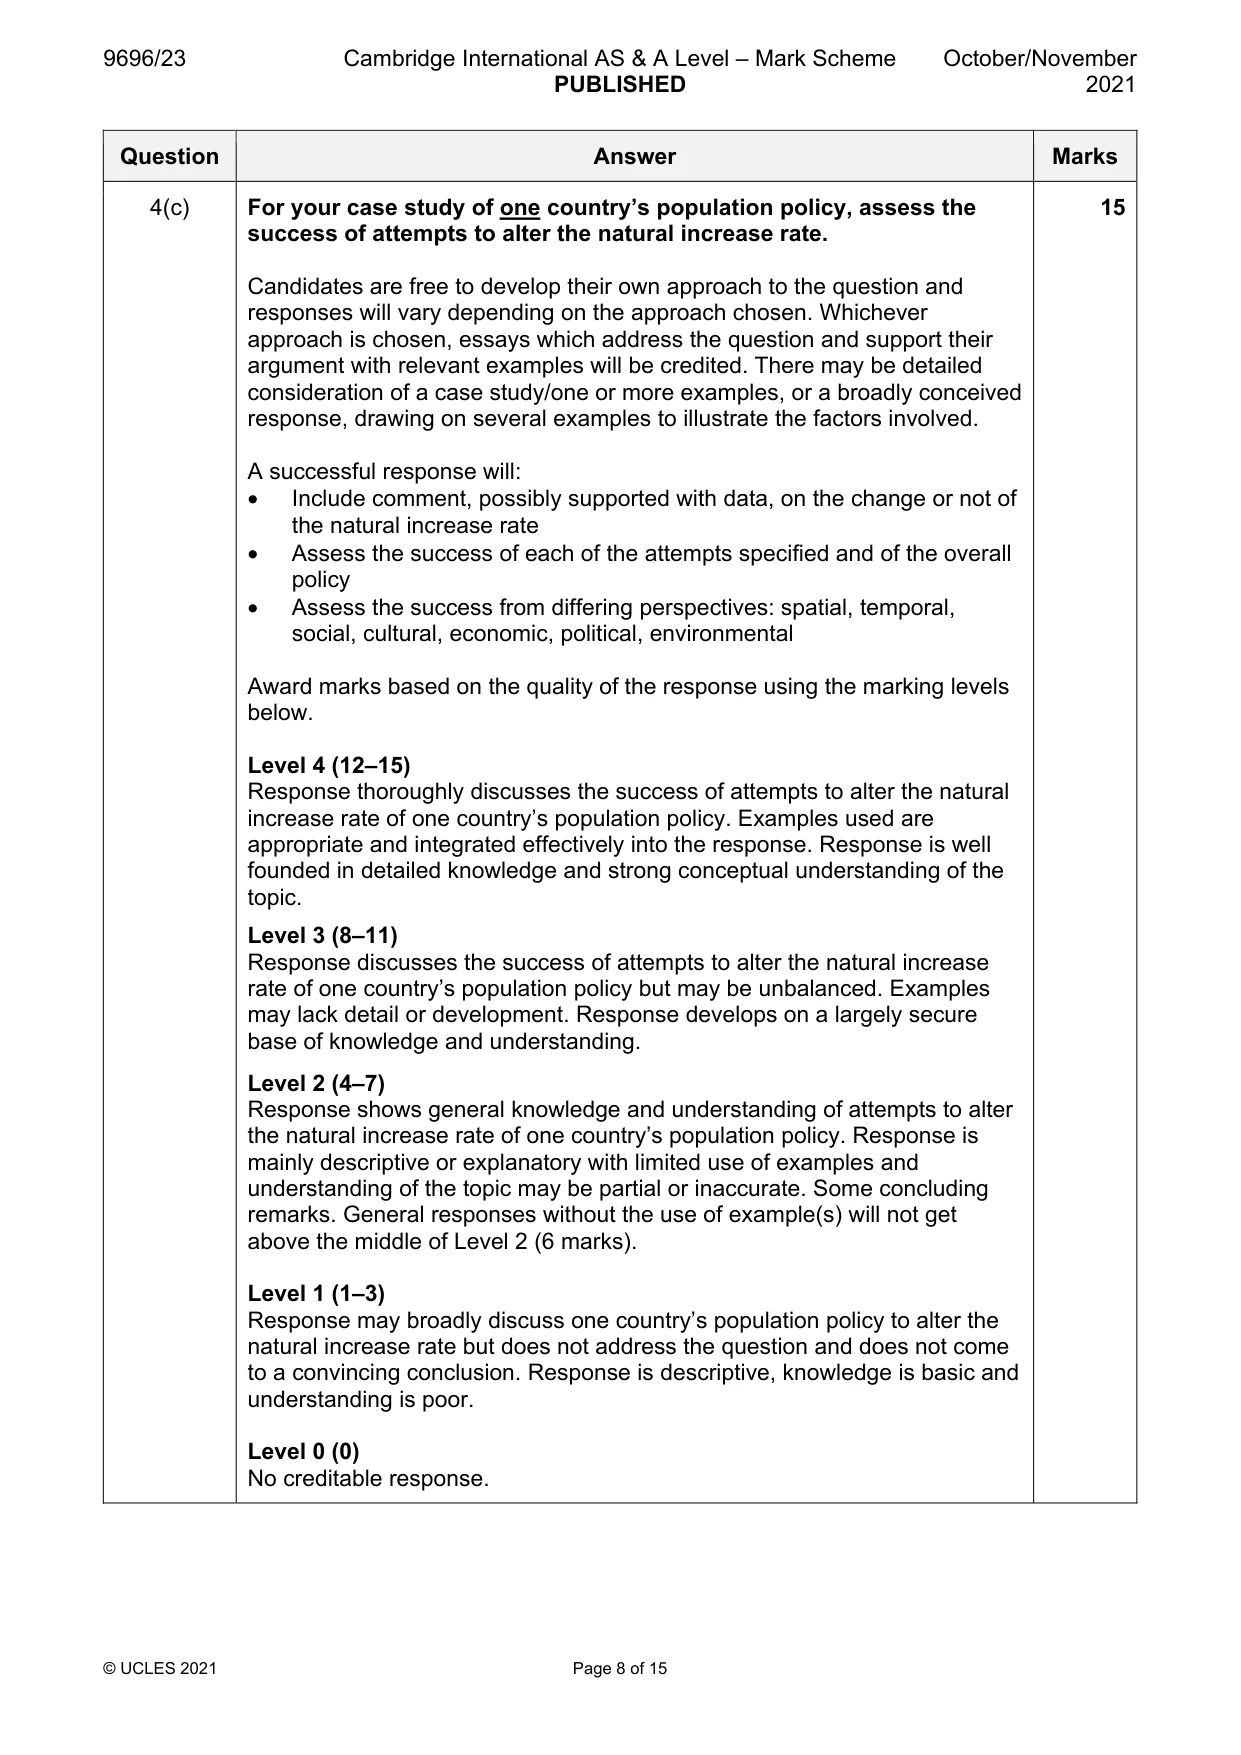
4 (a) (i) Describe how the gender balance varies in the age/sex structure of a typical HIC. [3] (ii) Suggest two reasons for the gender balance variation you described in (a)(i). [4] (b) With the aid of examples, explain the problems that gender imbalance in the age/sex structure may cause for a country. [8] (c) For your case study of one country’s population policy, assess the success of attempts to alter the natural increase rate. [15] Migration
Mark scheme: 4(a)(i) Describe how the gender balance varies in the age/sex structure of a 3 typical HIC. Responses are likely to include the following ideas: • At the base, males outnumber females • Balance is seen later • Towards the apex in HICs, females predominate 1 mark per point or 2 marks with development such as using an example or more detail. 4(a)(ii) Suggest two reasons for the gender balance variation you described in 4 (a)(i). Reasons must relate to HICs. Reasons may include: • At the base, males outnumber females because of biological/natural factors • Towards the apex in HICs, females predominate because of longer life expectancy for females • Impact of migration; probably more males 1 mark per reason or 2 marks with development such as using an example or more detail. 4(b) With the aid of examples, explain the problems that gender imbalance 8 in the age/sex structure may cause for a country. Problems may vary according to the examples chosen and could be for any reason. The reasons may explain why the problems arise using factors such as: natural, social, economic, political, or the explanation may be related to a specific age group where there is gender imbalance such as: female/male predominance leading to issues around marriage and impact on birth rates. Award marks based on the quality of explanation and breadth of the response using the marking levels below. If no examples, then a maximum of Level 2 (4 marks). Level 3 (6–8) Response clearly explains in detail the problems that gender imbalance in the age/sex structure may cause for a country. Response is well founded in detailed knowledge and strong conceptual understanding of the topic. Examples used are appropriate and integrated effectively into the response. Level 2 (3–5) Response offers some explanation for the problems that gender imbalance in the age/sex structure may cause for a country. Response develops on a largely secure base of knowledge and understanding. Examples may lack detail or development. Level 1 (1–2) Response is largely descriptive with limited explanation of the problems of gender imbalance in the age/sex structure for a country. Knowledge is basic and understanding may be inaccurate. Examples are in name only or lacking entirely. Level 0 (0) No creditable response. 4(c) For your case study of one country’s population policy, assess the 15 success of attempts to alter the natural increase rate. Candidates are free to develop their own approach to the question and responses will vary depending on the approach chosen. Whichever approach is chosen, essays which address the question and support their argument with relevant examples will be credited. There may be detailed consideration of a case study/one or more examples, or a broadly conceived response, drawing on several examples to illustrate the factors involved. A successful response will: • Include comment, possibly supported with data, on the change or not of the natural increase rate • Assess the success of each of the attempts specified and of the overall policy • Assess the success from differing perspectives: spatial, temporal, social, cultural, economic, political, environmental Award marks based on the quality of the response using the marking levels below. Level 4 (12–15) Response thoroughly discusses the success of attempts to alter the natural increase rate of one country’s population policy. Examples used are appropriate and integrated effectively into the response. Response is well founded in detailed knowledge and strong conceptual understanding of the topic. Level 3 (8–11) Response discusses the success of attempts to alter the natural increase rate of one country’s population policy but may be unbalanced. Examples may lack detail or development. Response develops on a largely secure base of knowledge and understanding. Level 2 (4–7) Response shows general knowledge and understanding of attempts to alter the natural increase rate of one country’s population policy. Response is mainly descriptive or explanatory with limited use of examples and understanding of the topic may be partial or inaccurate. Some concluding remarks. General responses without the use of example(s) will not get above the middle of Level 2 (6 marks). Level 1 (1–3) Response may broadly discuss one country’s population policy to alter the natural increase rate but does not address the question and does not come to a convincing conclusion. Response is descriptive, knowledge is basic and understanding is poor. Level 0 (0) No creditable response. Migration
Q5 · Compare the features of stepped migration with the features of urban–urban migration
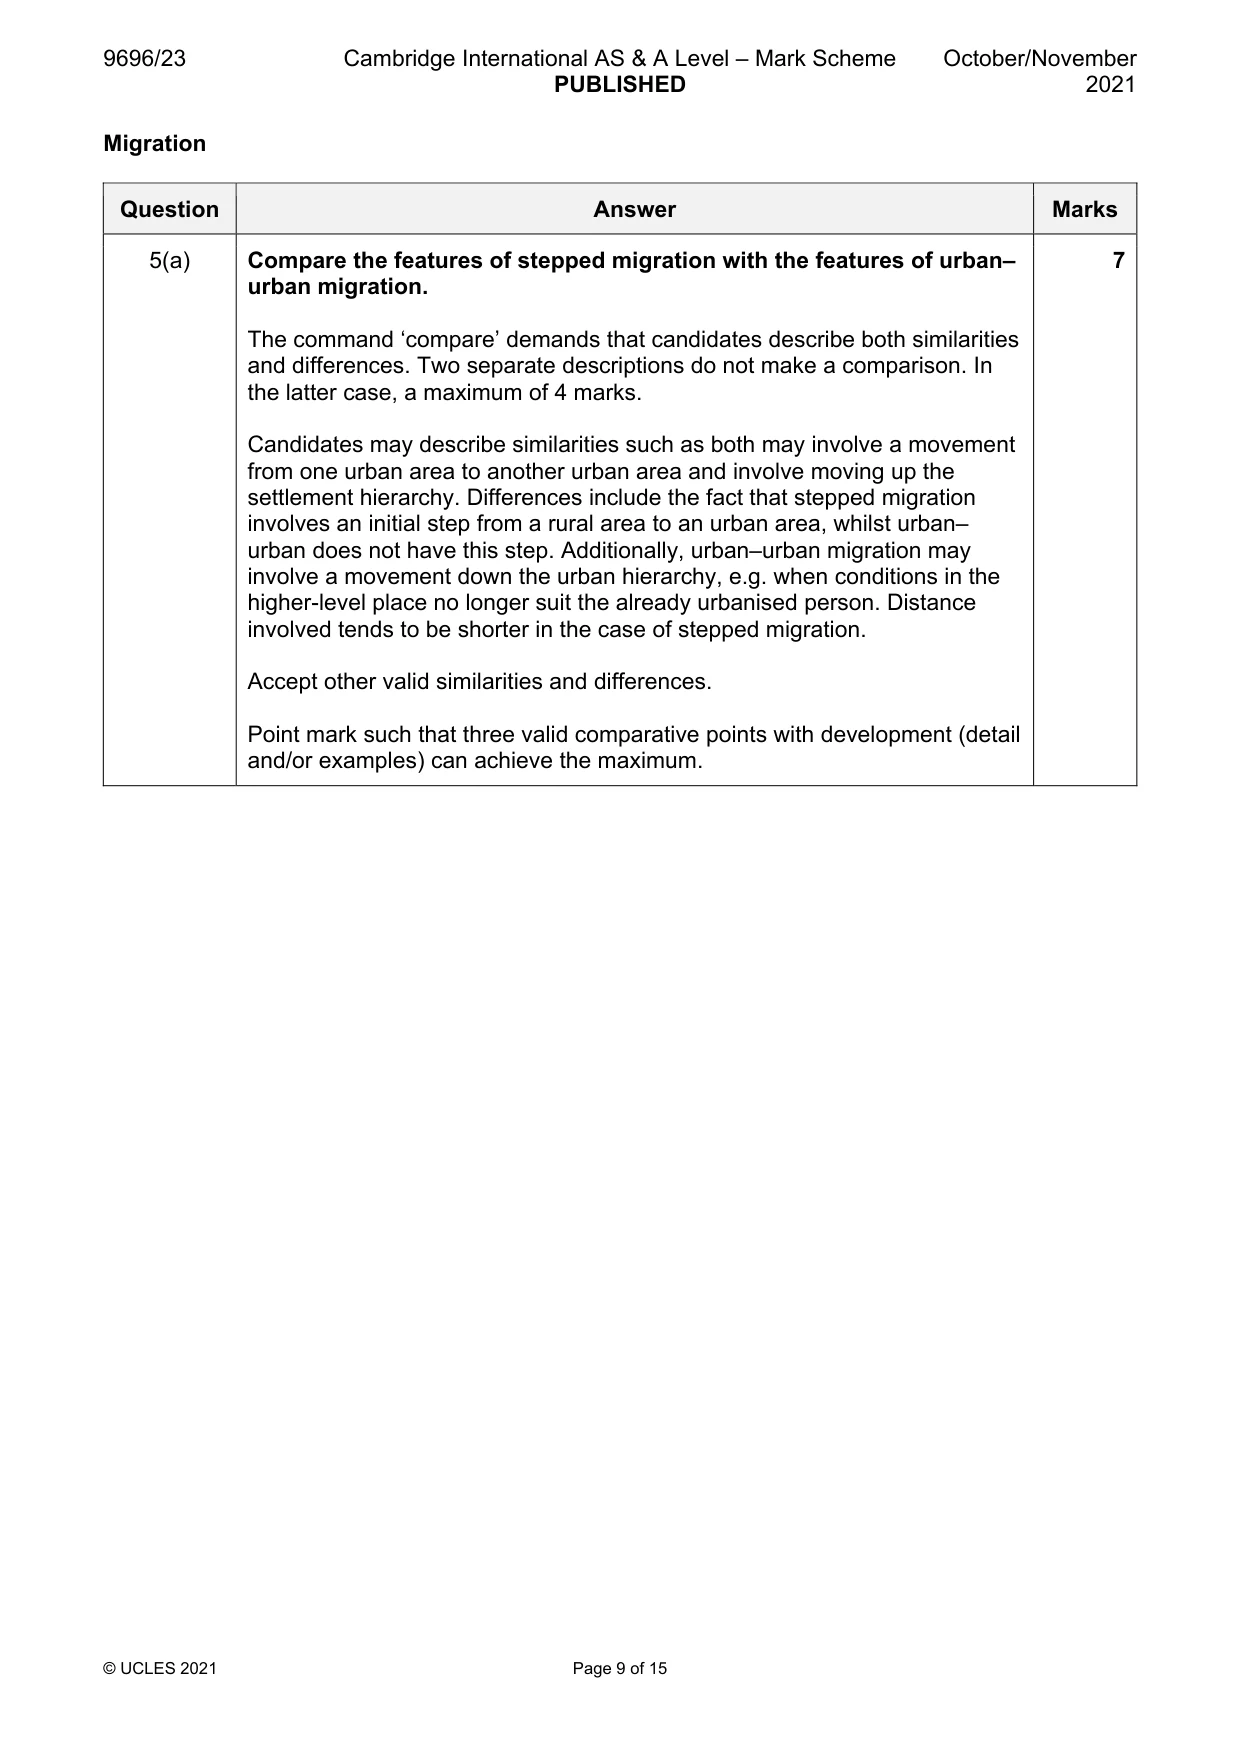
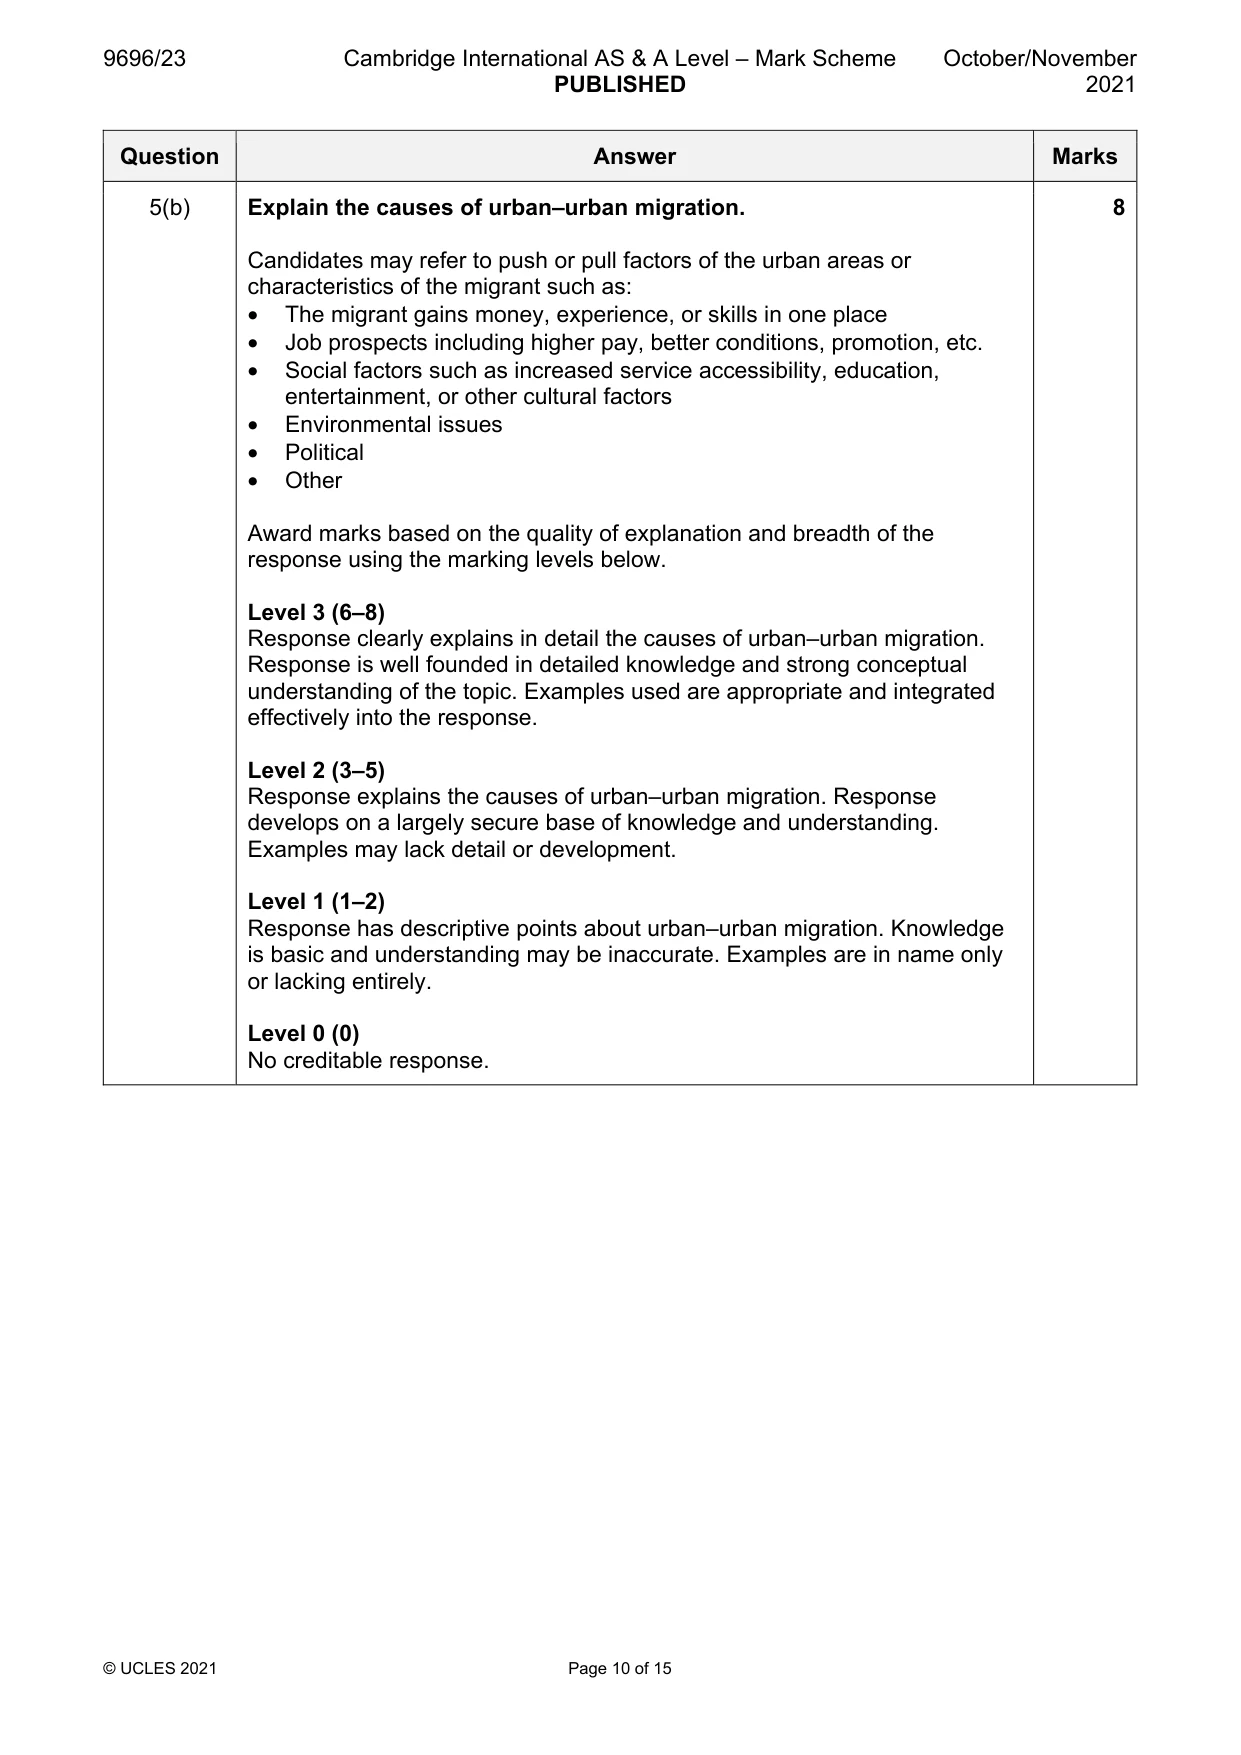
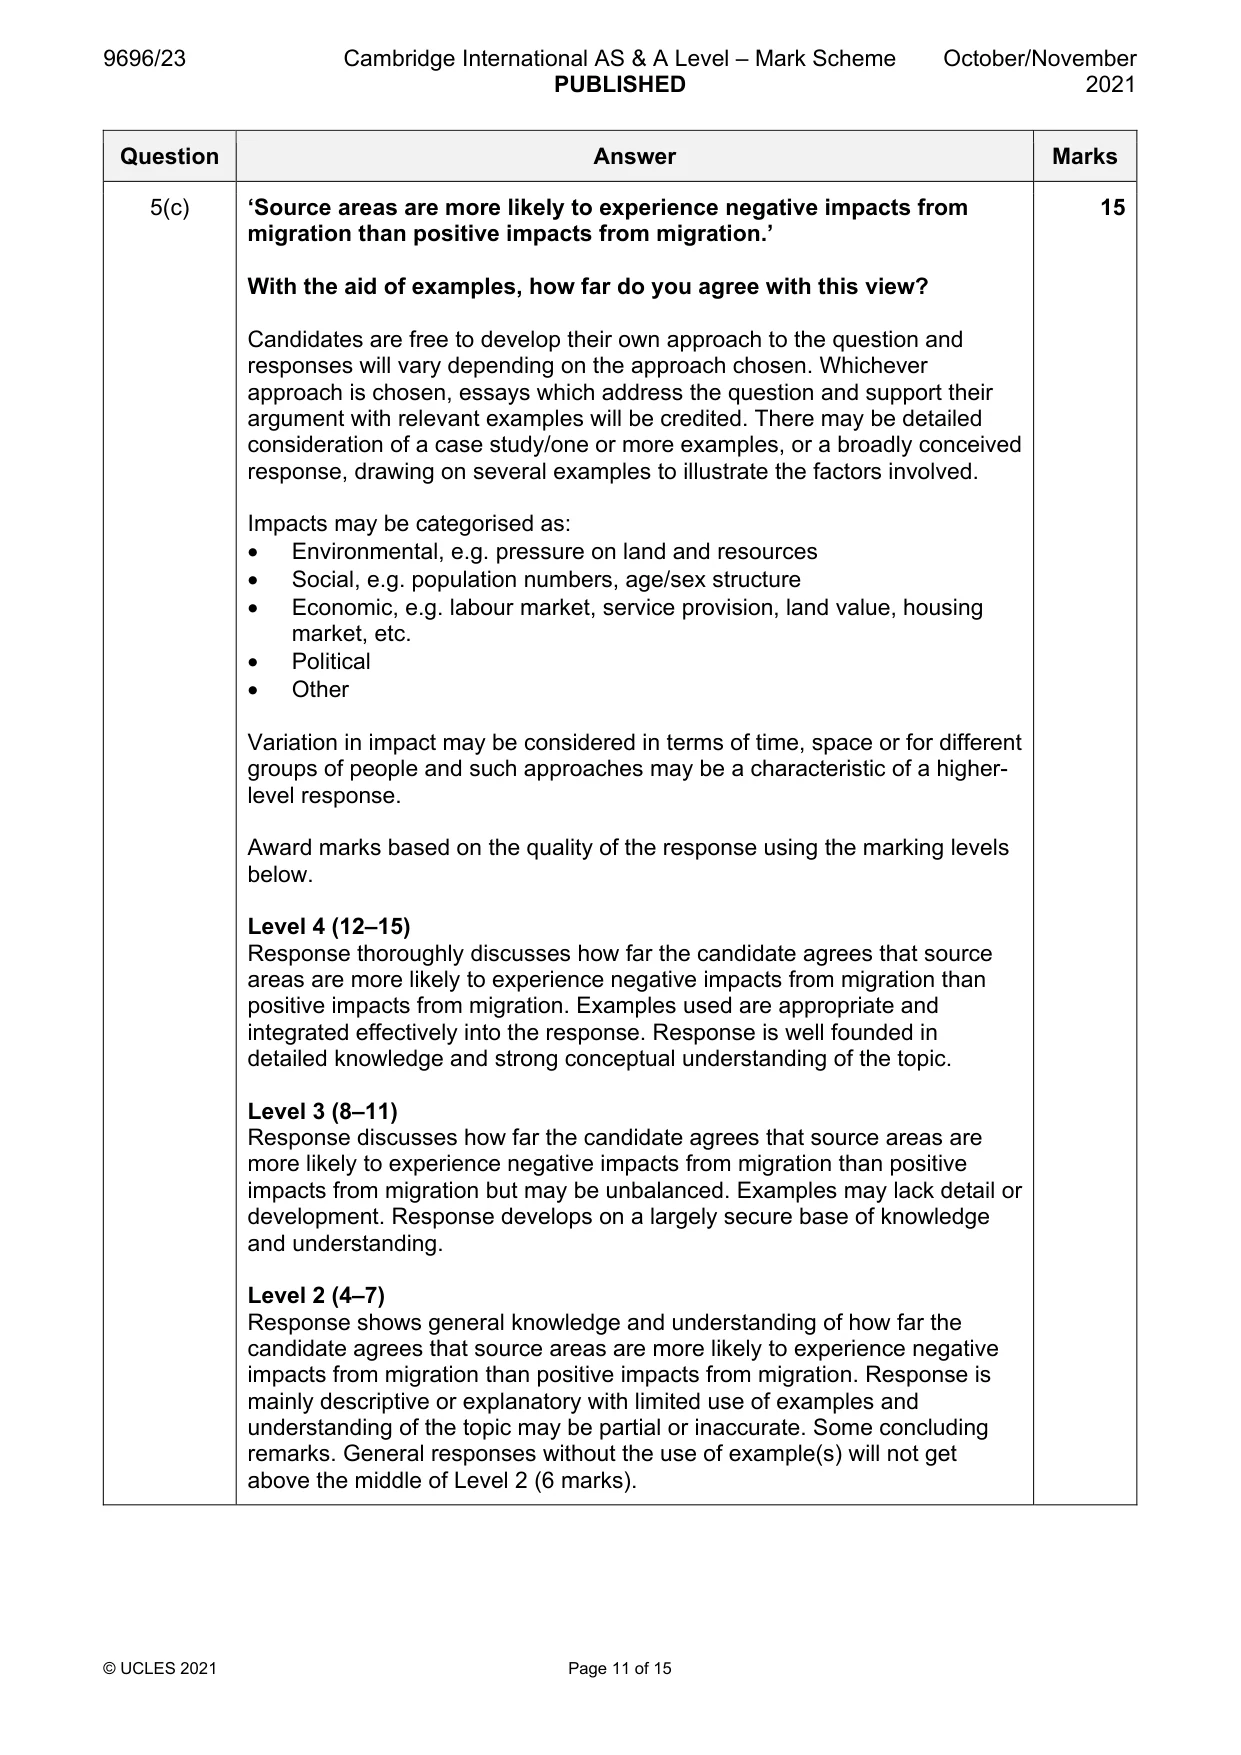
5 (a) Compare the features of stepped migration with the features of urban–urban migration. [7] (b) Explain the causes of urban–urban migration. [8] (c) ‘Source areas are more likely to experience negative impacts from migration than positive impacts from migration.’ With the aid of examples, how far do you agree with this view? [15] Settlement dynamics
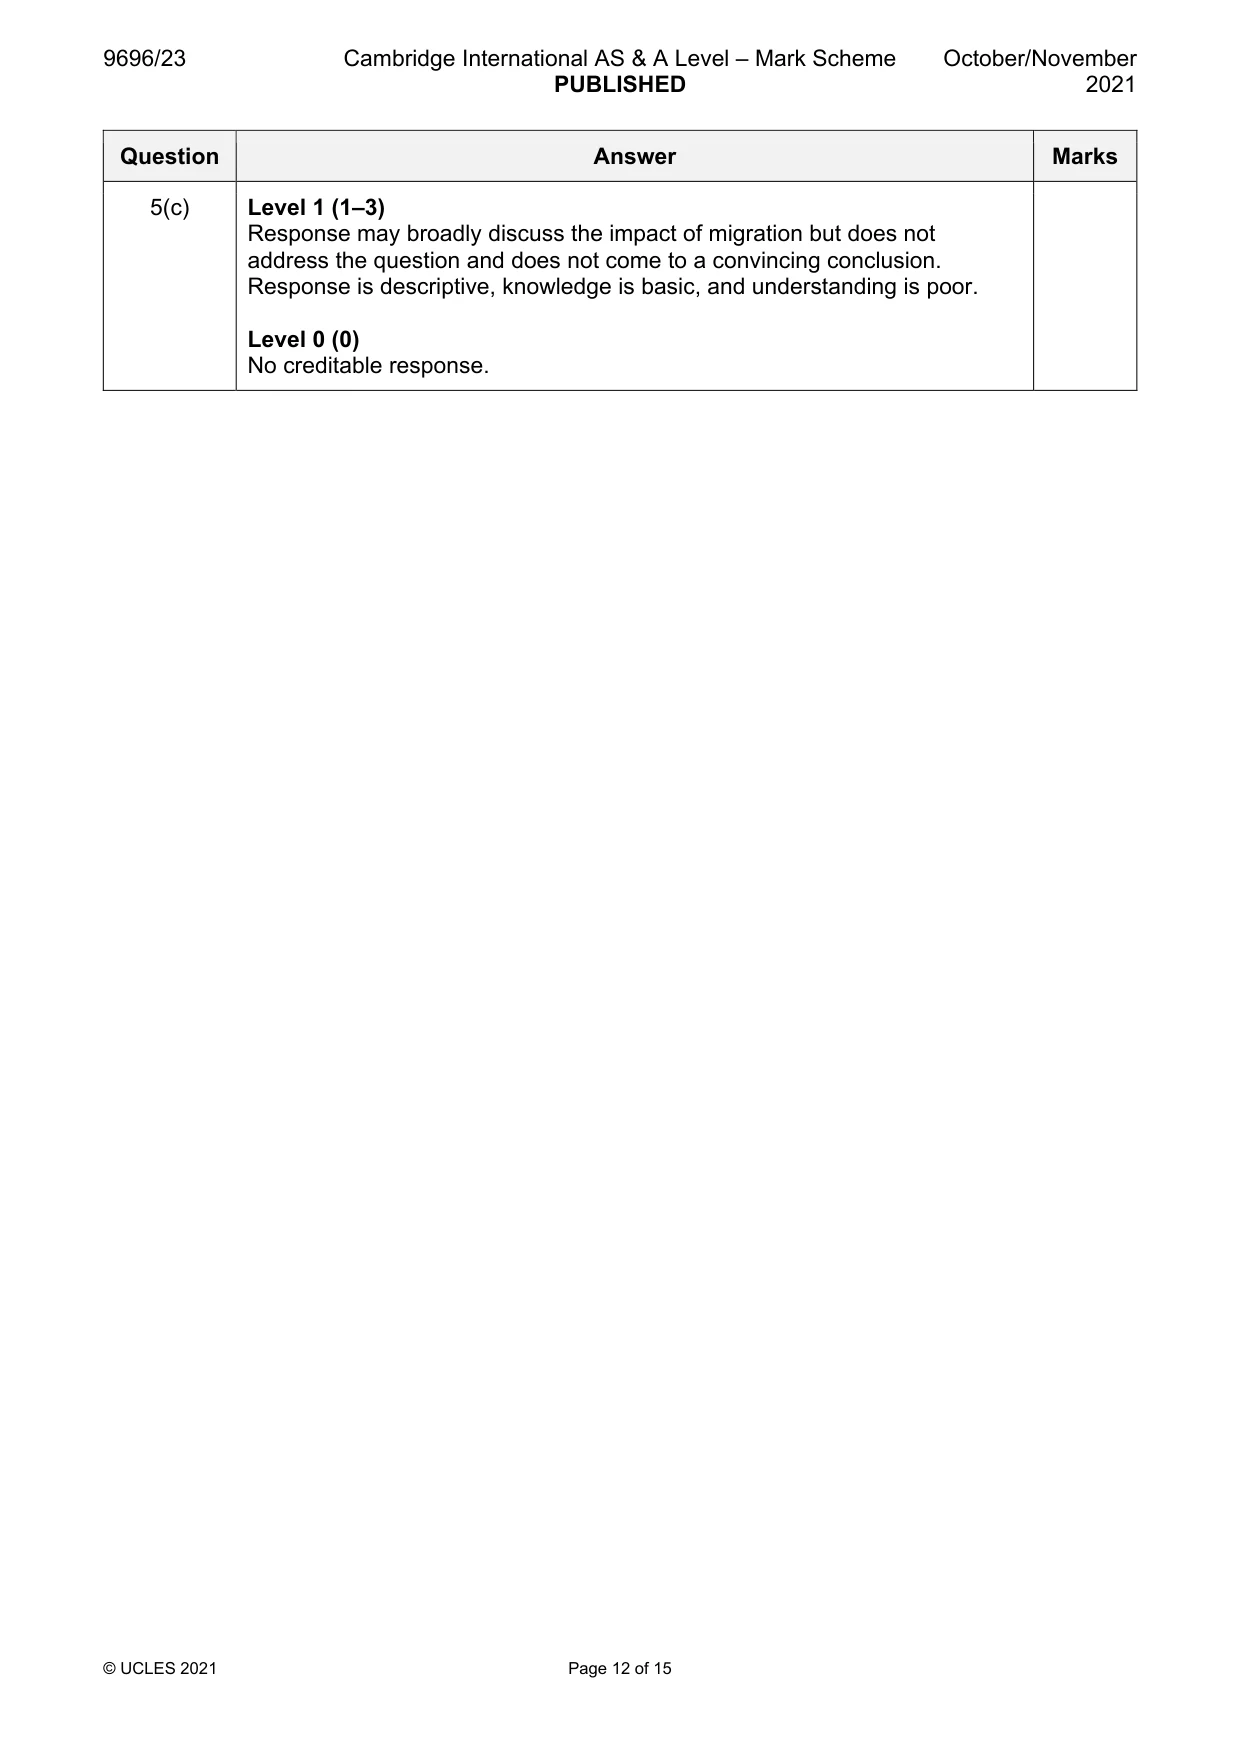
Mark scheme: 5(a) Compare the features of stepped migration with the features of urban– 7 urban migration. The command ‘compare’ demands that candidates describe both similarities and differences. Two separate descriptions do not make a comparison. In the latter case, a maximum of 4 marks. Candidates may describe similarities such as both may involve a movement from one urban area to another urban area and involve moving up the settlement hierarchy. Differences include the fact that stepped migration involves an initial step from a rural area to an urban area, whilst urban– urban does not have this step. Additionally, urban–urban migration may involve a movement down the urban hierarchy, e.g. when conditions in the higher-level place no longer suit the already urbanised person. Distance involved tends to be shorter in the case of stepped migration. Accept other valid similarities and differences. Point mark such that three valid comparative points with development (detail and/or examples) can achieve the maximum. 5(b) Explain the causes of urban–urban migration. 8 Candidates may refer to push or pull factors of the urban areas or characteristics of the migrant such as: • The migrant gains money, experience, or skills in one place • Job prospects including higher pay, better conditions, promotion, etc. • Social factors such as increased service accessibility, education, entertainment, or other cultural factors • Environmental issues • Political • Other Award marks based on the quality of explanation and breadth of the response using the marking levels below. Level 3 (6–8) Response clearly explains in detail the causes of urban–urban migration. Response is well founded in detailed knowledge and strong conceptual understanding of the topic. Examples used are appropriate and integrated effectively into the response. Level 2 (3–5) Response explains the causes of urban–urban migration. Response develops on a largely secure base of knowledge and understanding. Examples may lack detail or development. Level 1 (1–2) Response has descriptive points about urban–urban migration. Knowledge is basic and understanding may be inaccurate. Examples are in name only or lacking entirely. Level 0 (0) No creditable response. 5(c) ‘Source areas are more likely to experience negative impacts from 15 migration than positive impacts from migration.’ With the aid of examples, how far do you agree with this view? Candidates are free to develop their own approach to the question and responses will vary depending on the approach chosen. Whichever approach is chosen, essays which address the question and support their argument with relevant examples will be credited. There may be detailed consideration of a case study/one or more examples, or a broadly conceived response, drawing on several examples to illustrate the factors involved. Impacts may be categorised as: • Environmental, e.g. pressure on land and resources • Social, e.g. population numbers, age/sex structure • Economic, e.g. labour market, service provision, land value, housing market, etc. • Political • Other Variation in impact may be considered in terms of time, space or for different groups of people and such approaches may be a characteristic of a higher- level response. Award marks based on the quality of the response using the marking levels below. Level 4 (12–15) Response thoroughly discusses how far the candidate agrees that source areas are more likely to experience negative impacts from migration than positive impacts from migration. Examples used are appropriate and integrated effectively into the response. Response is well founded in detailed knowledge and strong conceptual understanding of the topic. Level 3 (8–11) Response discusses how far the candidate agrees that source areas are more likely to experience negative impacts from migration than positive impacts from migration but may be unbalanced. Examples may lack detail or development. Response develops on a largely secure base of knowledge and understanding. Level 2 (4–7) Response shows general knowledge and understanding of how far the candidate agrees that source areas are more likely to experience negative impacts from migration than positive impacts from migration. Response is mainly descriptive or explanatory with limited use of examples and understanding of the topic may be partial or inaccurate. Some concluding remarks. General responses without the use of example(s) will not get above the middle of Level 2 (6 marks). 5(c) Level 1 (1–3) Response may broadly discuss the impact of migration but does not address the question and does not come to a convincing conclusion. Response is descriptive, knowledge is basic, and understanding is poor. Level 0 (0) No creditable response. Settlement dynamics
Q6 · With the aid of examples, explain why the population of some rural areas is increasing
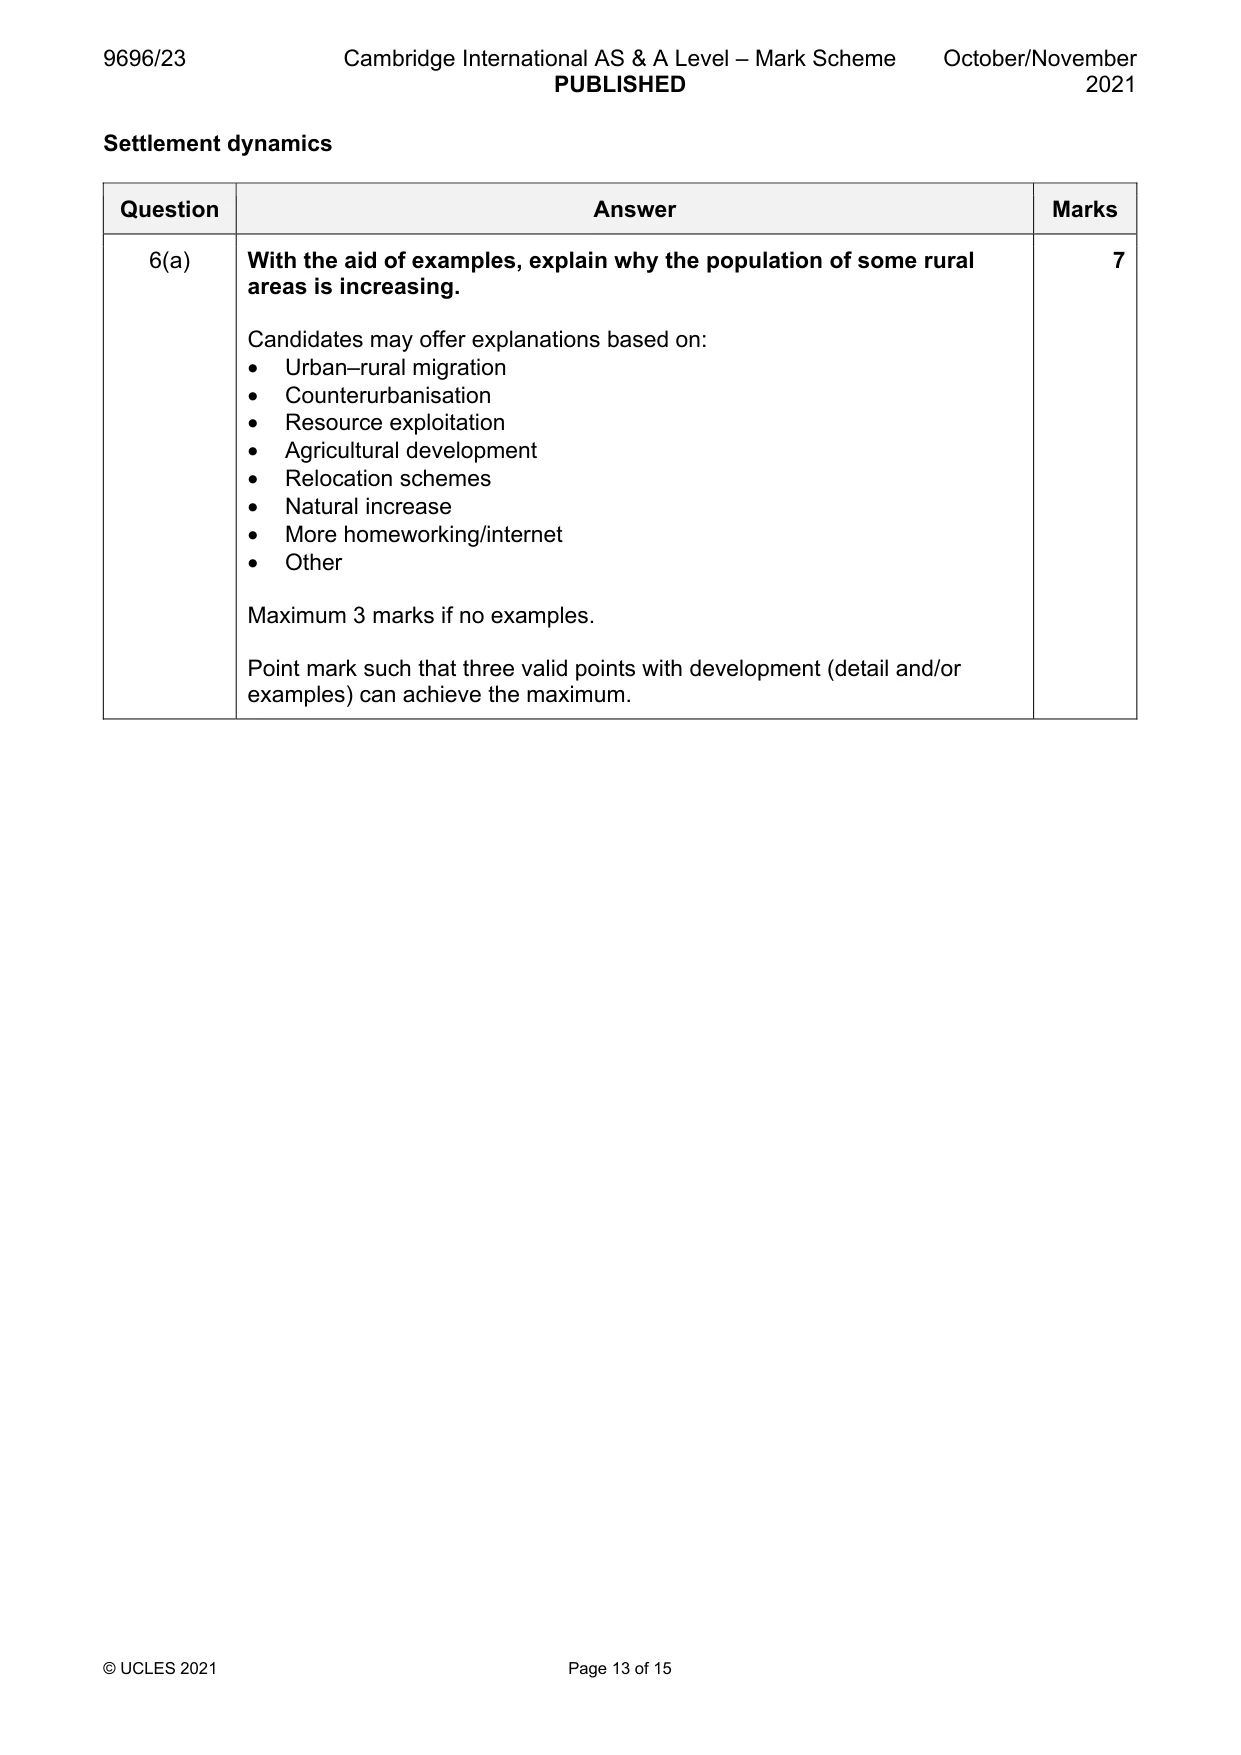
6 (a) With the aid of examples, explain why the population of some rural areas is increasing. [7] (b) For your case study of one rural settlement or rural area, explain how its issues are related to growth (or decline). [8] (c) For the rural settlement or rural area chosen in (b), evaluate the success of responses to its issues related to growth (or decline). [15]
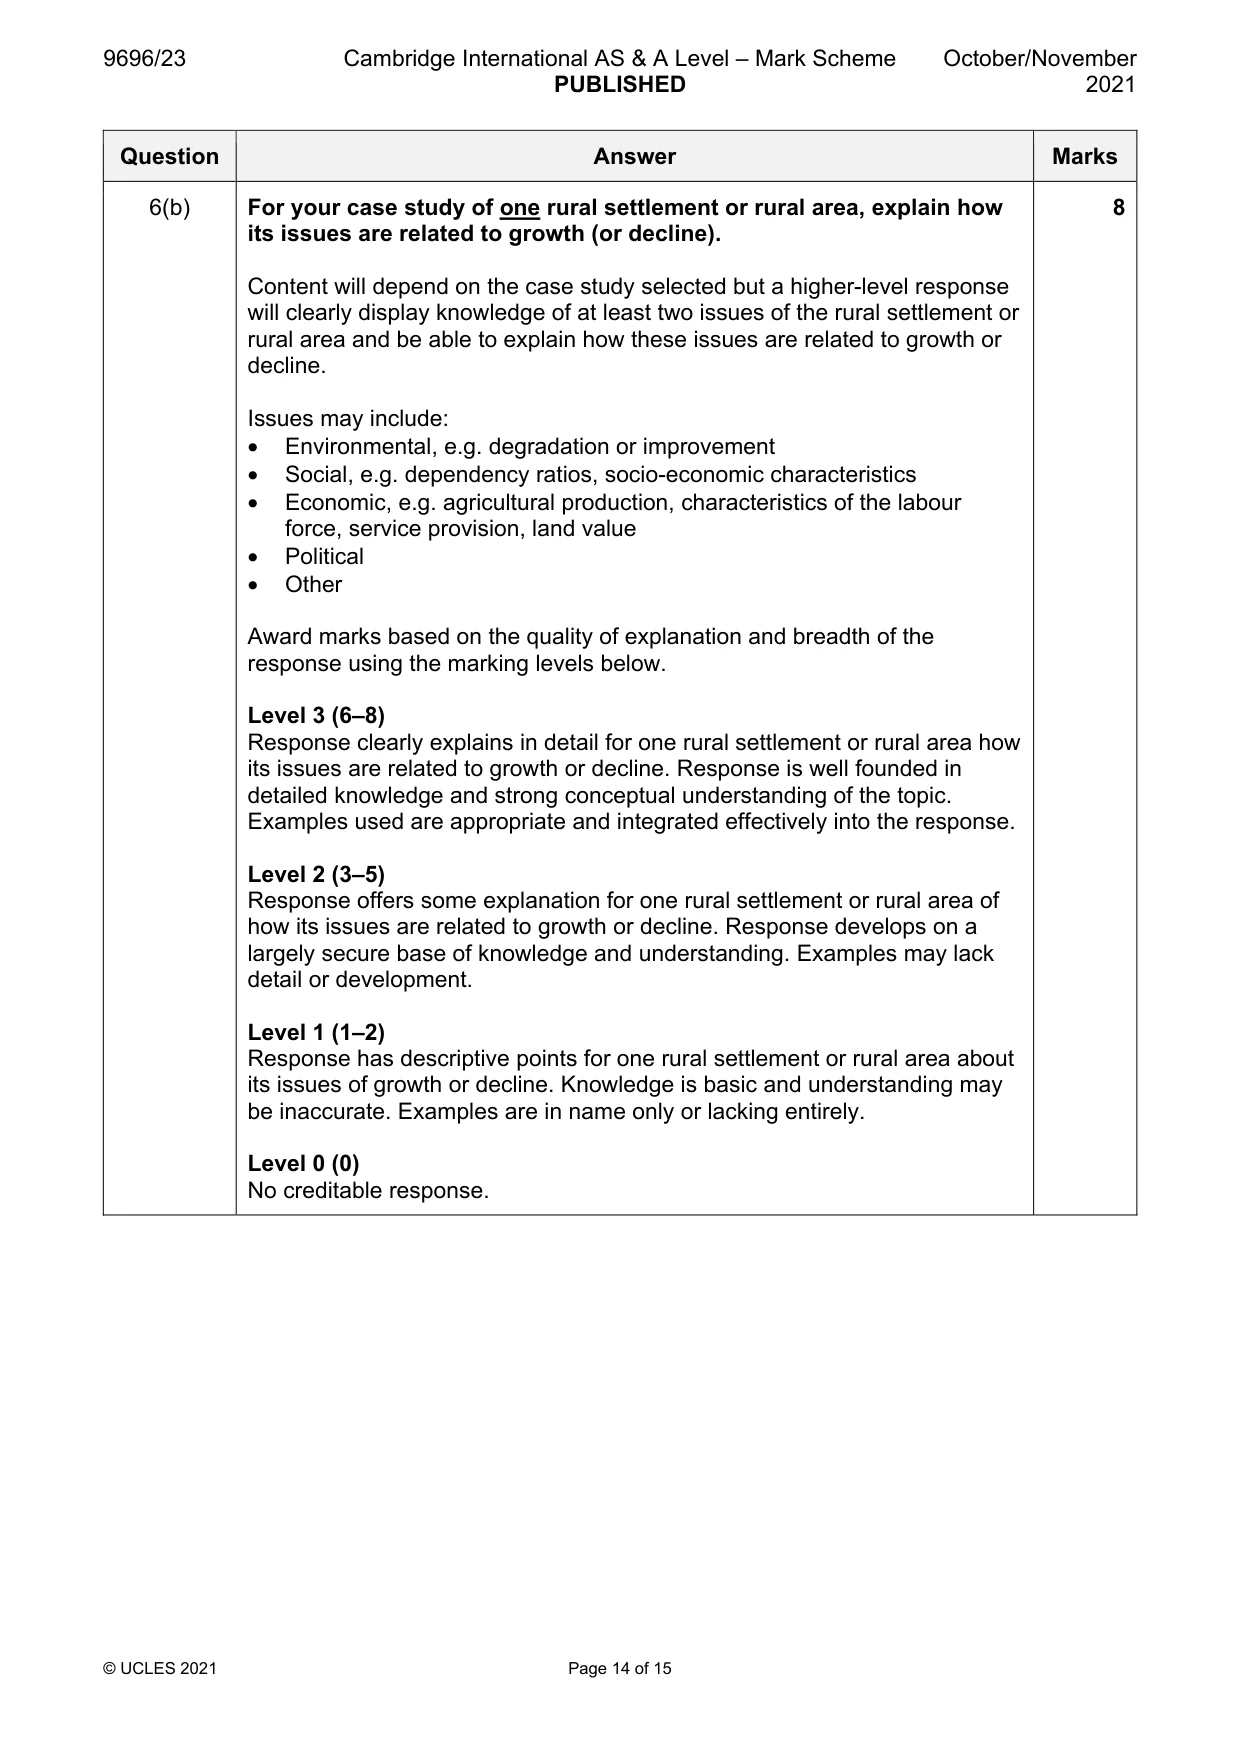
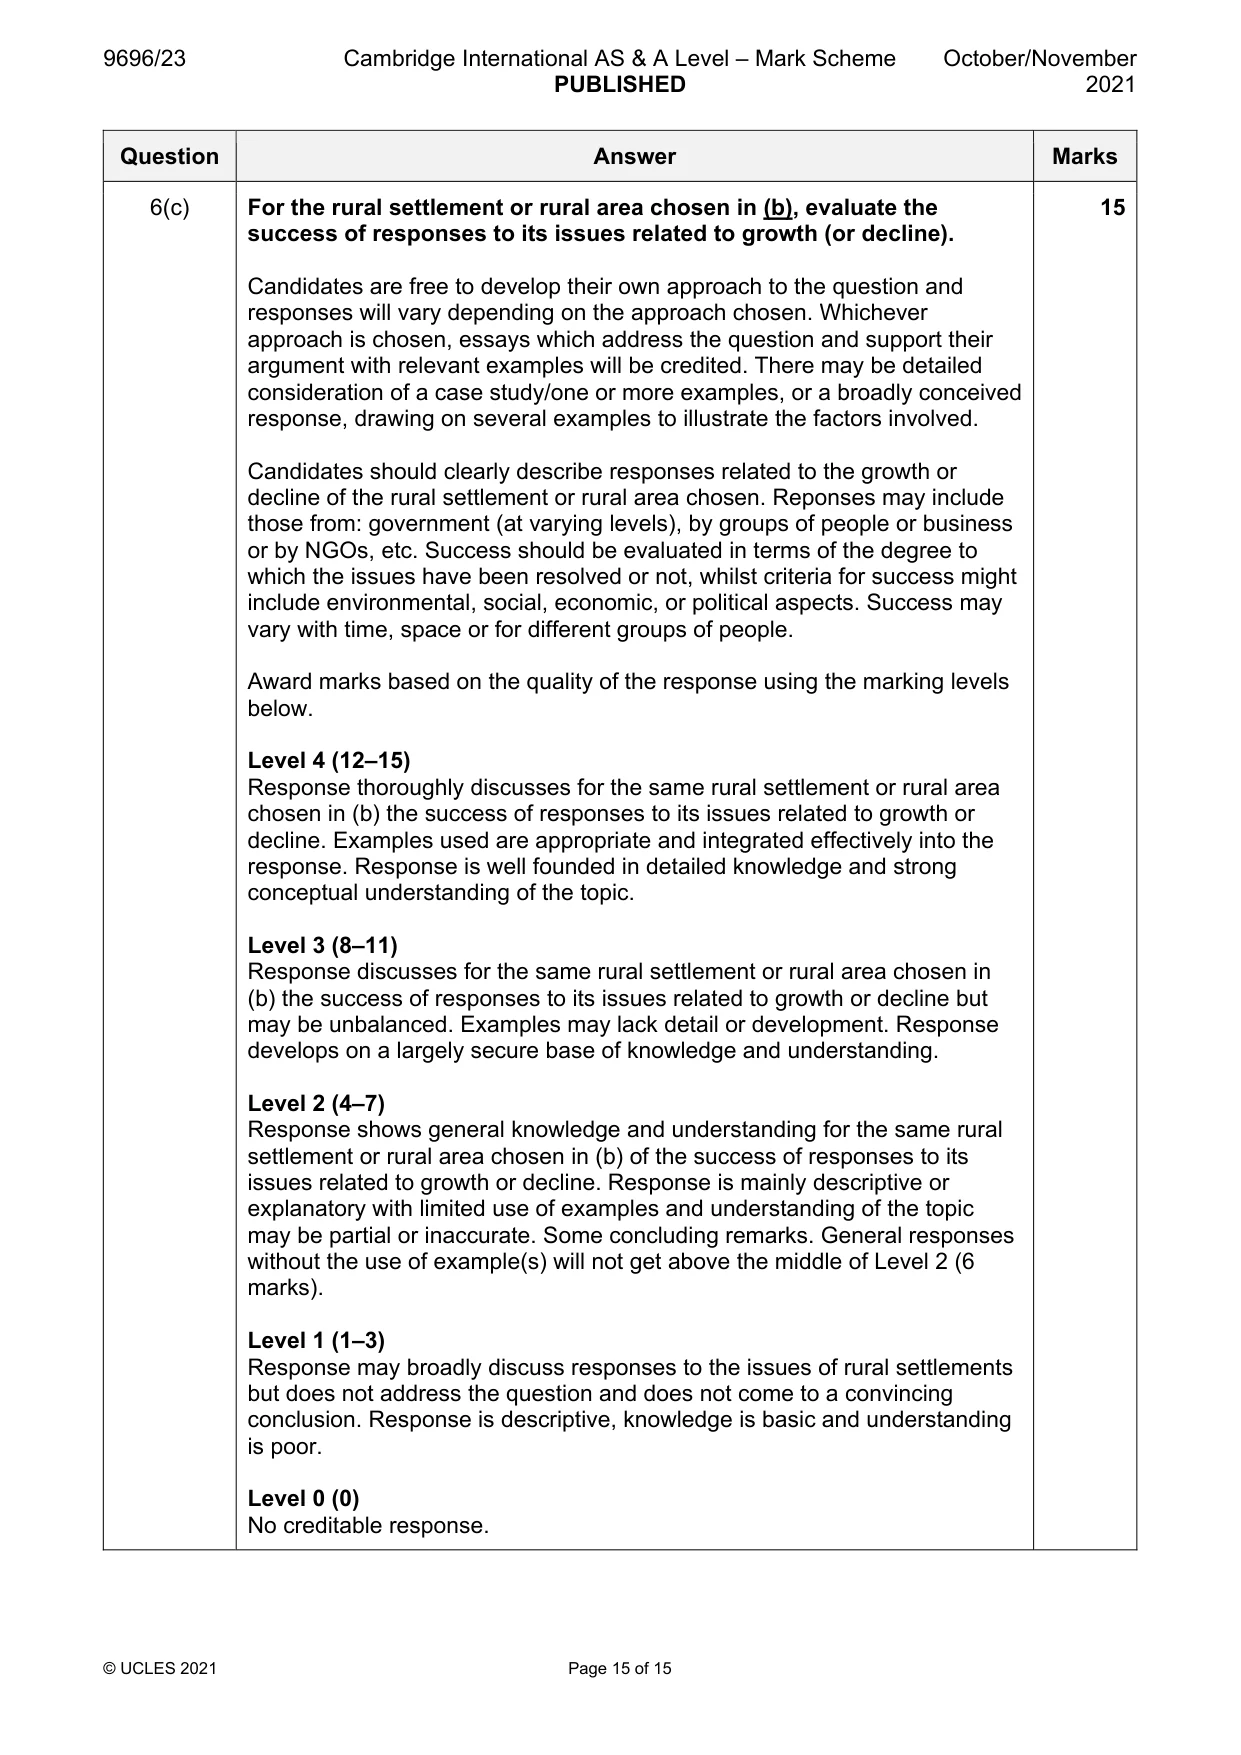
Mark scheme: 6(a) With the aid of examples, explain why the population of some rural 7 areas is increasing. Candidates may offer explanations based on: • Urban‒rural migration • Counterurbanisation • Resource exploitation • Agricultural development • Relocation schemes • Natural increase • More homeworking/internet • Other Maximum 3 marks if no examples. Point mark such that three valid points with development (detail and/or examples) can achieve the maximum. 6(b) For your case study of one rural settlement or rural area, explain how 8 its issues are related to growth (or decline). Content will depend on the case study selected but a higher-level response will clearly display knowledge of at least two issues of the rural settlement or rural area and be able to explain how these issues are related to growth or decline. Issues may include: • Environmental, e.g. degradation or improvement • Social, e.g. dependency ratios, socio-economic characteristics • Economic, e.g. agricultural production, characteristics of the labour force, service provision, land value • Political • Other Award marks based on the quality of explanation and breadth of the response using the marking levels below. Level 3 (6–8) Response clearly explains in detail for one rural settlement or rural area how its issues are related to growth or decline. Response is well founded in detailed knowledge and strong conceptual understanding of the topic. Examples used are appropriate and integrated effectively into the response. Level 2 (3–5) Response offers some explanation for one rural settlement or rural area of how its issues are related to growth or decline. Response develops on a largely secure base of knowledge and understanding. Examples may lack detail or development. Level 1 (1–2) Response has descriptive points for one rural settlement or rural area about its issues of growth or decline. Knowledge is basic and understanding may be inaccurate. Examples are in name only or lacking entirely. Level 0 (0) No creditable response. 6(c) For the rural settlement or rural area chosen in (b), evaluate the 15 success of responses to its issues related to growth (or decline). Candidates are free to develop their own approach to the question and responses will vary depending on the approach chosen. Whichever approach is chosen, essays which address the question and support their argument with relevant examples will be credited. There may be detailed consideration of a case study/one or more examples, or a broadly conceived response, drawing on several examples to illustrate the factors involved. Candidates should clearly describe responses related to the growth or decline of the rural settlement or rural area chosen. Reponses may include those from: government (at varying levels), by groups of people or business or by NGOs, etc. Success should be evaluated in terms of the degree to which the issues have been resolved or not, whilst criteria for success might include environmental, social, economic, or political aspects. Success may vary with time, space or for different groups of people. Award marks based on the quality of the response using the marking levels below. Level 4 (12–15) Response thoroughly discusses for the same rural settlement or rural area chosen in (b) the success of responses to its issues related to growth or decline. Examples used are appropriate and integrated effectively into the response. Response is well founded in detailed knowledge and strong conceptual understanding of the topic. Level 3 (8–11) Response discusses for the same rural settlement or rural area chosen in (b) the success of responses to its issues related to growth or decline but may be unbalanced. Examples may lack detail or development. Response develops on a largely secure base of knowledge and understanding. Level 2 (4–7) Response shows general knowledge and understanding for the same rural settlement or rural area chosen in (b) of the success of responses to its issues related to growth or decline. Response is mainly descriptive or explanatory with limited use of examples and understanding of the topic may be partial or inaccurate. Some concluding remarks. General responses without the use of example(s) will not get above the middle of Level 2 (6 marks). Level 1 (1–3) Response may broadly discuss responses to the issues of rural settlements but does not address the question and does not come to a convincing conclusion. Response is descriptive, knowledge is basic and understanding is poor. Level 0 (0) No creditable response.
What was in this paper
The subtopics covered by these 6 questions, and how many questions each got. Open one in a new tab to see every Cambridge question on it.
What you needed in this session
Cambridge’s own grade thresholds for 2021 Oct/Nov, Paper 2 · Variant 3. A higher threshold means an easier paper — the bar moves with how the cohort did.