Cambridge A Level Geography 9696 — 2021 May/June Paper 2 · Variant 1
9696/21/M/J/21 · 6 questions · 60 marks · ≈68 min
The question paper and its mark scheme, free to read here and free to download. This is Cambridge’s own paper, exactly as it was sat.
Question paper4 pages


Mark scheme17 pages
Answers below. Sit the paper first if you are practising.








Questions as text
Q1 · Total fertility rate (TFR) for Brazil, an MIC in South America, between 1960 and 2015
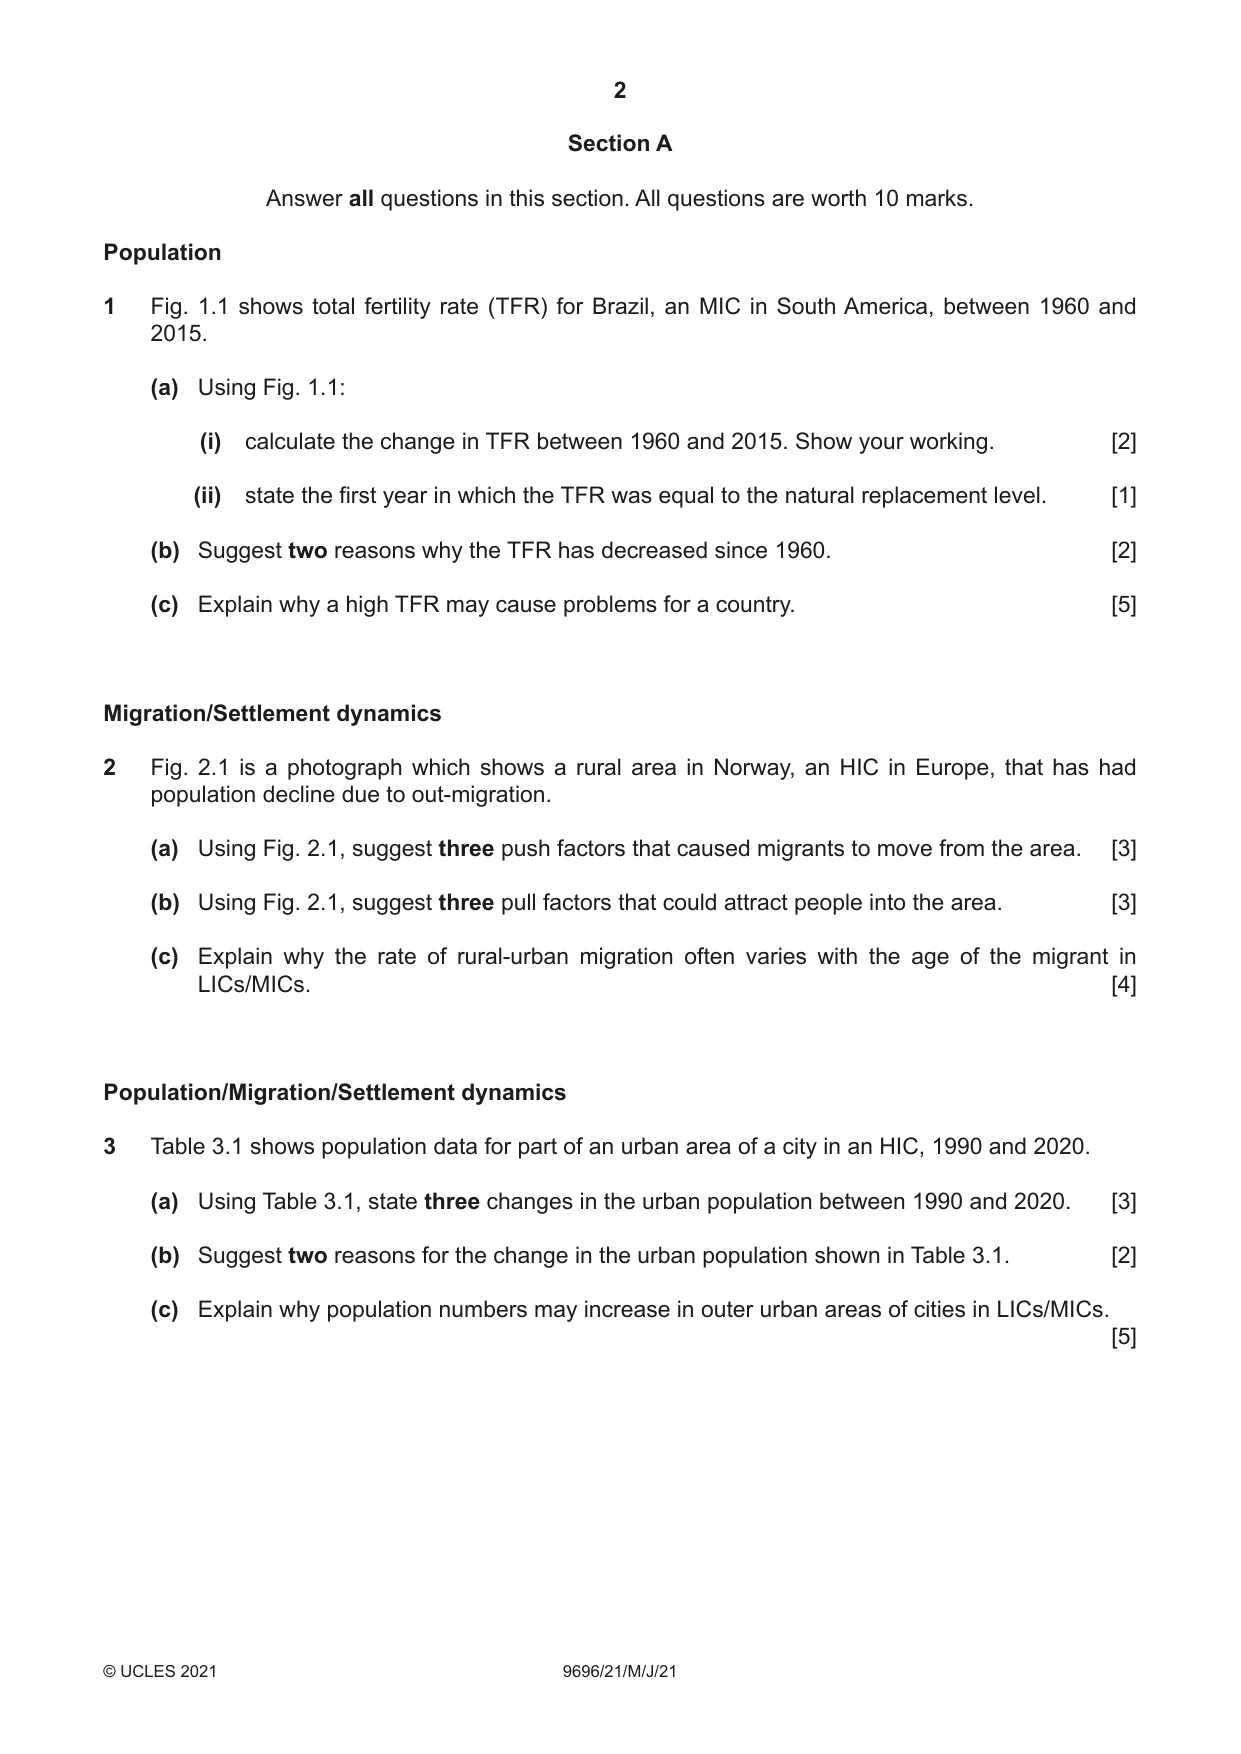
1 Fig. 1.1 shows total fertility rate (TFR) for Brazil, an MIC in South America, between 1960 and 2015. (a) Using Fig. 1.1: (i) calculate the change in TFR between 1960 and 2015. Show your working. [2] (ii) state the first year in which the TFR was equal to the natural replacement level. [1] (b) Suggest two reasons why the TFR has decreased since 1960. [2] (c) Explain why a high TFR may cause problems for a country. [5] Migration/Settlement dynamics
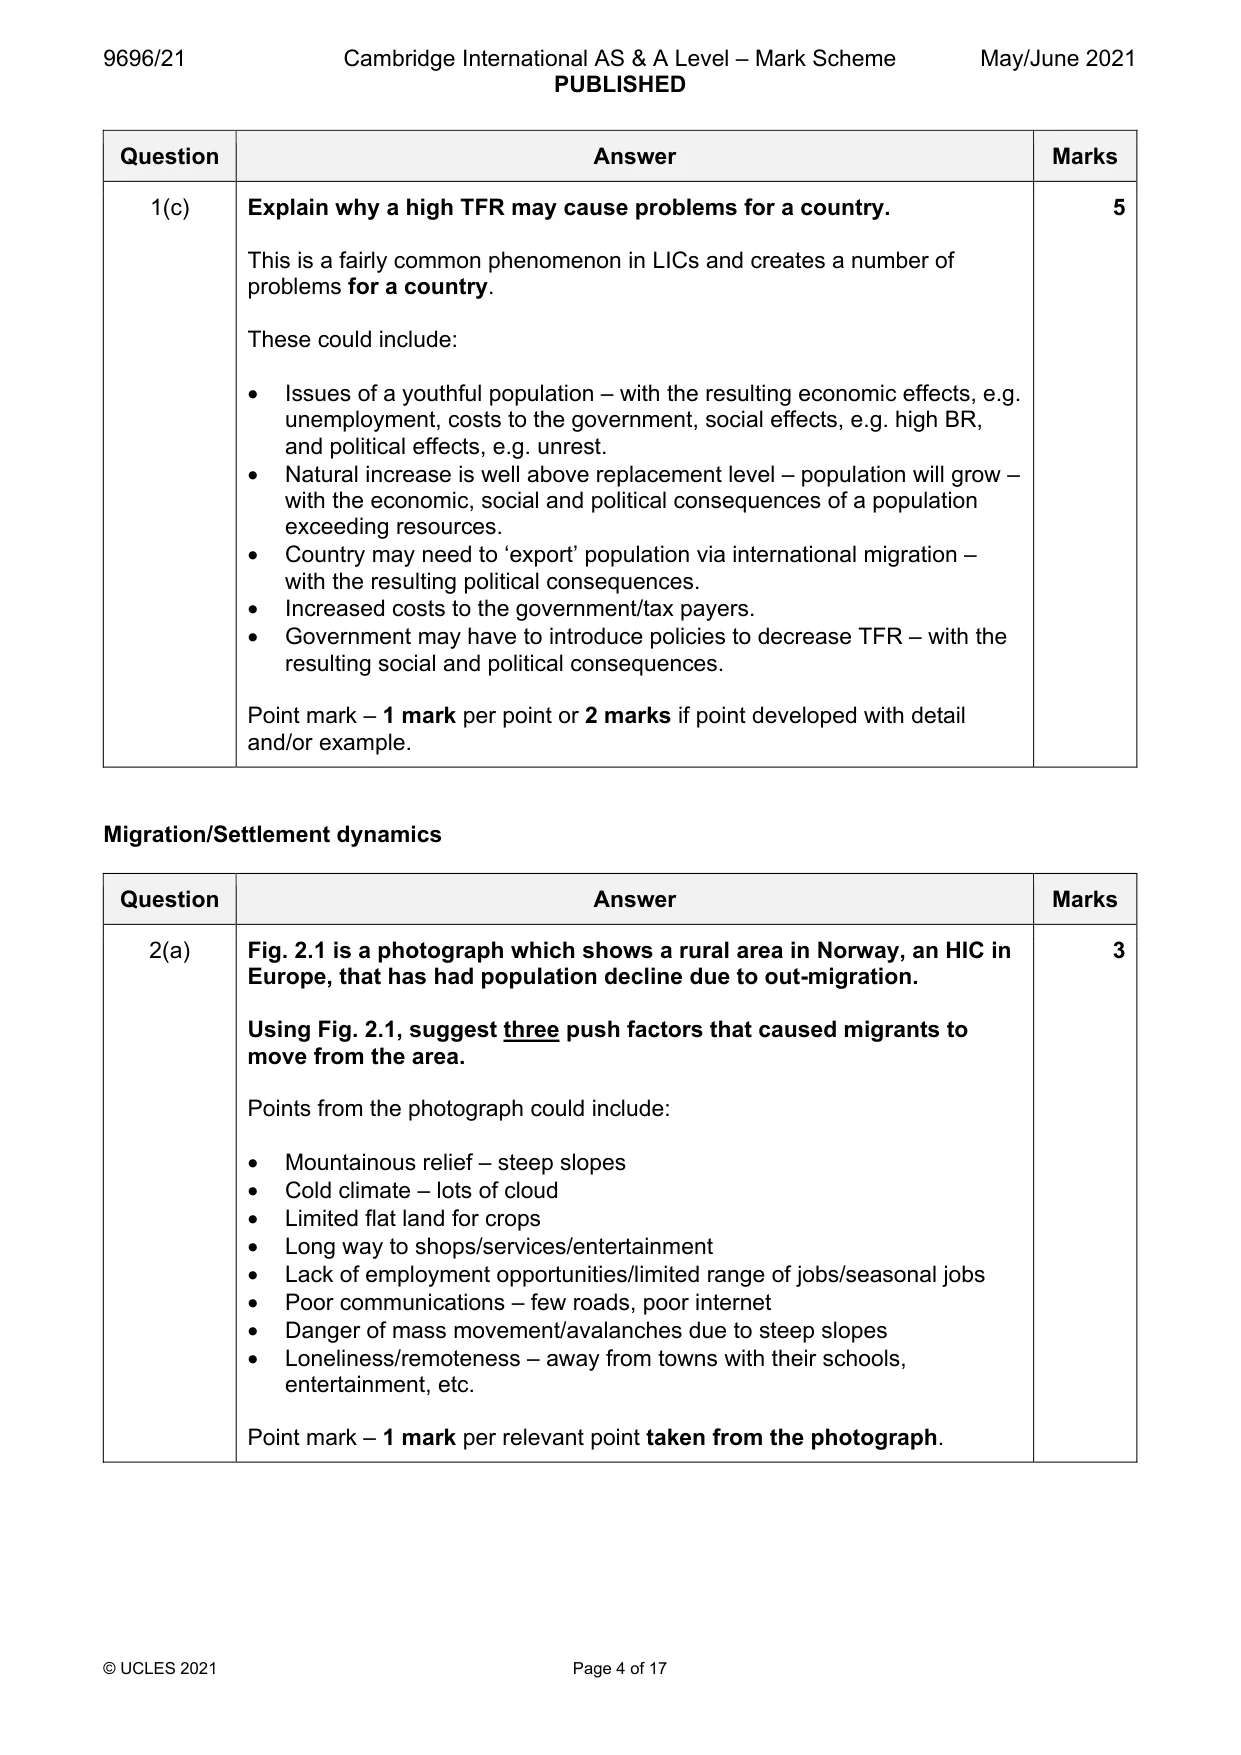
Mark scheme: Question Answer Marks 1(a)(i) Fig. 1.1 shows total fertility rate (TFR) for Brazil, an MIC in South 2 America, between 1960 and 2015. Using Fig. 1.1: calculate the change in TFR between 1960 and 2015. Show your working. 6.1–1.7 (1) a decrease of 4.4 (1) – no need to say decrease for the mark. 1(a)(ii) Using Fig. 1.1: state the first year in which the TFR was equal to the 1 natural replacement level. 2003 1(b) Suggest two reasons why the TFR has decreased since 1960. 2 1 mark per appropriate reason for decreased TFR. Reasons could include: • Less need to offset high child mortality as this has decreased • Changes in cultural/religious norms/expectations • Greater number of women work • Greater use of birth control • Increased female education/emancipation • Children are seen as economic liabilities/less need for children to work or support elders • Government anti-natal policy 1(c) Explain why a high TFR may cause problems for a country. 5 This is a fairly common phenomenon in LICs and creates a number of problems for a country. These could include: • Issues of a youthful population – with the resulting economic effects, e.g. unemployment, costs to the government, social effects, e.g. high BR, and political effects, e.g. unrest. • Natural increase is well above replacement level – population will grow – with the economic, social and political consequences of a population exceeding resources. • Country may need to ‘export’ population via international migration – with the resulting political consequences. • Increased costs to the government/tax payers. • Government may have to introduce policies to decrease TFR – with the resulting social and political consequences. Point mark – 1 mark per point or 2 marks if point developed with detail and/or example. Migration/Settlement dynamics
Q2 · A photograph which shows a rural area in Norway, an HIC in Europe, that has had…
2 Fig. 2.1 is a photograph which shows a rural area in Norway, an HIC in Europe, that has had population decline due to out-migration. (a) Using Fig. 2.1, suggest three push factors that caused migrants to move from the area. [3] (b) Using Fig. 2.1, suggest three pull factors that could attract people into the area. [3] (c) Explain why the rate of rural-urban migration often varies with the age of the migrant in LICs/MICs. [4] Population/Migration/Settlement dynamics
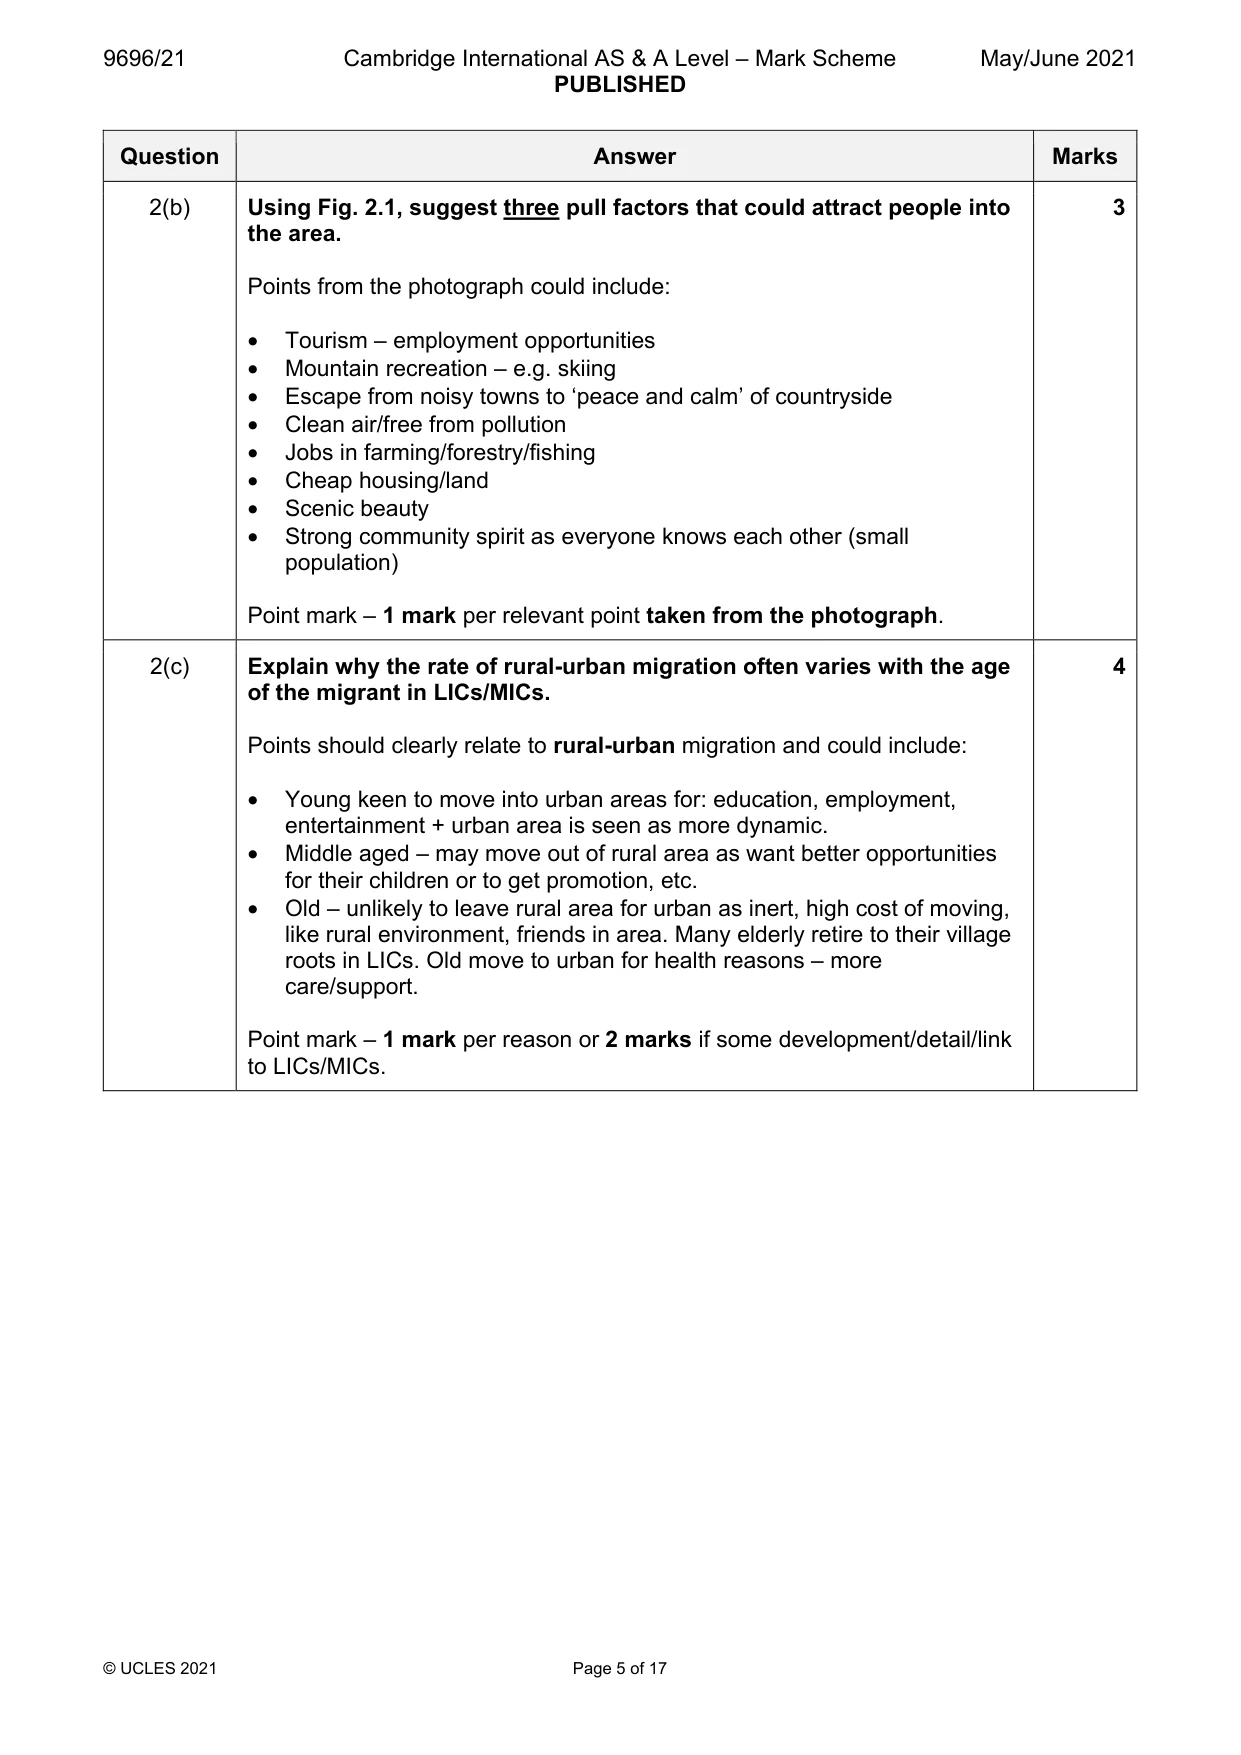
Mark scheme: 2(a) Fig. 2.1 is a photograph which shows a rural area in Norway, an HIC in 3 Europe, that has had population decline due to out-migration. Using Fig. 2.1, suggest three push factors that caused migrants to move from the area. Points from the photograph could include: • Mountainous relief – steep slopes • Cold climate – lots of cloud • Limited flat land for crops • Long way to shops/services/entertainment • Lack of employment opportunities/limited range of jobs/seasonal jobs • Poor communications – few roads, poor internet • Danger of mass movement/avalanches due to steep slopes • Loneliness/remoteness – away from towns with their schools, entertainment, etc. Point mark – 1 mark per relevant point taken from the photograph. 2(b) Using Fig. 2.1, suggest three pull factors that could attract people into 3 the area. Points from the photograph could include: • Tourism – employment opportunities • Mountain recreation – e.g. skiing • Escape from noisy towns to ‘peace and calm’ of countryside • Clean air/free from pollution • Jobs in farming/forestry/fishing • Cheap housing/land • Scenic beauty • Strong community spirit as everyone knows each other (small population) Point mark – 1 mark per relevant point taken from the photograph. 2(c) Explain why the rate of rural-urban migration often varies with the age 4 of the migrant in LICs/MICs. Points should clearly relate to rural-urban migration and could include: • Young keen to move into urban areas for: education, employment, entertainment + urban area is seen as more dynamic. • Middle aged – may move out of rural area as want better opportunities for their children or to get promotion, etc. • Old – unlikely to leave rural area for urban as inert, high cost of moving, like rural environment, friends in area. Many elderly retire to their village roots in LICs. Old move to urban for health reasons – more care/support. Point mark – 1 mark per reason or 2 marks if some development/detail/link to LICs/MICs. Population/Migration/Settlement dynamics
Q3 · Population data for part of an urban area of a city in an HIC, 1990 and 2020
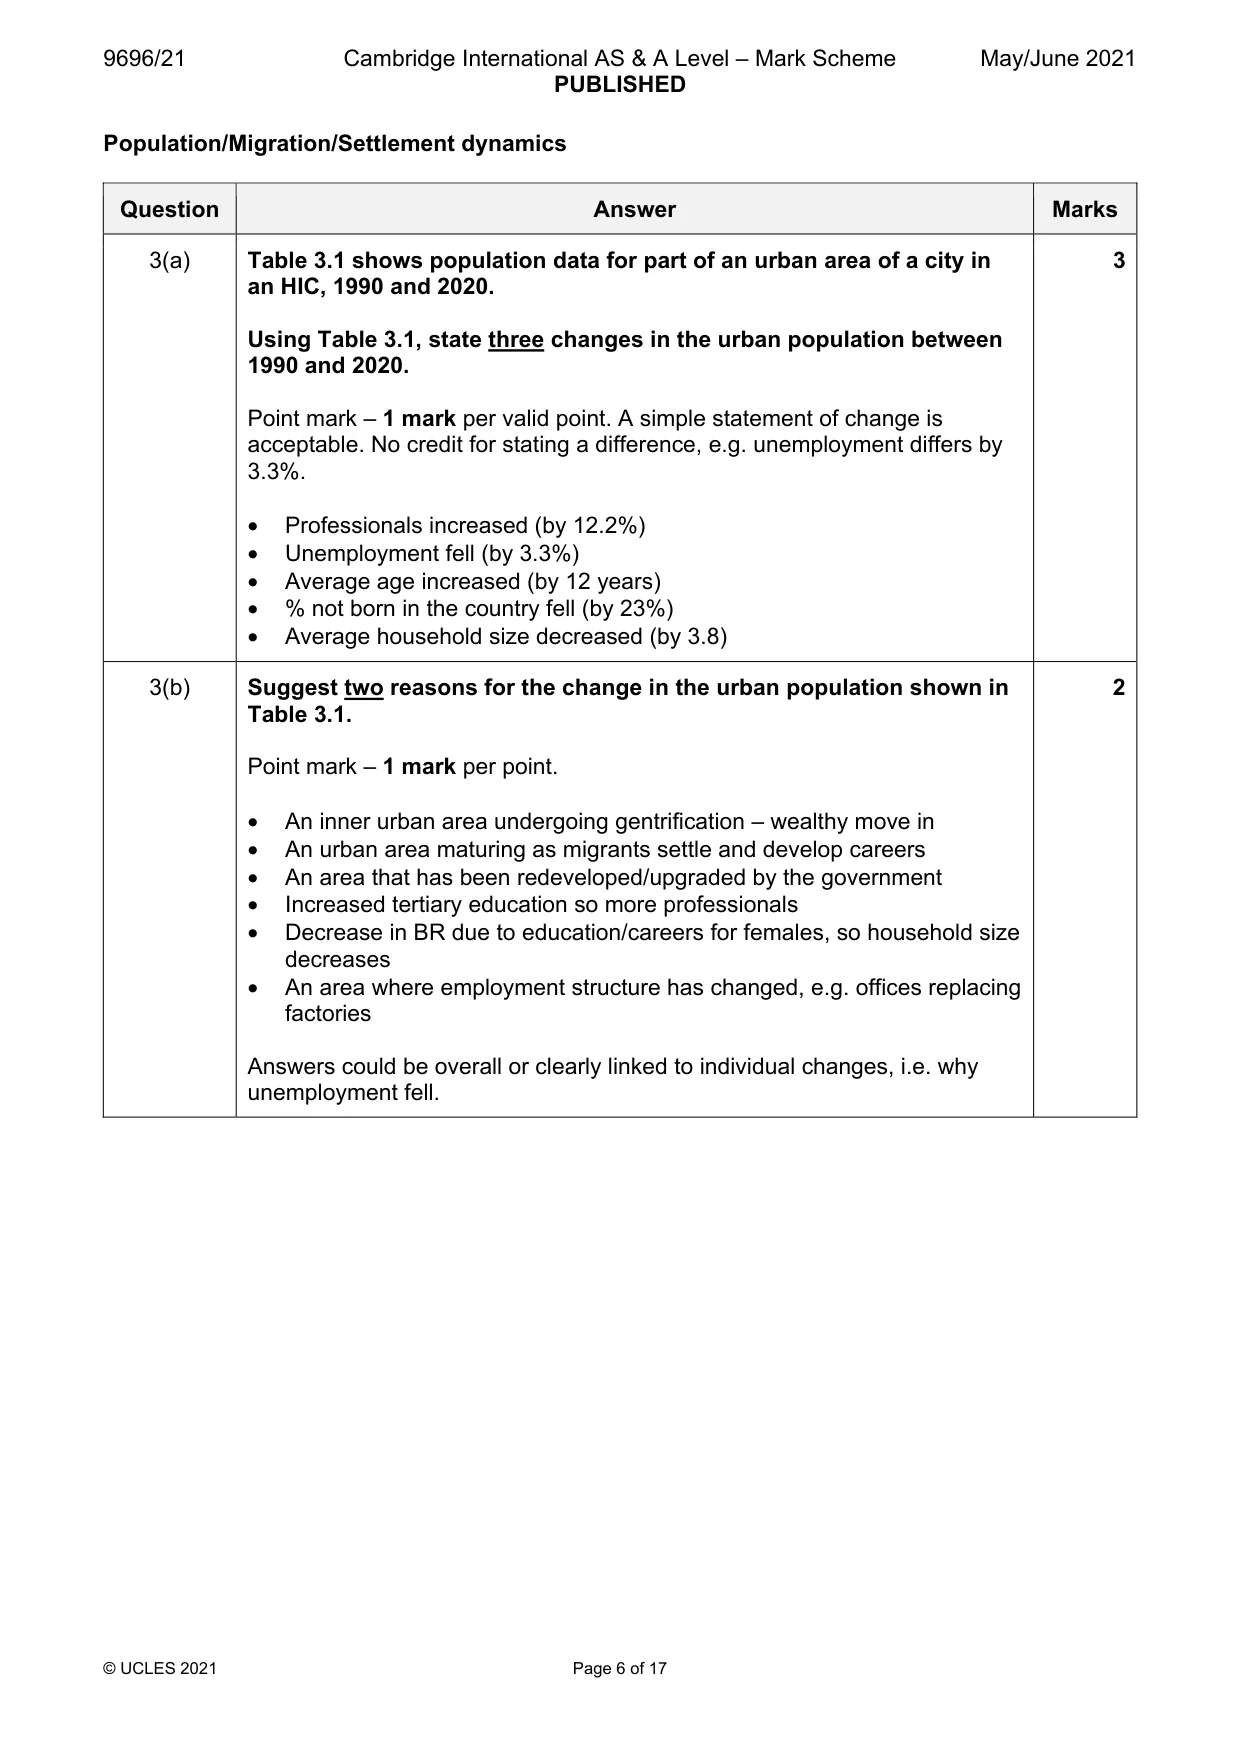
3 Table 3.1 shows population data for part of an urban area of a city in an HIC, 1990 and 2020. (a) Using Table 3.1, state three changes in the urban population between 1990 and 2020. [3] (b) Suggest two reasons for the change in the urban population shown in Table 3.1. [2] (c) Explain why population numbers may increase in outer urban areas of cities in LICs/MICs. [5]
Mark scheme: 3(a) Table 3.1 shows population data for part of an urban area of a city in 3 an HIC, 1990 and 2020. Using Table 3.1, state three changes in the urban population between 1990 and 2020. Point mark – 1 mark per valid point. A simple statement of change is acceptable. No credit for stating a difference, e.g. unemployment differs by 3.3%. • Professionals increased (by 12.2%) • Unemployment fell (by 3.3%) • Average age increased (by 12 years) • % not born in the country fell (by 23%) • Average household size decreased (by 3.8) 3(b) Suggest two reasons for the change in the urban population shown in 2 Table 3.1. Point mark – 1 mark per point. • An inner urban area undergoing gentrification – wealthy move in • An urban area maturing as migrants settle and develop careers • An area that has been redeveloped/upgraded by the government • Increased tertiary education so more professionals • Decrease in BR due to education/careers for females, so household size decreases • An area where employment structure has changed, e.g. offices replacing factories Answers could be overall or clearly linked to individual changes, i.e. why unemployment fell. 3(c) Explain why population numbers may increase in outer urban areas of 5 cities in LICs/MICs. Point mark with 1 mark per point or 2 marks if point developed (linking to LICs/MICs) to max. 5. Reasons could include: • Continued rural-urban migration creating high density housing on urban fringe (shanty towns) • Higher rates of natural increase in outer areas as more youthful population • Movement out from inner areas of industry, wholesalers, etc., to find more space (or lower costs) which pulls workers with it • Government planning or policies such as redevelopment of inner areas • Pushes from inner areas, e.g. pollution, congestion • Pulls of cheaper land, less pollution, more open space Max. 4 if no link to LICs/MICs. Section B Answer one question from this section. All questions are worth 30 marks. Population
Q4 · Describe how to calculate dependency ratio
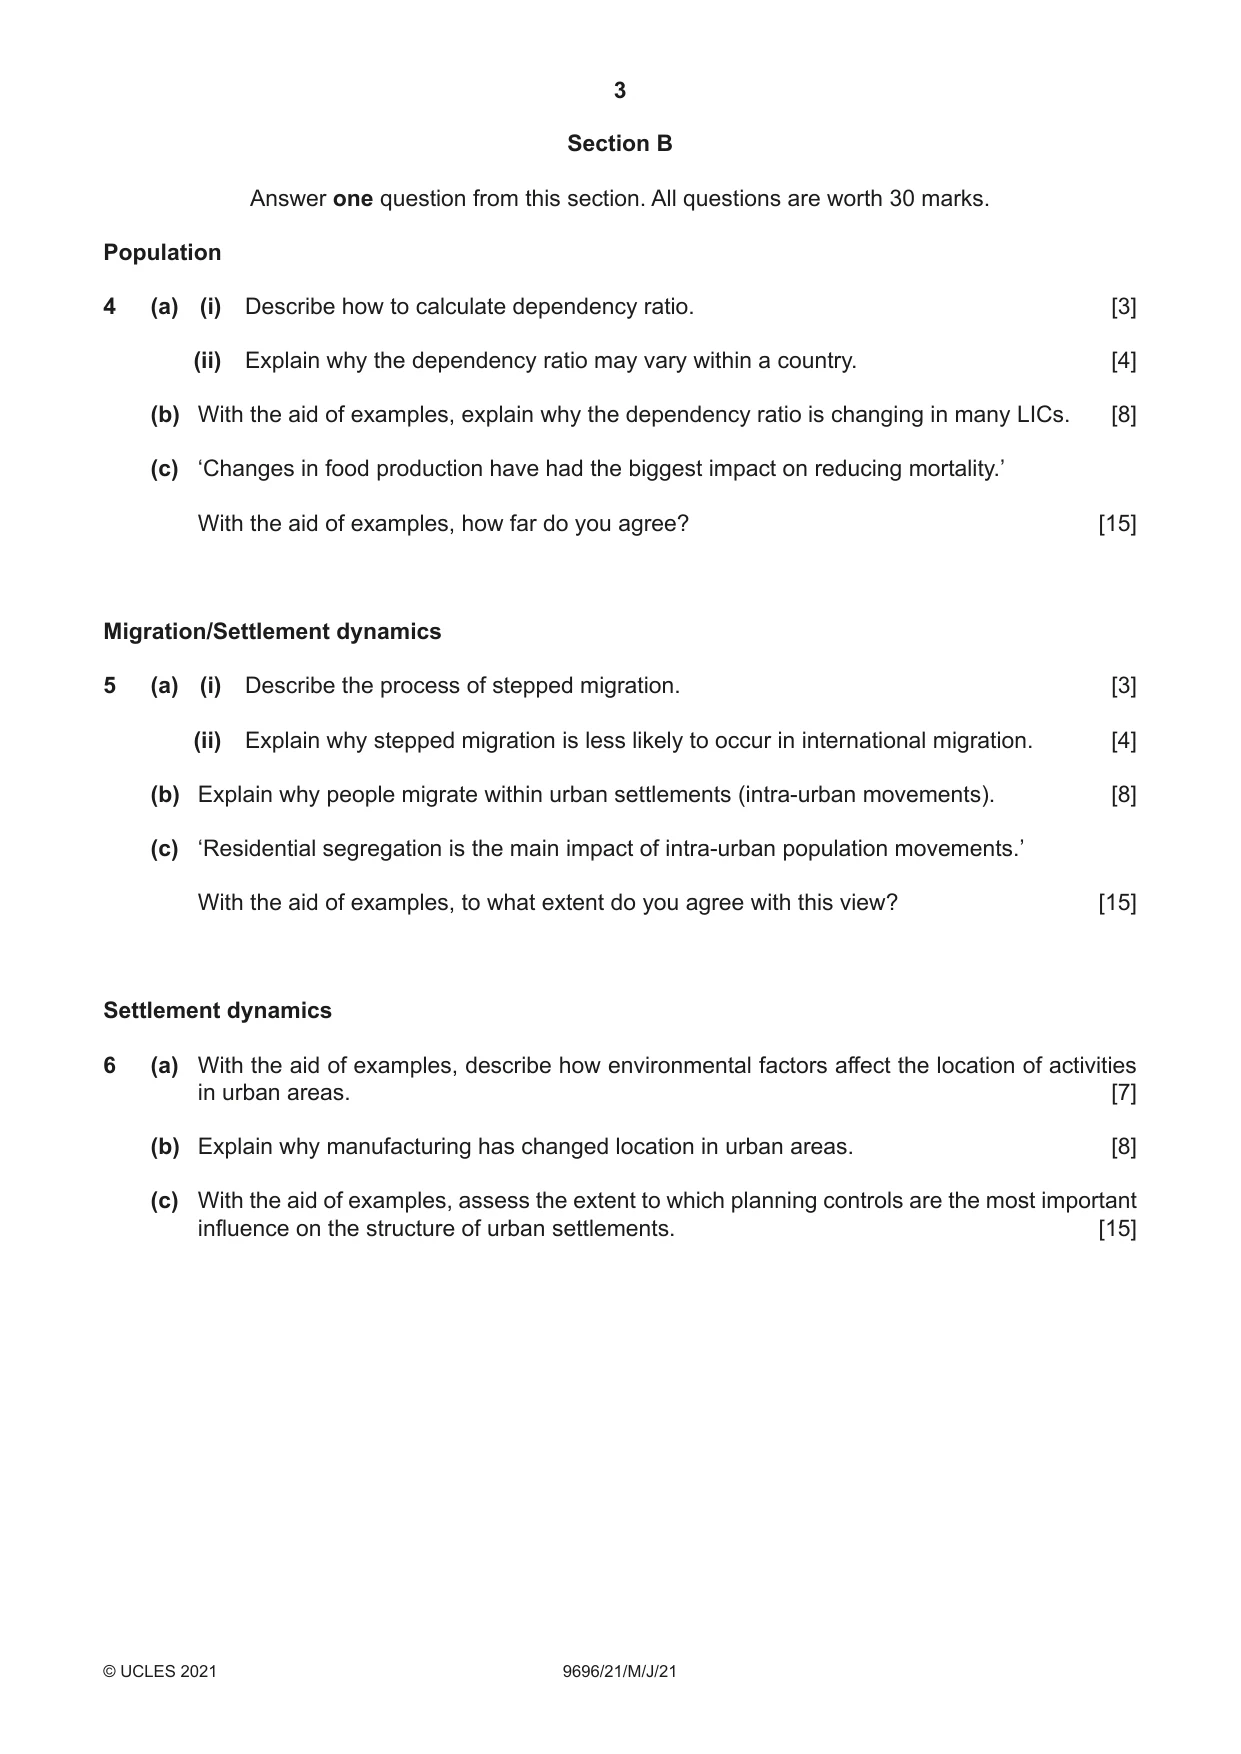
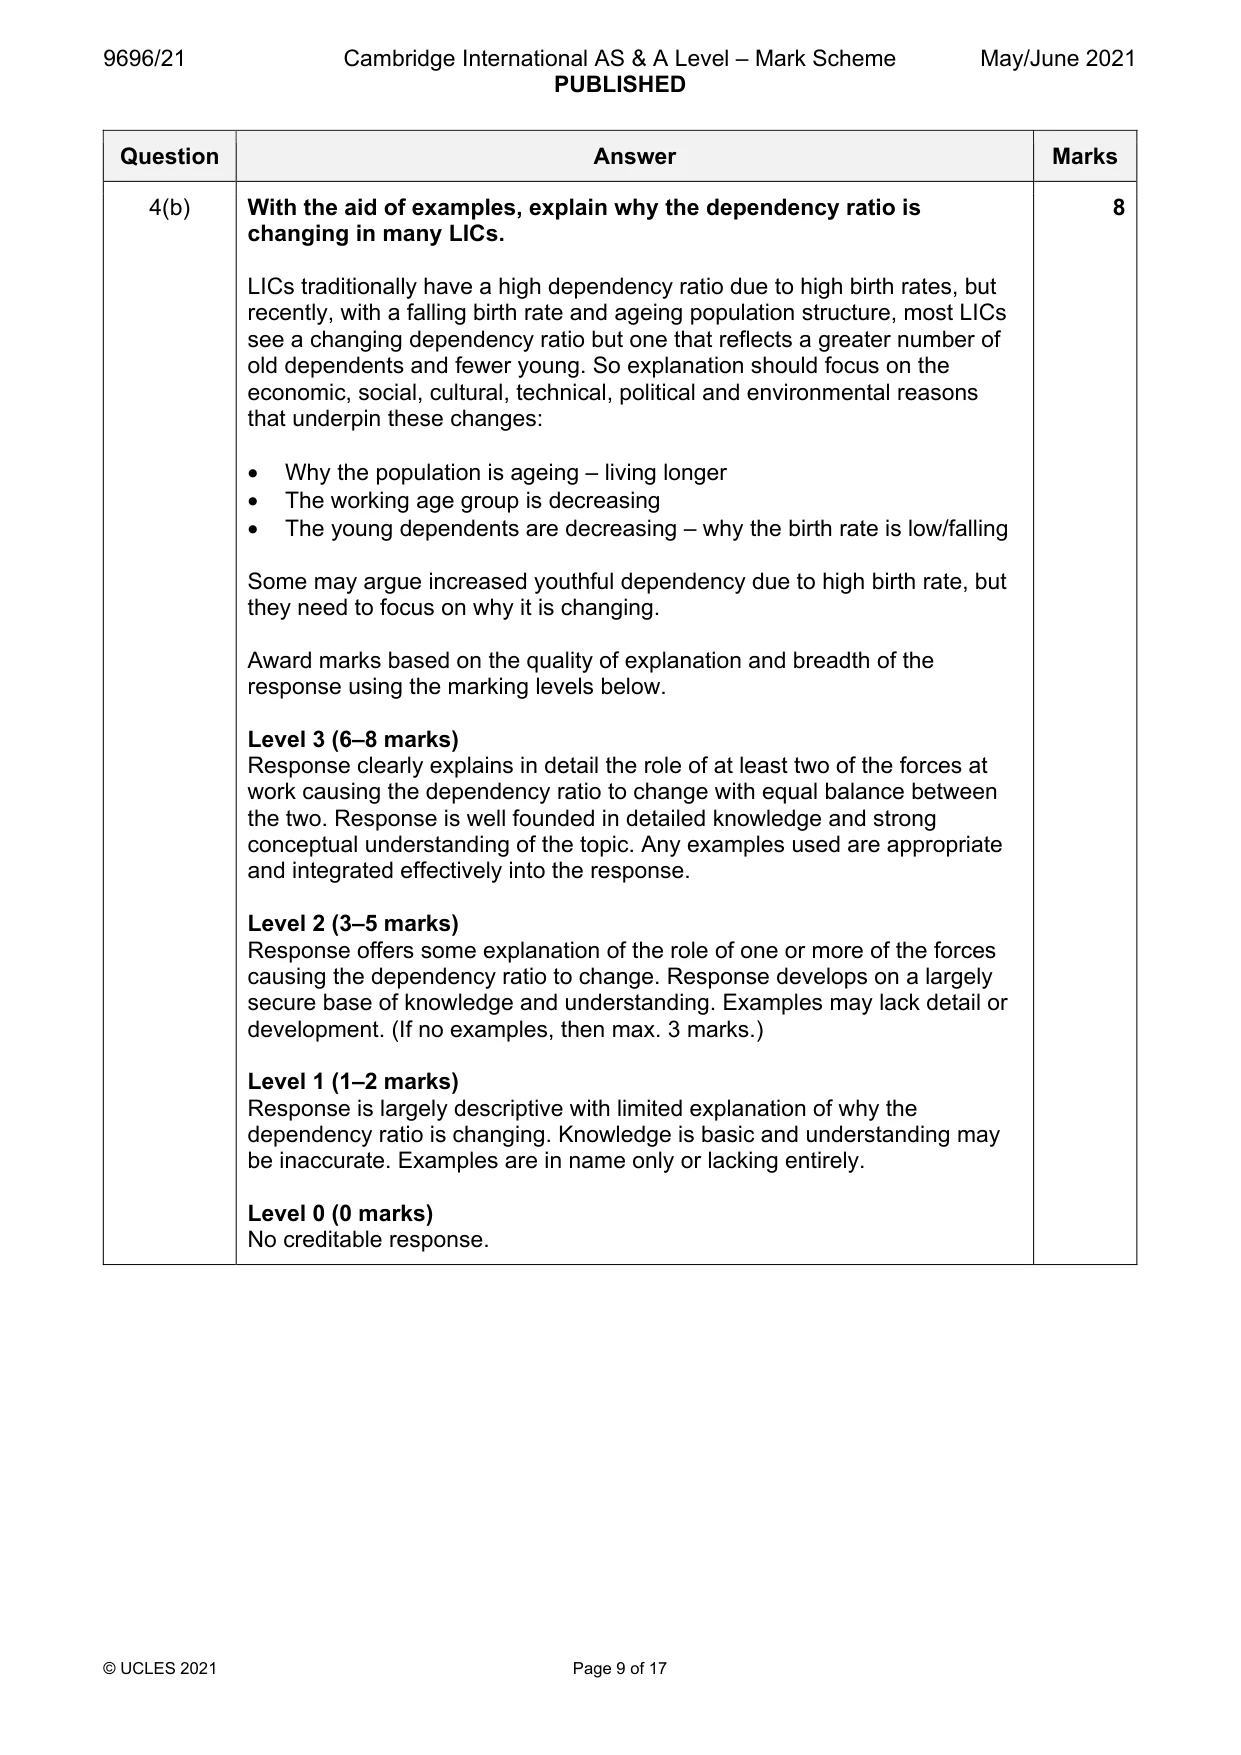
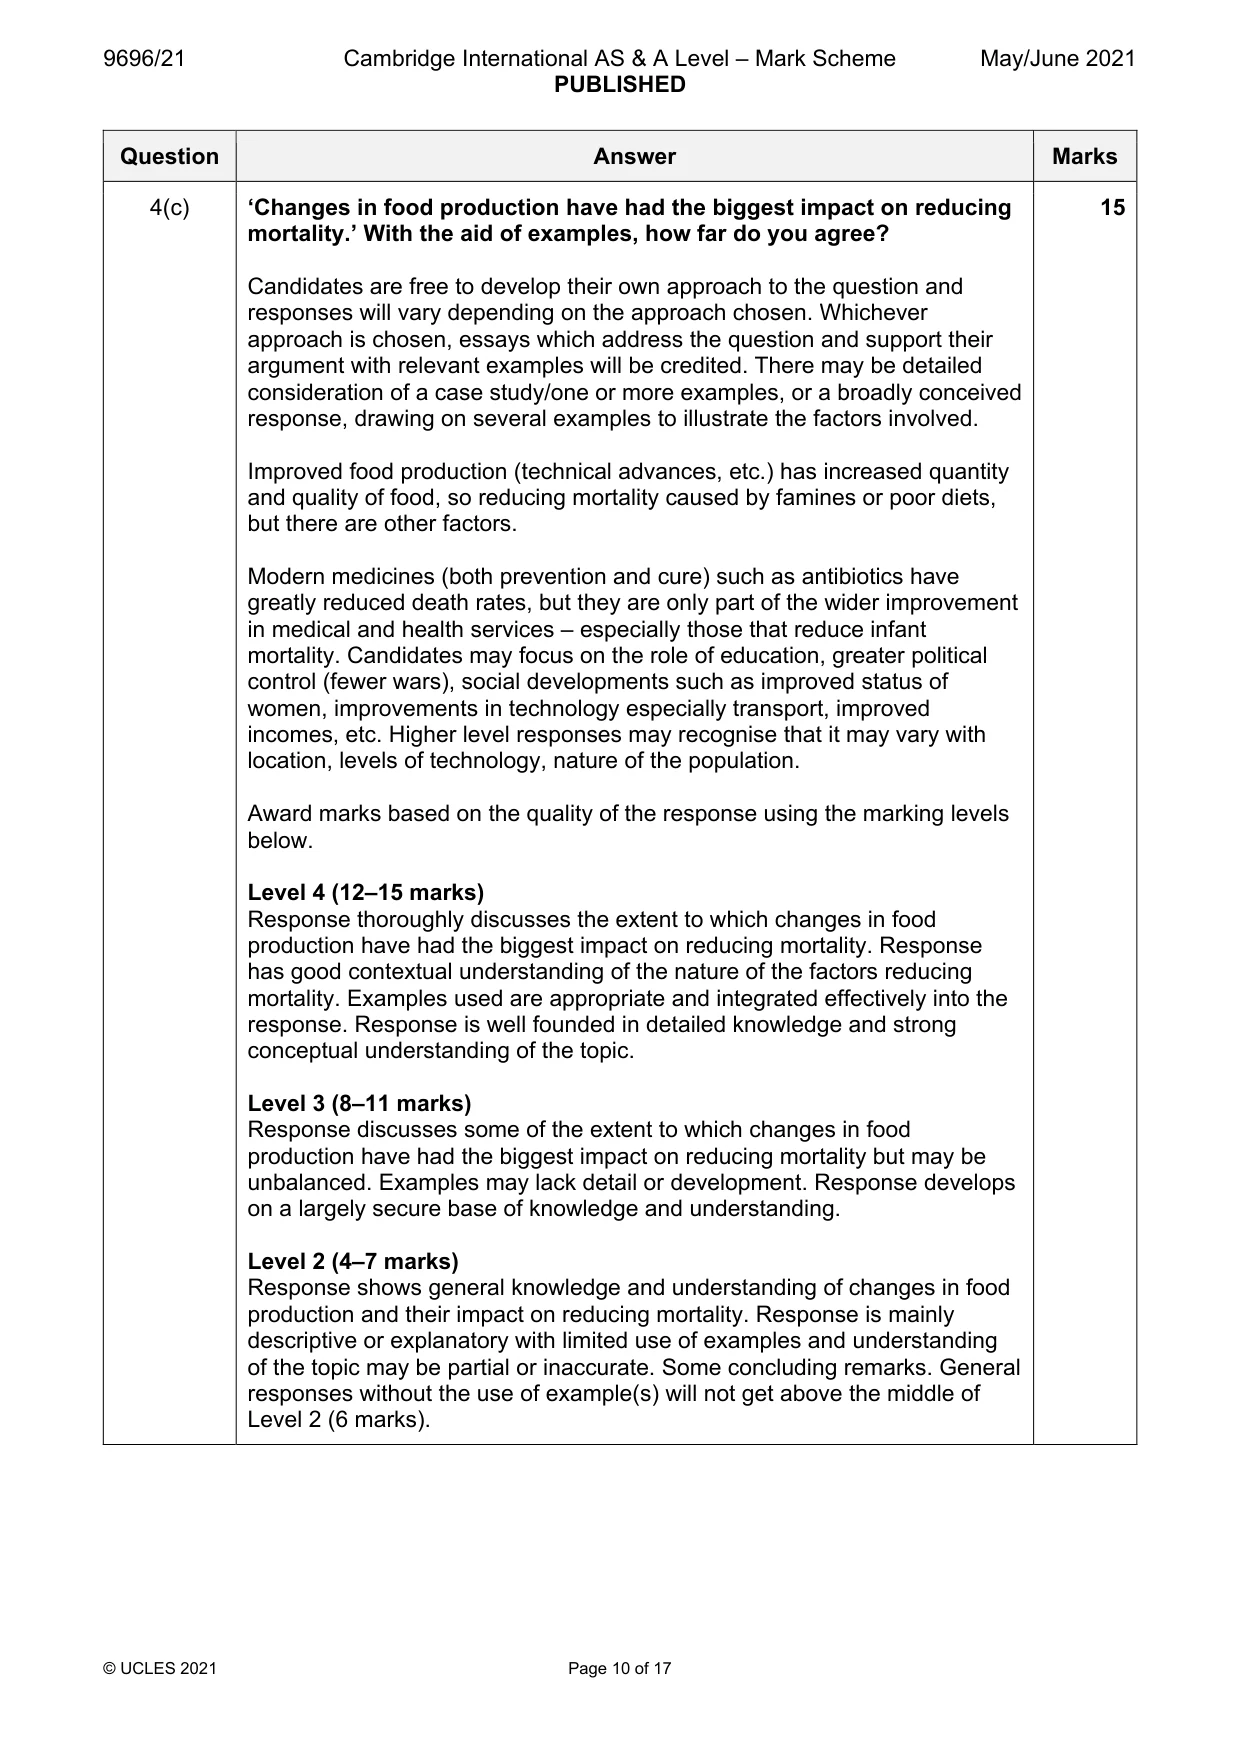
4 (a) (i) Describe how to calculate dependency ratio. [3] (ii) Explain why the dependency ratio may vary within a country. [4] (b) With the aid of examples, explain why the dependency ratio is changing in many LICs. [8] (c) ‘Changes in food production have had the biggest impact on reducing mortality.’ With the aid of examples, how far do you agree? [15] Migration/Settlement dynamics
Mark scheme: 4(a)(i) Describe how to calculate dependency ratio. 3 The ratio can be calculated as: Dependency Ratio = (Number of dependents (young + old) / Working population aged (15 / 16 to 60 / 64) × 100% [ 2 marks – 3 marks if dependents’ ages added] 4(a)(ii) Explain why the dependency ratio may vary within a country. 4 Stress is on variation within a country. Max. 2 if generic and not clearly within a country. Comparing countries is not acceptable. • Difference in numbers in the different age groups • Difference between rural areas and urban areas (rural may have more young and old dependents) • Retirement areas (especially coastal) may attract older dependents • Variation in health care – where it is poor, high IMR • Type of activity – industrial areas may have fewer dependents • University towns (or military towns) may have more young dependents • Location – remote areas compared to more central areas Point mark – 1 mark per point with additional mark for development, such as examples. 4(b) With the aid of examples, explain why the dependency ratio is 8 changing in many LICs. LICs traditionally have a high dependency ratio due to high birth rates, but recently, with a falling birth rate and ageing population structure, most LICs see a changing dependency ratio but one that reflects a greater number of old dependents and fewer young. So explanation should focus on the economic, social, cultural, technical, political and environmental reasons that underpin these changes: • Why the population is ageing – living longer • The working age group is decreasing • The young dependents are decreasing – why the birth rate is low/falling Some may argue increased youthful dependency due to high birth rate, but they need to focus on why it is changing. Award marks based on the quality of explanation and breadth of the response using the marking levels below. Level 3 (6–8 marks) Response clearly explains in detail the role of at least two of the forces at work causing the dependency ratio to change with equal balance between the two. Response is well founded in detailed knowledge and strong conceptual understanding of the topic. Any examples used are appropriate and integrated effectively into the response. Level 2 (3–5 marks) Response offers some explanation of the role of one or more of the forces causing the dependency ratio to change. Response develops on a largely secure base of knowledge and understanding. Examples may lack detail or development. (If no examples, then max. 3 marks.) Level 1 (1–2 marks) Response is largely descriptive with limited explanation of why the dependency ratio is changing. Knowledge is basic and understanding may be inaccurate. Examples are in name only or lacking entirely. Level 0 (0 marks) No creditable response. 4(c) ‘Changes in food production have had the biggest impact on reducing 15 mortality.’ With the aid of examples, how far do you agree? Candidates are free to develop their own approach to the question and responses will vary depending on the approach chosen. Whichever approach is chosen, essays which address the question and support their argument with relevant examples will be credited. There may be detailed consideration of a case study/one or more examples, or a broadly conceived response, drawing on several examples to illustrate the factors involved. Improved food production (technical advances, etc.) has increased quantity and quality of food, so reducing mortality caused by famines or poor diets, but there are other factors. Modern medicines (both prevention and cure) such as antibiotics have greatly reduced death rates, but they are only part of the wider improvement in medical and health services – especially those that reduce infant mortality. Candidates may focus on the role of education, greater political control (fewer wars), social developments such as improved status of women, improvements in technology especially transport, improved incomes, etc. Higher level responses may recognise that it may vary with location, levels of technology, nature of the population. Award marks based on the quality of the response using the marking levels below. Level 4 (12–15 marks) Response thoroughly discusses the extent to which changes in food production have had the biggest impact on reducing mortality. Response has good contextual understanding of the nature of the factors reducing mortality. Examples used are appropriate and integrated effectively into the response. Response is well founded in detailed knowledge and strong conceptual understanding of the topic. Level 3 (8–11 marks) Response discusses some of the extent to which changes in food production have had the biggest impact on reducing mortality but may be unbalanced. Examples may lack detail or development. Response develops on a largely secure base of knowledge and understanding. Level 2 (4–7 marks) Response shows general knowledge and understanding of changes in food production and their impact on reducing mortality. Response is mainly descriptive or explanatory with limited use of examples and understanding of the topic may be partial or inaccurate. Some concluding remarks. General responses without the use of example(s) will not get above the middle of Level 2 (6 marks). 4(c) Level 1 (1–3 marks) Response may broadly discuss the concept of reducing mortality but does not address the question and does not come to a convincing conclusion. Response is descriptive, knowledge is basic and understanding is poor. Level 0 (0 marks) No creditable response. Migration/Settlement dynamics
Q5 · Describe the process of stepped migration
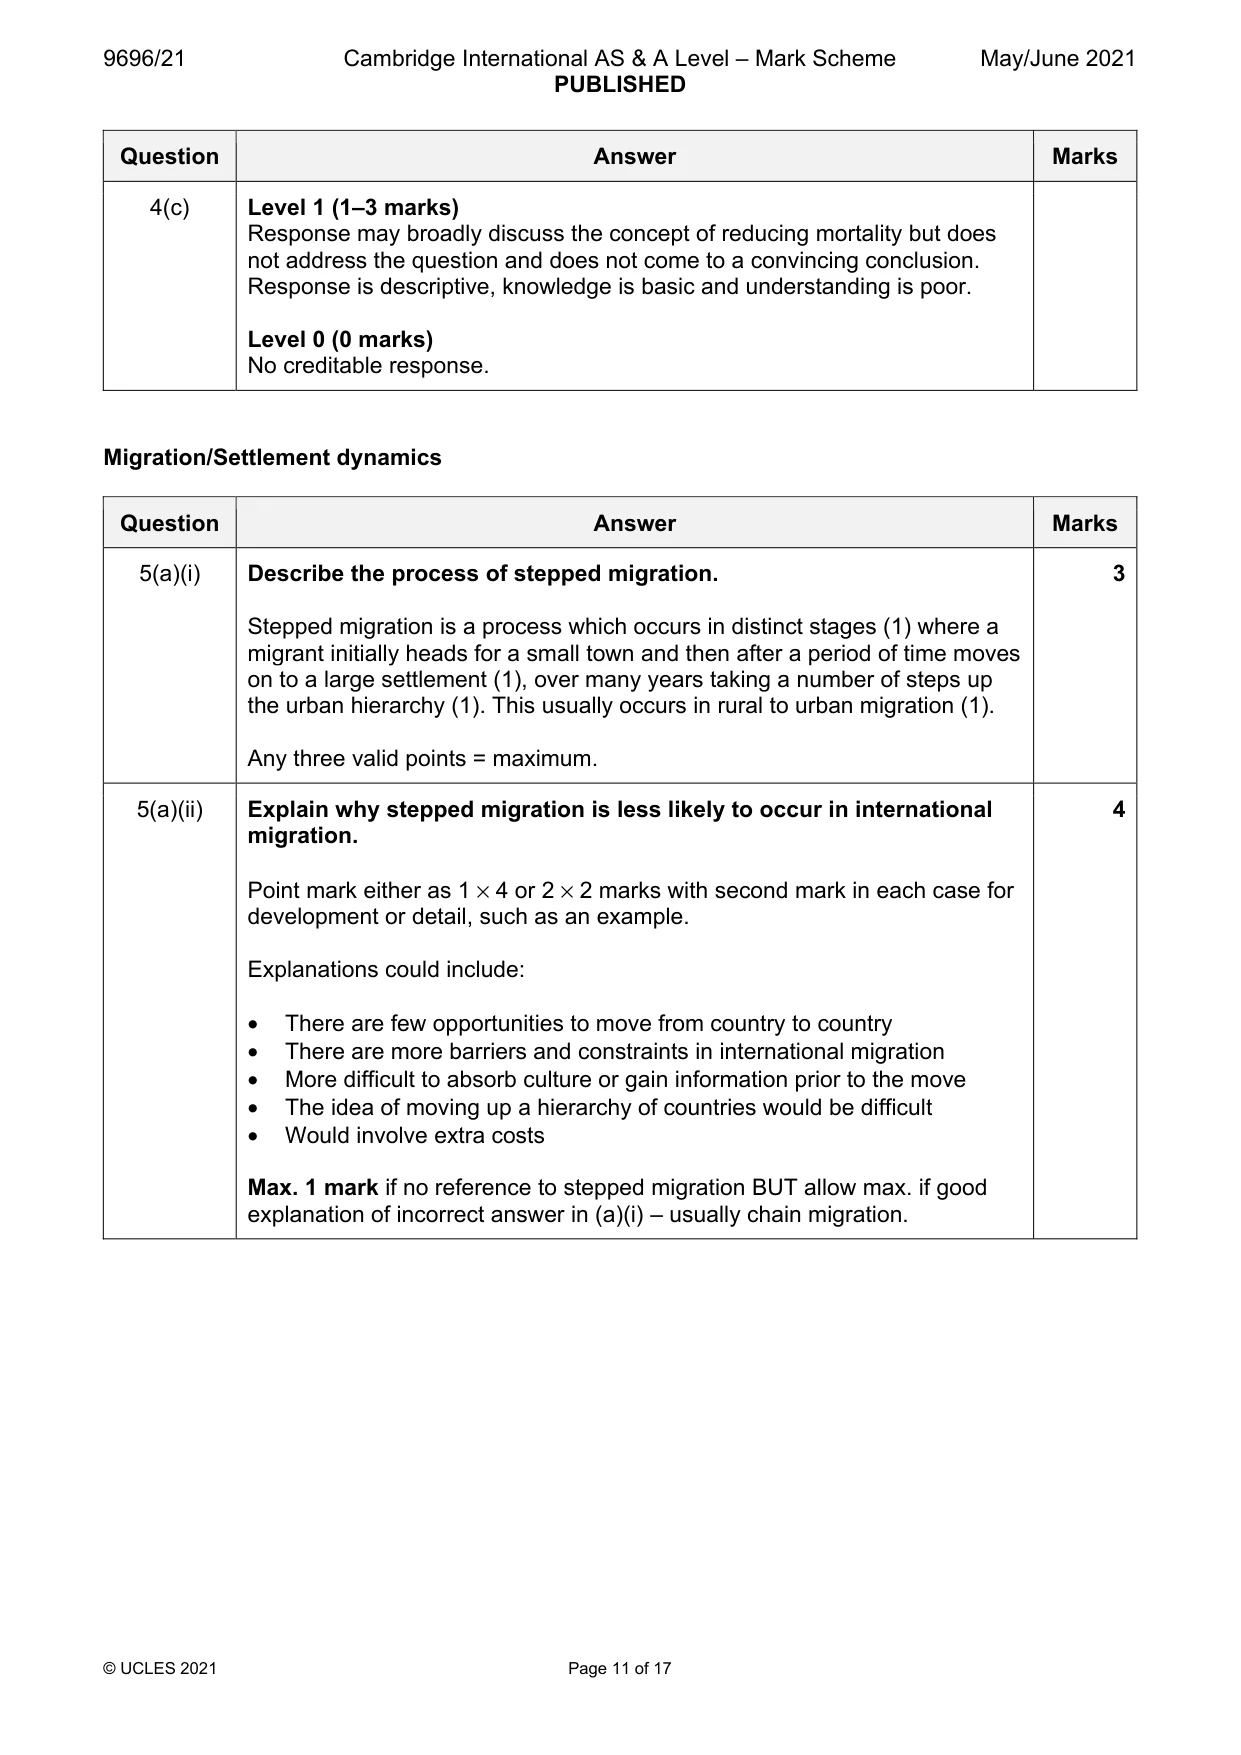
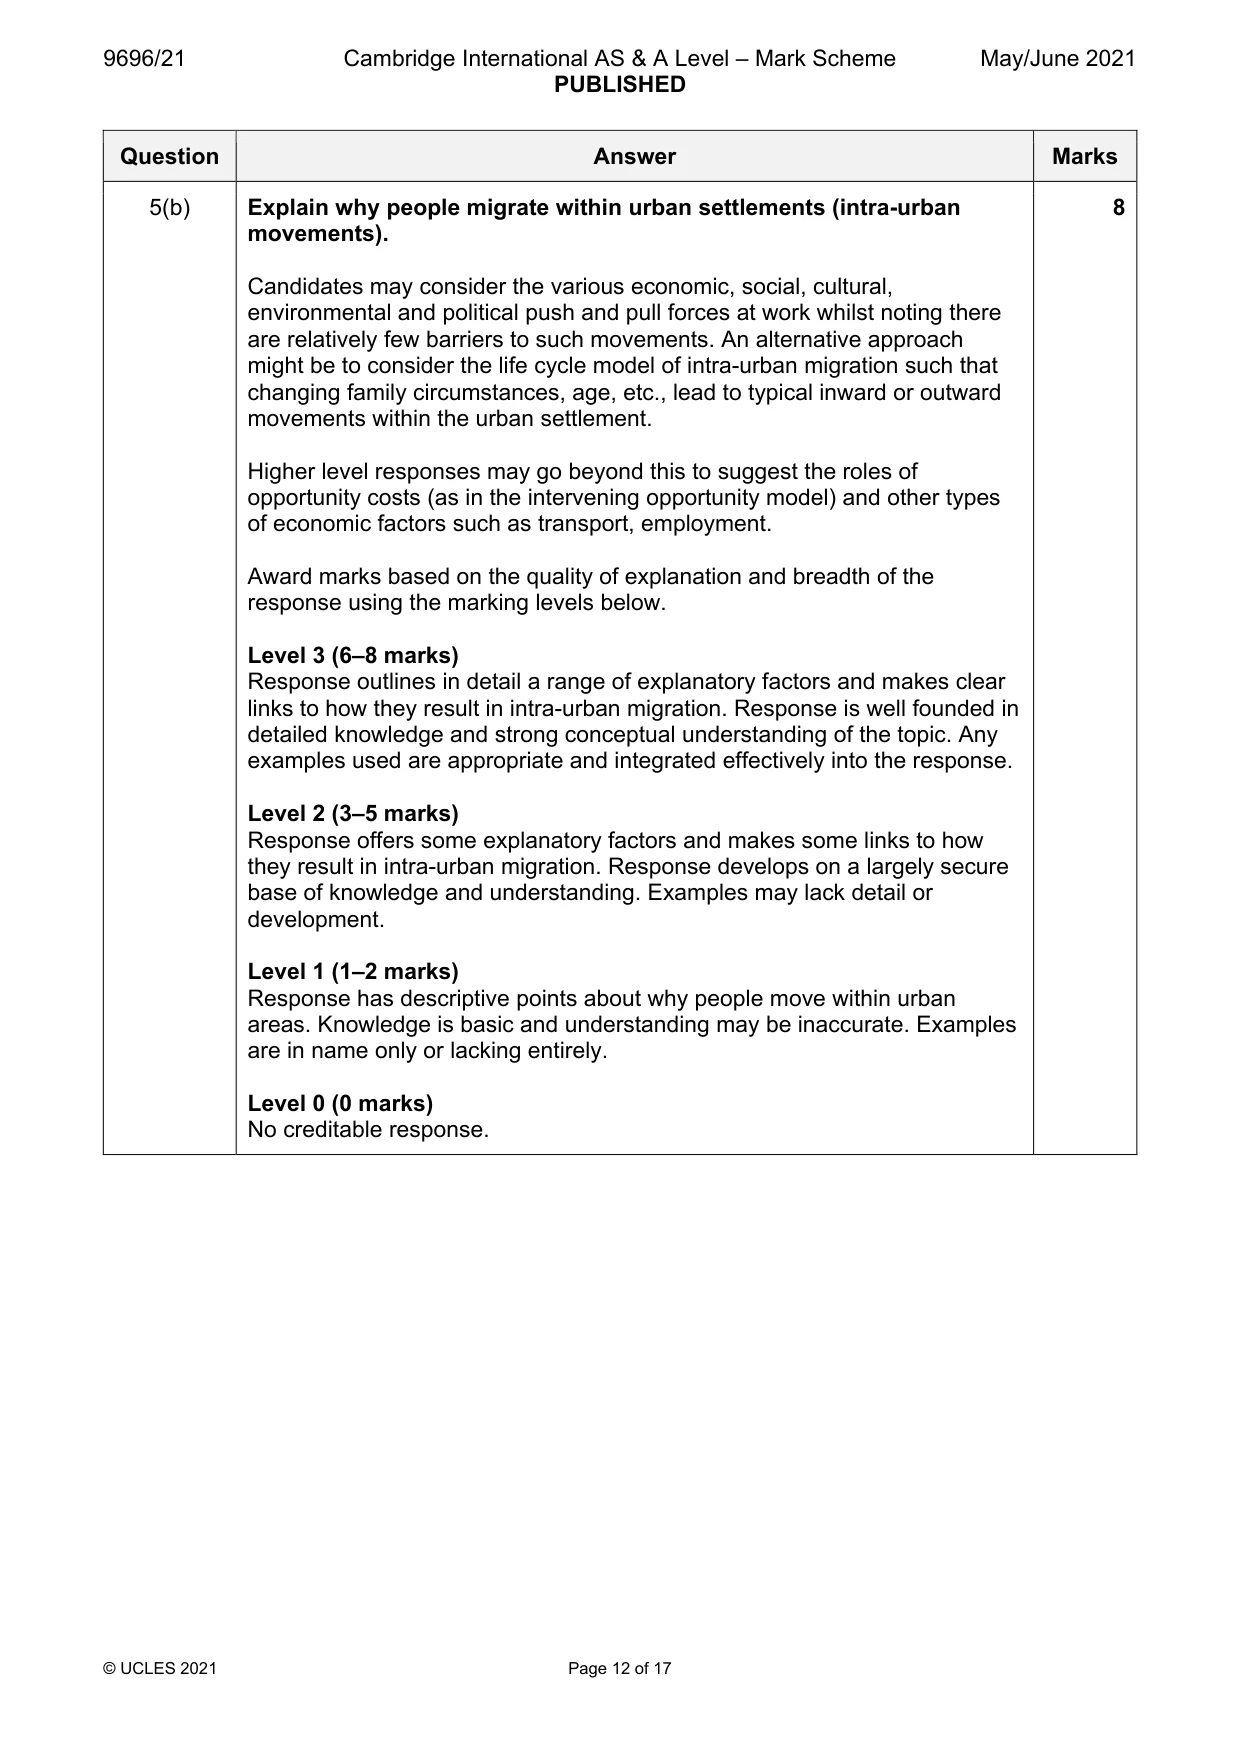
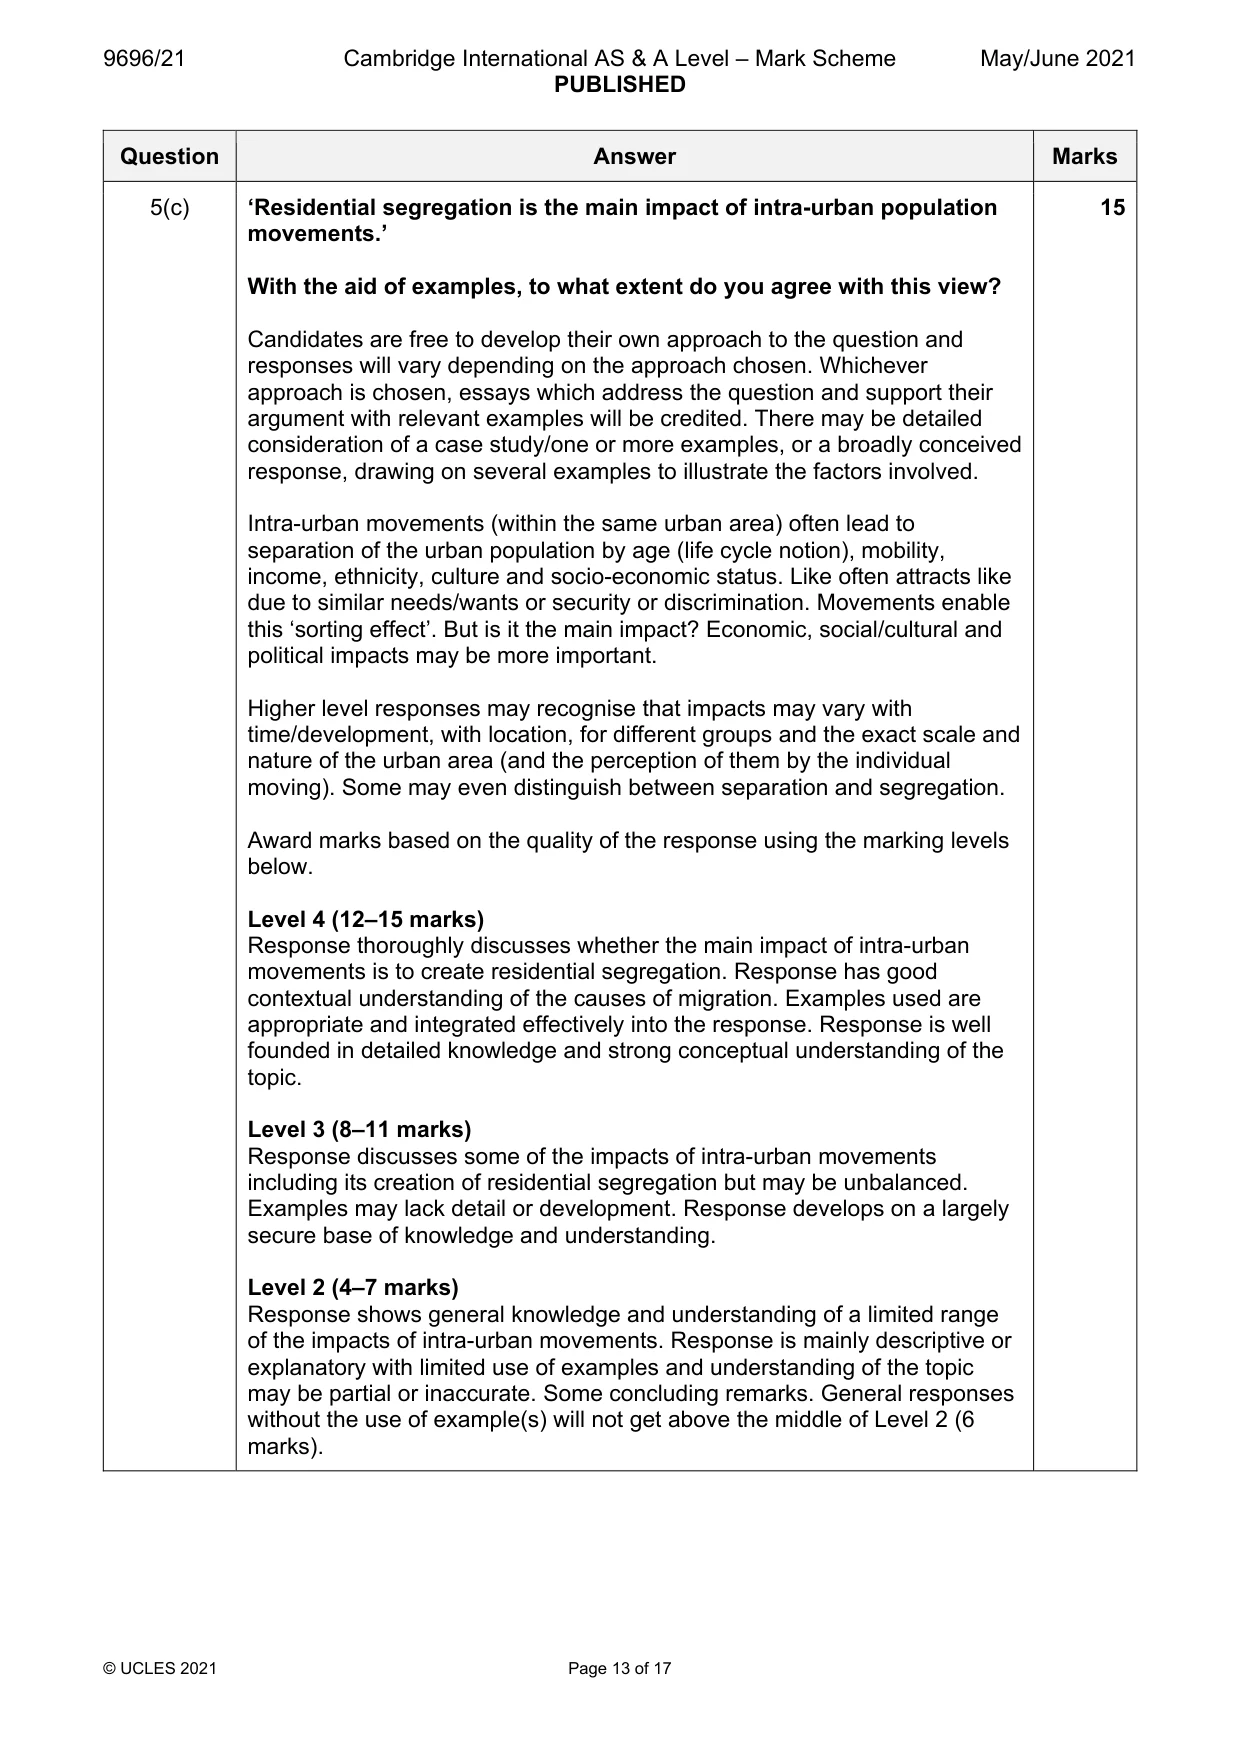
5 (a) (i) Describe the process of stepped migration. [3] (ii) Explain why stepped migration is less likely to occur in international migration. [4] (b) Explain why people migrate within urban settlements (intra-urban movements). [8] (c) ‘Residential segregation is the main impact of intra-urban population movements.’ With the aid of examples, to what extent do you agree with this view? [15] Settlement dynamics
Mark scheme: 5(a)(i) Describe the process of stepped migration. 3 Stepped migration is a process which occurs in distinct stages (1) where a migrant initially heads for a small town and then after a period of time moves on to a large settlement (1), over many years taking a number of steps up the urban hierarchy (1). This usually occurs in rural to urban migration (1). Any three valid points = maximum. 5(a)(ii) Explain why stepped migration is less likely to occur in international 4 migration. Point mark either as 1 × 4 or 2 × 2 marks with second mark in each case for development or detail, such as an example. Explanations could include: • There are few opportunities to move from country to country • There are more barriers and constraints in international migration • More difficult to absorb culture or gain information prior to the move • The idea of moving up a hierarchy of countries would be difficult • Would involve extra costs Max. 1 mark if no reference to stepped migration BUT allow max. if good explanation of incorrect answer in (a)(i) – usually chain migration. 5(b) Explain why people migrate within urban settlements (intra-urban 8 movements). Candidates may consider the various economic, social, cultural, environmental and political push and pull forces at work whilst noting there are relatively few barriers to such movements. An alternative approach might be to consider the life cycle model of intra-urban migration such that changing family circumstances, age, etc., lead to typical inward or outward movements within the urban settlement. Higher level responses may go beyond this to suggest the roles of opportunity costs (as in the intervening opportunity model) and other types of economic factors such as transport, employment. Award marks based on the quality of explanation and breadth of the response using the marking levels below. Level 3 (6–8 marks) Response outlines in detail a range of explanatory factors and makes clear links to how they result in intra-urban migration. Response is well founded in detailed knowledge and strong conceptual understanding of the topic. Any examples used are appropriate and integrated effectively into the response. Level 2 (3–5 marks) Response offers some explanatory factors and makes some links to how they result in intra-urban migration. Response develops on a largely secure base of knowledge and understanding. Examples may lack detail or development. Level 1 (1–2 marks) Response has descriptive points about why people move within urban areas. Knowledge is basic and understanding may be inaccurate. Examples are in name only or lacking entirely. Level 0 (0 marks) No creditable response. 5(c) ‘Residential segregation is the main impact of intra-urban population 15 movements.’ With the aid of examples, to what extent do you agree with this view? Candidates are free to develop their own approach to the question and responses will vary depending on the approach chosen. Whichever approach is chosen, essays which address the question and support their argument with relevant examples will be credited. There may be detailed consideration of a case study/one or more examples, or a broadly conceived response, drawing on several examples to illustrate the factors involved. Intra-urban movements (within the same urban area) often lead to separation of the urban population by age (life cycle notion), mobility, income, ethnicity, culture and socio-economic status. Like often attracts like due to similar needs/wants or security or discrimination. Movements enable this ‘sorting effect’. But is it the main impact? Economic, social/cultural and political impacts may be more important. Higher level responses may recognise that impacts may vary with time/development, with location, for different groups and the exact scale and nature of the urban area (and the perception of them by the individual moving). Some may even distinguish between separation and segregation. Award marks based on the quality of the response using the marking levels below. Level 4 (12–15 marks) Response thoroughly discusses whether the main impact of intra-urban movements is to create residential segregation. Response has good contextual understanding of the causes of migration. Examples used are appropriate and integrated effectively into the response. Response is well founded in detailed knowledge and strong conceptual understanding of the topic. Level 3 (8–11 marks) Response discusses some of the impacts of intra-urban movements including its creation of residential segregation but may be unbalanced. Examples may lack detail or development. Response develops on a largely secure base of knowledge and understanding. Level 2 (4–7 marks) Response shows general knowledge and understanding of a limited range of the impacts of intra-urban movements. Response is mainly descriptive or explanatory with limited use of examples and understanding of the topic may be partial or inaccurate. Some concluding remarks. General responses without the use of example(s) will not get above the middle of Level 2 (6 marks). 5(c) Level 1 (1–3 marks) Response may broadly discuss the impacts of migration in urban areas but does not address the question and does not come to a convincing conclusion. Response is descriptive, knowledge is basic and understanding is poor. Level 0 (0 marks) No creditable response. Settlement dynamics
Q6 · With the aid of examples, describe how environmental factors affect the location of…
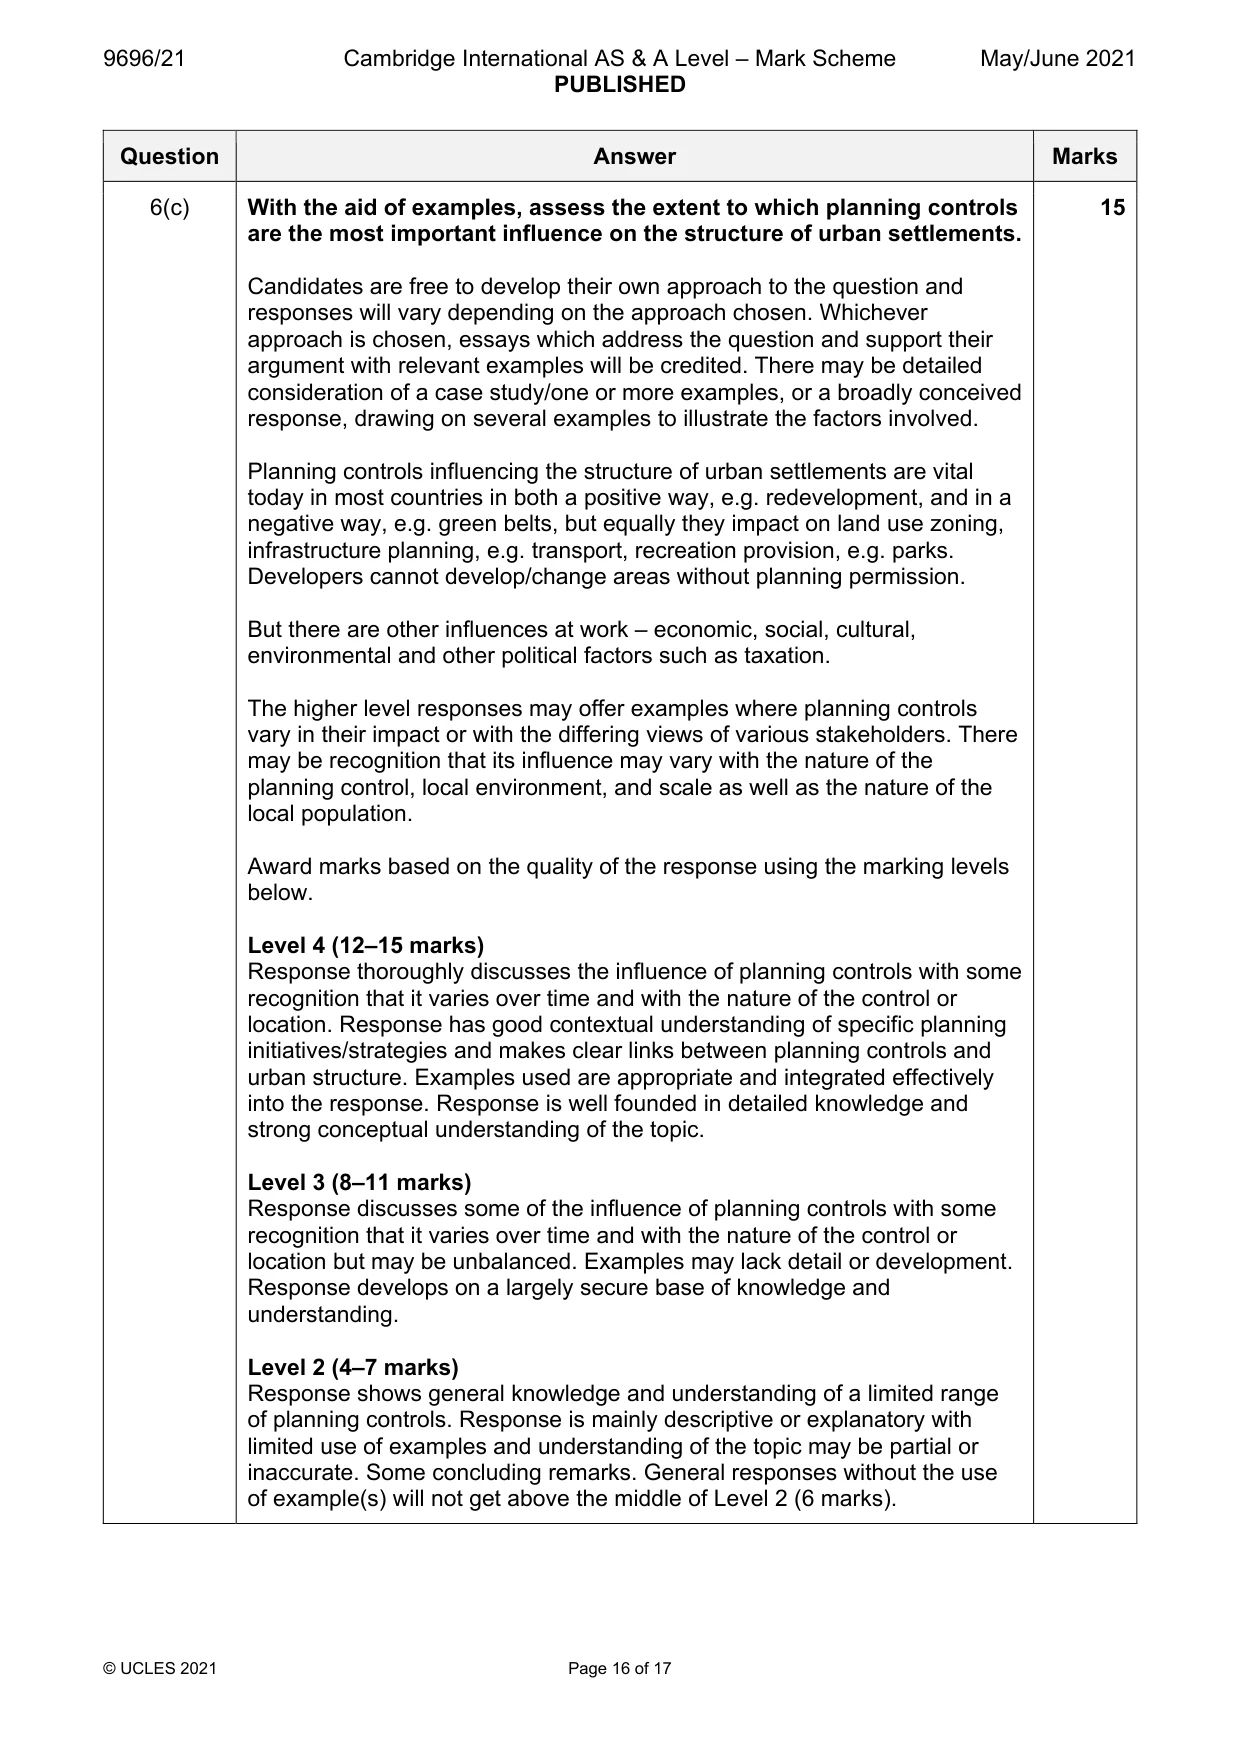
6 (a) With the aid of examples, describe how environmental factors affect the location of activities in urban areas. [7] (b) Explain why manufacturing has changed location in urban areas. [8] (c) With the aid of examples, assess the extent to which planning controls are the most important influence on the structure of urban settlements. [15]
Mark scheme: 6(a) With the aid of examples, describe how environmental factors affect 7 the location of activities in urban areas. Activities could refer to land uses, e.g. settlement vs industry or functions. The stress is on the influence on their location resulting from environmental factors such as: • Climate – aspect, micro-climate, wind directions, shelter • Relief – steepness, extent of flat land, natural barriers • Drainage – water supply, rivers as routes/bridging points, well drained soil • Vegetation – type and amount • Level and type of pollution • Geology – rock type, mineral supplies, building material, fuel Point mark with 1 mark per valid point or 2 marks if developed/exemplified point. If no examples, then max. 4. 6(b) Explain why manufacturing has changed location in urban areas. 8 Manufacturing in urban areas has changed its location in both HICs and LICs. In most cases it has been an outward movement (although accept well argued alternatives). Explanation could include: • Environmental reasons – increased pollution, need for more land, increased congestion in inner areas • Economic reasons – cheaper land, increased power supply, changes in accessibility, competition, changes in sources of raw materials • Social reasons – changes in local population, demand • Political reasons – government policies, pollution laws, planning controls, taxation, nationalisation Award marks based on the quality of explanation and breadth of the response using the marking levels below. Level 3 (6–8 marks) Response explains in detail how and why manufacturing has changed its location in urban areas. Response is well founded in detailed knowledge and strong conceptual understanding of the topic. Any examples used are appropriate and integrated effectively into the response. Level 2 (3–5 marks) Response offers some explanation of why manufacturing has changed its location in urban areas. Response develops on a largely secure base of knowledge and understanding. Examples may lack detail or development. Level 1 (1–2 marks) Response has largely descriptive points about manufacturing changing its location in urban areas. Knowledge is basic and understanding may be inaccurate. Examples are in name only or lacking entirely. Level 0 (0 marks) No creditable response. 6(c) With the aid of examples, assess the extent to which planning controls 15 are the most important influence on the structure of urban settlements. Candidates are free to develop their own approach to the question and responses will vary depending on the approach chosen. Whichever approach is chosen, essays which address the question and support their argument with relevant examples will be credited. There may be detailed consideration of a case study/one or more examples, or a broadly conceived response, drawing on several examples to illustrate the factors involved. Planning controls influencing the structure of urban settlements are vital today in most countries in both a positive way, e.g. redevelopment, and in a negative way, e.g. green belts, but equally they impact on land use zoning, infrastructure planning, e.g. transport, recreation provision, e.g. parks. Developers cannot develop/change areas without planning permission. But there are other influences at work – economic, social, cultural, environmental and other political factors such as taxation. The higher level responses may offer examples where planning controls vary in their impact or with the differing views of various stakeholders. There may be recognition that its influence may vary with the nature of the planning control, local environment, and scale as well as the nature of the local population. Award marks based on the quality of the response using the marking levels below. Level 4 (12–15 marks) Response thoroughly discusses the influence of planning controls with some recognition that it varies over time and with the nature of the control or location. Response has good contextual understanding of specific planning initiatives/strategies and makes clear links between planning controls and urban structure. Examples used are appropriate and integrated effectively into the response. Response is well founded in detailed knowledge and strong conceptual understanding of the topic. Level 3 (8–11 marks) Response discusses some of the influence of planning controls with some recognition that it varies over time and with the nature of the control or location but may be unbalanced. Examples may lack detail or development. Response develops on a largely secure base of knowledge and understanding. Level 2 (4–7 marks) Response shows general knowledge and understanding of a limited range of planning controls. Response is mainly descriptive or explanatory with limited use of examples and understanding of the topic may be partial or inaccurate. Some concluding remarks. General responses without the use of example(s) will not get above the middle of Level 2 (6 marks). 6(c) Level 1 (1–3 marks) Response may broadly discuss planning but does not address the question and does not come to a convincing conclusion. Response is descriptive, knowledge is basic and understanding is poor. Level 0 (0 marks) No creditable response.
What was in this paper
The subtopics covered by these 6 questions, and how many questions each got. Open one in a new tab to see every Cambridge question on it.
What you needed in this session
Cambridge’s own grade thresholds for 2021 May/June, Paper 2 · Variant 1. A higher threshold means an easier paper — the bar moves with how the cohort did.