Cambridge A Level Geography 9696 — 2021 May/June Paper 2 · Variant 3
9696/23/M/J/21 · 6 questions · 60 marks · ≈68 min
The question paper and its mark scheme, free to read here and free to download. This is Cambridge’s own paper, exactly as it was sat.
Question paper4 pages

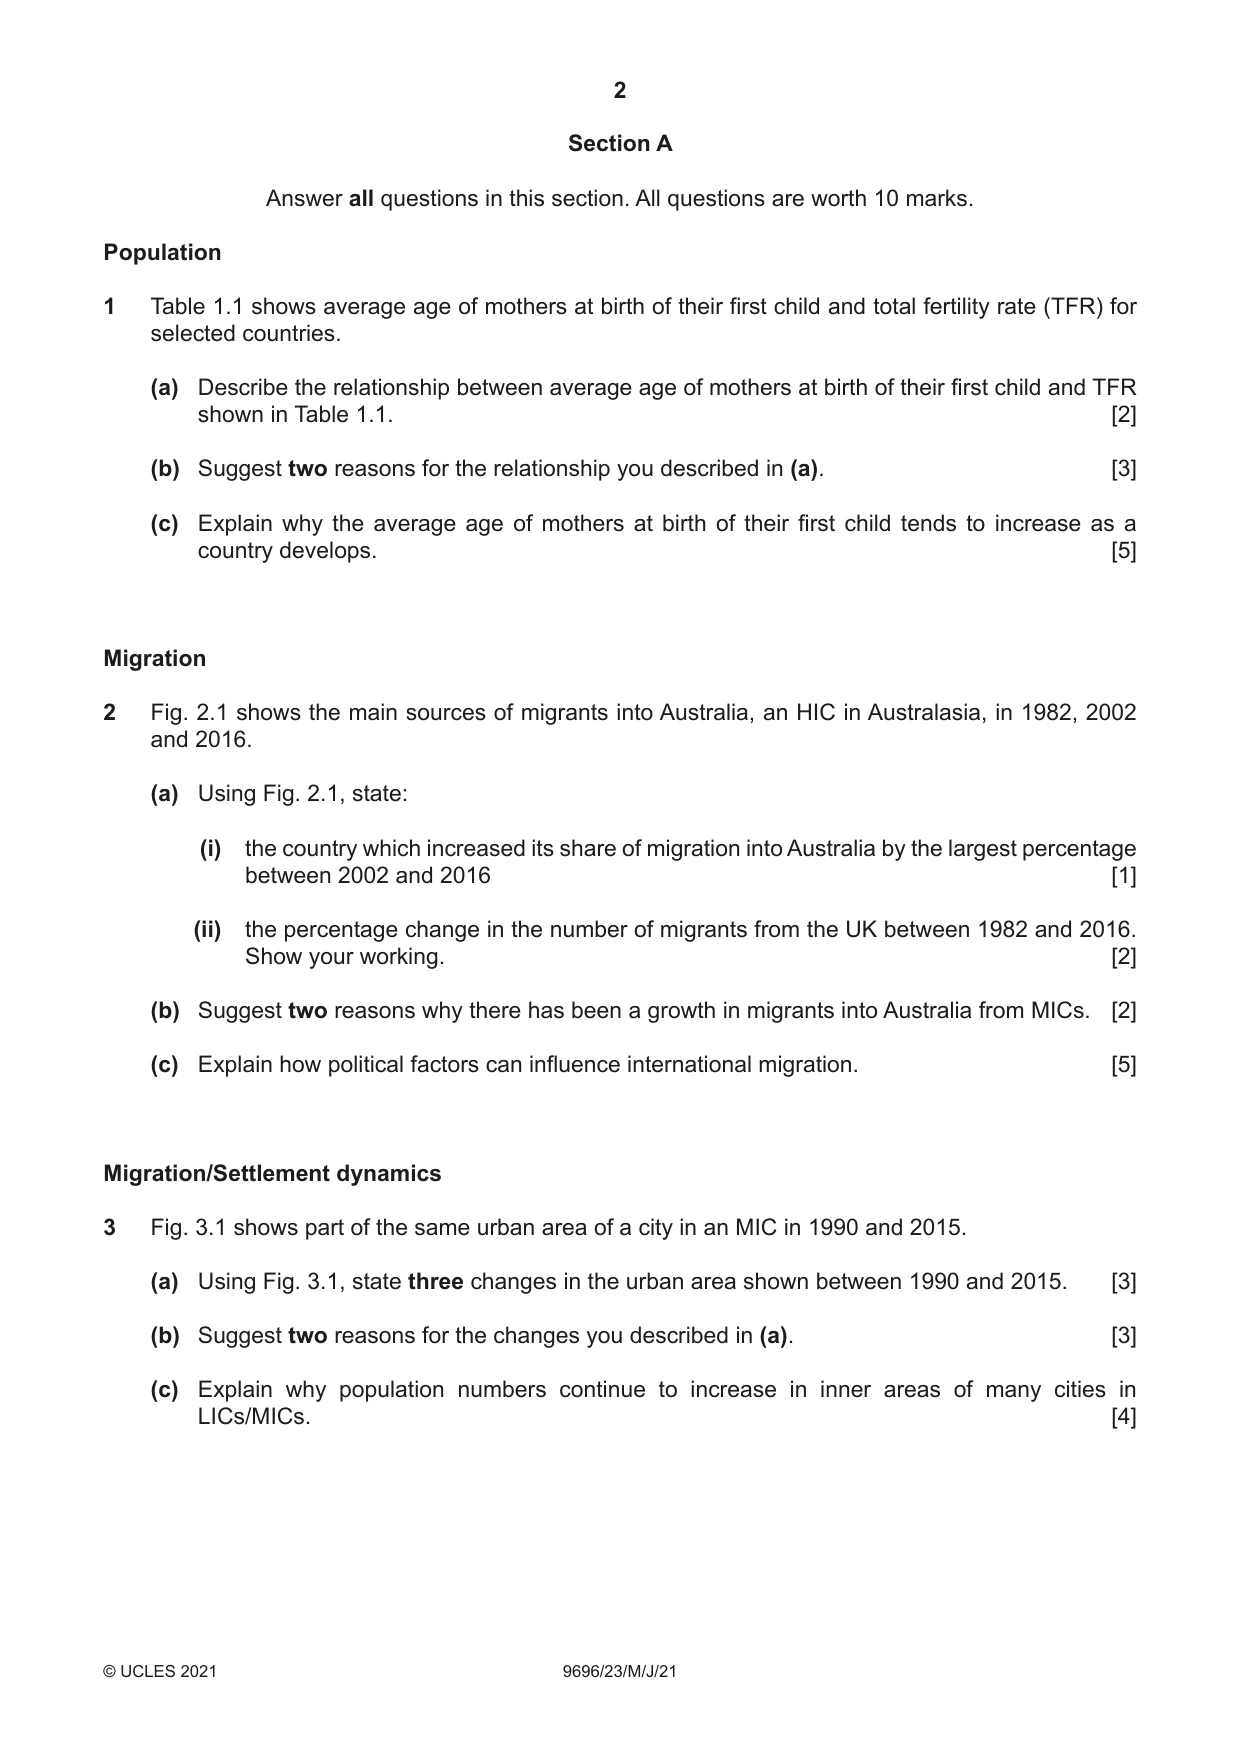
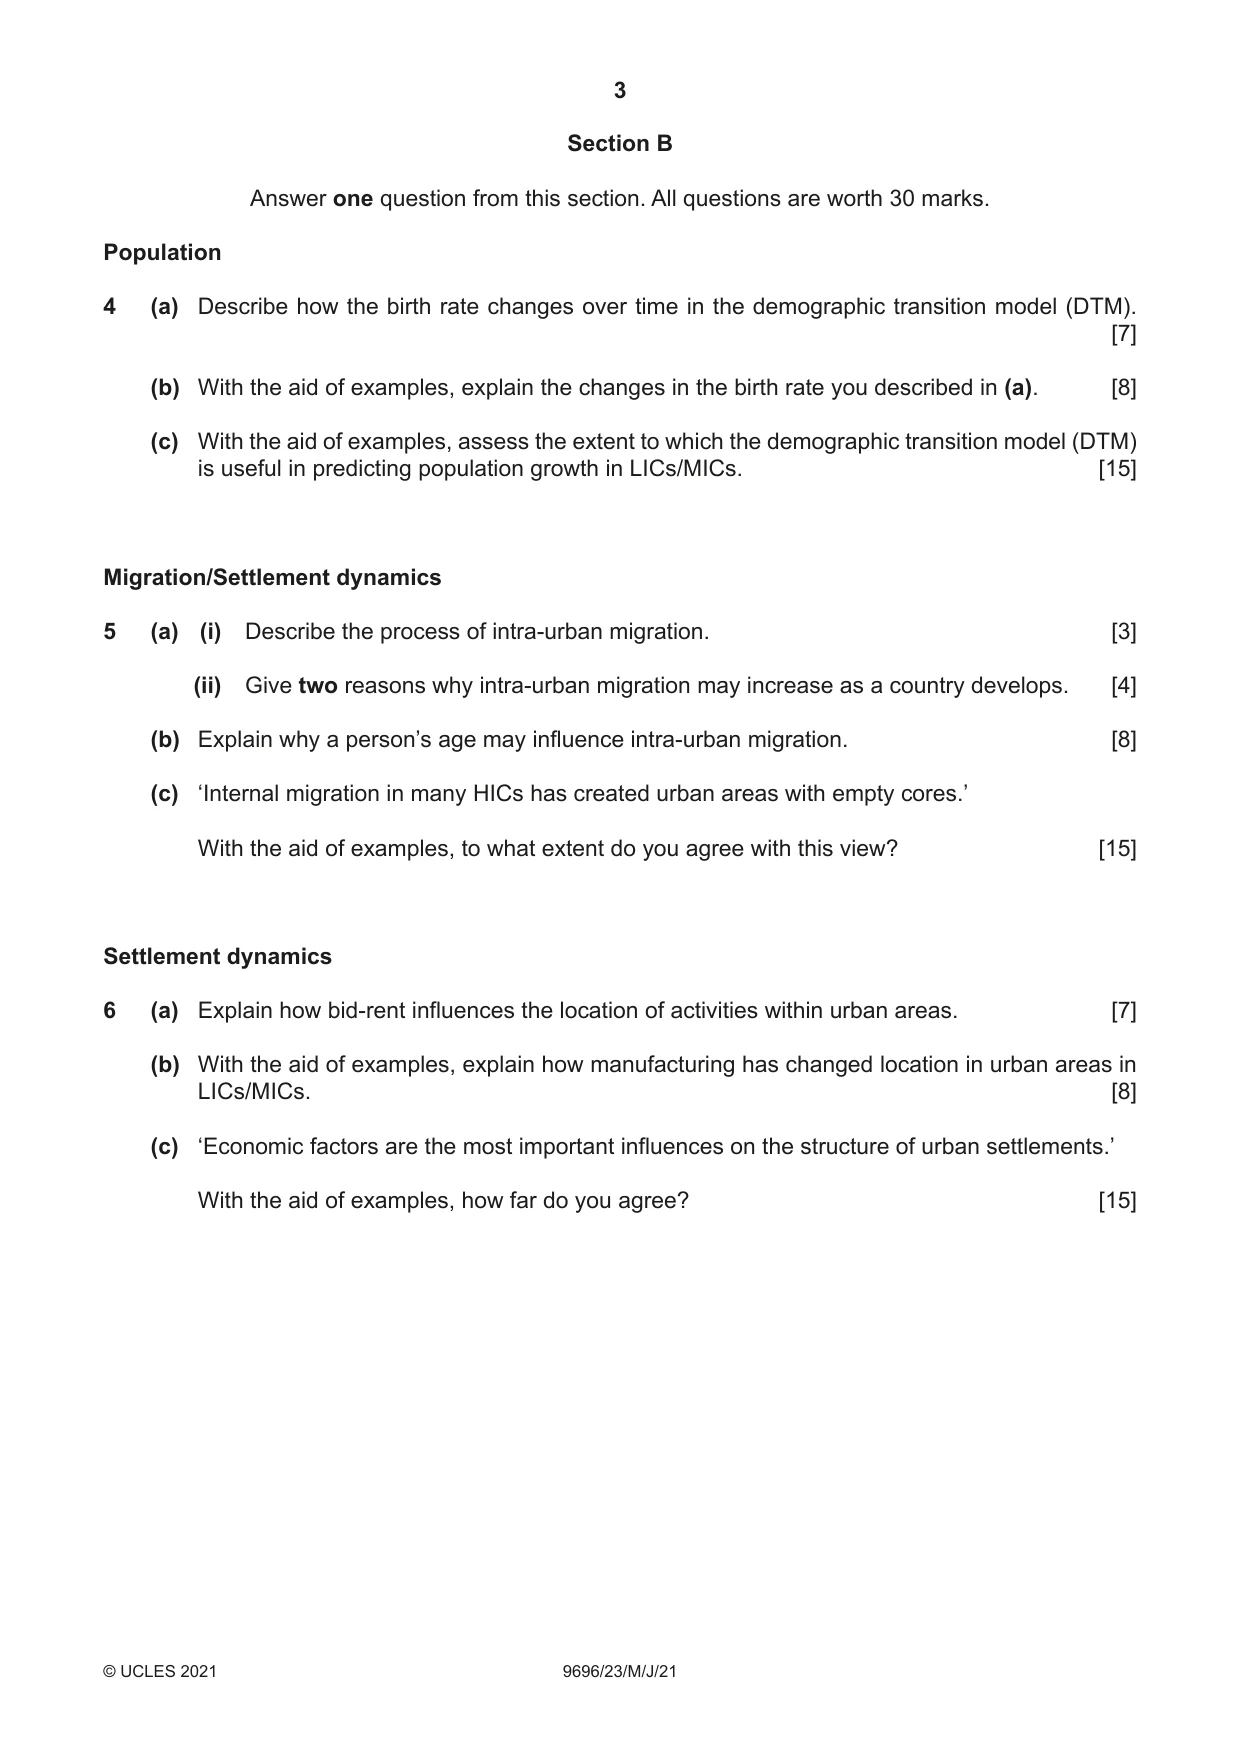

Mark scheme15 pages
Answers below. Sit the paper first if you are practising.






Questions as text
Q1 · Average age of mothers at birth of their first child and total fertility rate (TFR) for…
1 Table 1.1 shows average age of mothers at birth of their first child and total fertility rate (TFR) for selected countries. (a) Describe the relationship between average age of mothers at birth of their first child and TFR shown in Table 1.1. [2] (b) Suggest two reasons for the relationship you described in (a). [3] (c) Explain why the average age of mothers at birth of their first child tends to increase as a country develops. [5] Migration
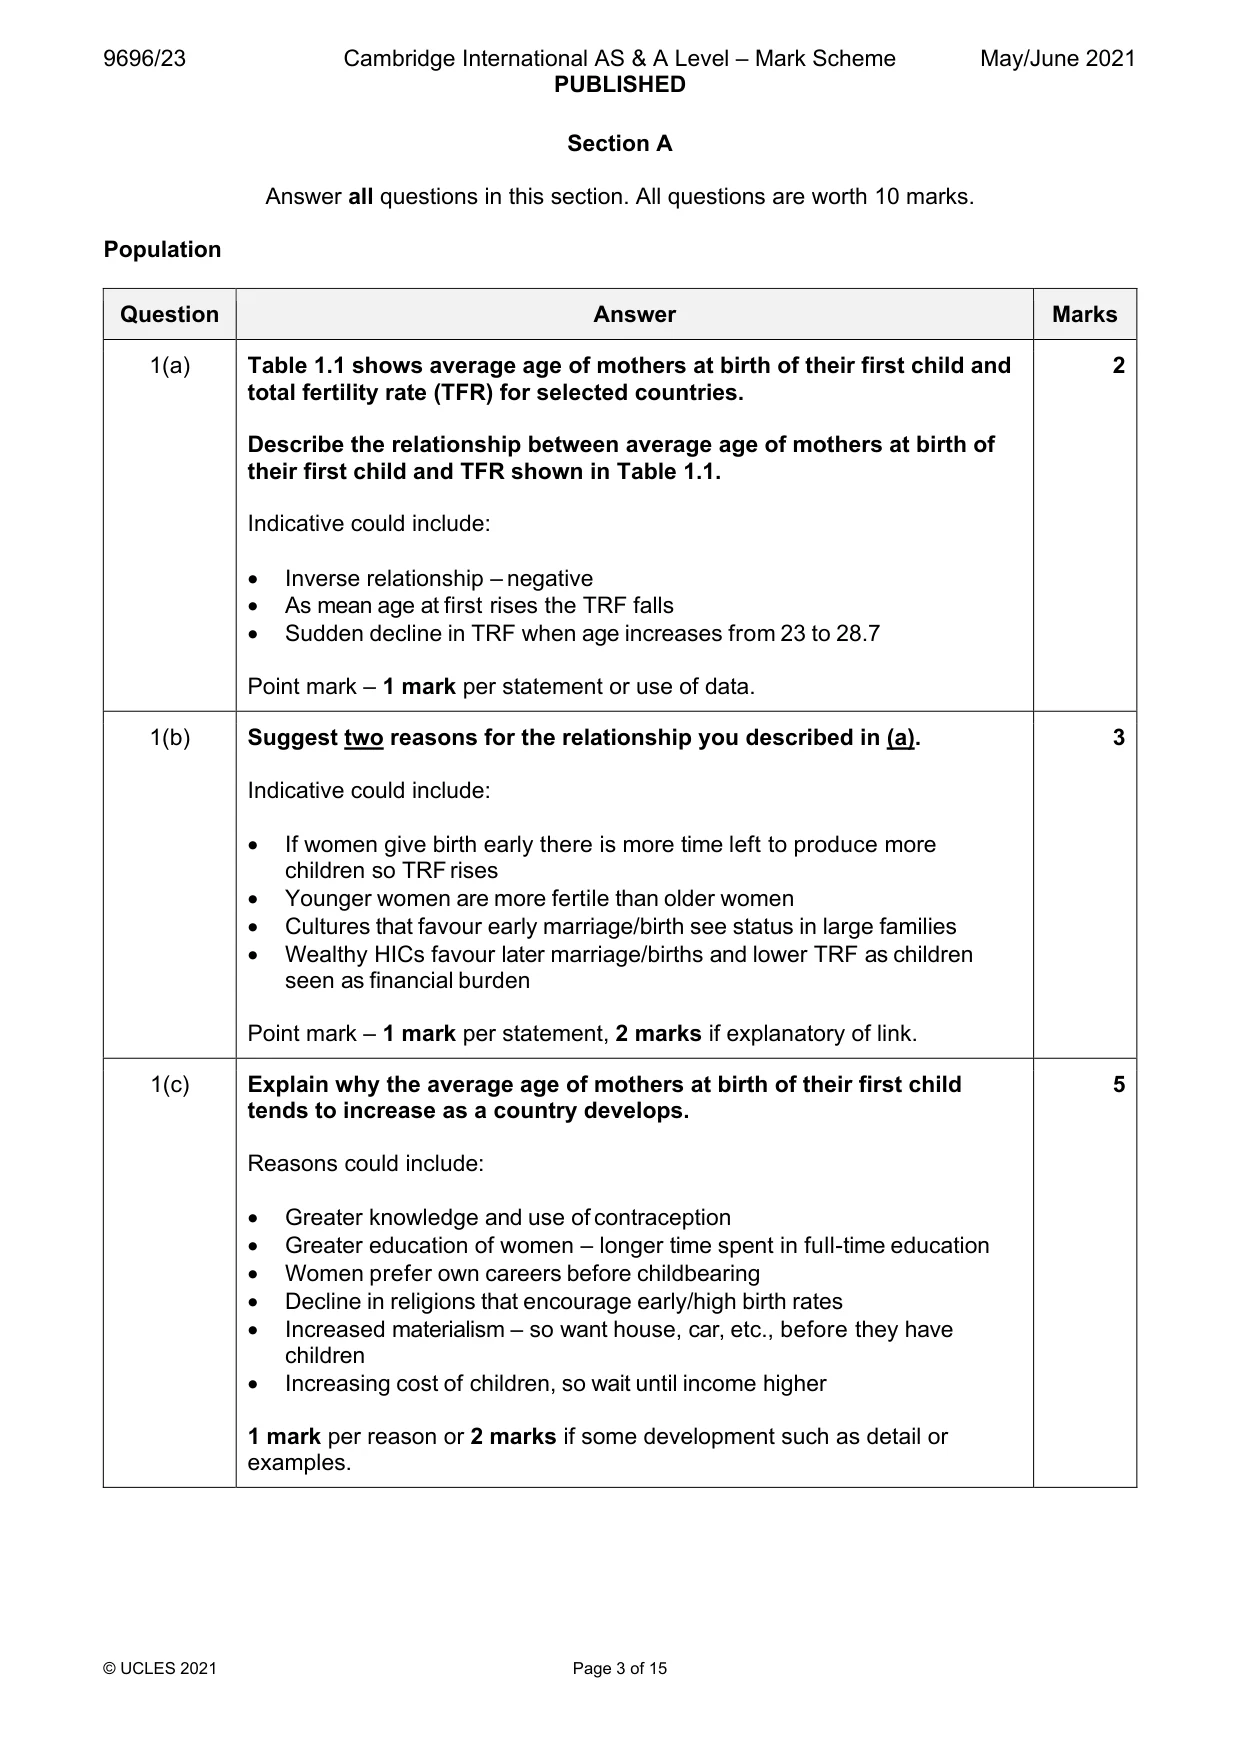
Mark scheme: Question Answer Marks 1(a) Table 1.1 shows average age of mothers at birth of their first child and 2 total fertility rate (TFR) for selected countries. Describe the relationship between average age of mothers at birth of their first child and TFR shown in Table 1.1. Indicative could include: • Inverse relationship – negative • As mean age at first rises the TRF falls • Sudden decline in TRF when age increases from 23 to 28.7 Point mark – 1 mark per statement or use of data. 1(b) Suggest two reasons for the relationship you described in (a). 3 Indicative could include: • If women give birth early there is more time left to produce more children so TRF rises • Younger women are more fertile than older women • Cultures that favour early marriage/birth see status in large families • Wealthy HICs favour later marriage/births and lower TRF as children seen as financial burden Point mark – 1 mark per statement, 2 marks if explanatory of link. 1(c) Explain why the average age of mothers at birth of their first child 5 tends to increase as a country develops. Reasons could include: • Greater knowledge and use of contraception • Greater education of women – longer time spent in full-time education • Women prefer own careers before childbearing • Decline in religions that encourage early/high birth rates • Increased materialism – so want house, car, etc., before they have children • Increasing cost of children, so wait until income higher 1 mark per reason or 2 marks if some development such as detail or examples. Migration
Q2 · The main sources of migrants into Australia, an HIC in Australasia, in 1982, 2002 and 2016
2 Fig. 2.1 shows the main sources of migrants into Australia, an HIC in Australasia, in 1982, 2002 and 2016. (a) Using Fig. 2.1, state: (i) the country which increased its share of migration into Australia by the largest percentage between 2002 and 2016 [1] (ii) the percentage change in the number of migrants from the UK between 1982 and 2016. Show your working. [2] (b) Suggest two reasons why there has been a growth in migrants into Australia from MICs. [2] (c) Explain how political factors can influence international migration. [5] Migration/Settlement dynamics
Mark scheme: 2(a)(i) Fig. 2.1 shows the main sources of migrants into Australia, an HIC in 1 Australasia, in 1982, 2002 and 2016. Using Fig. 2.1, state: the country which increased its share of migration into Australia by the largest percentage between 2002 and 2016 India 2(a)(ii) Using Fig. 2.1, state: the percentage change in the number of migrants 2 from the UK between 1982 and 2016. Show your working. 22% 1 mark and 1 mark for working. 2(b) Suggest two reasons why there has been a growth in migrants into 2 Australia from MICs. Reasons could include: • Pushed out of MIC by unemployment, poor housing, etc., which Australia can offer • Looking for a warmer climate (retirement) • Want better quality facilities, e.g. medical, education • Start businesses in this wealthy market • Employed as cheap labour by firms based in Australia • Working for TNCs located in Australia • Sending back remittances • More freedom if moving from a country with lack of freedom 1 mark per reason. 2(c) Explain how political factors can influence international migration. 5 Encourage: • Subsidise migrants’ travel, e.g. Australia £10 passage • Operate quotas based on specific criteria • Offer cheap housing, free education, social services, etc. • Put few barriers in their way • Escaping from repressive governments / conflict Discourage: • Build fences, walls – strict border controls • Operate quotas based on specific criteria • Insist on visas for entry • Indirect, e.g. anti-migrant attitude 1 mark per reason or 2 marks if some development of detail and/or examples. Migration/Settlement dynamics
Q3 · Part of the same urban area of a city in an MIC in 1990 and 2015
3 Fig. 3.1 shows part of the same urban area of a city in an MIC in 1990 and 2015. (a) Using Fig. 3.1, state three changes in the urban area shown between 1990 and 2015. [3] (b) Suggest two reasons for the changes you described in (a). [3] (c) Explain why population numbers continue to increase in inner areas of many cities in LICs/MICs. [4]
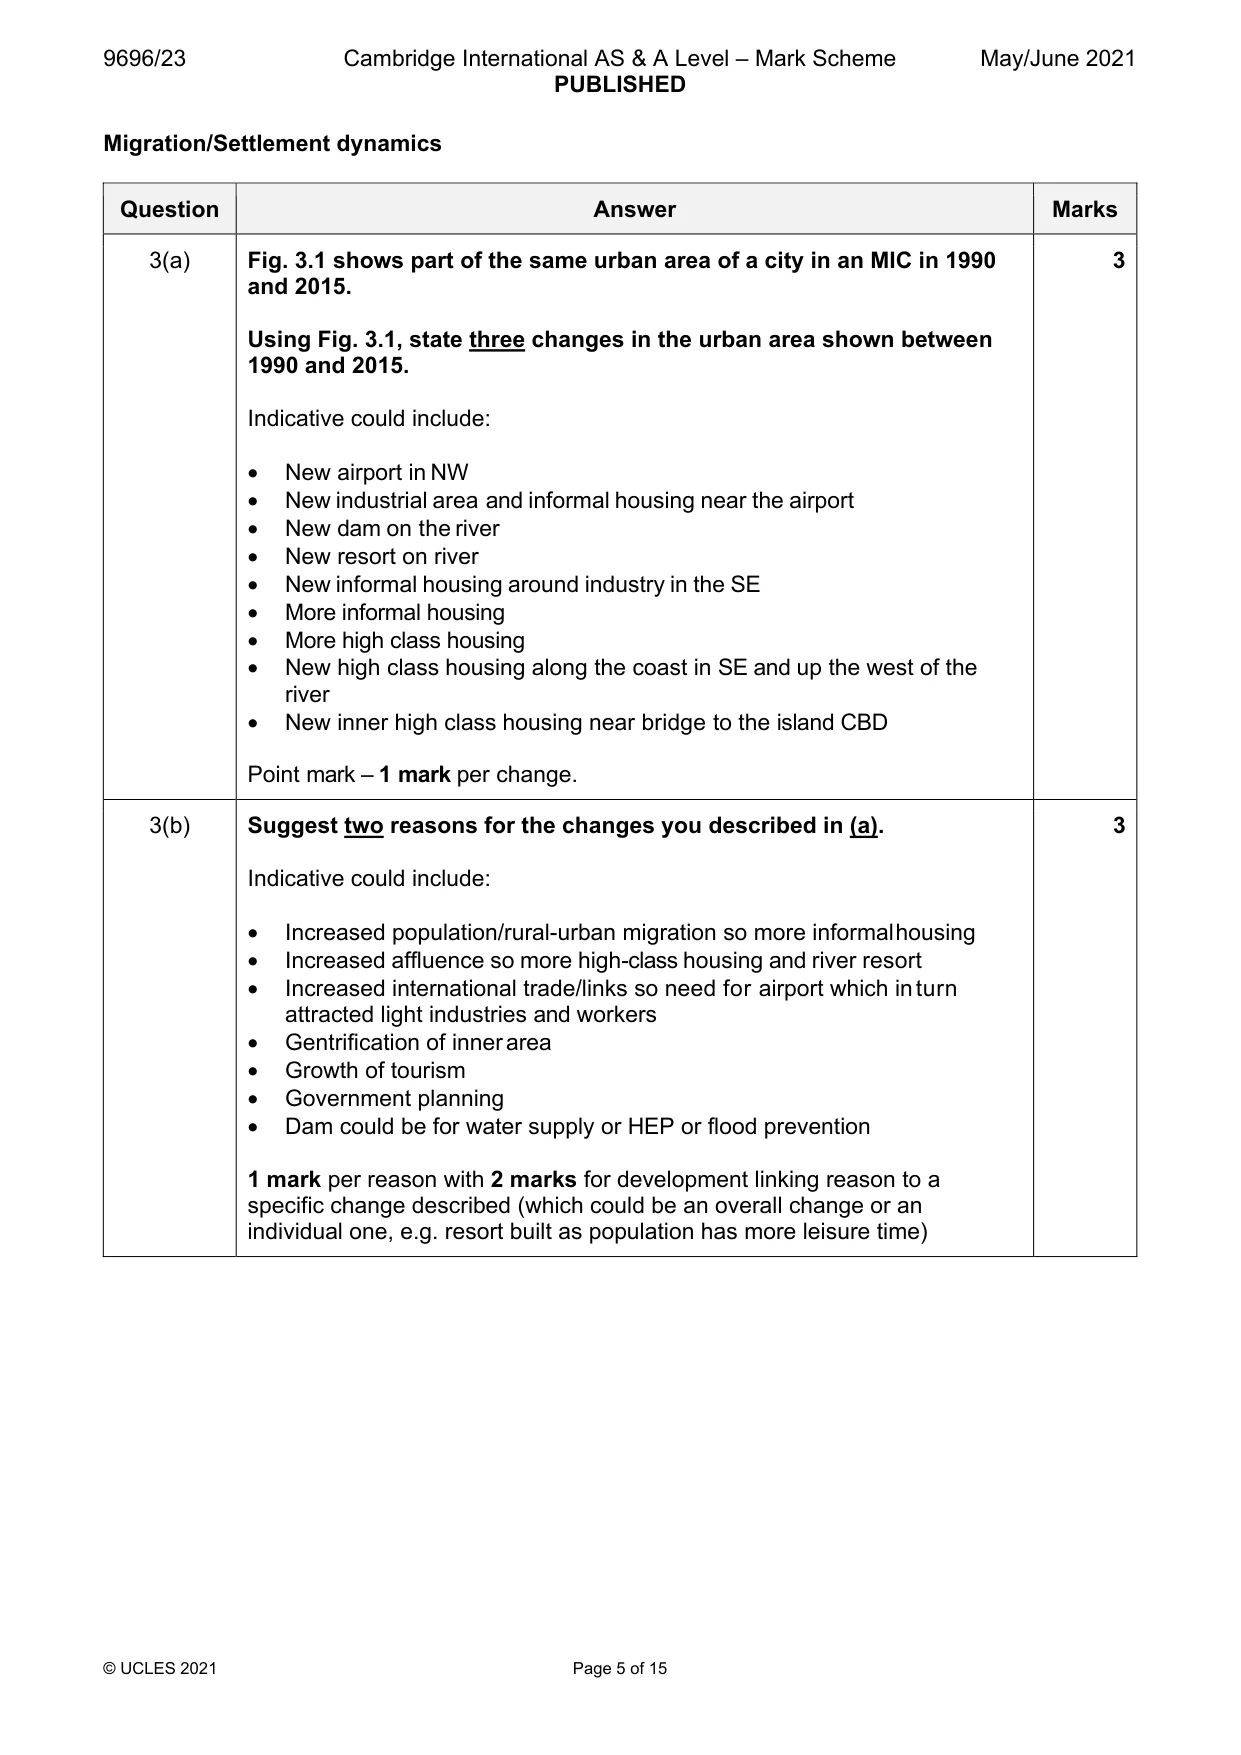
Mark scheme: 3(a) Fig. 3.1 shows part of the same urban area of a city in an MIC in 1990 3 and 2015. Using Fig. 3.1, state three changes in the urban area shown between 1990 and 2015. Indicative could include: • New airport in NW • New industrial area and informal housing near the airport • New dam on the river • New resort on river • New informal housing around industry in the SE • More informal housing • More high class housing • New high class housing along the coast in SE and up the west of the river • New inner high class housing near bridge to the island CBD Point mark – 1 mark per change. 3(b) Suggest two reasons for the changes you described in (a). 3 Indicative could include: • Increased population/rural-urban migration so more informal housing • Increased affluence so more high-class housing and river resort • Increased international trade/links so need for airport which in turn attracted light industries and workers • Gentrification of inner area • Growth of tourism • Government planning • Dam could be for water supply or HEP or flood prevention 1 mark per reason with 2 marks for development linking reason to a specific change described (which could be an overall change or an individual one, e.g. resort built as population has more leisure time) 3(c) Explain why population numbers continue to increase in inner areas of 4 many cities in LICs/MICs. Indicative: • Need to access jobs in CBD – especially low skilled ones such as retail, cleaners, etc., greater choice/range of jobs/higher pay • Transport focuses on inner areas and may be poor outside of these areas • Growth of high-rise housing in inner areas • Desire to be near the dynamic heart of the city/entertainment – ‘Bright Lights’ syndrome • Bulk of services and facilities are focused on inner areas (easier/cheaper for government), e.g. education, health, etc. • More secure and safe as better policing, etc. • Near to government centre (employment and contacts) • Low cost (informal) housing infilling 1 mark per reason or 2 marks if some development. Section B Answer one question from this section. All questions are worth 30 marks. Population
Q4 · Describe how the birth rate changes over time in the demographic transition model (DTM)
4 (a) Describe how the birth rate changes over time in the demographic transition model (DTM). [7] (b) With the aid of examples, explain the changes in the birth rate you described in (a). [8] (c) With the aid of examples, assess the extent to which the demographic transition model (DTM) is useful in predicting population growth in LICs/MICs. [15] Migration/Settlement dynamics
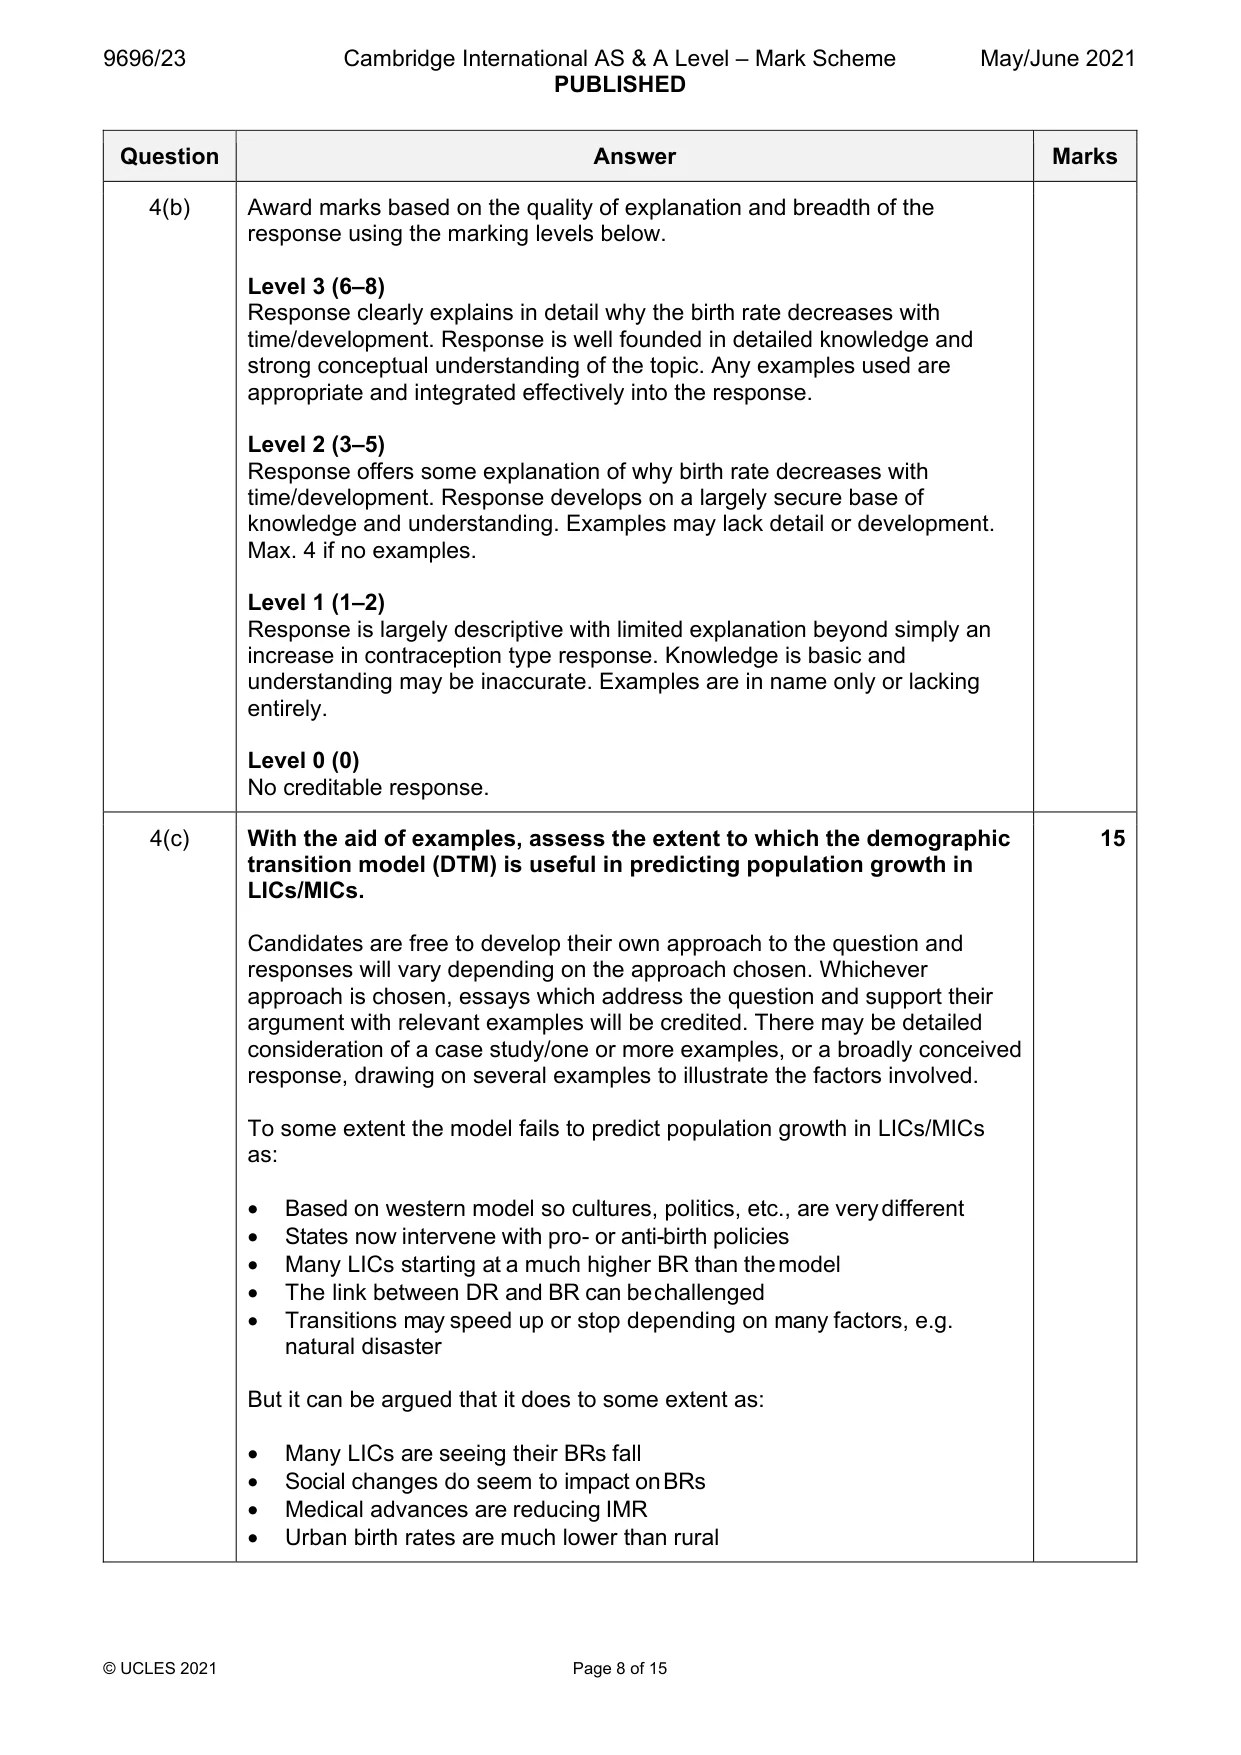
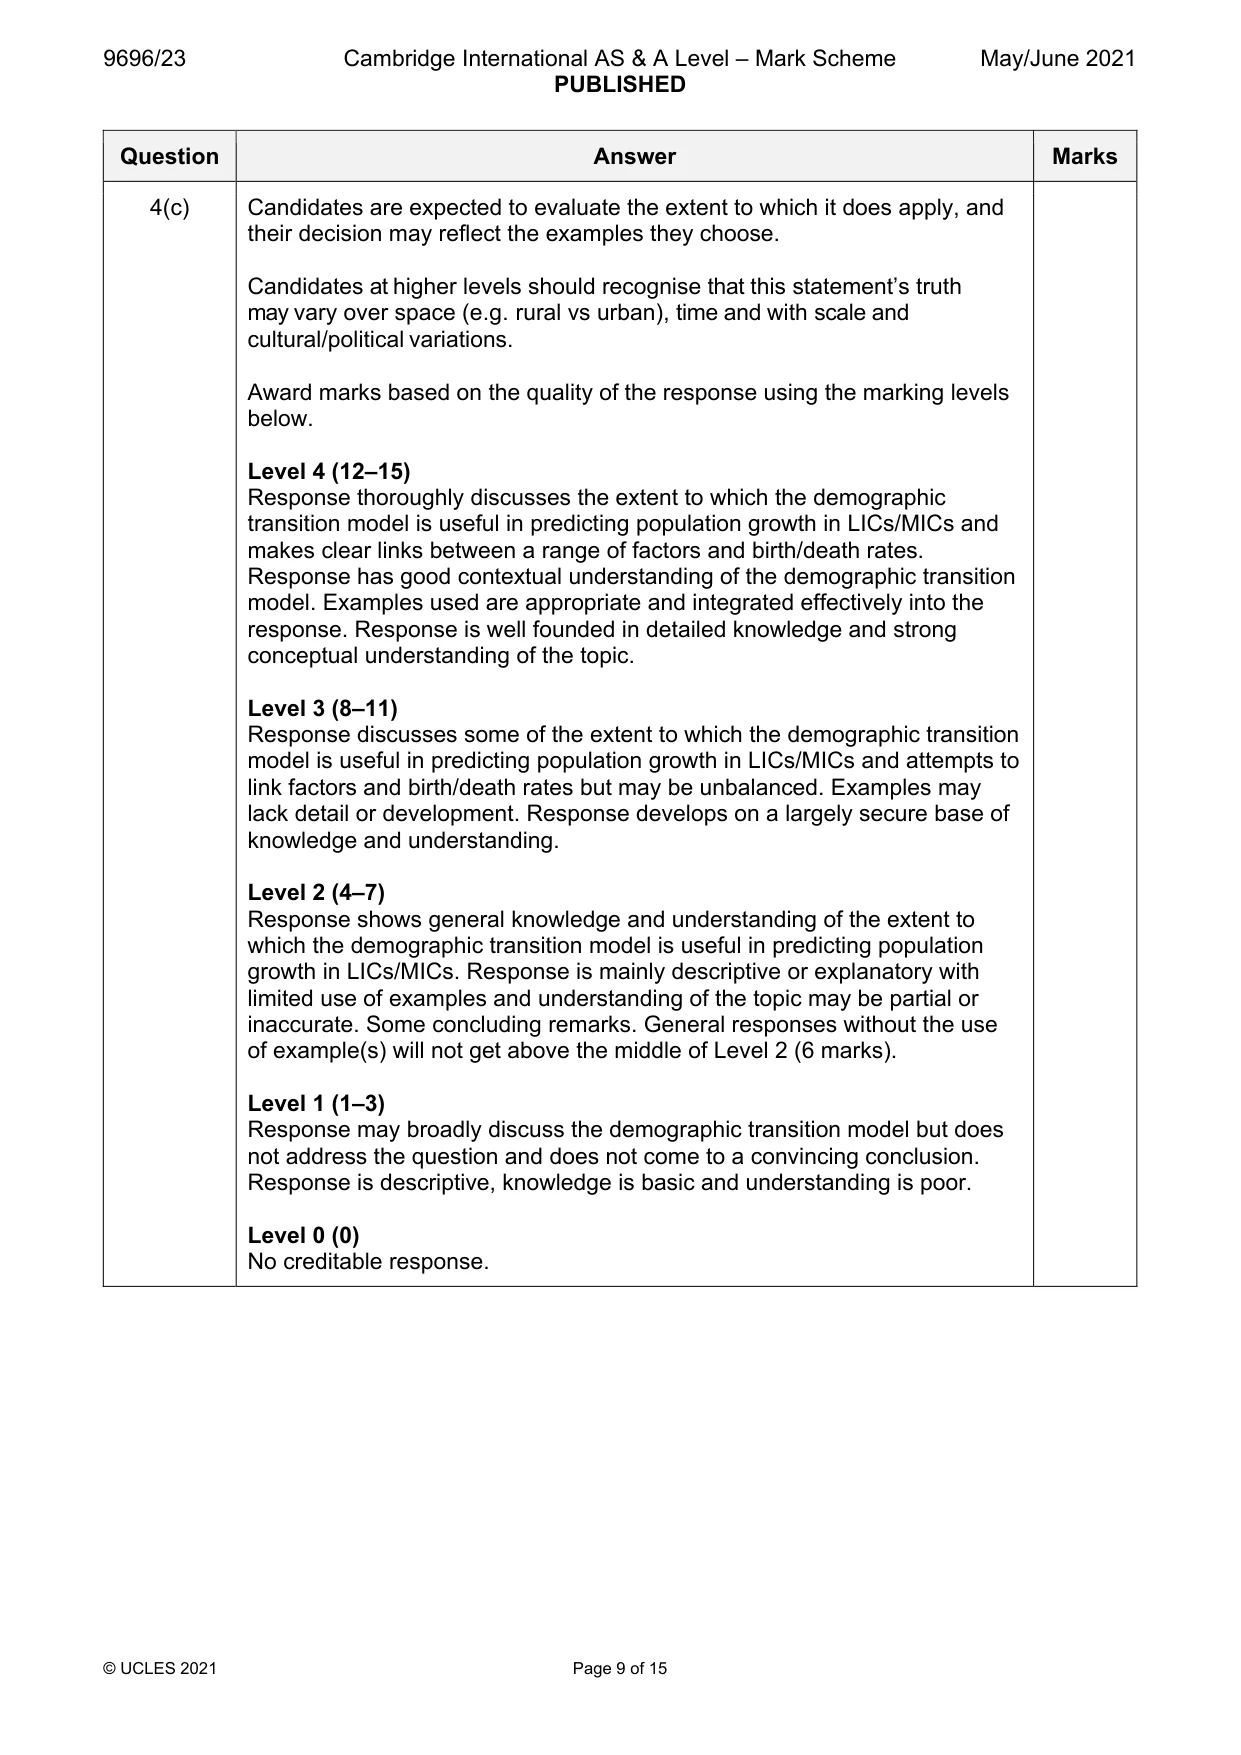
Mark scheme: 4(a) Describe how the birth rate changes over time in the demographic 7 transition model (DTM). Many will probably draw and label a diagram. Either way the distinct changes in the birth rate need to be linked to the stages of the model: • Stage 1 – high fluctuating – BR is high but fluctuates • Stage 2 – early expanding – BR high • Stage 3 – late expanding – BR falling rapidly • Stage 4 – low fluctuating – BR low and fluctuating • Stage 5 – natural decrease – BR even lower Point mark – 1 mark for stage and 1 mark for correctly stating the BR. 4(b) With the aid of examples, explain the changes in the birth rate you 8 described in (a). This should explain why the initially high birth rate declines with time/ development. Explanation needs to focus on the causes of birth rate decline such as: • Reduced infant mortality due to better health care, so less need to have lots of children in case they die • Education of women – marry later and want their own career rather than lots of children • Greater emancipation of women as traditional culture wanes • Increased wealth so can afford contraception • Increasing cost of children • Children less of an asset as laws stop child labour and pensions replace expectation that children will look after parents • Growth in materialism and urban lifestyle • Population policies 4(b) Award marks based on the quality of explanation and breadth of the response using the marking levels below. Level 3 (6–8) Response clearly explains in detail why the birth rate decreases with time/development. Response is well founded in detailed knowledge and strong conceptual understanding of the topic. Any examples used are appropriate and integrated effectively into the response. Level 2 (3–5) Response offers some explanation of why birth rate decreases with time/development. Response develops on a largely secure base of knowledge and understanding. Examples may lack detail or development. Max. 4 if no examples. Level 1 (1–2) Response is largely descriptive with limited explanation beyond simply an increase in contraception type response. Knowledge is basic and understanding may be inaccurate. Examples are in name only or lacking entirely. Level 0 (0) No creditable response. 4(c) With the aid of examples, assess the extent to which the demographic 15 transition model (DTM) is useful in predicting population growth in LICs/MICs. Candidates are free to develop their own approach to the question and responses will vary depending on the approach chosen. Whichever approach is chosen, essays which address the question and support their argument with relevant examples will be credited. There may be detailed consideration of a case study/one or more examples, or a broadly conceived response, drawing on several examples to illustrate the factors involved. To some extent the model fails to predict population growth in LICs/MICs as: • Based on western model so cultures, politics, etc., are very different • States now intervene with pro- or anti-birth policies • Many LICs starting at a much higher BR than the model • The link between DR and BR can be challenged • Transitions may speed up or stop depending on many factors, e.g. natural disaster But it can be argued that it does to some extent as: • Many LICs are seeing their BRs fall • Social changes do seem to impact on BRs • Medical advances are reducing IMR • Urban birth rates are much lower than rural 4(c) Candidates are expected to evaluate the extent to which it does apply, and their decision may reflect the examples they choose. Candidates at higher levels should recognise that this statement’s truth may vary over space (e.g. rural vs urban), time and with scale and cultural/political variations. Award marks based on the quality of the response using the marking levels below. Level 4 (12–15) Response thoroughly discusses the extent to which the demographic transition model is useful in predicting population growth in LICs/MICs and makes clear links between a range of factors and birth/death rates. Response has good contextual understanding of the demographic transition model. Examples used are appropriate and integrated effectively into the response. Response is well founded in detailed knowledge and strong conceptual understanding of the topic. Level 3 (8–11) Response discusses some of the extent to which the demographic transition model is useful in predicting population growth in LICs/MICs and attempts to link factors and birth/death rates but may be unbalanced. Examples may lack detail or development. Response develops on a largely secure base of knowledge and understanding. Level 2 (4–7) Response shows general knowledge and understanding of the extent to which the demographic transition model is useful in predicting population growth in LICs/MICs. Response is mainly descriptive or explanatory with limited use of examples and understanding of the topic may be partial or inaccurate. Some concluding remarks. General responses without the use of example(s) will not get above the middle of Level 2 (6 marks). Level 1 (1–3) Response may broadly discuss the demographic transition model but does not address the question and does not come to a convincing conclusion. Response is descriptive, knowledge is basic and understanding is poor. Level 0 (0) No creditable response. Migration/Settlement dynamics
Q5 · Describe the process of intra-urban migration
5 (a) (i) Describe the process of intra-urban migration. [3] (ii) Give two reasons why intra-urban migration may increase as a country develops. [4] (b) Explain why a person’s age may influence intra-urban migration. [8] (c) ‘Internal migration in many HICs has created urban areas with empty cores.’ With the aid of examples, to what extent do you agree with this view? [15] Settlement dynamics
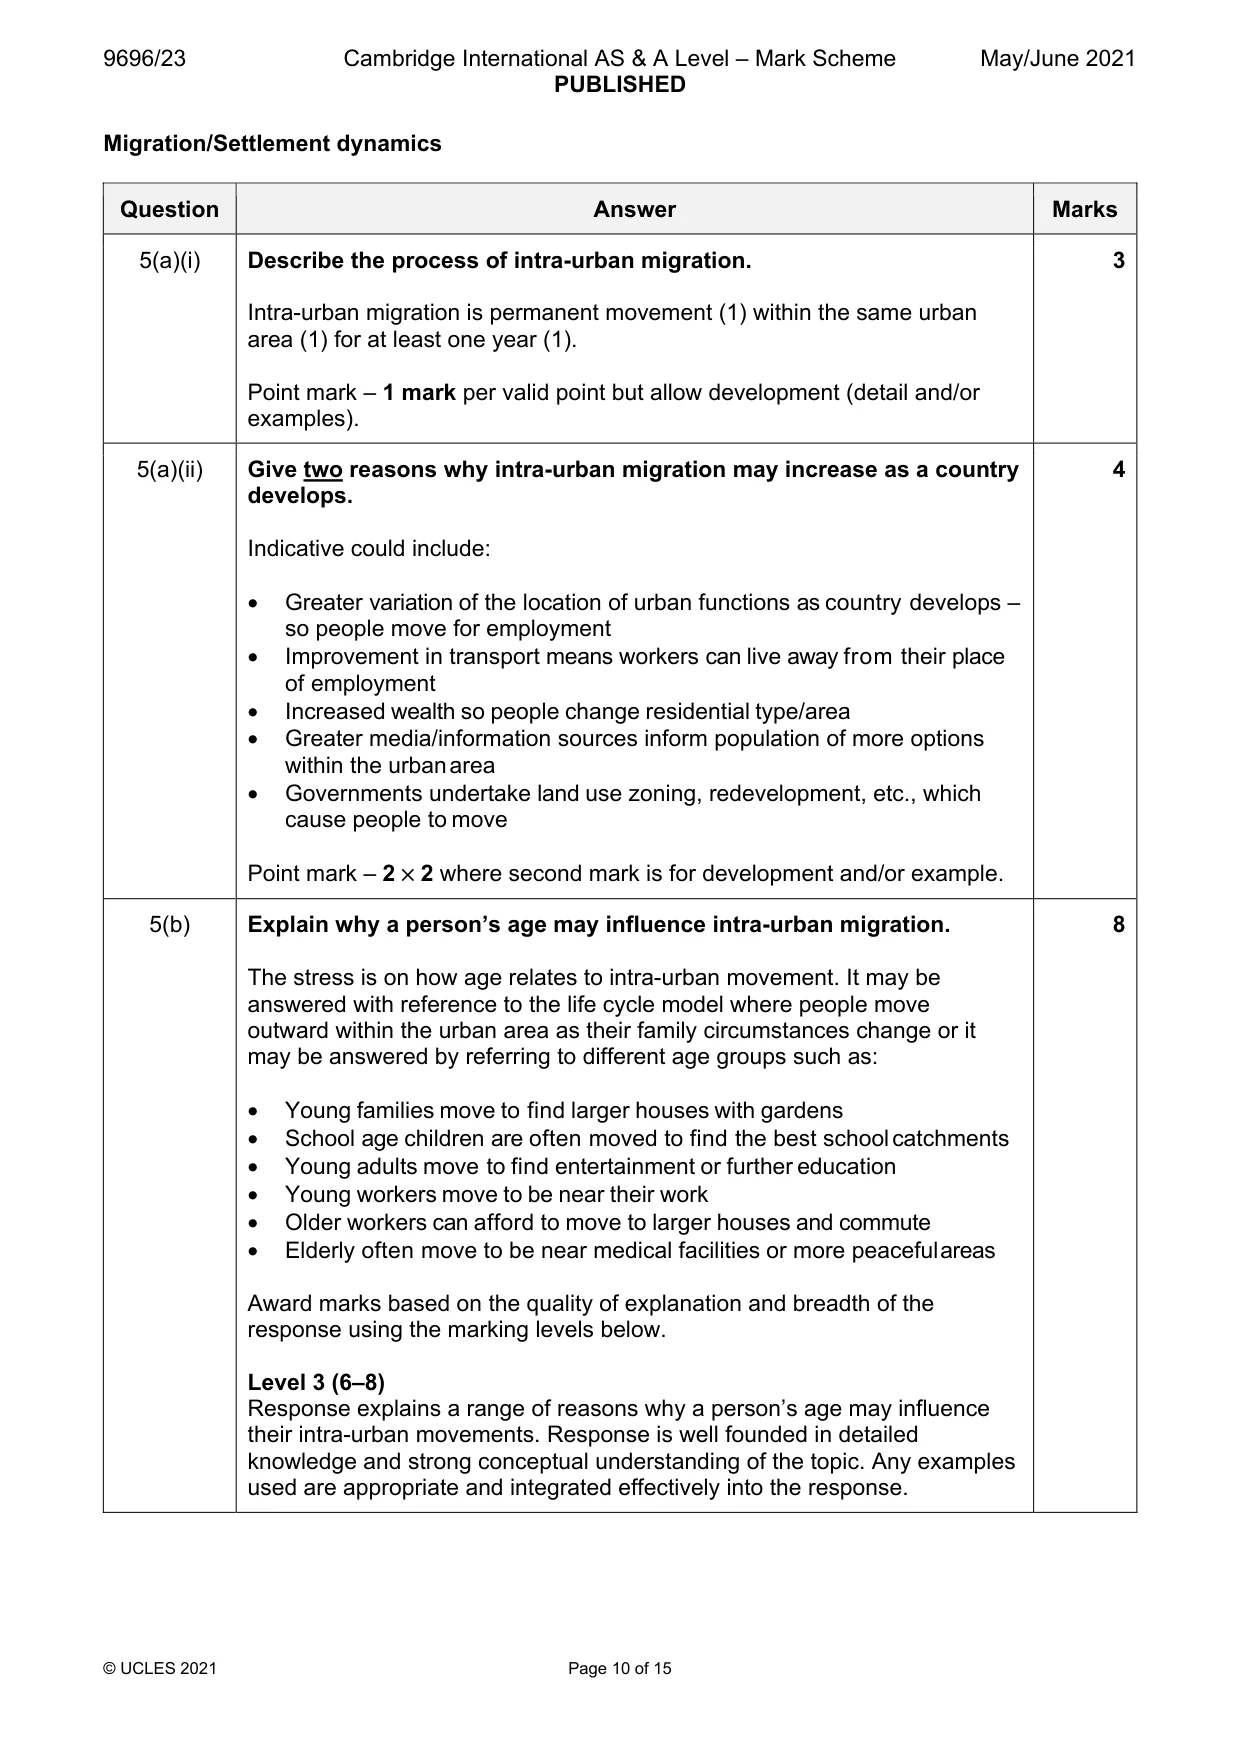
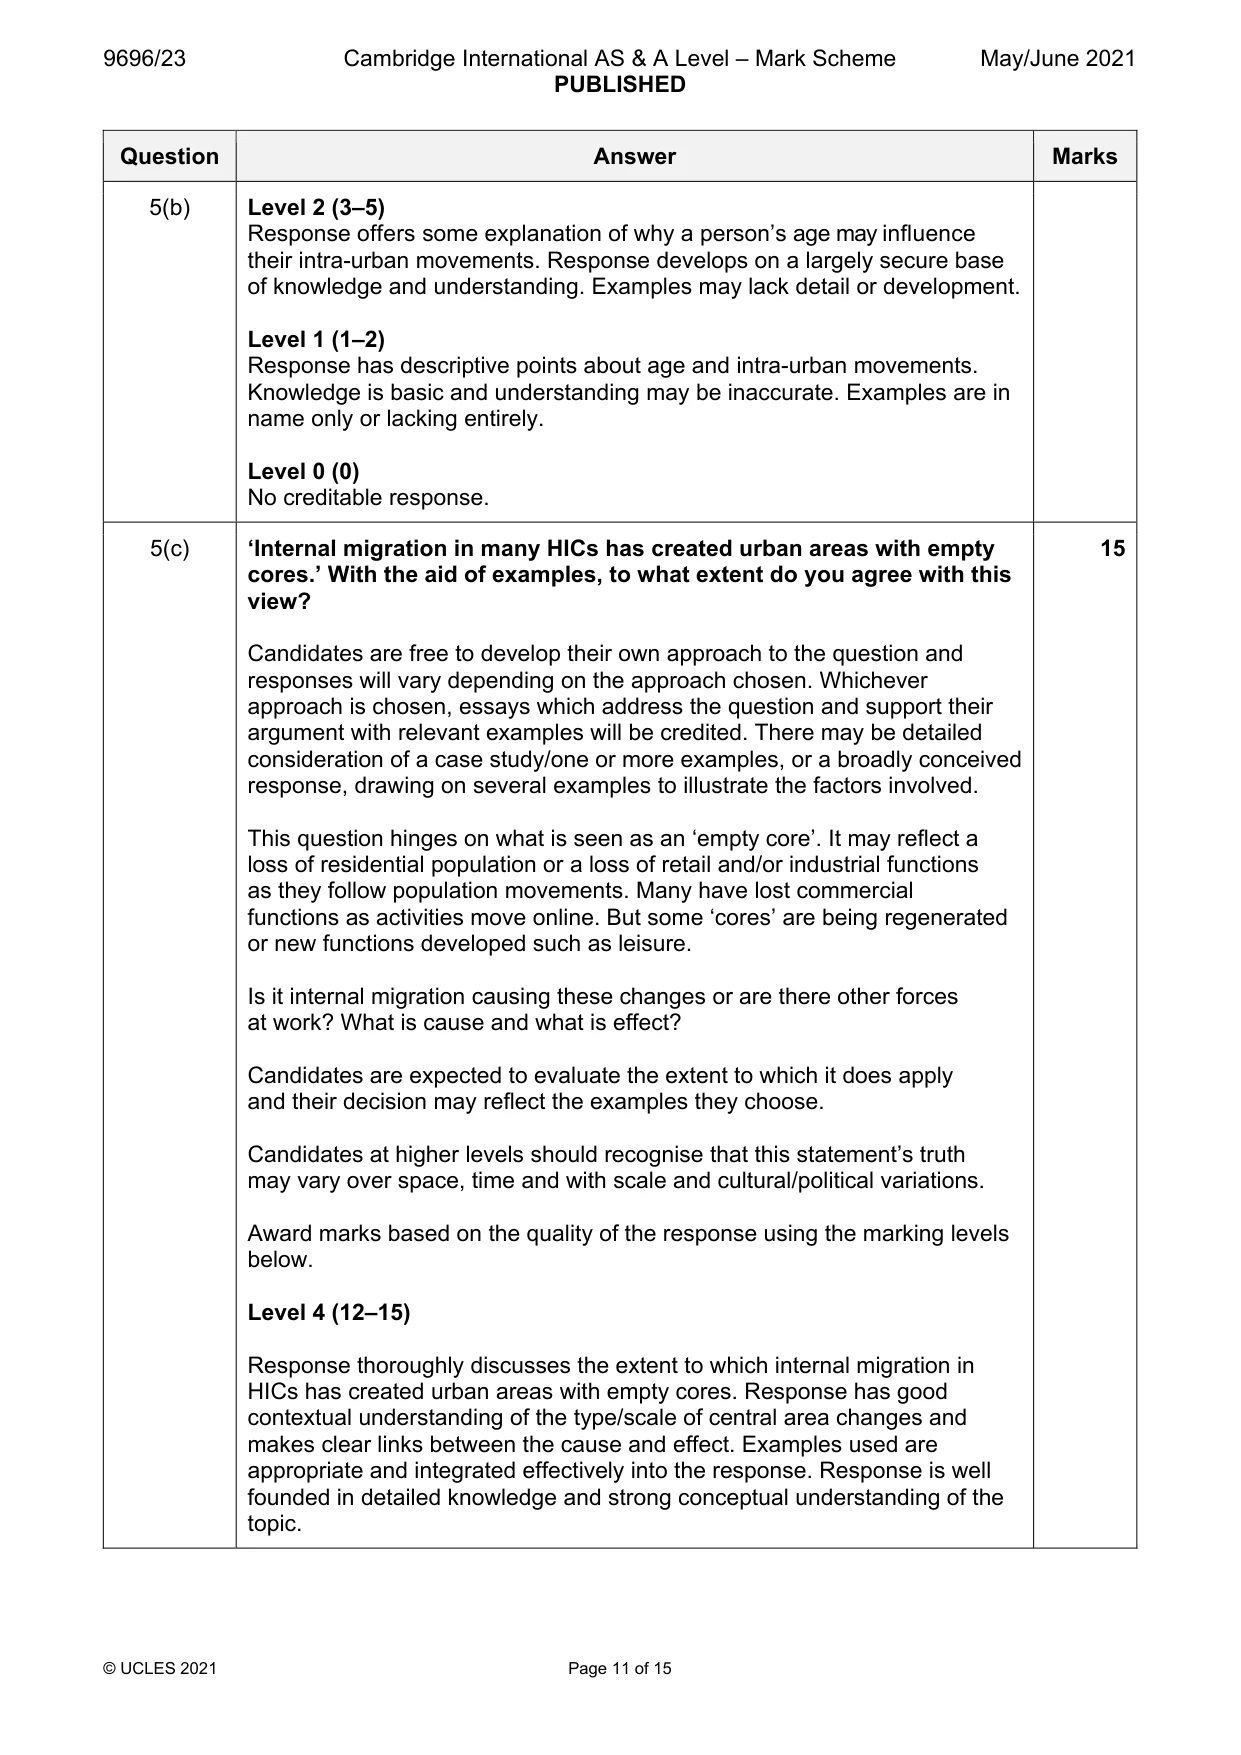
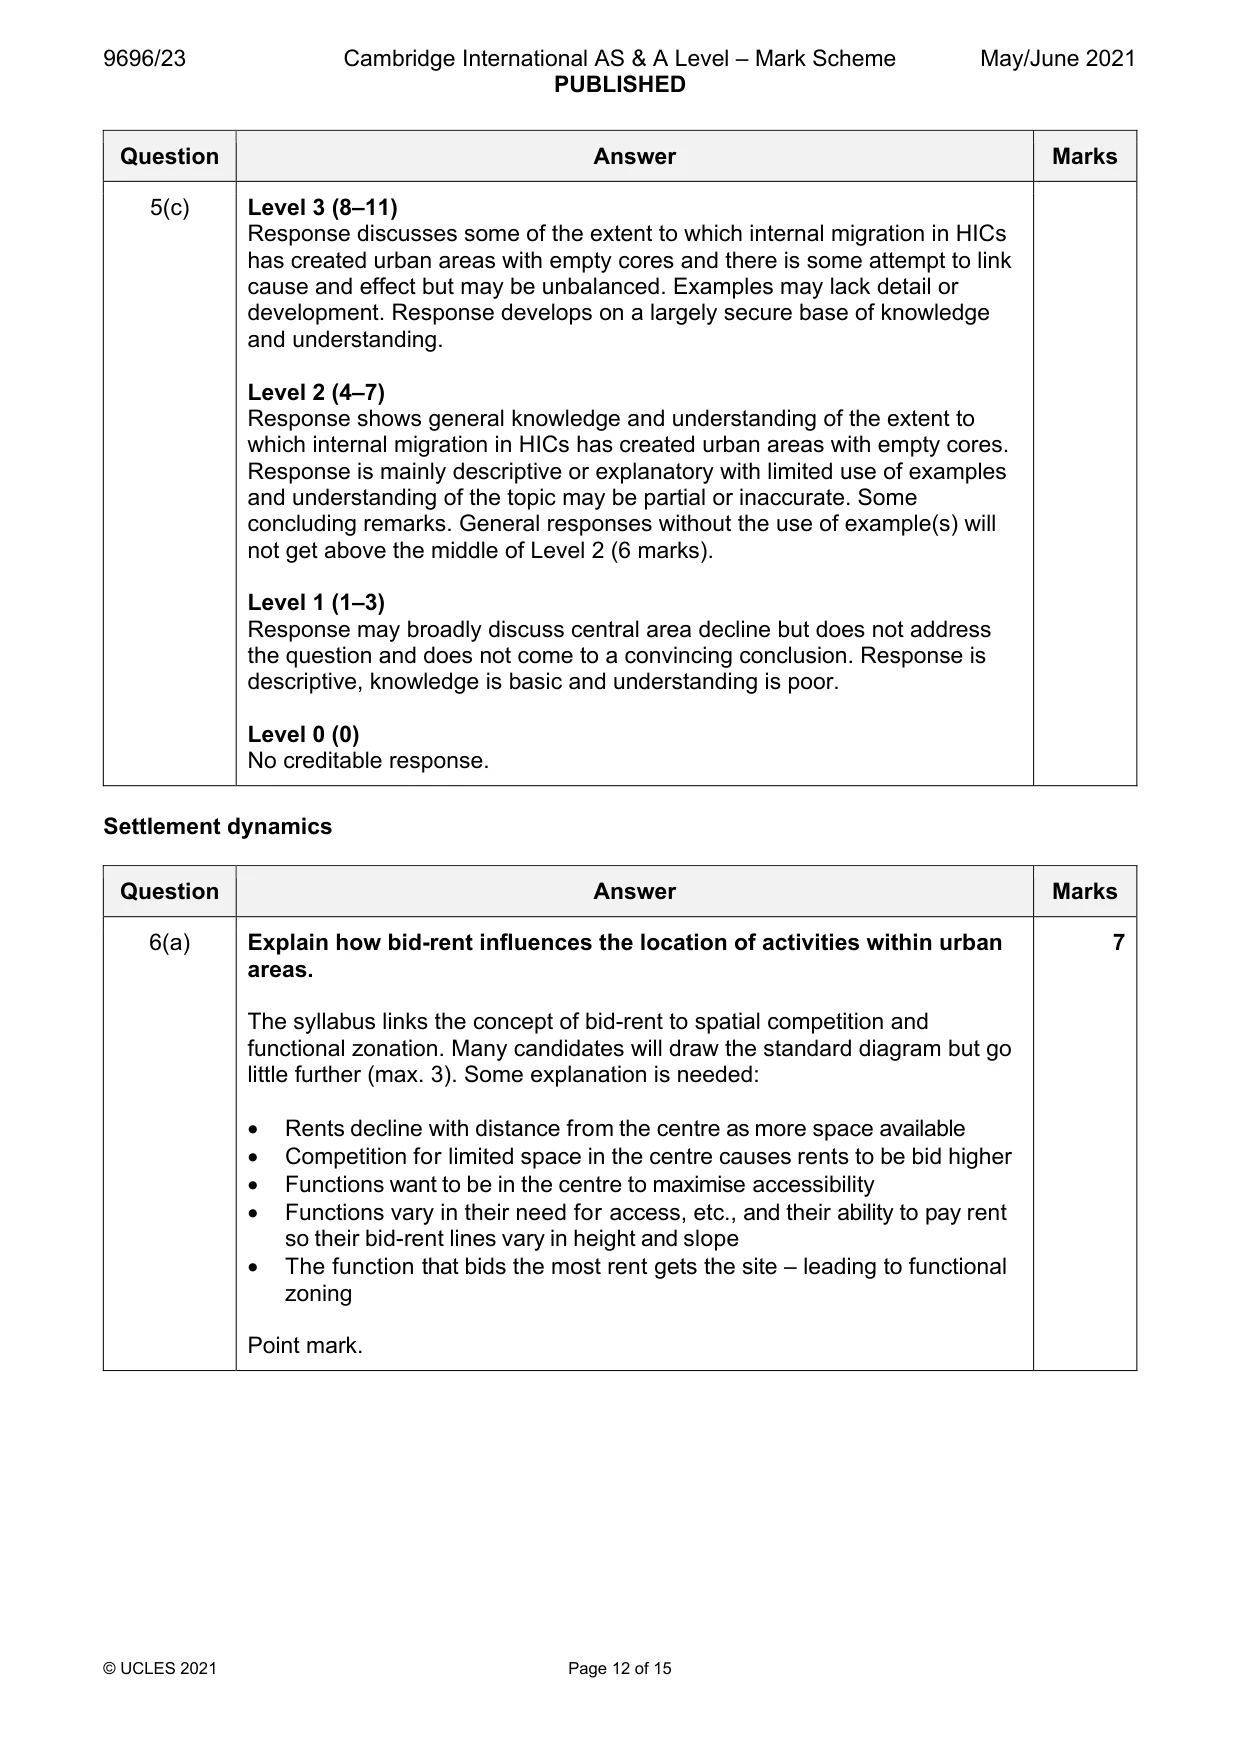
Mark scheme: 5(a)(i) Describe the process of intra-urban migration. 3 Intra-urban migration is permanent movement (1) within the same urban area (1) for at least one year (1). Point mark – 1 mark per valid point but allow development (detail and/or examples). 5(a)(ii) Give two reasons why intra-urban migration may increase as a country 4 develops. Indicative could include: • Greater variation of the location of urban functions as country develops – so people move for employment • Improvement in transport means workers can live away from their place of employment • Increased wealth so people change residential type/area • Greater media/information sources inform population of more options within the urban area • Governments undertake land use zoning, redevelopment, etc., which cause people to move Point mark – 2 × 2 where second mark is for development and/or example. 5(b) Explain why a person’s age may influence intra-urban migration. 8 The stress is on how age relates to intra-urban movement. It may be answered with reference to the life cycle model where people move outward within the urban area as their family circumstances change or it may be answered by referring to different age groups such as: • Young families move to find larger houses with gardens • School age children are often moved to find the best school catchments • Young adults move to find entertainment or further education • Young workers move to be near their work • Older workers can afford to move to larger houses and commute • Elderly often move to be near medical facilities or more peaceful areas Award marks based on the quality of explanation and breadth of the response using the marking levels below. Level 3 (6–8) Response explains a range of reasons why a person’s age may influence their intra-urban movements. Response is well founded in detailed knowledge and strong conceptual understanding of the topic. Any examples used are appropriate and integrated effectively into the response. 5(b) Level 2 (3–5) Response offers some explanation of why a person’s age may influence their intra-urban movements. Response develops on a largely secure base of knowledge and understanding. Examples may lack detail or development. Level 1 (1–2) Response has descriptive points about age and intra-urban movements. Knowledge is basic and understanding may be inaccurate. Examples are in name only or lacking entirely. Level 0 (0) No creditable response. 5(c) ‘Internal migration in many HICs has created urban areas with empty 15 cores.’ With the aid of examples, to what extent do you agree with this view? Candidates are free to develop their own approach to the question and responses will vary depending on the approach chosen. Whichever approach is chosen, essays which address the question and support their argument with relevant examples will be credited. There may be detailed consideration of a case study/one or more examples, or a broadly conceived response, drawing on several examples to illustrate the factors involved. This question hinges on what is seen as an ‘empty core’. It may reflect a loss of residential population or a loss of retail and/or industrial functions as they follow population movements. Many have lost commercial functions as activities move online. But some ‘cores’ are being regenerated or new functions developed such as leisure. Is it internal migration causing these changes or are there other forces at work? What is cause and what is effect? Candidates are expected to evaluate the extent to which it does apply and their decision may reflect the examples they choose. Candidates at higher levels should recognise that this statement’s truth may vary over space, time and with scale and cultural/political variations. Award marks based on the quality of the response using the marking levels below. Level 4 (12–15) Response thoroughly discusses the extent to which internal migration in HICs has created urban areas with empty cores. Response has good contextual understanding of the type/scale of central area changes and makes clear links between the cause and effect. Examples used are appropriate and integrated effectively into the response. Response is well founded in detailed knowledge and strong conceptual understanding of the topic. 5(c) Level 3 (8–11) Response discusses some of the extent to which internal migration in HICs has created urban areas with empty cores and there is some attempt to link cause and effect but may be unbalanced. Examples may lack detail or development. Response develops on a largely secure base of knowledge and understanding. Level 2 (4–7) Response shows general knowledge and understanding of the extent to which internal migration in HICs has created urban areas with empty cores. Response is mainly descriptive or explanatory with limited use of examples and understanding of the topic may be partial or inaccurate. Some concluding remarks. General responses without the use of example(s) will not get above the middle of Level 2 (6 marks). Level 1 (1–3) Response may broadly discuss central area decline but does not address the question and does not come to a convincing conclusion. Response is descriptive, knowledge is basic and understanding is poor. Level 0 (0) No creditable response. Settlement dynamics
Q6 · Explain how bid-rent influences the location of activities within urban areas
6 (a) Explain how bid-rent influences the location of activities within urban areas. [7] (b) With the aid of examples, explain how manufacturing has changed location in urban areas in LICs/MICs. [8] (c) ‘Economic factors are the most important influences on the structure of urban settlements.’ With the aid of examples, how far do you agree? [15]
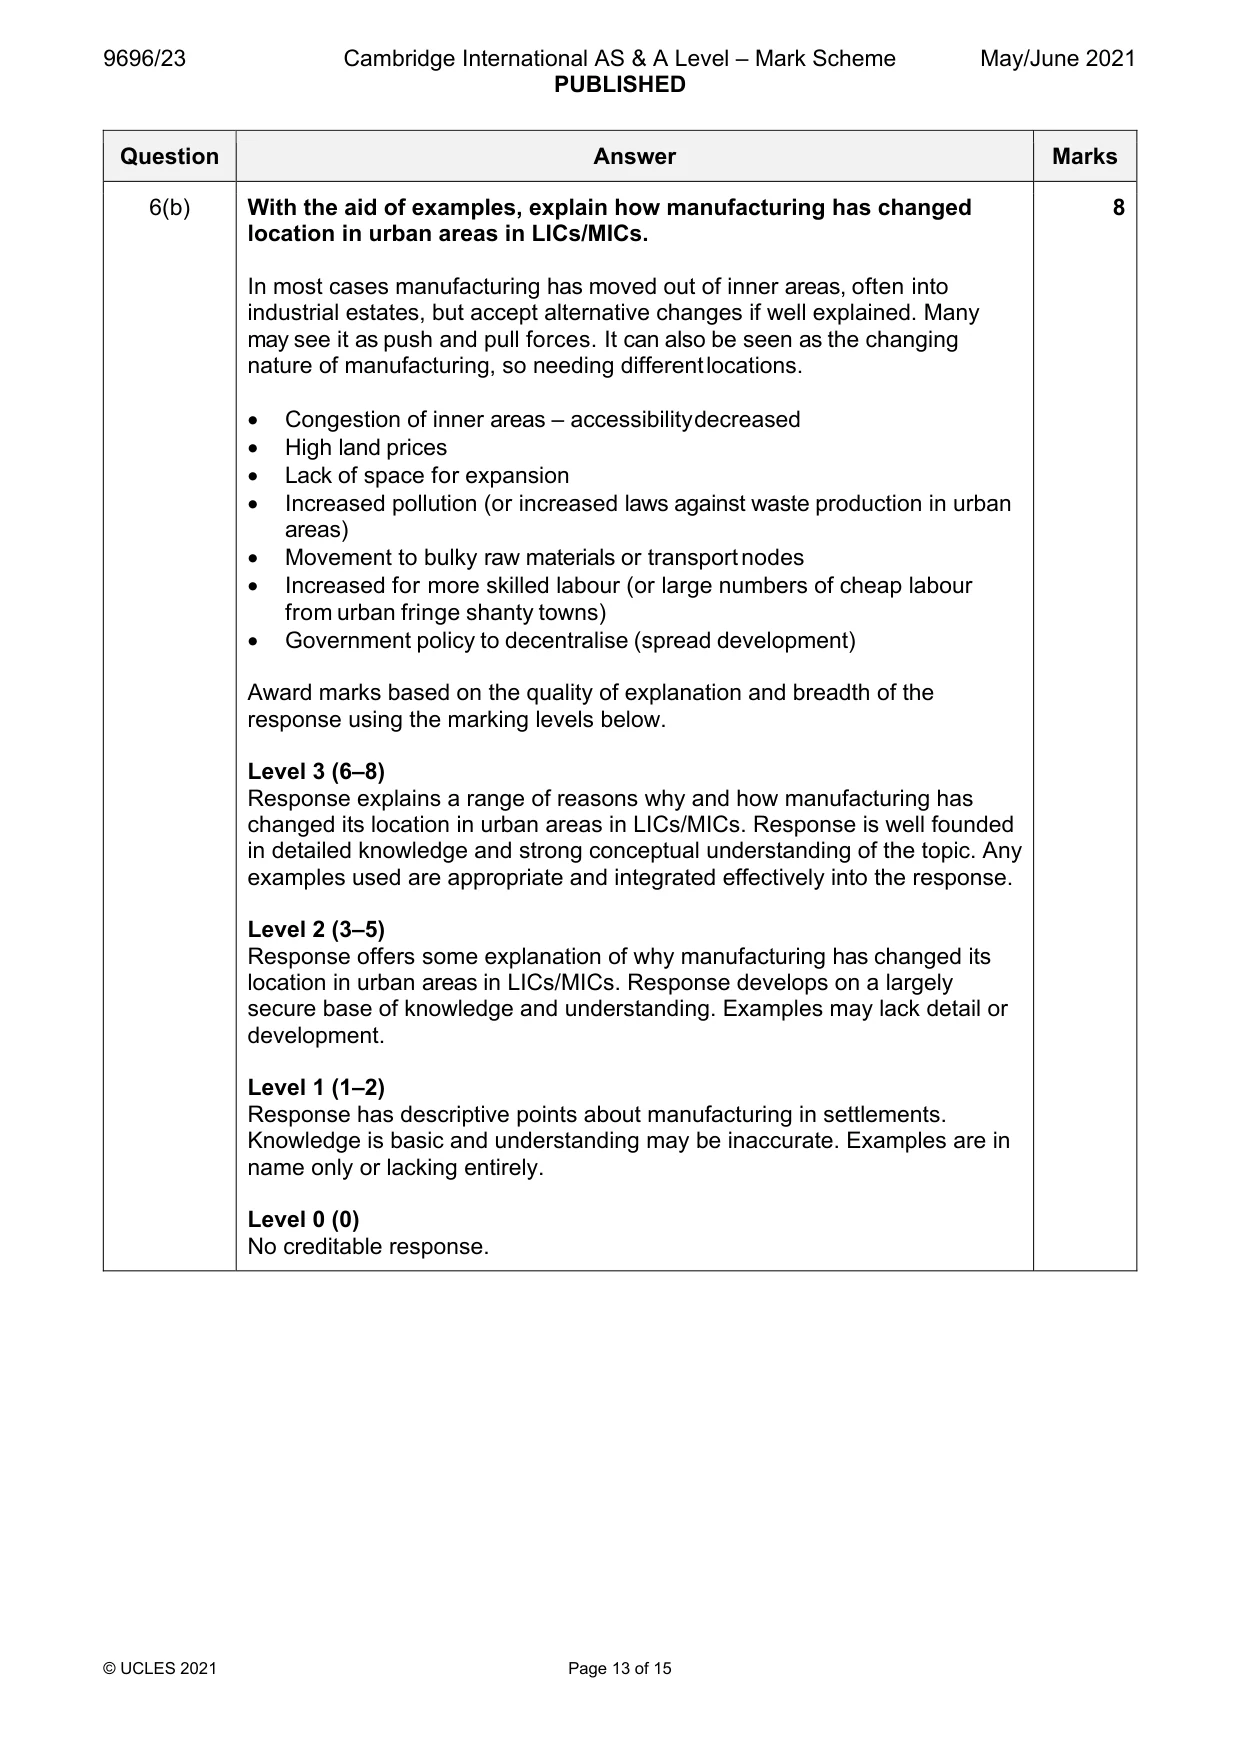
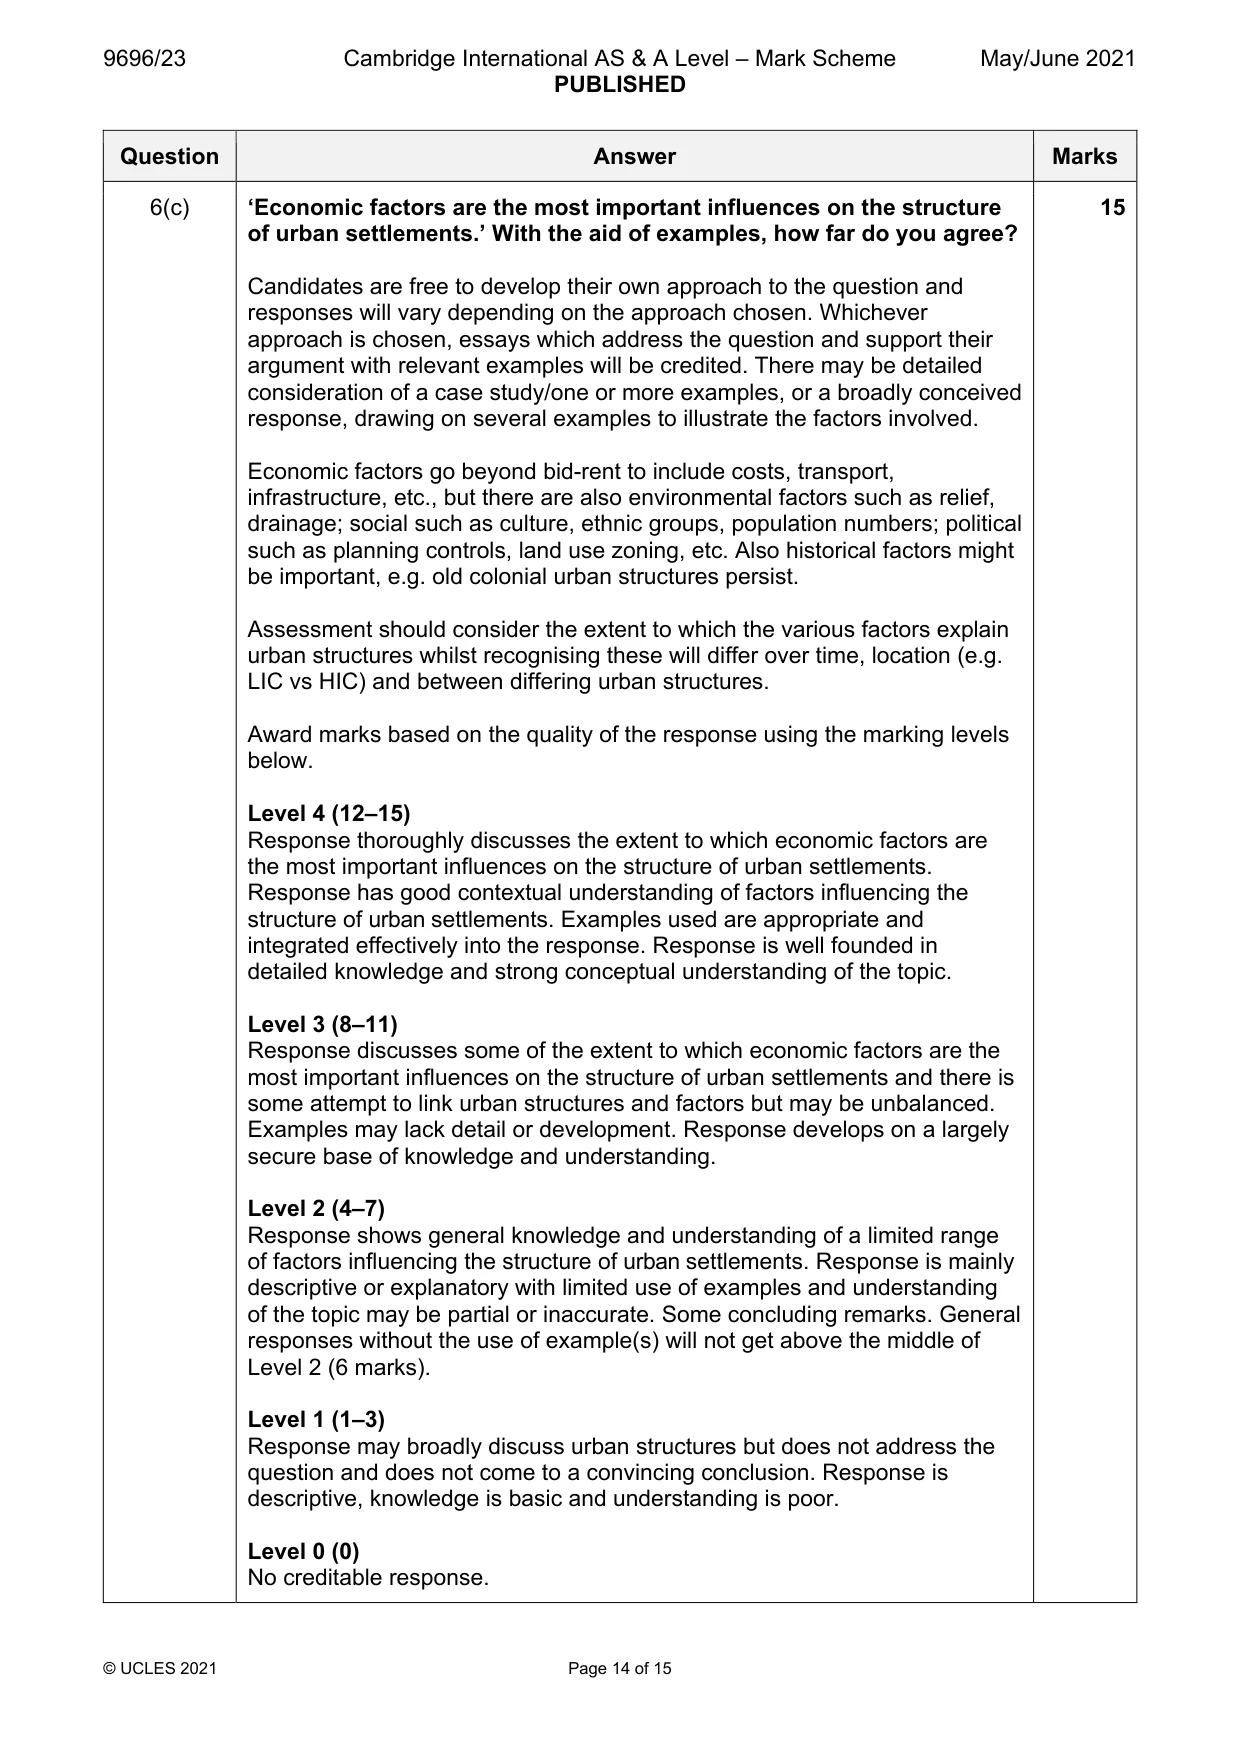
Mark scheme: 6(a) Explain how bid-rent influences the location of activities within urban 7 areas. The syllabus links the concept of bid-rent to spatial competition and functional zonation. Many candidates will draw the standard diagram but go little further (max. 3). Some explanation is needed: • Rents decline with distance from the centre as more space available • Competition for limited space in the centre causes rents to be bid higher • Functions want to be in the centre to maximise accessibility • Functions vary in their need for access, etc., and their ability to pay rent so their bid-rent lines vary in height and slope • The function that bids the most rent gets the site – leading to functional zoning Point mark. 6(b) With the aid of examples, explain how manufacturing has changed 8 location in urban areas in LICs/MICs. In most cases manufacturing has moved out of inner areas, often into industrial estates, but accept alternative changes if well explained. Many may see it as push and pull forces. It can also be seen as the changing nature of manufacturing, so needing different locations. • Congestion of inner areas – accessibility decreased • High land prices • Lack of space for expansion • Increased pollution (or increased laws against waste production in urban areas) • Movement to bulky raw materials or transport nodes • Increased for more skilled labour (or large numbers of cheap labour from urban fringe shanty towns) • Government policy to decentralise (spread development) Award marks based on the quality of explanation and breadth of the response using the marking levels below. Level 3 (6–8) Response explains a range of reasons why and how manufacturing has changed its location in urban areas in LICs/MICs. Response is well founded in detailed knowledge and strong conceptual understanding of the topic. Any examples used are appropriate and integrated effectively into the response. Level 2 (3–5) Response offers some explanation of why manufacturing has changed its location in urban areas in LICs/MICs. Response develops on a largely secure base of knowledge and understanding. Examples may lack detail or development. Level 1 (1–2) Response has descriptive points about manufacturing in settlements. Knowledge is basic and understanding may be inaccurate. Examples are in name only or lacking entirely. Level 0 (0) No creditable response. 6(c) ‘Economic factors are the most important influences on the structure 15 of urban settlements.’ With the aid of examples, how far do you agree? Candidates are free to develop their own approach to the question and responses will vary depending on the approach chosen. Whichever approach is chosen, essays which address the question and support their argument with relevant examples will be credited. There may be detailed consideration of a case study/one or more examples, or a broadly conceived response, drawing on several examples to illustrate the factors involved. Economic factors go beyond bid-rent to include costs, transport, infrastructure, etc., but there are also environmental factors such as relief, drainage; social such as culture, ethnic groups, population numbers; political such as planning controls, land use zoning, etc. Also historical factors might be important, e.g. old colonial urban structures persist. Assessment should consider the extent to which the various factors explain urban structures whilst recognising these will differ over time, location (e.g. LIC vs HIC) and between differing urban structures. Award marks based on the quality of the response using the marking levels below. Level 4 (12–15) Response thoroughly discusses the extent to which economic factors are the most important influences on the structure of urban settlements. Response has good contextual understanding of factors influencing the structure of urban settlements. Examples used are appropriate and integrated effectively into the response. Response is well founded in detailed knowledge and strong conceptual understanding of the topic. Level 3 (8–11) Response discusses some of the extent to which economic factors are the most important influences on the structure of urban settlements and there is some attempt to link urban structures and factors but may be unbalanced. Examples may lack detail or development. Response develops on a largely secure base of knowledge and understanding. Level 2 (4–7) Response shows general knowledge and understanding of a limited range of factors influencing the structure of urban settlements. Response is mainly descriptive or explanatory with limited use of examples and understanding of the topic may be partial or inaccurate. Some concluding remarks. General responses without the use of example(s) will not get above the middle of Level 2 (6 marks). Level 1 (1–3) Response may broadly discuss urban structures but does not address the question and does not come to a convincing conclusion. Response is descriptive, knowledge is basic and understanding is poor. Level 0 (0) No creditable response.
What was in this paper
The subtopics covered by these 6 questions, and how many questions each got. Open one in a new tab to see every Cambridge question on it.
What you needed in this session
Cambridge’s own grade thresholds for 2021 May/June, Paper 2 · Variant 3. A higher threshold means an easier paper — the bar moves with how the cohort did.