Cambridge A Level Geography 9696 — 2021 May/June Paper 2 · Variant 2
9696/22/M/J/21 · 6 questions · 60 marks · ≈68 min
The question paper and its mark scheme, free to read here and free to download. This is Cambridge’s own paper, exactly as it was sat.
Question paper4 pages
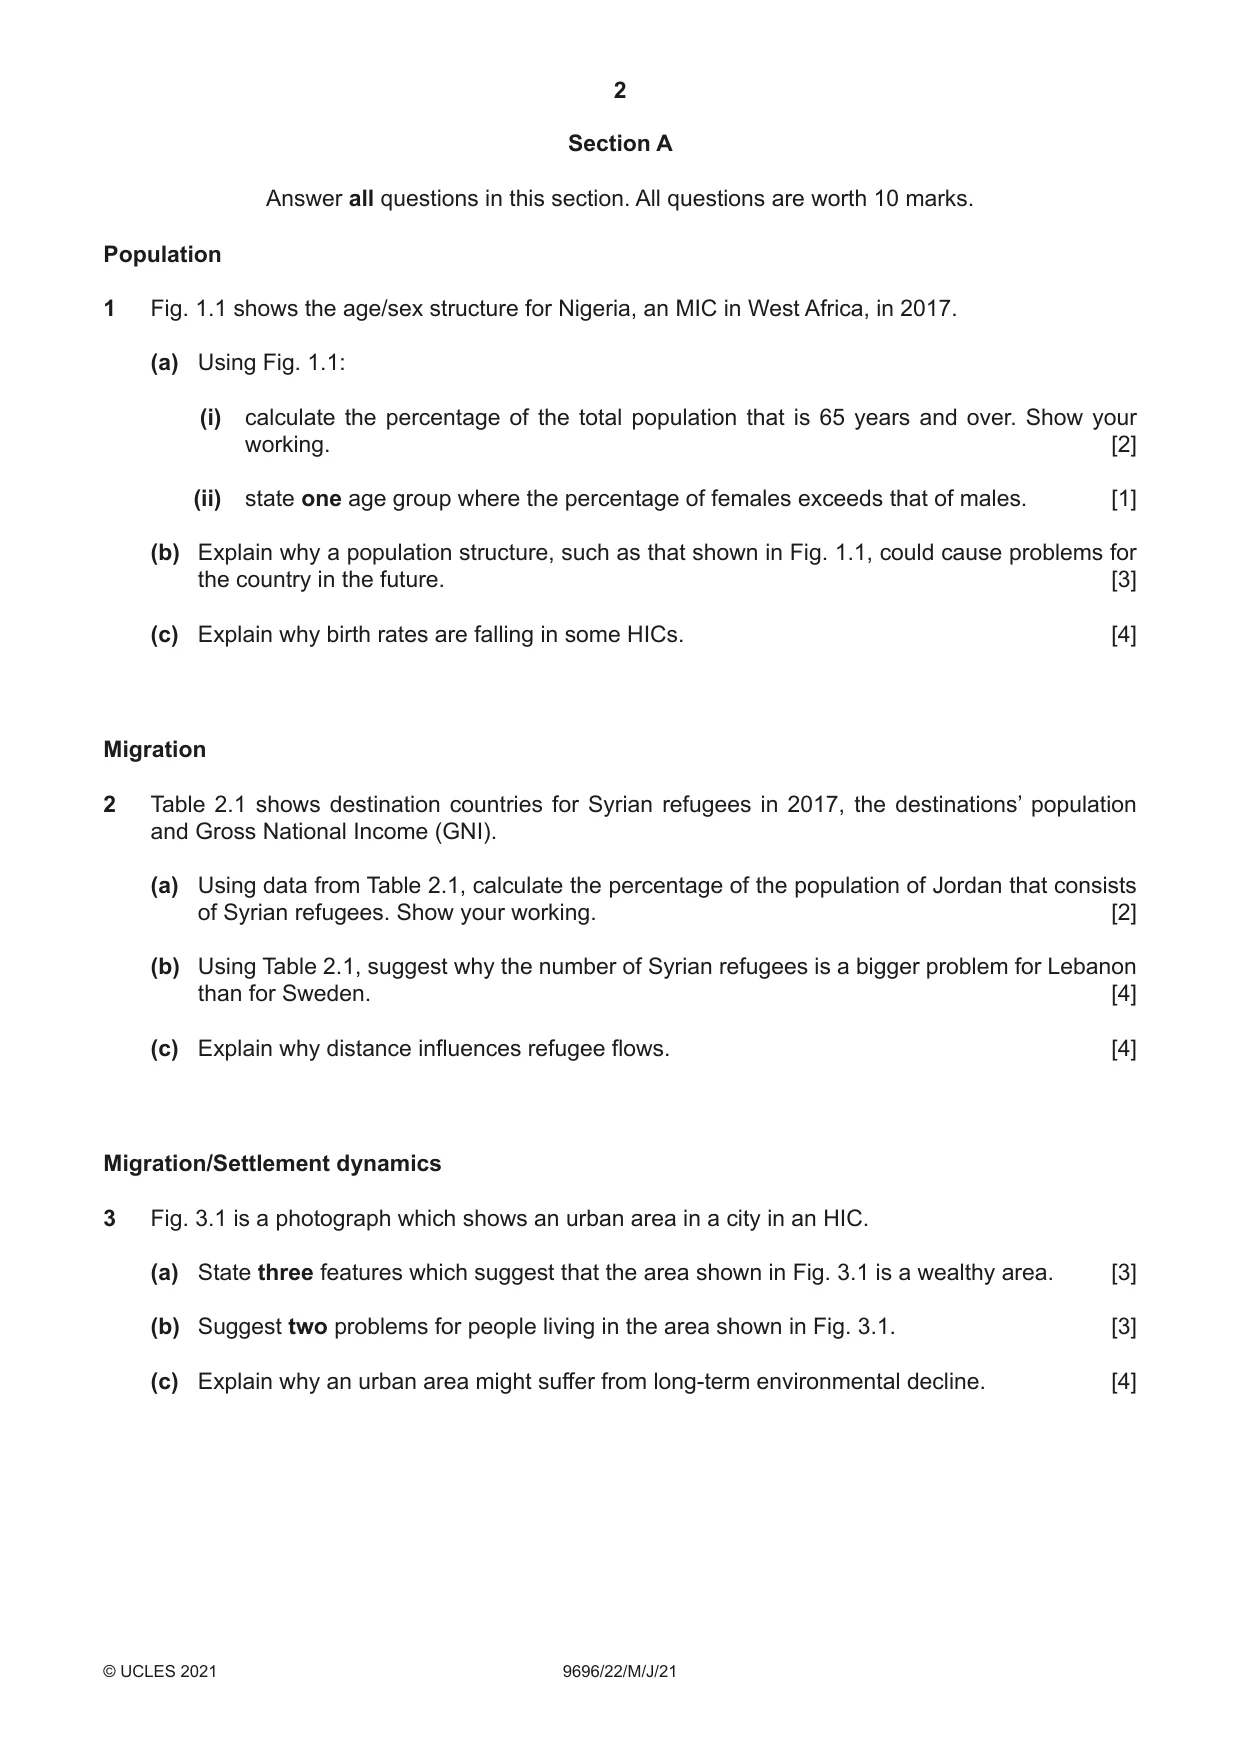

Mark scheme17 pages
Answers below. Sit the paper first if you are practising.





Questions as text
Q1 · The age/sex structure for Nigeria, an MIC in West Africa, in 2017
1 Fig. 1.1 shows the age/sex structure for Nigeria, an MIC in West Africa, in 2017. (a) Using Fig. 1.1: (i) calculate the percentage of the total population that is 65 years and over. Show your working. [2] (ii) state one age group where the percentage of females exceeds that of males. [1] (b) Explain why a population structure, such as that shown in Fig. 1.1, could cause problems for the country in the future. [3] (c) Explain why birth rates are falling in some HICs. [4] Migration
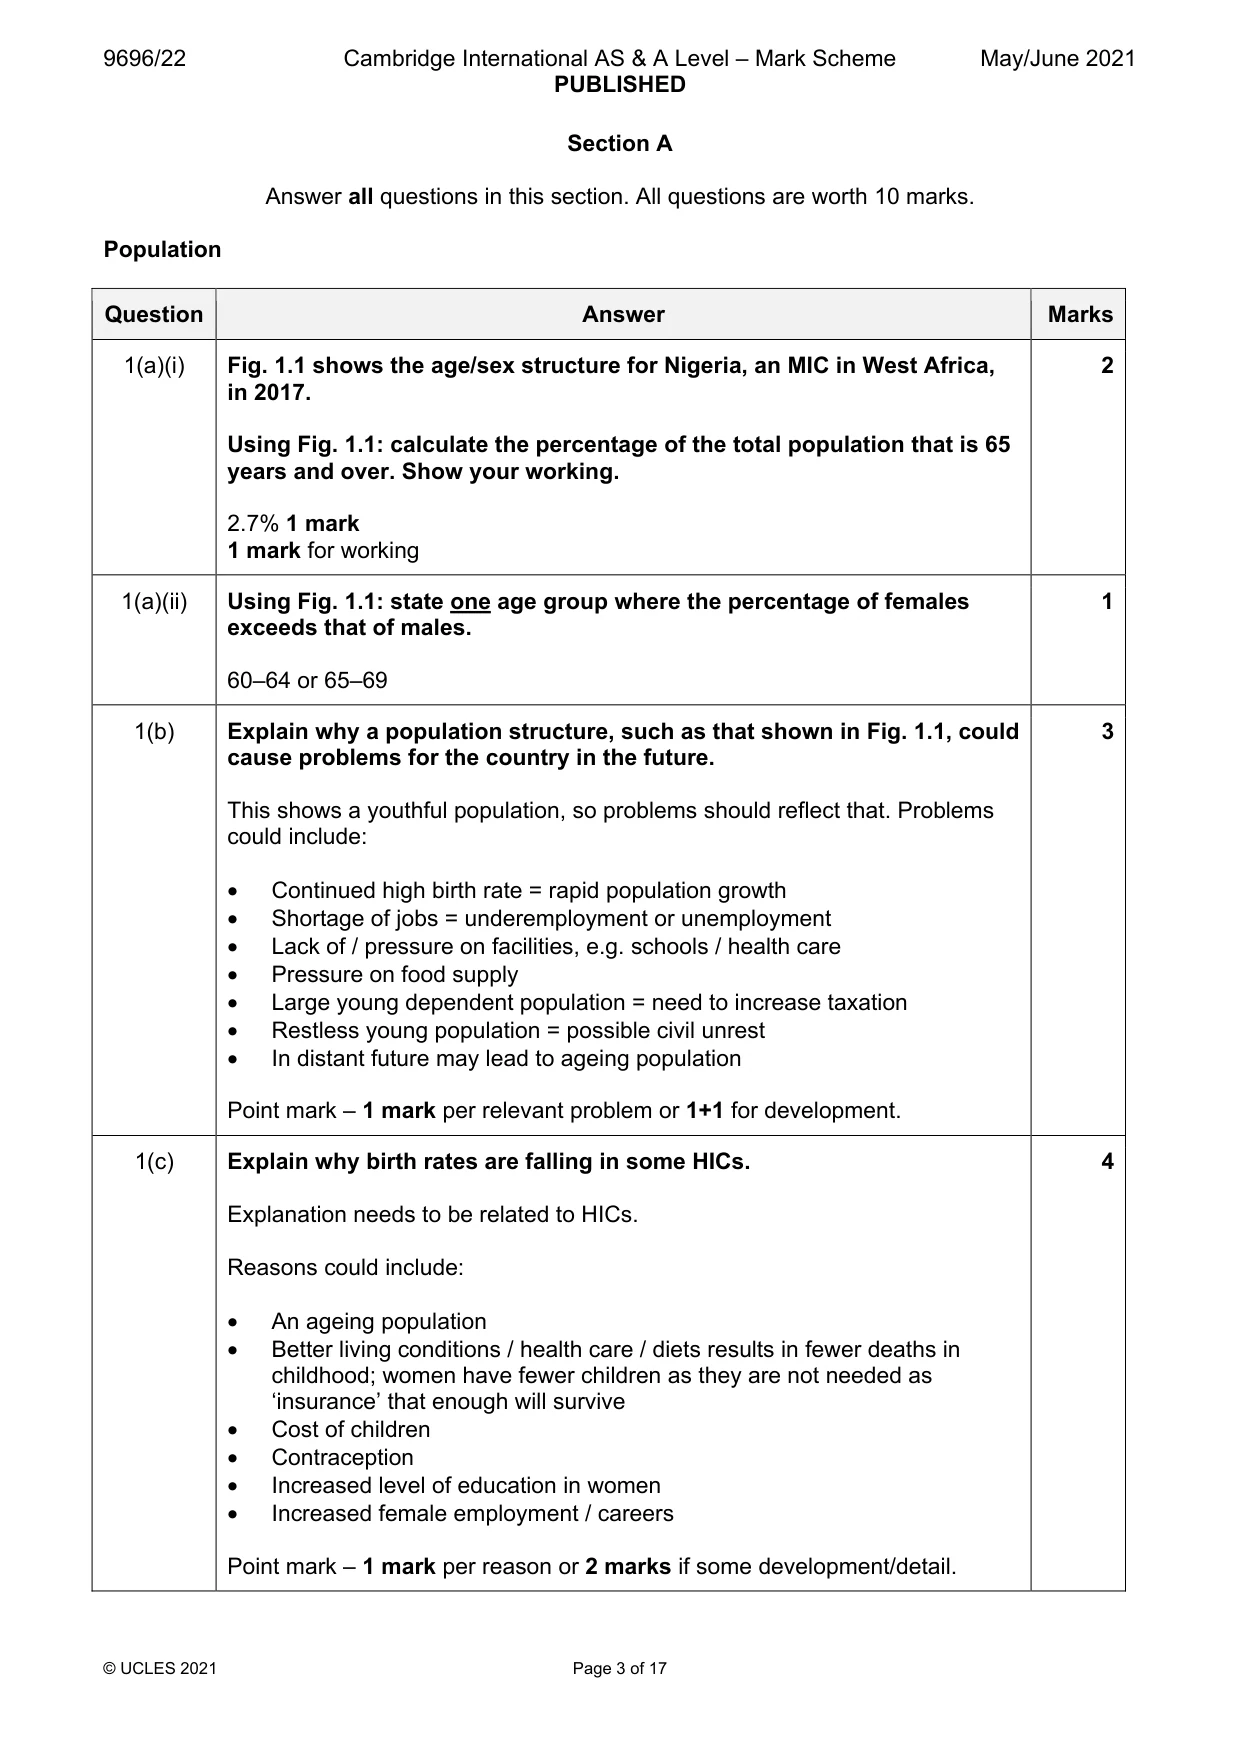
Mark scheme: Question Answer Marks 1(a)(i) Fig. 1.1 shows the age/sex structure for Nigeria, an MIC in West Africa, 2 in 2017. Using Fig. 1.1: calculate the percentage of the total population that is 65 years and over. Show your working. 2.7% 1 mark 1 mark for working 1(a)(ii) Using Fig. 1.1: state one age group where the percentage of females 1 exceeds that of males. 60–64 or 65–69 1(b) Explain why a population structure, such as that shown in Fig. 1.1, could 3 cause problems for the country in the future. This shows a youthful population, so problems should reflect that. Problems could include: • Continued high birth rate = rapid population growth • Shortage of jobs = underemployment or unemployment • Lack of / pressure on facilities, e.g. schools / health care • Pressure on food supply • Large young dependent population = need to increase taxation • Restless young population = possible civil unrest • In distant future may lead to ageing population Point mark – 1 mark per relevant problem or 1+1 for development. 1(c) Explain why birth rates are falling in some HICs. 4 Explanation needs to be related to HICs. Reasons could include: • An ageing population • Better living conditions / health care / diets results in fewer deaths in childhood; women have fewer children as they are not needed as ‘insurance’ that enough will survive • Cost of children • Contraception • Increased level of education in women • Increased female employment / careers Point mark – 1 mark per reason or 2 marks if some development/detail. Migration
Q2 · Destination countries for Syrian refugees in 2017, the destinations’ population and Gross…
2 Table 2.1 shows destination countries for Syrian refugees in 2017, the destinations’ population and Gross National Income (GNI). (a) Using data from Table 2.1, calculate the percentage of the population of Jordan that consists of Syrian refugees. Show your working. [2] (b) Using Table 2.1, suggest why the number of Syrian refugees is a bigger problem for Lebanon than for Sweden. [4] (c) Explain why distance influences refugee flows. [4] Migration/Settlement dynamics
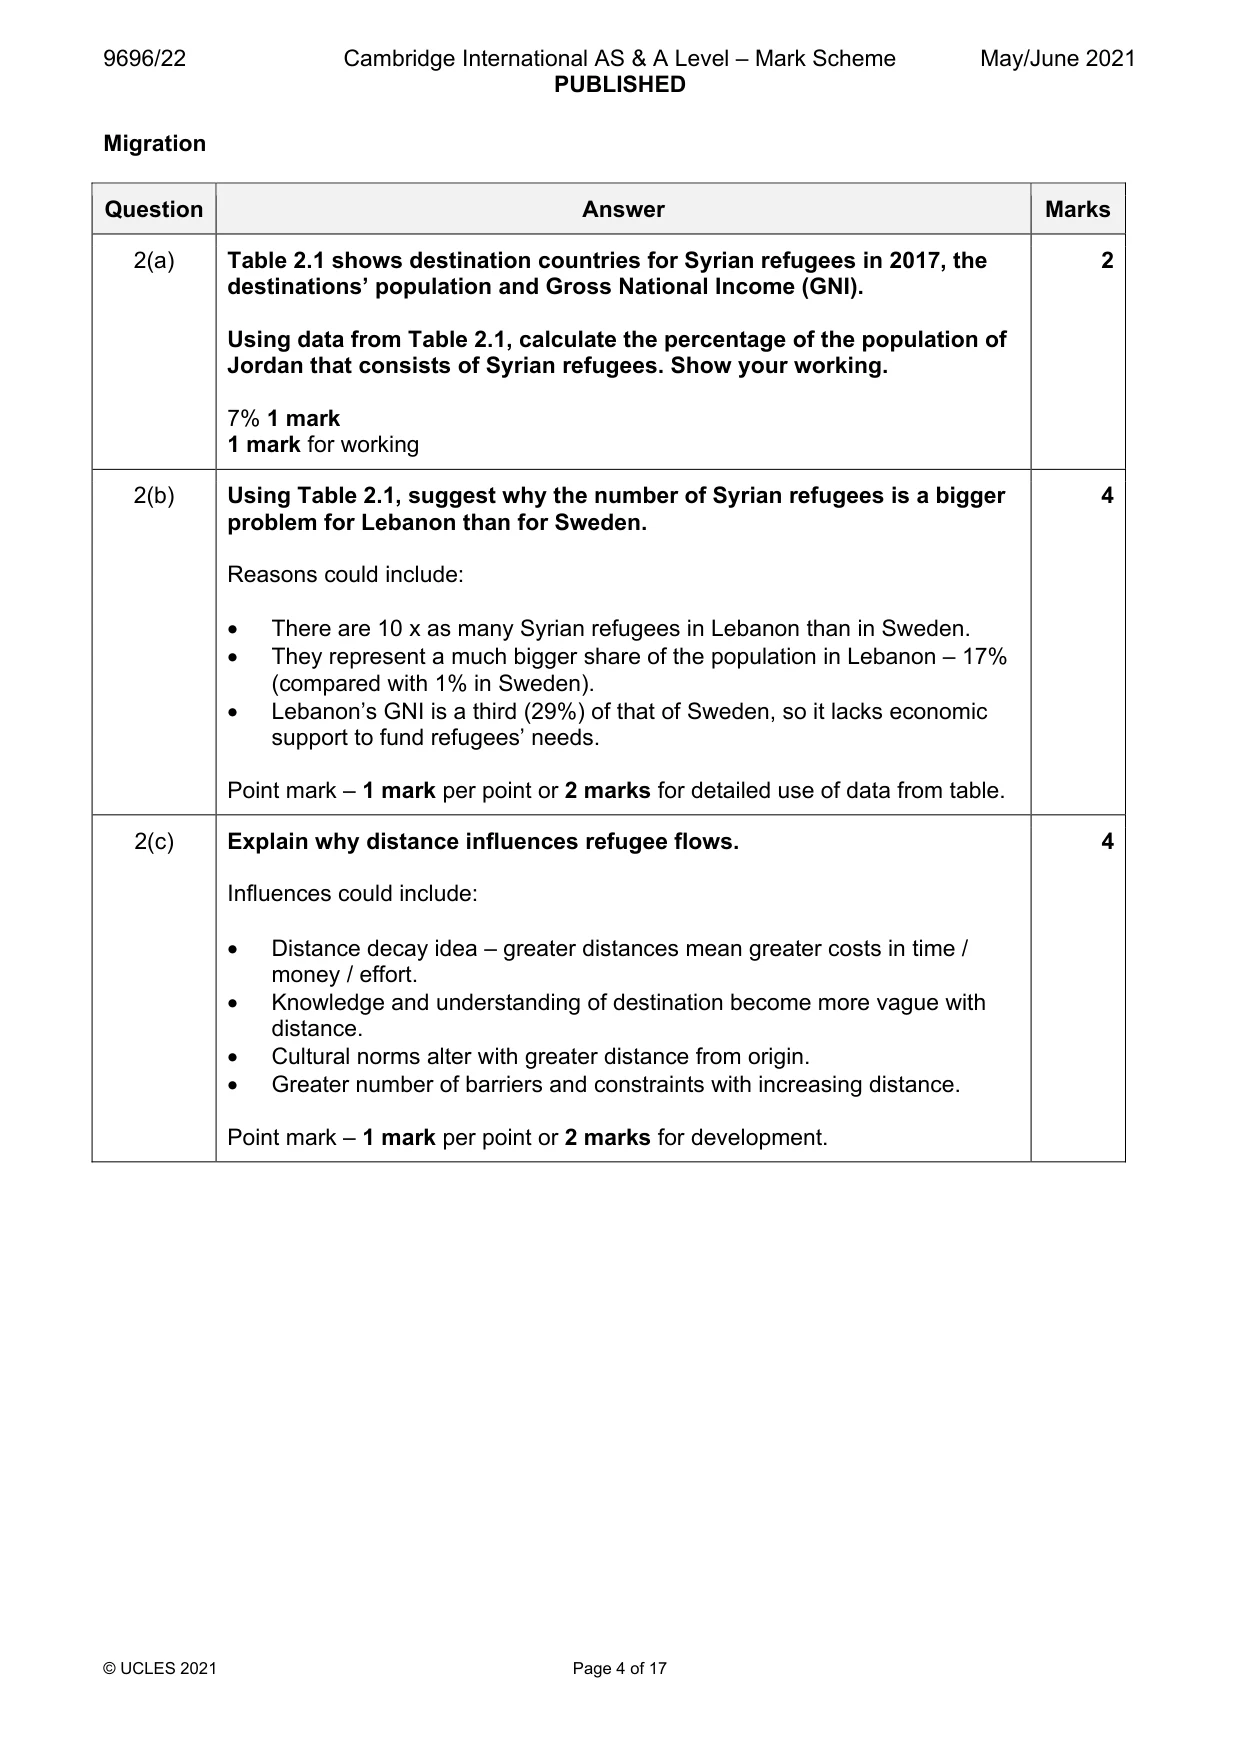
Mark scheme: 2(a) Table 2.1 shows destination countries for Syrian refugees in 2017, the 2 destinations’ population and Gross National Income (GNI). Using data from Table 2.1, calculate the percentage of the population of Jordan that consists of Syrian refugees. Show your working. 7% 1 mark 1 mark for working 2(b) Using Table 2.1, suggest why the number of Syrian refugees is a bigger 4 problem for Lebanon than for Sweden. Reasons could include: • There are 10 x as many Syrian refugees in Lebanon than in Sweden. • They represent a much bigger share of the population in Lebanon – 17% (compared with 1% in Sweden). • Lebanon’s GNI is a third (29%) of that of Sweden, so it lacks economic support to fund refugees’ needs. Point mark – 1 mark per point or 2 marks for detailed use of data from table. 2(c) Explain why distance influences refugee flows. 4 Influences could include: • Distance decay idea – greater distances mean greater costs in time / money / effort. • Knowledge and understanding of destination become more vague with distance. • Cultural norms alter with greater distance from origin. • Greater number of barriers and constraints with increasing distance. Point mark – 1 mark per point or 2 marks for development. Migration/Settlement dynamics
Q3 · A photograph which shows an urban area in a city in an HIC
3 Fig. 3.1 is a photograph which shows an urban area in a city in an HIC. (a) State three features which suggest that the area shown in Fig. 3.1 is a wealthy area. [3] (b) Suggest two problems for people living in the area shown in Fig. 3.1. [3] (c) Explain why an urban area might suffer from long-term environmental decline. [4]
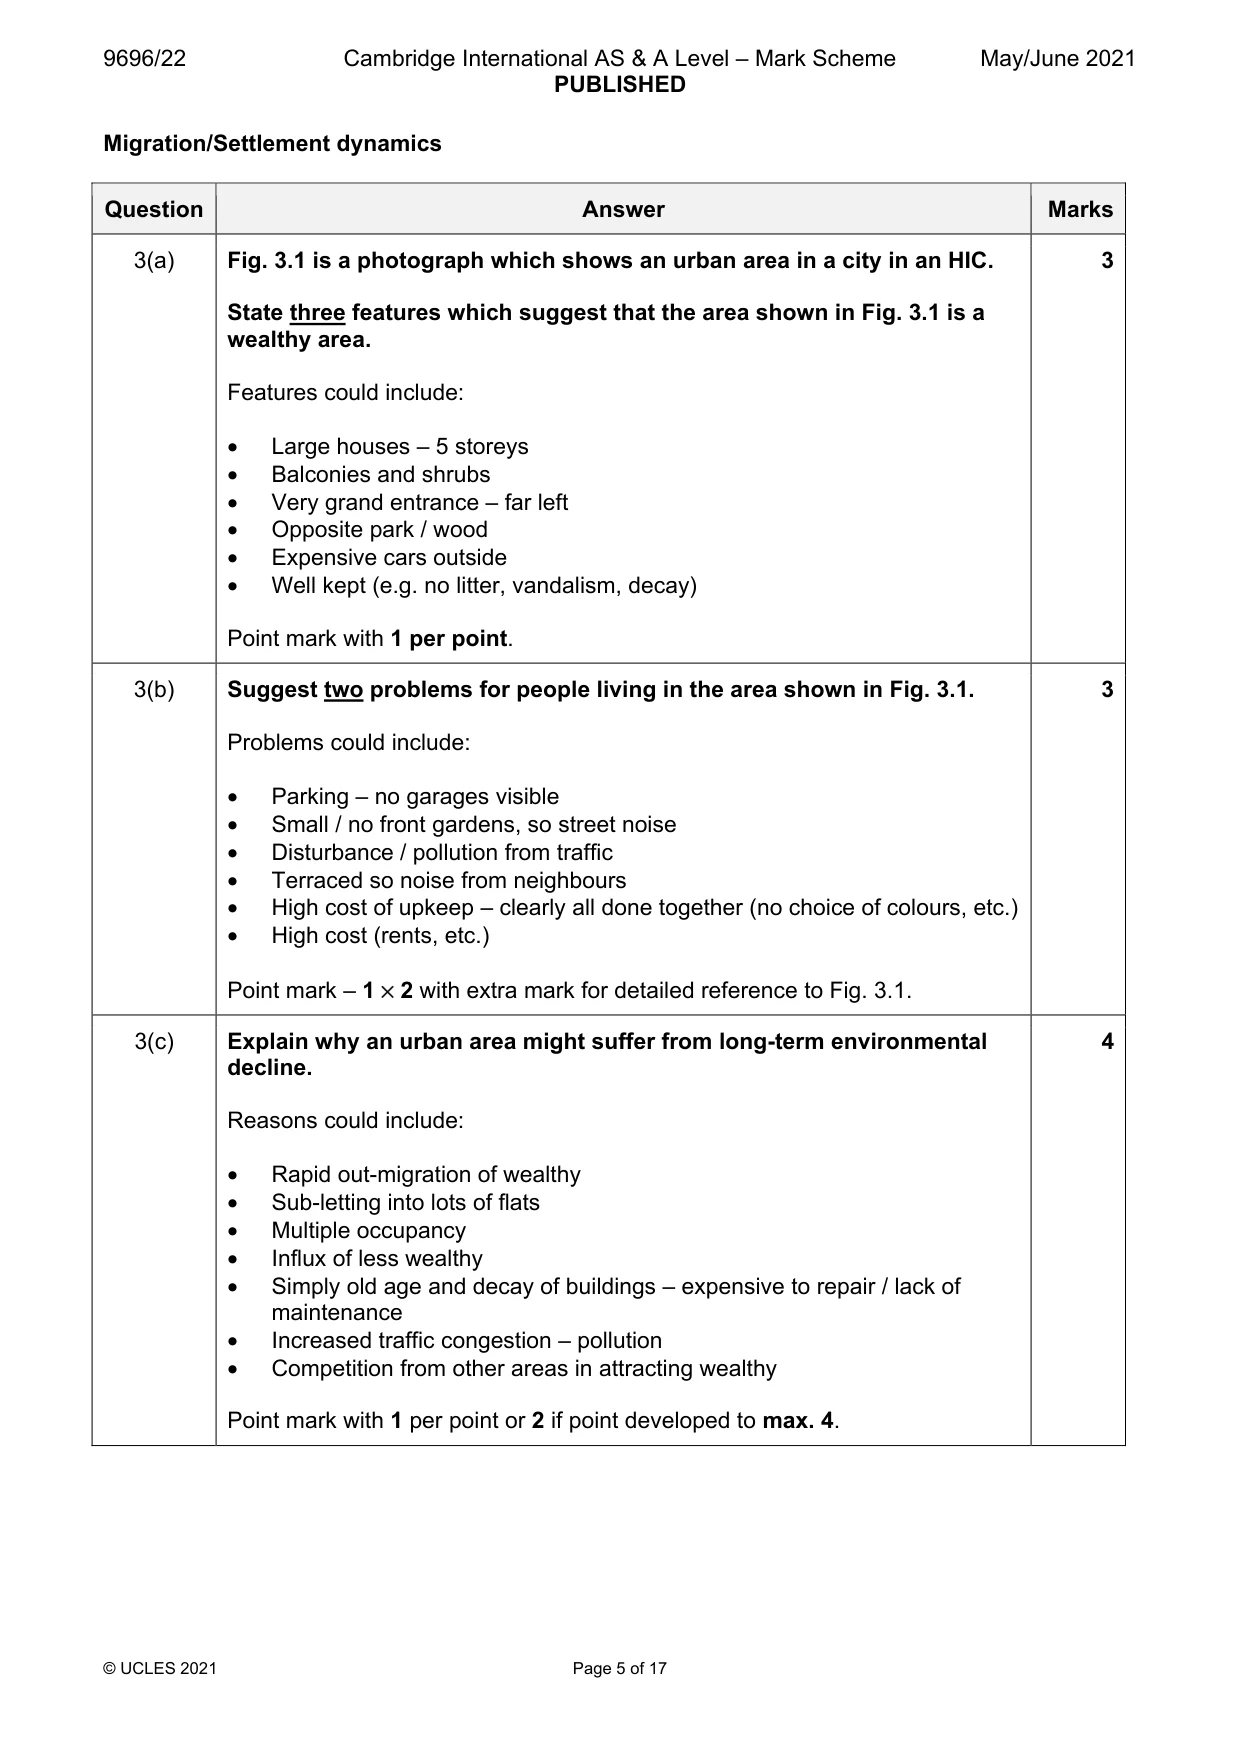
Mark scheme: 3(a) Fig. 3.1 is a photograph which shows an urban area in a city in an HIC. 3 State three features which suggest that the area shown in Fig. 3.1 is a wealthy area. Features could include: • Large houses – 5 storeys • Balconies and shrubs • Very grand entrance – far left • Opposite park / wood • Expensive cars outside • Well kept (e.g. no litter, vandalism, decay) Point mark with 1 per point. 3(b) Suggest two problems for people living in the area shown in Fig. 3.1. 3 Problems could include: • Parking – no garages visible • Small / no front gardens, so street noise • Disturbance / pollution from traffic • Terraced so noise from neighbours • High cost of upkeep – clearly all done together (no choice of colours, etc.) • High cost (rents, etc.) Point mark – 1 × 2 with extra mark for detailed reference to Fig. 3.1. 3(c) Explain why an urban area might suffer from long-term environmental 4 decline. Reasons could include: • Rapid out-migration of wealthy • Sub-letting into lots of flats • Multiple occupancy • Influx of less wealthy • Simply old age and decay of buildings – expensive to repair / lack of maintenance • Increased traffic congestion – pollution • Competition from other areas in attracting wealthy Point mark with 1 per point or 2 if point developed to max. 4. Section B Answer one question from this section. All questions are worth 30 marks. Population
Q4 · Define the term mortality rate
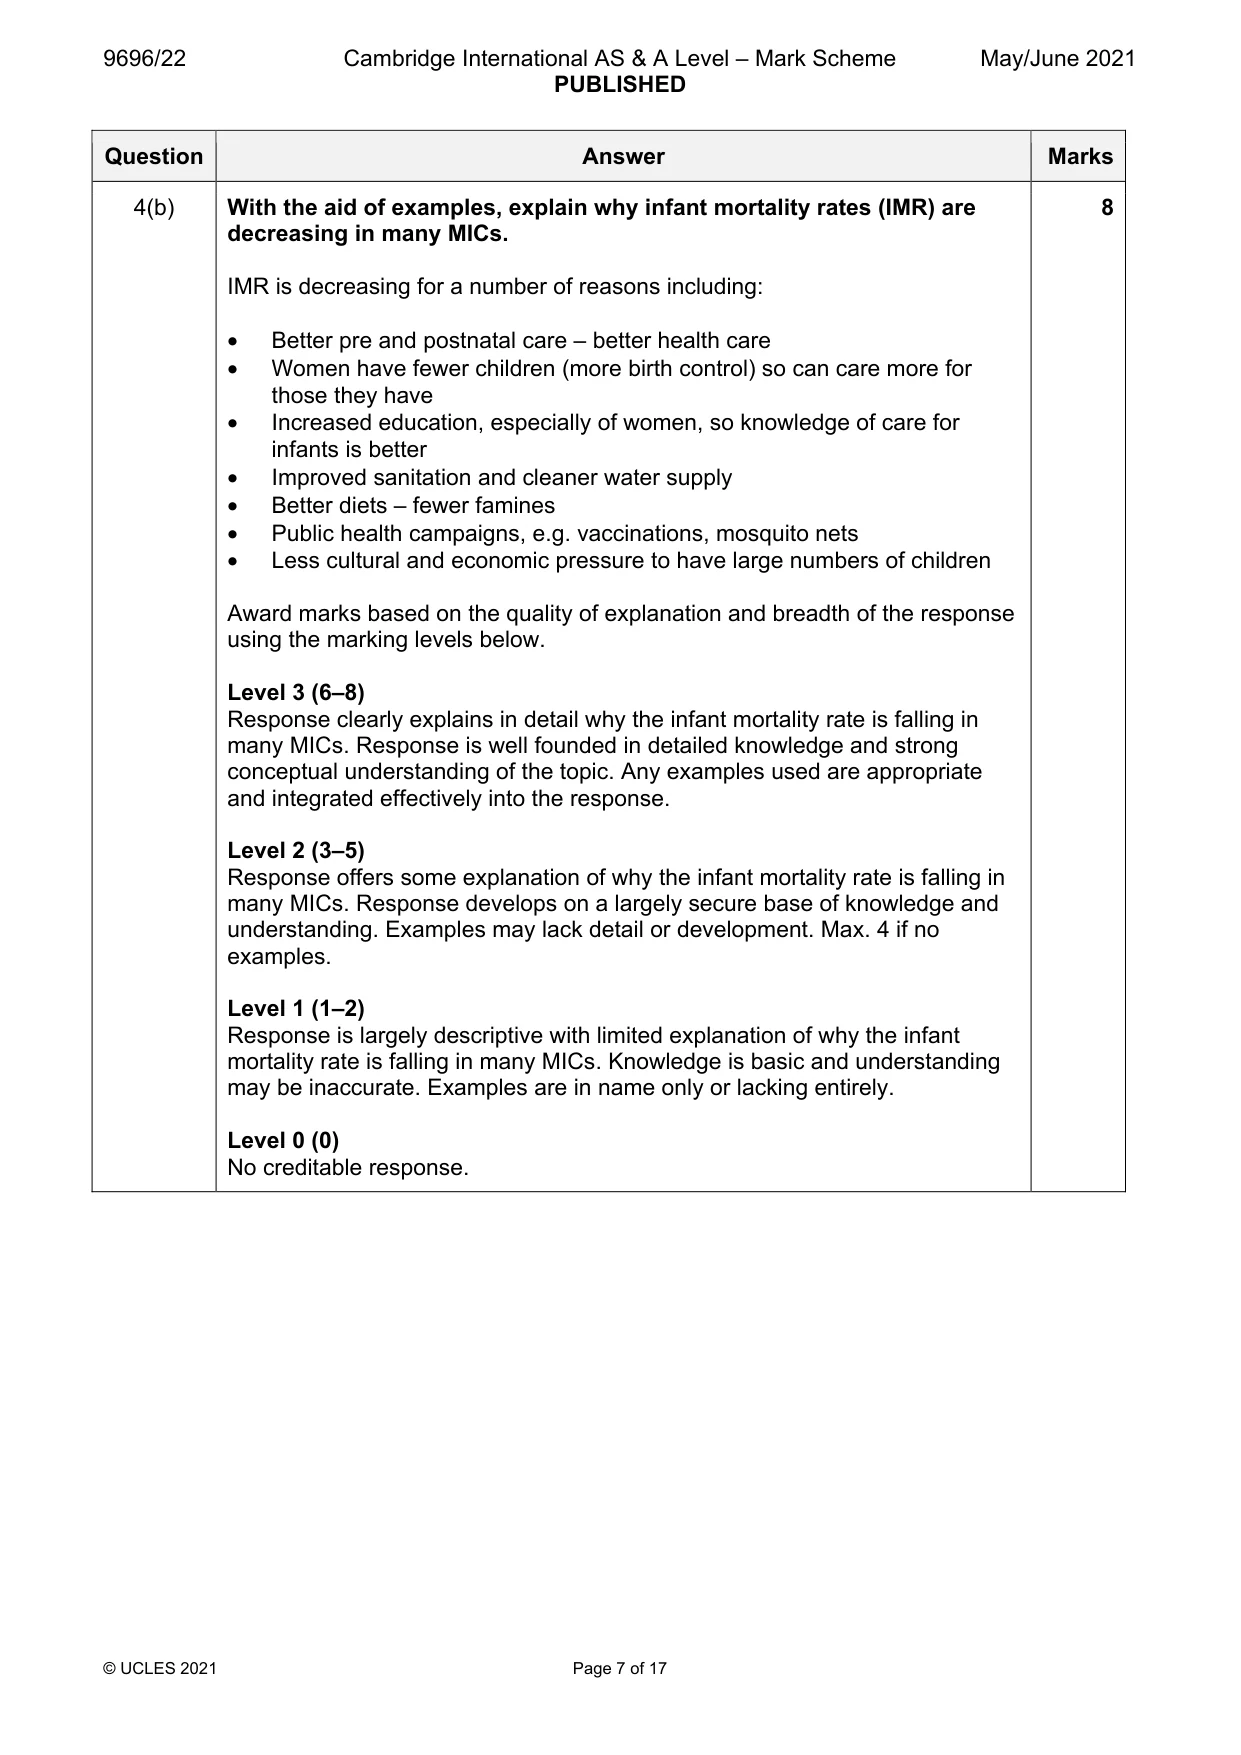
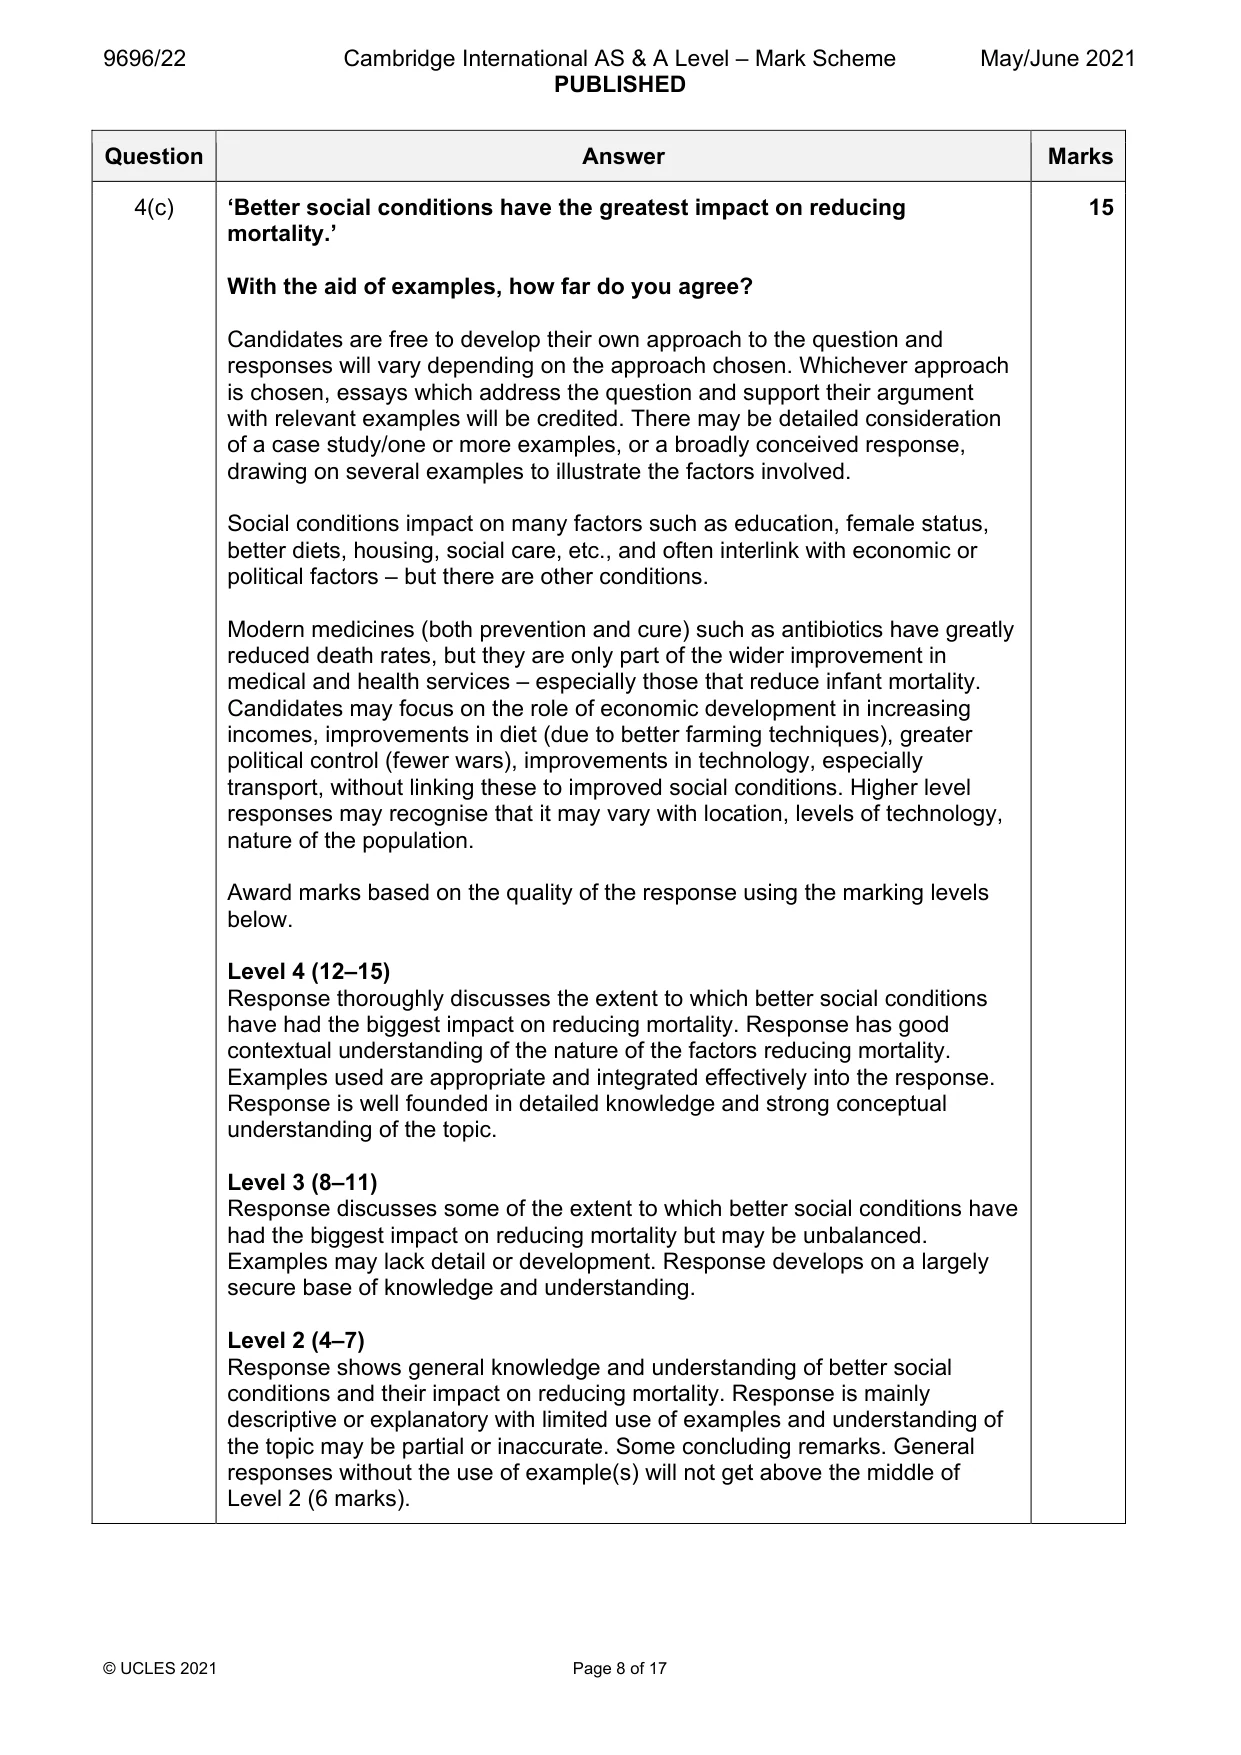
4 (a) (i) Define the term mortality rate. [3] (ii) Contrast the infant mortality rates (IMR) in HICs and LICs/MICs. [4] (b) With the aid of examples, explain why infant mortality rates (IMR) are decreasing in many MICs. [8] (c) ‘Better social conditions have the greatest impact on reducing mortality.’ With the aid of examples, how far do you agree? [15] Migration/Settlement dynamics
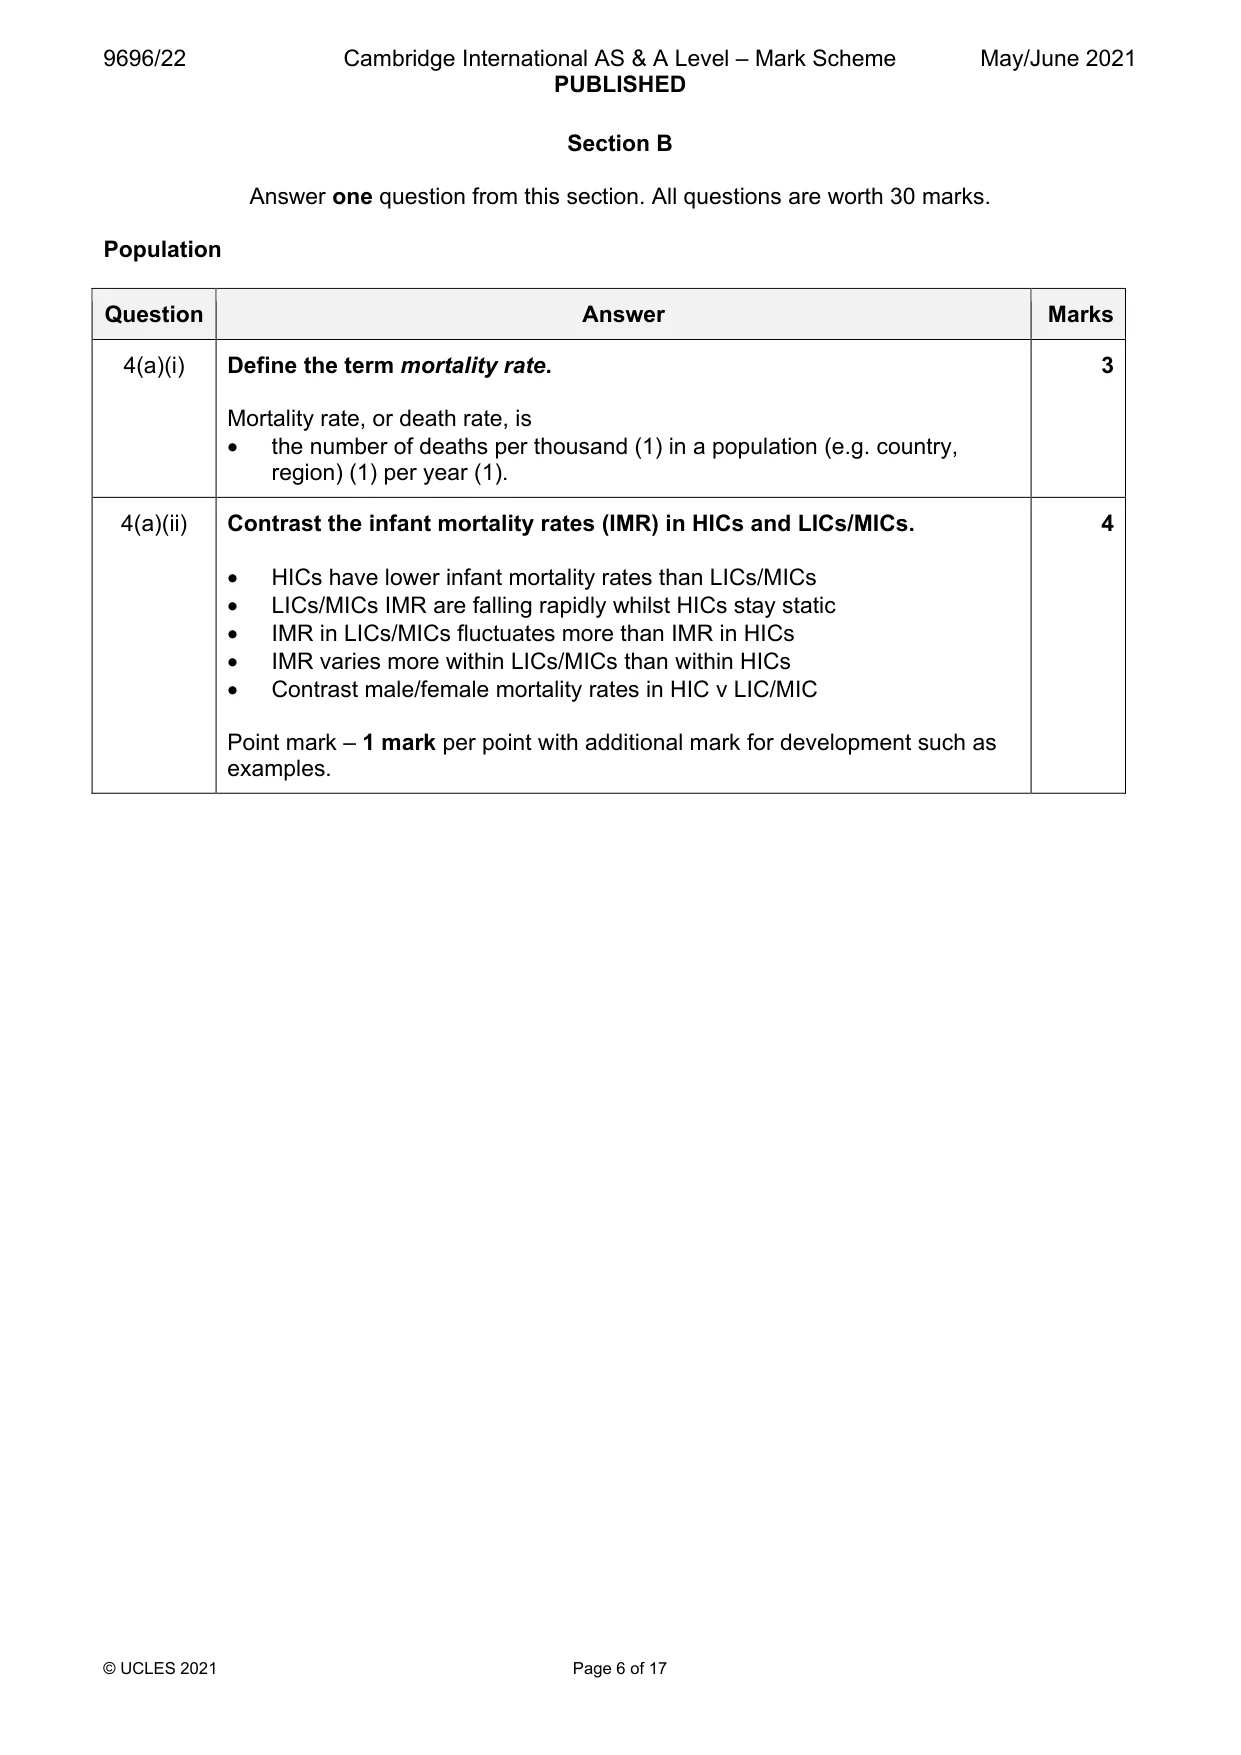
Mark scheme: 4(a)(i) Define the term mortality rate. 3 Mortality rate, or death rate, is • the number of deaths per thousand (1) in a population (e.g. country, region) (1) per year (1). 4(a)(ii) Contrast the infant mortality rates (IMR) in HICs and LICs/MICs. 4 • HICs have lower infant mortality rates than LICs/MICs • LICs/MICs IMR are falling rapidly whilst HICs stay static • IMR in LICs/MICs fluctuates more than IMR in HICs • IMR varies more within LICs/MICs than within HICs • Contrast male/female mortality rates in HIC v LIC/MIC Point mark – 1 mark per point with additional mark for development such as examples. 4(b) With the aid of examples, explain why infant mortality rates (IMR) are 8 decreasing in many MICs. IMR is decreasing for a number of reasons including: • Better pre and postnatal care – better health care • Women have fewer children (more birth control) so can care more for those they have • Increased education, especially of women, so knowledge of care for infants is better • Improved sanitation and cleaner water supply • Better diets – fewer famines • Public health campaigns, e.g. vaccinations, mosquito nets • Less cultural and economic pressure to have large numbers of children Award marks based on the quality of explanation and breadth of the response using the marking levels below. Level 3 (6–8) Response clearly explains in detail why the infant mortality rate is falling in many MICs. Response is well founded in detailed knowledge and strong conceptual understanding of the topic. Any examples used are appropriate and integrated effectively into the response. Level 2 (3–5) Response offers some explanation of why the infant mortality rate is falling in many MICs. Response develops on a largely secure base of knowledge and understanding. Examples may lack detail or development. Max. 4 if no examples. Level 1 (1–2) Response is largely descriptive with limited explanation of why the infant mortality rate is falling in many MICs. Knowledge is basic and understanding may be inaccurate. Examples are in name only or lacking entirely. Level 0 (0) No creditable response. 4(c) ‘Better social conditions have the greatest impact on reducing 15 mortality.’ With the aid of examples, how far do you agree? Candidates are free to develop their own approach to the question and responses will vary depending on the approach chosen. Whichever approach is chosen, essays which address the question and support their argument with relevant examples will be credited. There may be detailed consideration of a case study/one or more examples, or a broadly conceived response, drawing on several examples to illustrate the factors involved. Social conditions impact on many factors such as education, female status, better diets, housing, social care, etc., and often interlink with economic or political factors – but there are other conditions. Modern medicines (both prevention and cure) such as antibiotics have greatly reduced death rates, but they are only part of the wider improvement in medical and health services – especially those that reduce infant mortality. Candidates may focus on the role of economic development in increasing incomes, improvements in diet (due to better farming techniques), greater political control (fewer wars), improvements in technology, especially transport, without linking these to improved social conditions. Higher level responses may recognise that it may vary with location, levels of technology, nature of the population. Award marks based on the quality of the response using the marking levels below. Level 4 (12–15) Response thoroughly discusses the extent to which better social conditions have had the biggest impact on reducing mortality. Response has good contextual understanding of the nature of the factors reducing mortality. Examples used are appropriate and integrated effectively into the response. Response is well founded in detailed knowledge and strong conceptual understanding of the topic. Level 3 (8–11) Response discusses some of the extent to which better social conditions have had the biggest impact on reducing mortality but may be unbalanced. Examples may lack detail or development. Response develops on a largely secure base of knowledge and understanding. Level 2 (4–7) Response shows general knowledge and understanding of better social conditions and their impact on reducing mortality. Response is mainly descriptive or explanatory with limited use of examples and understanding of the topic may be partial or inaccurate. Some concluding remarks. General responses without the use of example(s) will not get above the middle of Level 2 (6 marks). 4(c) Level 1 (1–3) Response may broadly discuss the concept of reducing mortality but does not address the question and does not come to a convincing conclusion. Response is descriptive, knowledge is basic and understanding is poor. Level 0 (0) No creditable response. Migration/Settlement dynamics
Q5 · With the aid of examples, explain the advantages and disadvantages of stepped migration…
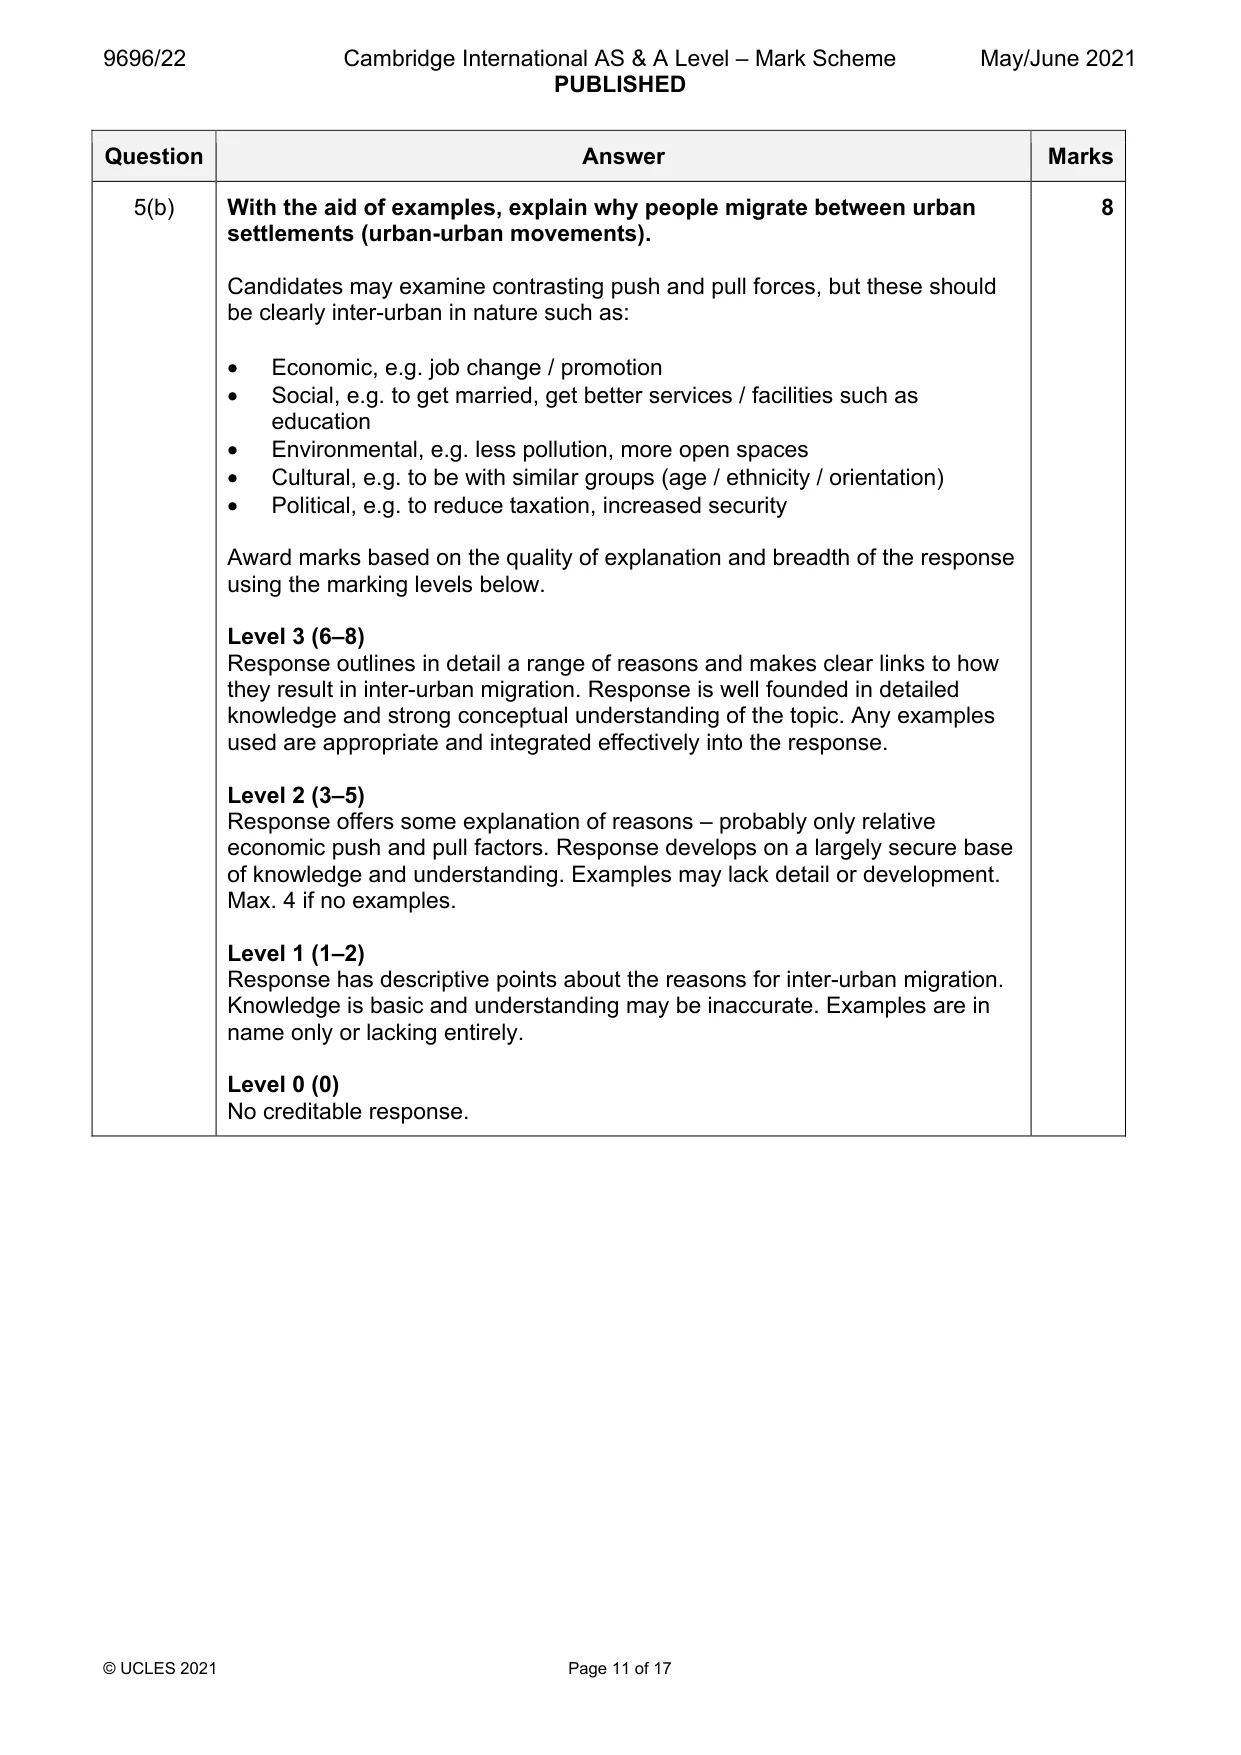
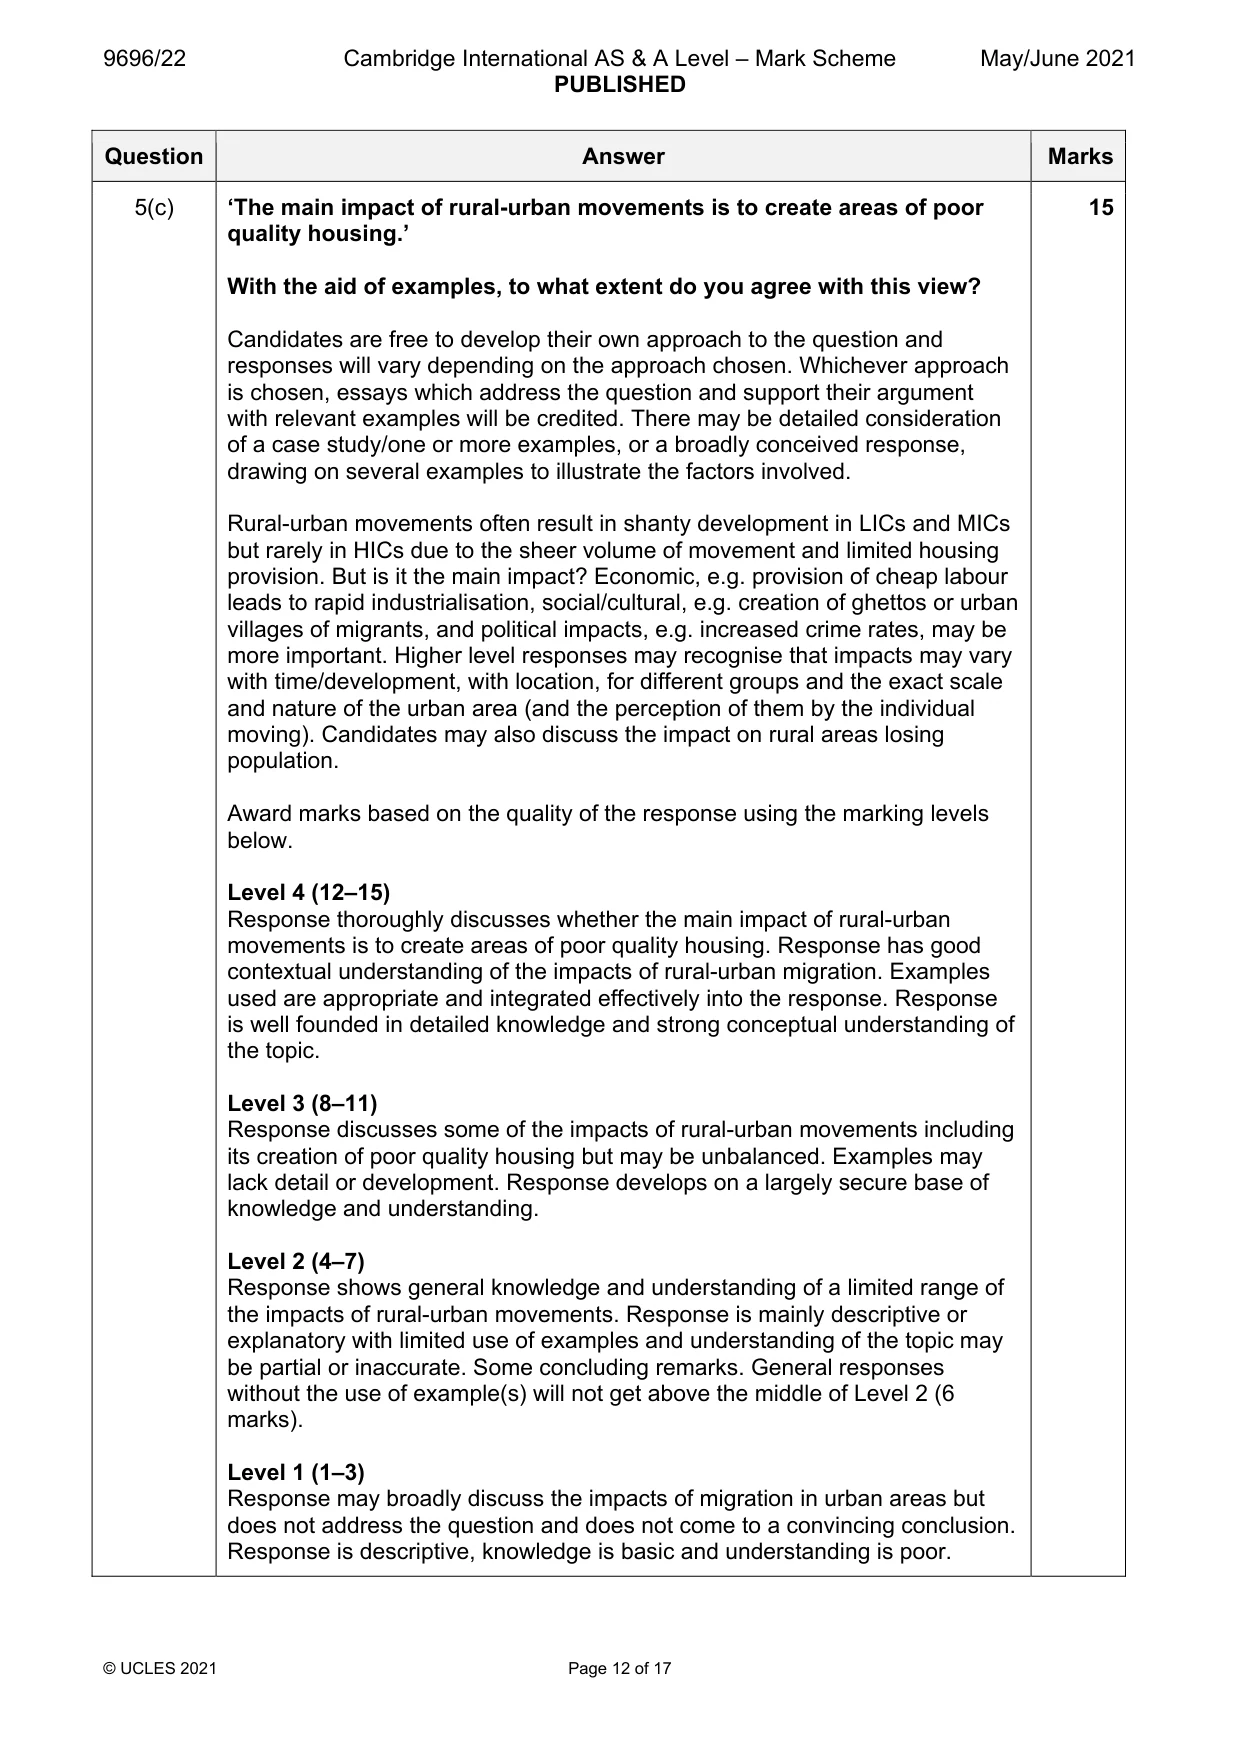
5 (a) With the aid of examples, explain the advantages and disadvantages of stepped migration for the migrant. [7] (b) With the aid of examples, explain why people migrate between urban settlements (urban-urban movements). [8] (c) ‘The main impact of rural-urban movements is to create areas of poor quality housing.’ With the aid of examples, to what extent do you agree with this view? [15] Migration/Settlement dynamics
Mark scheme: 5(a) With the aid of examples, explain the advantages and disadvantages of 7 stepped migration for the migrant. Advantages could include: • Helps in building up knowledge of urban environments • Accumulation of capital to fund next move • Builds self confidence • Creates more links and connections • Remittances sent back to origin • Less stressful than one ‘big move’ Disadvantages could include: • Takes longer to reach final destination • May cost more as involves many moves • Disrupts social life every time migrant moves • More stress as always getting ready to move • Never putting down roots Point mark – but max. 5 if only advantages or disadvantages or if no examples. 5(b) With the aid of examples, explain why people migrate between urban 8 settlements (urban-urban movements). Candidates may examine contrasting push and pull forces, but these should be clearly inter-urban in nature such as: • Economic, e.g. job change / promotion • Social, e.g. to get married, get better services / facilities such as education • Environmental, e.g. less pollution, more open spaces • Cultural, e.g. to be with similar groups (age / ethnicity / orientation) • Political, e.g. to reduce taxation, increased security Award marks based on the quality of explanation and breadth of the response using the marking levels below. Level 3 (6–8) Response outlines in detail a range of reasons and makes clear links to how they result in inter-urban migration. Response is well founded in detailed knowledge and strong conceptual understanding of the topic. Any examples used are appropriate and integrated effectively into the response. Level 2 (3–5) Response offers some explanation of reasons – probably only relative economic push and pull factors. Response develops on a largely secure base of knowledge and understanding. Examples may lack detail or development. Max. 4 if no examples. Level 1 (1–2) Response has descriptive points about the reasons for inter-urban migration. Knowledge is basic and understanding may be inaccurate. Examples are in name only or lacking entirely. Level 0 (0) No creditable response. 5(c) ‘The main impact of rural-urban movements is to create areas of poor 15 quality housing.’ With the aid of examples, to what extent do you agree with this view? Candidates are free to develop their own approach to the question and responses will vary depending on the approach chosen. Whichever approach is chosen, essays which address the question and support their argument with relevant examples will be credited. There may be detailed consideration of a case study/one or more examples, or a broadly conceived response, drawing on several examples to illustrate the factors involved. Rural-urban movements often result in shanty development in LICs and MICs but rarely in HICs due to the sheer volume of movement and limited housing provision. But is it the main impact? Economic, e.g. provision of cheap labour leads to rapid industrialisation, social/cultural, e.g. creation of ghettos or urban villages of migrants, and political impacts, e.g. increased crime rates, may be more important. Higher level responses may recognise that impacts may vary with time/development, with location, for different groups and the exact scale and nature of the urban area (and the perception of them by the individual moving). Candidates may also discuss the impact on rural areas losing population. Award marks based on the quality of the response using the marking levels below. Level 4 (12–15) Response thoroughly discusses whether the main impact of rural-urban movements is to create areas of poor quality housing. Response has good contextual understanding of the impacts of rural-urban migration. Examples used are appropriate and integrated effectively into the response. Response is well founded in detailed knowledge and strong conceptual understanding of the topic. Level 3 (8–11) Response discusses some of the impacts of rural-urban movements including its creation of poor quality housing but may be unbalanced. Examples may lack detail or development. Response develops on a largely secure base of knowledge and understanding. Level 2 (4–7) Response shows general knowledge and understanding of a limited range of the impacts of rural-urban movements. Response is mainly descriptive or explanatory with limited use of examples and understanding of the topic may be partial or inaccurate. Some concluding remarks. General responses without the use of example(s) will not get above the middle of Level 2 (6 marks). Level 1 (1–3) Response may broadly discuss the impacts of migration in urban areas but does not address the question and does not come to a convincing conclusion. Response is descriptive, knowledge is basic and understanding is poor. 5(c) Level 0 (0) No creditable response. Migration/Settlement dynamics
Q6 · Describe how political factors influence the location of activities in urban areas
6 (a) Describe how political factors influence the location of activities in urban areas. [7] (b) With the aid of examples, explain why the location of retailing has changed in urban areas in HICs. [8] (c) ‘With increasing levels of economic development, cities will decrease in population size.’ With the aid of examples, to what extent do you agree with this view? [15]
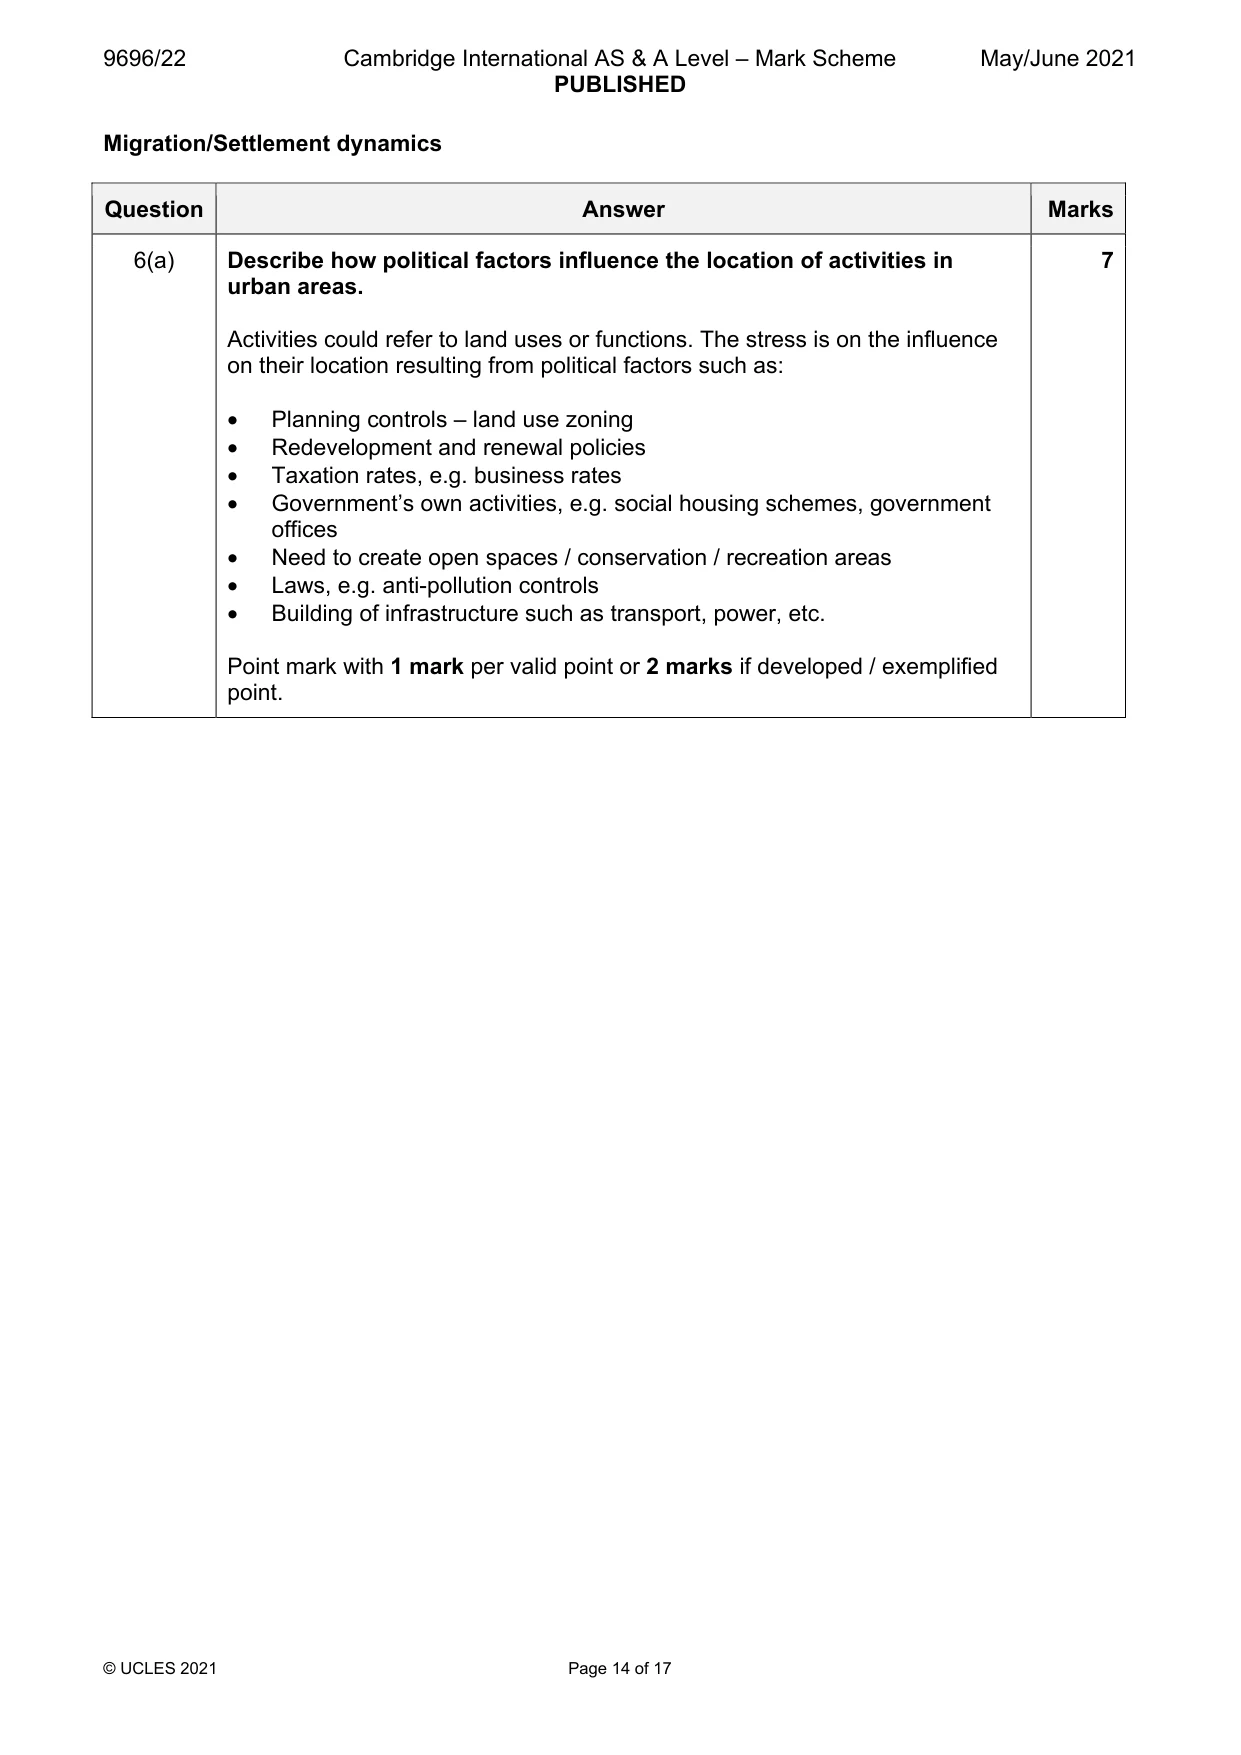
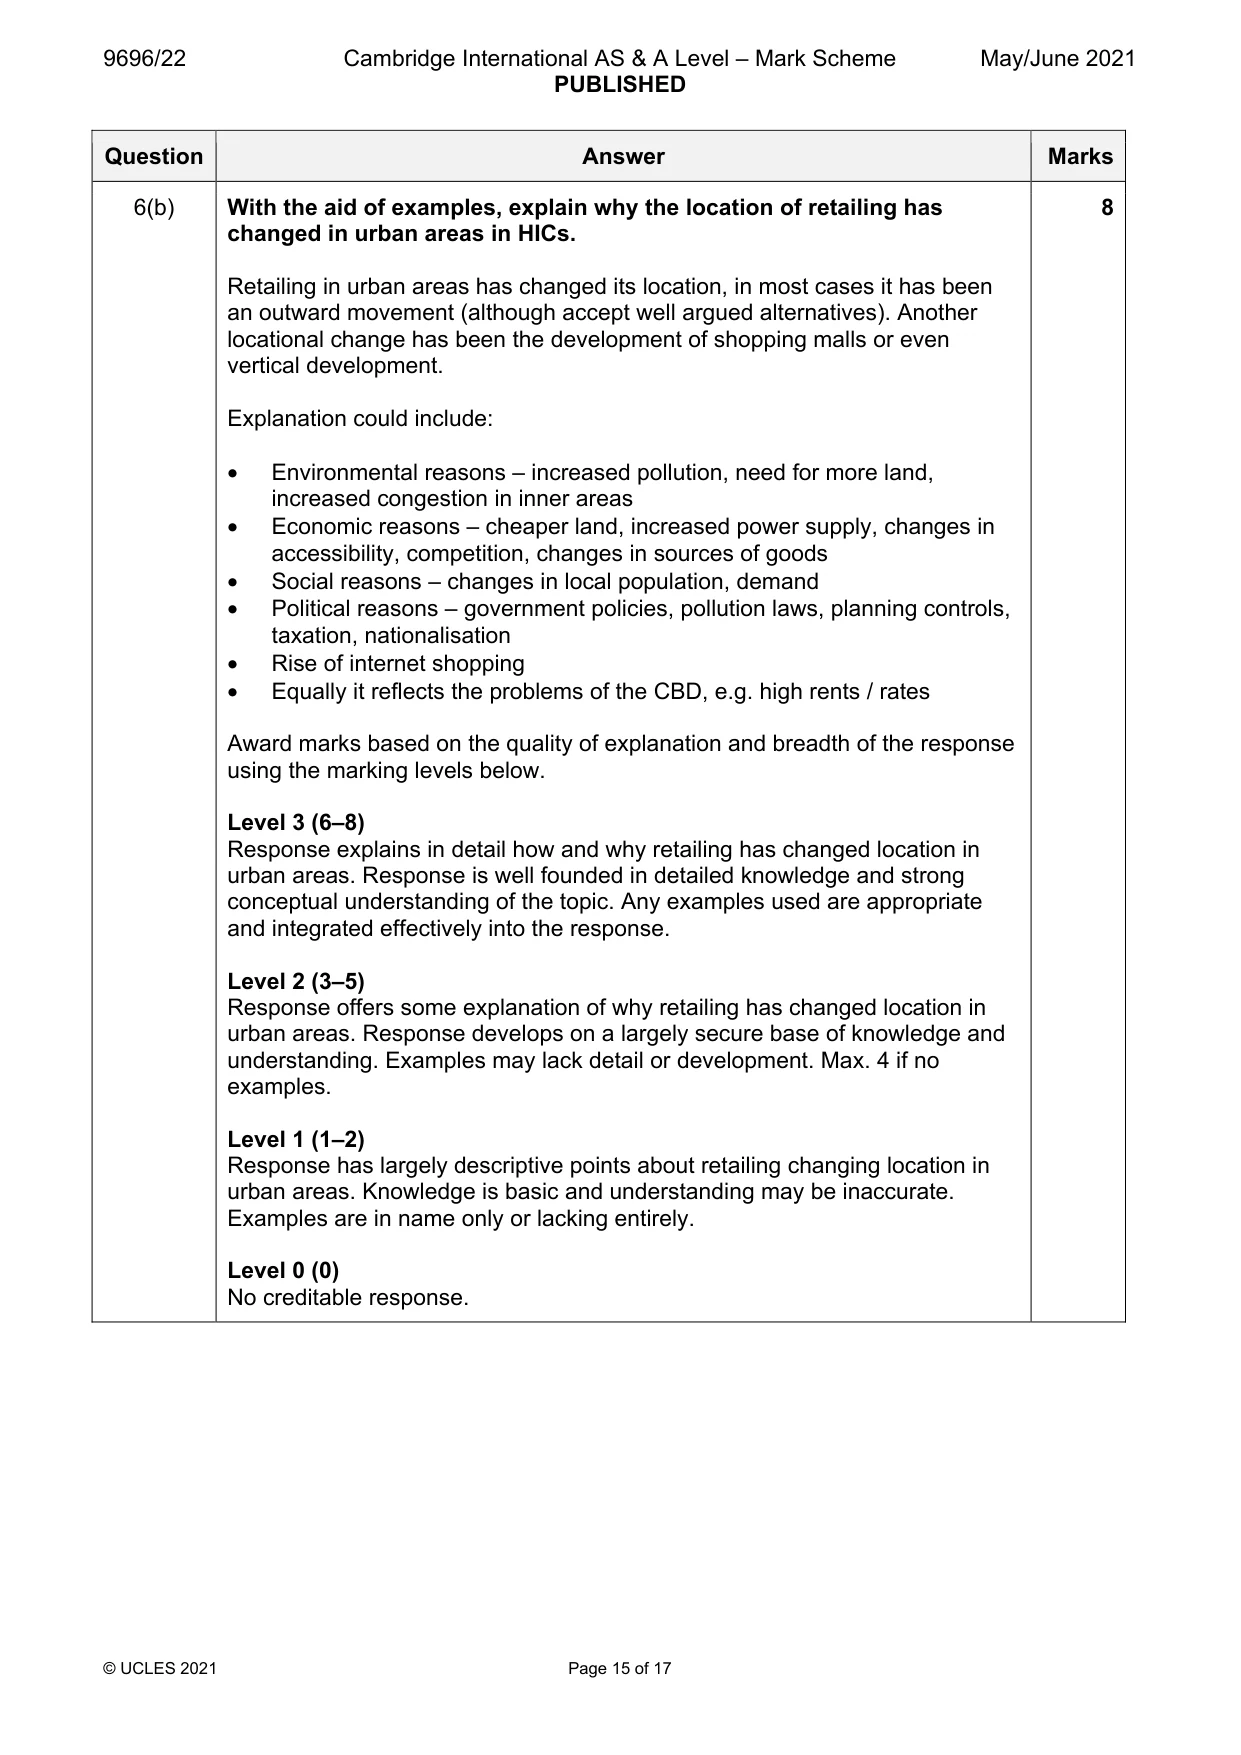
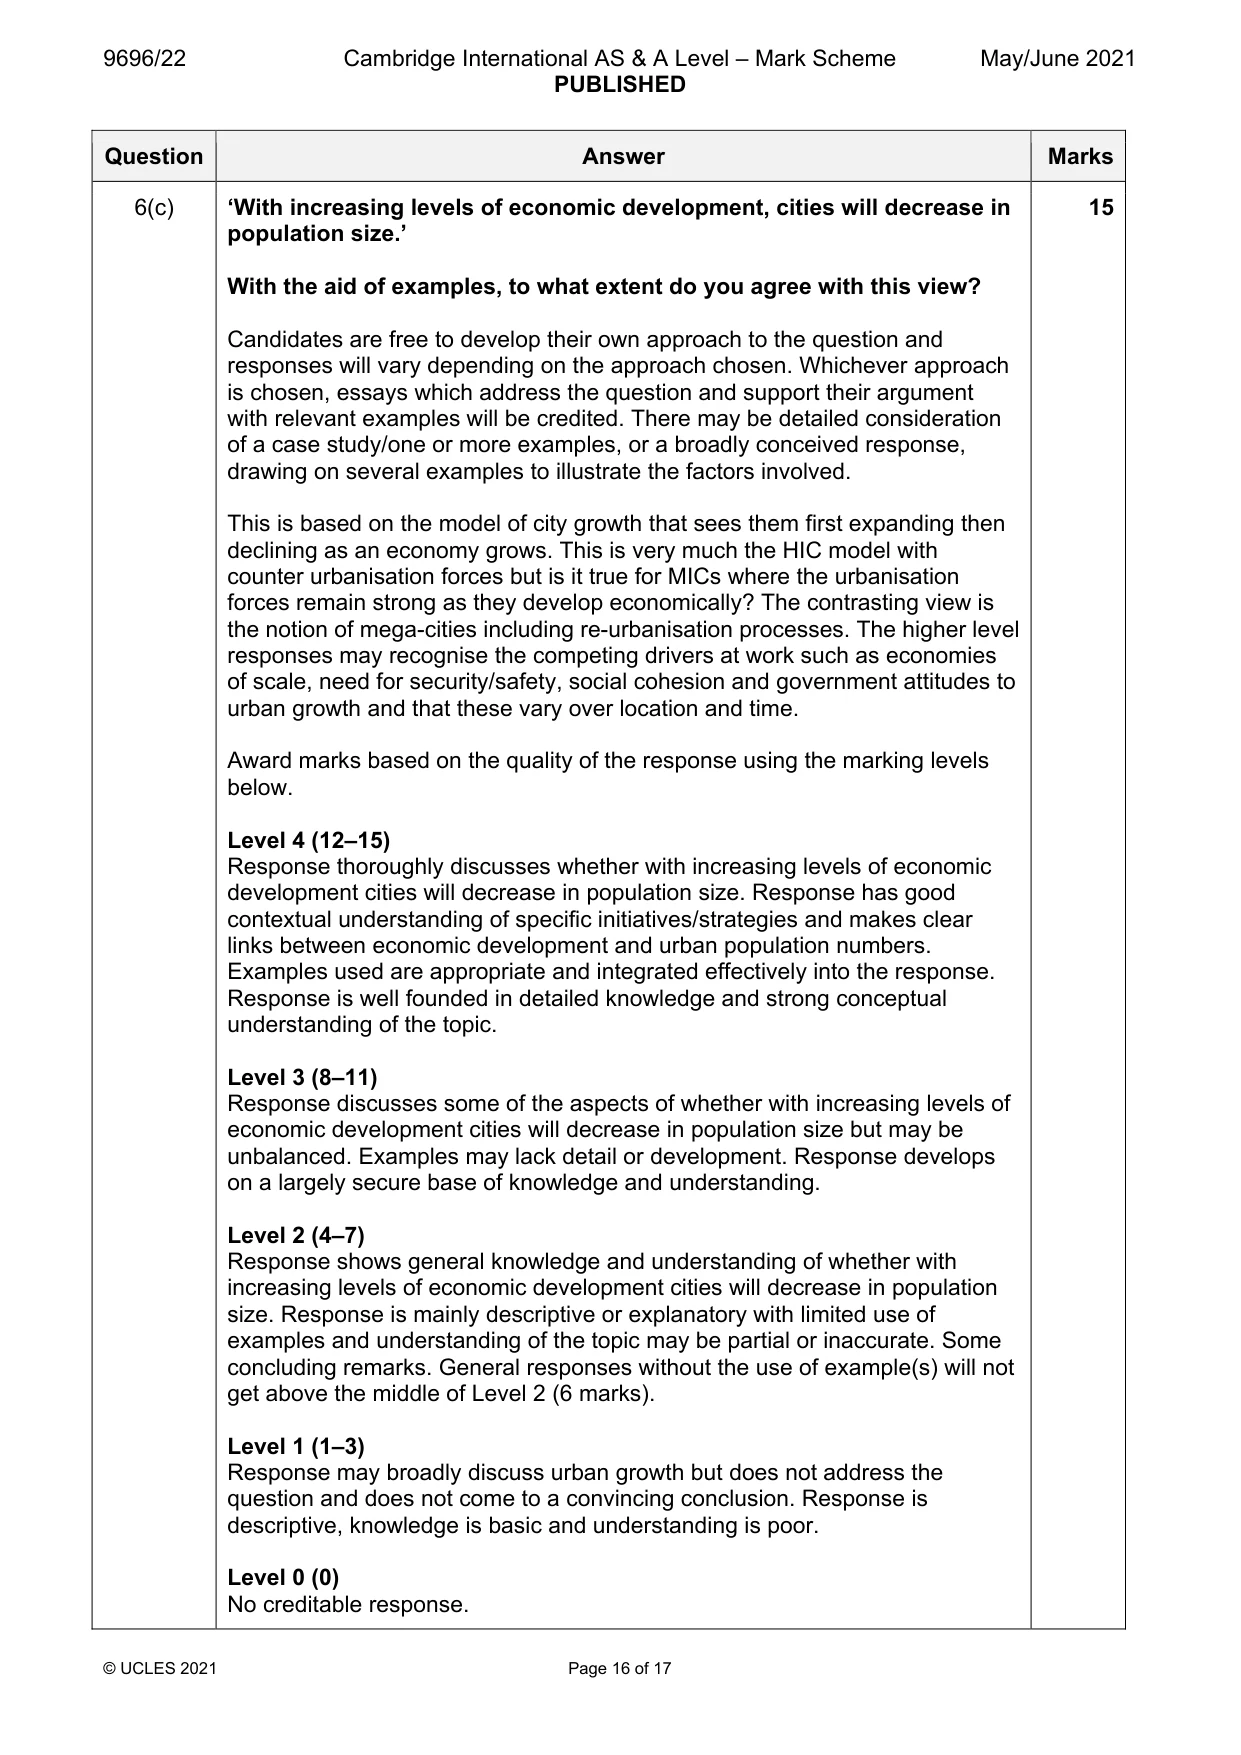
Mark scheme: 6(a) Describe how political factors influence the location of activities in 7 urban areas. Activities could refer to land uses or functions. The stress is on the influence on their location resulting from political factors such as: • Planning controls – land use zoning • Redevelopment and renewal policies • Taxation rates, e.g. business rates • Government’s own activities, e.g. social housing schemes, government offices • Need to create open spaces / conservation / recreation areas • Laws, e.g. anti-pollution controls • Building of infrastructure such as transport, power, etc. Point mark with 1 mark per valid point or 2 marks if developed / exemplified point. 6(b) With the aid of examples, explain why the location of retailing has 8 changed in urban areas in HICs. Retailing in urban areas has changed its location, in most cases it has been an outward movement (although accept well argued alternatives). Another locational change has been the development of shopping malls or even vertical development. Explanation could include: • Environmental reasons – increased pollution, need for more land, increased congestion in inner areas • Economic reasons – cheaper land, increased power supply, changes in accessibility, competition, changes in sources of goods • Social reasons – changes in local population, demand • Political reasons – government policies, pollution laws, planning controls, taxation, nationalisation • Rise of internet shopping • Equally it reflects the problems of the CBD, e.g. high rents / rates Award marks based on the quality of explanation and breadth of the response using the marking levels below. Level 3 (6–8) Response explains in detail how and why retailing has changed location in urban areas. Response is well founded in detailed knowledge and strong conceptual understanding of the topic. Any examples used are appropriate and integrated effectively into the response. Level 2 (3–5) Response offers some explanation of why retailing has changed location in urban areas. Response develops on a largely secure base of knowledge and understanding. Examples may lack detail or development. Max. 4 if no examples. Level 1 (1–2) Response has largely descriptive points about retailing changing location in urban areas. Knowledge is basic and understanding may be inaccurate. Examples are in name only or lacking entirely. Level 0 (0) No creditable response. 6(c) ‘With increasing levels of economic development, cities will decrease in 15 population size.’ With the aid of examples, to what extent do you agree with this view? Candidates are free to develop their own approach to the question and responses will vary depending on the approach chosen. Whichever approach is chosen, essays which address the question and support their argument with relevant examples will be credited. There may be detailed consideration of a case study/one or more examples, or a broadly conceived response, drawing on several examples to illustrate the factors involved. This is based on the model of city growth that sees them first expanding then declining as an economy grows. This is very much the HIC model with counter urbanisation forces but is it true for MICs where the urbanisation forces remain strong as they develop economically? The contrasting view is the notion of mega-cities including re-urbanisation processes. The higher level responses may recognise the competing drivers at work such as economies of scale, need for security/safety, social cohesion and government attitudes to urban growth and that these vary over location and time. Award marks based on the quality of the response using the marking levels below. Level 4 (12–15) Response thoroughly discusses whether with increasing levels of economic development cities will decrease in population size. Response has good contextual understanding of specific initiatives/strategies and makes clear links between economic development and urban population numbers. Examples used are appropriate and integrated effectively into the response. Response is well founded in detailed knowledge and strong conceptual understanding of the topic. Level 3 (8–11) Response discusses some of the aspects of whether with increasing levels of economic development cities will decrease in population size but may be unbalanced. Examples may lack detail or development. Response develops on a largely secure base of knowledge and understanding. Level 2 (4–7) Response shows general knowledge and understanding of whether with increasing levels of economic development cities will decrease in population size. Response is mainly descriptive or explanatory with limited use of examples and understanding of the topic may be partial or inaccurate. Some concluding remarks. General responses without the use of example(s) will not get above the middle of Level 2 (6 marks). Level 1 (1–3) Response may broadly discuss urban growth but does not address the question and does not come to a convincing conclusion. Response is descriptive, knowledge is basic and understanding is poor. Level 0 (0) No creditable response.
What was in this paper
The subtopics covered by these 6 questions, and how many questions each got. Open one in a new tab to see every Cambridge question on it.
What you needed in this session
Cambridge’s own grade thresholds for 2021 May/June, Paper 2 · Variant 2. A higher threshold means an easier paper — the bar moves with how the cohort did.