Cambridge A Level Geography 9696 — 2020 Oct/Nov Paper 2 · Variant 1
9696/21/O/N/20 · 6 questions · 60 marks · ≈68 min
The question paper and its mark scheme, free to read here and free to download. This is Cambridge’s own paper, exactly as it was sat.
Question paper4 pages
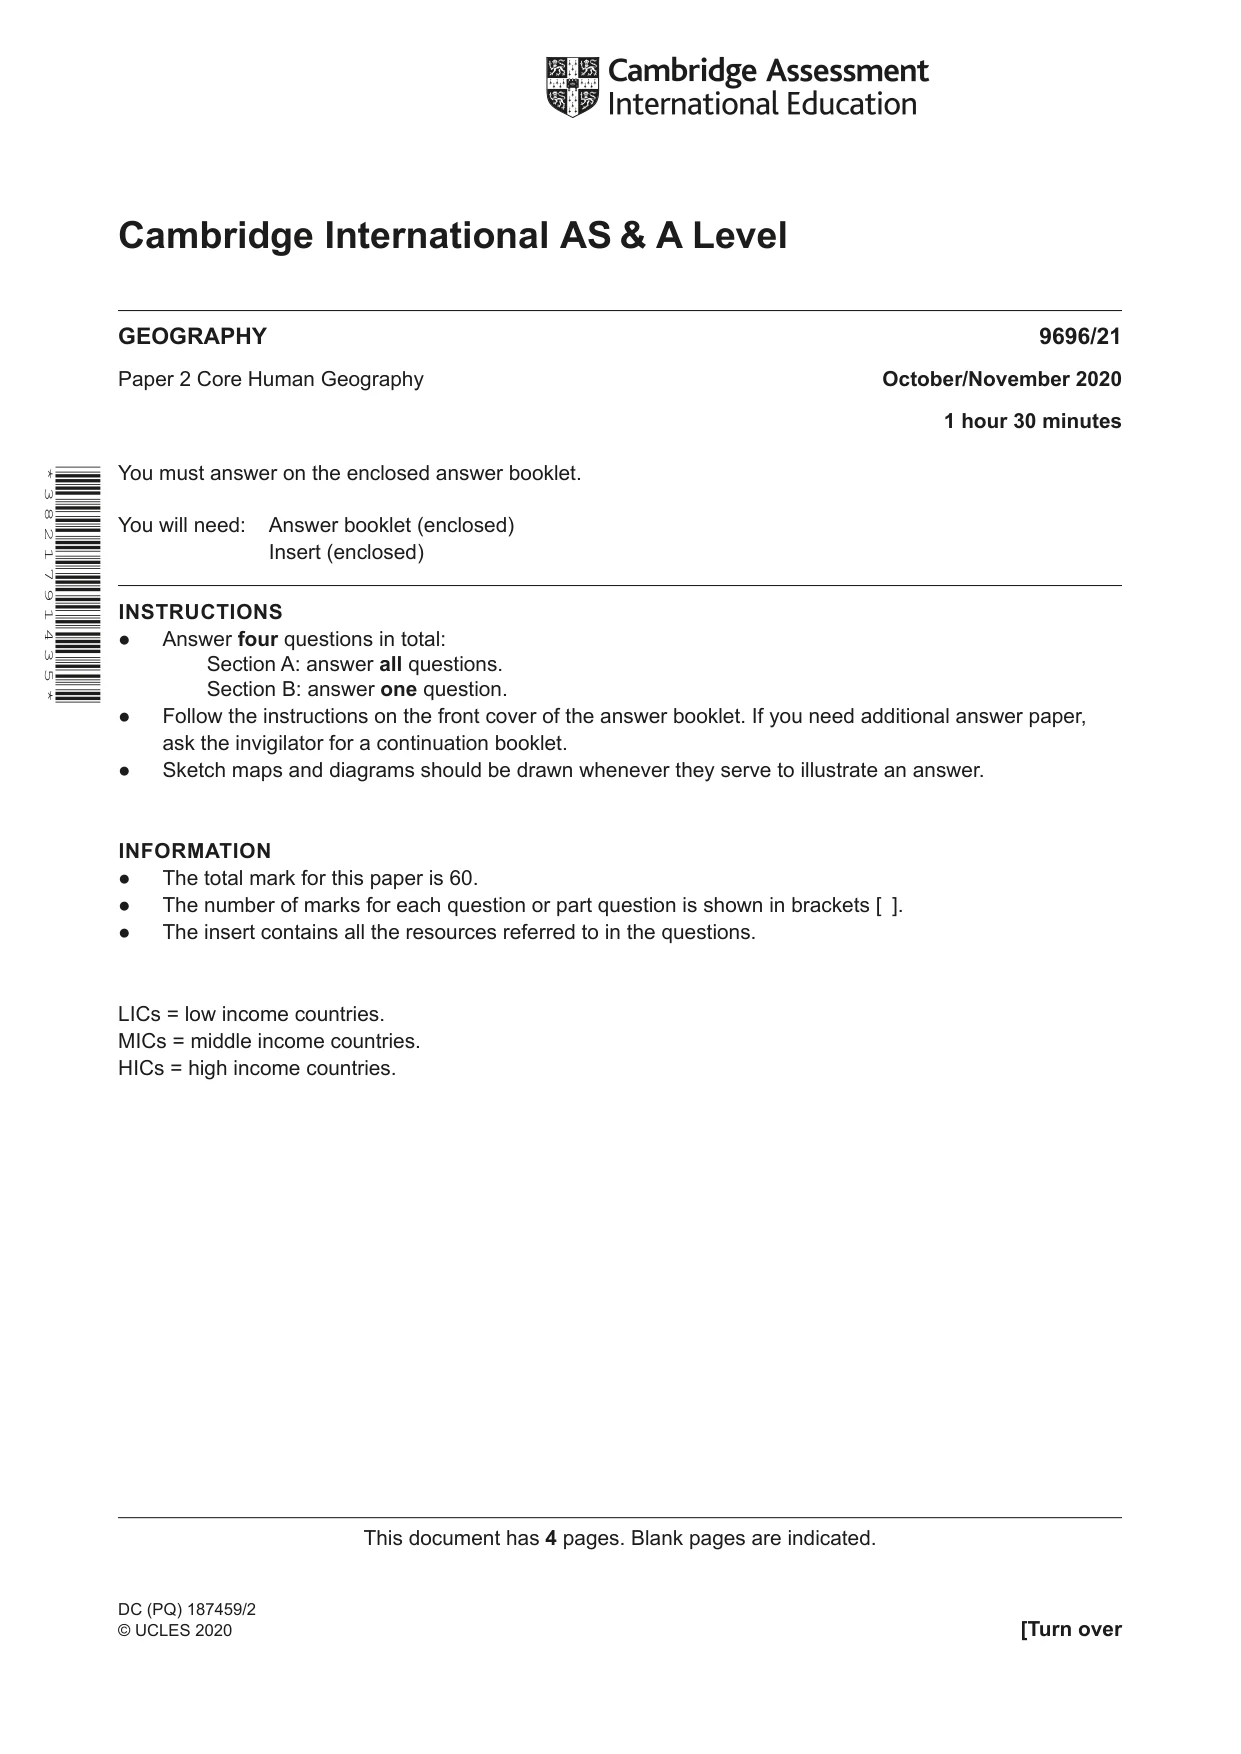
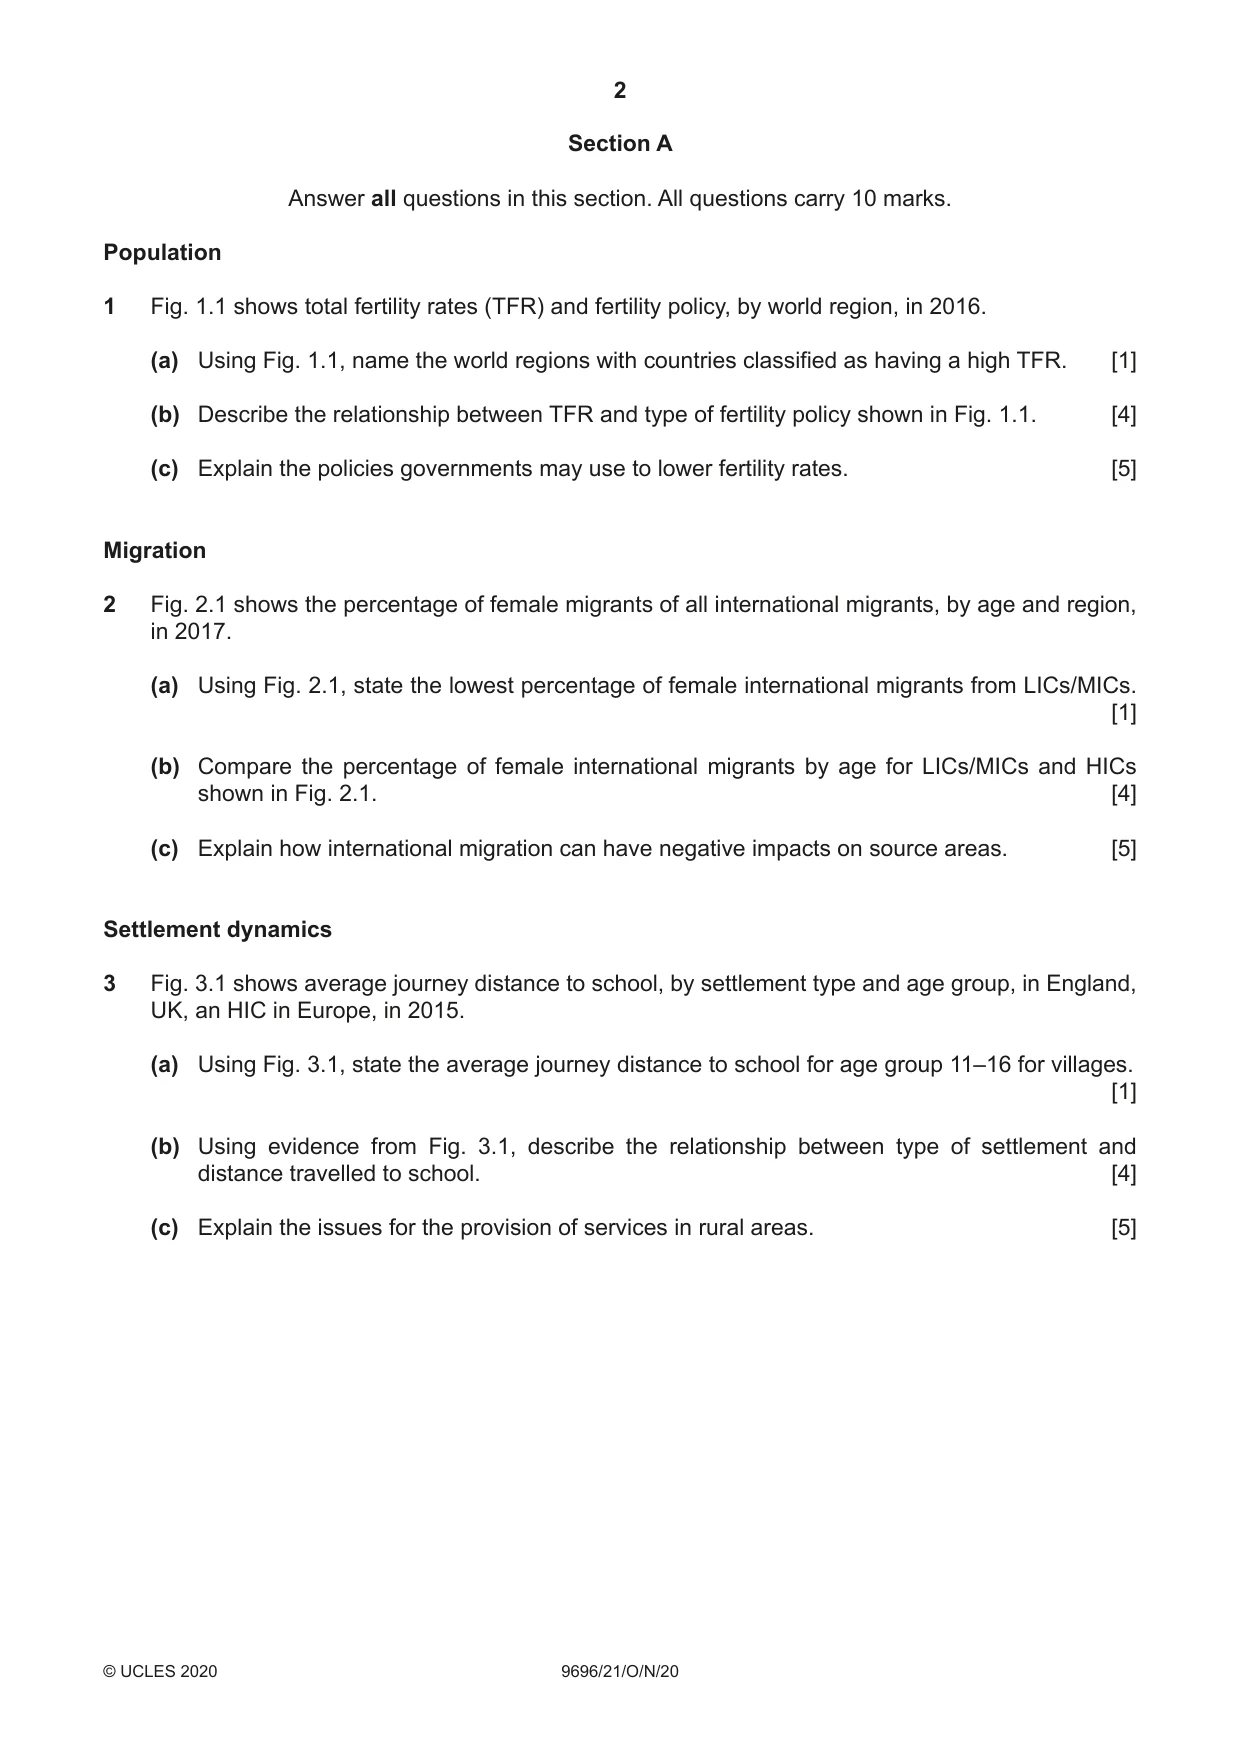
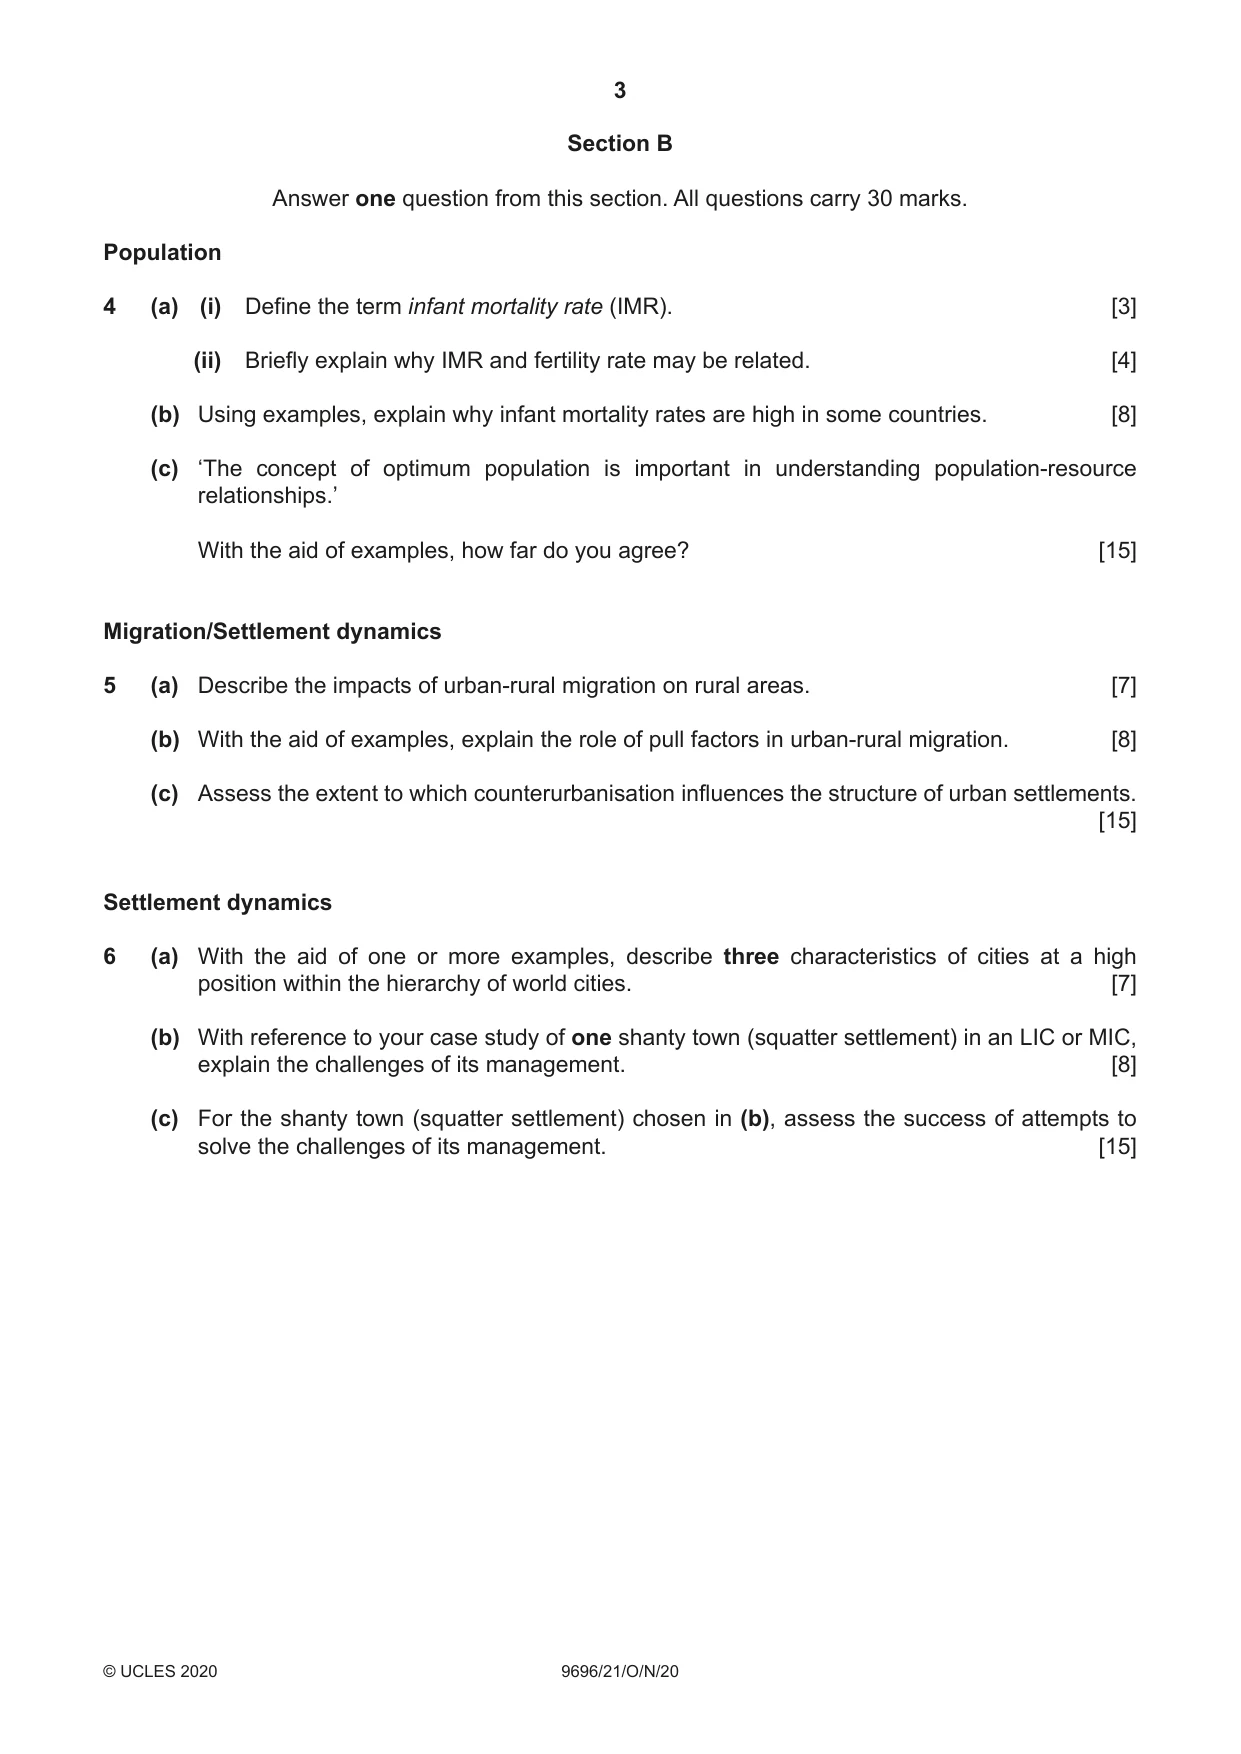

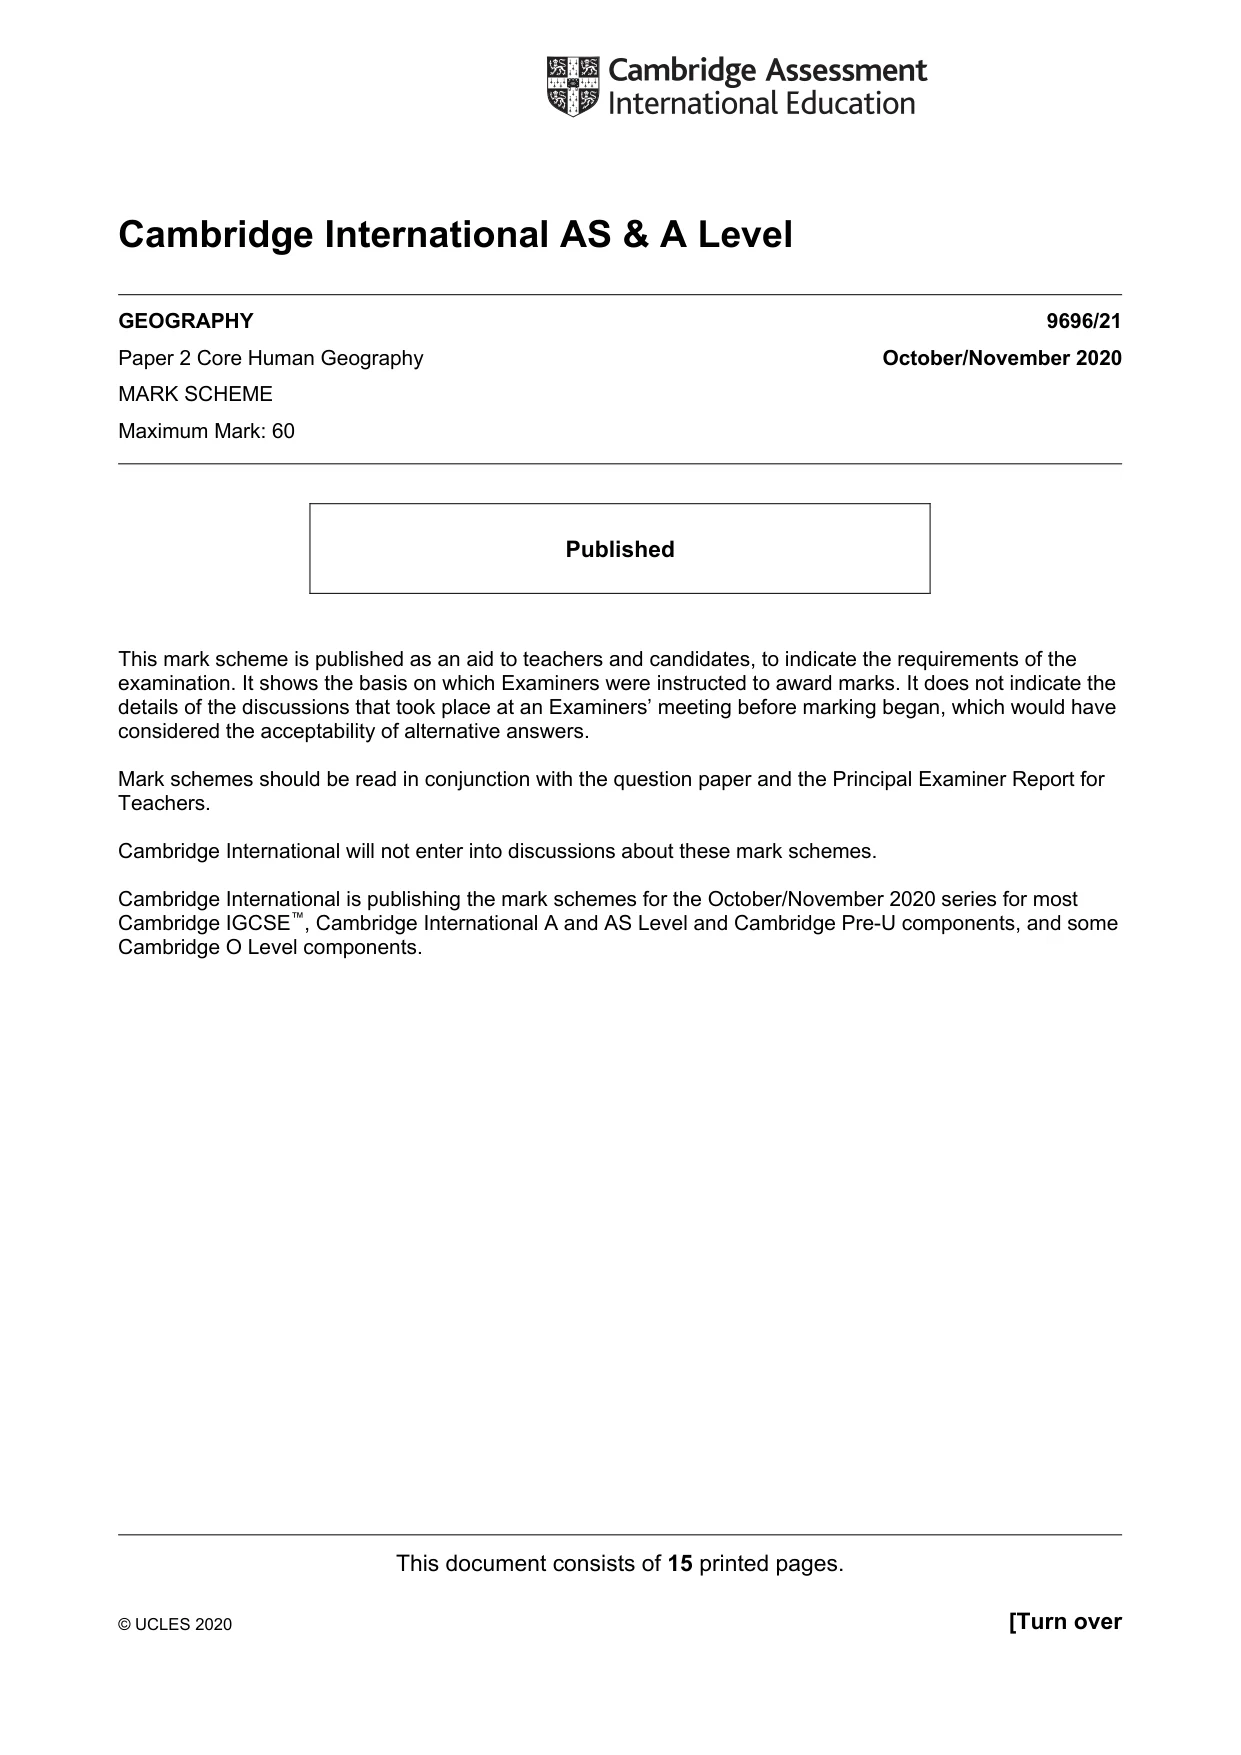
Mark scheme15 pages
Answers below. Sit the paper first if you are practising.
Questions as text
Q1 · Total fertility rates (TFR) and fertility policy, by world region, in 2016
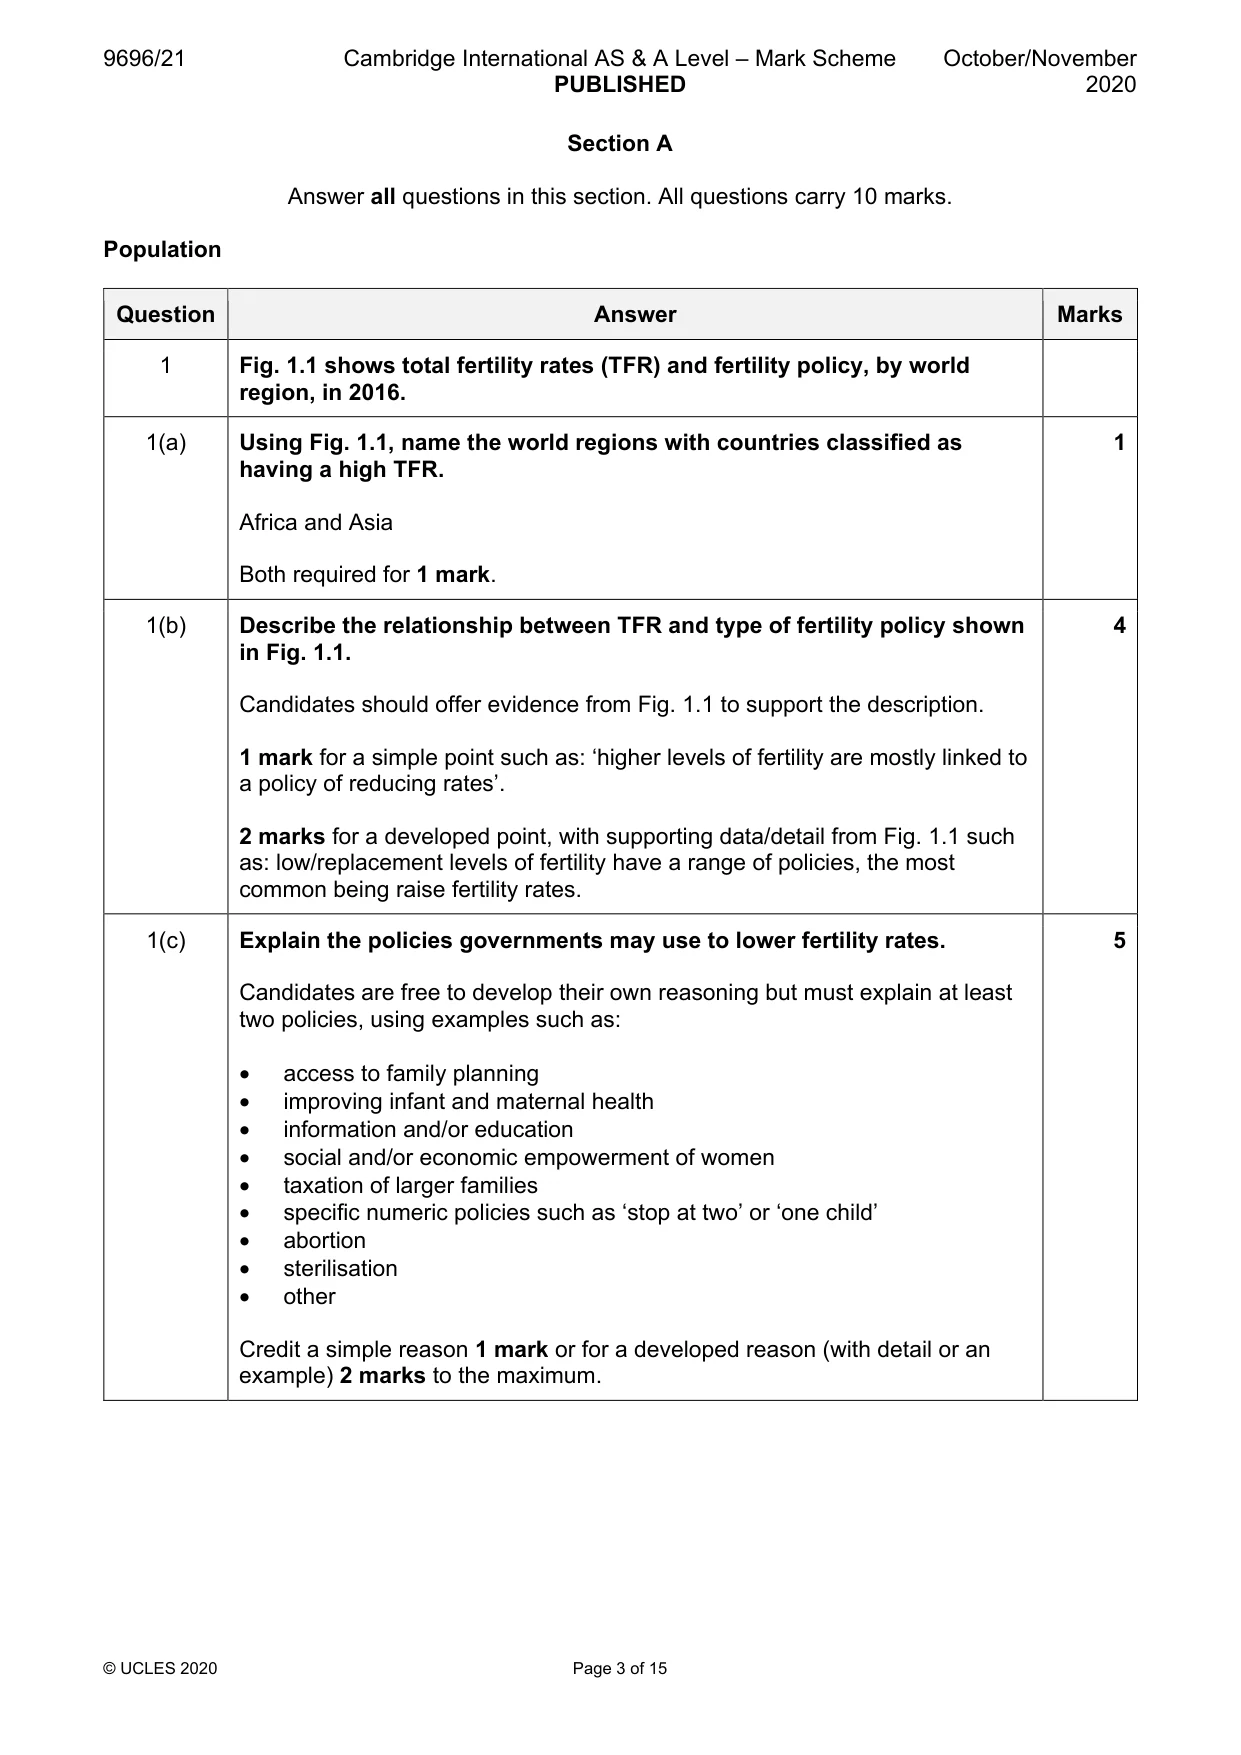
1 Fig. 1.1 shows total fertility rates (TFR) and fertility policy, by world region, in 2016. (a) Using Fig. 1.1, name the world regions with countries classified as having a high TFR. [1] (b) Describe the relationship between TFR and type of fertility policy shown in Fig. 1.1. [4] (c) Explain the policies governments may use to lower fertility rates. [5] Migration
Mark scheme: Question Answer Marks 1 Fig. 1.1 shows total fertility rates (TFR) and fertility policy, by world region, in 2016. 1(a) Using Fig. 1.1, name the world regions with countries classified as 1 having a high TFR. Africa and Asia Both required for 1 mark. 1(b) Describe the relationship between TFR and type of fertility policy shown 4 in Fig. 1.1. Candidates should offer evidence from Fig. 1.1 to support the description. 1 mark for a simple point such as: ‘higher levels of fertility are mostly linked to a policy of reducing rates’. 2 marks for a developed point, with supporting data/detail from Fig. 1.1 such as: low/replacement levels of fertility have a range of policies, the most common being raise fertility rates. 1(c) Explain the policies governments may use to lower fertility rates. 5 Candidates are free to develop their own reasoning but must explain at least two policies, using examples such as: • access to family planning • improving infant and maternal health • information and/or education • social and/or economic empowerment of women • taxation of larger families • specific numeric policies such as ‘stop at two’ or ‘one child’ • abortion • sterilisation • other Credit a simple reason 1 mark or for a developed reason (with detail or an example) 2 marks to the maximum. Migration
Q2 · The percentage of female migrants of all international migrants, by age and region, in…
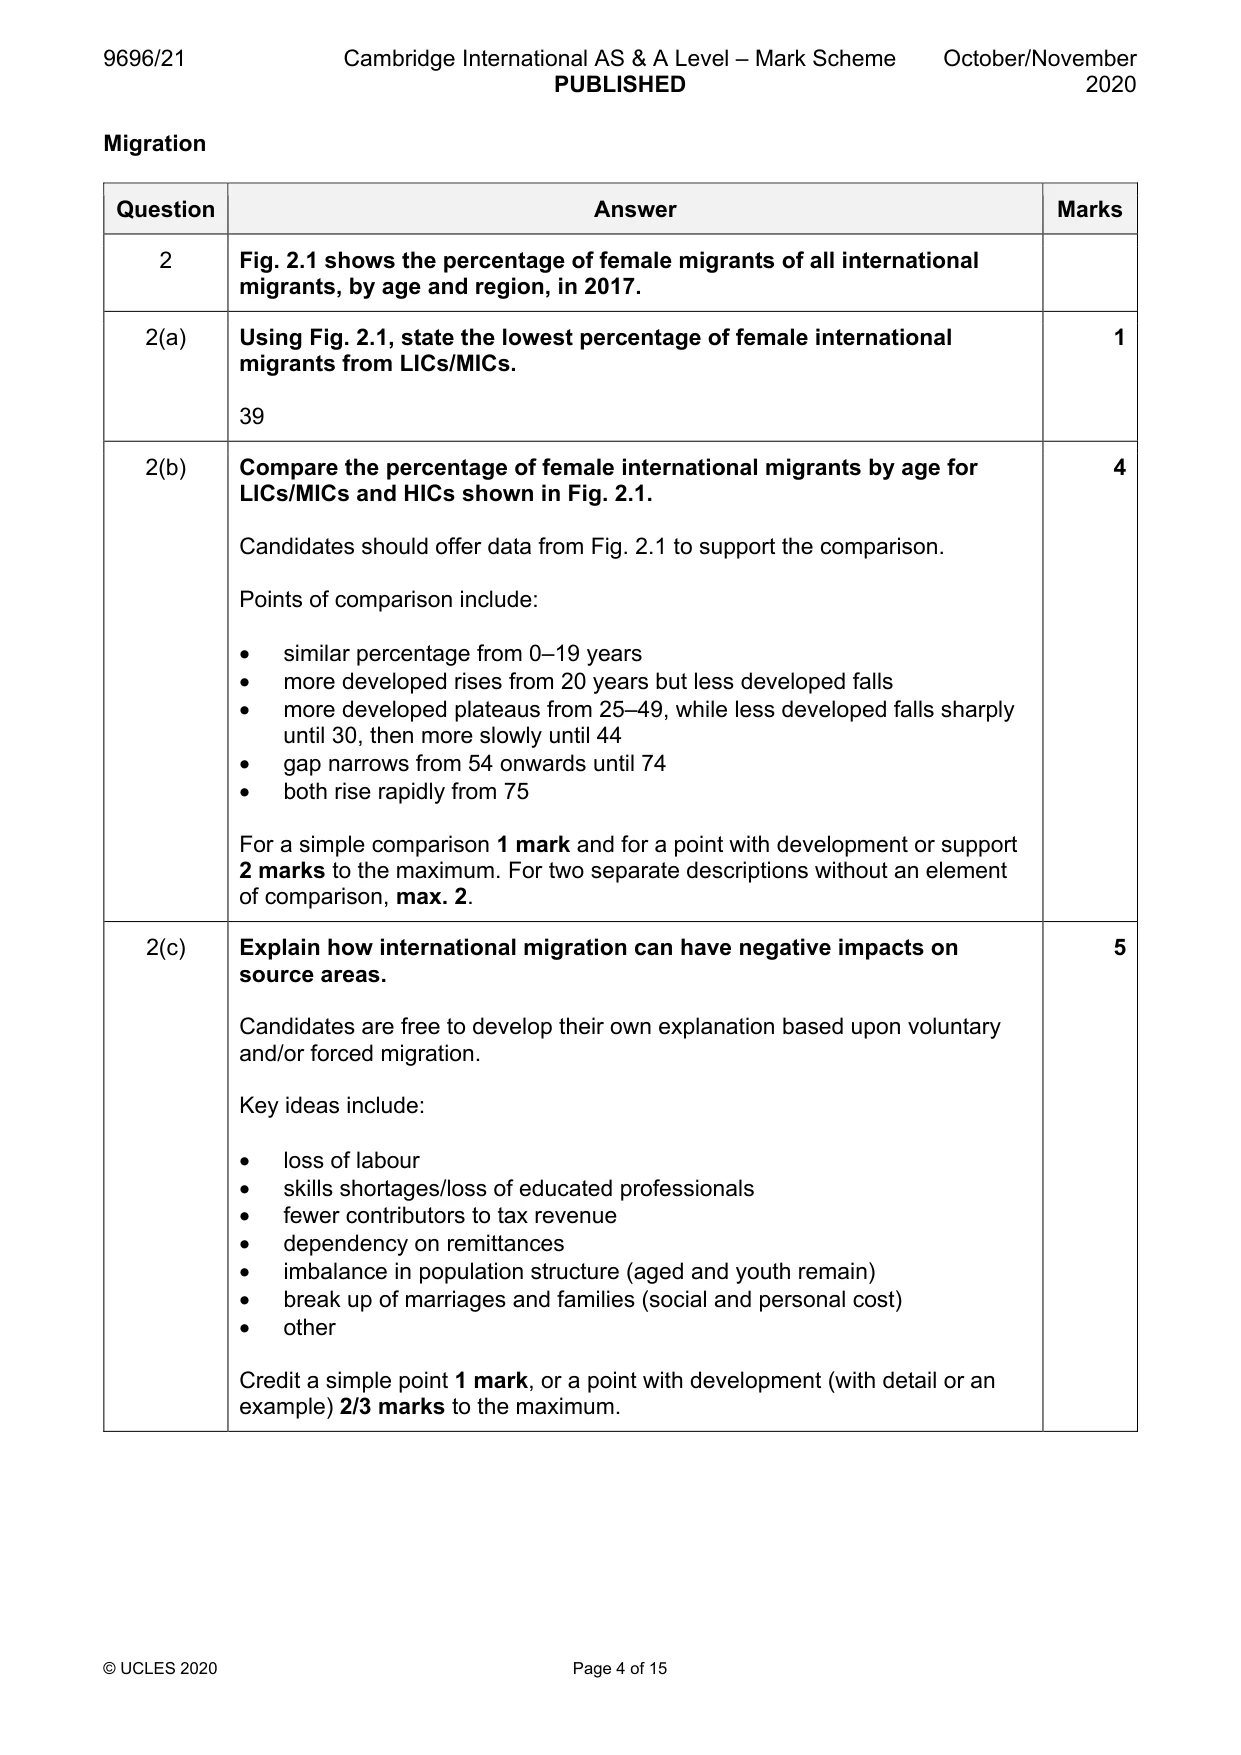
2 Fig. 2.1 shows the percentage of female migrants of all international migrants, by age and region, in 2017. (a) Using Fig. 2.1, state the lowest percentage of female international migrants from LICs/MICs. [1] (b) Compare the percentage of female international migrants by age for LICs/MICs and HICs shown in Fig. 2.1. [4] (c) Explain how international migration can have negative impacts on source areas. [5] Settlement dynamics
Mark scheme: 2 Fig. 2.1 shows the percentage of female migrants of all international migrants, by age and region, in 2017. 2(a) Using Fig. 2.1, state the lowest percentage of female international 1 migrants from LICs/MICs. 39 2(b) Compare the percentage of female international migrants by age for 4 LICs/MICs and HICs shown in Fig. 2.1. Candidates should offer data from Fig. 2.1 to support the comparison. Points of comparison include: • similar percentage from 0–19 years • more developed rises from 20 years but less developed falls • more developed plateaus from 25–49, while less developed falls sharply until 30, then more slowly until 44 • gap narrows from 54 onwards until 74 • both rise rapidly from 75 For a simple comparison 1 mark and for a point with development or support 2 marks to the maximum. For two separate descriptions without an element of comparison, max. 2. 2(c) Explain how international migration can have negative impacts on 5 source areas. Candidates are free to develop their own explanation based upon voluntary and/or forced migration. Key ideas include: • loss of labour • skills shortages/loss of educated professionals • fewer contributors to tax revenue • dependency on remittances • imbalance in population structure (aged and youth remain) • break up of marriages and families (social and personal cost) • other Credit a simple point 1 mark, or a point with development (with detail or an example) 2/3 marks to the maximum. Settlement dynamics
Q3 · Average journey distance to school, by settlement type and age group, in England, UK, an…
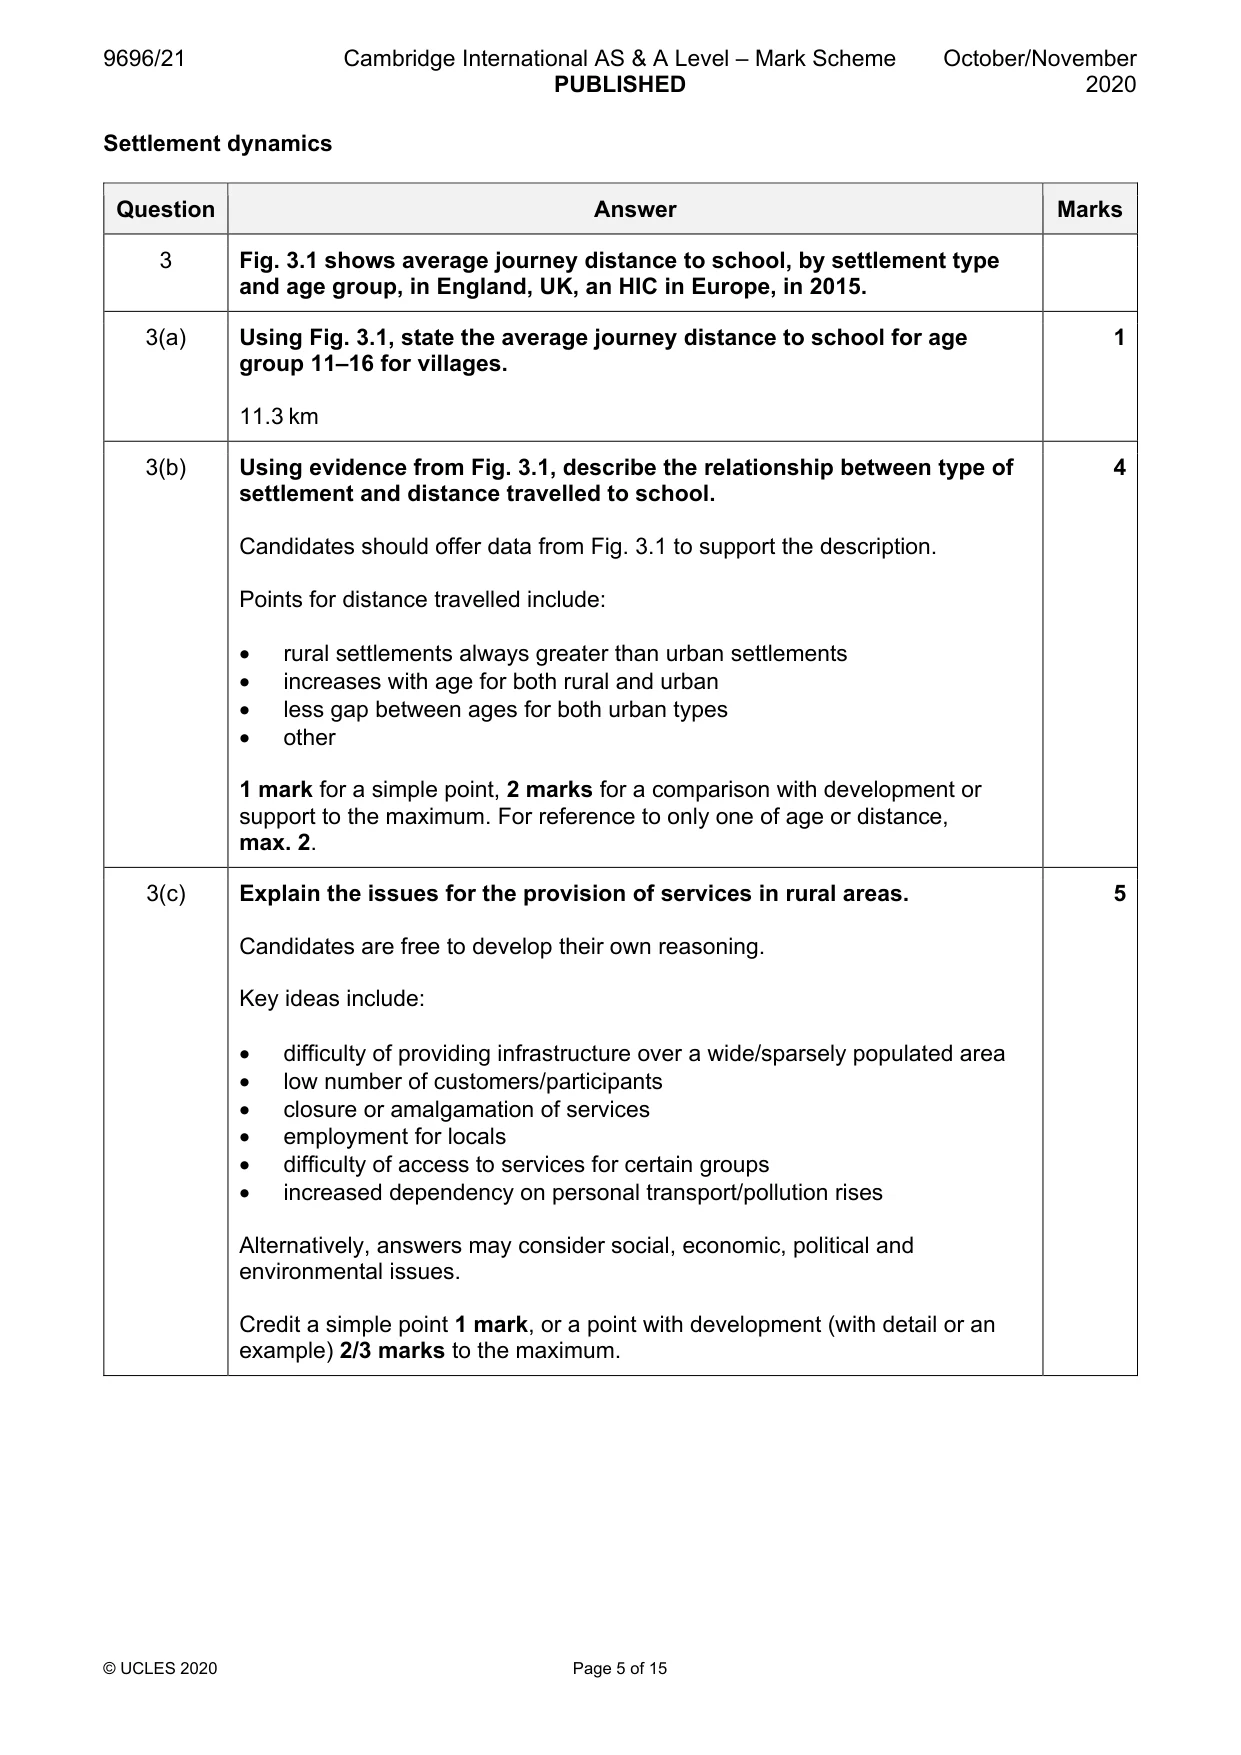
3 Fig. 3.1 shows average journey distance to school, by settlement type and age group, in England, UK, an HIC in Europe, in 2015. (a) Using Fig. 3.1, state the average journey distance to school for age group 11–16 for villages. [1] (b) Using evidence from Fig. 3.1, describe the relationship between type of settlement and distance travelled to school. [4] (c) Explain the issues for the provision of services in rural areas. [5]
Mark scheme: 3 Fig. 3.1 shows average journey distance to school, by settlement type and age group, in England, UK, an HIC in Europe, in 2015. 3(a) Using Fig. 3.1, state the average journey distance to school for age 1 group 11–16 for villages. 11.3 km 3(b) Using evidence from Fig. 3.1, describe the relationship between type of 4 settlement and distance travelled to school. Candidates should offer data from Fig. 3.1 to support the description. Points for distance travelled include: • rural settlements always greater than urban settlements • increases with age for both rural and urban • less gap between ages for both urban types • other 1 mark for a simple point, 2 marks for a comparison with development or support to the maximum. For reference to only one of age or distance, max. 2. 3(c) Explain the issues for the provision of services in rural areas. 5 Candidates are free to develop their own reasoning. Key ideas include: • difficulty of providing infrastructure over a wide/sparsely populated area • low number of customers/participants • closure or amalgamation of services • employment for locals • difficulty of access to services for certain groups • increased dependency on personal transport/pollution rises Alternatively, answers may consider social, economic, political and environmental issues. Credit a simple point 1 mark, or a point with development (with detail or an example) 2/3 marks to the maximum. Section B Answer one question from this section. All questions carry 30 marks. Population
Q4 · Define the term infant mortality rate (IMR)
4 (a) (i) Define the term infant mortality rate (IMR). [3] (ii) Briefly explain why IMR and fertility rate may be related. [4] (b) Using examples, explain why infant mortality rates are high in some countries. [8] (c) ‘The concept of optimum population is important in understanding population-resource relationships.’ With the aid of examples, how far do you agree? [15] Migration/Settlement dynamics
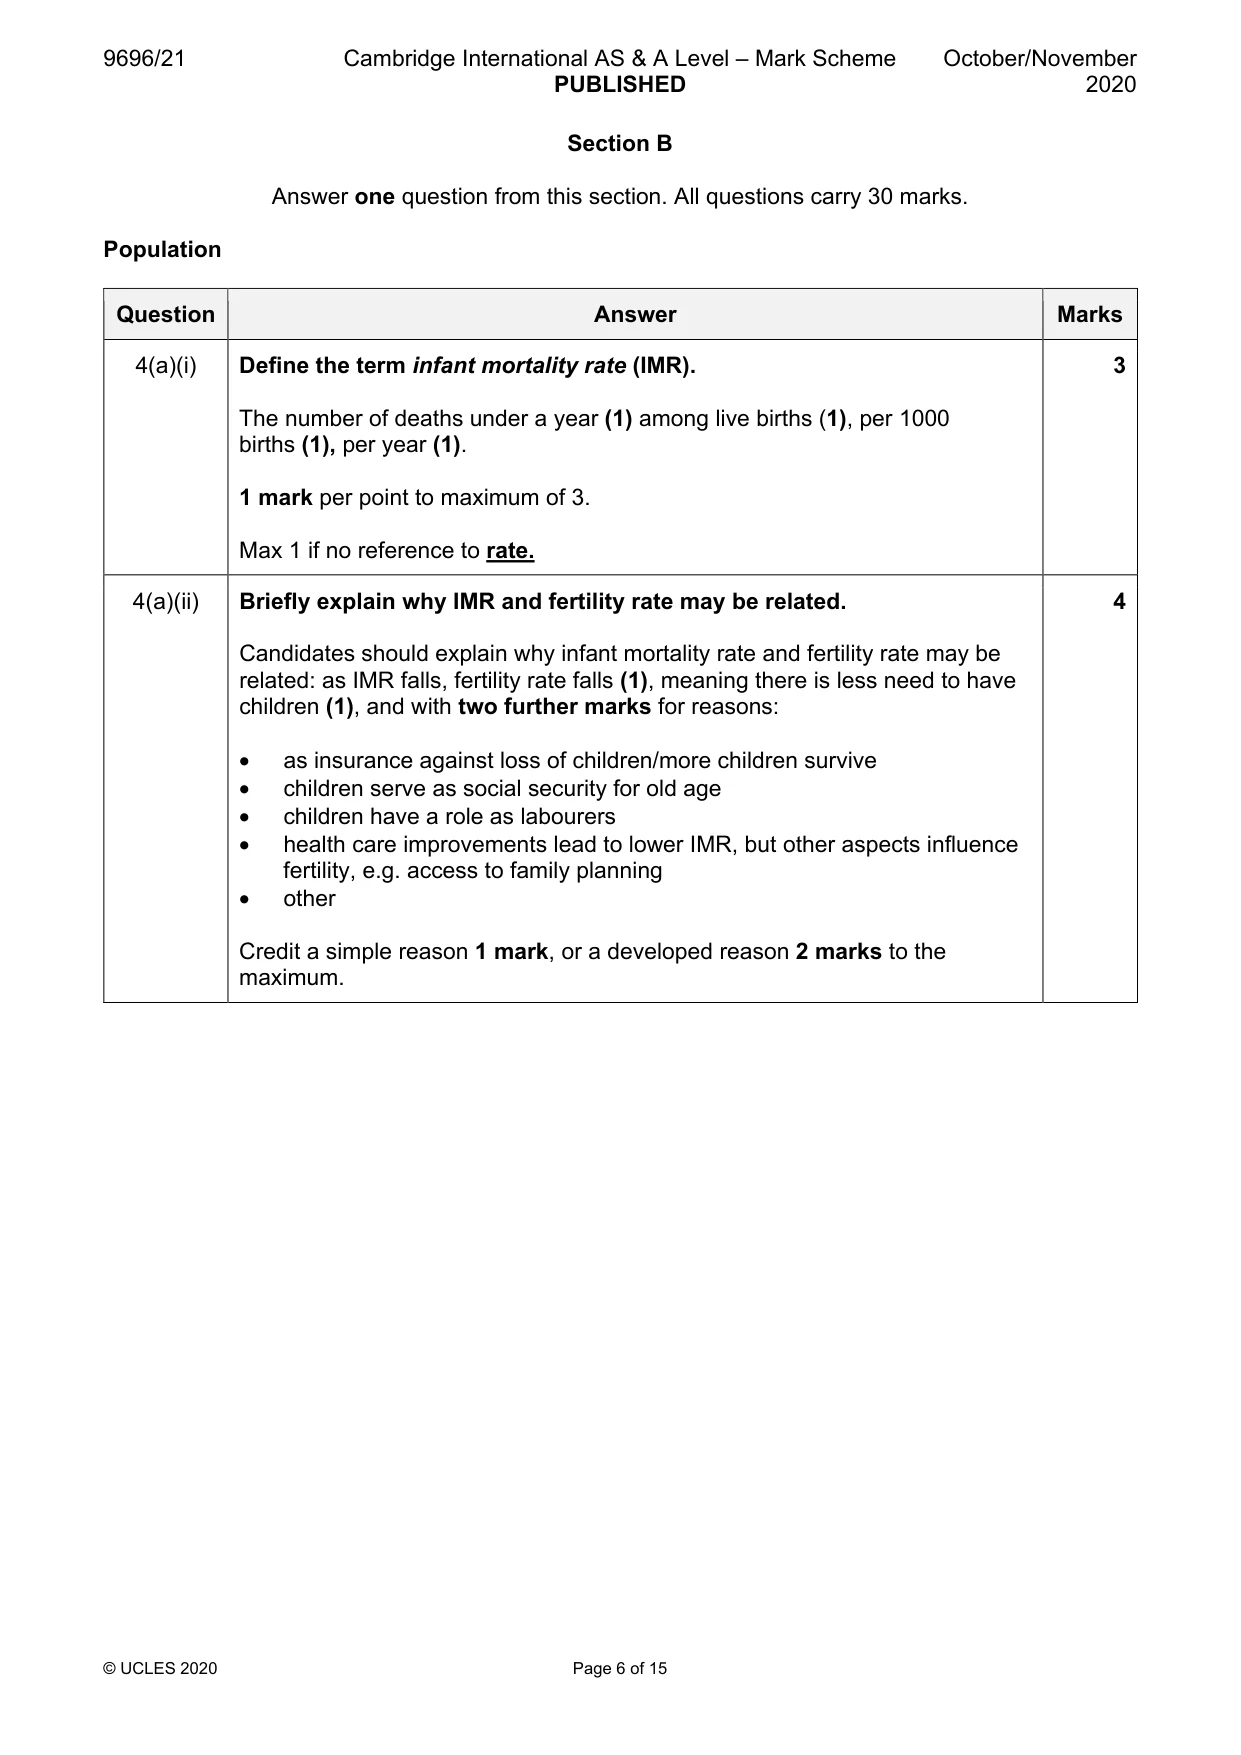
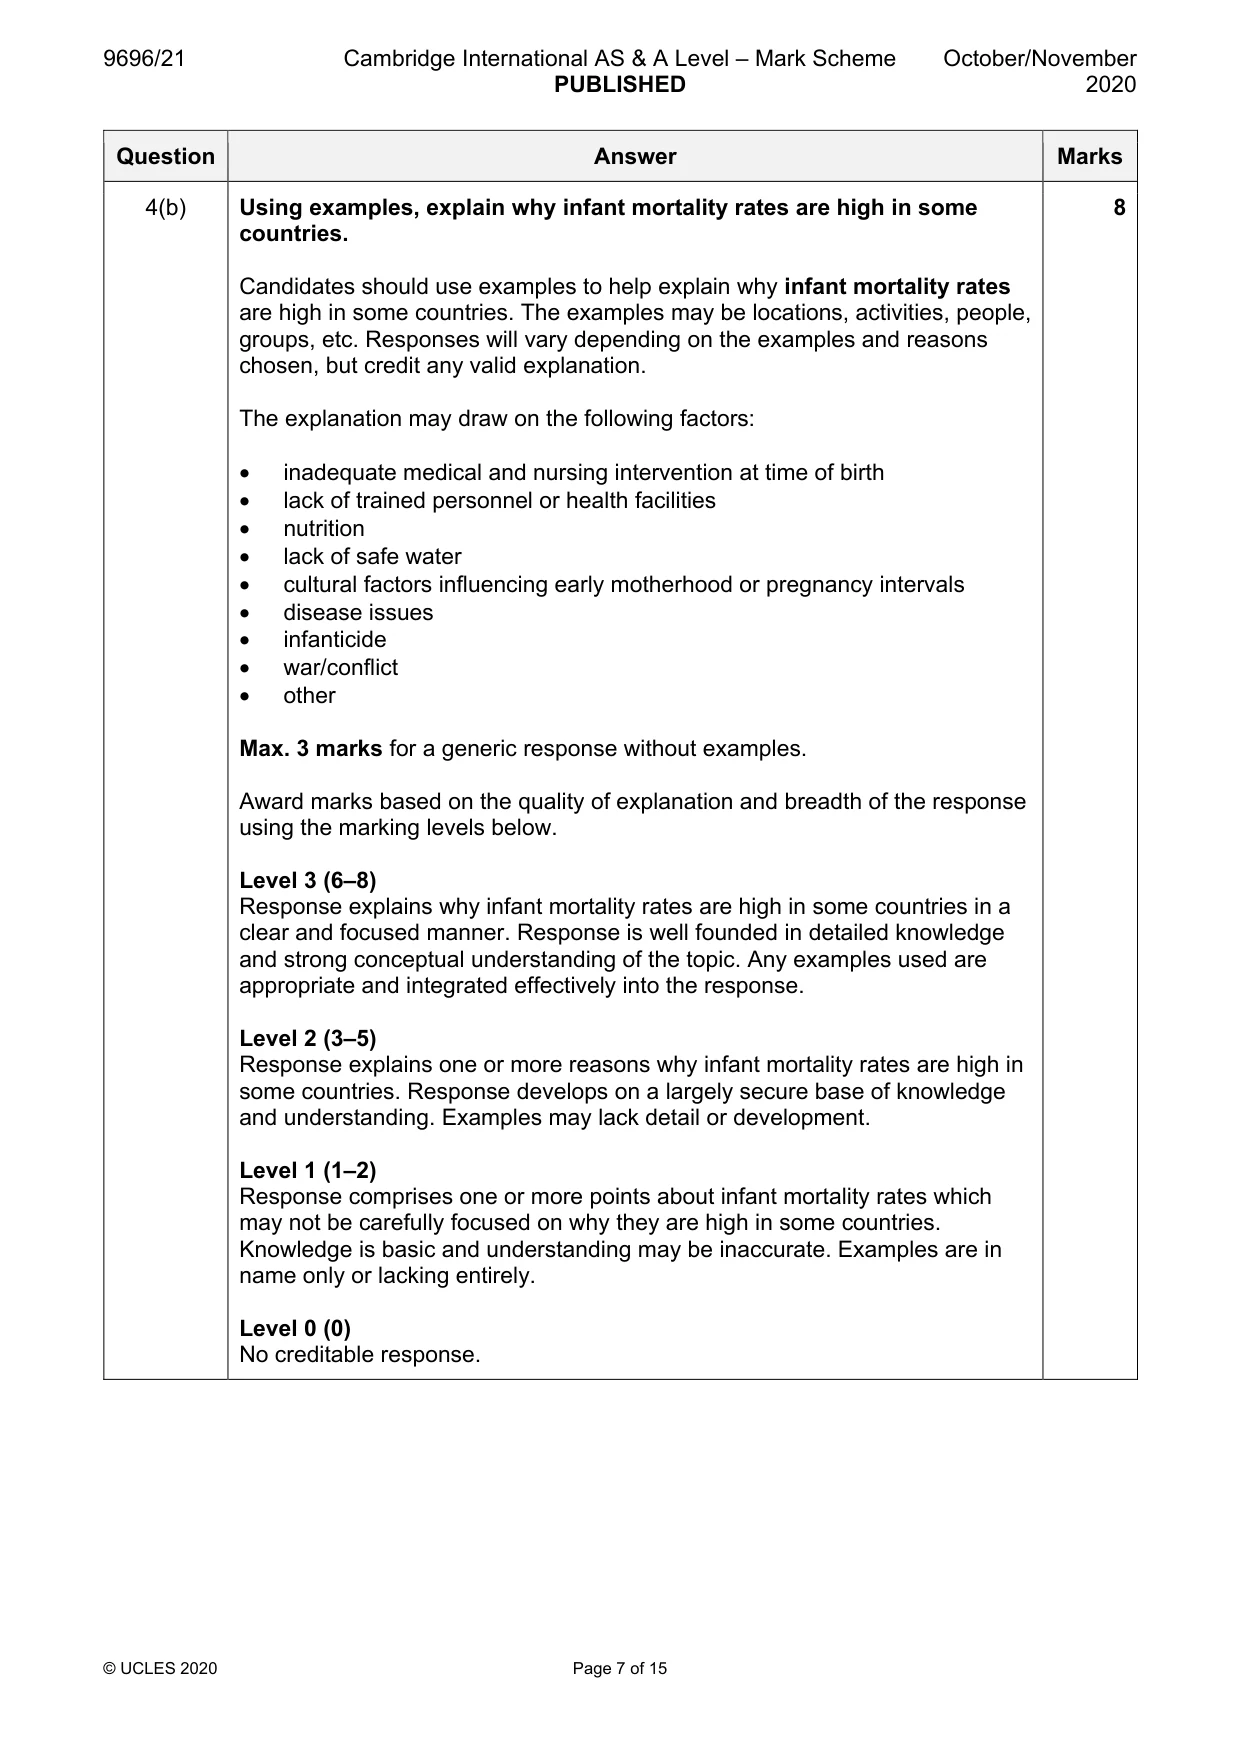
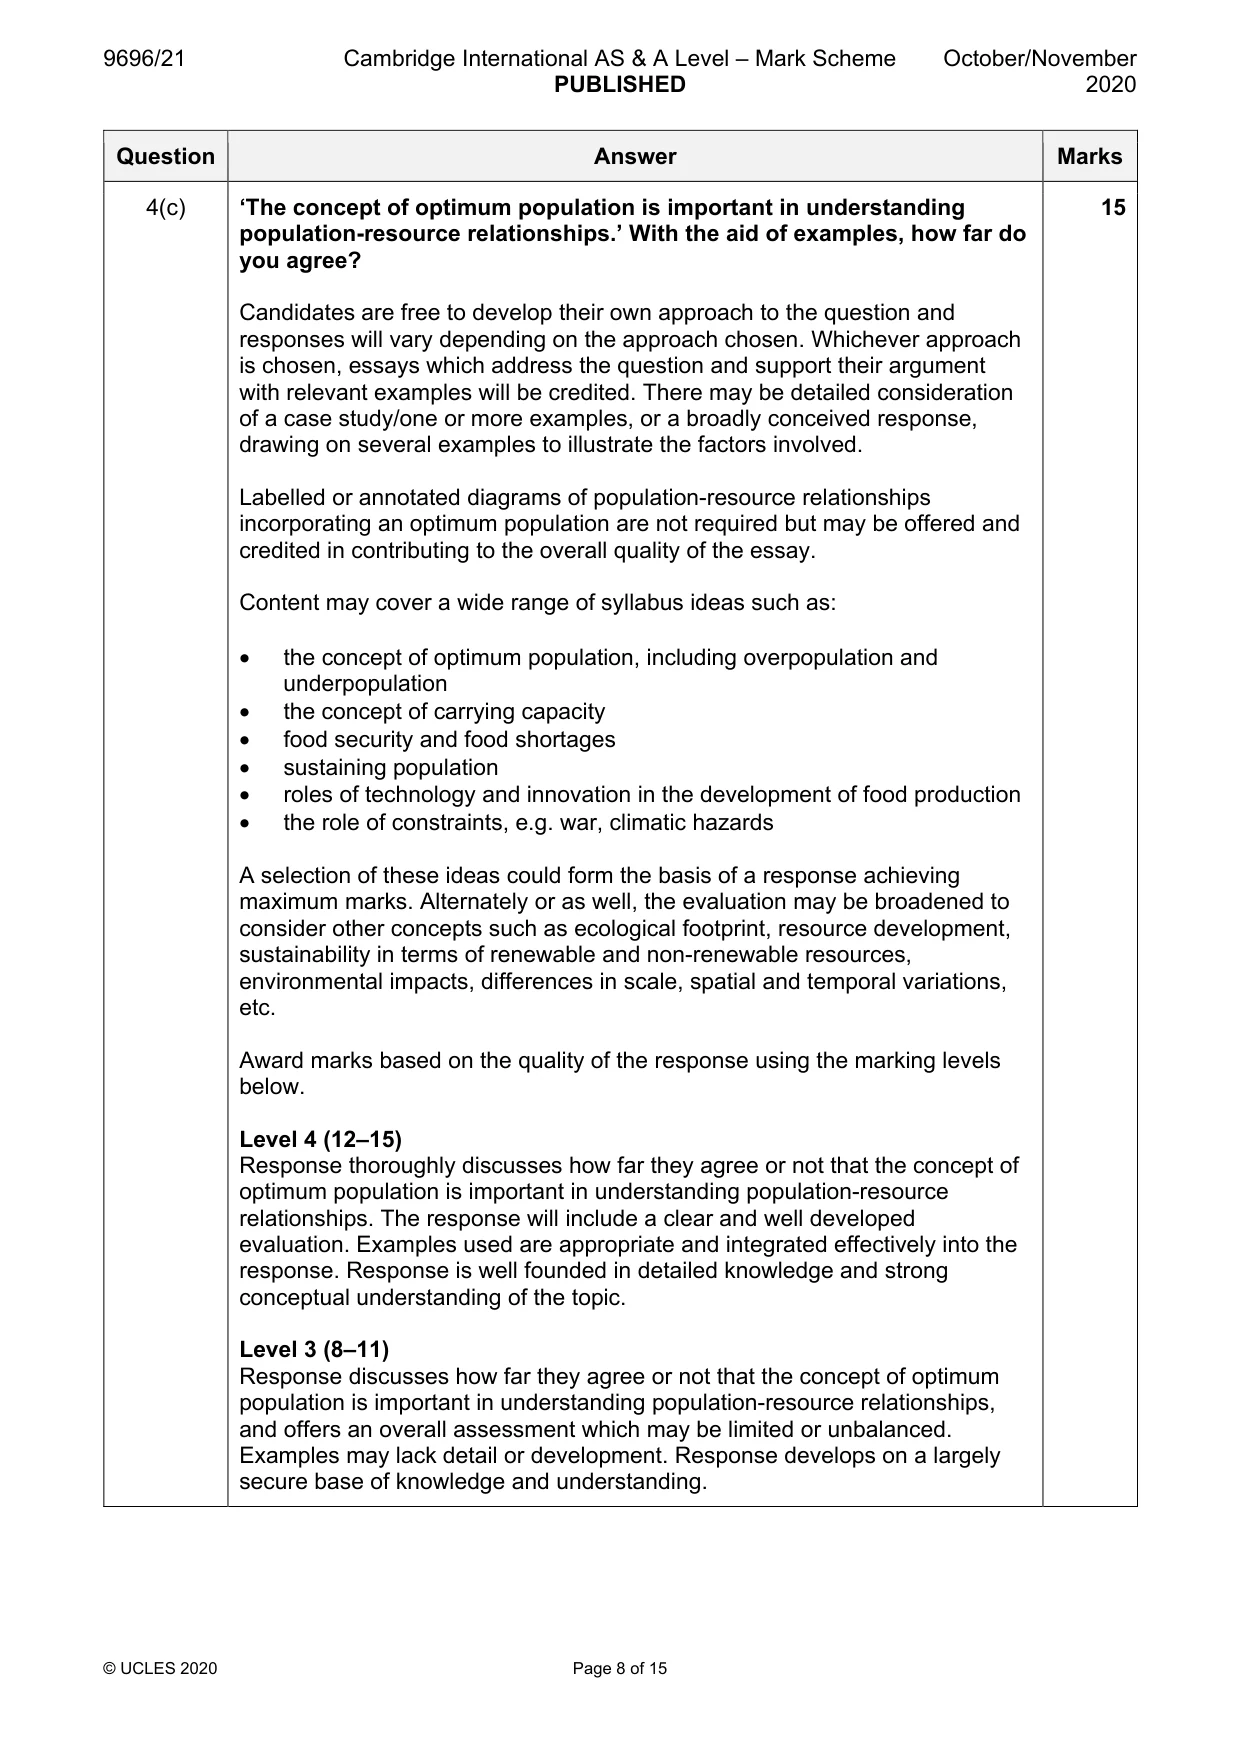
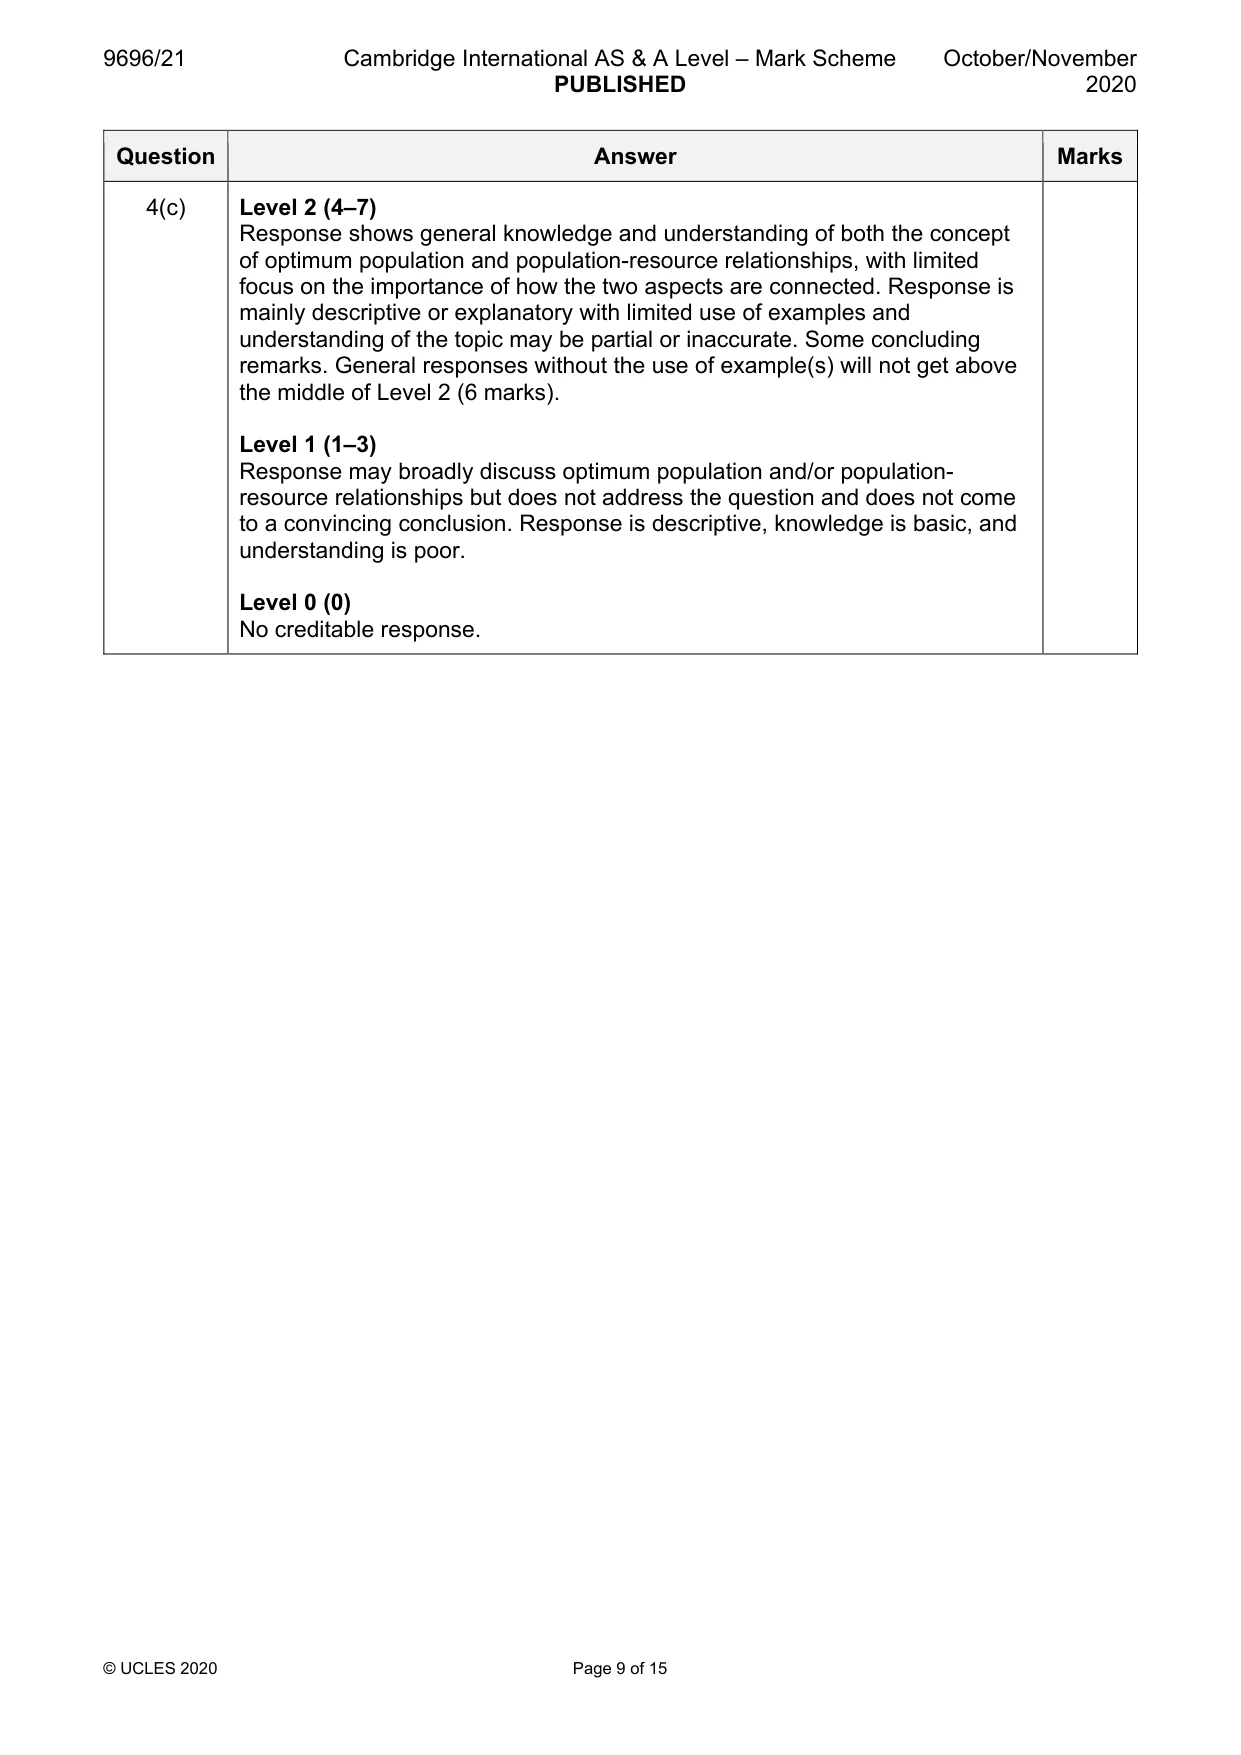
Mark scheme: 4(a)(i) Define the term infant mortality rate (IMR). 3 The number of deaths under a year (1) among live births (1), per 1000 births (1), per year (1). 1 mark per point to maximum of 3. Max 1 if no reference to rate. 4(a)(ii) Briefly explain why IMR and fertility rate may be related. 4 Candidates should explain why infant mortality rate and fertility rate may be related: as IMR falls, fertility rate falls (1), meaning there is less need to have children (1), and with two further marks for reasons: • as insurance against loss of children/more children survive • children serve as social security for old age • children have a role as labourers • health care improvements lead to lower IMR, but other aspects influence fertility, e.g. access to family planning • other Credit a simple reason 1 mark, or a developed reason 2 marks to the maximum. 4(b) Using examples, explain why infant mortality rates are high in some 8 countries. Candidates should use examples to help explain why infant mortality rates are high in some countries. The examples may be locations, activities, people, groups, etc. Responses will vary depending on the examples and reasons chosen, but credit any valid explanation. The explanation may draw on the following factors: • inadequate medical and nursing intervention at time of birth • lack of trained personnel or health facilities • nutrition • lack of safe water • cultural factors influencing early motherhood or pregnancy intervals • disease issues • infanticide • war/conflict • other Max. 3 marks for a generic response without examples. Award marks based on the quality of explanation and breadth of the response using the marking levels below. Level 3 (6–8) Response explains why infant mortality rates are high in some countries in a clear and focused manner. Response is well founded in detailed knowledge and strong conceptual understanding of the topic. Any examples used are appropriate and integrated effectively into the response. Level 2 (3–5) Response explains one or more reasons why infant mortality rates are high in some countries. Response develops on a largely secure base of knowledge and understanding. Examples may lack detail or development. Level 1 (1–2) Response comprises one or more points about infant mortality rates which may not be carefully focused on why they are high in some countries. Knowledge is basic and understanding may be inaccurate. Examples are in name only or lacking entirely. Level 0 (0) No creditable response. 4(c) ‘The concept of optimum population is important in understanding 15 population-resource relationships.’ With the aid of examples, how far do you agree? Candidates are free to develop their own approach to the question and responses will vary depending on the approach chosen. Whichever approach is chosen, essays which address the question and support their argument with relevant examples will be credited. There may be detailed consideration of a case study/one or more examples, or a broadly conceived response, drawing on several examples to illustrate the factors involved. Labelled or annotated diagrams of population-resource relationships incorporating an optimum population are not required but may be offered and credited in contributing to the overall quality of the essay. Content may cover a wide range of syllabus ideas such as: • the concept of optimum population, including overpopulation and underpopulation • the concept of carrying capacity • food security and food shortages • sustaining population • roles of technology and innovation in the development of food production • the role of constraints, e.g. war, climatic hazards A selection of these ideas could form the basis of a response achieving maximum marks. Alternately or as well, the evaluation may be broadened to consider other concepts such as ecological footprint, resource development, sustainability in terms of renewable and non-renewable resources, environmental impacts, differences in scale, spatial and temporal variations, etc. Award marks based on the quality of the response using the marking levels below. Level 4 (12–15) Response thoroughly discusses how far they agree or not that the concept of optimum population is important in understanding population-resource relationships. The response will include a clear and well developed evaluation. Examples used are appropriate and integrated effectively into the response. Response is well founded in detailed knowledge and strong conceptual understanding of the topic. Level 3 (8–11) Response discusses how far they agree or not that the concept of optimum population is important in understanding population-resource relationships, and offers an overall assessment which may be limited or unbalanced. Examples may lack detail or development. Response develops on a largely secure base of knowledge and understanding. 4(c) Level 2 (4–7) Response shows general knowledge and understanding of both the concept of optimum population and population-resource relationships, with limited focus on the importance of how the two aspects are connected. Response is mainly descriptive or explanatory with limited use of examples and understanding of the topic may be partial or inaccurate. Some concluding remarks. General responses without the use of example(s) will not get above the middle of Level 2 (6 marks). Level 1 (1–3) Response may broadly discuss optimum population and/or population- resource relationships but does not address the question and does not come to a convincing conclusion. Response is descriptive, knowledge is basic, and understanding is poor. Level 0 (0) No creditable response. Migration/Settlement dynamics
Q5 · Describe the impacts of urban-rural migration on rural areas
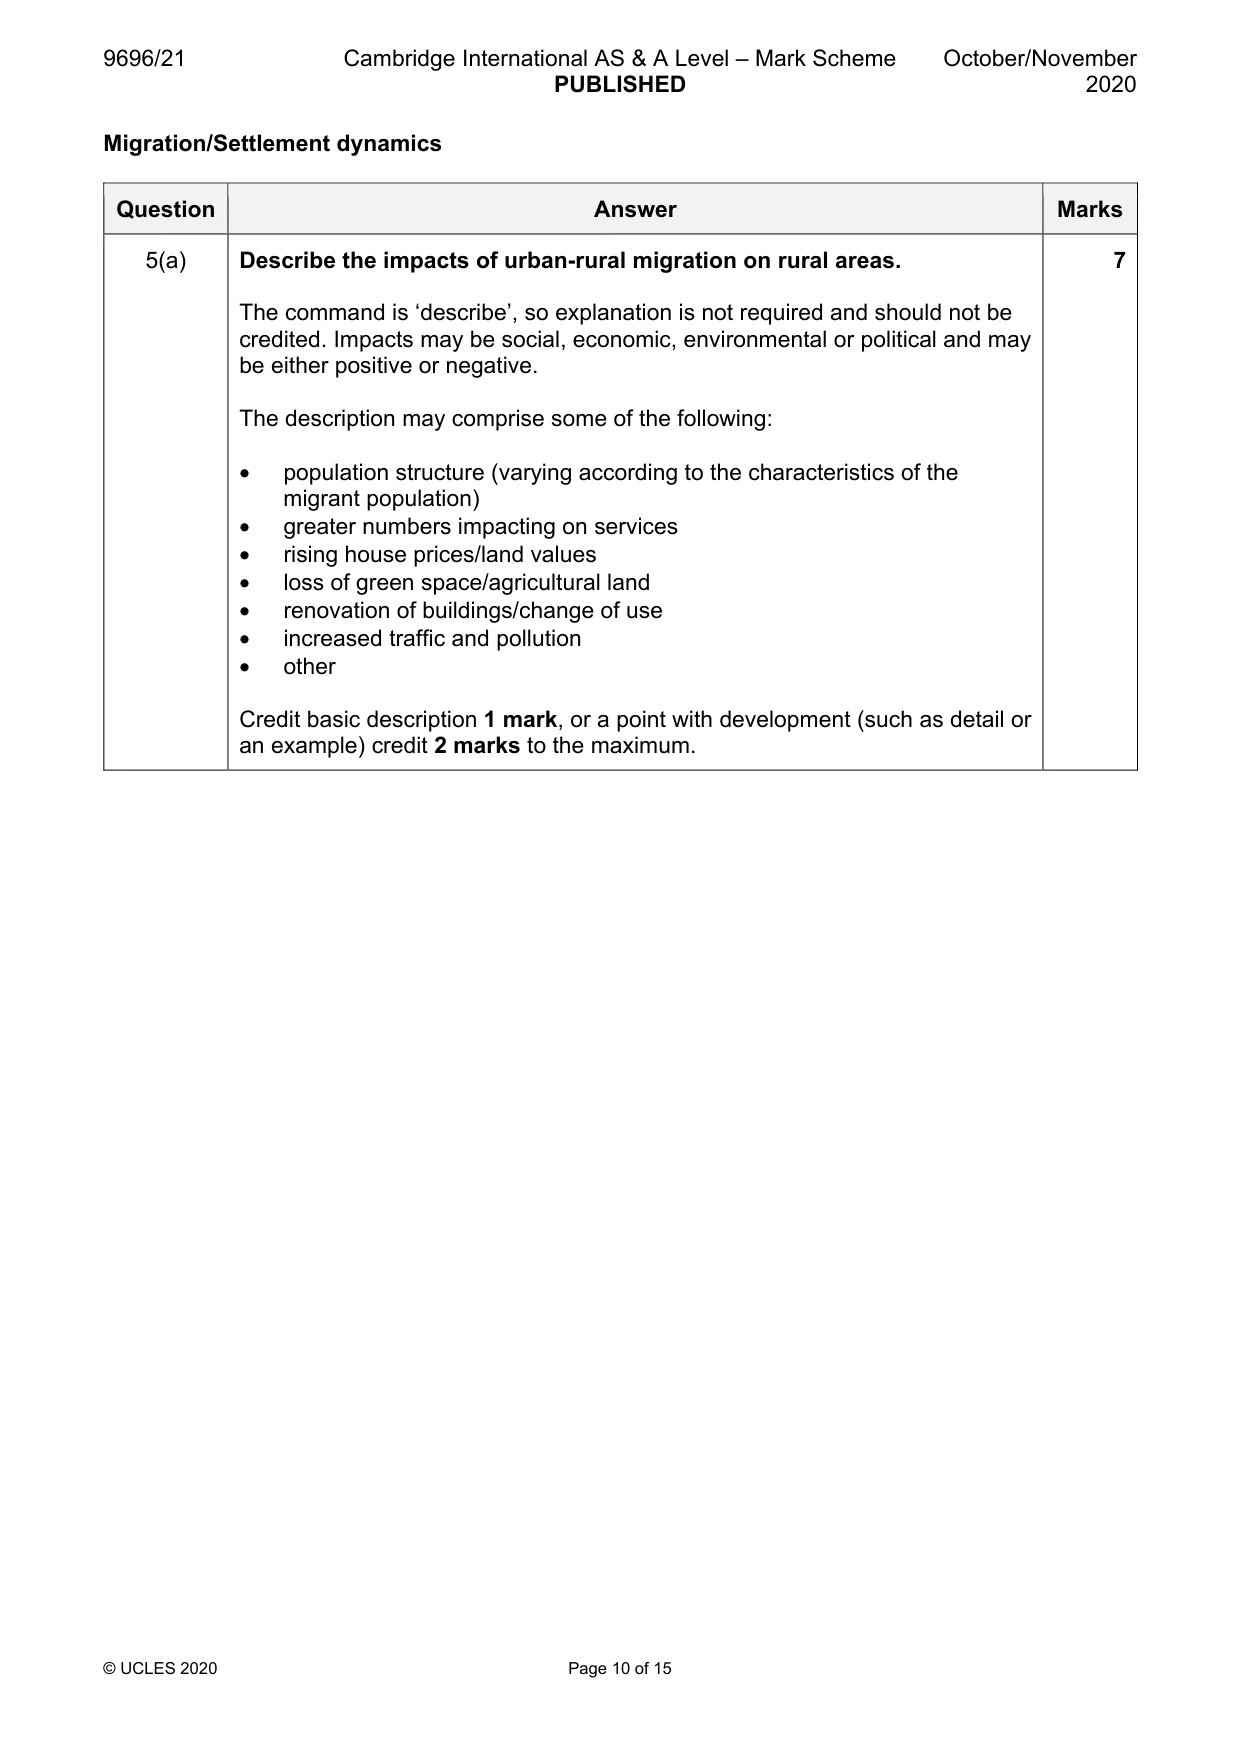
5 (a) Describe the impacts of urban-rural migration on rural areas. [7] (b) With the aid of examples, explain the role of pull factors in urban-rural migration. [8] (c) Assess the extent to which counterurbanisation influences the structure of urban settlements. [15] Settlement dynamics
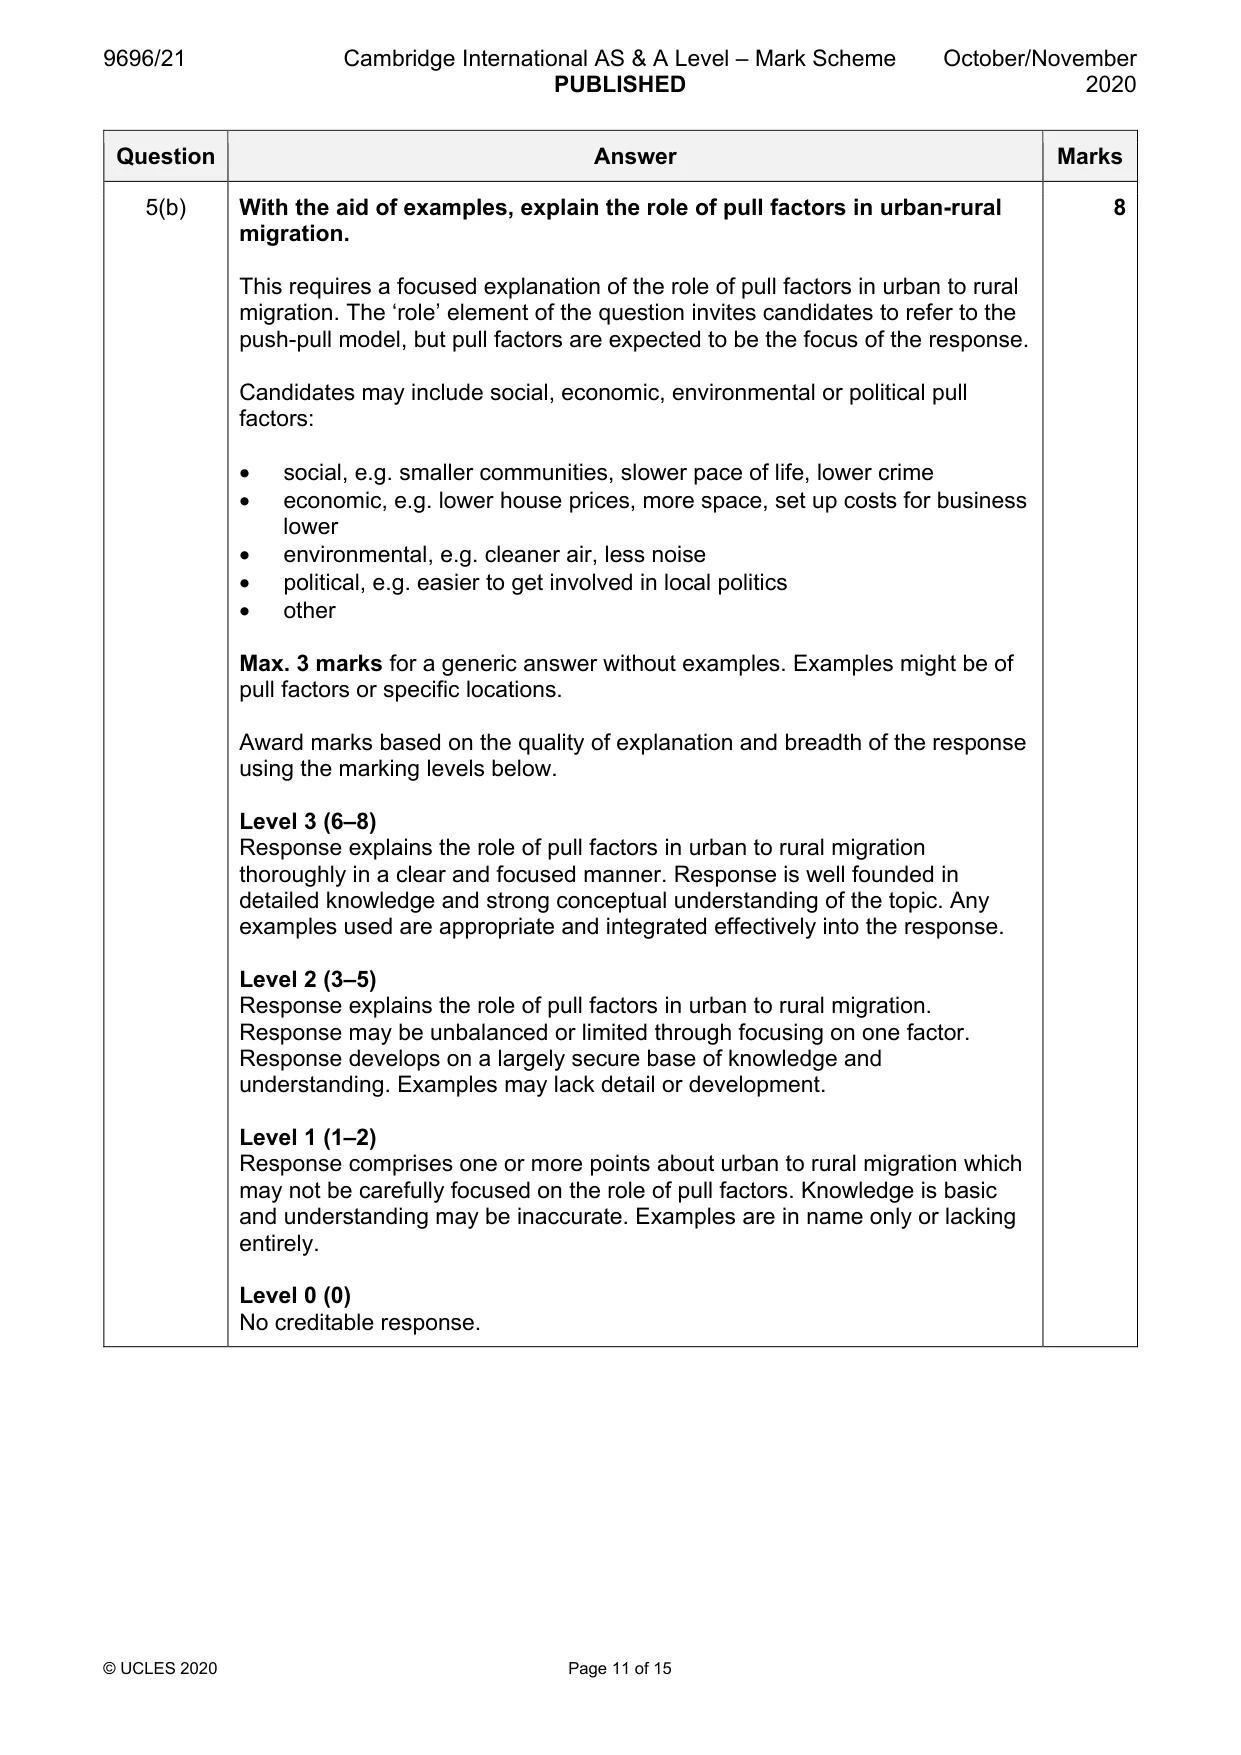
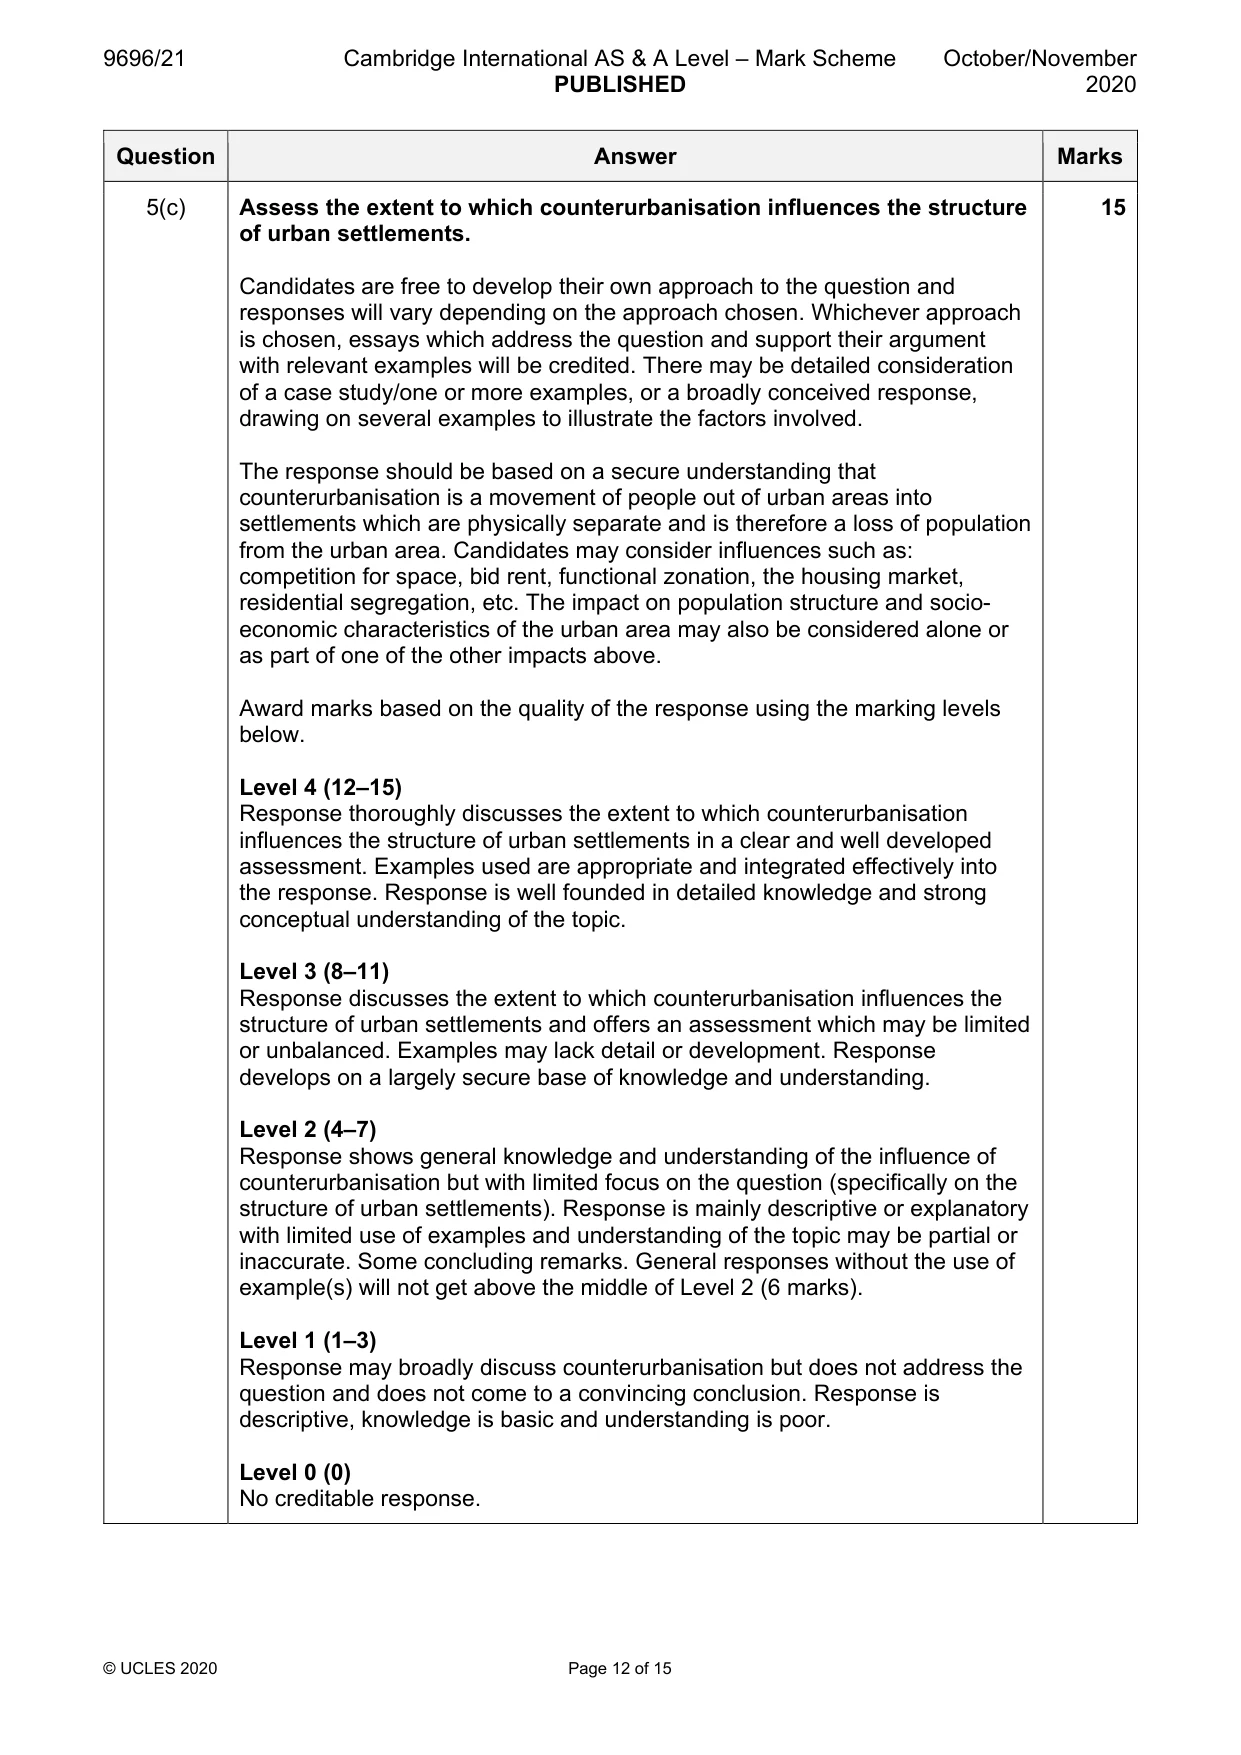
Mark scheme: 5(a) Describe the impacts of urban-rural migration on rural areas. 7 The command is ‘describe’, so explanation is not required and should not be credited. Impacts may be social, economic, environmental or political and may be either positive or negative. The description may comprise some of the following: • population structure (varying according to the characteristics of the migrant population) • greater numbers impacting on services • rising house prices/land values • loss of green space/agricultural land • renovation of buildings/change of use • increased traffic and pollution • other Credit basic description 1 mark, or a point with development (such as detail or an example) credit 2 marks to the maximum. 5(b) With the aid of examples, explain the role of pull factors in urban-rural 8 migration. This requires a focused explanation of the role of pull factors in urban to rural migration. The ‘role’ element of the question invites candidates to refer to the push-pull model, but pull factors are expected to be the focus of the response. Candidates may include social, economic, environmental or political pull factors: • social, e.g. smaller communities, slower pace of life, lower crime • economic, e.g. lower house prices, more space, set up costs for business lower • environmental, e.g. cleaner air, less noise • political, e.g. easier to get involved in local politics • other Max. 3 marks for a generic answer without examples. Examples might be of pull factors or specific locations. Award marks based on the quality of explanation and breadth of the response using the marking levels below. Level 3 (6–8) Response explains the role of pull factors in urban to rural migration thoroughly in a clear and focused manner. Response is well founded in detailed knowledge and strong conceptual understanding of the topic. Any examples used are appropriate and integrated effectively into the response. Level 2 (3–5) Response explains the role of pull factors in urban to rural migration. Response may be unbalanced or limited through focusing on one factor. Response develops on a largely secure base of knowledge and understanding. Examples may lack detail or development. Level 1 (1–2) Response comprises one or more points about urban to rural migration which may not be carefully focused on the role of pull factors. Knowledge is basic and understanding may be inaccurate. Examples are in name only or lacking entirely. Level 0 (0) No creditable response. 5(c) Assess the extent to which counterurbanisation influences the structure 15 of urban settlements. Candidates are free to develop their own approach to the question and responses will vary depending on the approach chosen. Whichever approach is chosen, essays which address the question and support their argument with relevant examples will be credited. There may be detailed consideration of a case study/one or more examples, or a broadly conceived response, drawing on several examples to illustrate the factors involved. The response should be based on a secure understanding that counterurbanisation is a movement of people out of urban areas into settlements which are physically separate and is therefore a loss of population from the urban area. Candidates may consider influences such as: competition for space, bid rent, functional zonation, the housing market, residential segregation, etc. The impact on population structure and socio- economic characteristics of the urban area may also be considered alone or as part of one of the other impacts above. Award marks based on the quality of the response using the marking levels below. Level 4 (12–15) Response thoroughly discusses the extent to which counterurbanisation influences the structure of urban settlements in a clear and well developed assessment. Examples used are appropriate and integrated effectively into the response. Response is well founded in detailed knowledge and strong conceptual understanding of the topic. Level 3 (8–11) Response discusses the extent to which counterurbanisation influences the structure of urban settlements and offers an assessment which may be limited or unbalanced. Examples may lack detail or development. Response develops on a largely secure base of knowledge and understanding. Level 2 (4–7) Response shows general knowledge and understanding of the influence of counterurbanisation but with limited focus on the question (specifically on the structure of urban settlements). Response is mainly descriptive or explanatory with limited use of examples and understanding of the topic may be partial or inaccurate. Some concluding remarks. General responses without the use of example(s) will not get above the middle of Level 2 (6 marks). Level 1 (1–3) Response may broadly discuss counterurbanisation but does not address the question and does not come to a convincing conclusion. Response is descriptive, knowledge is basic and understanding is poor. Level 0 (0) No creditable response. Settlement dynamics
Q6 · With the aid of one or more examples, describe three characteristics of cities at a high…
6 (a) With the aid of one or more examples, describe three characteristics of cities at a high position within the hierarchy of world cities. [7] (b) With reference to your case study of one shanty town (squatter settlement) in an LIC or MIC, explain the challenges of its management. [8] (c) For the shanty town (squatter settlement) chosen in (b), assess the success of attempts to solve the challenges of its management. [15]
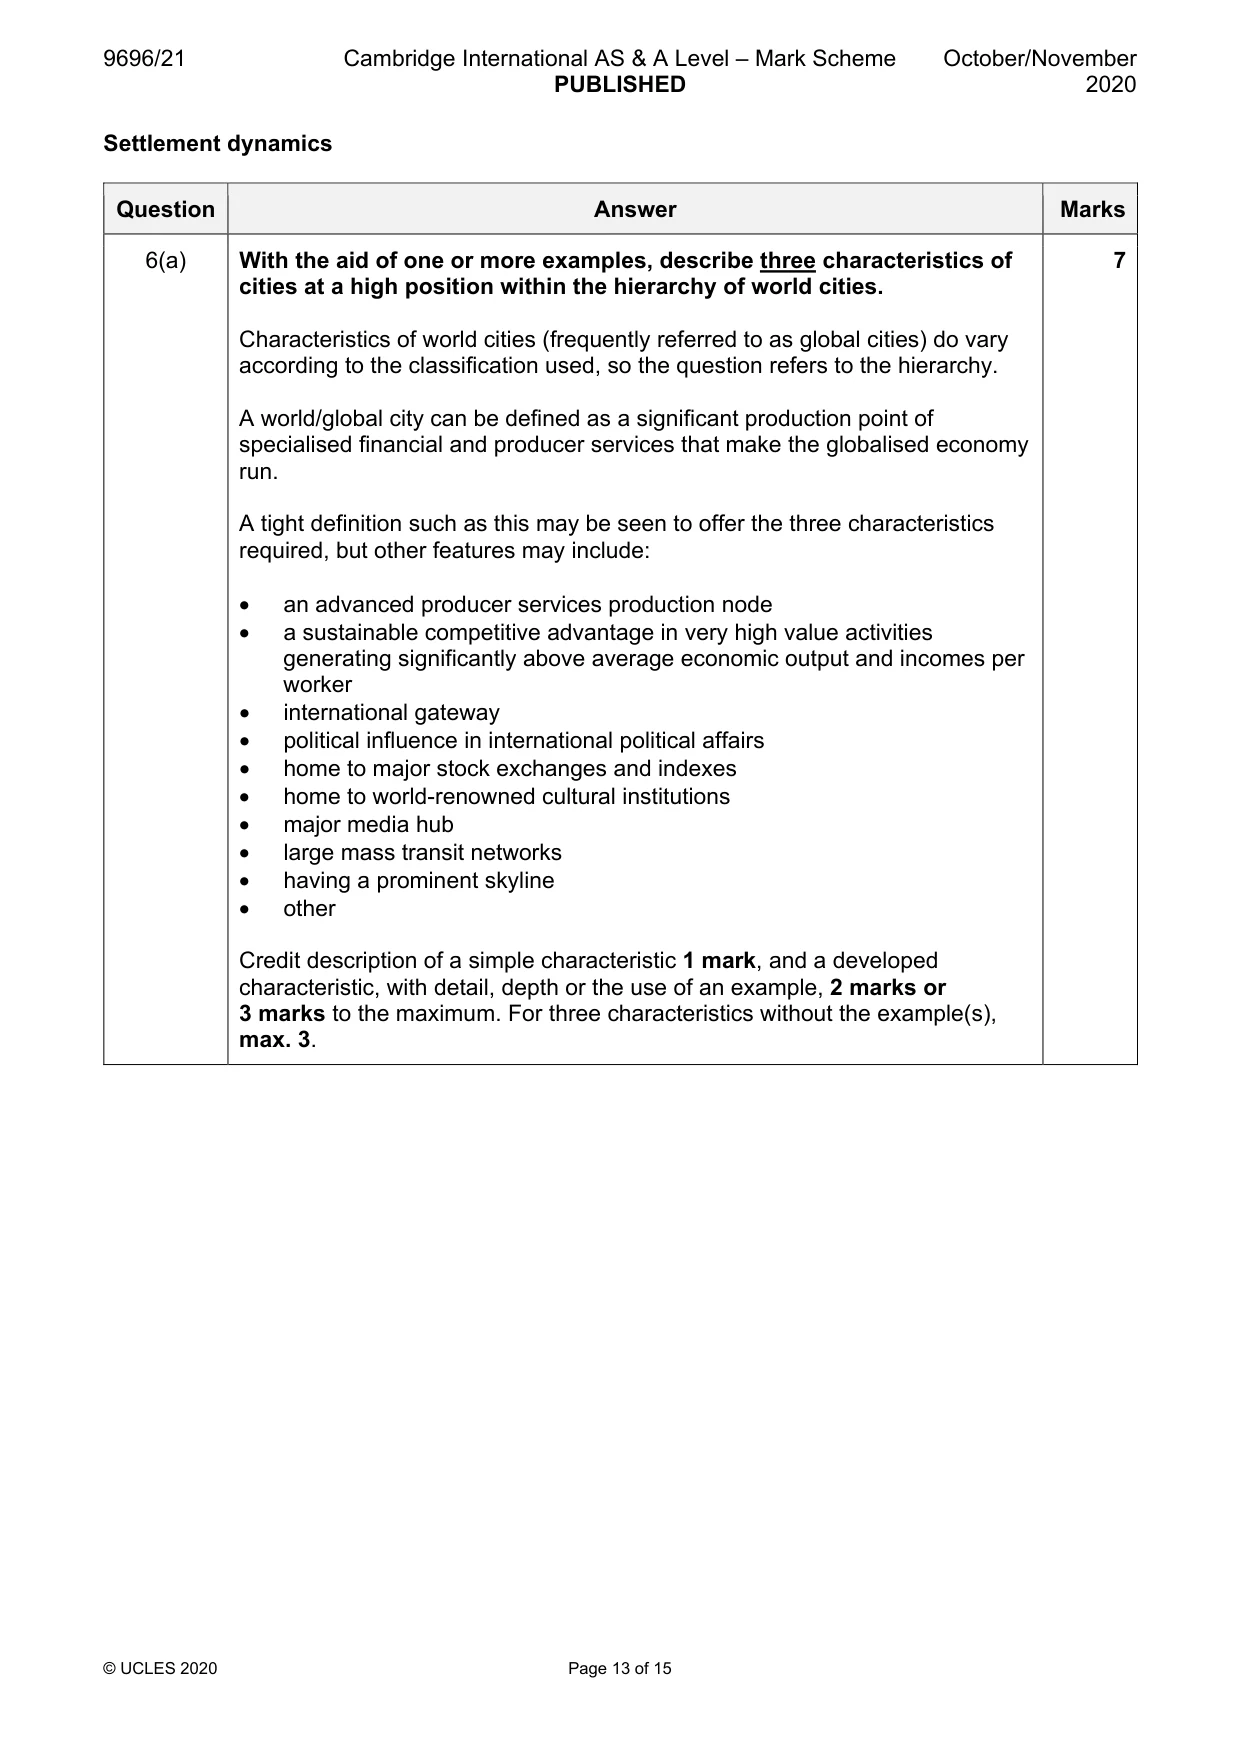
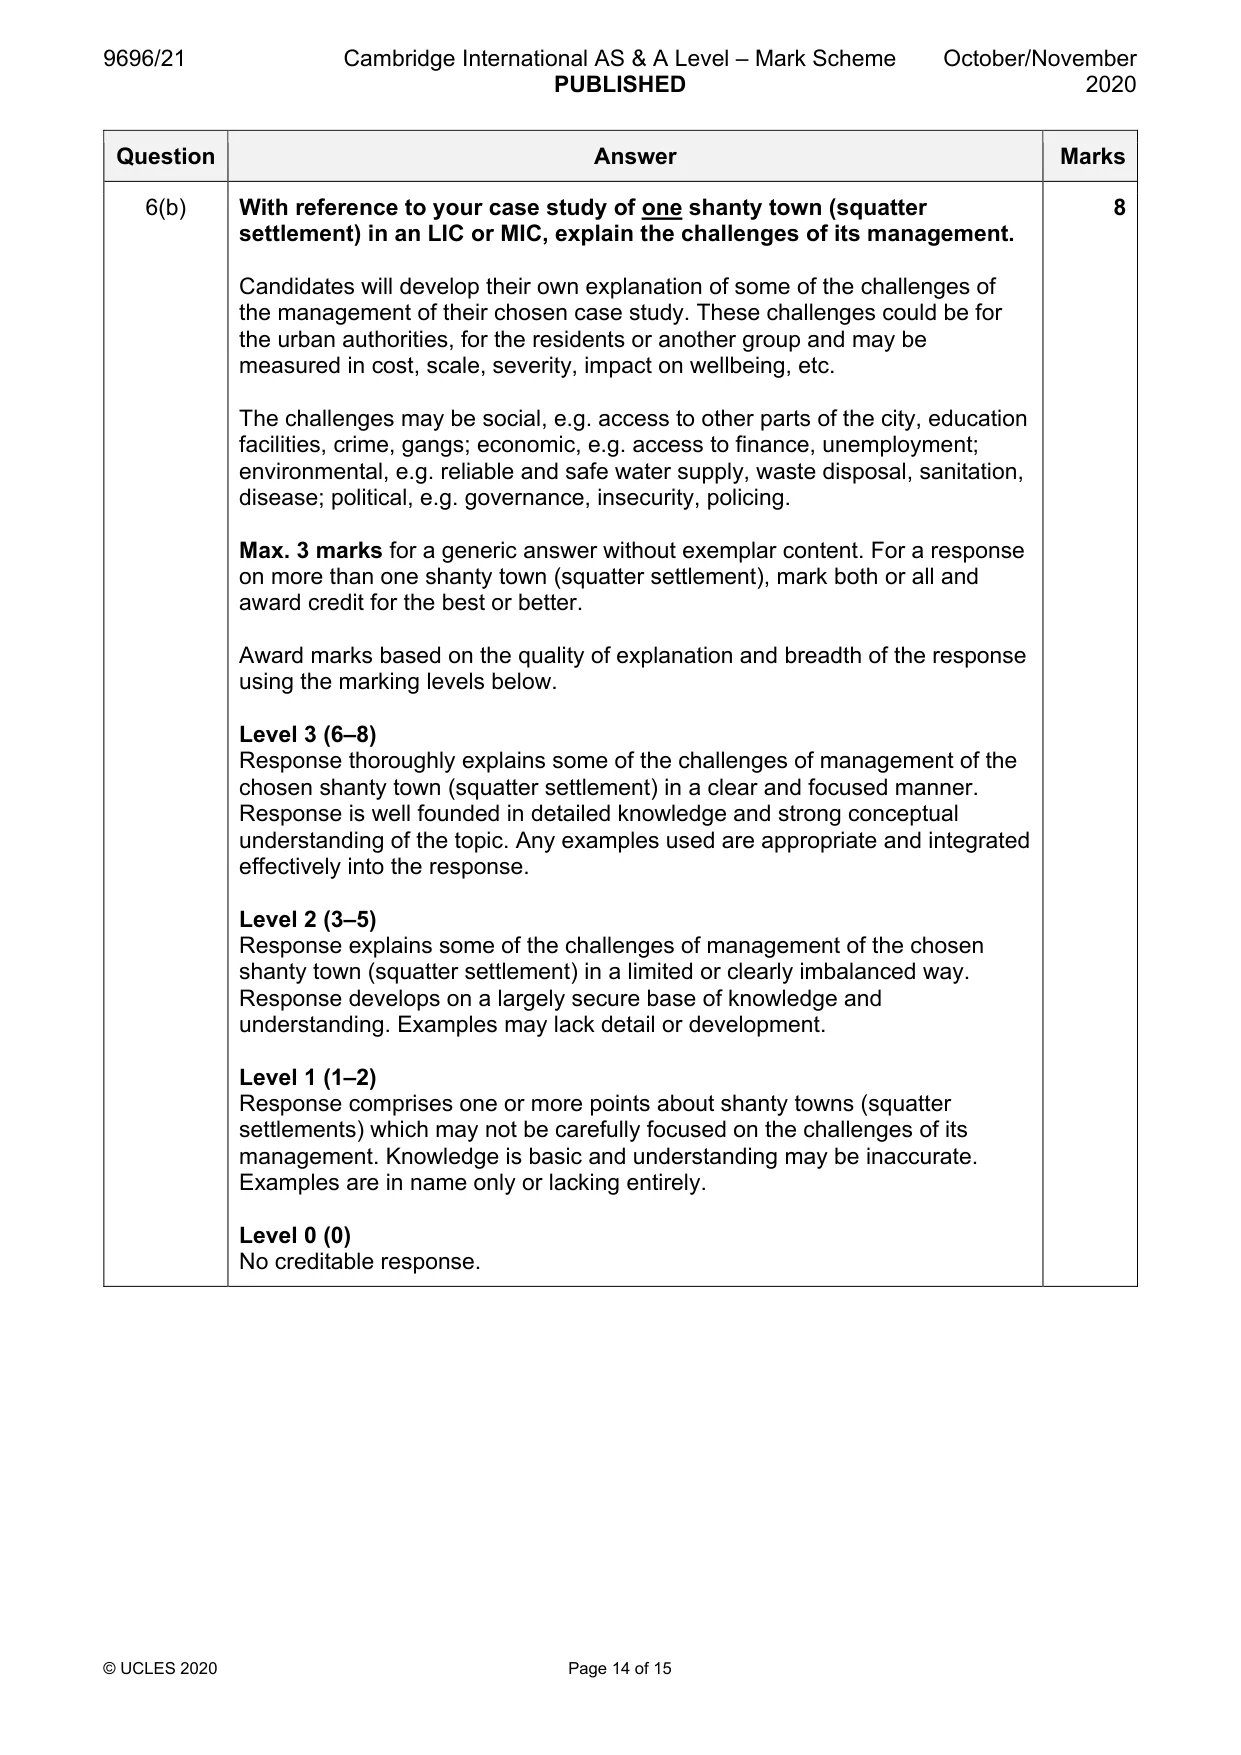
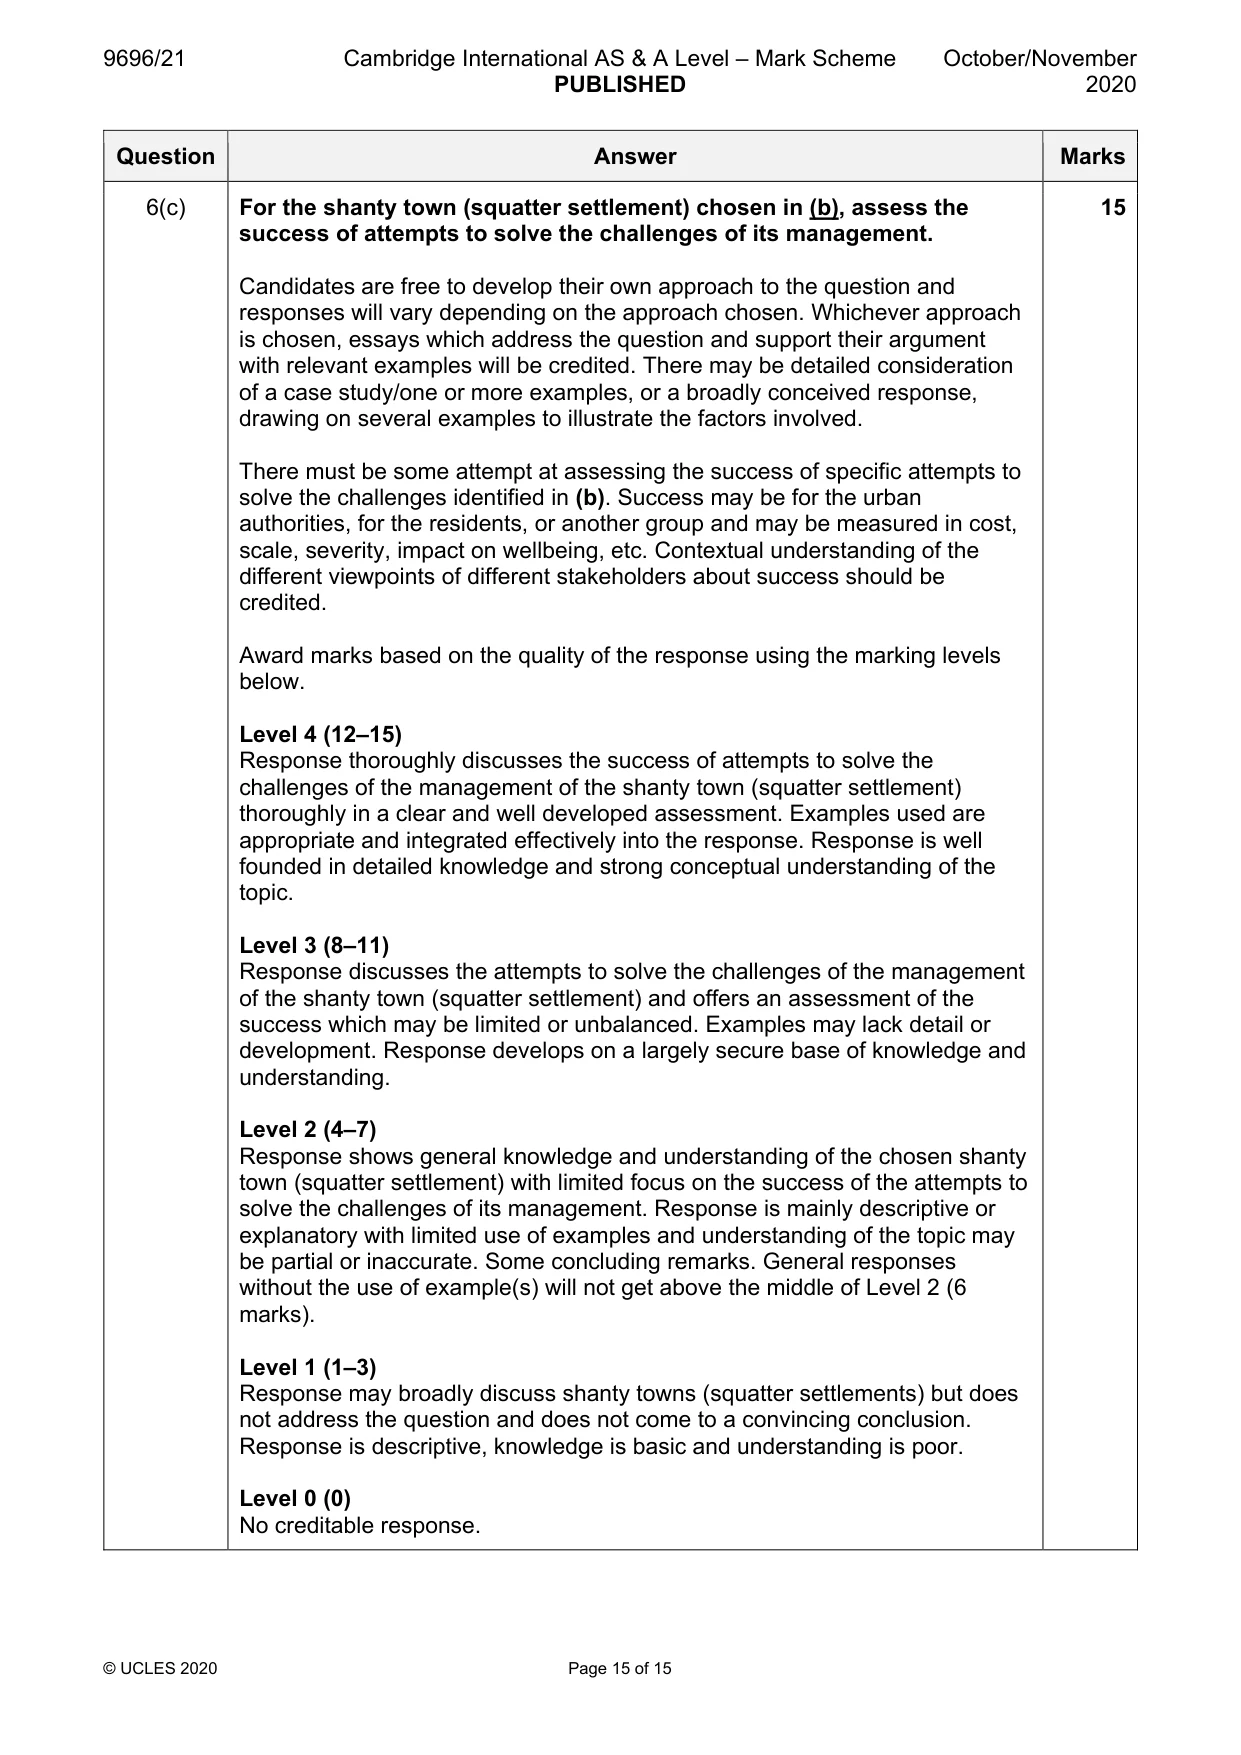
Mark scheme: 6(a) With the aid of one or more examples, describe three characteristics of 7 cities at a high position within the hierarchy of world cities. Characteristics of world cities (frequently referred to as global cities) do vary according to the classification used, so the question refers to the hierarchy. A world/global city can be defined as a significant production point of specialised financial and producer services that make the globalised economy run. A tight definition such as this may be seen to offer the three characteristics required, but other features may include: • an advanced producer services production node • a sustainable competitive advantage in very high value activities generating significantly above average economic output and incomes per worker • international gateway • political influence in international political affairs • home to major stock exchanges and indexes • home to world-renowned cultural institutions • major media hub • large mass transit networks • having a prominent skyline • other Credit description of a simple characteristic 1 mark, and a developed characteristic, with detail, depth or the use of an example, 2 marks or 3 marks to the maximum. For three characteristics without the example(s), max. 3. 6(b) With reference to your case study of one shanty town (squatter 8 settlement) in an LIC or MIC, explain the challenges of its management. Candidates will develop their own explanation of some of the challenges of the management of their chosen case study. These challenges could be for the urban authorities, for the residents or another group and may be measured in cost, scale, severity, impact on wellbeing, etc. The challenges may be social, e.g. access to other parts of the city, education facilities, crime, gangs; economic, e.g. access to finance, unemployment; environmental, e.g. reliable and safe water supply, waste disposal, sanitation, disease; political, e.g. governance, insecurity, policing. Max. 3 marks for a generic answer without exemplar content. For a response on more than one shanty town (squatter settlement), mark both or all and award credit for the best or better. Award marks based on the quality of explanation and breadth of the response using the marking levels below. Level 3 (6–8) Response thoroughly explains some of the challenges of management of the chosen shanty town (squatter settlement) in a clear and focused manner. Response is well founded in detailed knowledge and strong conceptual understanding of the topic. Any examples used are appropriate and integrated effectively into the response. Level 2 (3–5) Response explains some of the challenges of management of the chosen shanty town (squatter settlement) in a limited or clearly imbalanced way. Response develops on a largely secure base of knowledge and understanding. Examples may lack detail or development. Level 1 (1–2) Response comprises one or more points about shanty towns (squatter settlements) which may not be carefully focused on the challenges of its management. Knowledge is basic and understanding may be inaccurate. Examples are in name only or lacking entirely. Level 0 (0) No creditable response. 6(c) For the shanty town (squatter settlement) chosen in (b), assess the 15 success of attempts to solve the challenges of its management. Candidates are free to develop their own approach to the question and responses will vary depending on the approach chosen. Whichever approach is chosen, essays which address the question and support their argument with relevant examples will be credited. There may be detailed consideration of a case study/one or more examples, or a broadly conceived response, drawing on several examples to illustrate the factors involved. There must be some attempt at assessing the success of specific attempts to solve the challenges identified in (b). Success may be for the urban authorities, for the residents, or another group and may be measured in cost, scale, severity, impact on wellbeing, etc. Contextual understanding of the different viewpoints of different stakeholders about success should be credited. Award marks based on the quality of the response using the marking levels below. Level 4 (12–15) Response thoroughly discusses the success of attempts to solve the challenges of the management of the shanty town (squatter settlement) thoroughly in a clear and well developed assessment. Examples used are appropriate and integrated effectively into the response. Response is well founded in detailed knowledge and strong conceptual understanding of the topic. Level 3 (8–11) Response discusses the attempts to solve the challenges of the management of the shanty town (squatter settlement) and offers an assessment of the success which may be limited or unbalanced. Examples may lack detail or development. Response develops on a largely secure base of knowledge and understanding. Level 2 (4–7) Response shows general knowledge and understanding of the chosen shanty town (squatter settlement) with limited focus on the success of the attempts to solve the challenges of its management. Response is mainly descriptive or explanatory with limited use of examples and understanding of the topic may be partial or inaccurate. Some concluding remarks. General responses without the use of example(s) will not get above the middle of Level 2 (6 marks). Level 1 (1–3) Response may broadly discuss shanty towns (squatter settlements) but does not address the question and does not come to a convincing conclusion. Response is descriptive, knowledge is basic and understanding is poor. Level 0 (0) No creditable response.
What was in this paper
The subtopics covered by these 6 questions, and how many questions each got. Open one in a new tab to see every Cambridge question on it.
What you needed in this session
Cambridge’s own grade thresholds for 2020 Oct/Nov, Paper 2 · Variant 1. A higher threshold means an easier paper — the bar moves with how the cohort did.