Cambridge A Level Geography 9696 — 2020 Oct/Nov Paper 2 · Variant 3
9696/23/O/N/20 · 6 questions · 60 marks · ≈68 min
The question paper and its mark scheme, free to read here and free to download. This is Cambridge’s own paper, exactly as it was sat.
Question paper4 pages

Mark scheme17 pages
Answers below. Sit the paper first if you are practising.



Questions as text
Q1 · The changes in global infant mortality rate (IMR) between 1990 and 2016
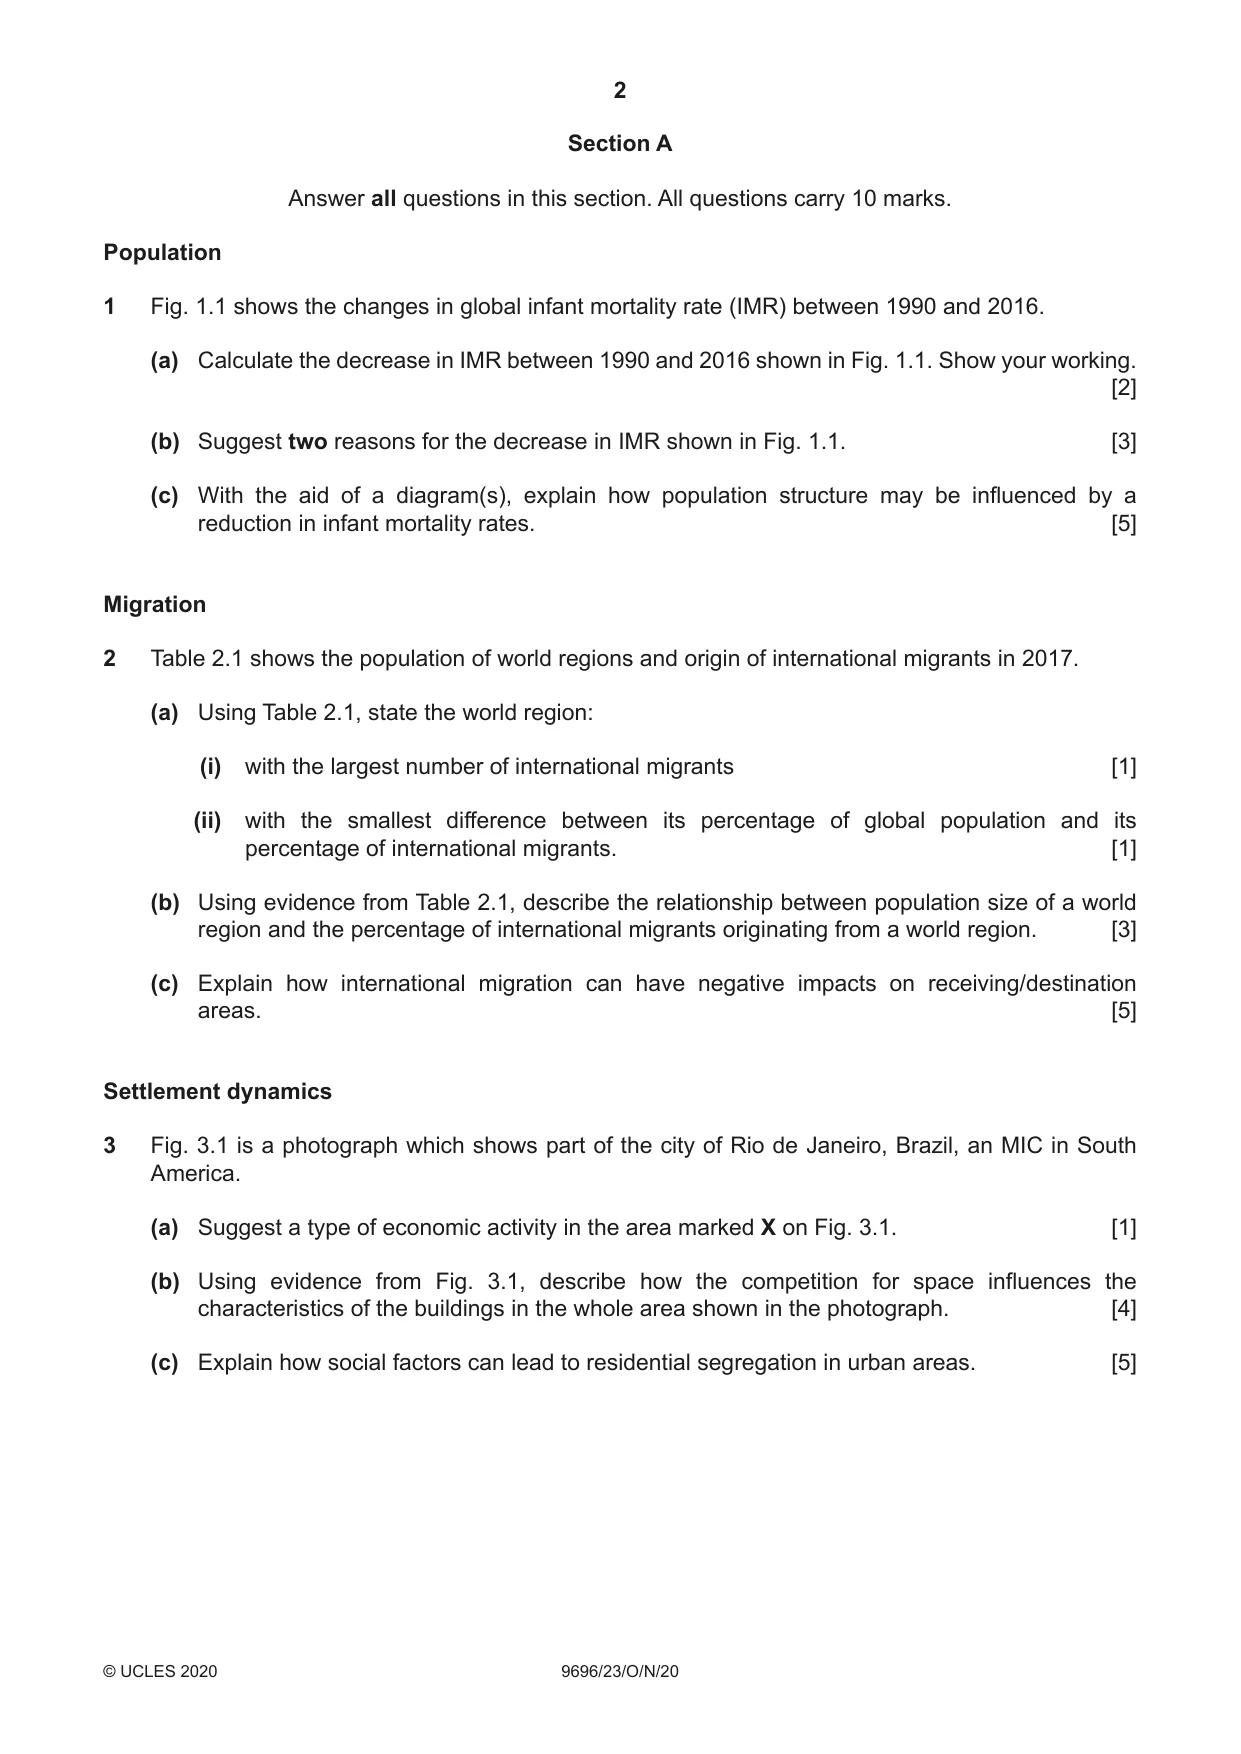
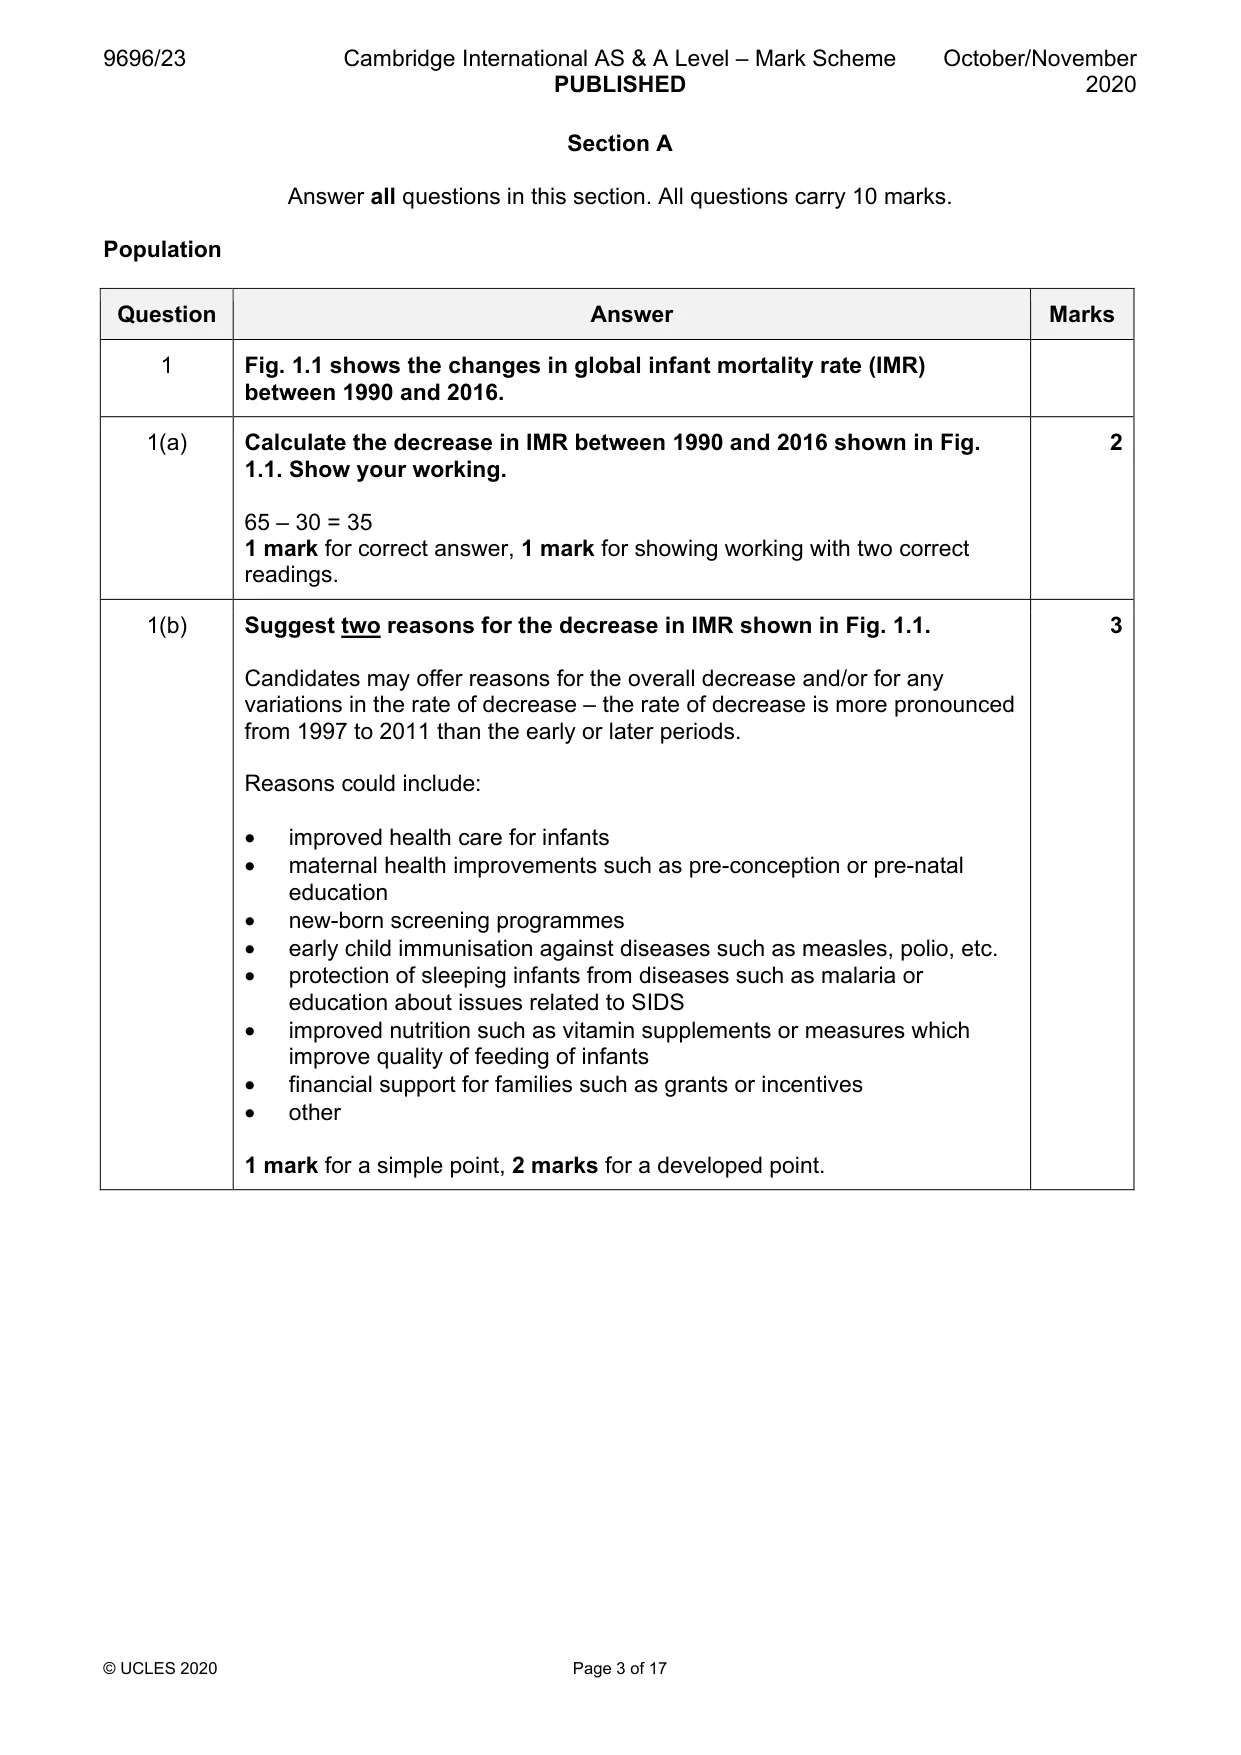
1 Fig. 1.1 shows the changes in global infant mortality rate (IMR) between 1990 and 2016. (a) Calculate the decrease in IMR between 1990 and 2016 shown in Fig. 1.1. Show your working. [2] (b) Suggest two reasons for the decrease in IMR shown in Fig. 1.1. [3] (c) With the aid of a diagram(s), explain how population structure may be influenced by a reduction in infant mortality rates. [5] Migration
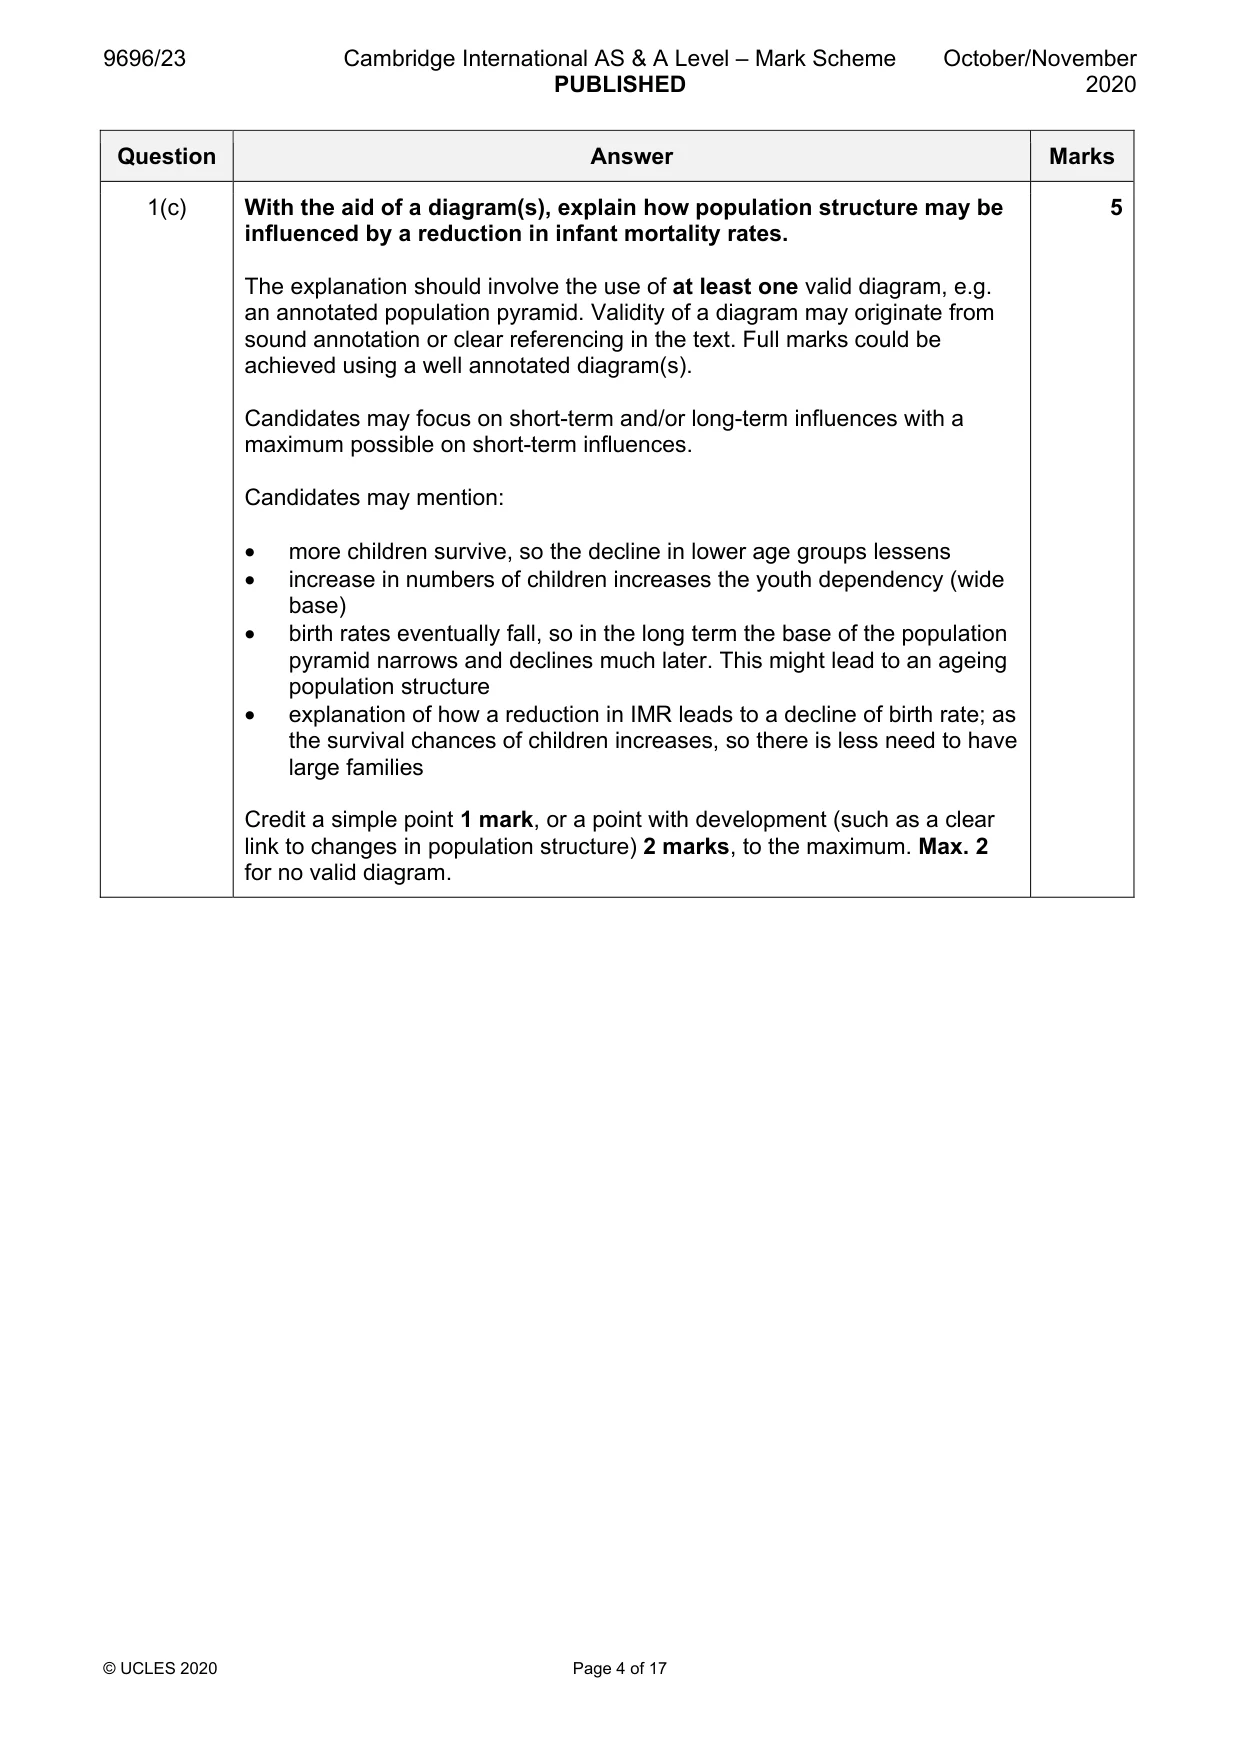
Mark scheme: Question Answer Marks 1 Fig. 1.1 shows the changes in global infant mortality rate (IMR) between 1990 and 2016. 1(a) Calculate the decrease in IMR between 1990 and 2016 shown in Fig. 2 1.1. Show your working. 65 – 30 = 35 1 mark for correct answer, 1 mark for showing working with two correct readings. 1(b) Suggest two reasons for the decrease in IMR shown in Fig. 1.1. 3 Candidates may offer reasons for the overall decrease and/or for any variations in the rate of decrease – the rate of decrease is more pronounced from 1997 to 2011 than the early or later periods. Reasons could include: • improved health care for infants • maternal health improvements such as pre-conception or pre-natal education • new-born screening programmes • early child immunisation against diseases such as measles, polio, etc. • protection of sleeping infants from diseases such as malaria or education about issues related to SIDS • improved nutrition such as vitamin supplements or measures which improve quality of feeding of infants • financial support for families such as grants or incentives • other 1 mark for a simple point, 2 marks for a developed point. 1(c) With the aid of a diagram(s), explain how population structure may be 5 influenced by a reduction in infant mortality rates. The explanation should involve the use of at least one valid diagram, e.g. an annotated population pyramid. Validity of a diagram may originate from sound annotation or clear referencing in the text. Full marks could be achieved using a well annotated diagram(s). Candidates may focus on short-term and/or long-term influences with a maximum possible on short-term influences. Candidates may mention: • more children survive, so the decline in lower age groups lessens • increase in numbers of children increases the youth dependency (wide base) • birth rates eventually fall, so in the long term the base of the population pyramid narrows and declines much later. This might lead to an ageing population structure • explanation of how a reduction in IMR leads to a decline of birth rate; as the survival chances of children increases, so there is less need to have large families Credit a simple point 1 mark, or a point with development (such as a clear link to changes in population structure) 2 marks, to the maximum. Max. 2 for no valid diagram. Migration
Q2 · The population of world regions and origin of international migrants in 2017
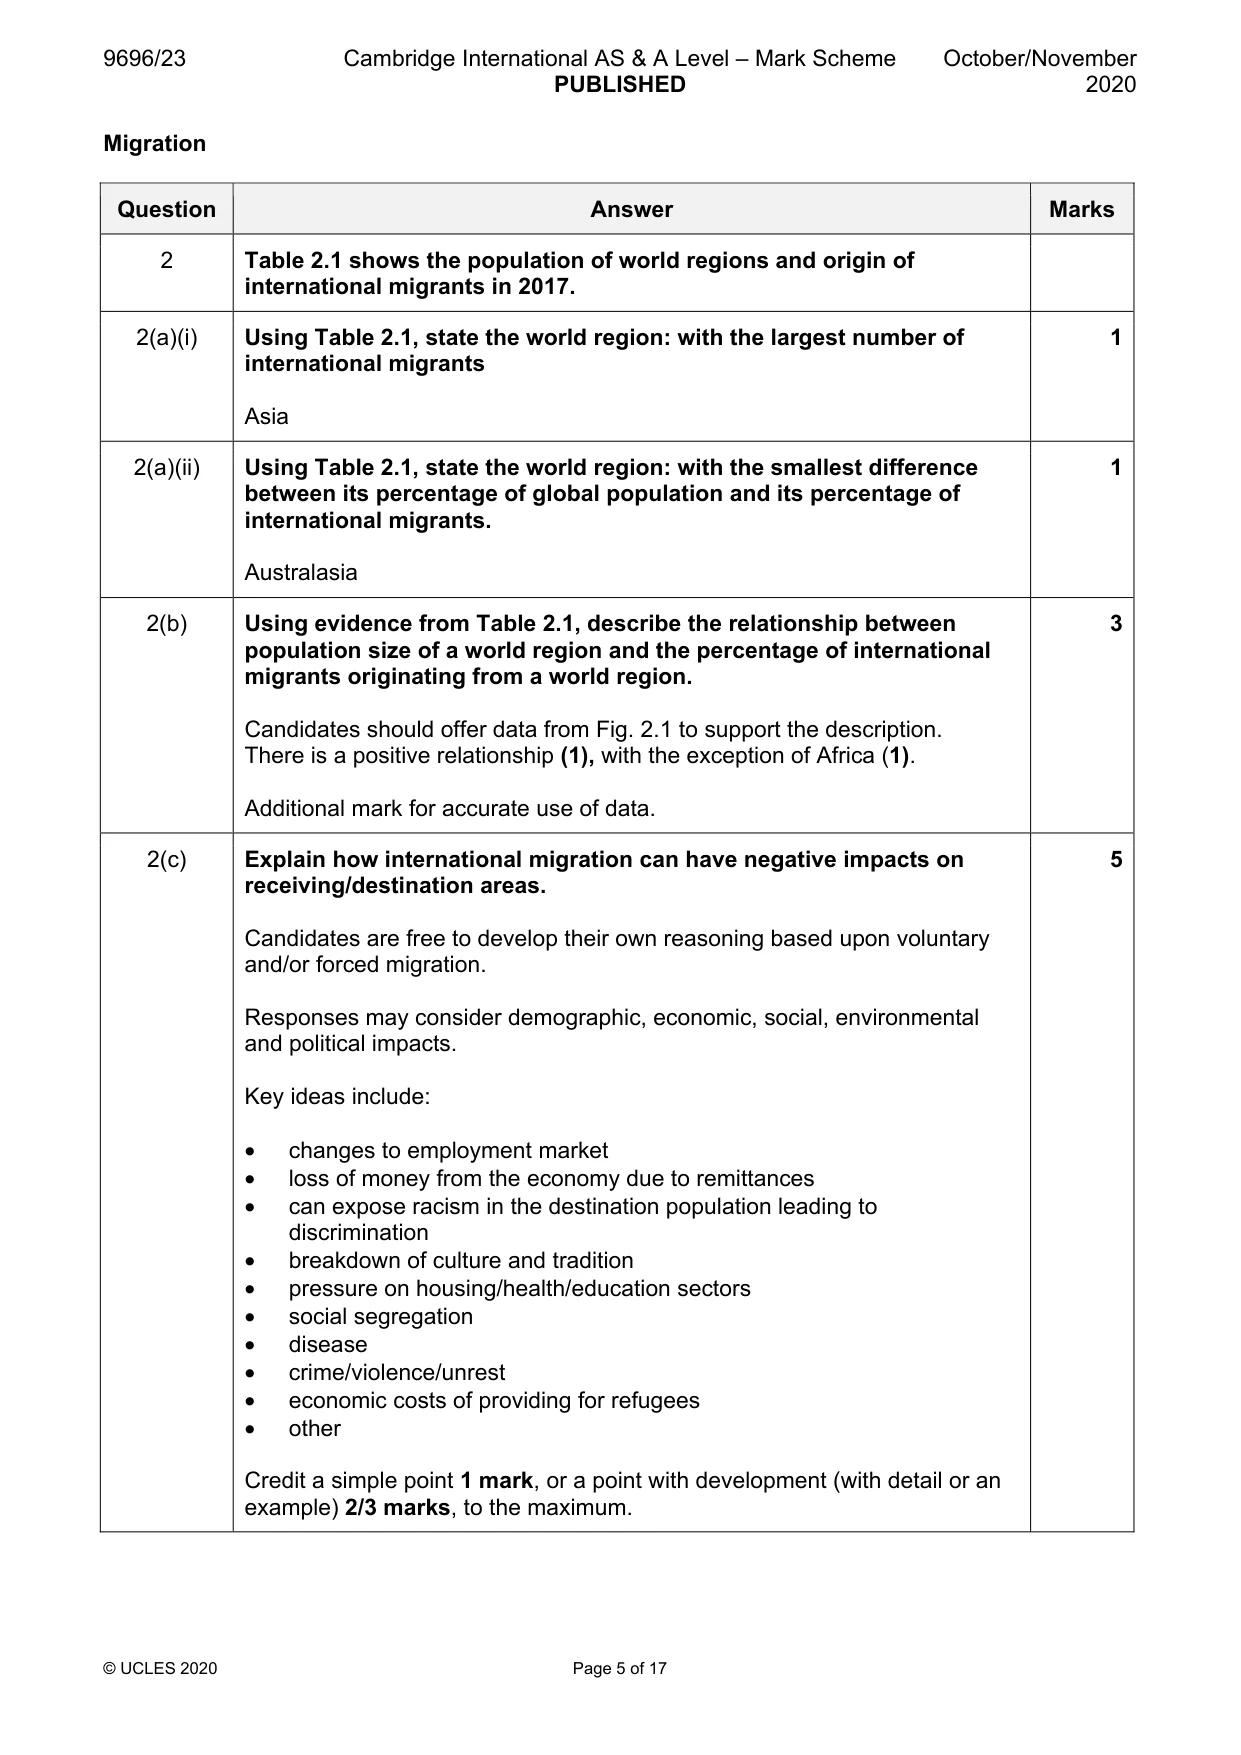
2 Table 2.1 shows the population of world regions and origin of international migrants in 2017. (a) Using Table 2.1, state the world region: (i) with the largest number of international migrants [1] (ii) with the smallest difference between its percentage of global population and its percentage of international migrants. [1] (b) Using evidence from Table 2.1, describe the relationship between population size of a world region and the percentage of international migrants originating from a world region. [3] (c) Explain how international migration can have negative impacts on receiving/destination areas. [5] Settlement dynamics
Mark scheme: 2 Table 2.1 shows the population of world regions and origin of international migrants in 2017. 2(a)(i) Using Table 2.1, state the world region: with the largest number of 1 international migrants Asia 2(a)(ii) Using Table 2.1, state the world region: with the smallest difference 1 between its percentage of global population and its percentage of international migrants. Australasia 2(b) Using evidence from Table 2.1, describe the relationship between 3 population size of a world region and the percentage of international migrants originating from a world region. Candidates should offer data from Fig. 2.1 to support the description. There is a positive relationship (1), with the exception of Africa (1). Additional mark for accurate use of data. 2(c) Explain how international migration can have negative impacts on 5 receiving/destination areas. Candidates are free to develop their own reasoning based upon voluntary and/or forced migration. Responses may consider demographic, economic, social, environmental and political impacts. Key ideas include: • changes to employment market • loss of money from the economy due to remittances • can expose racism in the destination population leading to discrimination • breakdown of culture and tradition • pressure on housing/health/education sectors • social segregation • disease • crime/violence/unrest • economic costs of providing for refugees • other Credit a simple point 1 mark, or a point with development (with detail or an example) 2/3 marks, to the maximum. Settlement dynamics
Q3 · A photograph which shows part of the city of Rio de Janeiro, Brazil, an MIC in South…
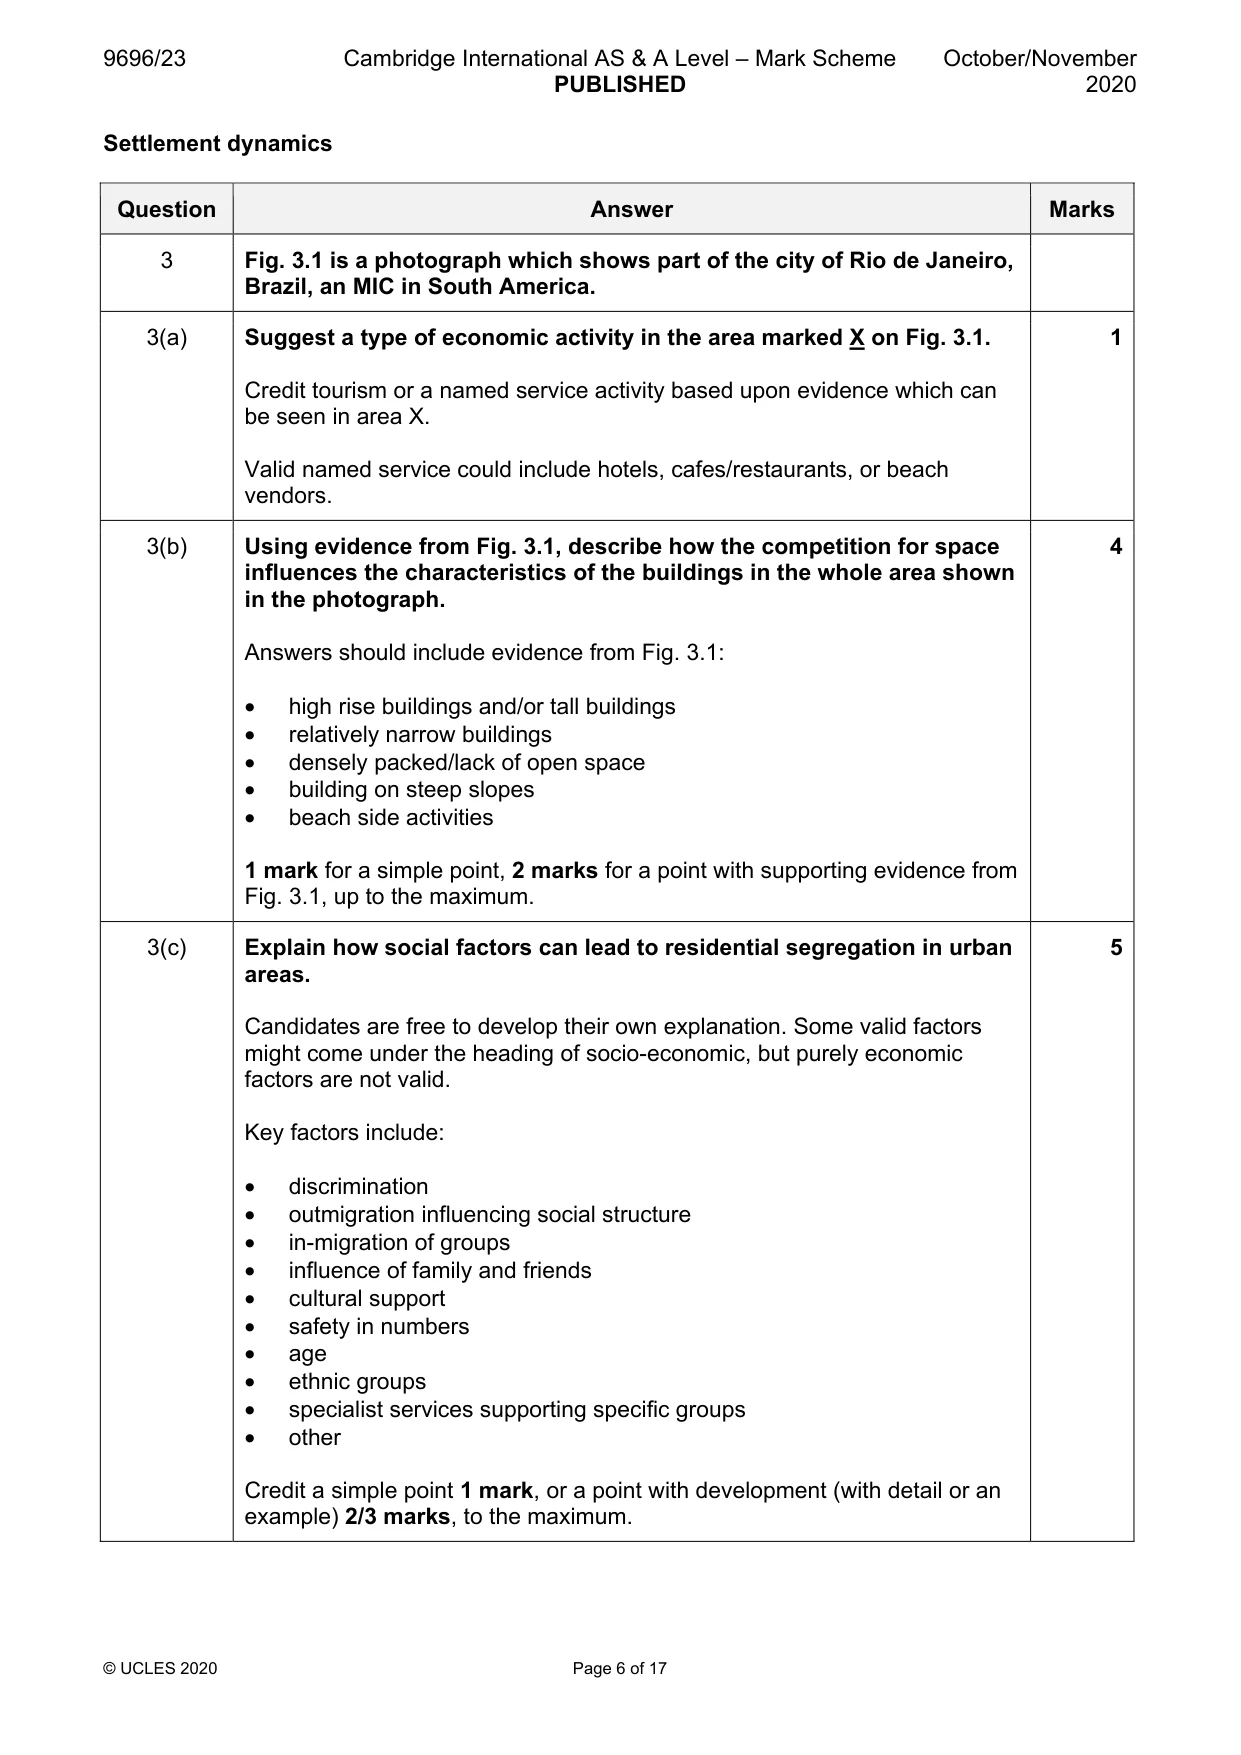
3 Fig. 3.1 is a photograph which shows part of the city of Rio de Janeiro, Brazil, an MIC in South America. (a) Suggest a type of economic activity in the area marked X on Fig. 3.1. [1] (b) Using evidence from Fig. 3.1, describe how the competition for space influences the characteristics of the buildings in the whole area shown in the photograph. [4] (c) Explain how social factors can lead to residential segregation in urban areas. [5]
Mark scheme: 3 Fig. 3.1 is a photograph which shows part of the city of Rio de Janeiro, Brazil, an MIC in South America. 3(a) Suggest a type of economic activity in the area marked X on Fig. 3.1. 1 Credit tourism or a named service activity based upon evidence which can be seen in area X. Valid named service could include hotels, cafes/restaurants, or beach vendors. 3(b) Using evidence from Fig. 3.1, describe how the competition for space 4 influences the characteristics of the buildings in the whole area shown in the photograph. Answers should include evidence from Fig. 3.1: • high rise buildings and/or tall buildings • relatively narrow buildings • densely packed/lack of open space • building on steep slopes • beach side activities 1 mark for a simple point, 2 marks for a point with supporting evidence from Fig. 3.1, up to the maximum. 3(c) Explain how social factors can lead to residential segregation in urban 5 areas. Candidates are free to develop their own explanation. Some valid factors might come under the heading of socio-economic, but purely economic factors are not valid. Key factors include: • discrimination • outmigration influencing social structure • in-migration of groups • influence of family and friends • cultural support • safety in numbers • age • ethnic groups • specialist services supporting specific groups • other Credit a simple point 1 mark, or a point with development (with detail or an example) 2/3 marks, to the maximum. Section B Answer one question from this section. All questions carry 30 marks. Population
Q4 · Describe how the death rate changes over time in the demographic transition model (DTM)
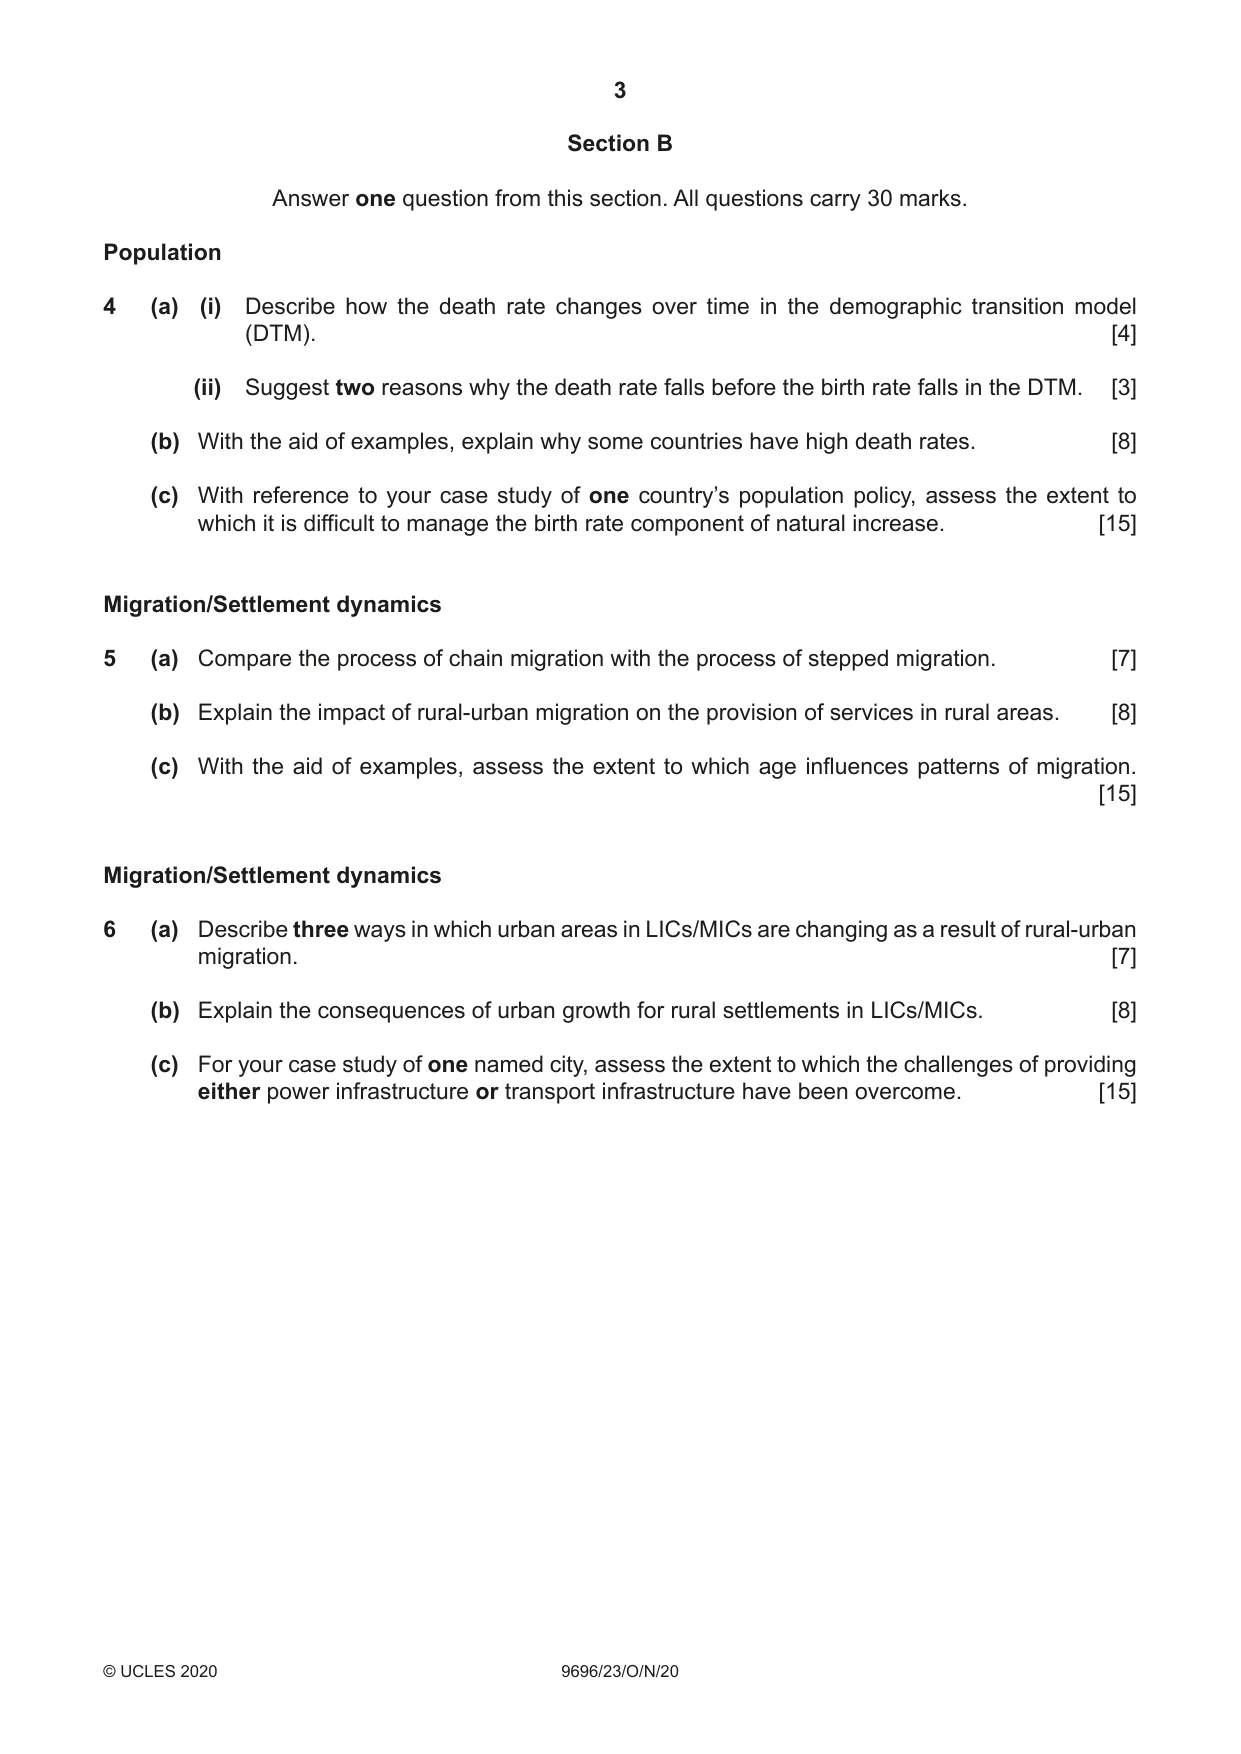
4 (a) (i) Describe how the death rate changes over time in the demographic transition model (DTM). [4] (ii) Suggest two reasons why the death rate falls before the birth rate falls in the DTM. [3] (b) With the aid of examples, explain why some countries have high death rates. [8] (c) With reference to your case study of one country’s population policy, assess the extent to which it is difficult to manage the birth rate component of natural increase. [15] Migration/Settlement dynamics
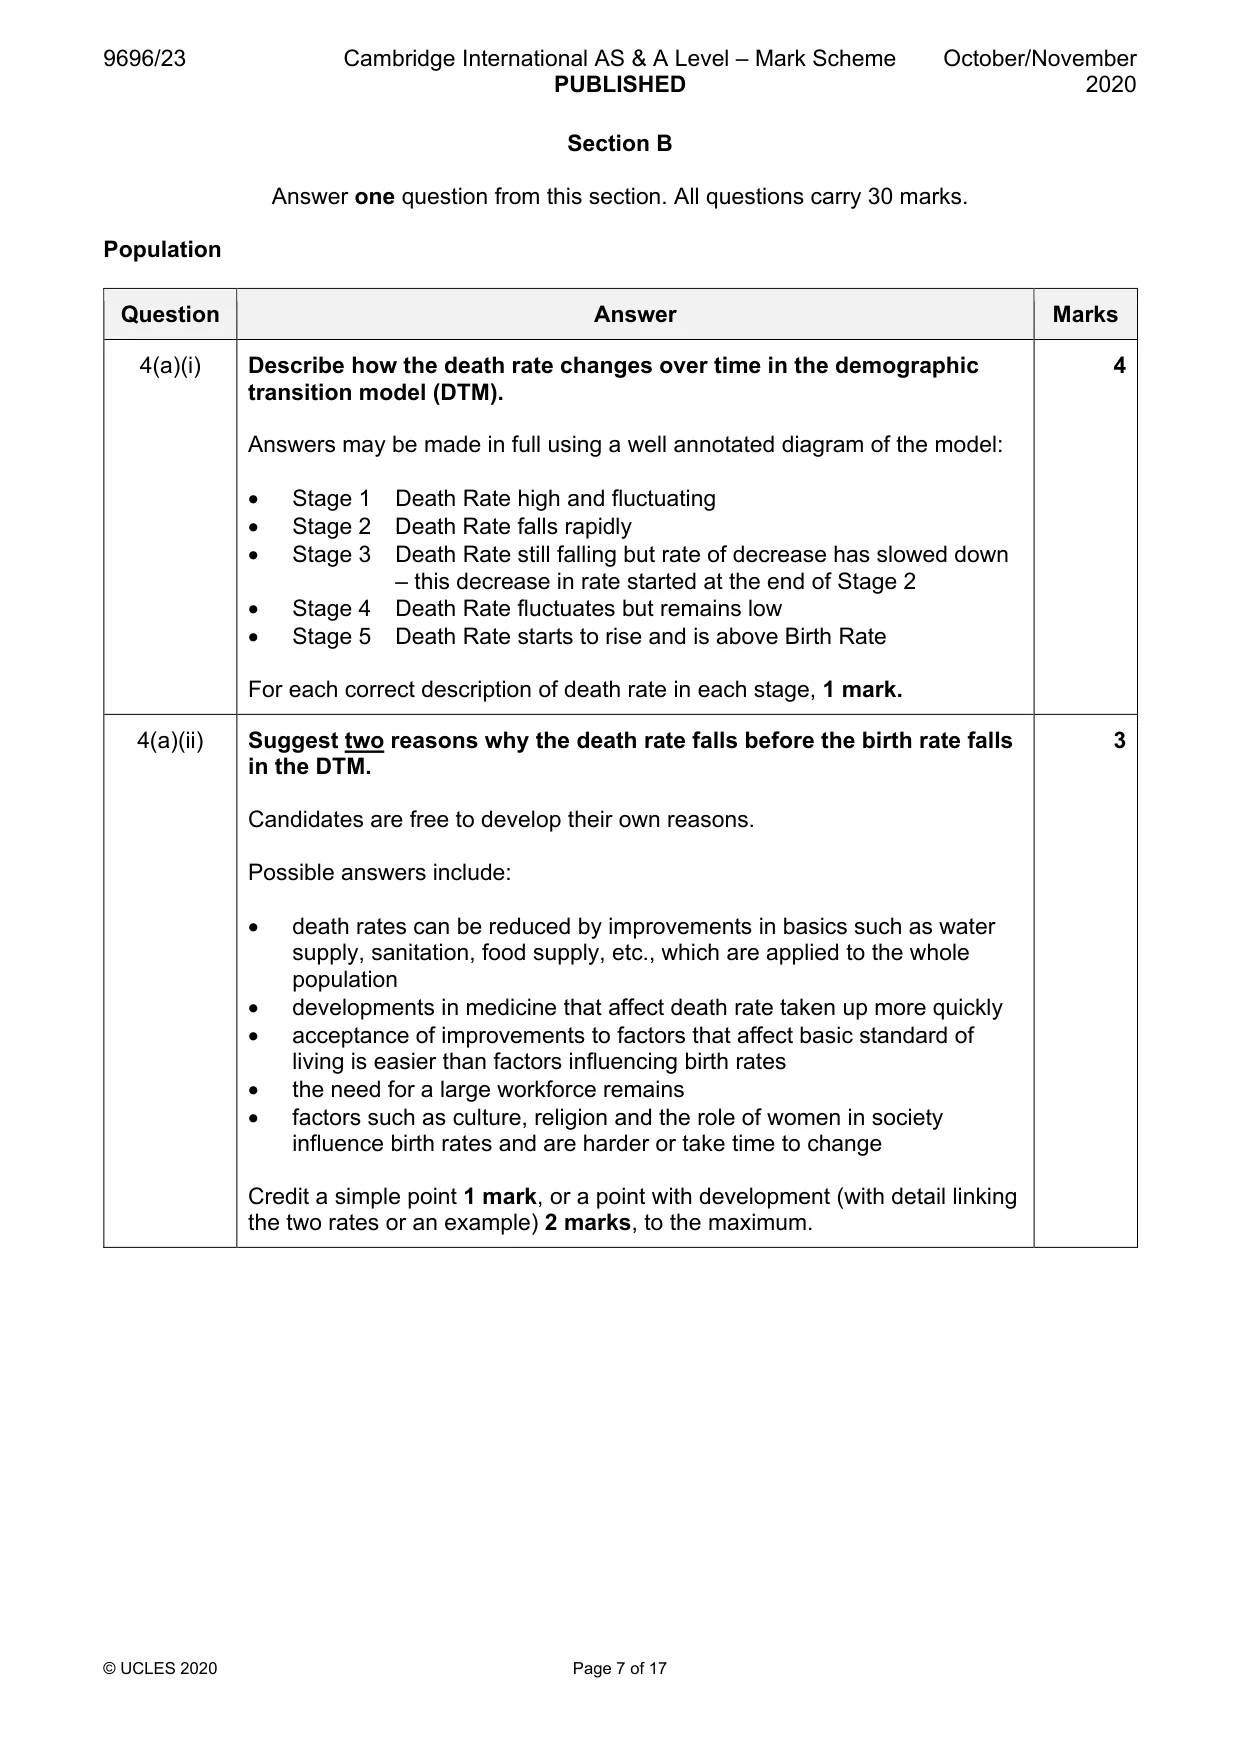
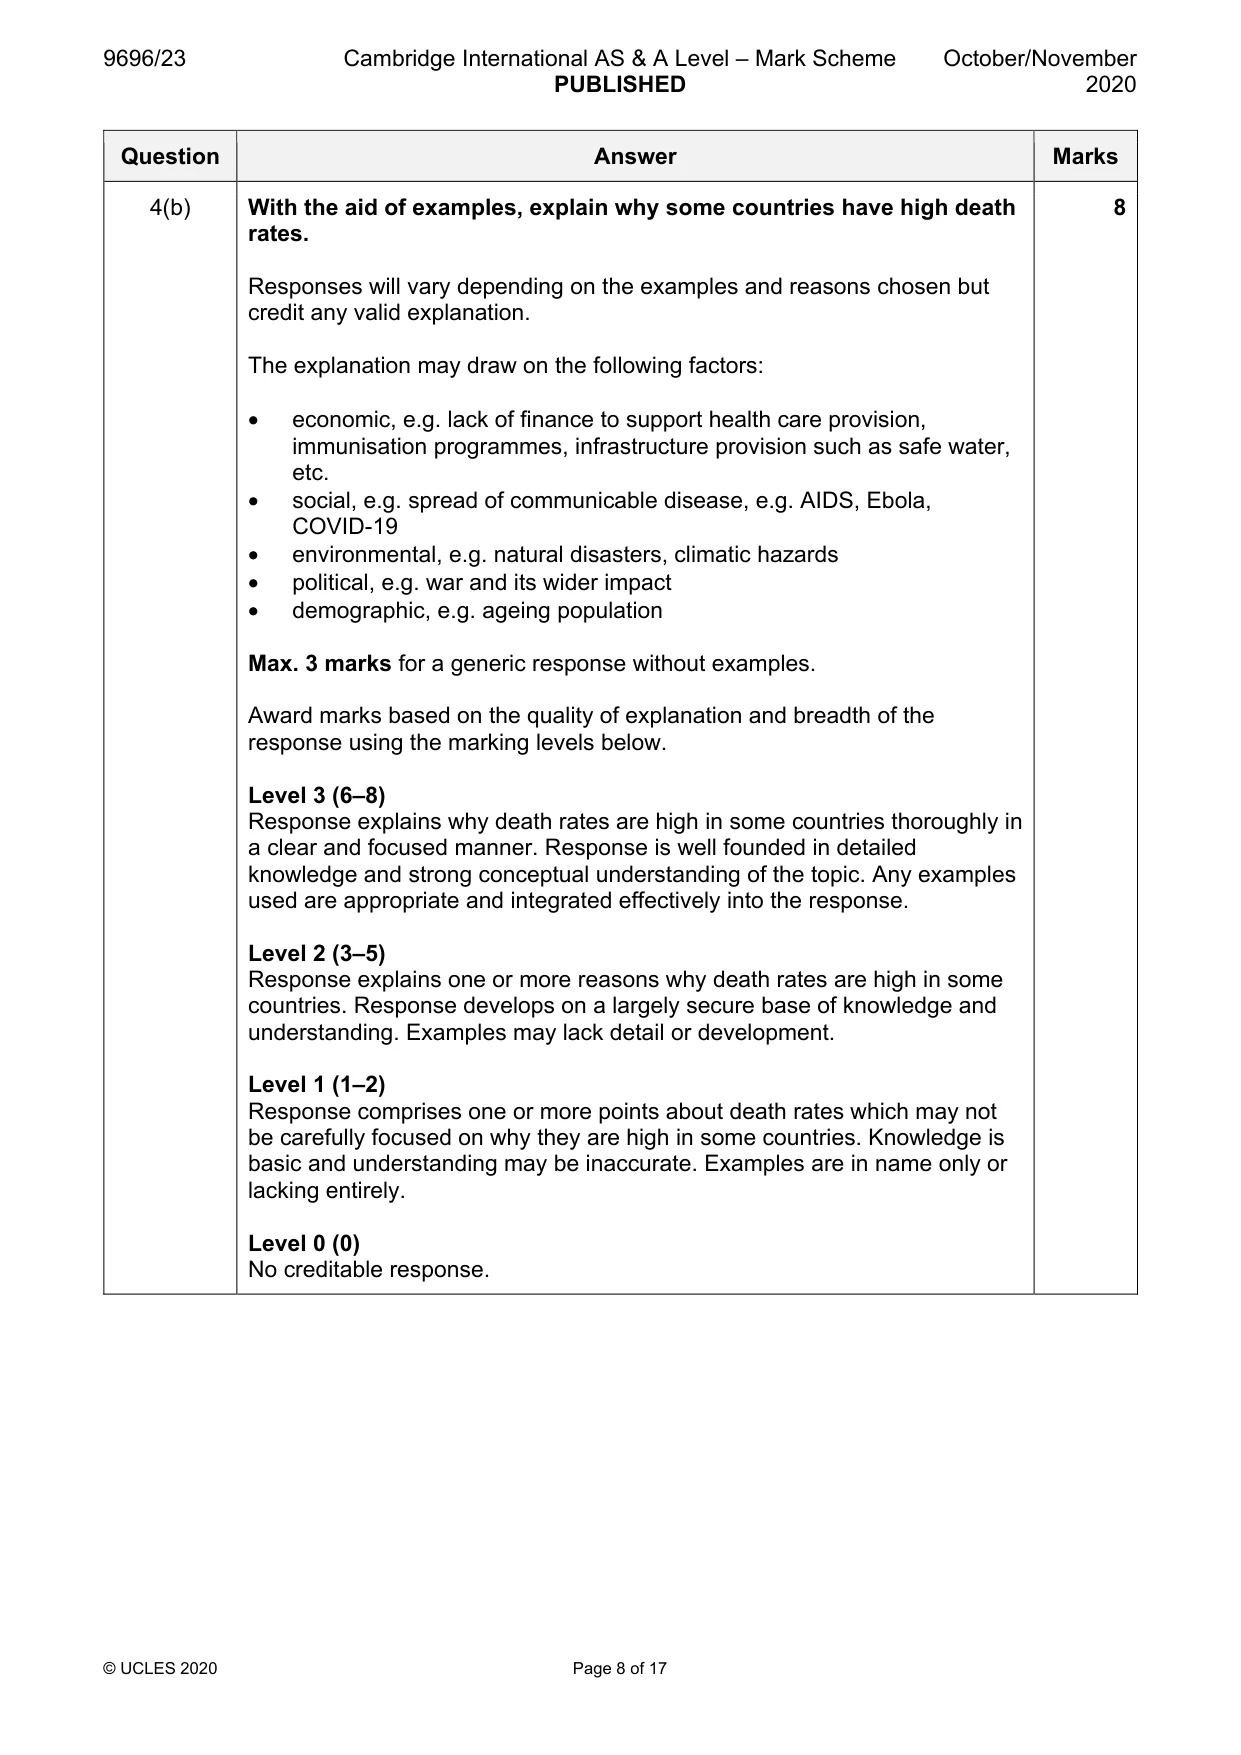
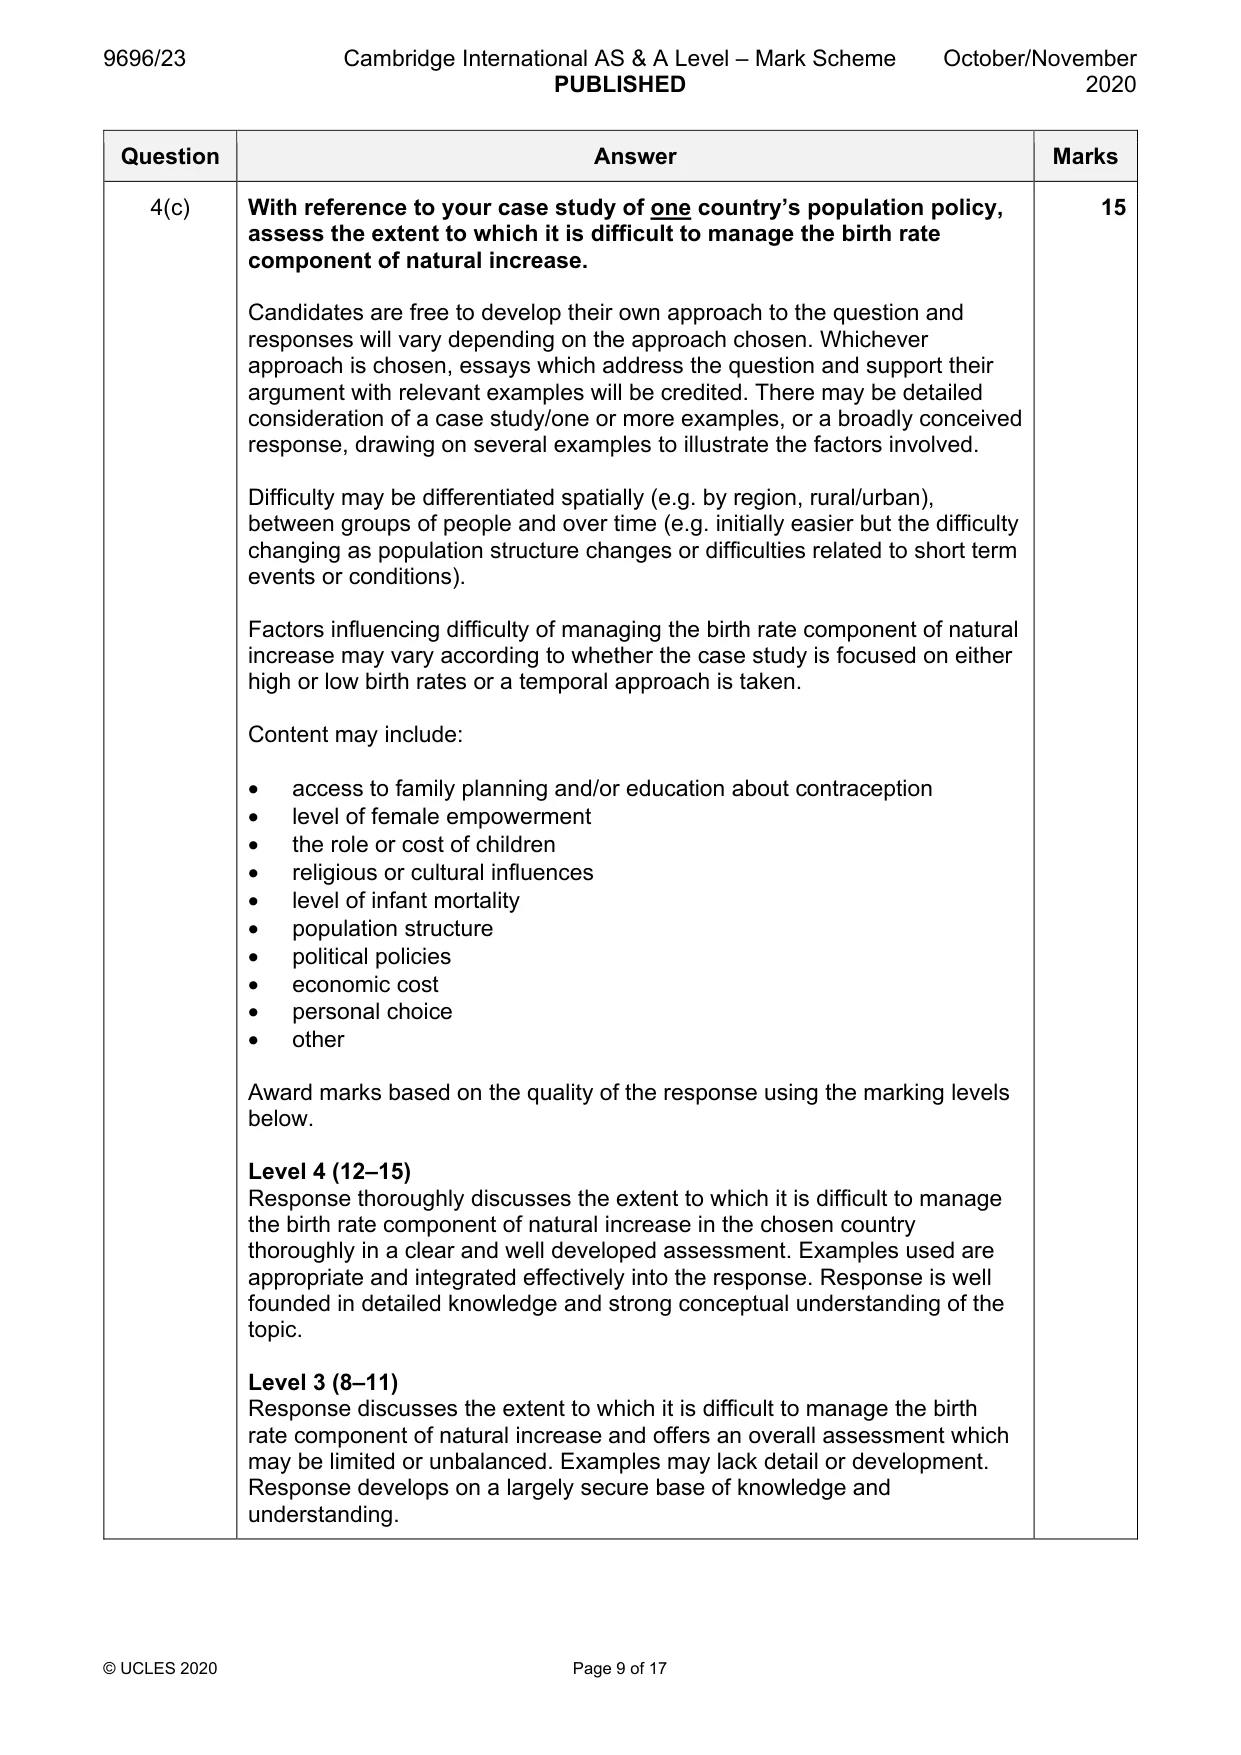
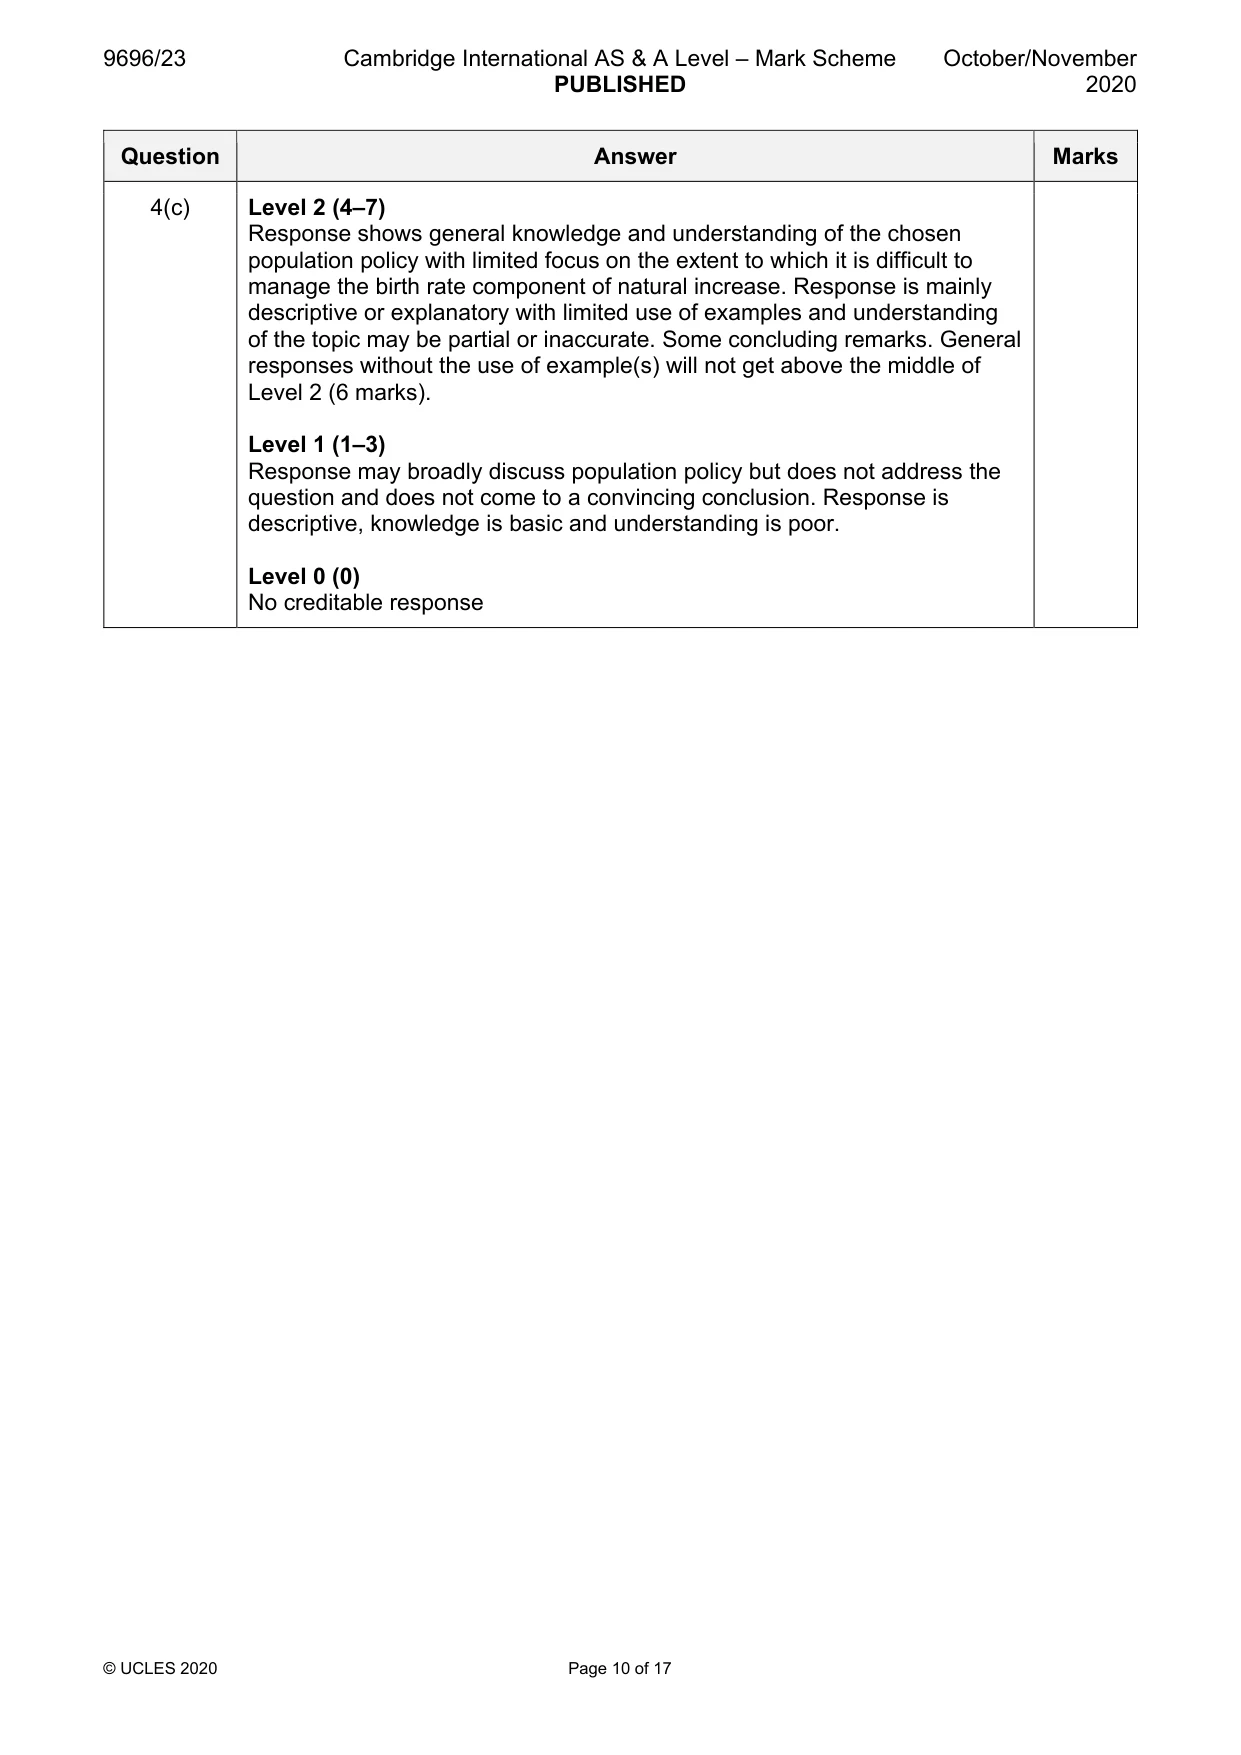
Mark scheme: 4(a)(i) Describe how the death rate changes over time in the demographic 4 transition model (DTM). Answers may be made in full using a well annotated diagram of the model: • Stage 1 Death Rate high and fluctuating • Stage 2 Death Rate falls rapidly • Stage 3 Death Rate still falling but rate of decrease has slowed down – this decrease in rate started at the end of Stage 2 • Stage 4 Death Rate fluctuates but remains low • Stage 5 Death Rate starts to rise and is above Birth Rate For each correct description of death rate in each stage, 1 mark. 4(a)(ii) Suggest two reasons why the death rate falls before the birth rate falls 3 in the DTM. Candidates are free to develop their own reasons. Possible answers include: • death rates can be reduced by improvements in basics such as water supply, sanitation, food supply, etc., which are applied to the whole population • developments in medicine that affect death rate taken up more quickly • acceptance of improvements to factors that affect basic standard of living is easier than factors influencing birth rates • the need for a large workforce remains • factors such as culture, religion and the role of women in society influence birth rates and are harder or take time to change Credit a simple point 1 mark, or a point with development (with detail linking the two rates or an example) 2 marks, to the maximum. 4(b) With the aid of examples, explain why some countries have high death 8 rates. Responses will vary depending on the examples and reasons chosen but credit any valid explanation. The explanation may draw on the following factors: • economic, e.g. lack of finance to support health care provision, immunisation programmes, infrastructure provision such as safe water, etc. • social, e.g. spread of communicable disease, e.g. AIDS, Ebola, COVID-19 • environmental, e.g. natural disasters, climatic hazards • political, e.g. war and its wider impact • demographic, e.g. ageing population Max. 3 marks for a generic response without examples. Award marks based on the quality of explanation and breadth of the response using the marking levels below. Level 3 (6–8) Response explains why death rates are high in some countries thoroughly in a clear and focused manner. Response is well founded in detailed knowledge and strong conceptual understanding of the topic. Any examples used are appropriate and integrated effectively into the response. Level 2 (3–5) Response explains one or more reasons why death rates are high in some countries. Response develops on a largely secure base of knowledge and understanding. Examples may lack detail or development. Level 1 (1–2) Response comprises one or more points about death rates which may not be carefully focused on why they are high in some countries. Knowledge is basic and understanding may be inaccurate. Examples are in name only or lacking entirely. Level 0 (0) No creditable response. 4(c) With reference to your case study of one country’s population policy, 15 assess the extent to which it is difficult to manage the birth rate component of natural increase. Candidates are free to develop their own approach to the question and responses will vary depending on the approach chosen. Whichever approach is chosen, essays which address the question and support their argument with relevant examples will be credited. There may be detailed consideration of a case study/one or more examples, or a broadly conceived response, drawing on several examples to illustrate the factors involved. Difficulty may be differentiated spatially (e.g. by region, rural/urban), between groups of people and over time (e.g. initially easier but the difficulty changing as population structure changes or difficulties related to short term events or conditions). Factors influencing difficulty of managing the birth rate component of natural increase may vary according to whether the case study is focused on either high or low birth rates or a temporal approach is taken. Content may include: • access to family planning and/or education about contraception • level of female empowerment • the role or cost of children • religious or cultural influences • level of infant mortality • population structure • political policies • economic cost • personal choice • other Award marks based on the quality of the response using the marking levels below. Level 4 (12–15) Response thoroughly discusses the extent to which it is difficult to manage the birth rate component of natural increase in the chosen country thoroughly in a clear and well developed assessment. Examples used are appropriate and integrated effectively into the response. Response is well founded in detailed knowledge and strong conceptual understanding of the topic. Level 3 (8–11) Response discusses the extent to which it is difficult to manage the birth rate component of natural increase and offers an overall assessment which may be limited or unbalanced. Examples may lack detail or development. Response develops on a largely secure base of knowledge and understanding. 4(c) Level 2 (4–7) Response shows general knowledge and understanding of the chosen population policy with limited focus on the extent to which it is difficult to manage the birth rate component of natural increase. Response is mainly descriptive or explanatory with limited use of examples and understanding of the topic may be partial or inaccurate. Some concluding remarks. General responses without the use of example(s) will not get above the middle of Level 2 (6 marks). Level 1 (1–3) Response may broadly discuss population policy but does not address the question and does not come to a convincing conclusion. Response is descriptive, knowledge is basic and understanding is poor. Level 0 (0) No creditable response Migration/Settlement dynamics
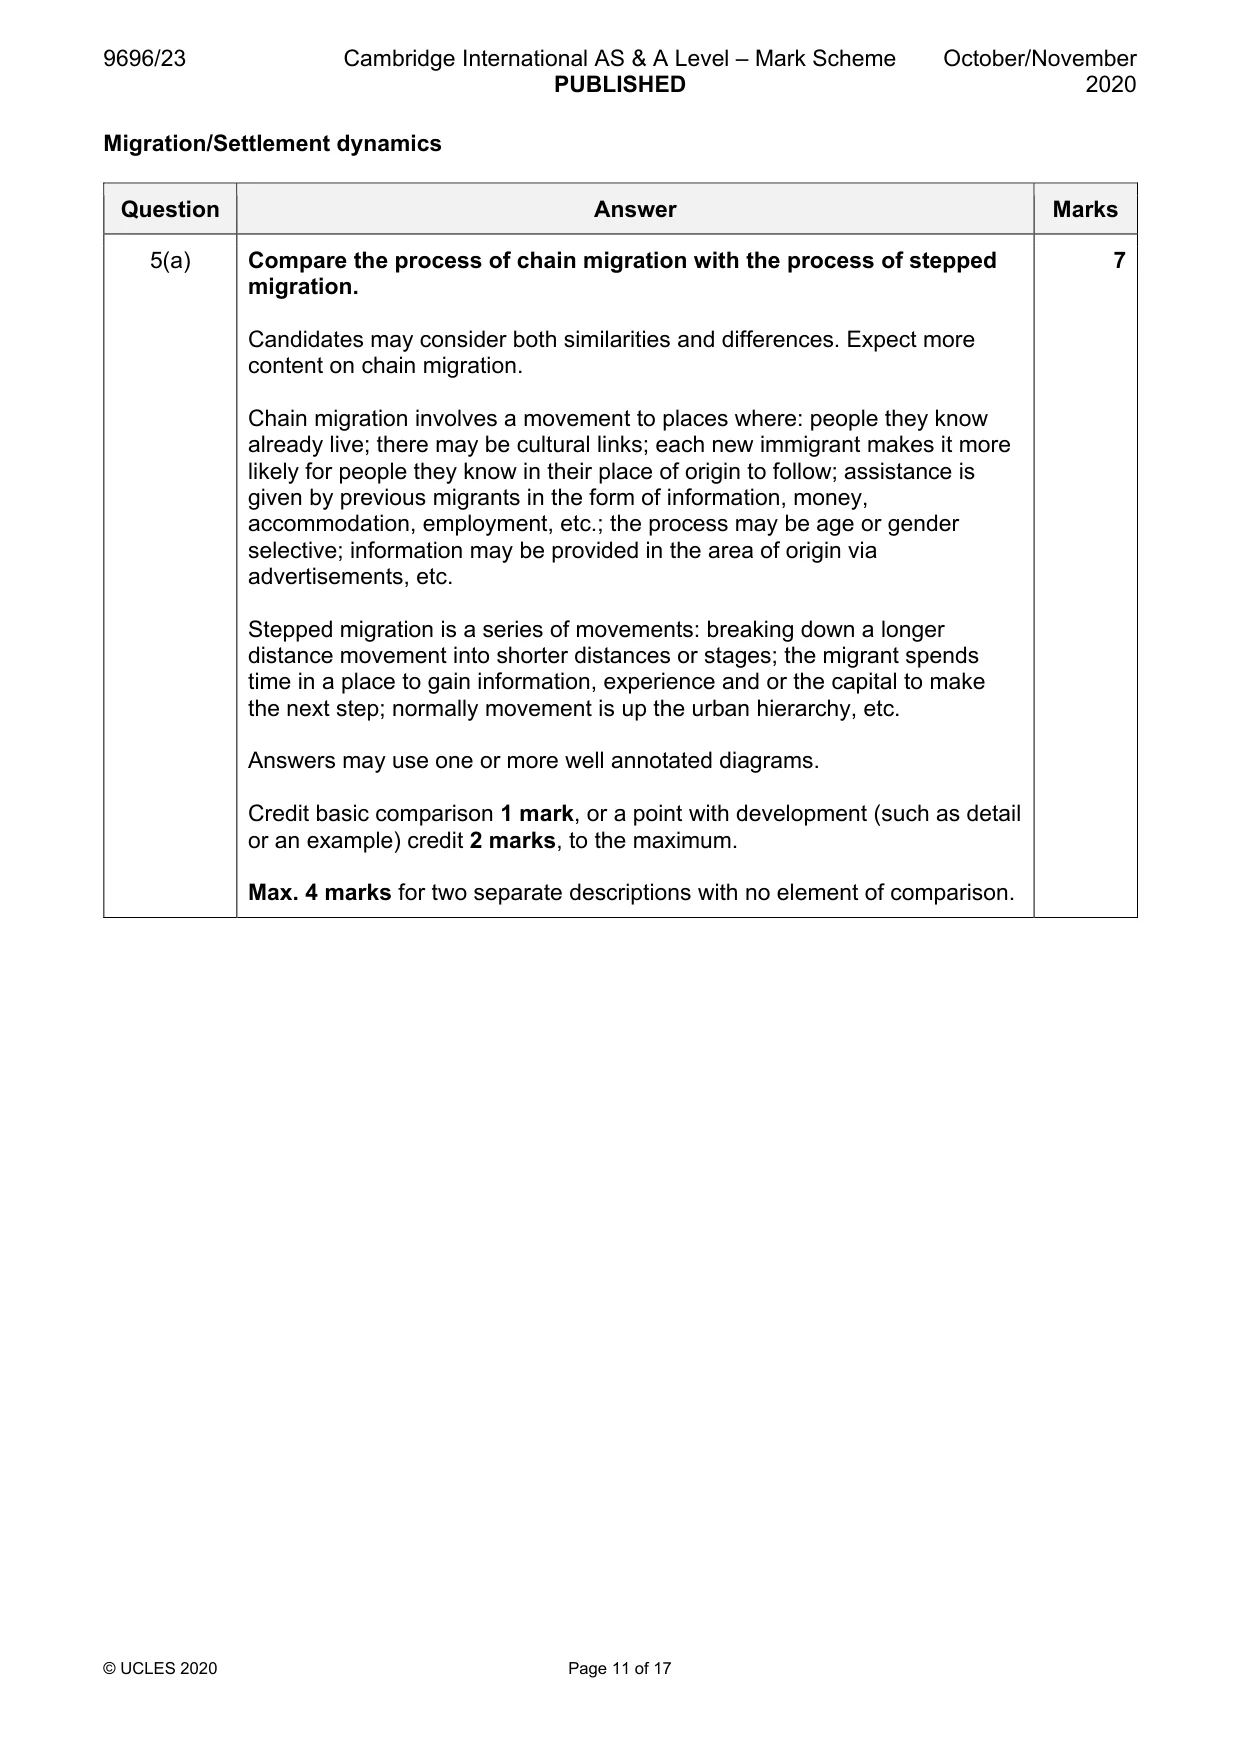
Q5 · Compare the process of chain migration with the process of stepped migration
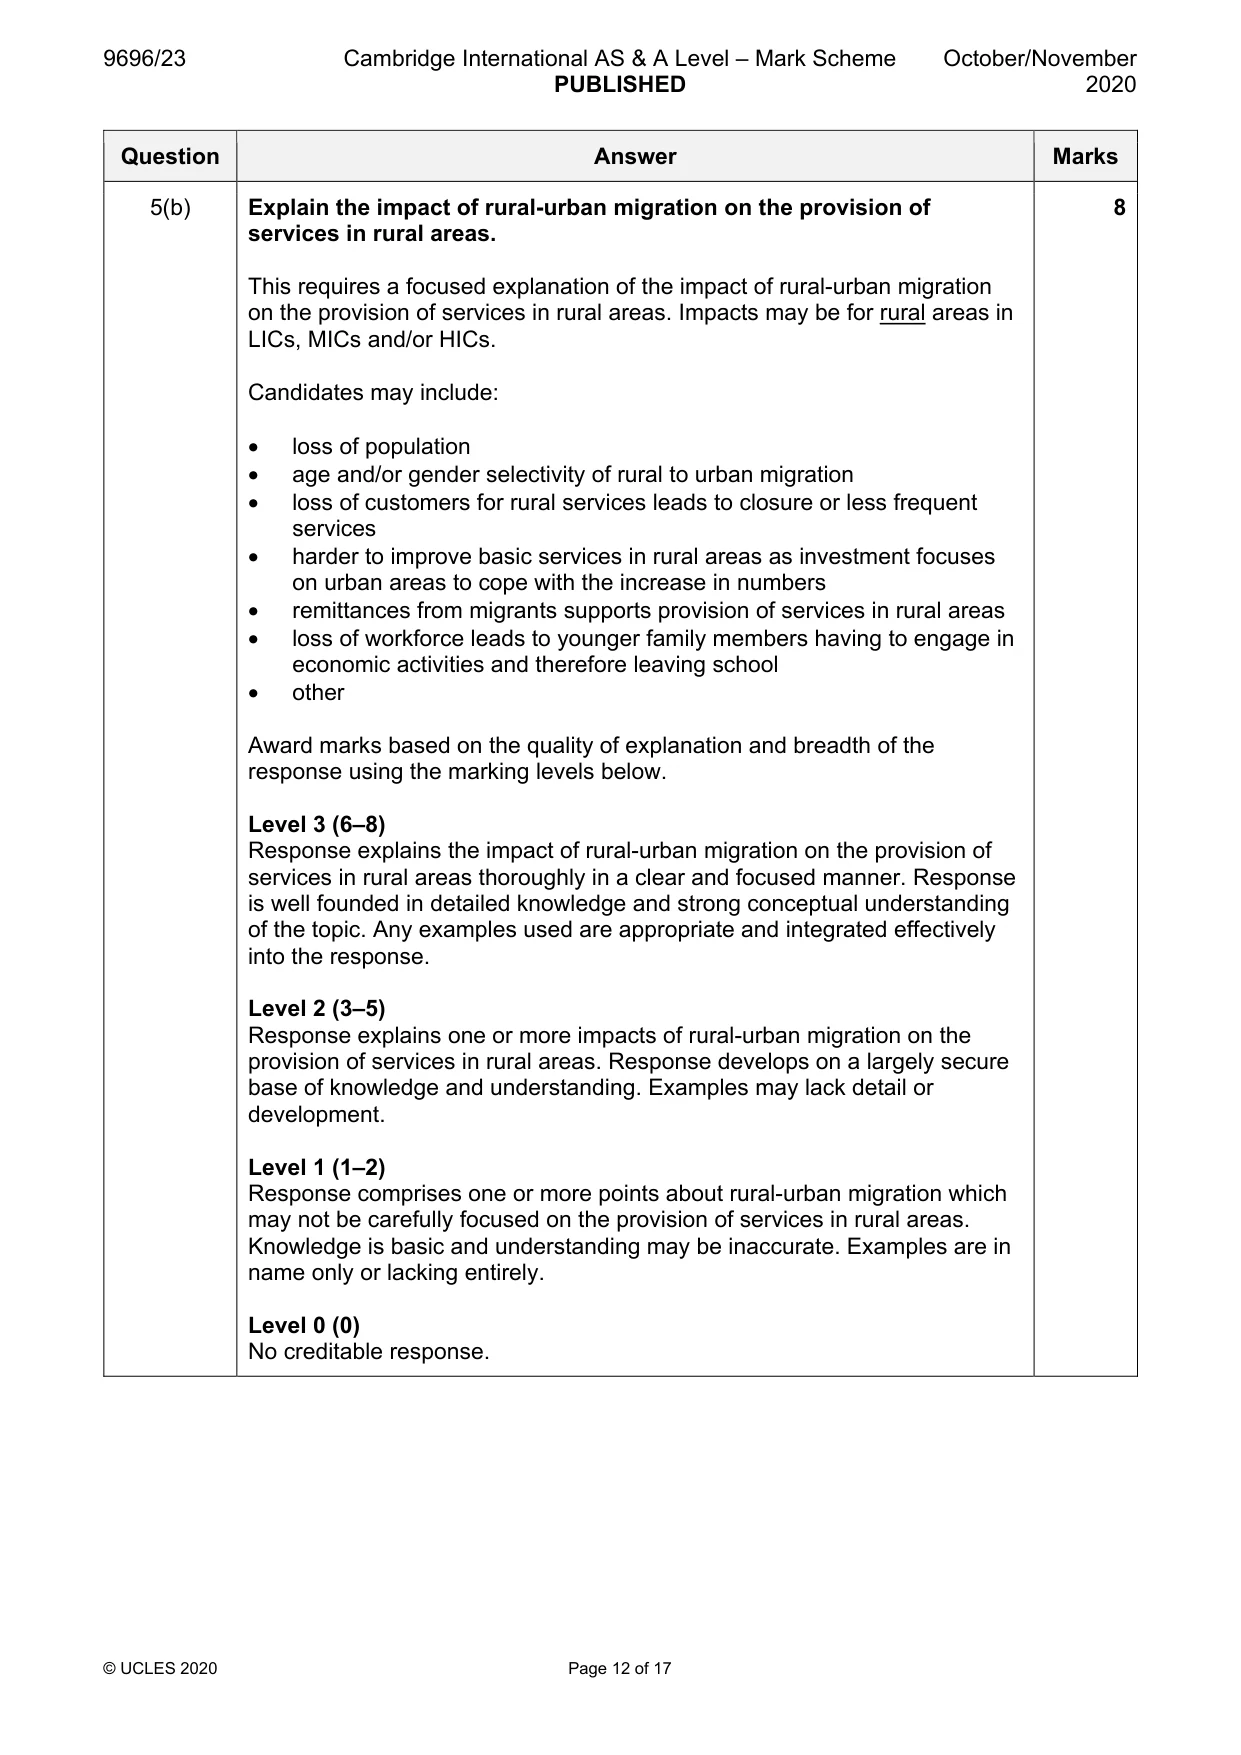
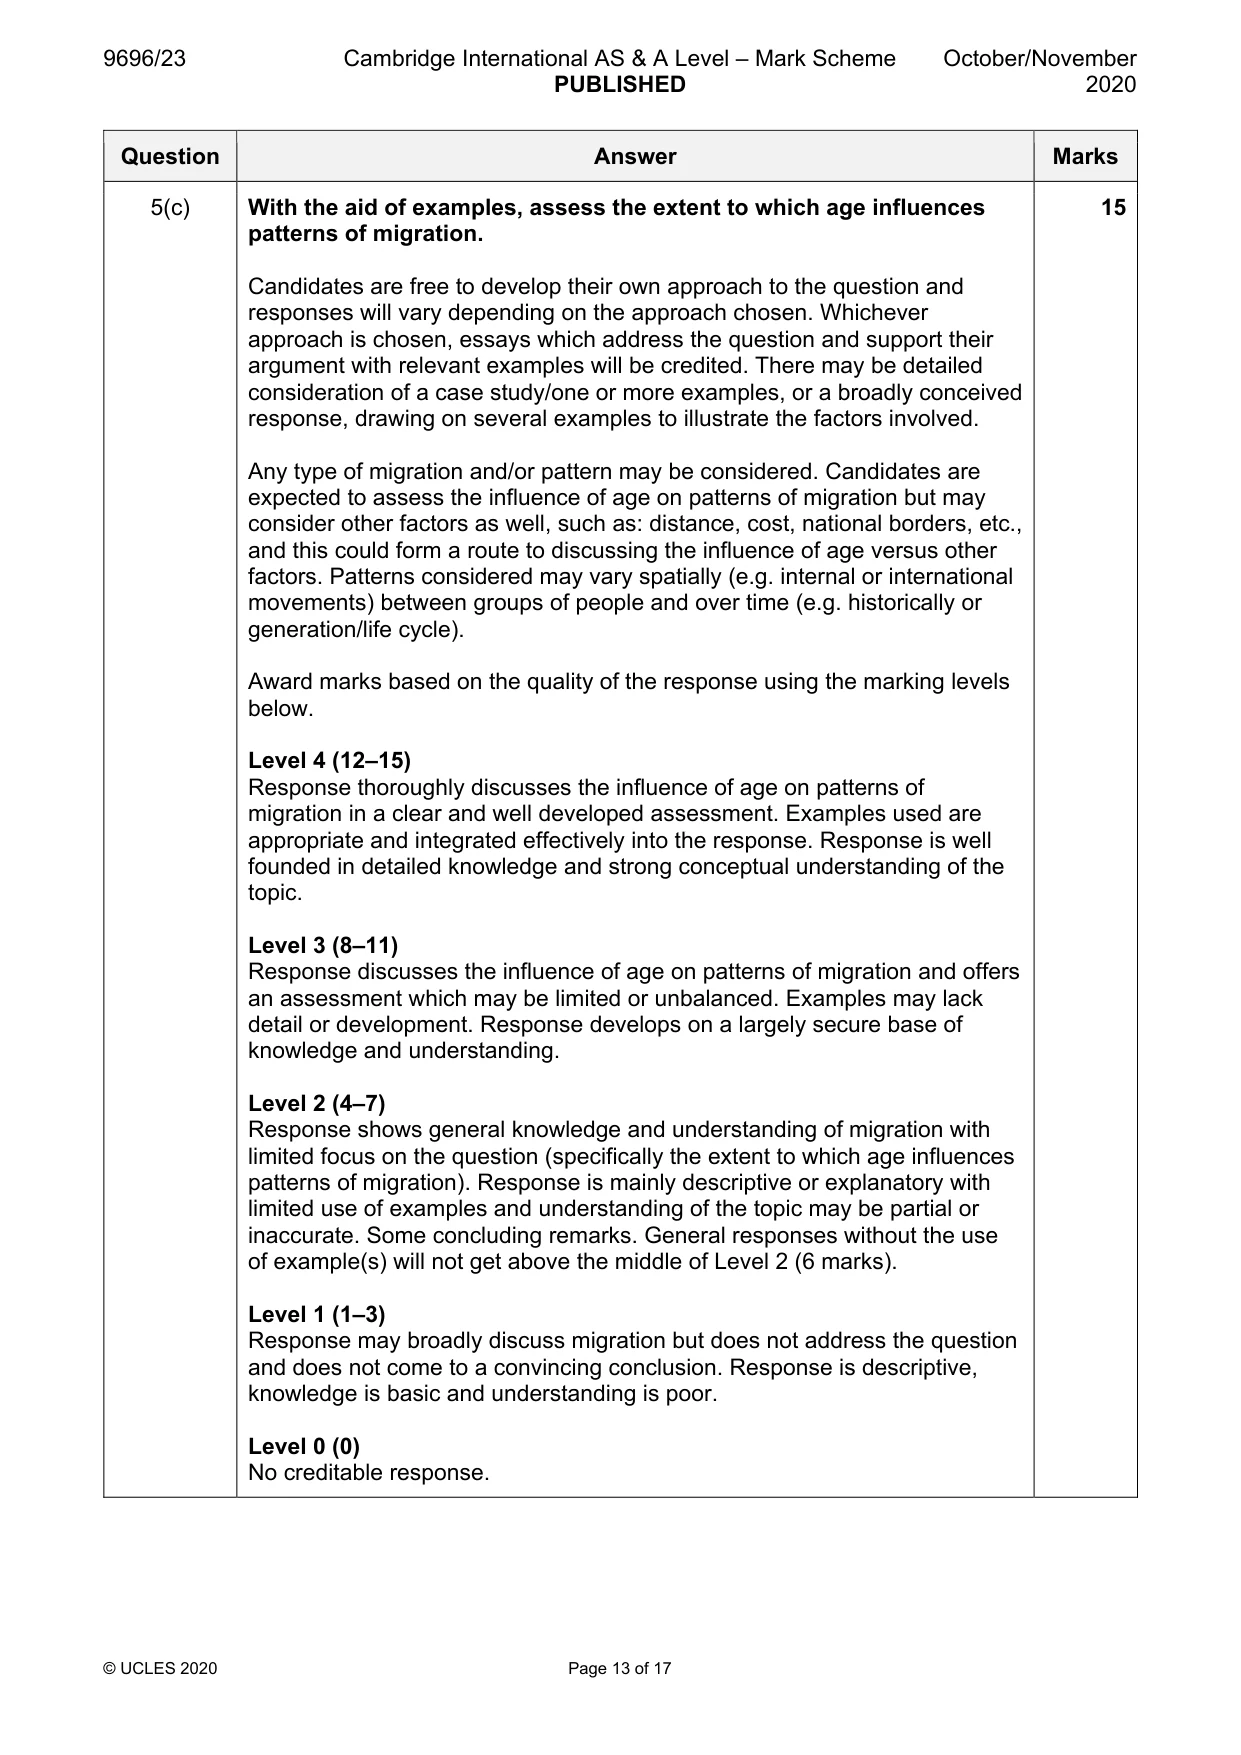
5 (a) Compare the process of chain migration with the process of stepped migration. [7] (b) Explain the impact of rural-urban migration on the provision of services in rural areas. [8] (c) With the aid of examples, assess the extent to which age influences patterns of migration. [15] Migration/Settlement dynamics
Mark scheme: 5(a) Compare the process of chain migration with the process of stepped 7 migration. Candidates may consider both similarities and differences. Expect more content on chain migration. Chain migration involves a movement to places where: people they know already live; there may be cultural links; each new immigrant makes it more likely for people they know in their place of origin to follow; assistance is given by previous migrants in the form of information, money, accommodation, employment, etc.; the process may be age or gender selective; information may be provided in the area of origin via advertisements, etc. Stepped migration is a series of movements: breaking down a longer distance movement into shorter distances or stages; the migrant spends time in a place to gain information, experience and or the capital to make the next step; normally movement is up the urban hierarchy, etc. Answers may use one or more well annotated diagrams. Credit basic comparison 1 mark, or a point with development (such as detail or an example) credit 2 marks, to the maximum. Max. 4 marks for two separate descriptions with no element of comparison. 5(b) Explain the impact of rural-urban migration on the provision of 8 services in rural areas. This requires a focused explanation of the impact of rural-urban migration on the provision of services in rural areas. Impacts may be for rural areas in LICs, MICs and/or HICs. Candidates may include: • loss of population • age and/or gender selectivity of rural to urban migration • loss of customers for rural services leads to closure or less frequent services • harder to improve basic services in rural areas as investment focuses on urban areas to cope with the increase in numbers • remittances from migrants supports provision of services in rural areas • loss of workforce leads to younger family members having to engage in economic activities and therefore leaving school • other Award marks based on the quality of explanation and breadth of the response using the marking levels below. Level 3 (6–8) Response explains the impact of rural-urban migration on the provision of services in rural areas thoroughly in a clear and focused manner. Response is well founded in detailed knowledge and strong conceptual understanding of the topic. Any examples used are appropriate and integrated effectively into the response. Level 2 (3–5) Response explains one or more impacts of rural-urban migration on the provision of services in rural areas. Response develops on a largely secure base of knowledge and understanding. Examples may lack detail or development. Level 1 (1–2) Response comprises one or more points about rural-urban migration which may not be carefully focused on the provision of services in rural areas. Knowledge is basic and understanding may be inaccurate. Examples are in name only or lacking entirely. Level 0 (0) No creditable response. 5(c) With the aid of examples, assess the extent to which age influences 15 patterns of migration. Candidates are free to develop their own approach to the question and responses will vary depending on the approach chosen. Whichever approach is chosen, essays which address the question and support their argument with relevant examples will be credited. There may be detailed consideration of a case study/one or more examples, or a broadly conceived response, drawing on several examples to illustrate the factors involved. Any type of migration and/or pattern may be considered. Candidates are expected to assess the influence of age on patterns of migration but may consider other factors as well, such as: distance, cost, national borders, etc., and this could form a route to discussing the influence of age versus other factors. Patterns considered may vary spatially (e.g. internal or international movements) between groups of people and over time (e.g. historically or generation/life cycle). Award marks based on the quality of the response using the marking levels below. Level 4 (12–15) Response thoroughly discusses the influence of age on patterns of migration in a clear and well developed assessment. Examples used are appropriate and integrated effectively into the response. Response is well founded in detailed knowledge and strong conceptual understanding of the topic. Level 3 (8–11) Response discusses the influence of age on patterns of migration and offers an assessment which may be limited or unbalanced. Examples may lack detail or development. Response develops on a largely secure base of knowledge and understanding. Level 2 (4–7) Response shows general knowledge and understanding of migration with limited focus on the question (specifically the extent to which age influences patterns of migration). Response is mainly descriptive or explanatory with limited use of examples and understanding of the topic may be partial or inaccurate. Some concluding remarks. General responses without the use of example(s) will not get above the middle of Level 2 (6 marks). Level 1 (1–3) Response may broadly discuss migration but does not address the question and does not come to a convincing conclusion. Response is descriptive, knowledge is basic and understanding is poor. Level 0 (0) No creditable response. Migration/Settlement dynamics
Q6 · Describe three ways in which urban areas in LICs/MICs are changing as a result of…
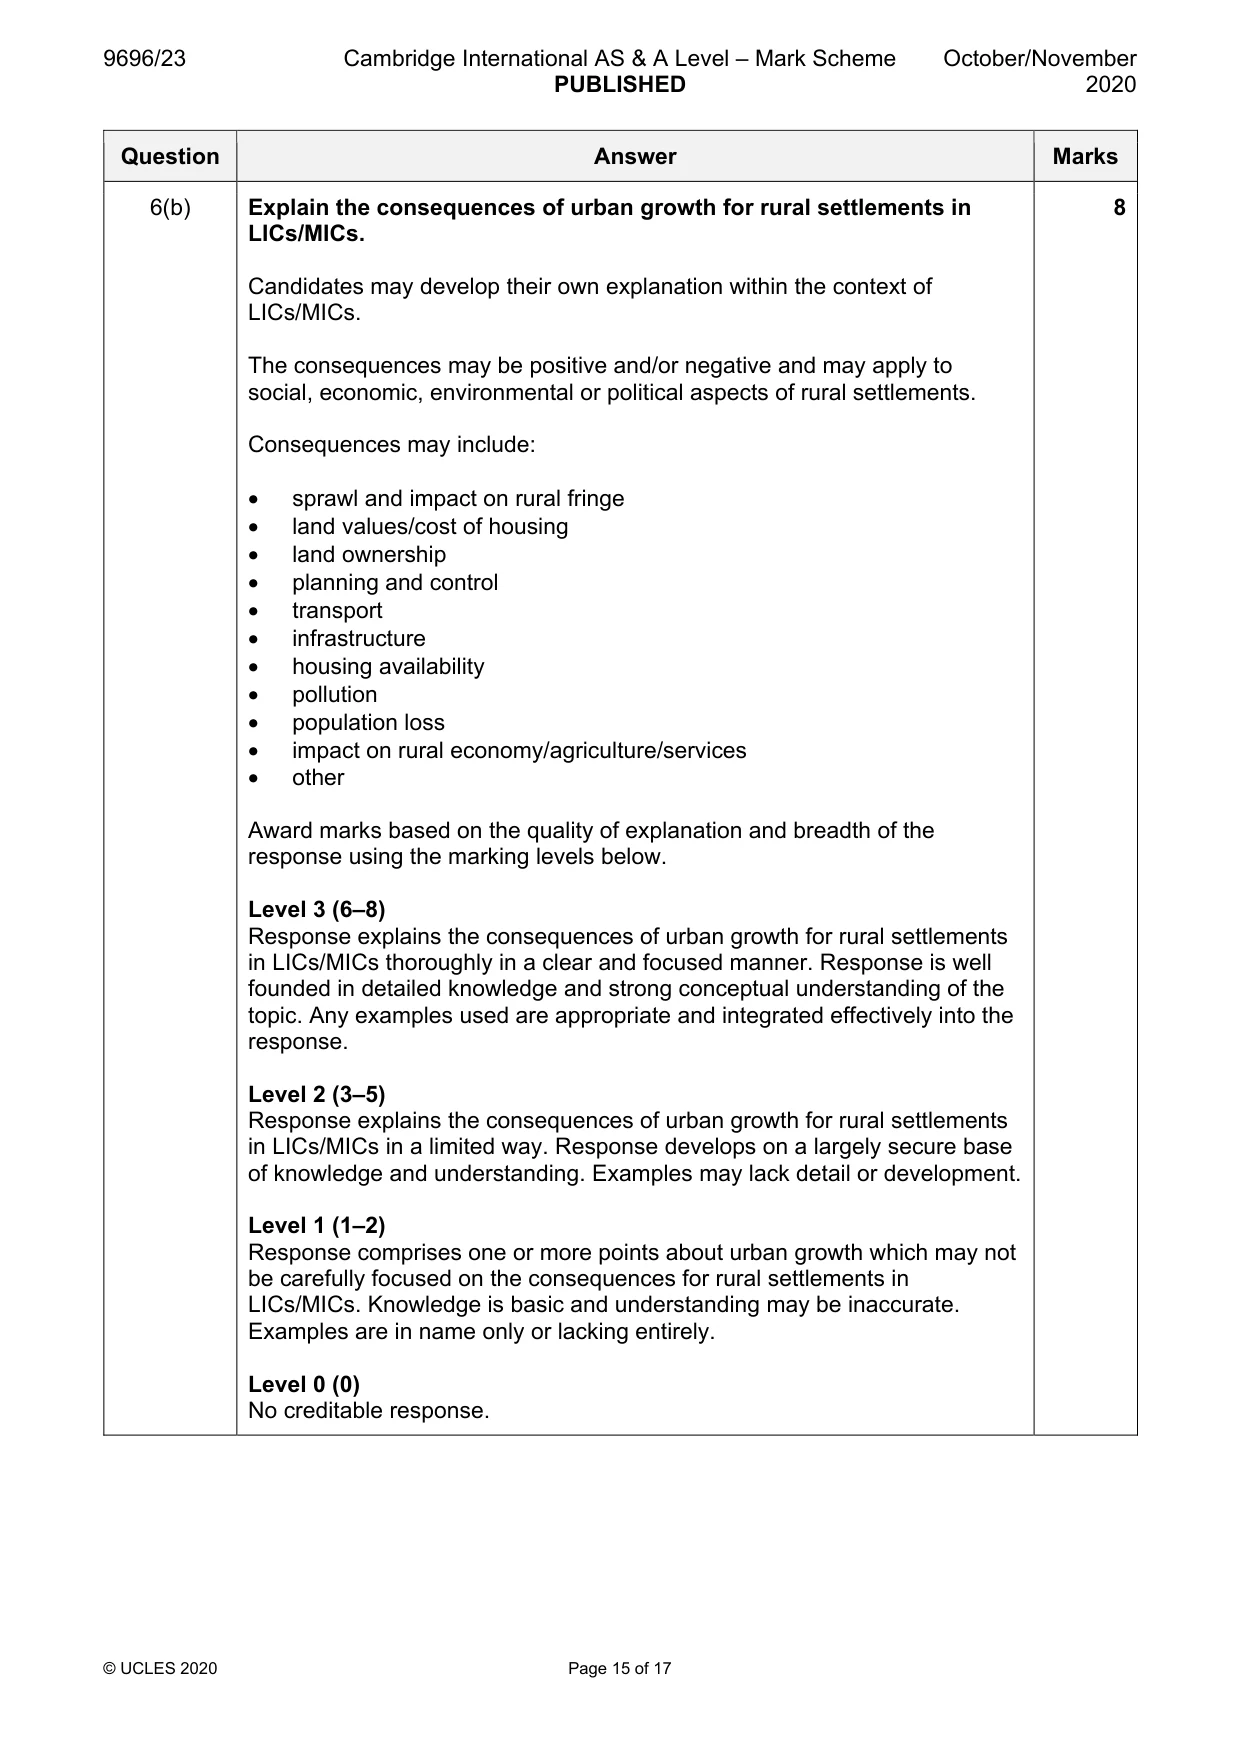
6 (a) Describe three ways in which urban areas in LICs/MICs are changing as a result of rural-urban migration. [7] (b) Explain the consequences of urban growth for rural settlements in LICs/MICs. [8] (c) For your case study of one named city, assess the extent to which the challenges of providing either power infrastructure or transport infrastructure have been overcome. [15]
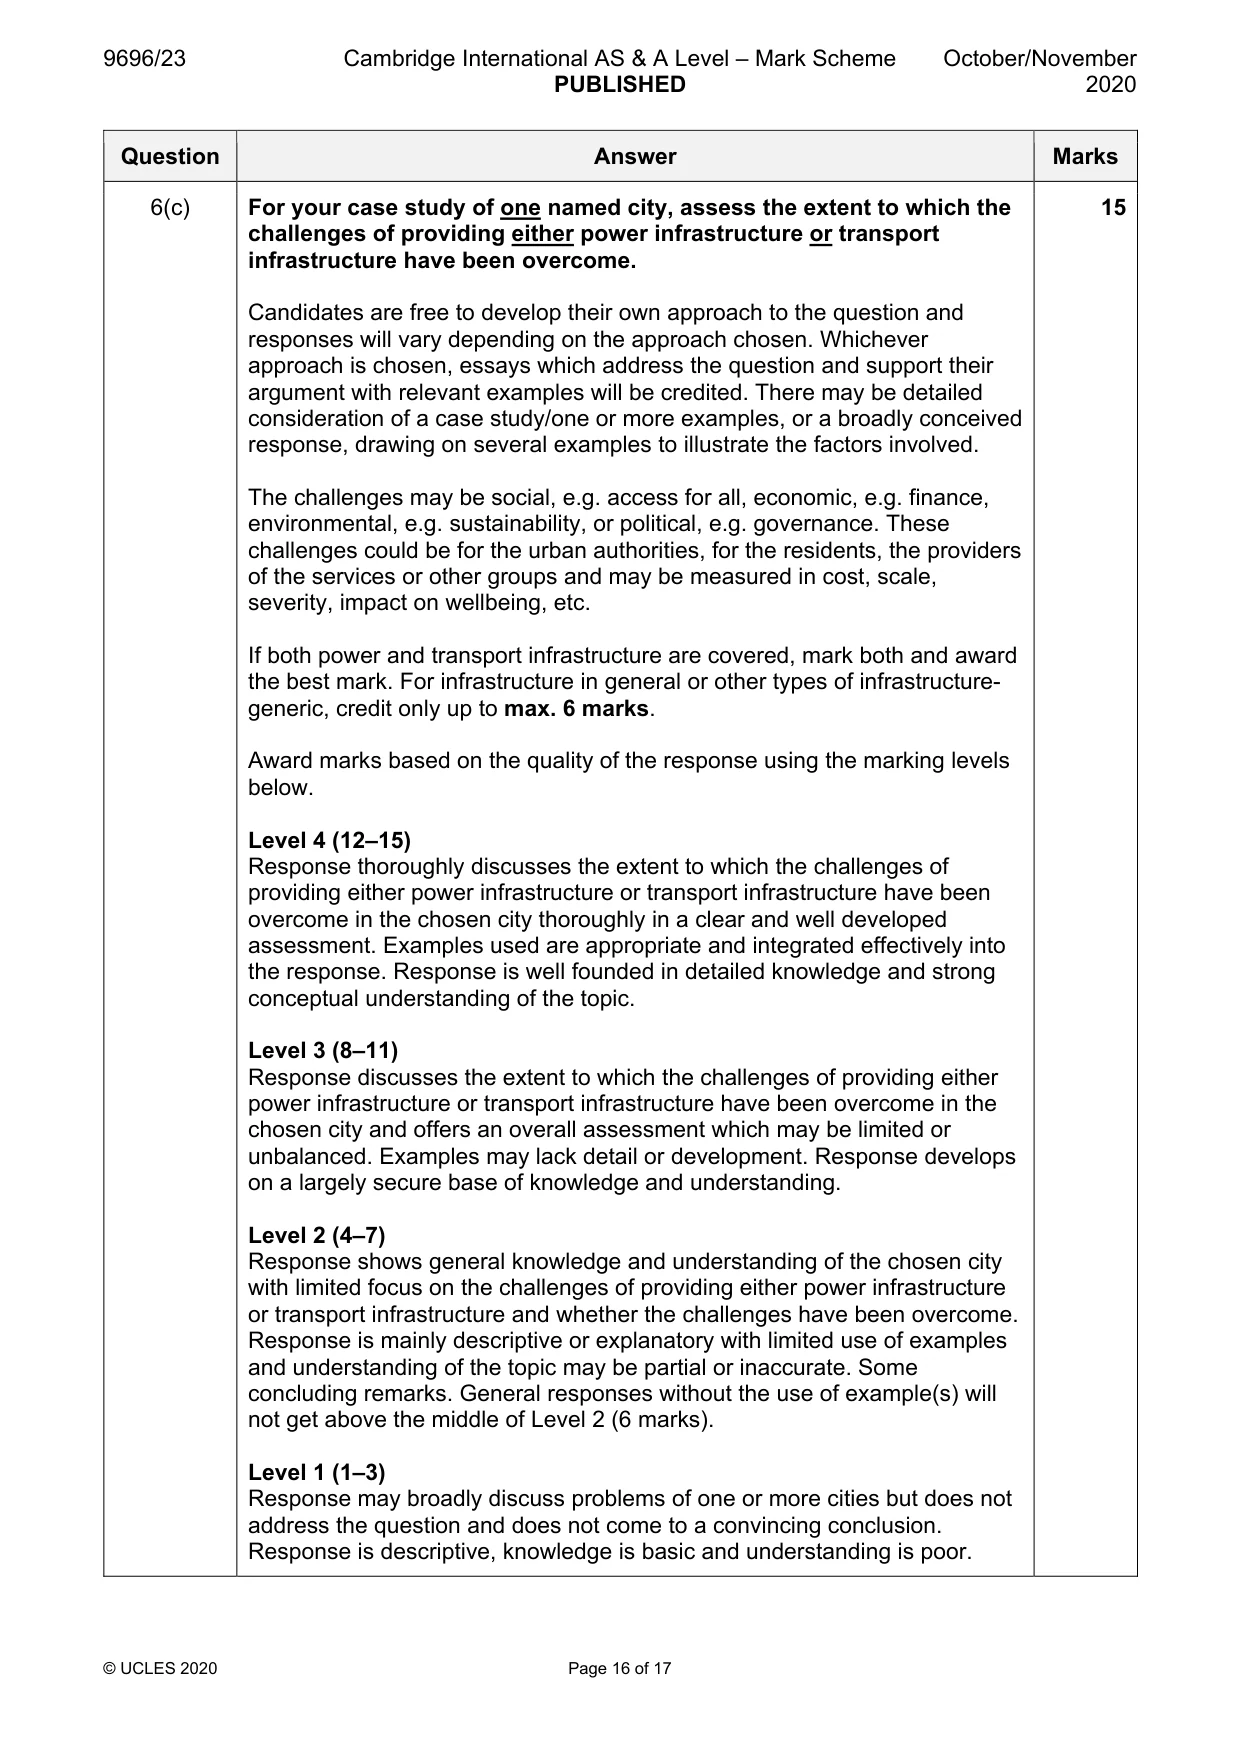
Mark scheme: 6(a) Describe three ways in which urban areas in LICs/MICs are changing 7 as a result of rural-urban migration. May consider demographic, economic, social, environmental and political changes. Description of changes to the urban areas may include: • increased competition for land • overcrowding of existing housing/transport • creation of shanty towns (squatter settlements) • pressure on utility services • unemployment • increased crime • health issues • congestion • pollution • other Do not credit explanation as the command word is ‘describe’. Credit a simple change 1 mark, and a developed way, with detail, depth or the use of an example, 2 marks or 3 marks to the maximum. 6(b) Explain the consequences of urban growth for rural settlements in 8 LICs/MICs. Candidates may develop their own explanation within the context of LICs/MICs. The consequences may be positive and/or negative and may apply to social, economic, environmental or political aspects of rural settlements. Consequences may include: • sprawl and impact on rural fringe • land values/cost of housing • land ownership • planning and control • transport • infrastructure • housing availability • pollution • population loss • impact on rural economy/agriculture/services • other Award marks based on the quality of explanation and breadth of the response using the marking levels below. Level 3 (6–8) Response explains the consequences of urban growth for rural settlements in LICs/MICs thoroughly in a clear and focused manner. Response is well founded in detailed knowledge and strong conceptual understanding of the topic. Any examples used are appropriate and integrated effectively into the response. Level 2 (3–5) Response explains the consequences of urban growth for rural settlements in LICs/MICs in a limited way. Response develops on a largely secure base of knowledge and understanding. Examples may lack detail or development. Level 1 (1–2) Response comprises one or more points about urban growth which may not be carefully focused on the consequences for rural settlements in LICs/MICs. Knowledge is basic and understanding may be inaccurate. Examples are in name only or lacking entirely. Level 0 (0) No creditable response. 6(c) For your case study of one named city, assess the extent to which the 15 challenges of providing either power infrastructure or transport infrastructure have been overcome. Candidates are free to develop their own approach to the question and responses will vary depending on the approach chosen. Whichever approach is chosen, essays which address the question and support their argument with relevant examples will be credited. There may be detailed consideration of a case study/one or more examples, or a broadly conceived response, drawing on several examples to illustrate the factors involved. The challenges may be social, e.g. access for all, economic, e.g. finance, environmental, e.g. sustainability, or political, e.g. governance. These challenges could be for the urban authorities, for the residents, the providers of the services or other groups and may be measured in cost, scale, severity, impact on wellbeing, etc. If both power and transport infrastructure are covered, mark both and award the best mark. For infrastructure in general or other types of infrastructure- generic, credit only up to max. 6 marks. Award marks based on the quality of the response using the marking levels below. Level 4 (12–15) Response thoroughly discusses the extent to which the challenges of providing either power infrastructure or transport infrastructure have been overcome in the chosen city thoroughly in a clear and well developed assessment. Examples used are appropriate and integrated effectively into the response. Response is well founded in detailed knowledge and strong conceptual understanding of the topic. Level 3 (8–11) Response discusses the extent to which the challenges of providing either power infrastructure or transport infrastructure have been overcome in the chosen city and offers an overall assessment which may be limited or unbalanced. Examples may lack detail or development. Response develops on a largely secure base of knowledge and understanding. Level 2 (4–7) Response shows general knowledge and understanding of the chosen city with limited focus on the challenges of providing either power infrastructure or transport infrastructure and whether the challenges have been overcome. Response is mainly descriptive or explanatory with limited use of examples and understanding of the topic may be partial or inaccurate. Some concluding remarks. General responses without the use of example(s) will not get above the middle of Level 2 (6 marks). Level 1 (1–3) Response may broadly discuss problems of one or more cities but does not address the question and does not come to a convincing conclusion. Response is descriptive, knowledge is basic and understanding is poor. 6(c) Level 0 (0) No creditable response.
What was in this paper
The subtopics covered by these 6 questions, and how many questions each got. Open one in a new tab to see every Cambridge question on it.
What you needed in this session
Cambridge’s own grade thresholds for 2020 Oct/Nov, Paper 2 · Variant 3. A higher threshold means an easier paper — the bar moves with how the cohort did.