Cambridge A Level Geography 9696 — 2020 Oct/Nov Paper 2 · Variant 2
9696/22/O/N/20 · 6 questions · 60 marks · ≈68 min
The question paper and its mark scheme, free to read here and free to download. This is Cambridge’s own paper, exactly as it was sat.
Question paper4 pages

Mark scheme17 pages
Answers below. Sit the paper first if you are practising.


Questions as text
Question 1
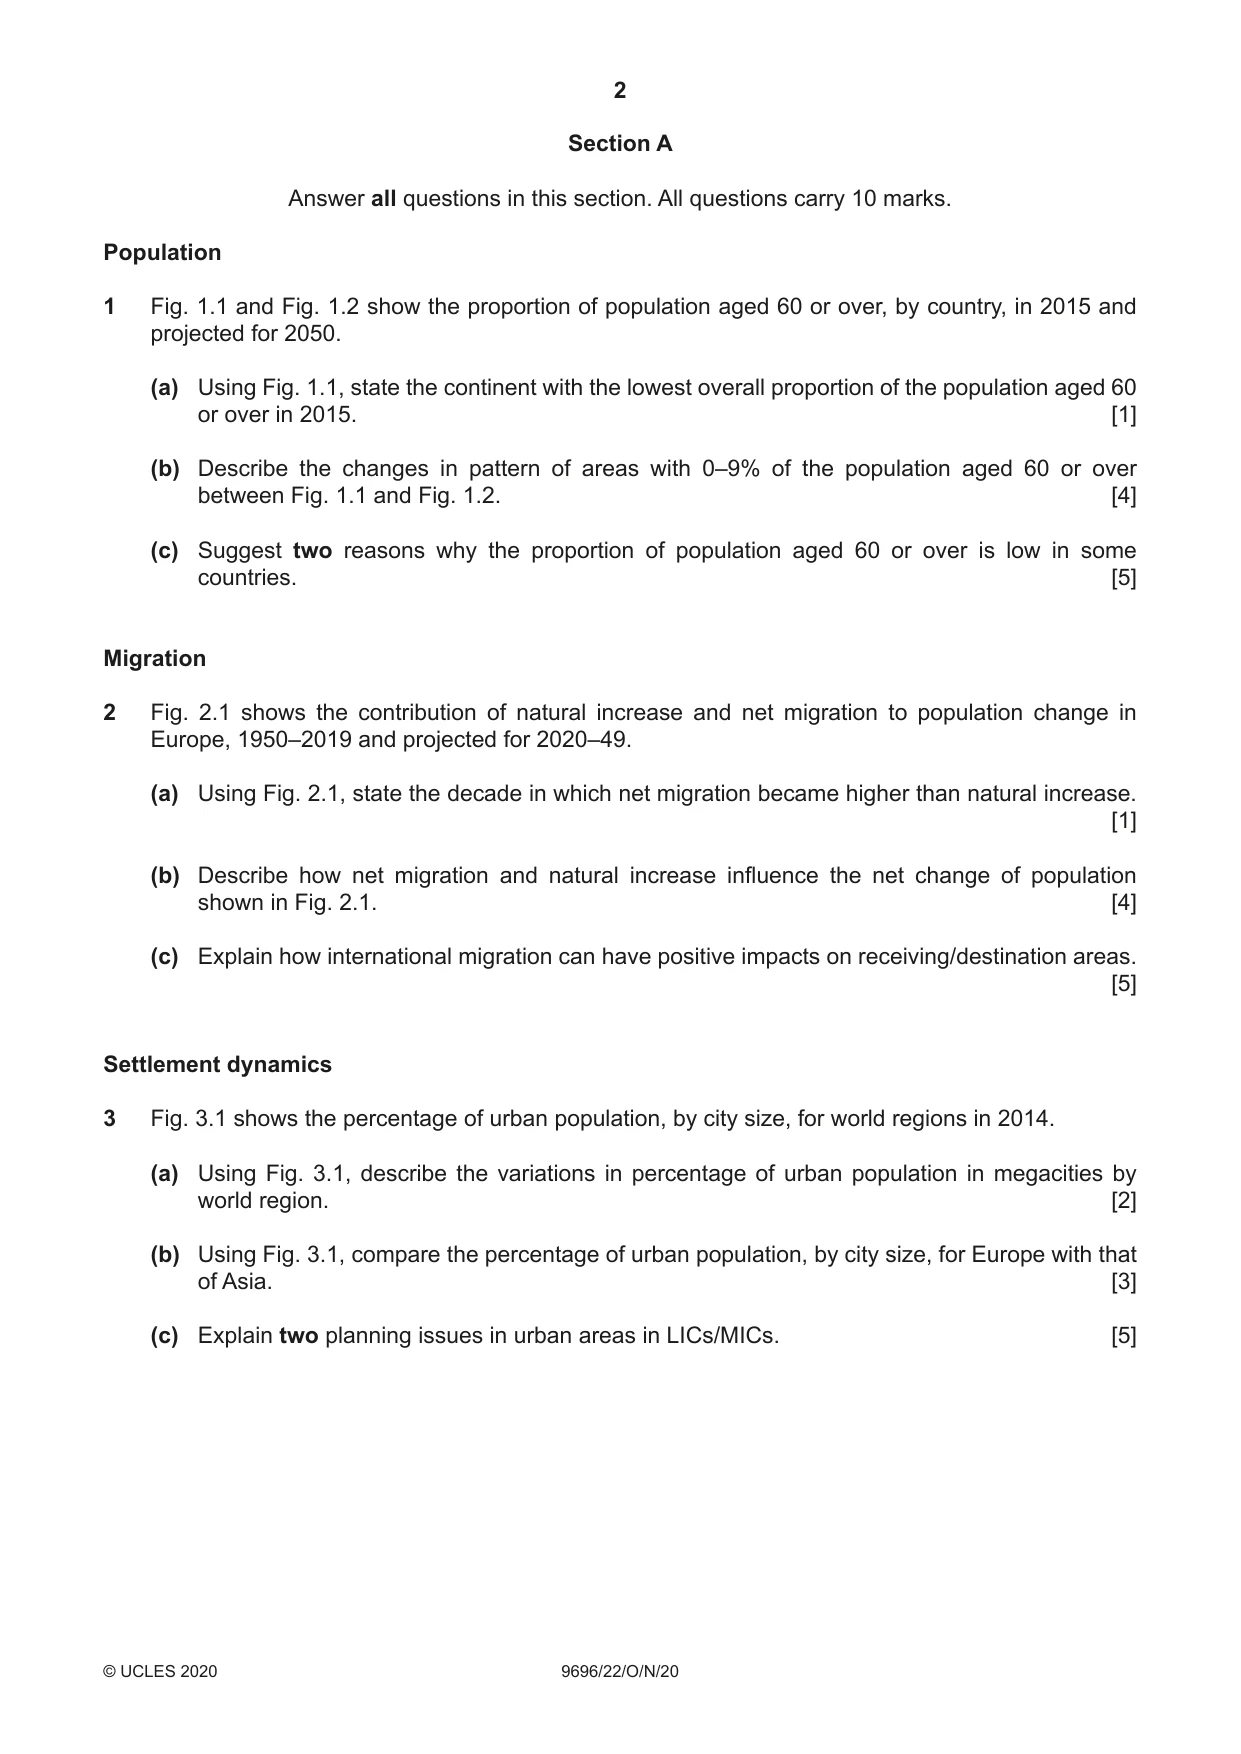
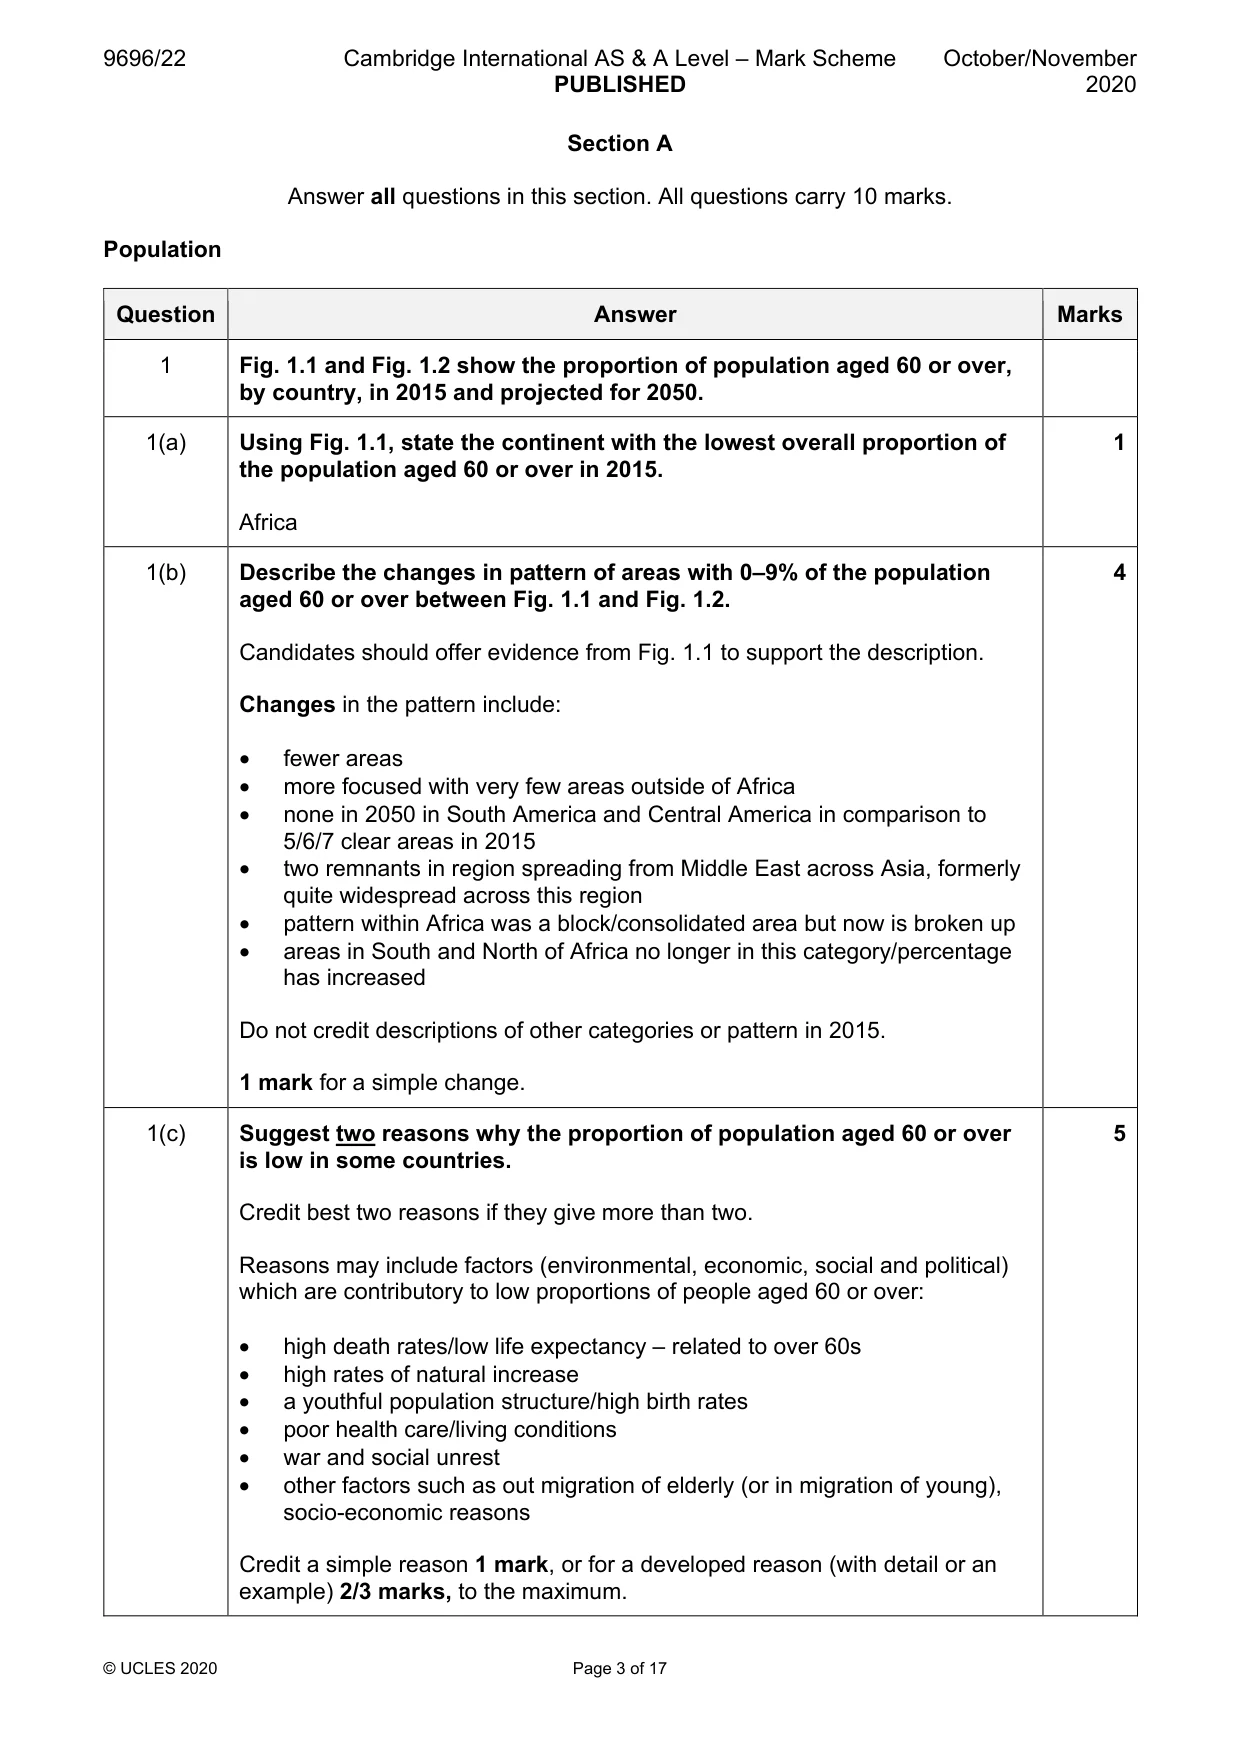
1 Fig. 1.1 and Fig. 1.2 show the proportion of population aged 60 or over, by country, in 2015 and projected for 2050. (a) Using Fig. 1.1, state the continent with the lowest overall proportion of the population aged 60 or over in 2015. [1] (b) Describe the changes in pattern of areas with 0–9% of the population aged 60 or over between Fig. 1.1 and Fig. 1.2. [4] (c) Suggest two reasons why the proportion of population aged 60 or over is low in some countries. [5] Migration
Mark scheme: Question Answer Marks 1 Fig. 1.1 and Fig. 1.2 show the proportion of population aged 60 or over, by country, in 2015 and projected for 2050. 1(a) Using Fig. 1.1, state the continent with the lowest overall proportion of 1 the population aged 60 or over in 2015. Africa 1(b) Describe the changes in pattern of areas with 0–9% of the population 4 aged 60 or over between Fig. 1.1 and Fig. 1.2. Candidates should offer evidence from Fig. 1.1 to support the description. Changes in the pattern include: • fewer areas • more focused with very few areas outside of Africa • none in 2050 in South America and Central America in comparison to 5/6/7 clear areas in 2015 • two remnants in region spreading from Middle East across Asia, formerly quite widespread across this region • pattern within Africa was a block/consolidated area but now is broken up • areas in South and North of Africa no longer in this category/percentage has increased Do not credit descriptions of other categories or pattern in 2015. 1 mark for a simple change. 1(c) Suggest two reasons why the proportion of population aged 60 or over 5 is low in some countries. Credit best two reasons if they give more than two. Reasons may include factors (environmental, economic, social and political) which are contributory to low proportions of people aged 60 or over: • high death rates/low life expectancy – related to over 60s • high rates of natural increase • a youthful population structure/high birth rates • poor health care/living conditions • war and social unrest • other factors such as out migration of elderly (or in migration of young), socio-economic reasons Credit a simple reason 1 mark, or for a developed reason (with detail or an example) 2/3 marks, to the maximum. Migration
Q2 · The contribution of natural increase and net migration to population change in Europe…
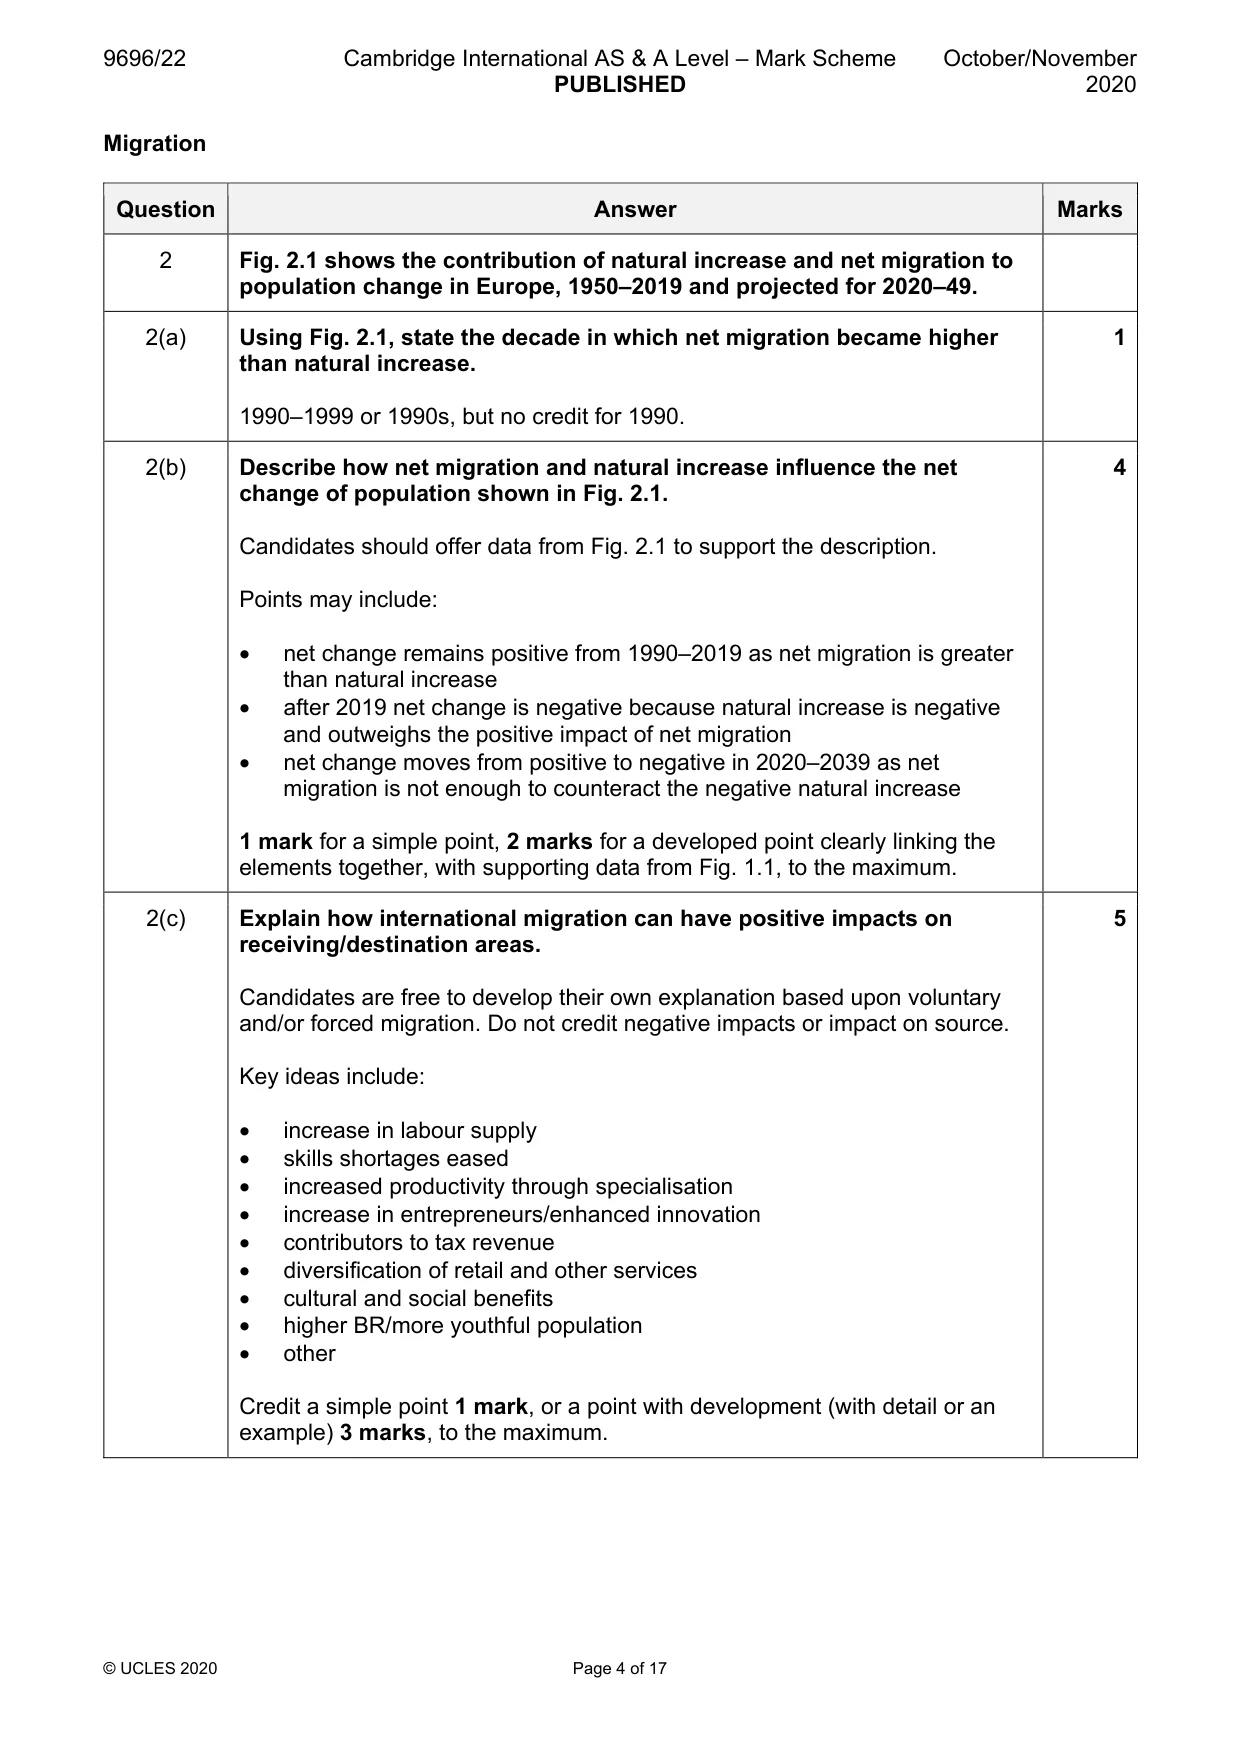
2 Fig. 2.1 shows the contribution of natural increase and net migration to population change in Europe, 1950–2019 and projected for 2020–49. (a) Using Fig. 2.1, state the decade in which net migration became higher than natural increase. [1] (b) Describe how net migration and natural increase influence the net change of population shown in Fig. 2.1. [4] (c) Explain how international migration can have positive impacts on receiving/destination areas. [5] Settlement dynamics
Mark scheme: 2 Fig. 2.1 shows the contribution of natural increase and net migration to population change in Europe, 1950–2019 and projected for 2020–49. 2(a) Using Fig. 2.1, state the decade in which net migration became higher 1 than natural increase. 1990–1999 or 1990s, but no credit for 1990. 2(b) Describe how net migration and natural increase influence the net 4 change of population shown in Fig. 2.1. Candidates should offer data from Fig. 2.1 to support the description. Points may include: • net change remains positive from 1990–2019 as net migration is greater than natural increase • after 2019 net change is negative because natural increase is negative and outweighs the positive impact of net migration • net change moves from positive to negative in 2020–2039 as net migration is not enough to counteract the negative natural increase 1 mark for a simple point, 2 marks for a developed point clearly linking the elements together, with supporting data from Fig. 1.1, to the maximum. 2(c) Explain how international migration can have positive impacts on 5 receiving/destination areas. Candidates are free to develop their own explanation based upon voluntary and/or forced migration. Do not credit negative impacts or impact on source. Key ideas include: • increase in labour supply • skills shortages eased • increased productivity through specialisation • increase in entrepreneurs/enhanced innovation • contributors to tax revenue • diversification of retail and other services • cultural and social benefits • higher BR/more youthful population • other Credit a simple point 1 mark, or a point with development (with detail or an example) 3 marks, to the maximum. Settlement dynamics
Q3 · The percentage of urban population, by city size, for world regions in 2014
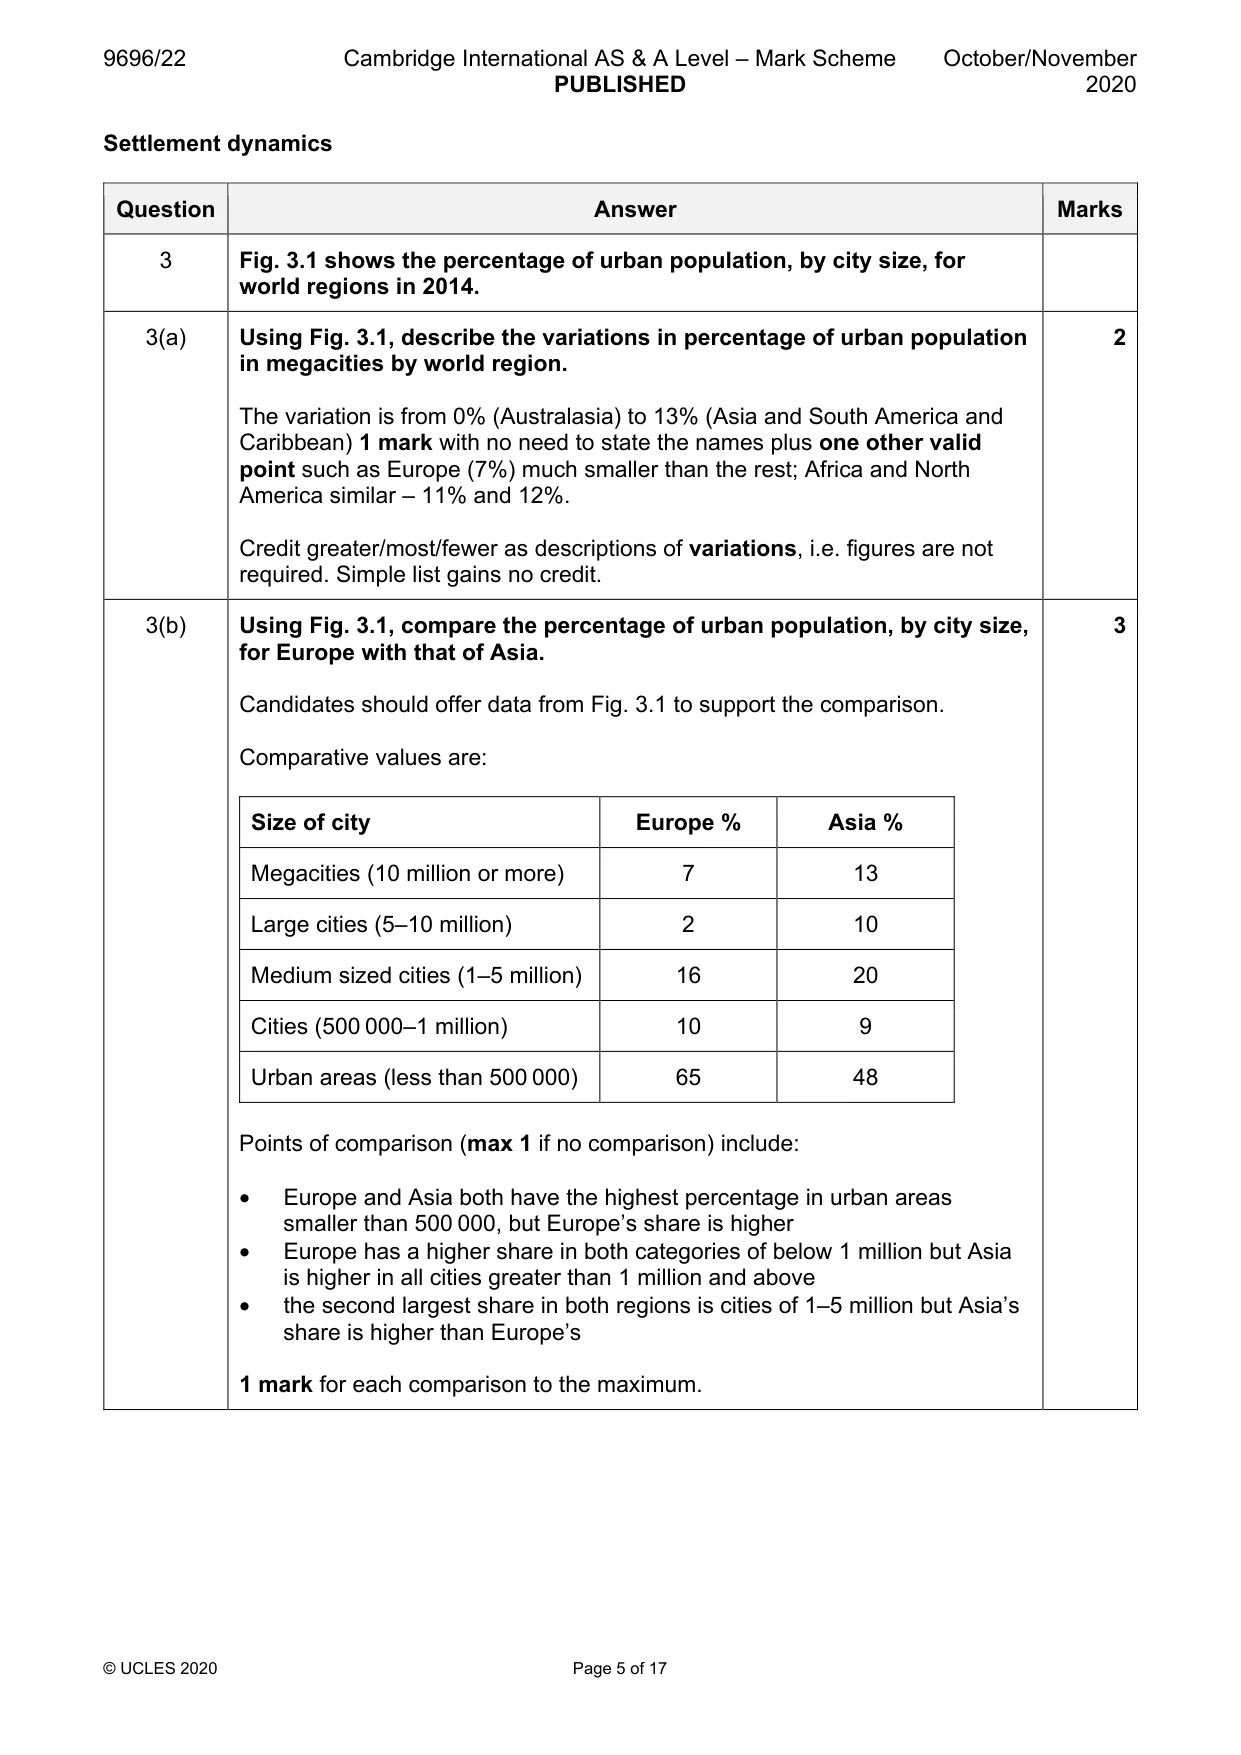
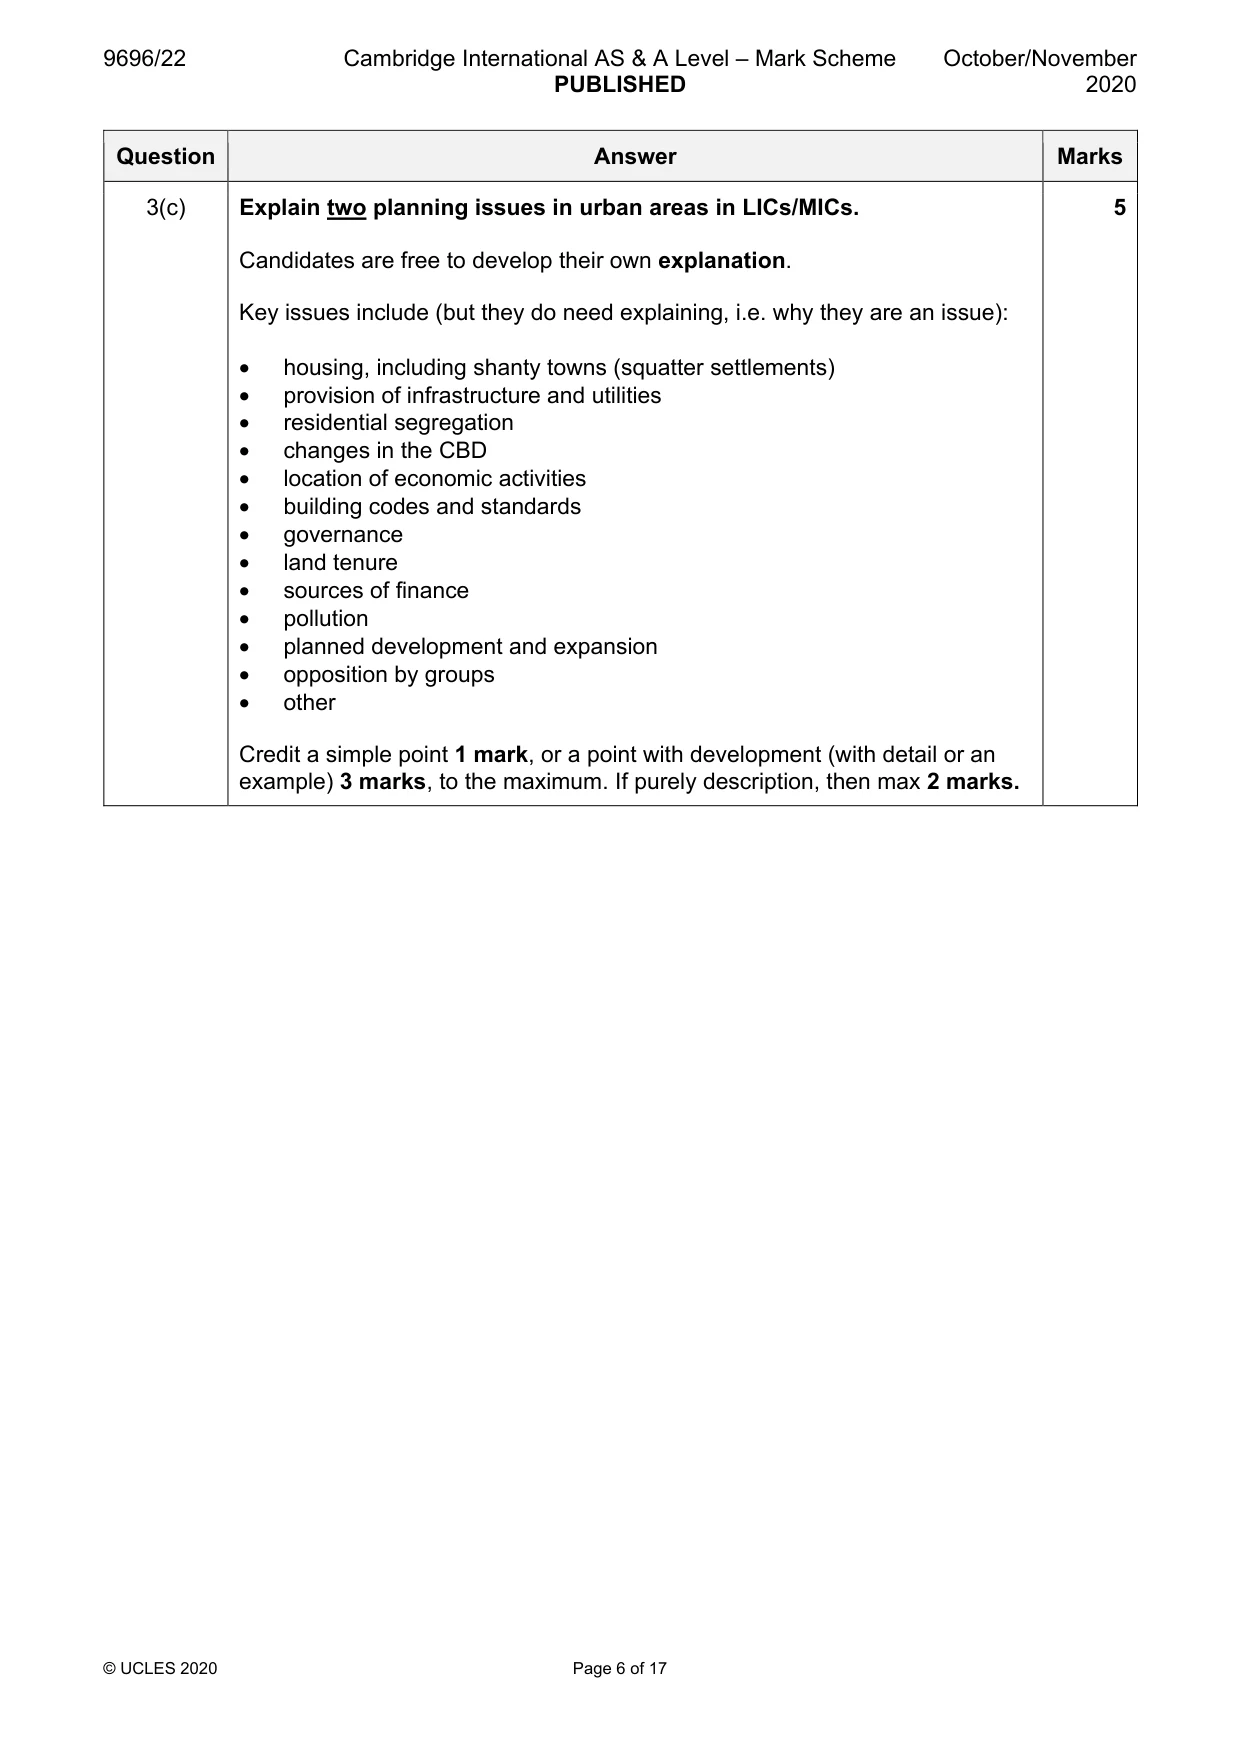
3 Fig. 3.1 shows the percentage of urban population, by city size, for world regions in 2014. (a) Using Fig. 3.1, describe the variations in percentage of urban population in megacities by world region. [2] (b) Using Fig. 3.1, compare the percentage of urban population, by city size, for Europe with that of Asia. [3] (c) Explain two planning issues in urban areas in LICs/MICs. [5]
Mark scheme: 3 Fig. 3.1 shows the percentage of urban population, by city size, for world regions in 2014. 3(a) Using Fig. 3.1, describe the variations in percentage of urban population 2 in megacities by world region. The variation is from 0% (Australasia) to 13% (Asia and South America and Caribbean) 1 mark with no need to state the names plus one other valid point such as Europe (7%) much smaller than the rest; Africa and North America similar – 11% and 12%. Credit greater/most/fewer as descriptions of variations, i.e. figures are not required. Simple list gains no credit. 3(b) Using Fig. 3.1, compare the percentage of urban population, by city size, 3 for Europe with that of Asia. Candidates should offer data from Fig. 3.1 to support the comparison. Comparative values are: Size of city Europe % Asia % Megacities (10 million or more) 7 13 Large cities (5–10 million) 2 10 Medium sized cities (1–5 million) 16 20 Cities (500 000–1 million) 10 9 Urban areas (less than 500 000) 65 48 Points of comparison (max 1 if no comparison) include: • Europe and Asia both have the highest percentage in urban areas smaller than 500 000, but Europe’s share is higher • Europe has a higher share in both categories of below 1 million but Asia is higher in all cities greater than 1 million and above • the second largest share in both regions is cities of 1–5 million but Asia’s share is higher than Europe’s 1 mark for each comparison to the maximum. 3(c) Explain two planning issues in urban areas in LICs/MICs. 5 Candidates are free to develop their own explanation. Key issues include (but they do need explaining, i.e. why they are an issue): • housing, including shanty towns (squatter settlements) • provision of infrastructure and utilities • residential segregation • changes in the CBD • location of economic activities • building codes and standards • governance • land tenure • sources of finance • pollution • planned development and expansion • opposition by groups • other Credit a simple point 1 mark, or a point with development (with detail or an example) 3 marks, to the maximum. If purely description, then max 2 marks. Section B Answer one question from this section. All questions carry 30 marks. Population
Q4 · Define the term food security
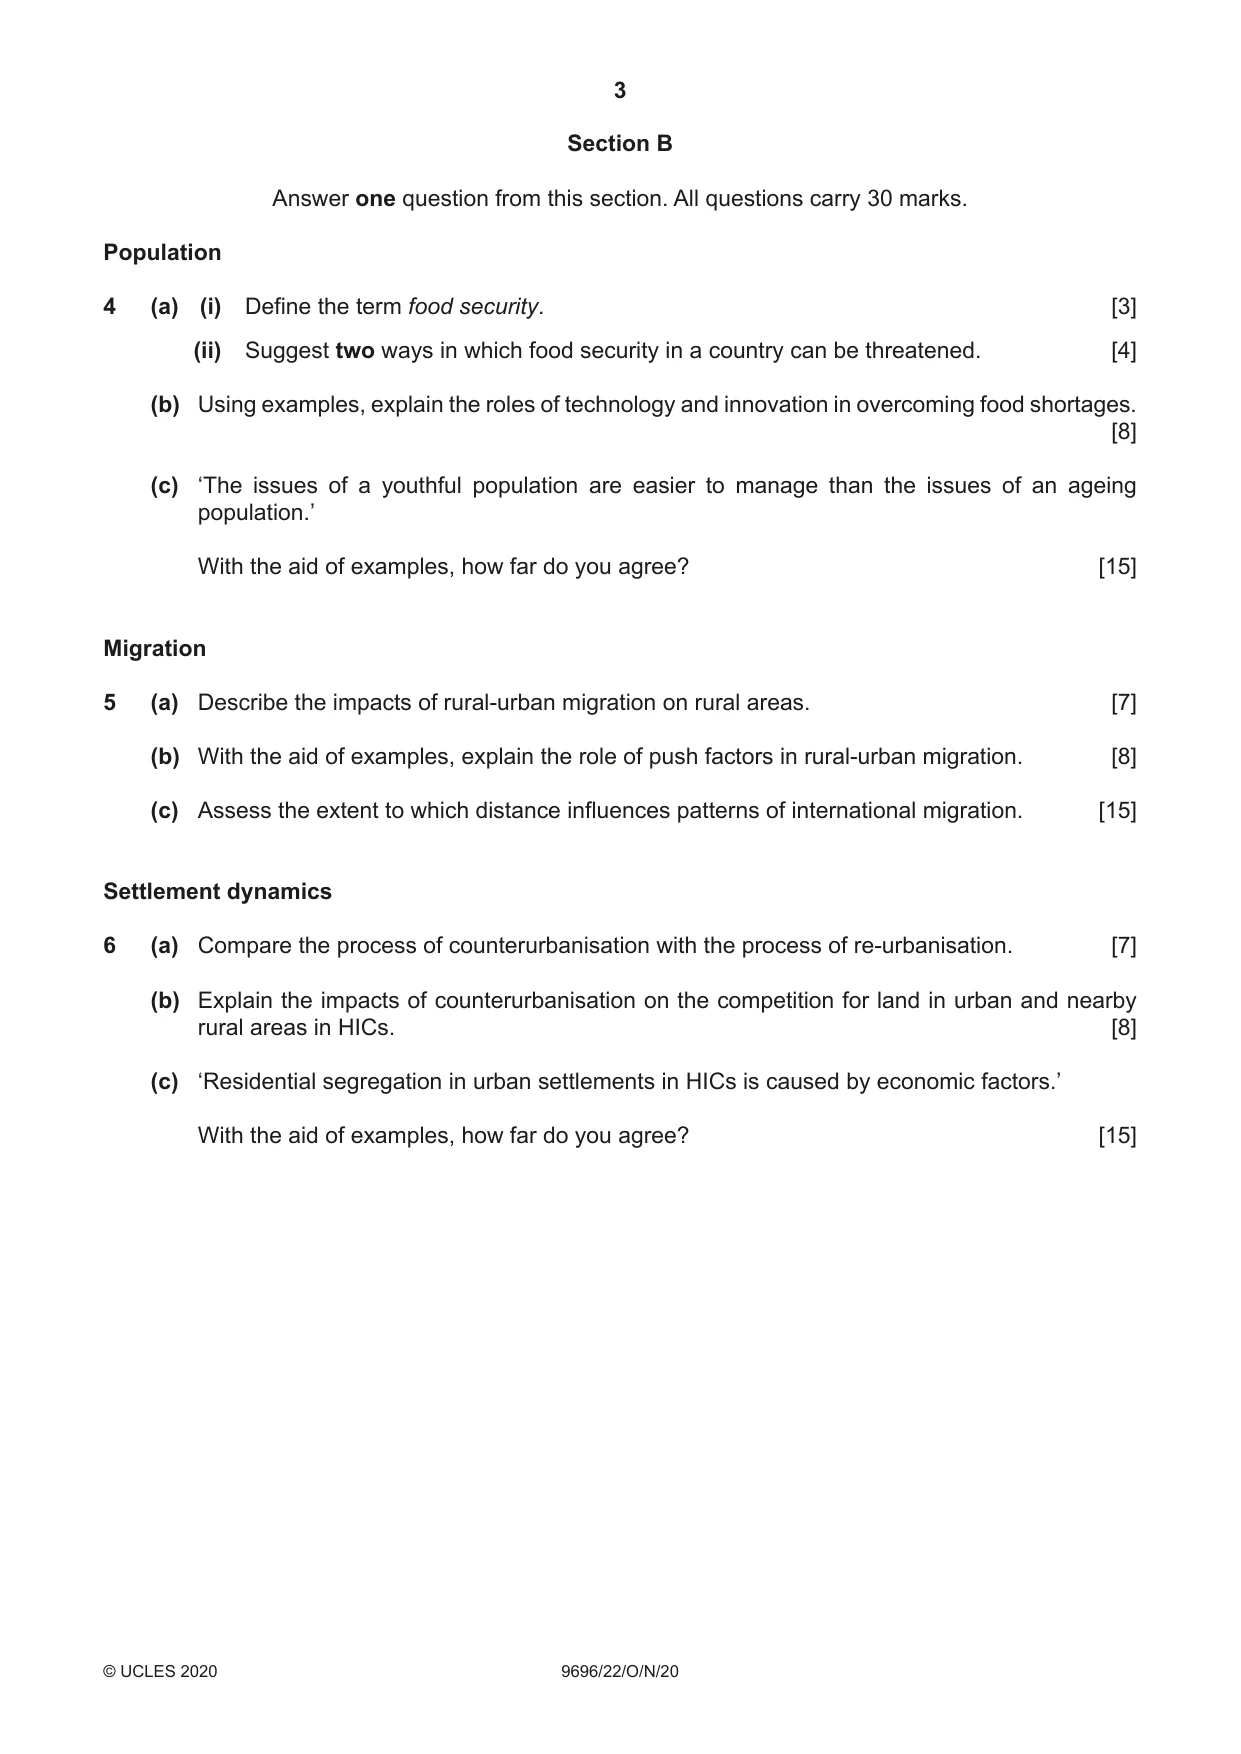
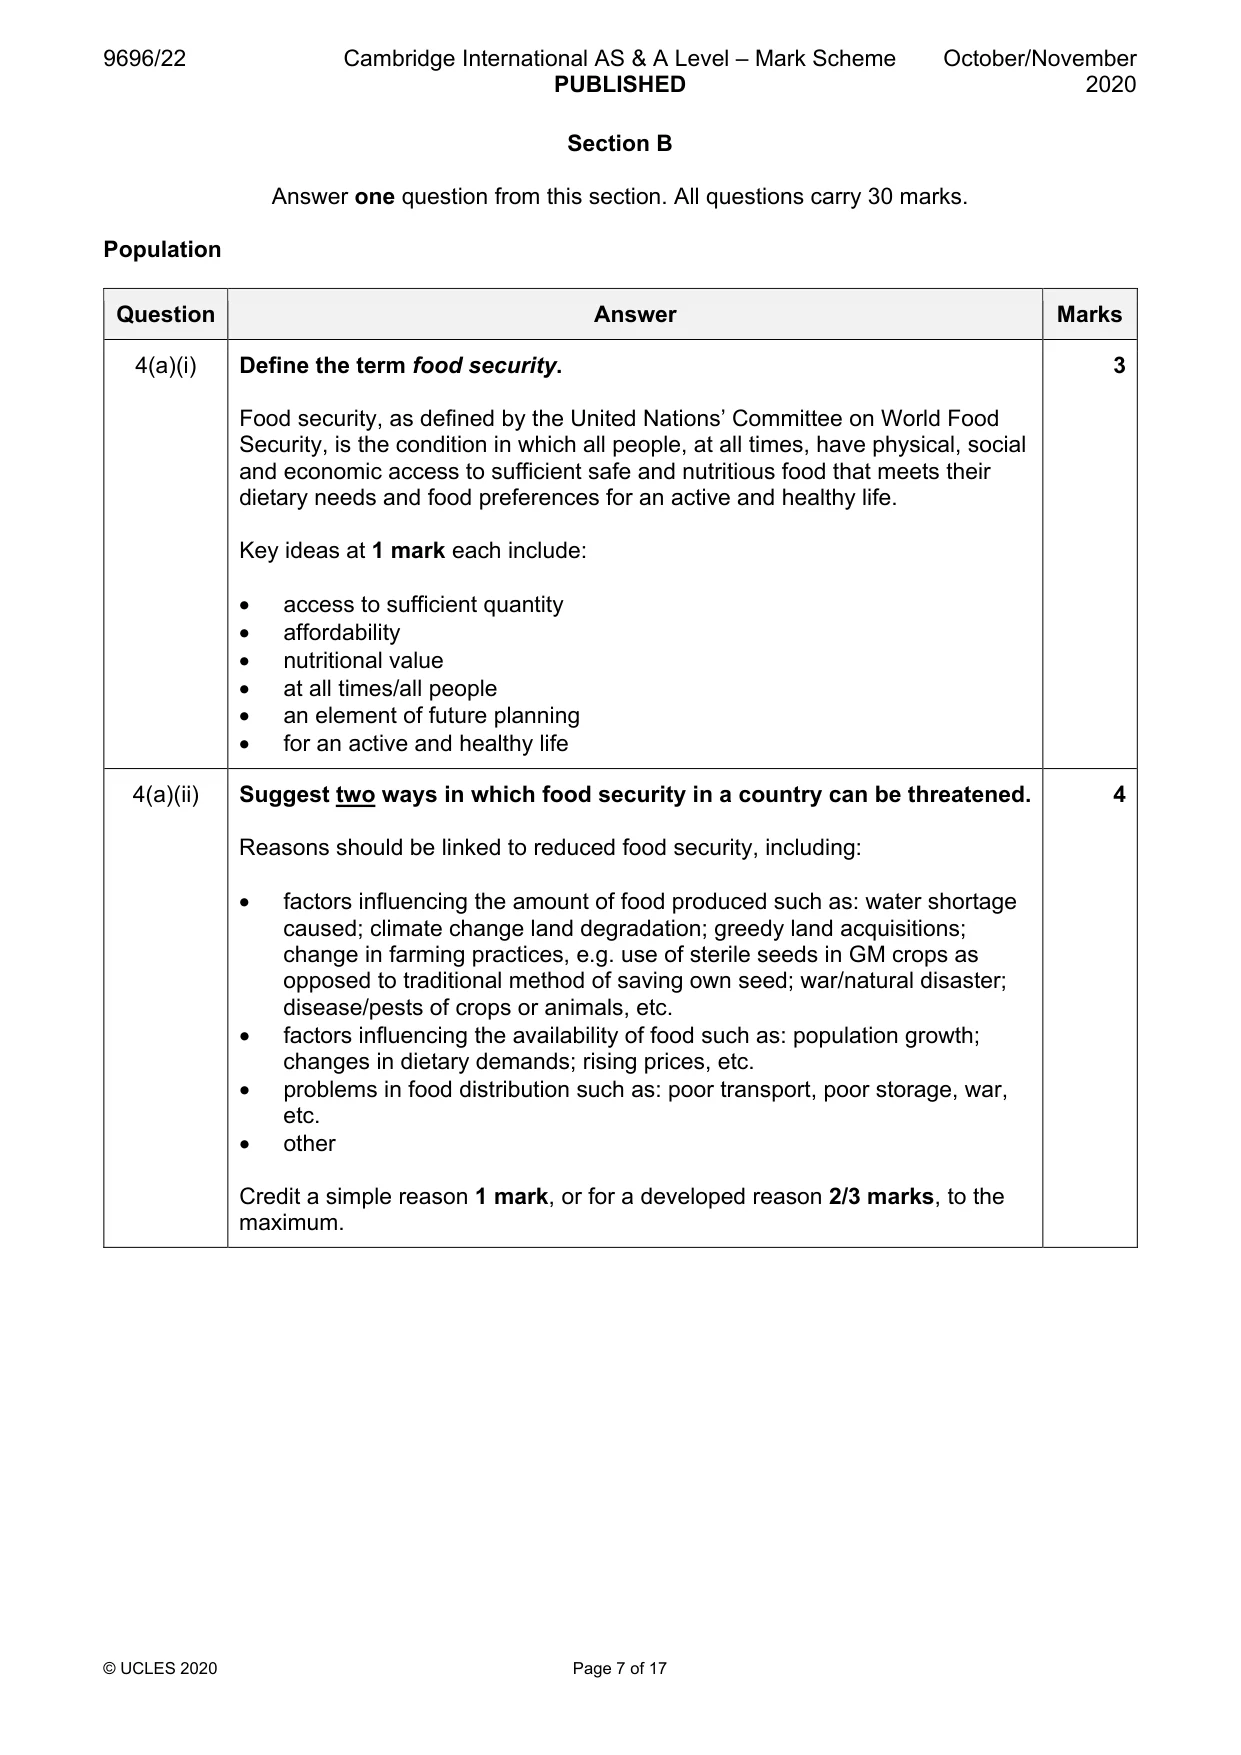
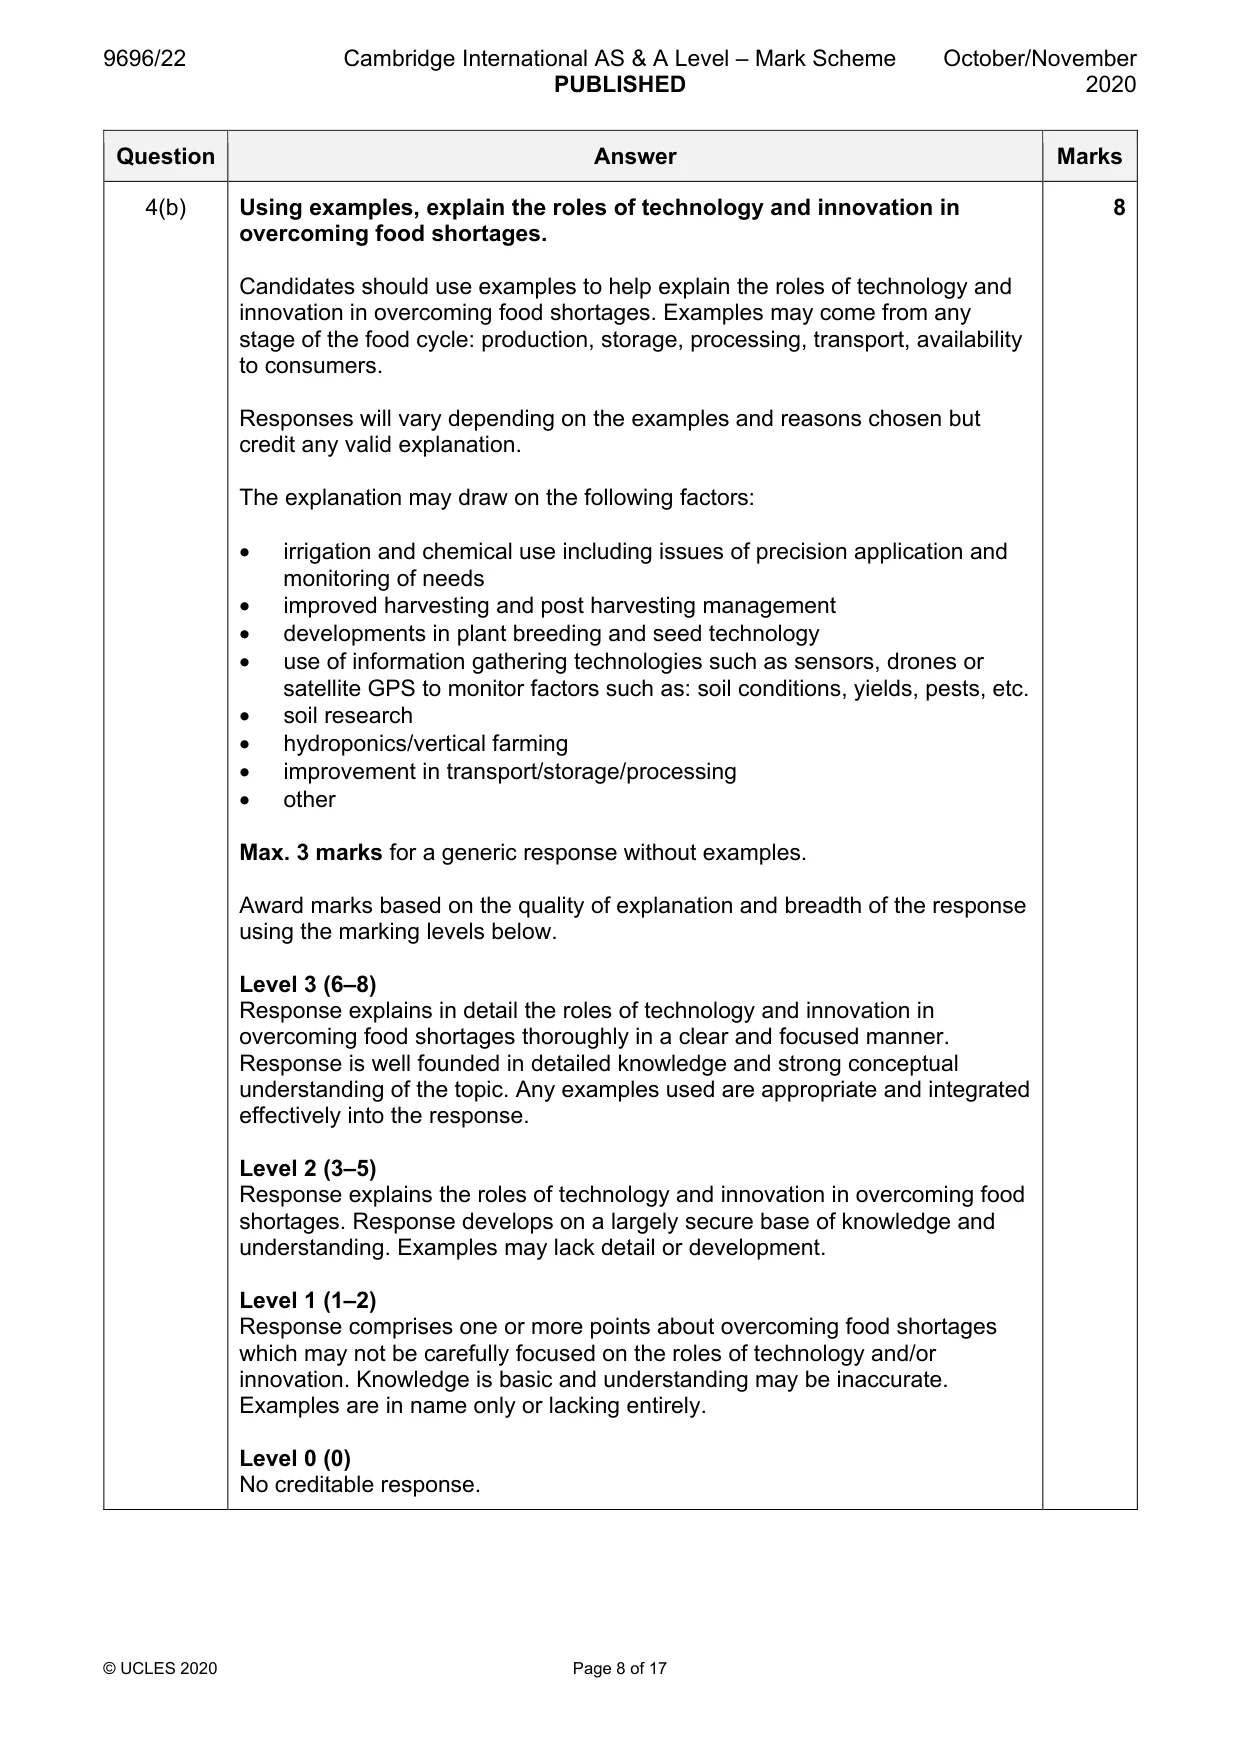
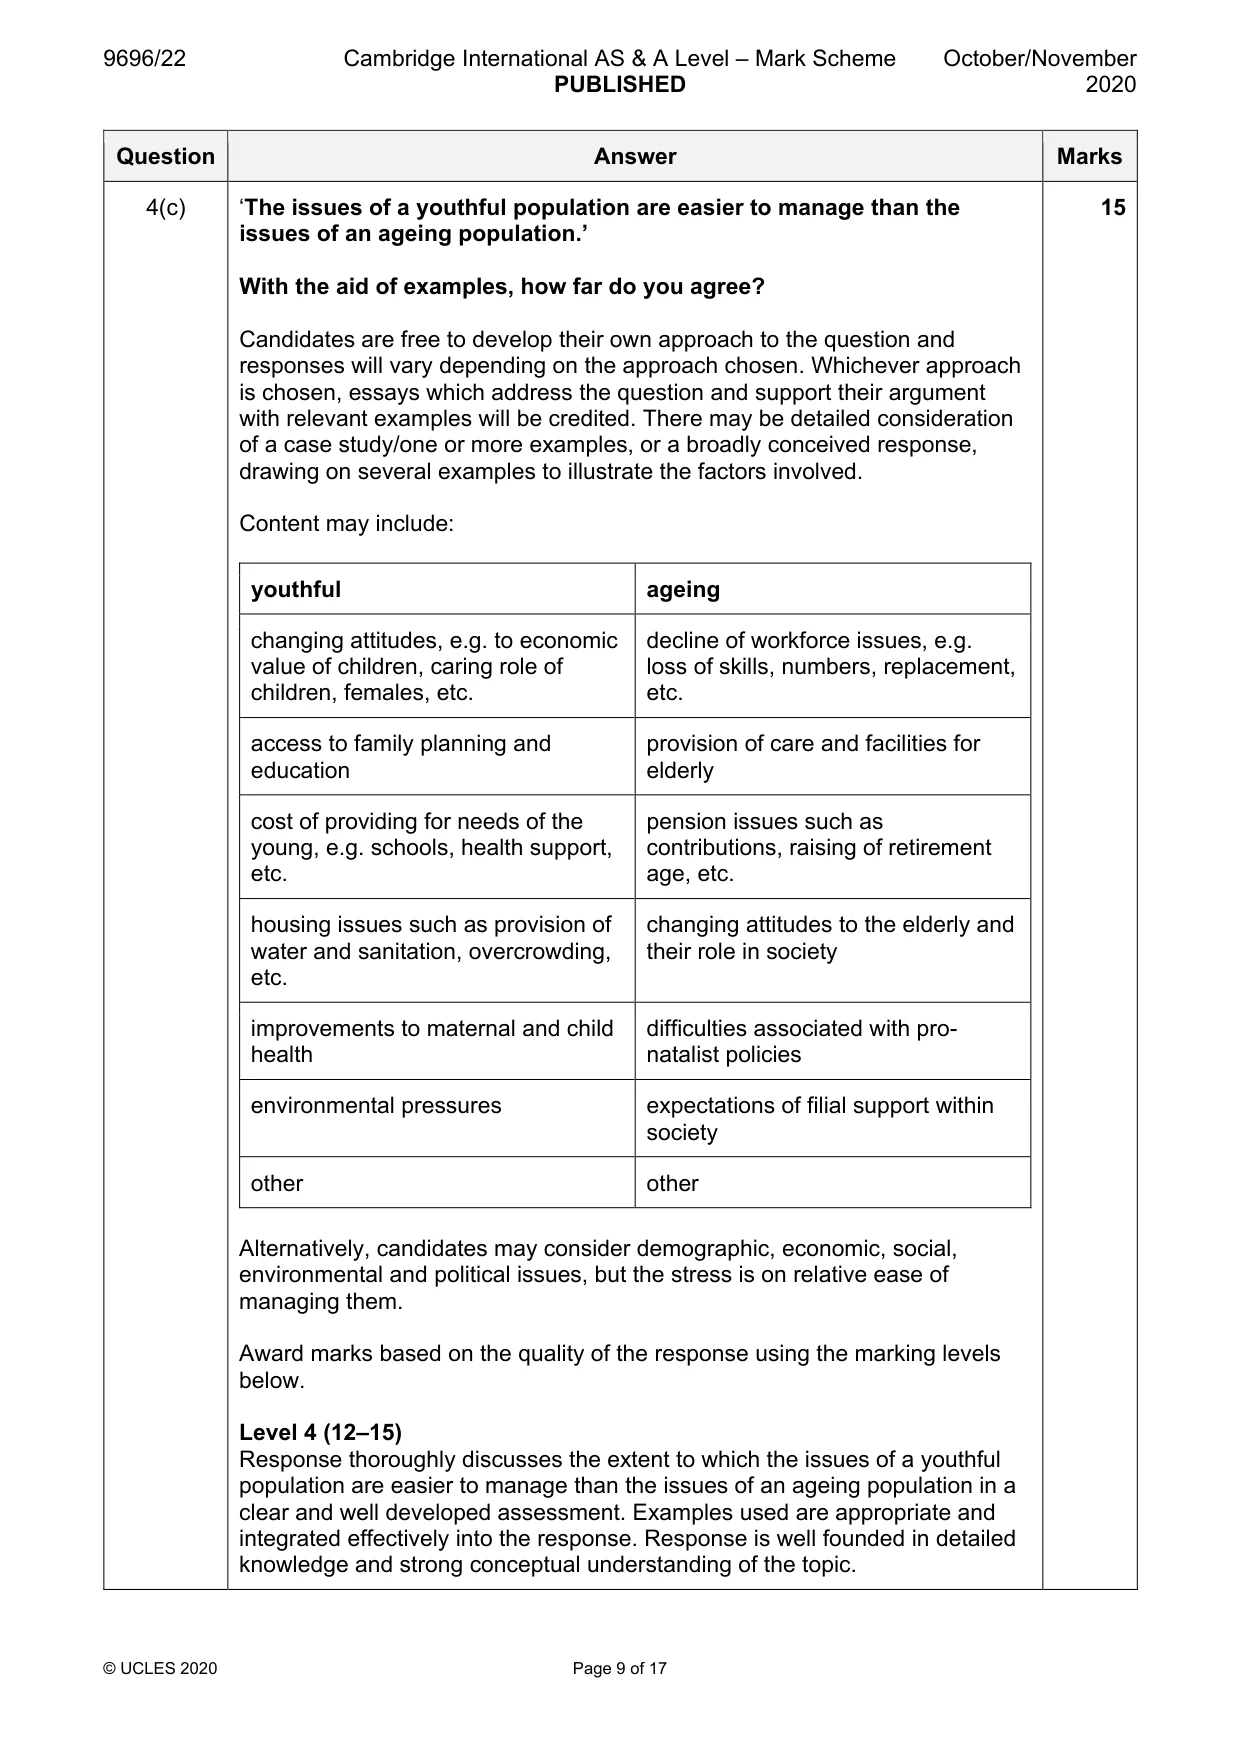
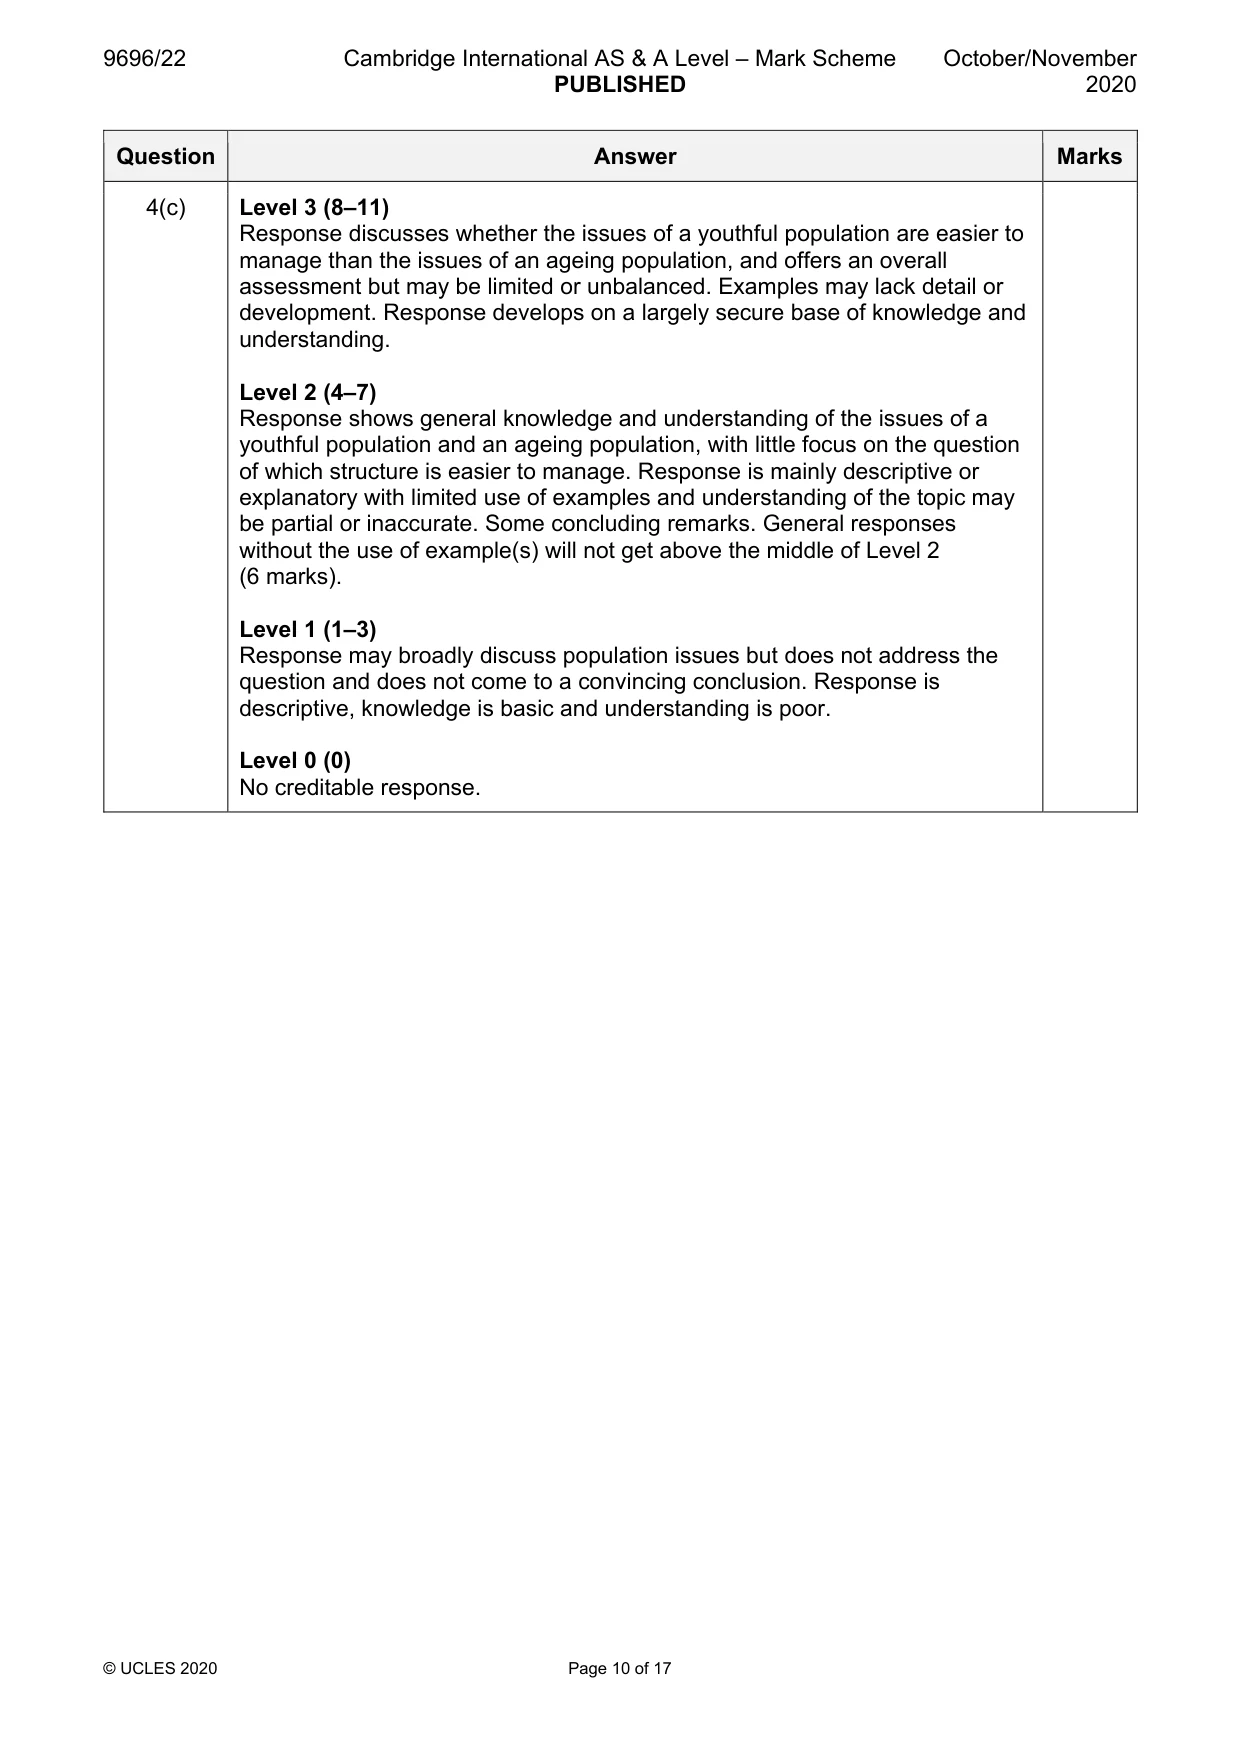
4 (a) (i) Define the term food security. [3] (ii) Suggest two ways in which food security in a country can be threatened. [4] (b) Using examples, explain the roles of technology and innovation in overcoming food shortages. [8] (c) ‘The issues of a youthful population are easier to manage than the issues of an ageing population.’ With the aid of examples, how far do you agree? [15] Migration
Mark scheme: 4(a)(i) Define the term food security. 3 Food security, as defined by the United Nations’ Committee on World Food Security, is the condition in which all people, at all times, have physical, social and economic access to sufficient safe and nutritious food that meets their dietary needs and food preferences for an active and healthy life. Key ideas at 1 mark each include: • access to sufficient quantity • affordability • nutritional value • at all times/all people • an element of future planning • for an active and healthy life 4(a)(ii) Suggest two ways in which food security in a country can be threatened. 4 Reasons should be linked to reduced food security, including: • factors influencing the amount of food produced such as: water shortage caused; climate change land degradation; greedy land acquisitions; change in farming practices, e.g. use of sterile seeds in GM crops as opposed to traditional method of saving own seed; war/natural disaster; disease/pests of crops or animals, etc. • factors influencing the availability of food such as: population growth; changes in dietary demands; rising prices, etc. • problems in food distribution such as: poor transport, poor storage, war, etc. • other Credit a simple reason 1 mark, or for a developed reason 2/3 marks, to the maximum. 4(b) Using examples, explain the roles of technology and innovation in 8 overcoming food shortages. Candidates should use examples to help explain the roles of technology and innovation in overcoming food shortages. Examples may come from any stage of the food cycle: production, storage, processing, transport, availability to consumers. Responses will vary depending on the examples and reasons chosen but credit any valid explanation. The explanation may draw on the following factors: • irrigation and chemical use including issues of precision application and monitoring of needs • improved harvesting and post harvesting management • developments in plant breeding and seed technology • use of information gathering technologies such as sensors, drones or satellite GPS to monitor factors such as: soil conditions, yields, pests, etc. • soil research • hydroponics/vertical farming • improvement in transport/storage/processing • other Max. 3 marks for a generic response without examples. Award marks based on the quality of explanation and breadth of the response using the marking levels below. Level 3 (6–8) Response explains in detail the roles of technology and innovation in overcoming food shortages thoroughly in a clear and focused manner. Response is well founded in detailed knowledge and strong conceptual understanding of the topic. Any examples used are appropriate and integrated effectively into the response. Level 2 (3–5) Response explains the roles of technology and innovation in overcoming food shortages. Response develops on a largely secure base of knowledge and understanding. Examples may lack detail or development. Level 1 (1–2) Response comprises one or more points about overcoming food shortages which may not be carefully focused on the roles of technology and/or innovation. Knowledge is basic and understanding may be inaccurate. Examples are in name only or lacking entirely. Level 0 (0) No creditable response. 4(c) ‘The issues of a youthful population are easier to manage than the 15 issues of an ageing population.’ With the aid of examples, how far do you agree? Candidates are free to develop their own approach to the question and responses will vary depending on the approach chosen. Whichever approach is chosen, essays which address the question and support their argument with relevant examples will be credited. There may be detailed consideration of a case study/one or more examples, or a broadly conceived response, drawing on several examples to illustrate the factors involved. Content may include: youthful ageing changing attitudes, e.g. to economic decline of workforce issues, e.g. value of children, caring role of loss of skills, numbers, replacement, children, females, etc. etc. access to family planning and provision of care and facilities for education elderly cost of providing for needs of the pension issues such as young, e.g. schools, health support, contributions, raising of retirement etc. age, etc. housing issues such as provision of changing attitudes to the elderly and water and sanitation, overcrowding, their role in society etc. improvements to maternal and child difficulties associated with pro- health natalist policies environmental pressures expectations of filial support within society other other Alternatively, candidates may consider demographic, economic, social, environmental and political issues, but the stress is on relative ease of managing them. Award marks based on the quality of the response using the marking levels below. Level 4 (12–15) Response thoroughly discusses the extent to which the issues of a youthful population are easier to manage than the issues of an ageing population in a clear and well developed assessment. Examples used are appropriate and integrated effectively into the response. Response is well founded in detailed knowledge and strong conceptual understanding of the topic. 4(c) Level 3 (8–11) Response discusses whether the issues of a youthful population are easier to manage than the issues of an ageing population, and offers an overall assessment but may be limited or unbalanced. Examples may lack detail or development. Response develops on a largely secure base of knowledge and understanding. Level 2 (4–7) Response shows general knowledge and understanding of the issues of a youthful population and an ageing population, with little focus on the question of which structure is easier to manage. Response is mainly descriptive or explanatory with limited use of examples and understanding of the topic may be partial or inaccurate. Some concluding remarks. General responses without the use of example(s) will not get above the middle of Level 2 (6 marks). Level 1 (1–3) Response may broadly discuss population issues but does not address the question and does not come to a convincing conclusion. Response is descriptive, knowledge is basic and understanding is poor. Level 0 (0) No creditable response. Migration
Q5 · Describe the impacts of rural-urban migration on rural areas
5 (a) Describe the impacts of rural-urban migration on rural areas. [7] (b) With the aid of examples, explain the role of push factors in rural-urban migration. [8] (c) Assess the extent to which distance influences patterns of international migration. [15] Settlement dynamics
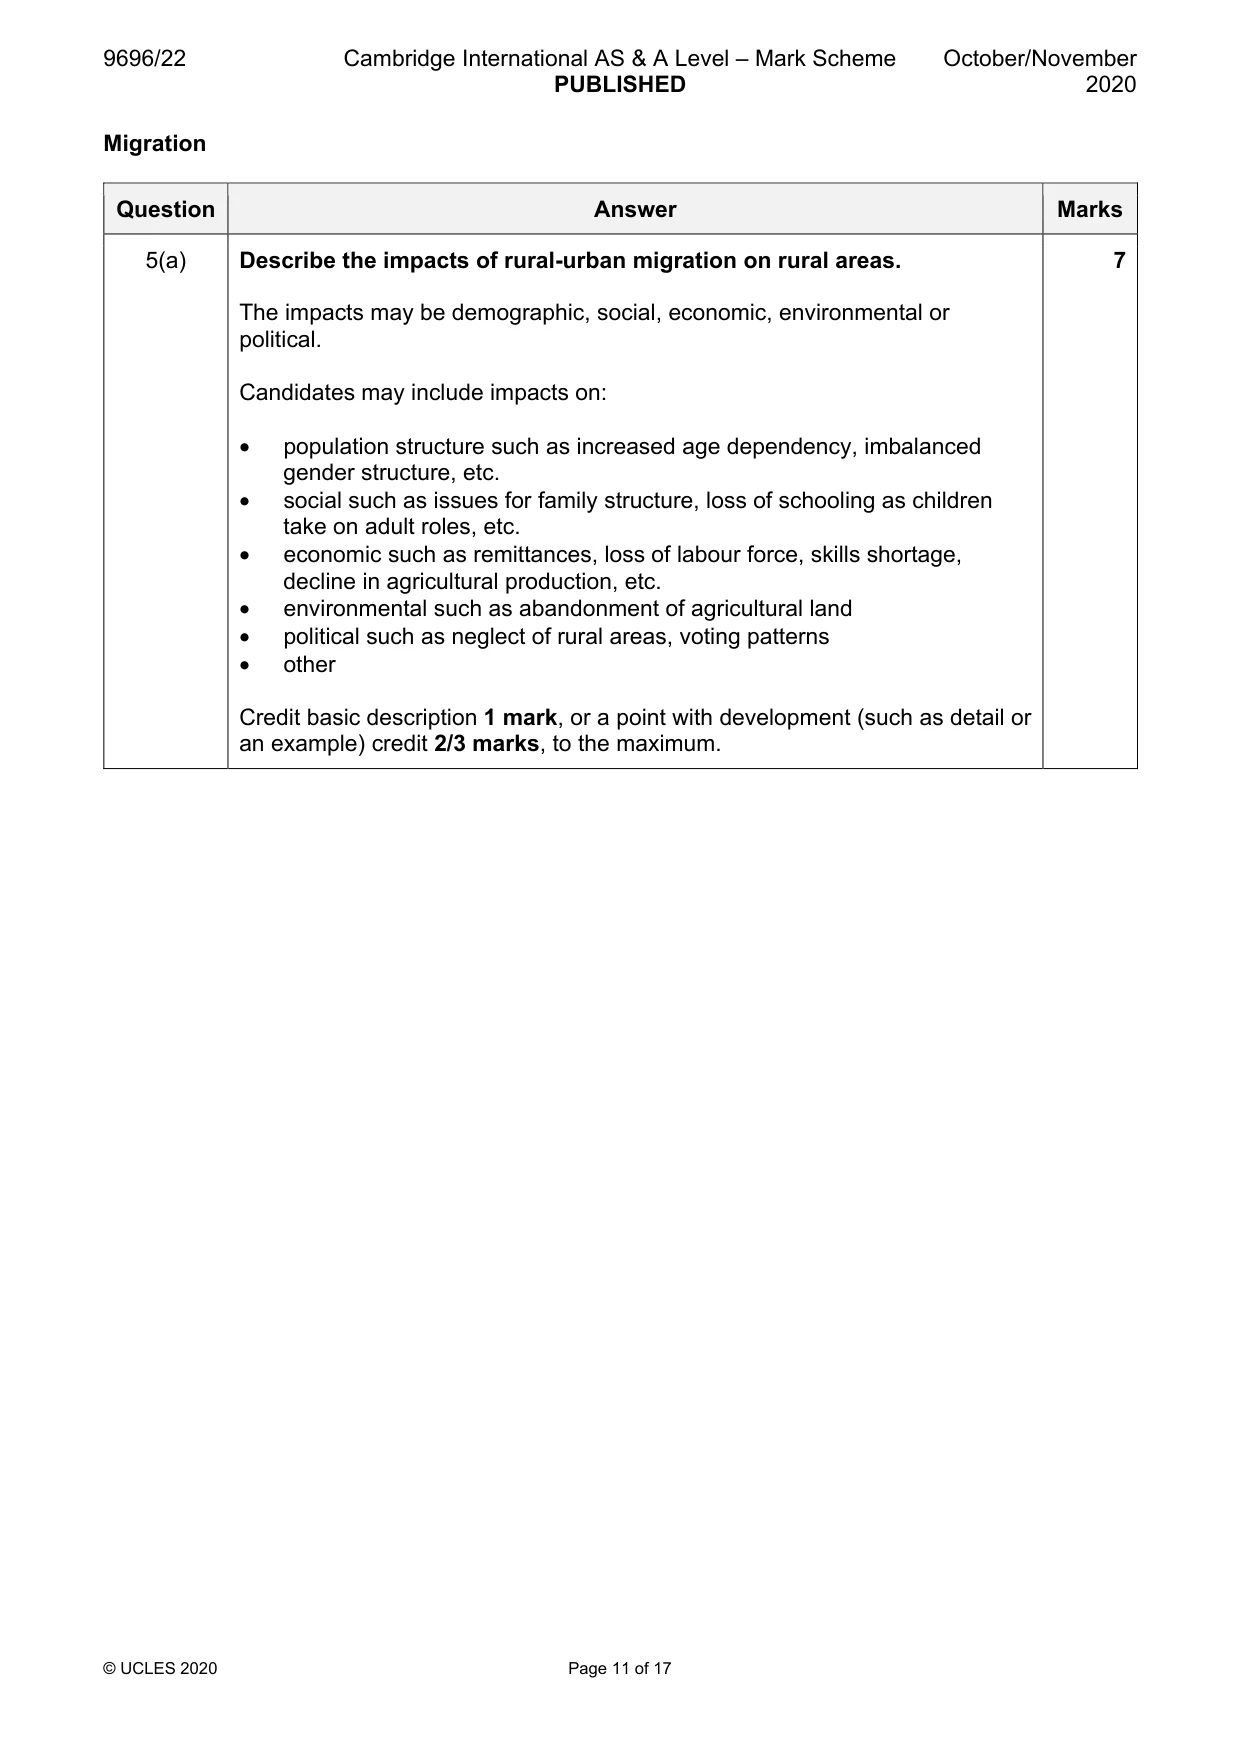
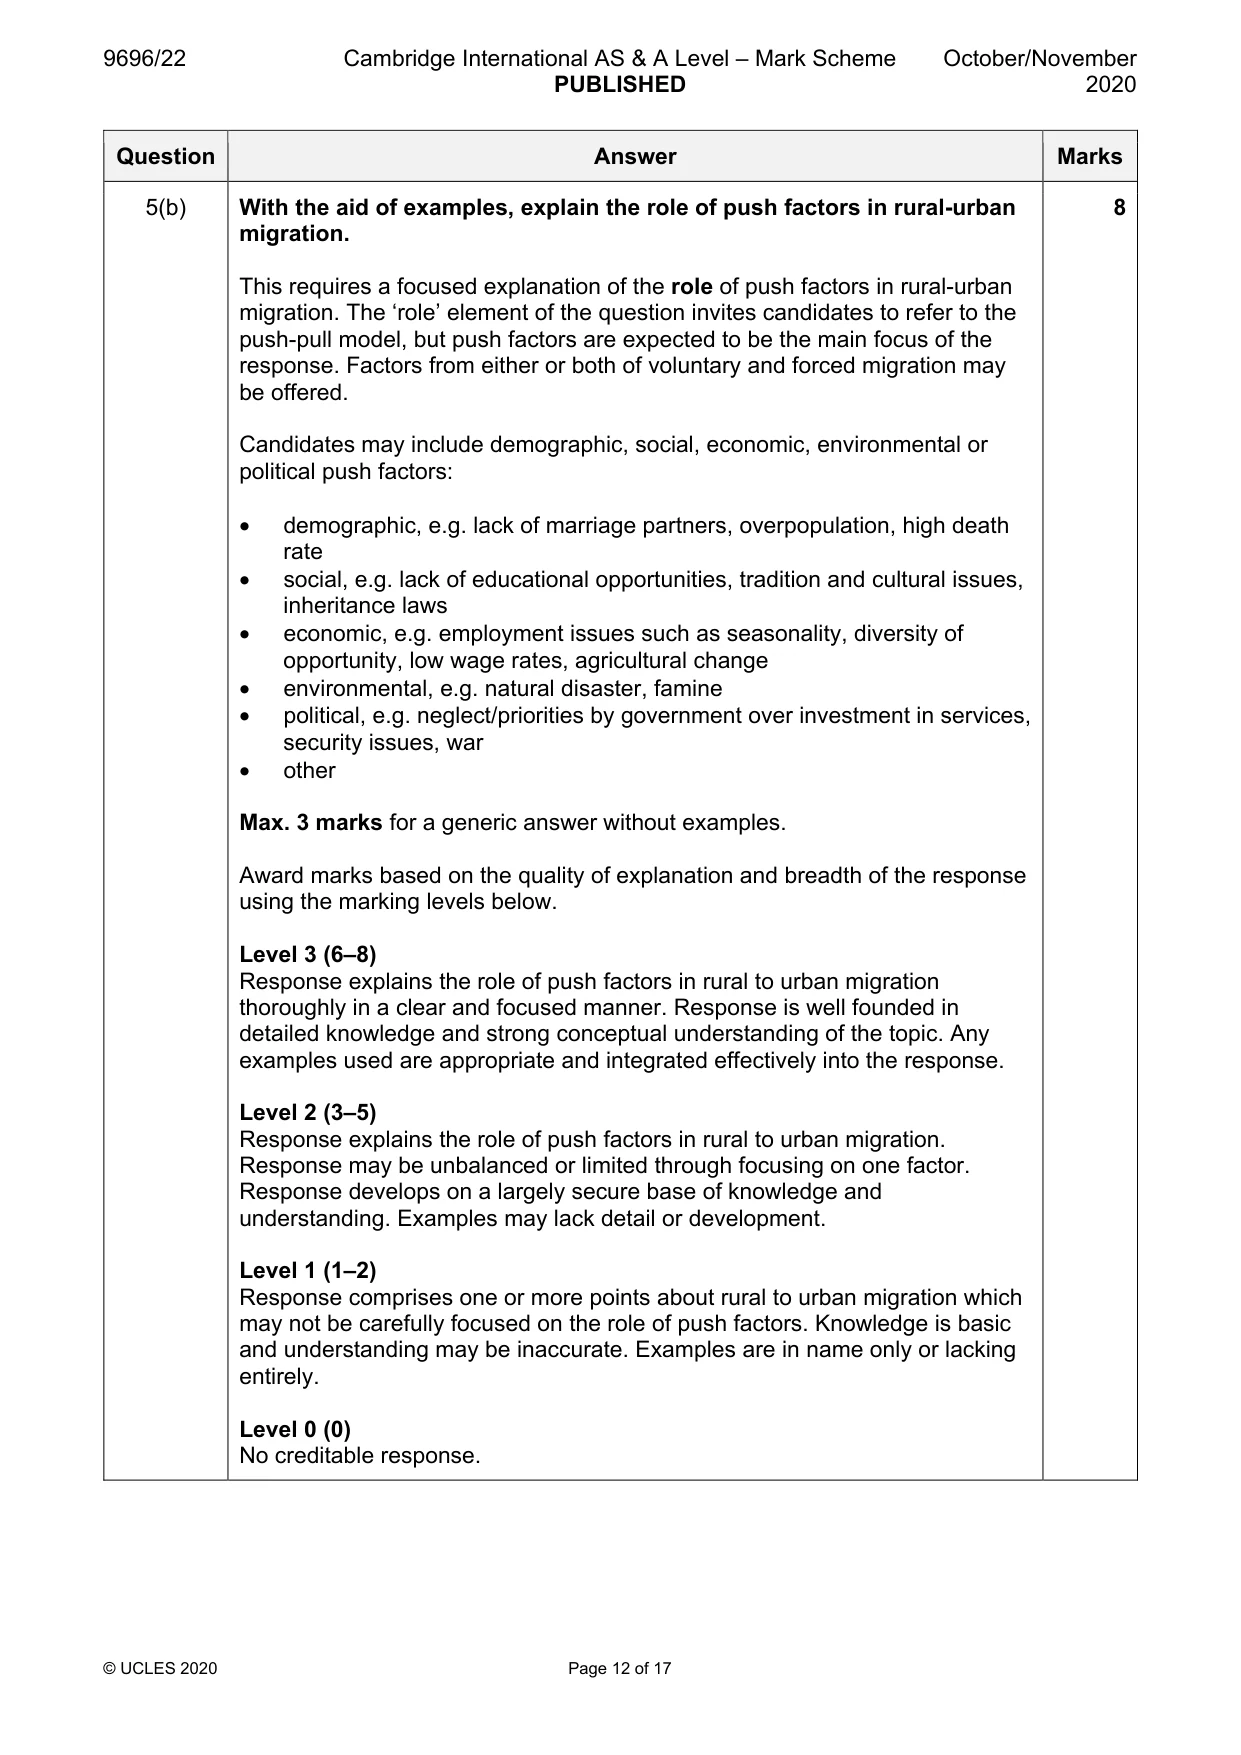
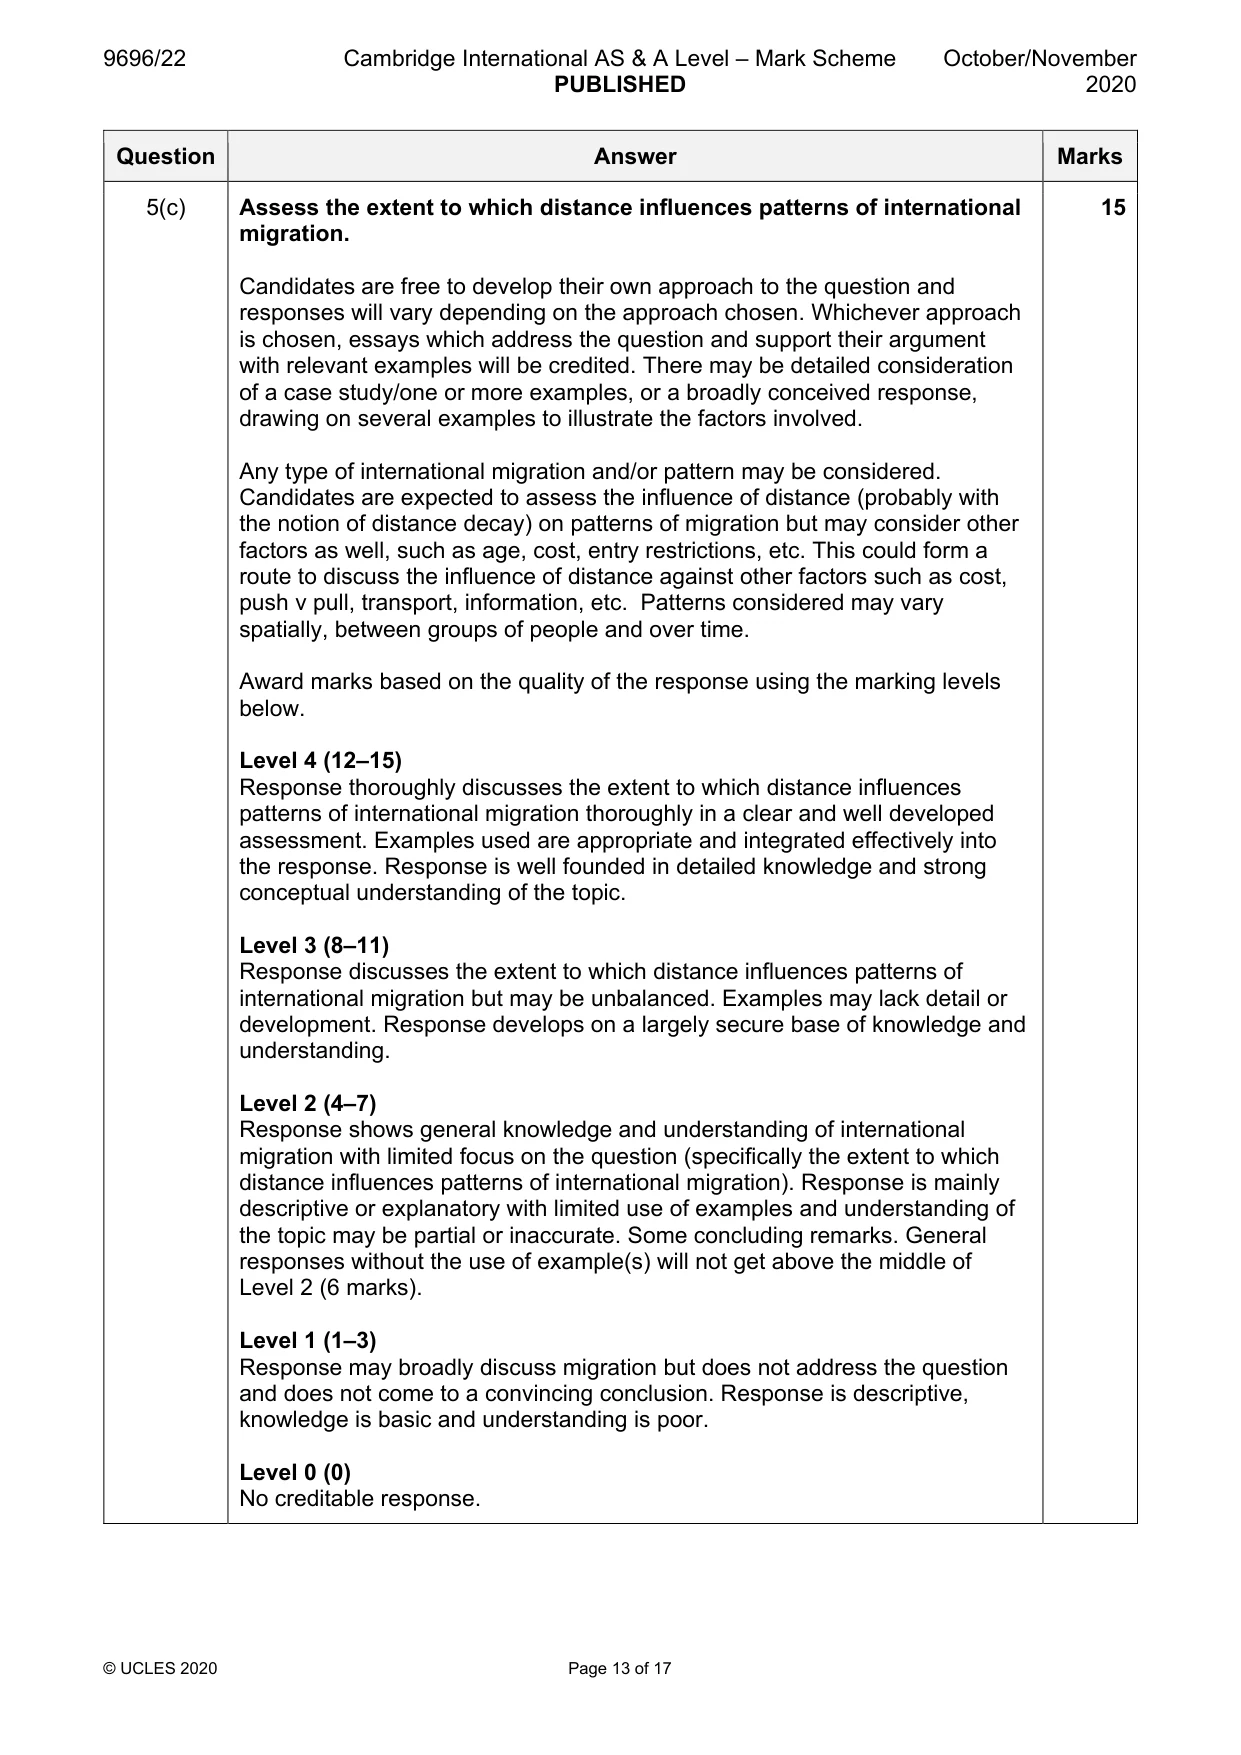
Mark scheme: 5(a) Describe the impacts of rural-urban migration on rural areas. 7 The impacts may be demographic, social, economic, environmental or political. Candidates may include impacts on: • population structure such as increased age dependency, imbalanced gender structure, etc. • social such as issues for family structure, loss of schooling as children take on adult roles, etc. • economic such as remittances, loss of labour force, skills shortage, decline in agricultural production, etc. • environmental such as abandonment of agricultural land • political such as neglect of rural areas, voting patterns • other Credit basic description 1 mark, or a point with development (such as detail or an example) credit 2/3 marks, to the maximum. 5(b) With the aid of examples, explain the role of push factors in rural-urban 8 migration. This requires a focused explanation of the role of push factors in rural-urban migration. The ‘role’ element of the question invites candidates to refer to the push-pull model, but push factors are expected to be the main focus of the response. Factors from either or both of voluntary and forced migration may be offered. Candidates may include demographic, social, economic, environmental or political push factors: • demographic, e.g. lack of marriage partners, overpopulation, high death rate • social, e.g. lack of educational opportunities, tradition and cultural issues, inheritance laws • economic, e.g. employment issues such as seasonality, diversity of opportunity, low wage rates, agricultural change • environmental, e.g. natural disaster, famine • political, e.g. neglect/priorities by government over investment in services, security issues, war • other Max. 3 marks for a generic answer without examples. Award marks based on the quality of explanation and breadth of the response using the marking levels below. Level 3 (6–8) Response explains the role of push factors in rural to urban migration thoroughly in a clear and focused manner. Response is well founded in detailed knowledge and strong conceptual understanding of the topic. Any examples used are appropriate and integrated effectively into the response. Level 2 (3–5) Response explains the role of push factors in rural to urban migration. Response may be unbalanced or limited through focusing on one factor. Response develops on a largely secure base of knowledge and understanding. Examples may lack detail or development. Level 1 (1–2) Response comprises one or more points about rural to urban migration which may not be carefully focused on the role of push factors. Knowledge is basic and understanding may be inaccurate. Examples are in name only or lacking entirely. Level 0 (0) No creditable response. 5(c) Assess the extent to which distance influences patterns of international 15 migration. Candidates are free to develop their own approach to the question and responses will vary depending on the approach chosen. Whichever approach is chosen, essays which address the question and support their argument with relevant examples will be credited. There may be detailed consideration of a case study/one or more examples, or a broadly conceived response, drawing on several examples to illustrate the factors involved. Any type of international migration and/or pattern may be considered. Candidates are expected to assess the influence of distance (probably with the notion of distance decay) on patterns of migration but may consider other factors as well, such as age, cost, entry restrictions, etc. This could form a route to discuss the influence of distance against other factors such as cost, push v pull, transport, information, etc. Patterns considered may vary spatially, between groups of people and over time. Award marks based on the quality of the response using the marking levels below. Level 4 (12–15) Response thoroughly discusses the extent to which distance influences patterns of international migration thoroughly in a clear and well developed assessment. Examples used are appropriate and integrated effectively into the response. Response is well founded in detailed knowledge and strong conceptual understanding of the topic. Level 3 (8–11) Response discusses the extent to which distance influences patterns of international migration but may be unbalanced. Examples may lack detail or development. Response develops on a largely secure base of knowledge and understanding. Level 2 (4–7) Response shows general knowledge and understanding of international migration with limited focus on the question (specifically the extent to which distance influences patterns of international migration). Response is mainly descriptive or explanatory with limited use of examples and understanding of the topic may be partial or inaccurate. Some concluding remarks. General responses without the use of example(s) will not get above the middle of Level 2 (6 marks). Level 1 (1–3) Response may broadly discuss migration but does not address the question and does not come to a convincing conclusion. Response is descriptive, knowledge is basic and understanding is poor. Level 0 (0) No creditable response. Settlement dynamics
Q6 · Compare the process of counterurbanisation with the process of re-urbanisation
6 (a) Compare the process of counterurbanisation with the process of re-urbanisation. [7] (b) Explain the impacts of counterurbanisation on the competition for land in urban and nearby rural areas in HICs. [8] (c) ‘Residential segregation in urban settlements in HICs is caused by economic factors.’ With the aid of examples, how far do you agree? [15]
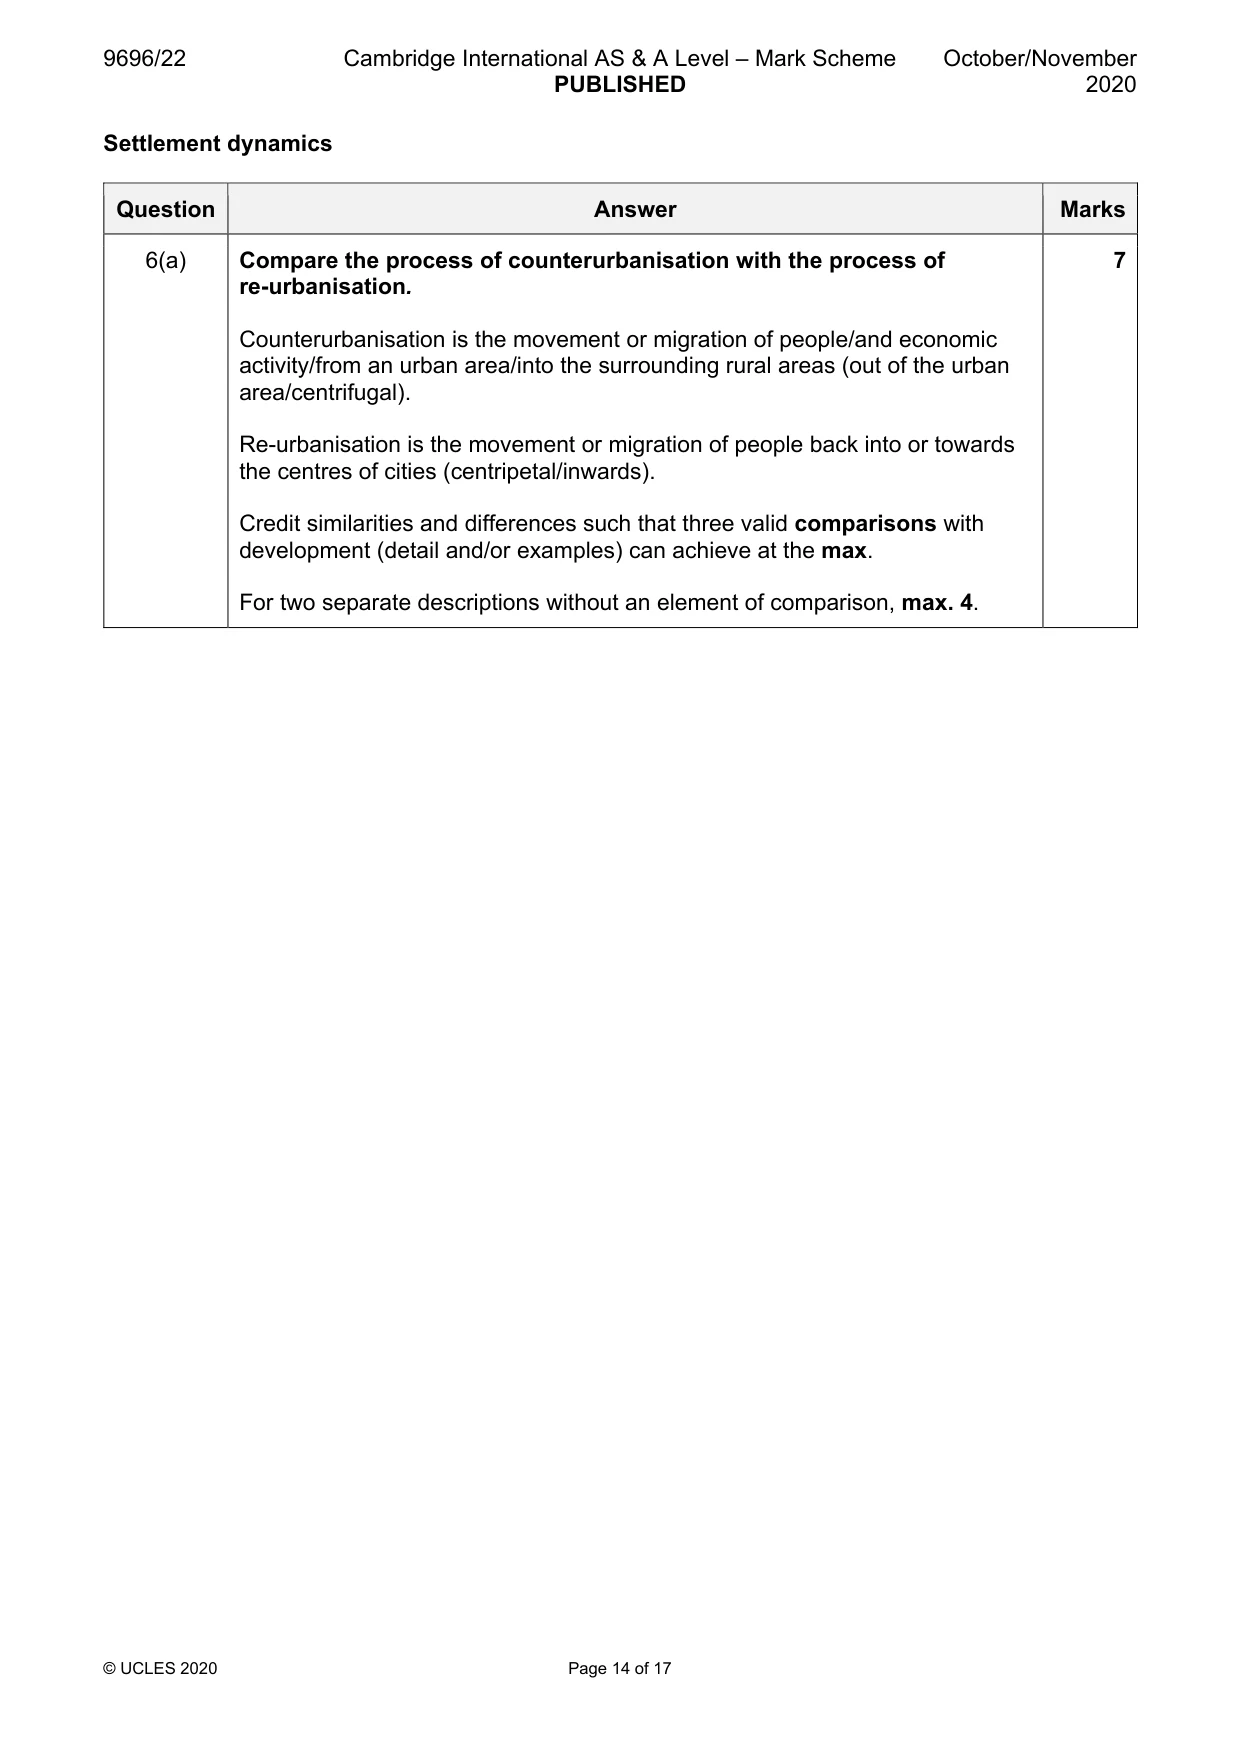
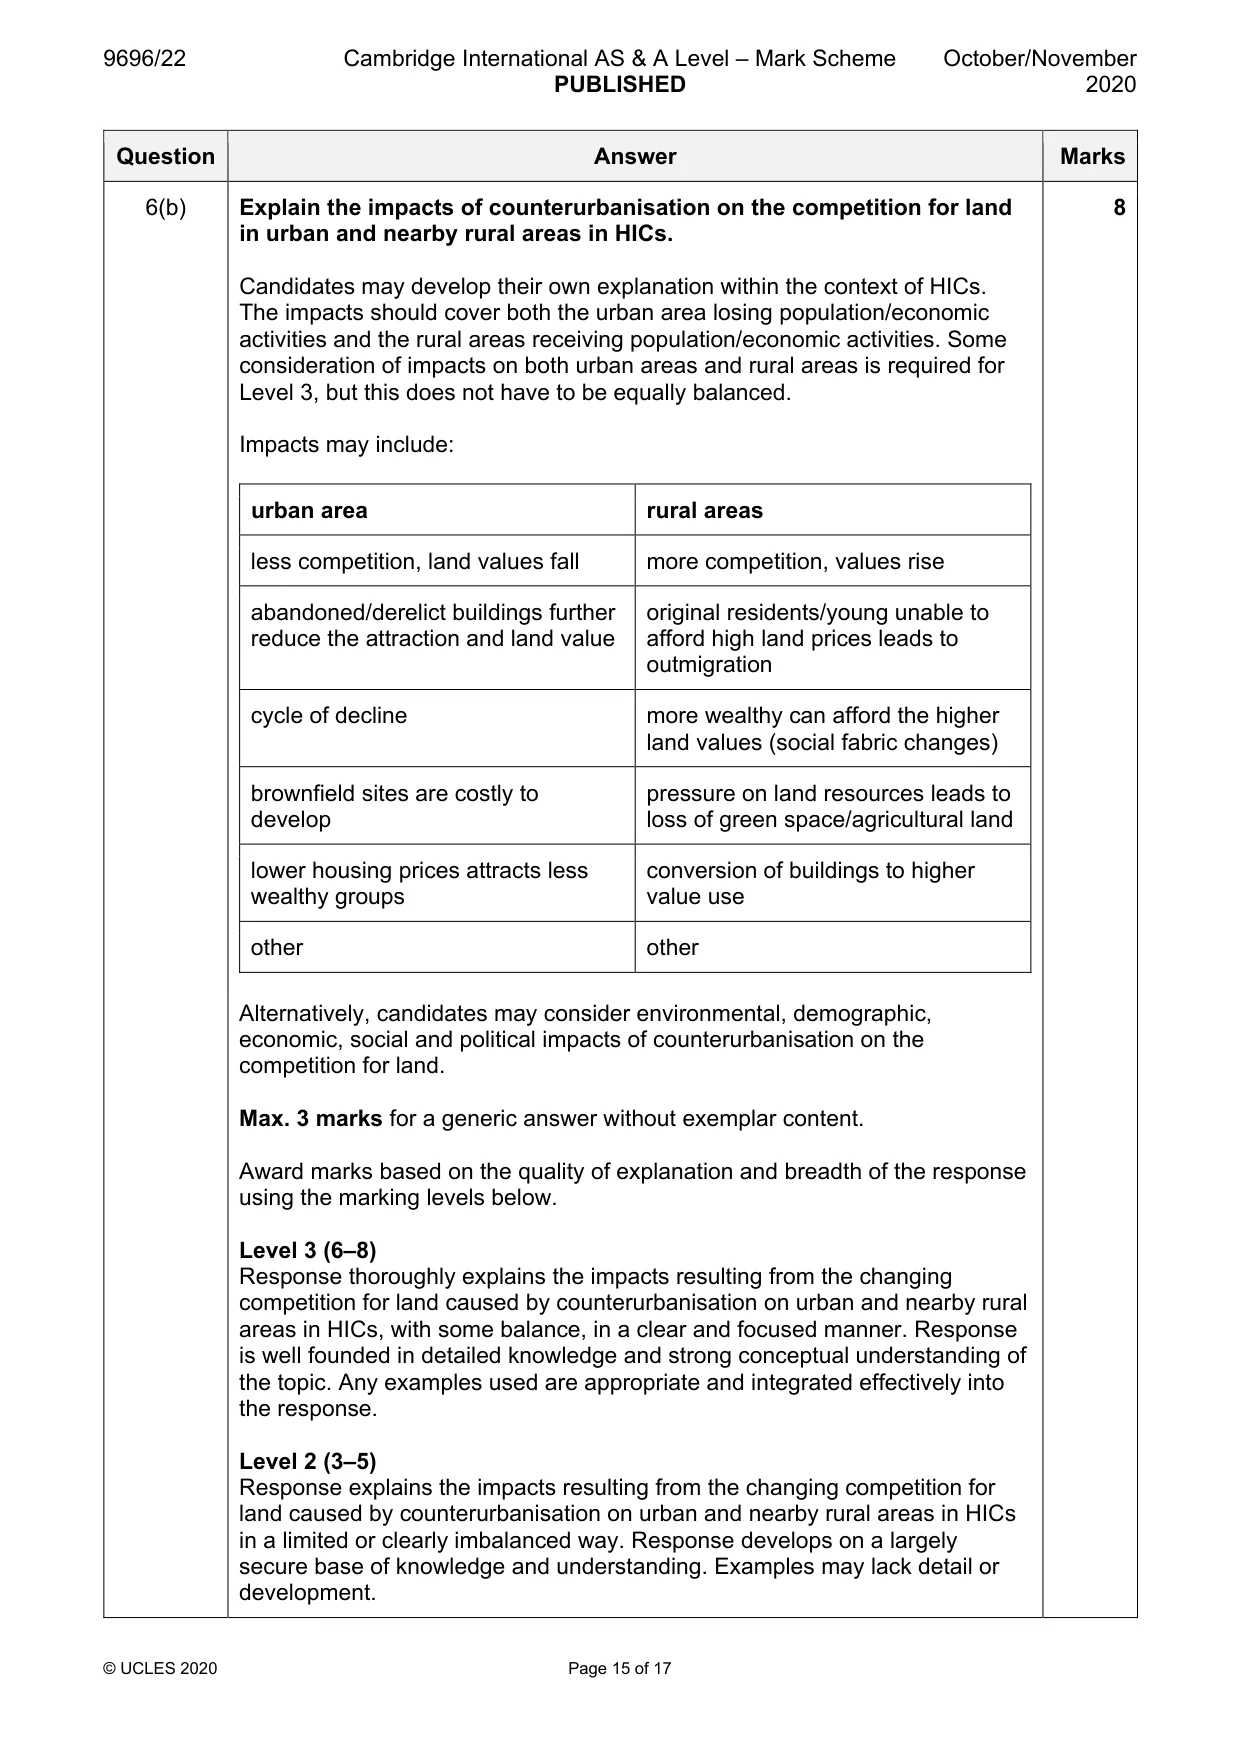
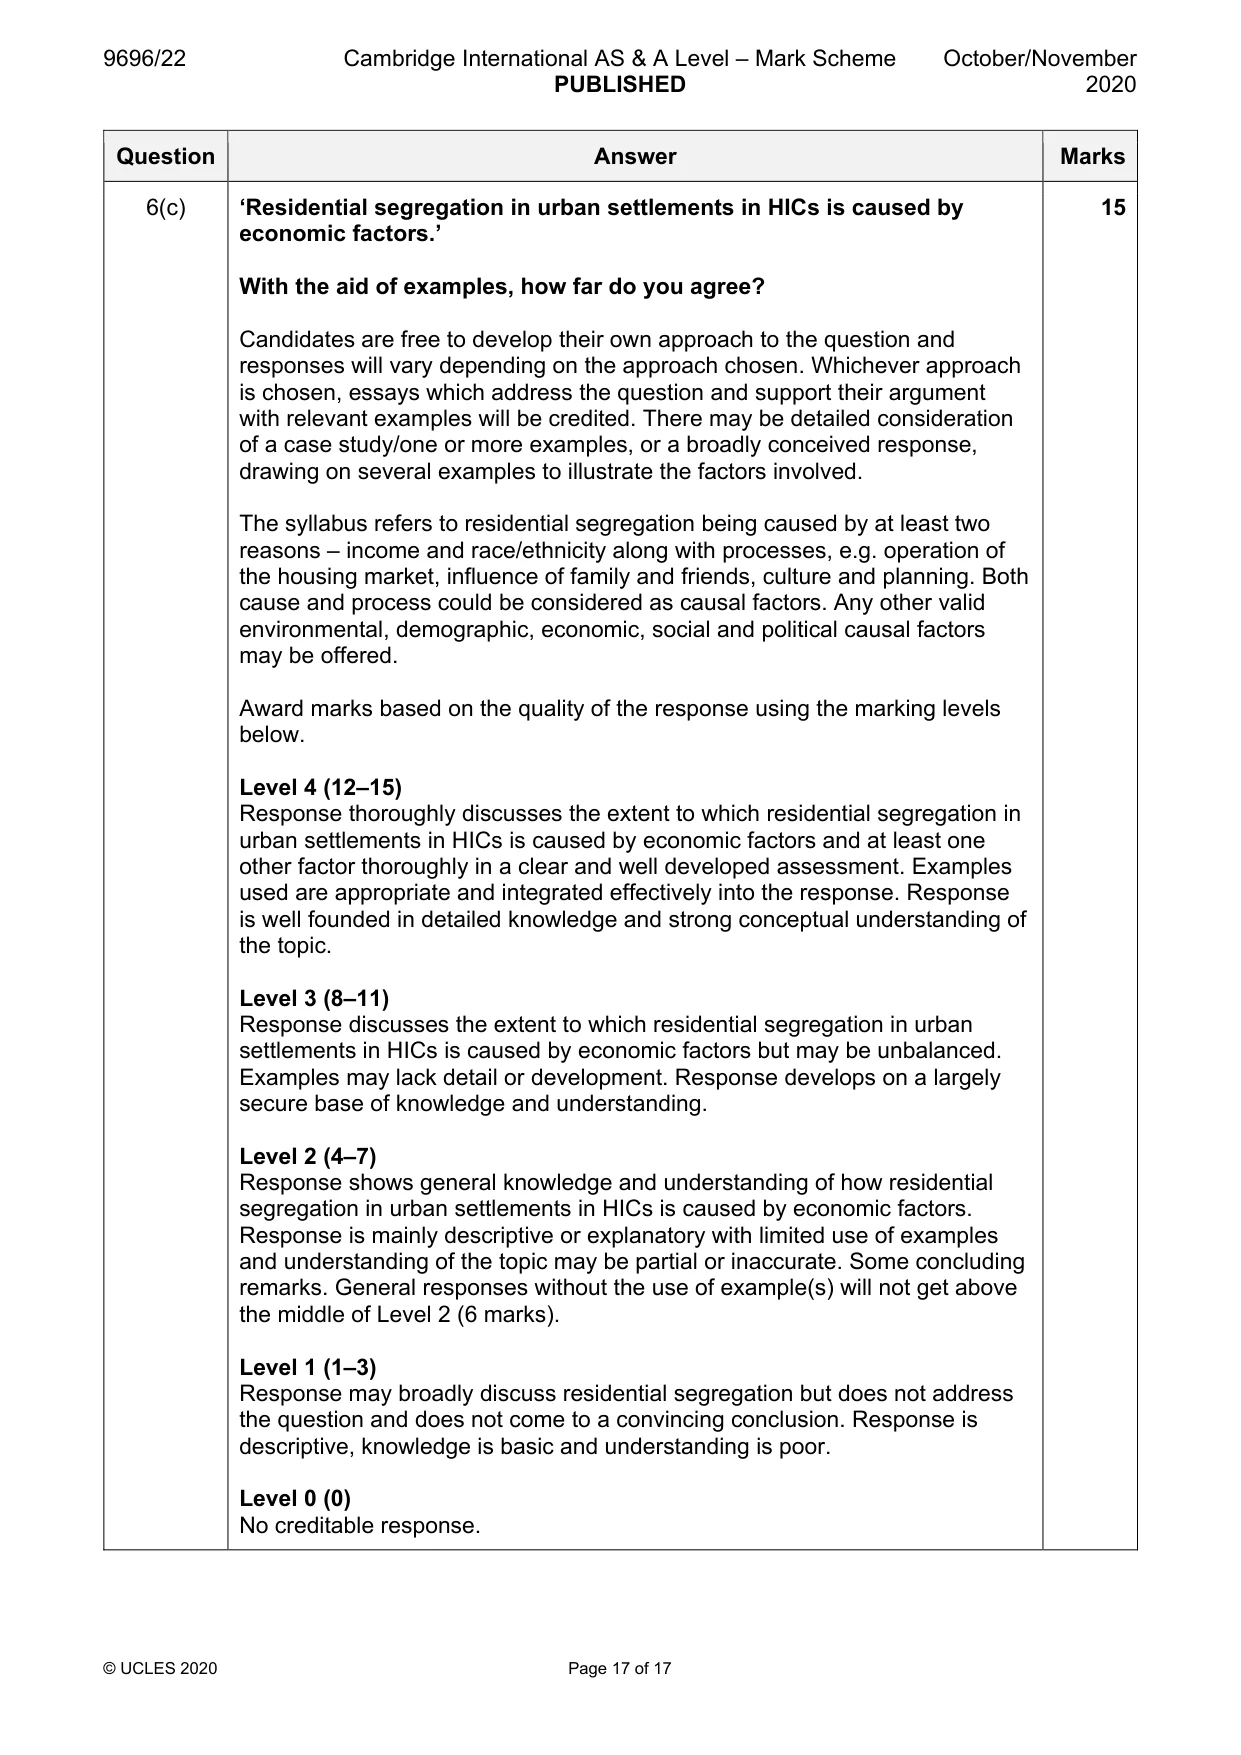
Mark scheme: 6(a) Compare the process of counterurbanisation with the process of 7 re-urbanisation. Counterurbanisation is the movement or migration of people/and economic activity/from an urban area/into the surrounding rural areas (out of the urban area/centrifugal). Re-urbanisation is the movement or migration of people back into or towards the centres of cities (centripetal/inwards). Credit similarities and differences such that three valid comparisons with development (detail and/or examples) can achieve at the max. For two separate descriptions without an element of comparison, max. 4. 6(b) Explain the impacts of counterurbanisation on the competition for land 8 in urban and nearby rural areas in HICs. Candidates may develop their own explanation within the context of HICs. The impacts should cover both the urban area losing population/economic activities and the rural areas receiving population/economic activities. Some consideration of impacts on both urban areas and rural areas is required for Level 3, but this does not have to be equally balanced. Impacts may include: urban area rural areas less competition, land values fall more competition, values rise abandoned/derelict buildings further original residents/young unable to reduce the attraction and land value afford high land prices leads to outmigration cycle of decline more wealthy can afford the higher land values (social fabric changes) brownfield sites are costly to pressure on land resources leads to develop loss of green space/agricultural land lower housing prices attracts less conversion of buildings to higher wealthy groups value use other other Alternatively, candidates may consider environmental, demographic, economic, social and political impacts of counterurbanisation on the competition for land. Max. 3 marks for a generic answer without exemplar content. Award marks based on the quality of explanation and breadth of the response using the marking levels below. Level 3 (6–8) Response thoroughly explains the impacts resulting from the changing competition for land caused by counterurbanisation on urban and nearby rural areas in HICs, with some balance, in a clear and focused manner. Response is well founded in detailed knowledge and strong conceptual understanding of the topic. Any examples used are appropriate and integrated effectively into the response. Level 2 (3–5) Response explains the impacts resulting from the changing competition for land caused by counterurbanisation on urban and nearby rural areas in HICs in a limited or clearly imbalanced way. Response develops on a largely secure base of knowledge and understanding. Examples may lack detail or development. 6(b) Level 1 (1–2) Response comprises one or more points about counterurbanisation which may not be carefully focused on the impacts resulting from the changing competition for land on urban and/or nearby rural areas in HICs. Knowledge is basic and understanding may be inaccurate. Examples are in name only or lacking entirely. Level 0 (0) No creditable response. 6(c) ‘Residential segregation in urban settlements in HICs is caused by 15 economic factors.’ With the aid of examples, how far do you agree? Candidates are free to develop their own approach to the question and responses will vary depending on the approach chosen. Whichever approach is chosen, essays which address the question and support their argument with relevant examples will be credited. There may be detailed consideration of a case study/one or more examples, or a broadly conceived response, drawing on several examples to illustrate the factors involved. The syllabus refers to residential segregation being caused by at least two reasons – income and race/ethnicity along with processes, e.g. operation of the housing market, influence of family and friends, culture and planning. Both cause and process could be considered as causal factors. Any other valid environmental, demographic, economic, social and political causal factors may be offered. Award marks based on the quality of the response using the marking levels below. Level 4 (12–15) Response thoroughly discusses the extent to which residential segregation in urban settlements in HICs is caused by economic factors and at least one other factor thoroughly in a clear and well developed assessment. Examples used are appropriate and integrated effectively into the response. Response is well founded in detailed knowledge and strong conceptual understanding of the topic. Level 3 (8–11) Response discusses the extent to which residential segregation in urban settlements in HICs is caused by economic factors but may be unbalanced. Examples may lack detail or development. Response develops on a largely secure base of knowledge and understanding. Level 2 (4–7) Response shows general knowledge and understanding of how residential segregation in urban settlements in HICs is caused by economic factors. Response is mainly descriptive or explanatory with limited use of examples and understanding of the topic may be partial or inaccurate. Some concluding remarks. General responses without the use of example(s) will not get above the middle of Level 2 (6 marks). Level 1 (1–3) Response may broadly discuss residential segregation but does not address the question and does not come to a convincing conclusion. Response is descriptive, knowledge is basic and understanding is poor. Level 0 (0) No creditable response.
What was in this paper
The subtopics covered by these 6 questions, and how many questions each got. Open one in a new tab to see every Cambridge question on it.
What you needed in this session
Cambridge’s own grade thresholds for 2020 Oct/Nov, Paper 2 · Variant 2. A higher threshold means an easier paper — the bar moves with how the cohort did.