Cambridge A Level Geography 9696 — 2019 Oct/Nov Paper 2 · Variant 1
9696/21/O/N/19 · 6 questions · 60 marks · ≈68 min
The question paper and its mark scheme, free to read here and free to download. This is Cambridge’s own paper, exactly as it was sat.
Question paper4 pages

Mark scheme15 pages
Answers below. Sit the paper first if you are practising.

Questions as text
Q1 · Dependency ratios in Southeast Asia, 1980–2030
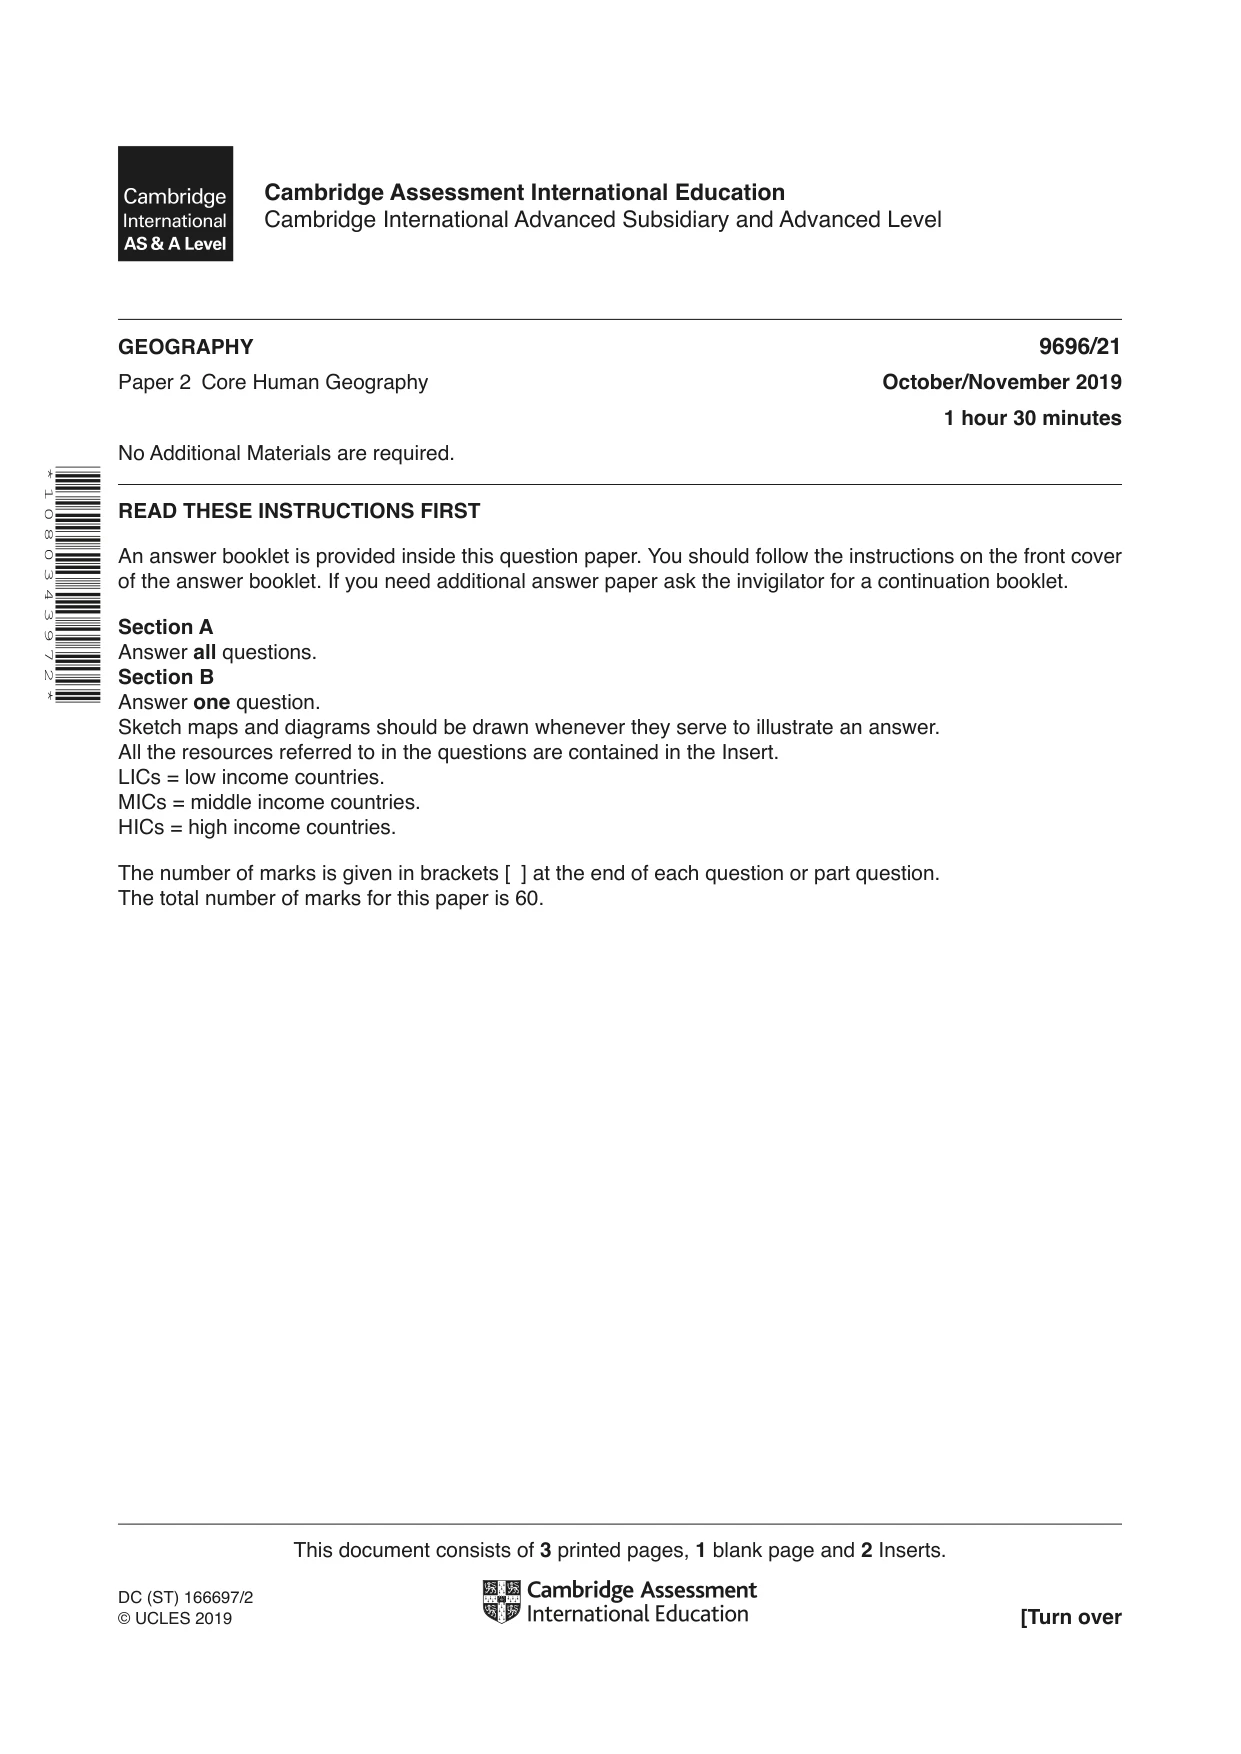
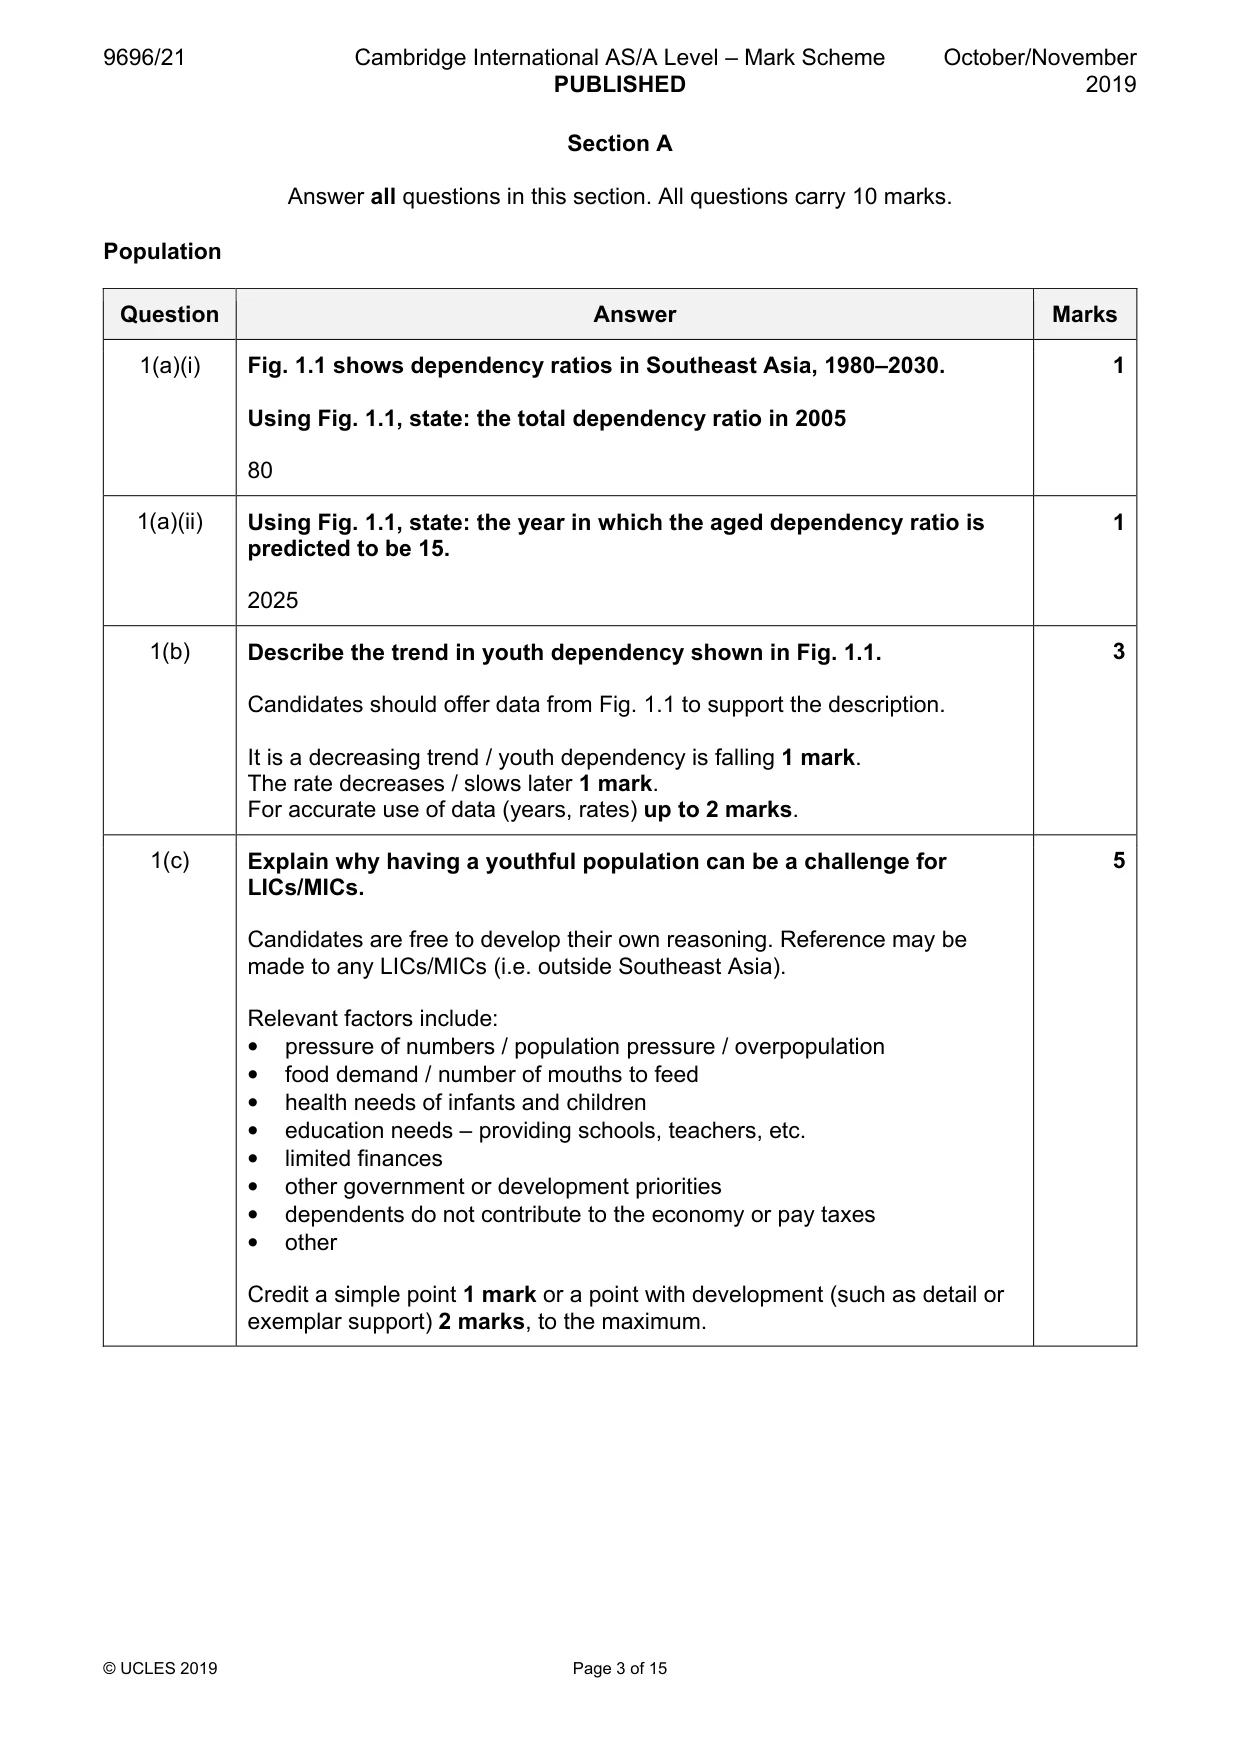
1 Fig. 1.1 shows dependency ratios in Southeast Asia, 1980–2030. (a) Using Fig. 1.1, state: (i) the total dependency ratio in 2005 [1] (ii) the year in which the aged dependency ratio is predicted to be 15. [1] (b) Describe the trend in youth dependency shown in Fig. 1.1. [3] (c) Explain why having a youthful population can be a challenge for LICs/MICs. [5] [Total: 10] Migration/Settlement dynamics
Mark scheme: Question Answer Marks 1(a)(i) Fig. 1.1 shows dependency ratios in Southeast Asia, 1980–2030. 1 Using Fig. 1.1, state: the total dependency ratio in 2005 80 1(a)(ii) Using Fig. 1.1, state: the year in which the aged dependency ratio is 1 predicted to be 15. 2025 1(b) Describe the trend in youth dependency shown in Fig. 1.1. 3 Candidates should offer data from Fig. 1.1 to support the description. It is a decreasing trend / youth dependency is falling 1 mark. The rate decreases / slows later 1 mark. For accurate use of data (years, rates) up to 2 marks. 1(c) Explain why having a youthful population can be a challenge for 5 LICs/MICs. Candidates are free to develop their own reasoning. Reference may be made to any LICs/MICs (i.e. outside Southeast Asia). Relevant factors include: • pressure of numbers / population pressure / overpopulation • food demand / number of mouths to feed • health needs of infants and children • education needs – providing schools, teachers, etc. • limited finances • other government or development priorities • dependents do not contribute to the economy or pay taxes • other Credit a simple point 1 mark or a point with development (such as detail or exemplar support) 2 marks, to the maximum. Migration/Settlement dynamics
Q2 · Impacts of remittances from rural-urban migrants on Imo and Abia, two states in Nigeria…
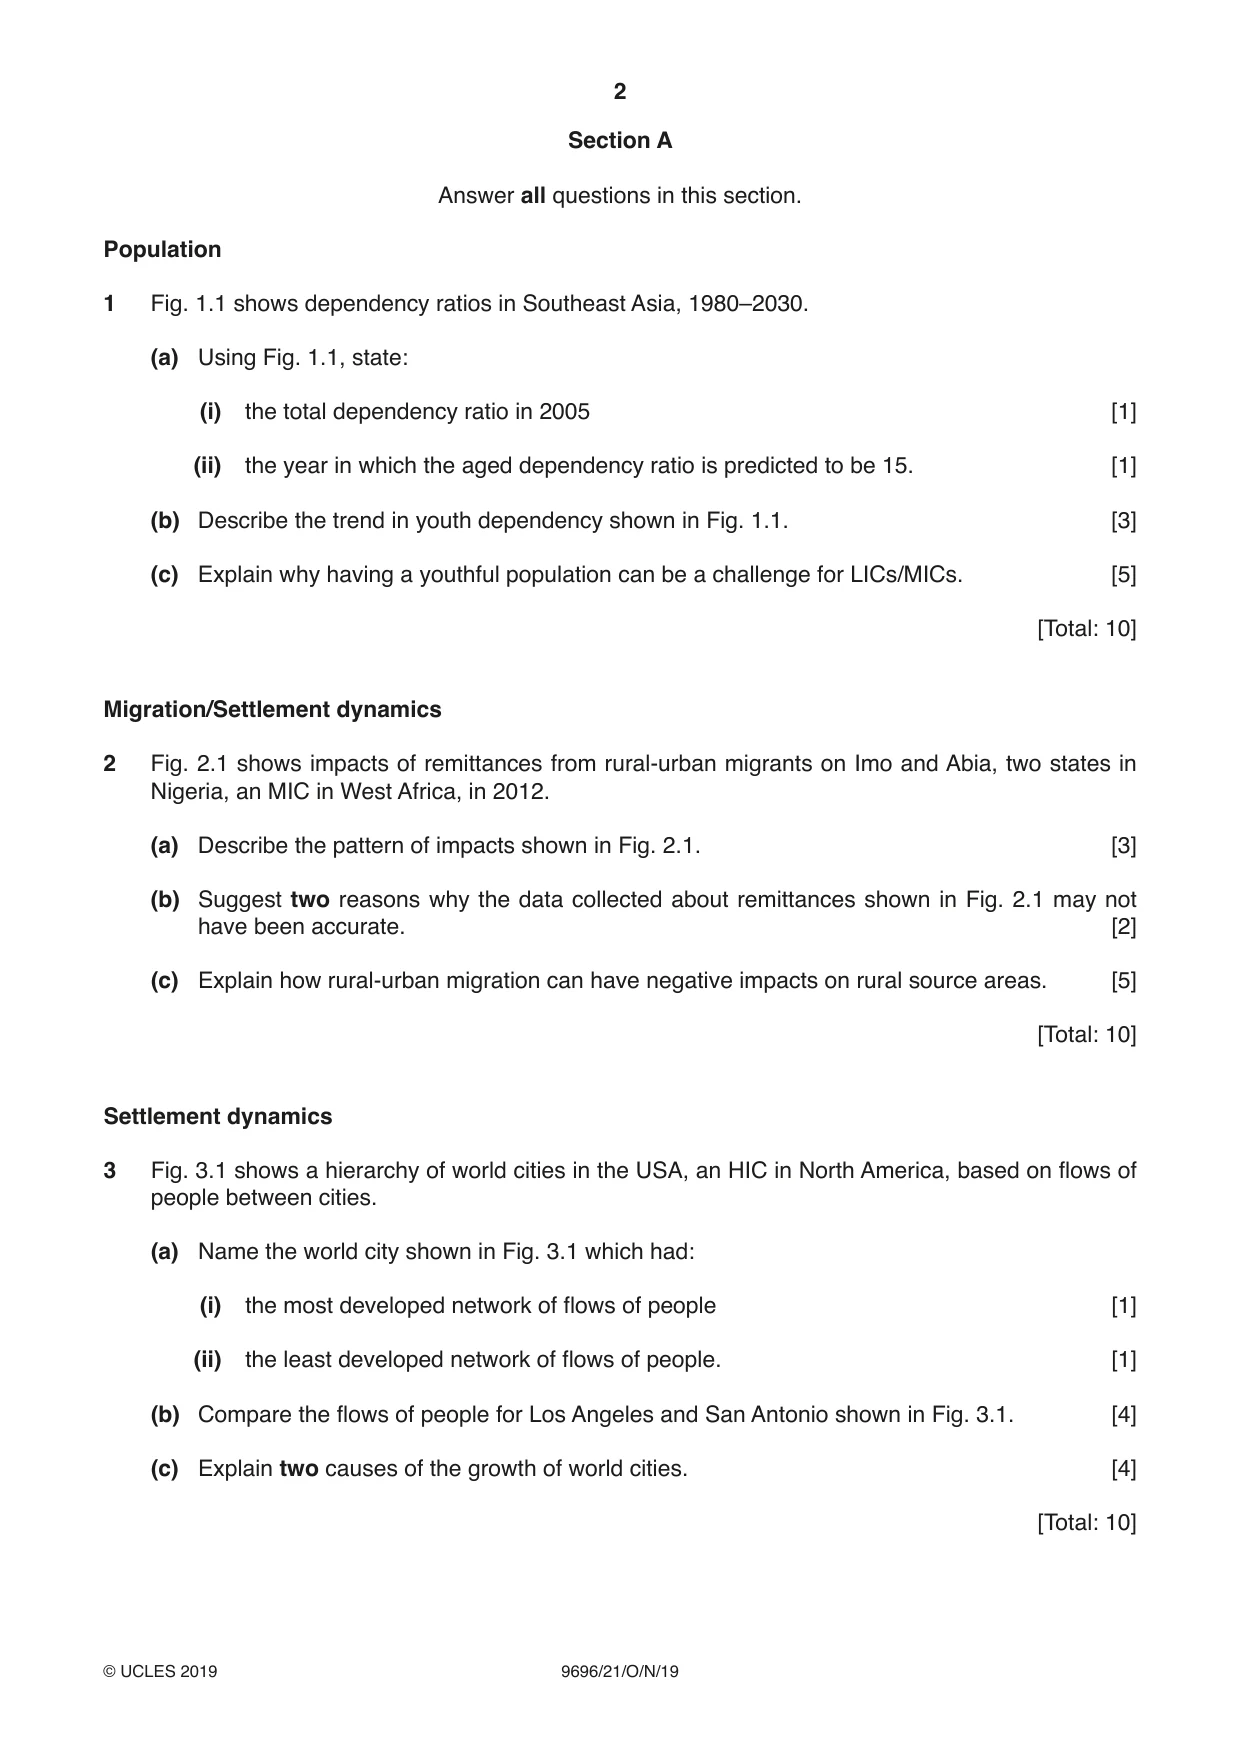
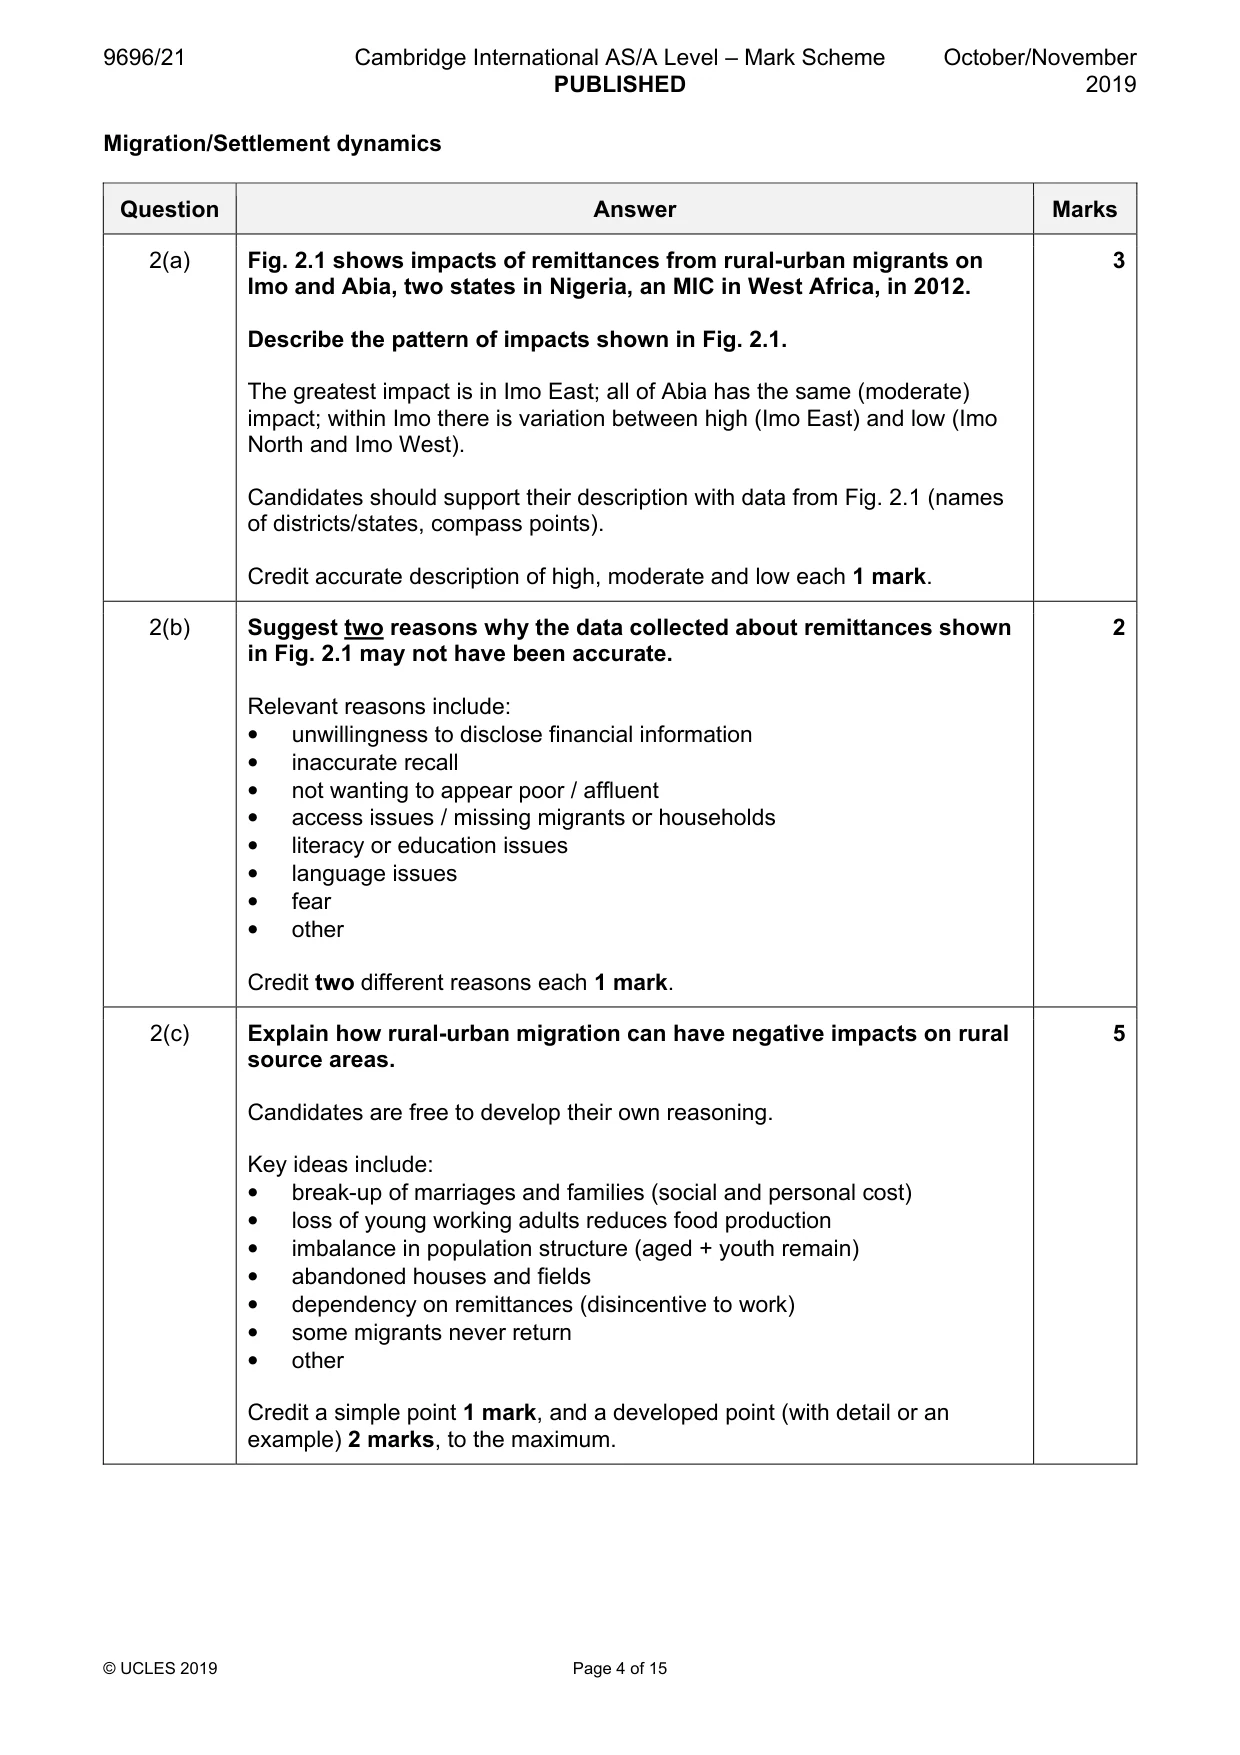
2 Fig. 2.1 shows impacts of remittances from rural-urban migrants on Imo and Abia, two states in Nigeria, an MIC in West Africa, in 2012. (a) Describe the pattern of impacts shown in Fig. 2.1. [3] (b) Suggest two reasons why the data collected about remittances shown in Fig. 2.1 may not have been accurate. [2] (c) Explain how rural-urban migration can have negative impacts on rural source areas. [5] [Total: 10] Settlement dynamics
Mark scheme: 2(a) Fig. 2.1 shows impacts of remittances from rural-urban migrants on 3 Imo and Abia, two states in Nigeria, an MIC in West Africa, in 2012. Describe the pattern of impacts shown in Fig. 2.1. The greatest impact is in Imo East; all of Abia has the same (moderate) impact; within Imo there is variation between high (Imo East) and low (Imo North and Imo West). Candidates should support their description with data from Fig. 2.1 (names of districts/states, compass points). Credit accurate description of high, moderate and low each 1 mark. 2(b) Suggest two reasons why the data collected about remittances shown 2 in Fig. 2.1 may not have been accurate. Relevant reasons include: • unwillingness to disclose financial information • inaccurate recall • not wanting to appear poor / affluent • access issues / missing migrants or households • literacy or education issues • language issues • fear • other Credit two different reasons each 1 mark. 2(c) Explain how rural-urban migration can have negative impacts on rural 5 source areas. Candidates are free to develop their own reasoning. Key ideas include: • break-up of marriages and families (social and personal cost) • loss of young working adults reduces food production • imbalance in population structure (aged + youth remain) • abandoned houses and fields • dependency on remittances (disincentive to work) • some migrants never return • other Credit a simple point 1 mark, and a developed point (with detail or an example) 2 marks, to the maximum. Settlement dynamics
Q3 · A hierarchy of world cities in the USA, an HIC in North America, based on flows of people…
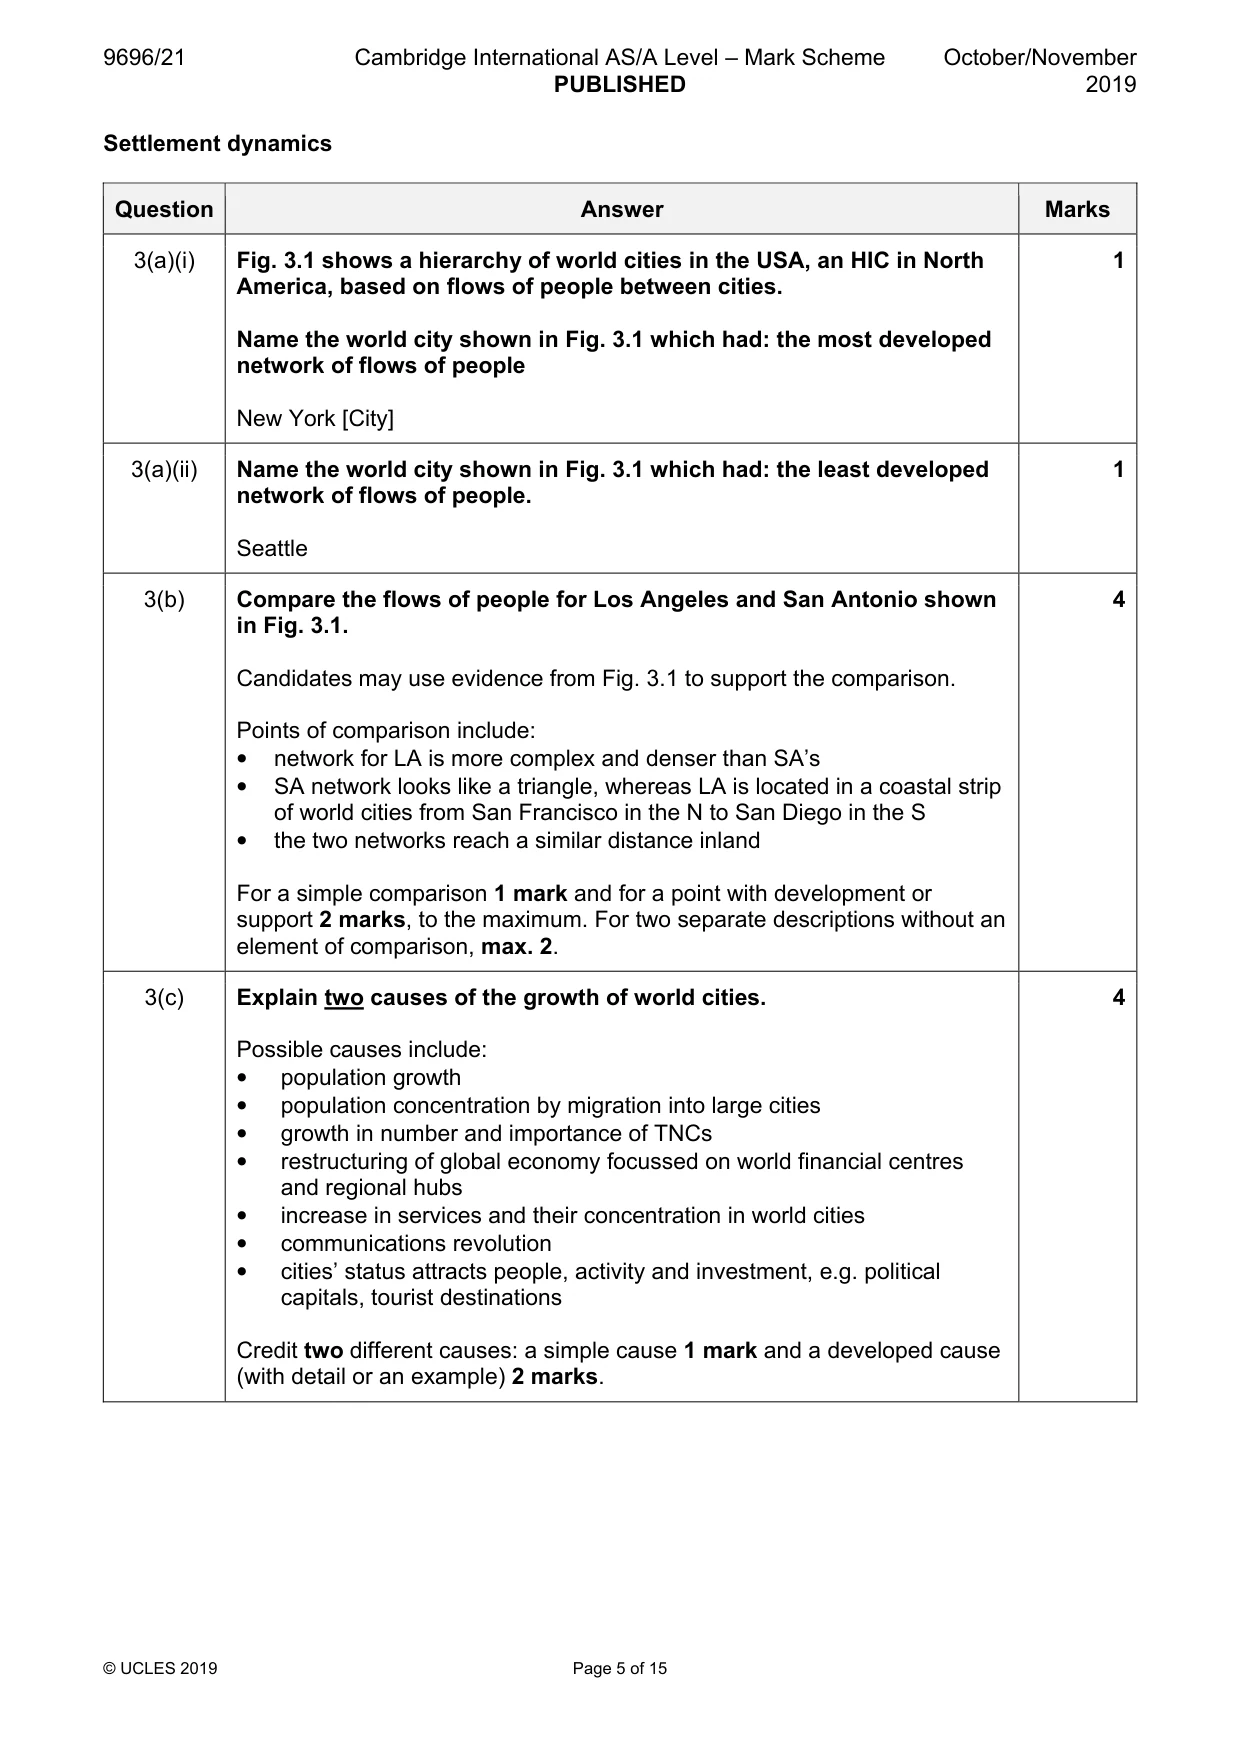
3 Fig. 3.1 shows a hierarchy of world cities in the USA, an HIC in North America, based on flows of people between cities. (a) Name the world city shown in Fig. 3.1 which had: (i) the most developed network of flows of people [1] (ii) the least developed network of flows of people. [1] (b) Compare the flows of people for Los Angeles and San Antonio shown in Fig. 3.1. [4] (c) Explain two causes of the growth of world cities. [4] [Total: 10]
Mark scheme: 3(a)(i) Fig. 3.1 shows a hierarchy of world cities in the USA, an HIC in North 1 America, based on flows of people between cities. Name the world city shown in Fig. 3.1 which had: the most developed network of flows of people New York [City] 3(a)(ii) Name the world city shown in Fig. 3.1 which had: the least developed 1 network of flows of people. Seattle 3(b) Compare the flows of people for Los Angeles and San Antonio shown 4 in Fig. 3.1. Candidates may use evidence from Fig. 3.1 to support the comparison. Points of comparison include: • network for LA is more complex and denser than SA’s • SA network looks like a triangle, whereas LA is located in a coastal strip of world cities from San Francisco in the N to San Diego in the S • the two networks reach a similar distance inland For a simple comparison 1 mark and for a point with development or support 2 marks, to the maximum. For two separate descriptions without an element of comparison, max. 2. 3(c) Explain two causes of the growth of world cities. 4 Possible causes include: • population growth • population concentration by migration into large cities • growth in number and importance of TNCs • restructuring of global economy focussed on world financial centres and regional hubs • increase in services and their concentration in world cities • communications revolution • cities’ status attracts people, activity and investment, e.g. political capitals, tourist destinations Credit two different causes: a simple cause 1 mark and a developed cause (with detail or an example) 2 marks. Section B Answer one question from this section. All questions carry 30 marks. Population
Q4 · Compare the meaning of the terms birth rate and fertility rate
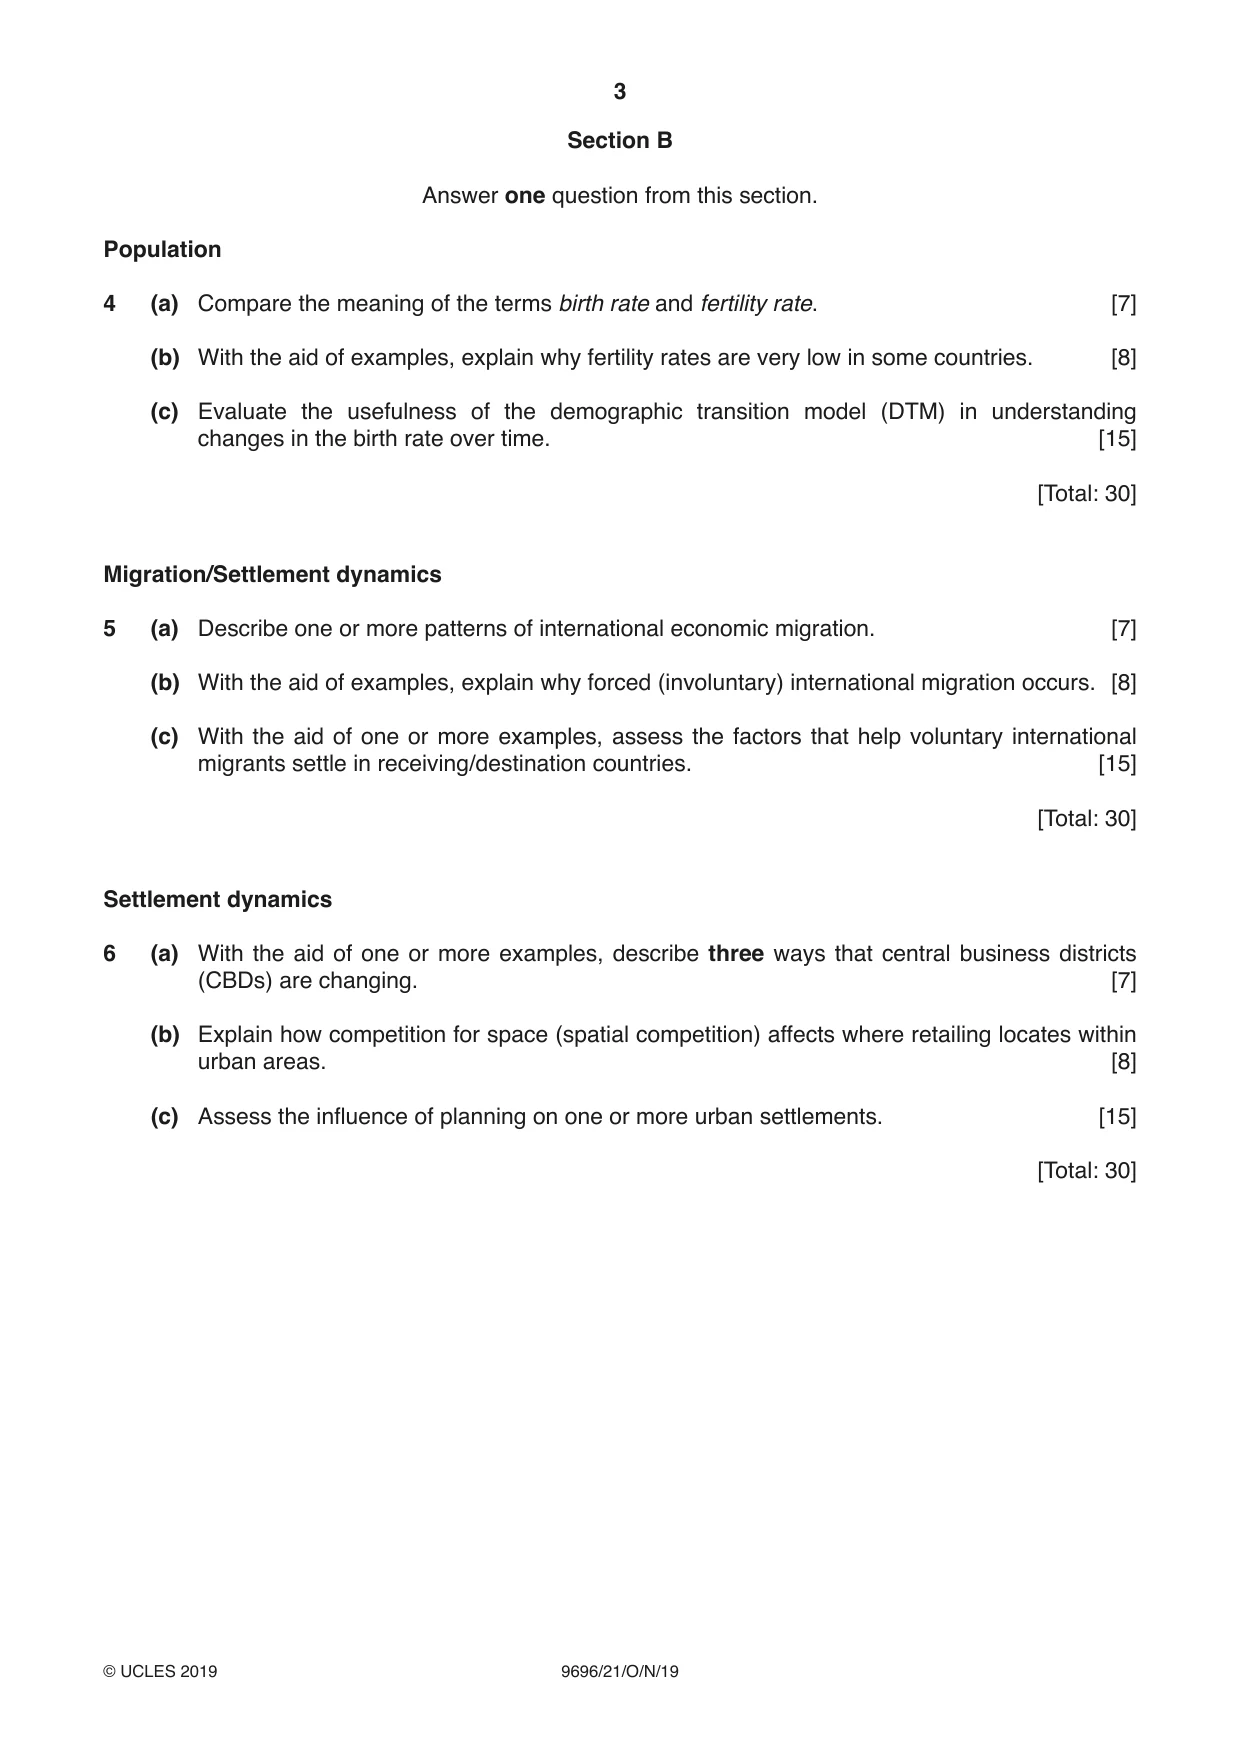
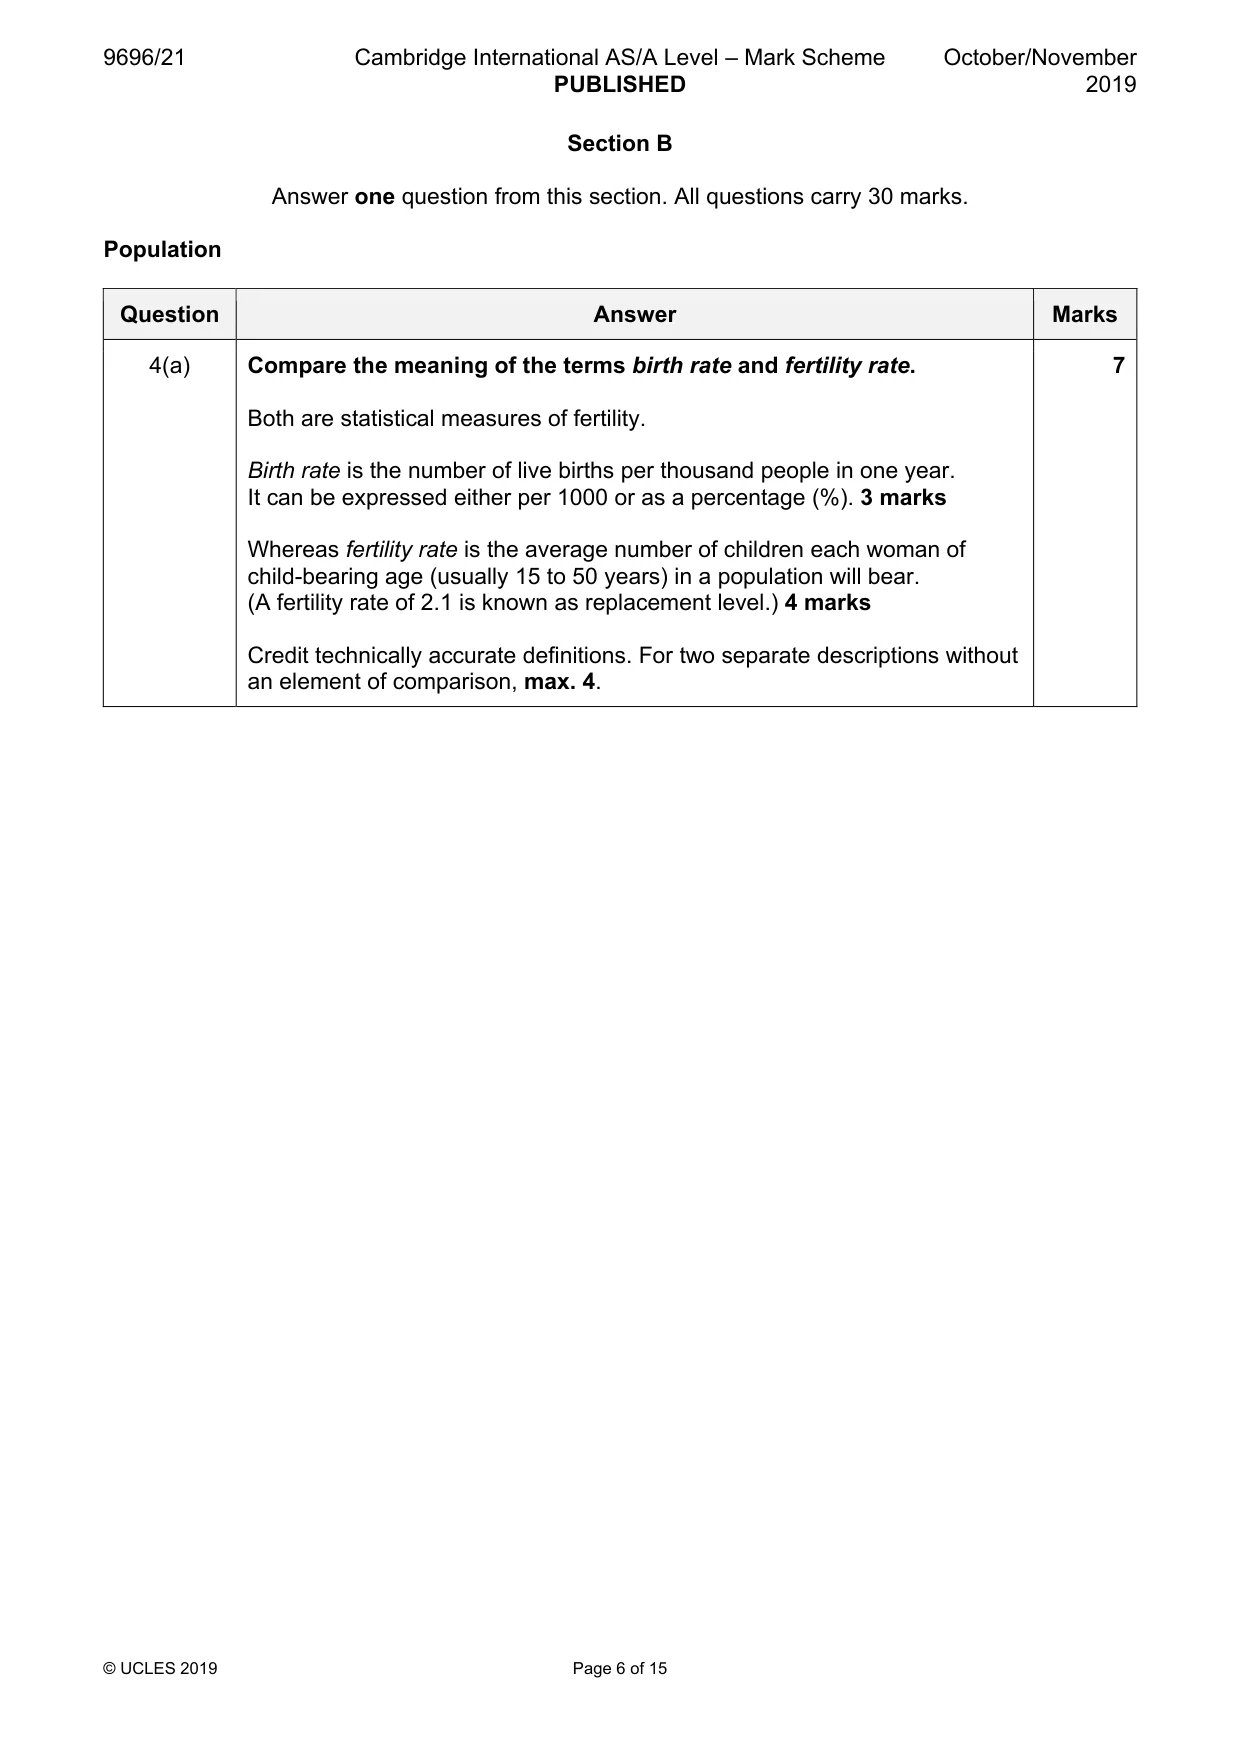
4 (a) Compare the meaning of the terms birth rate and fertility rate. [7] (b) With the aid of examples, explain why fertility rates are very low in some countries. [8] (c) Evaluate the usefulness of the demographic transition model (DTM) in understanding changes in the birth rate over time. [15] [Total: 30] Migration/Settlement dynamics
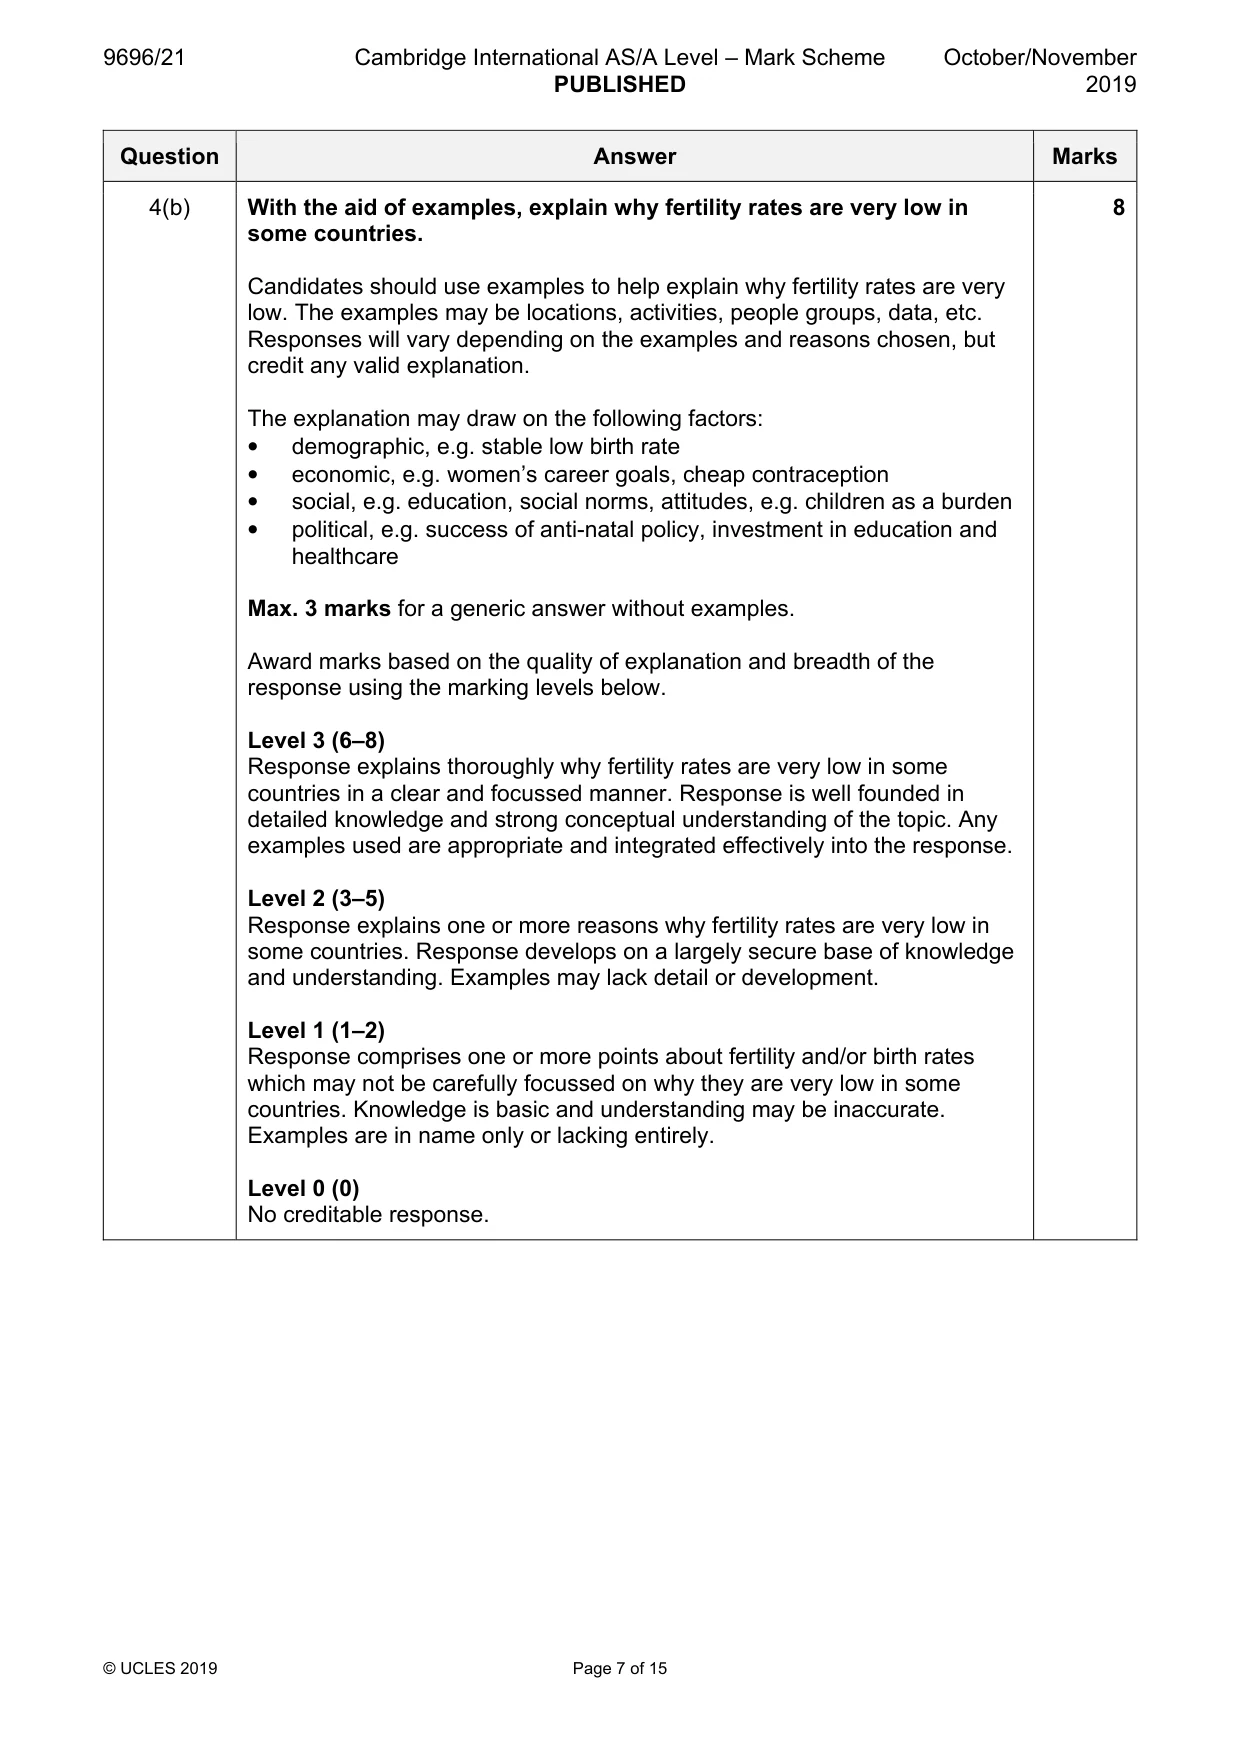
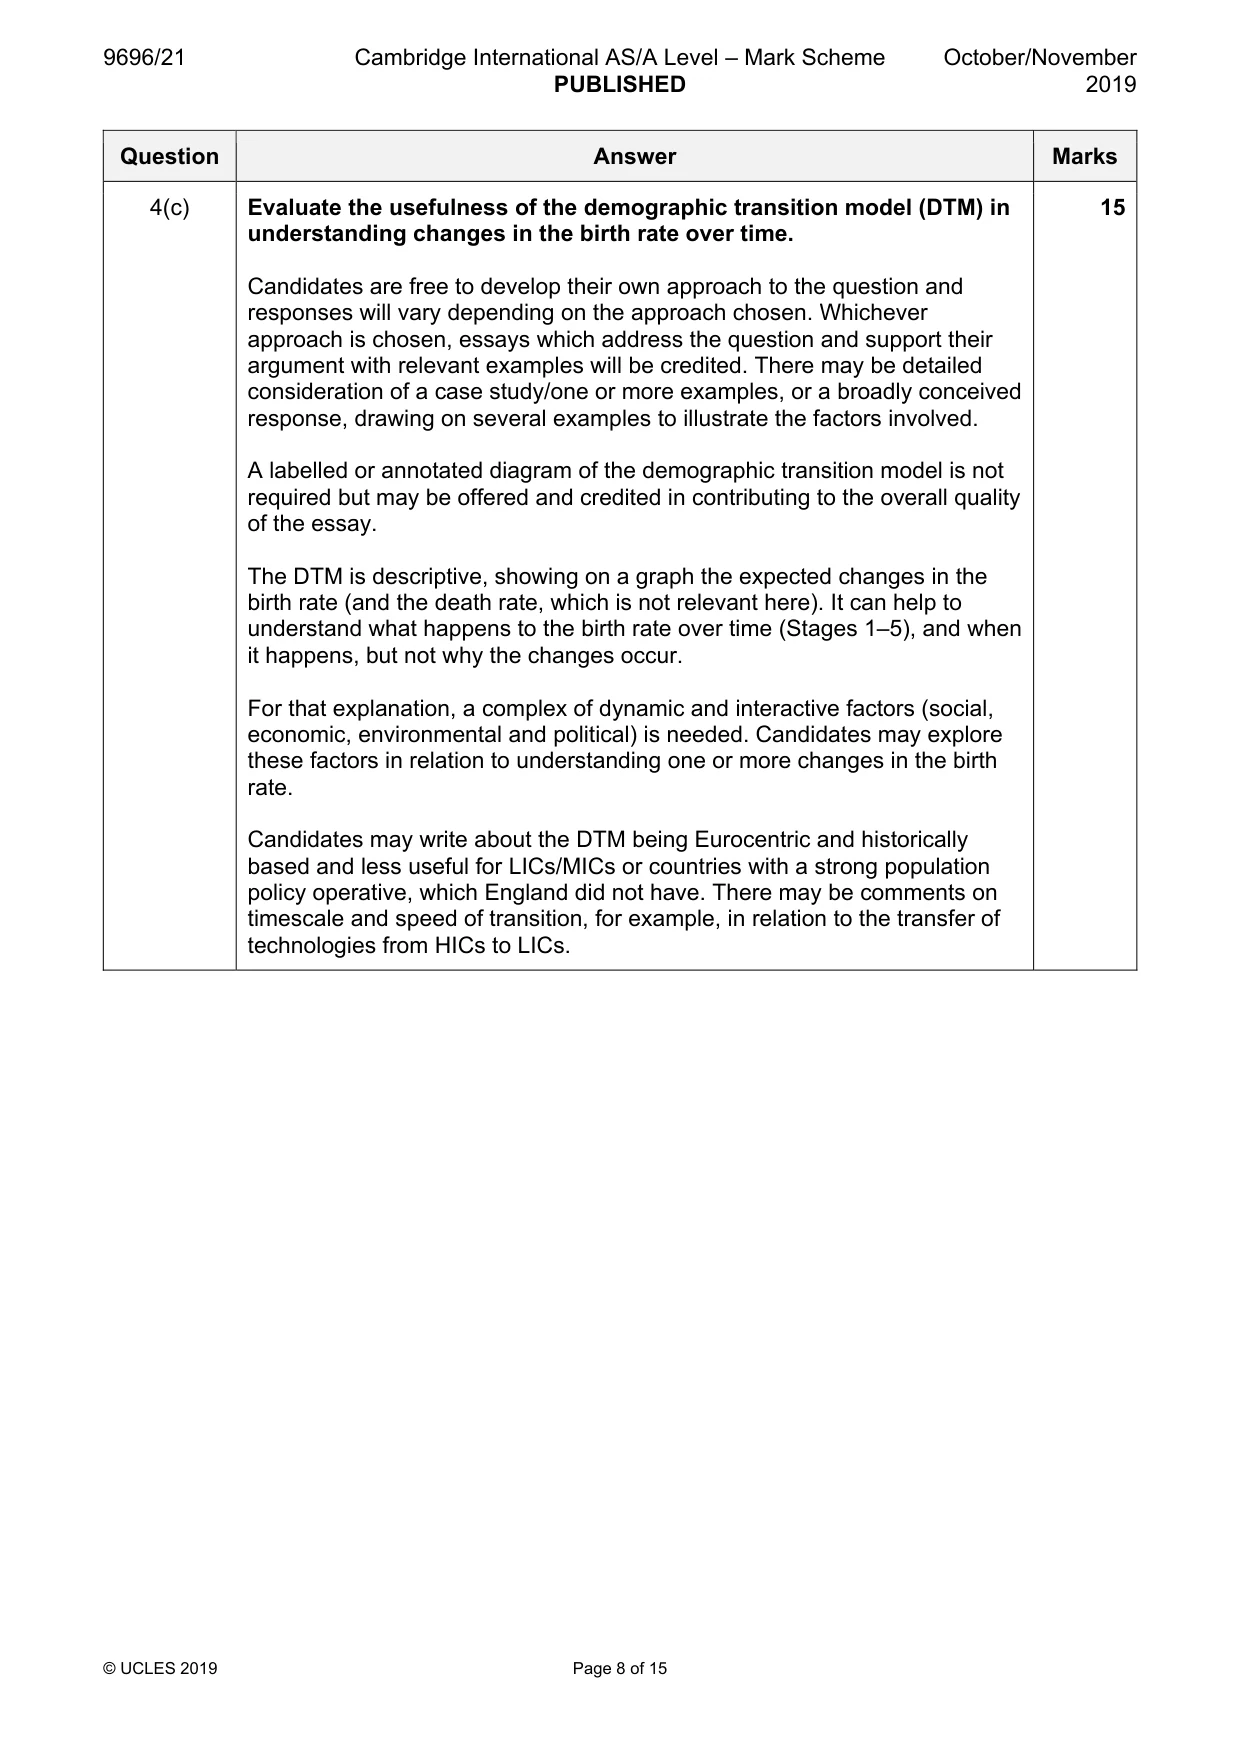
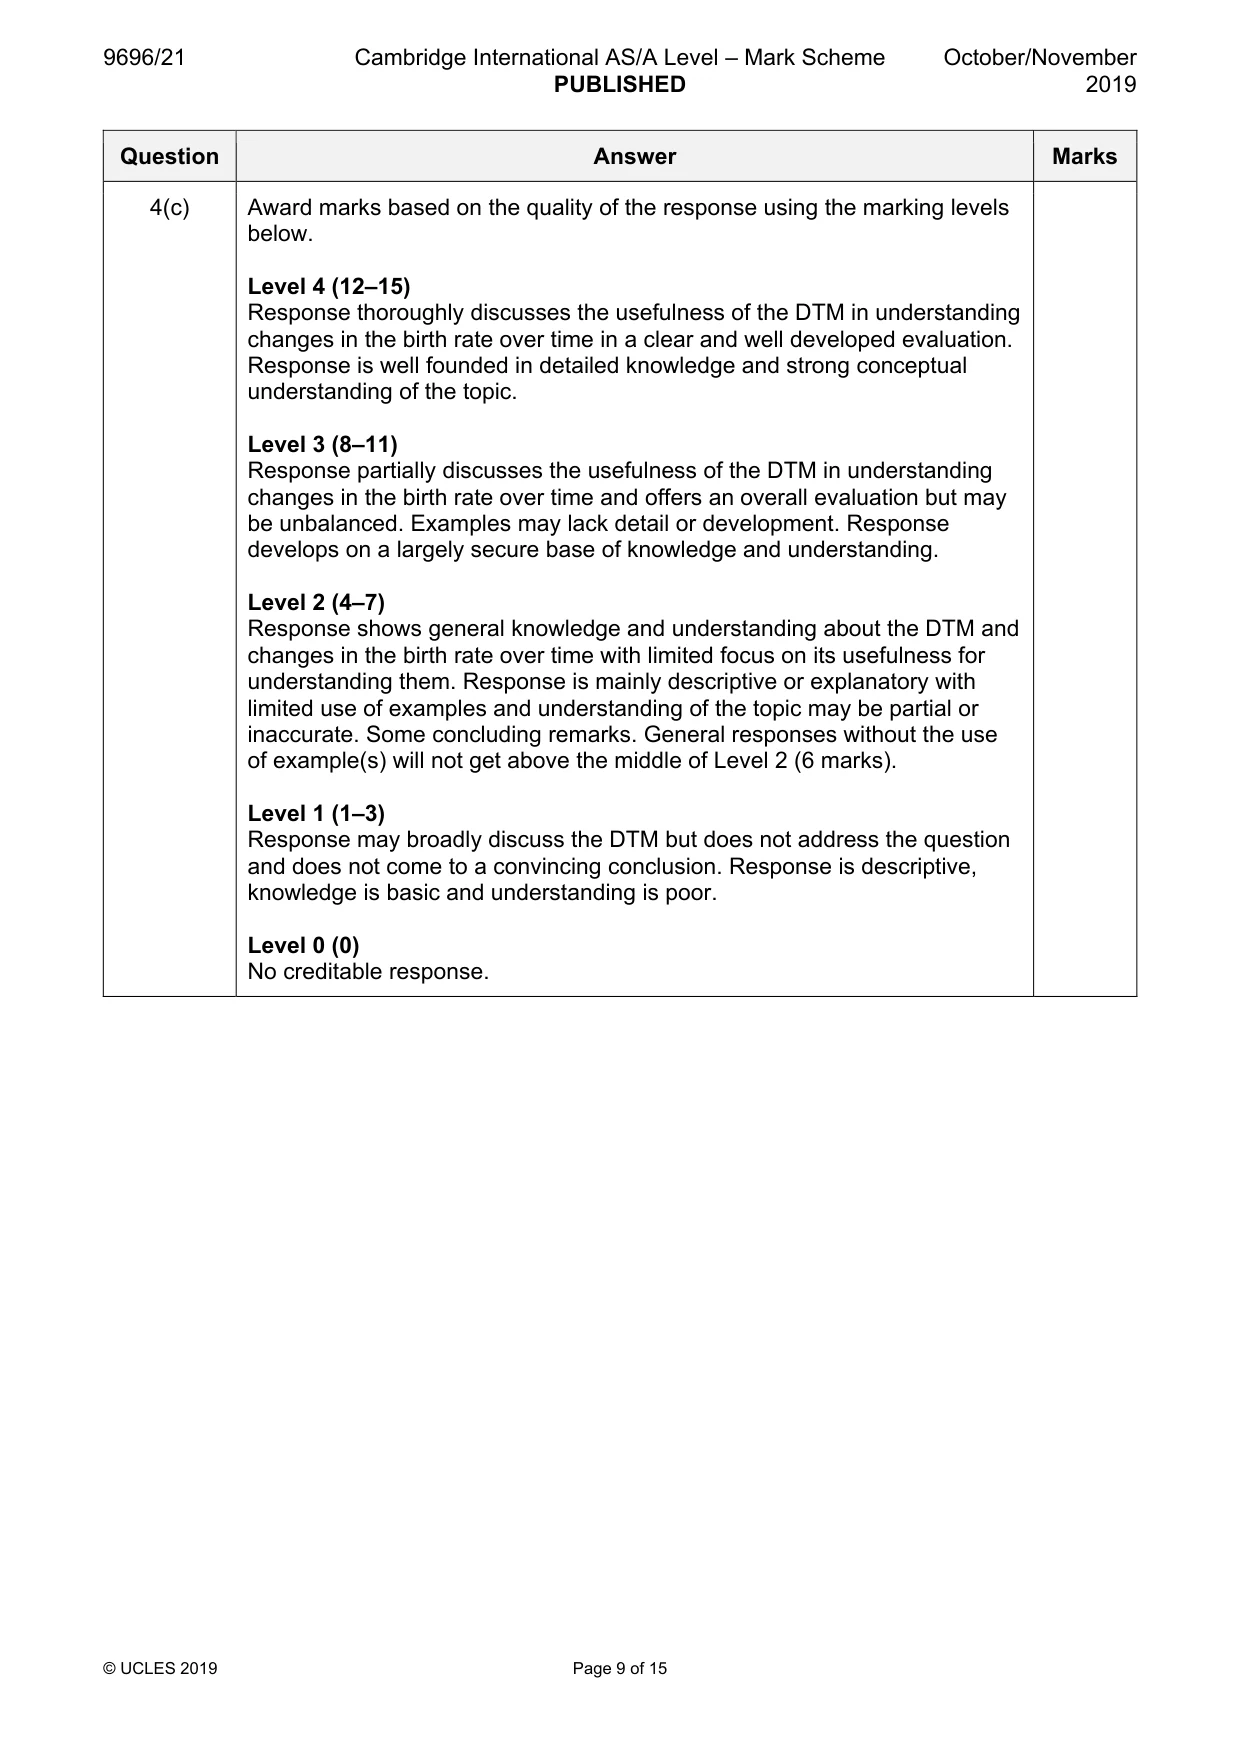
Mark scheme: 4(a) Compare the meaning of the terms birth rate and fertility rate. 7 Both are statistical measures of fertility. Birth rate is the number of live births per thousand people in one year. It can be expressed either per 1000 or as a percentage (%). 3 marks Whereas fertility rate is the average number of children each woman of child-bearing age (usually 15 to 50 years) in a population will bear. (A fertility rate of 2.1 is known as replacement level.) 4 marks Credit technically accurate definitions. For two separate descriptions without an element of comparison, max. 4. 4(b) With the aid of examples, explain why fertility rates are very low in 8 some countries. Candidates should use examples to help explain why fertility rates are very low. The examples may be locations, activities, people groups, data, etc. Responses will vary depending on the examples and reasons chosen, but credit any valid explanation. The explanation may draw on the following factors: • demographic, e.g. stable low birth rate • economic, e.g. women’s career goals, cheap contraception • social, e.g. education, social norms, attitudes, e.g. children as a burden • political, e.g. success of anti-natal policy, investment in education and healthcare Max. 3 marks for a generic answer without examples. Award marks based on the quality of explanation and breadth of the response using the marking levels below. Level 3 (6–8) Response explains thoroughly why fertility rates are very low in some countries in a clear and focussed manner. Response is well founded in detailed knowledge and strong conceptual understanding of the topic. Any examples used are appropriate and integrated effectively into the response. Level 2 (3–5) Response explains one or more reasons why fertility rates are very low in some countries. Response develops on a largely secure base of knowledge and understanding. Examples may lack detail or development. Level 1 (1–2) Response comprises one or more points about fertility and/or birth rates which may not be carefully focussed on why they are very low in some countries. Knowledge is basic and understanding may be inaccurate. Examples are in name only or lacking entirely. Level 0 (0) No creditable response. 4(c) Evaluate the usefulness of the demographic transition model (DTM) in 15 understanding changes in the birth rate over time. Candidates are free to develop their own approach to the question and responses will vary depending on the approach chosen. Whichever approach is chosen, essays which address the question and support their argument with relevant examples will be credited. There may be detailed consideration of a case study/one or more examples, or a broadly conceived response, drawing on several examples to illustrate the factors involved. A labelled or annotated diagram of the demographic transition model is not required but may be offered and credited in contributing to the overall quality of the essay. The DTM is descriptive, showing on a graph the expected changes in the birth rate (and the death rate, which is not relevant here). It can help to understand what happens to the birth rate over time (Stages 1–5), and when it happens, but not why the changes occur. For that explanation, a complex of dynamic and interactive factors (social, economic, environmental and political) is needed. Candidates may explore these factors in relation to understanding one or more changes in the birth rate. Candidates may write about the DTM being Eurocentric and historically based and less useful for LICs/MICs or countries with a strong population policy operative, which England did not have. There may be comments on timescale and speed of transition, for example, in relation to the transfer of technologies from HICs to LICs. 4(c) Award marks based on the quality of the response using the marking levels below. Level 4 (12–15) Response thoroughly discusses the usefulness of the DTM in understanding changes in the birth rate over time in a clear and well developed evaluation. Response is well founded in detailed knowledge and strong conceptual understanding of the topic. Level 3 (8–11) Response partially discusses the usefulness of the DTM in understanding changes in the birth rate over time and offers an overall evaluation but may be unbalanced. Examples may lack detail or development. Response develops on a largely secure base of knowledge and understanding. Level 2 (4–7) Response shows general knowledge and understanding about the DTM and changes in the birth rate over time with limited focus on its usefulness for understanding them. Response is mainly descriptive or explanatory with limited use of examples and understanding of the topic may be partial or inaccurate. Some concluding remarks. General responses without the use of example(s) will not get above the middle of Level 2 (6 marks). Level 1 (1–3) Response may broadly discuss the DTM but does not address the question and does not come to a convincing conclusion. Response is descriptive, knowledge is basic and understanding is poor. Level 0 (0) No creditable response. Migration/Settlement dynamics
Q5 · Describe one or more patterns of international economic migration
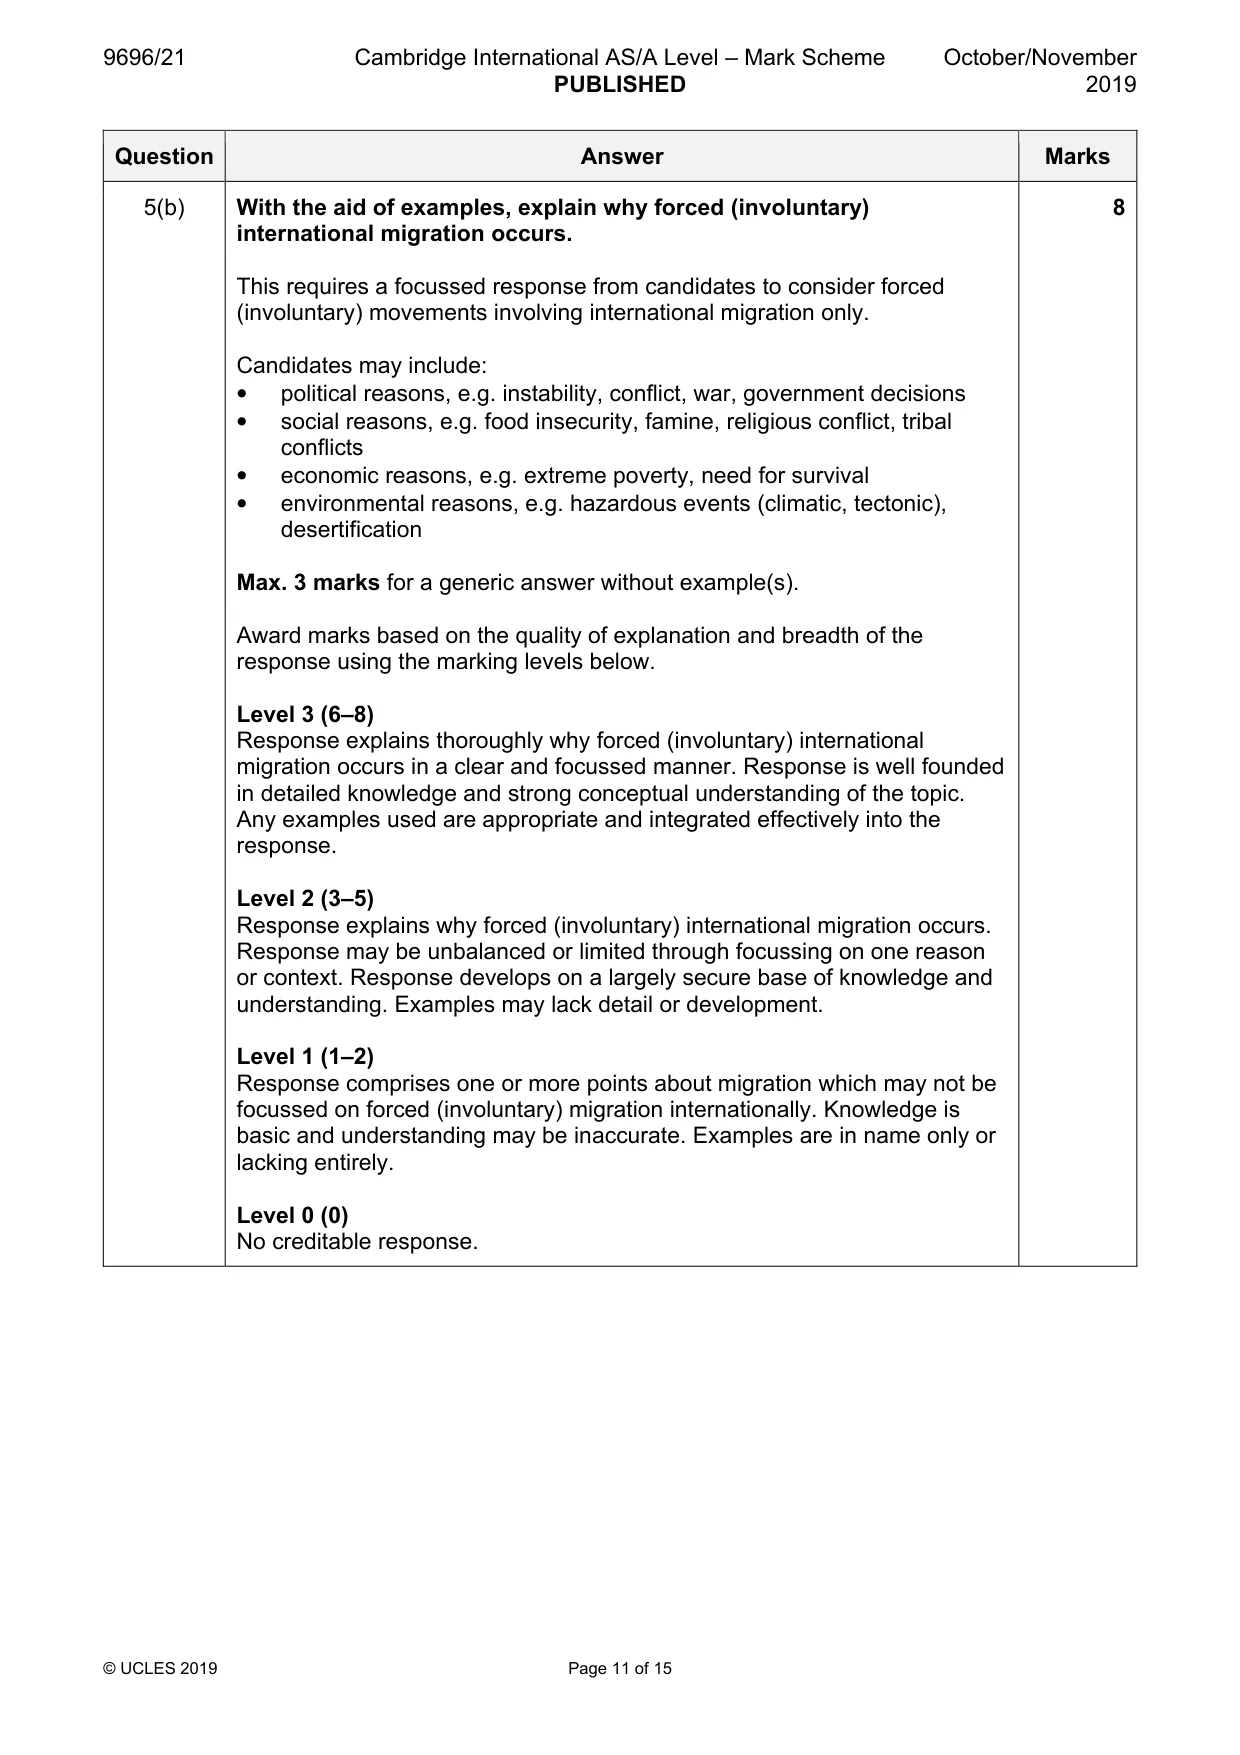
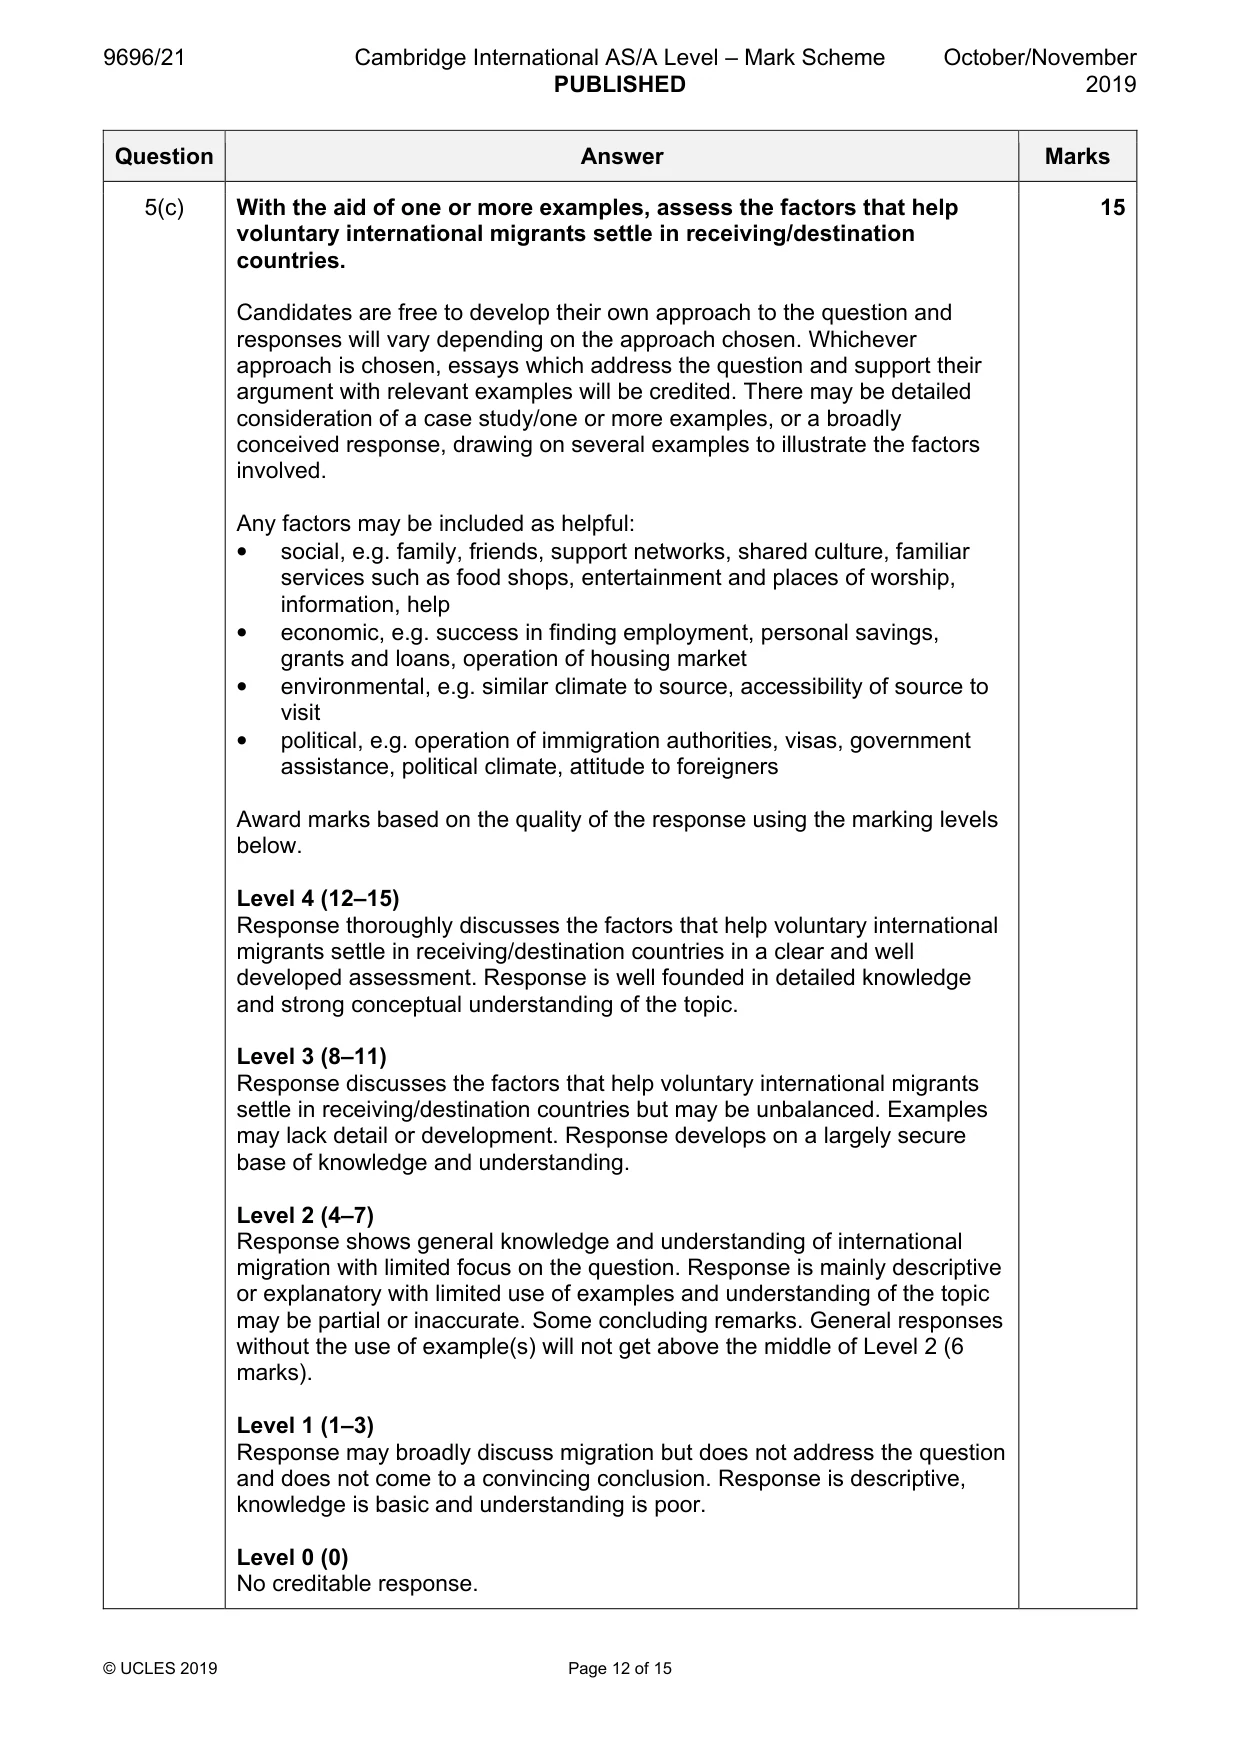
5 (a) Describe one or more patterns of international economic migration. [7] (b) With the aid of examples, explain why forced (involuntary) international migration occurs. [8] (c) With the aid of one or more examples, assess the factors that help voluntary international migrants settle in receiving/destination countries. [15] [Total: 30] Settlement dynamics
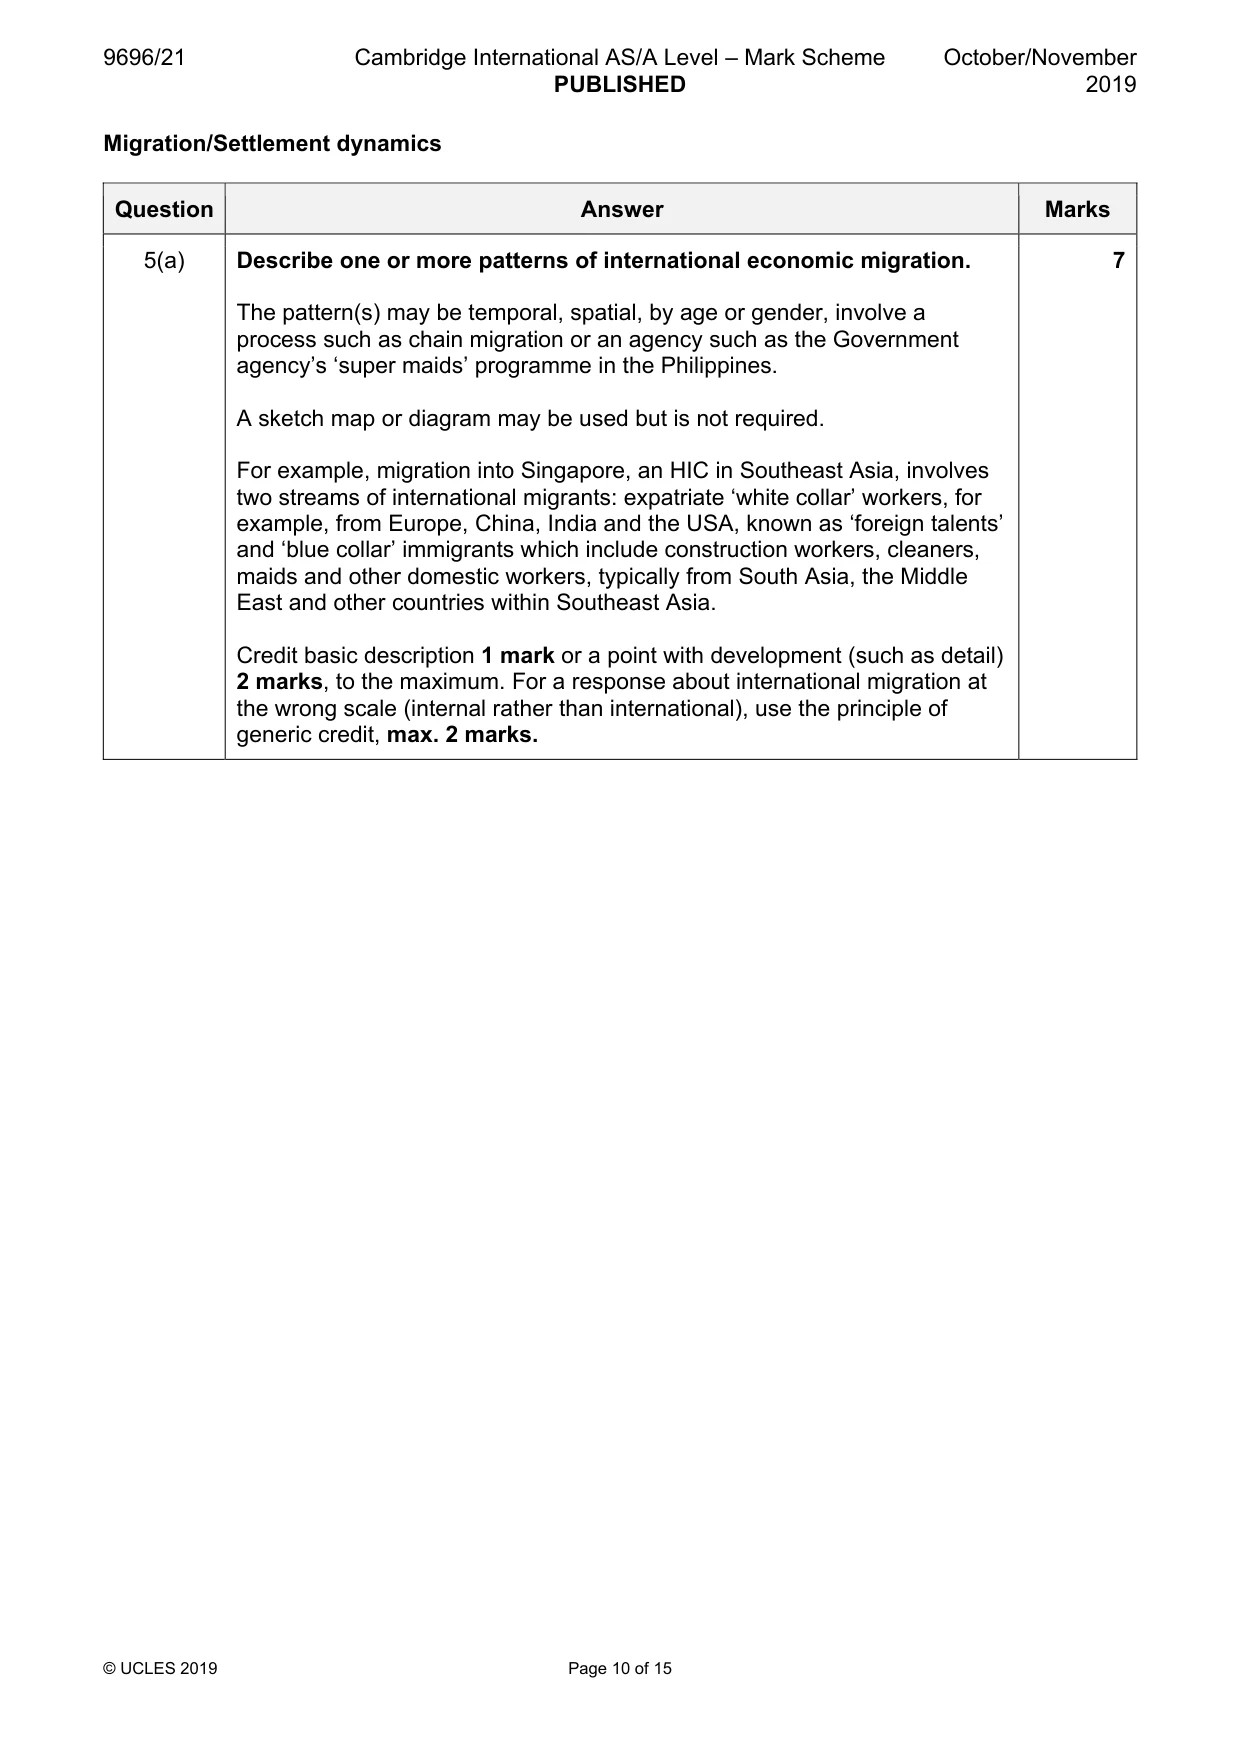
Mark scheme: 5(a) Describe one or more patterns of international economic migration. 7 The pattern(s) may be temporal, spatial, by age or gender, involve a process such as chain migration or an agency such as the Government agency’s ‘super maids’ programme in the Philippines. A sketch map or diagram may be used but is not required. For example, migration into Singapore, an HIC in Southeast Asia, involves two streams of international migrants: expatriate ‘white collar’ workers, for example, from Europe, China, India and the USA, known as ‘foreign talents’ and ‘blue collar’ immigrants which include construction workers, cleaners, maids and other domestic workers, typically from South Asia, the Middle East and other countries within Southeast Asia. Credit basic description 1 mark or a point with development (such as detail) 2 marks, to the maximum. For a response about international migration at the wrong scale (internal rather than international), use the principle of generic credit, max. 2 marks. 5(b) With the aid of examples, explain why forced (involuntary) 8 international migration occurs. This requires a focussed response from candidates to consider forced (involuntary) movements involving international migration only. Candidates may include: • political reasons, e.g. instability, conflict, war, government decisions • social reasons, e.g. food insecurity, famine, religious conflict, tribal conflicts • economic reasons, e.g. extreme poverty, need for survival • environmental reasons, e.g. hazardous events (climatic, tectonic), desertification Max. 3 marks for a generic answer without example(s). Award marks based on the quality of explanation and breadth of the response using the marking levels below. Level 3 (6–8) Response explains thoroughly why forced (involuntary) international migration occurs in a clear and focussed manner. Response is well founded in detailed knowledge and strong conceptual understanding of the topic. Any examples used are appropriate and integrated effectively into the response. Level 2 (3–5) Response explains why forced (involuntary) international migration occurs. Response may be unbalanced or limited through focussing on one reason or context. Response develops on a largely secure base of knowledge and understanding. Examples may lack detail or development. Level 1 (1–2) Response comprises one or more points about migration which may not be focussed on forced (involuntary) migration internationally. Knowledge is basic and understanding may be inaccurate. Examples are in name only or lacking entirely. Level 0 (0) No creditable response. 5(c) With the aid of one or more examples, assess the factors that help 15 voluntary international migrants settle in receiving/destination countries. Candidates are free to develop their own approach to the question and responses will vary depending on the approach chosen. Whichever approach is chosen, essays which address the question and support their argument with relevant examples will be credited. There may be detailed consideration of a case study/one or more examples, or a broadly conceived response, drawing on several examples to illustrate the factors involved. Any factors may be included as helpful: • social, e.g. family, friends, support networks, shared culture, familiar services such as food shops, entertainment and places of worship, information, help • economic, e.g. success in finding employment, personal savings, grants and loans, operation of housing market • environmental, e.g. similar climate to source, accessibility of source to visit • political, e.g. operation of immigration authorities, visas, government assistance, political climate, attitude to foreigners Award marks based on the quality of the response using the marking levels below. Level 4 (12–15) Response thoroughly discusses the factors that help voluntary international migrants settle in receiving/destination countries in a clear and well developed assessment. Response is well founded in detailed knowledge and strong conceptual understanding of the topic. Level 3 (8–11) Response discusses the factors that help voluntary international migrants settle in receiving/destination countries but may be unbalanced. Examples may lack detail or development. Response develops on a largely secure base of knowledge and understanding. Level 2 (4–7) Response shows general knowledge and understanding of international migration with limited focus on the question. Response is mainly descriptive or explanatory with limited use of examples and understanding of the topic may be partial or inaccurate. Some concluding remarks. General responses without the use of example(s) will not get above the middle of Level 2 (6 marks). Level 1 (1–3) Response may broadly discuss migration but does not address the question and does not come to a convincing conclusion. Response is descriptive, knowledge is basic and understanding is poor. Level 0 (0) No creditable response. Settlement dynamics
Q6 · With the aid of one or more examples, describe three ways that central business districts…
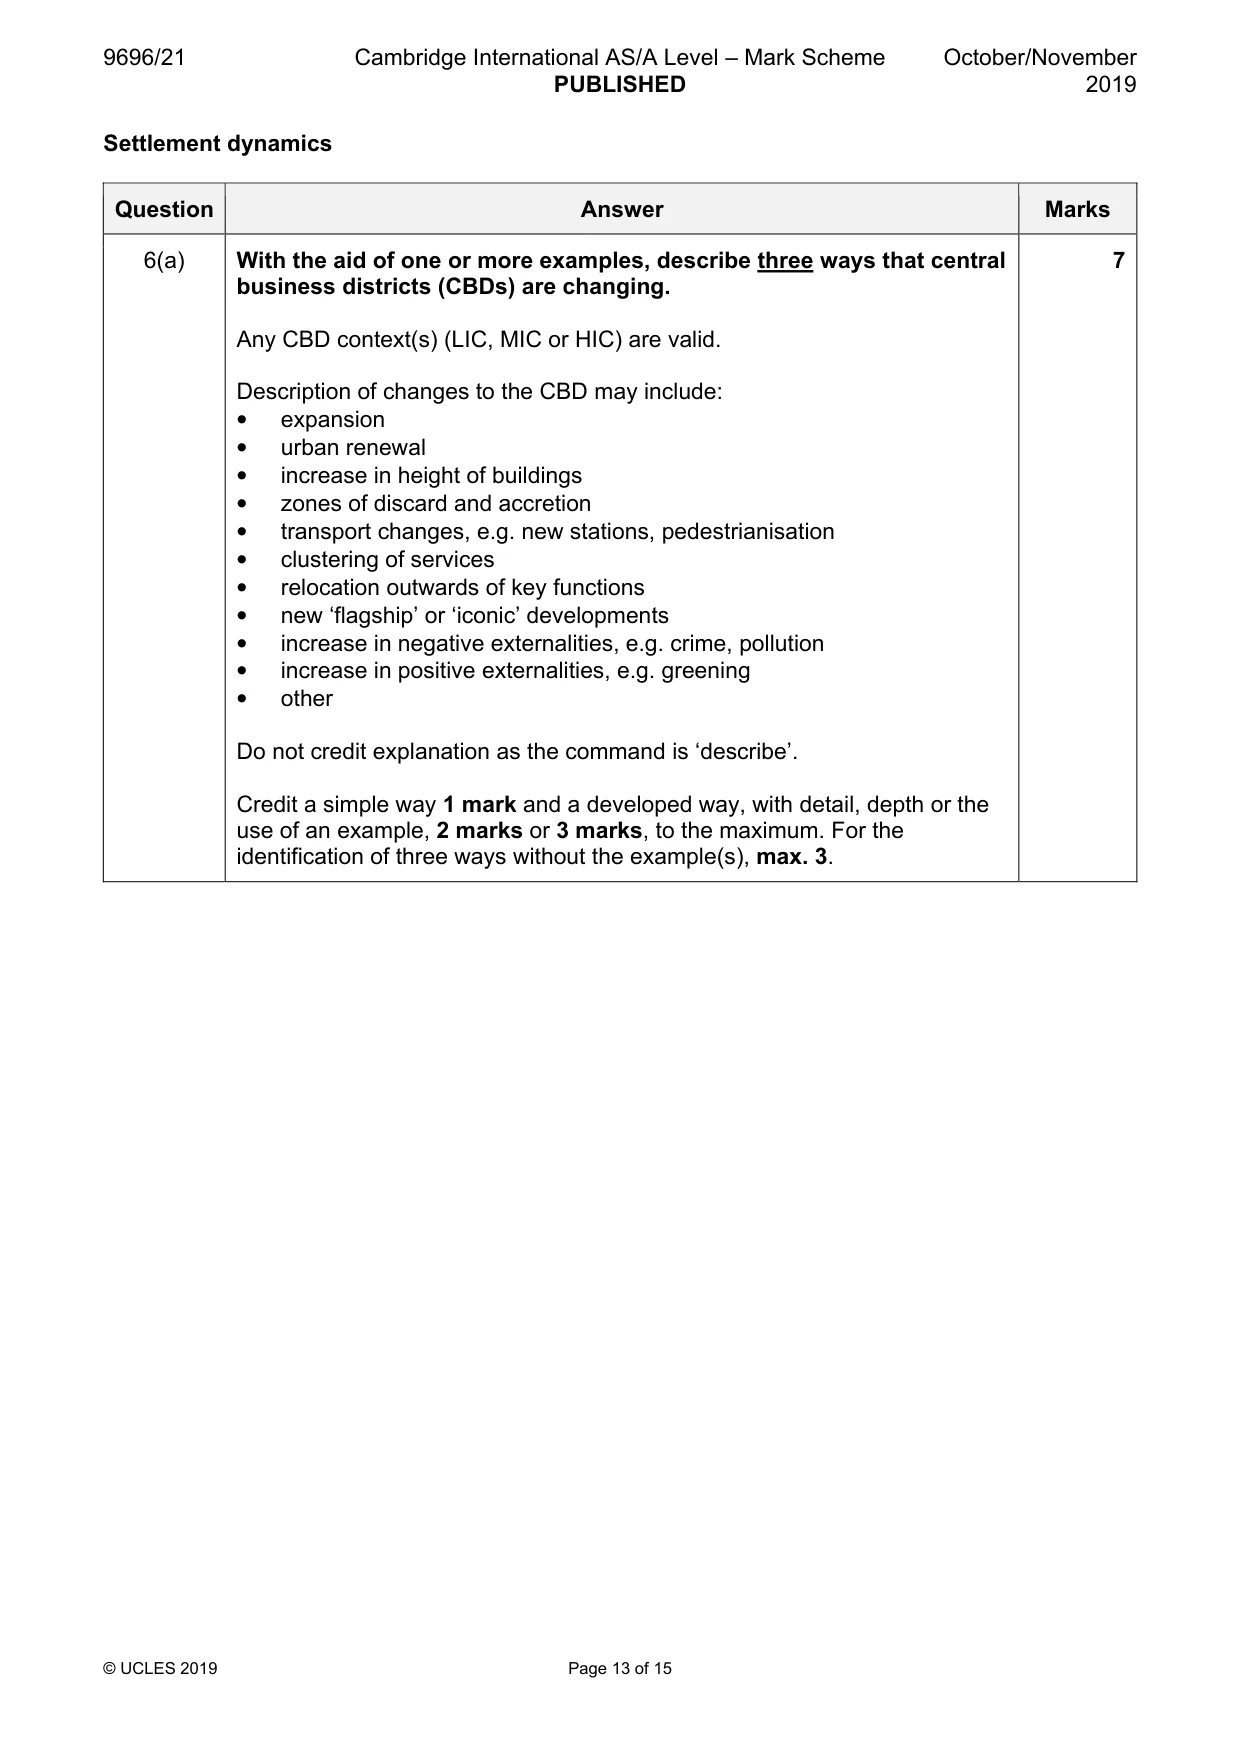
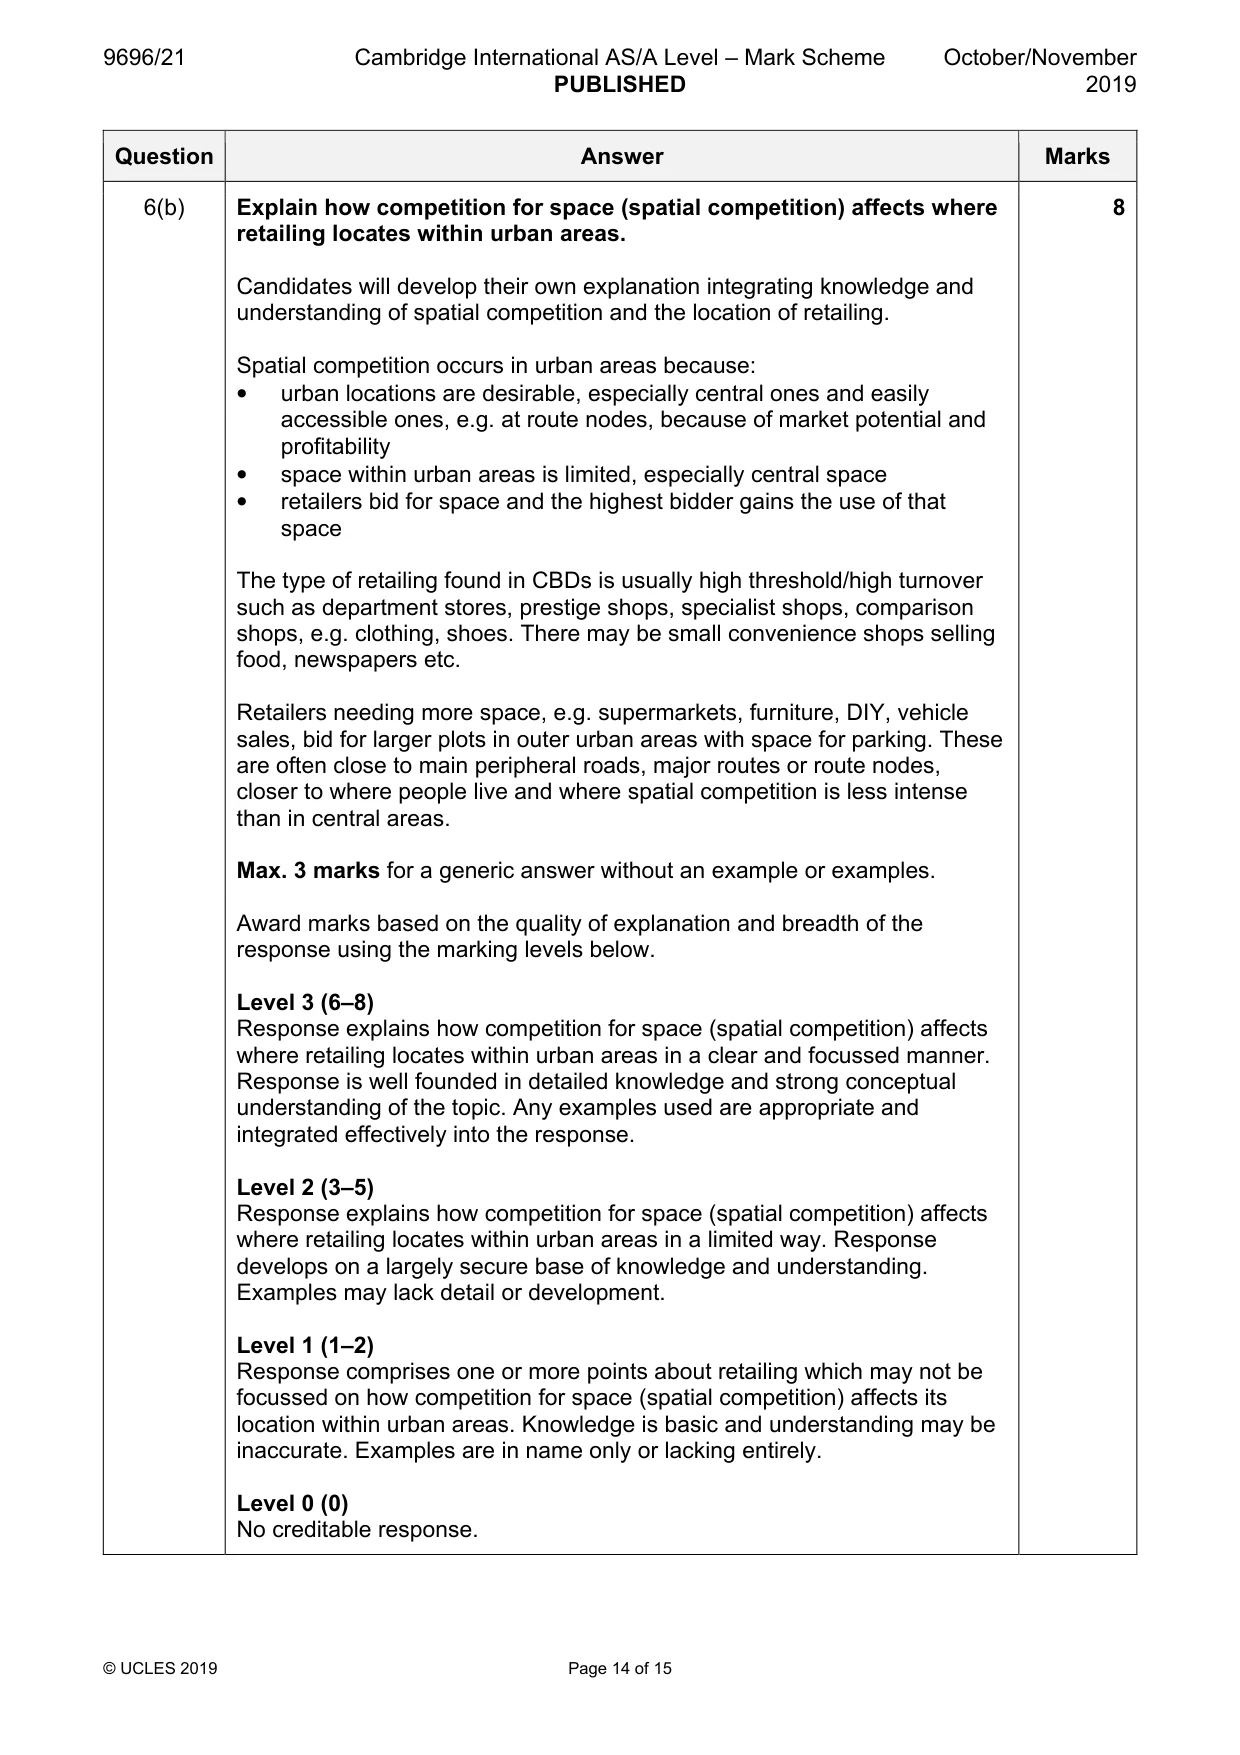
6 (a) With the aid of one or more examples, describe three ways that central business districts (CBDs) are changing. [7] (b) Explain how competition for space (spatial competition) affects where retailing locates within urban areas. [8] (c) Assess the influence of planning on one or more urban settlements. [15] [Total: 30]
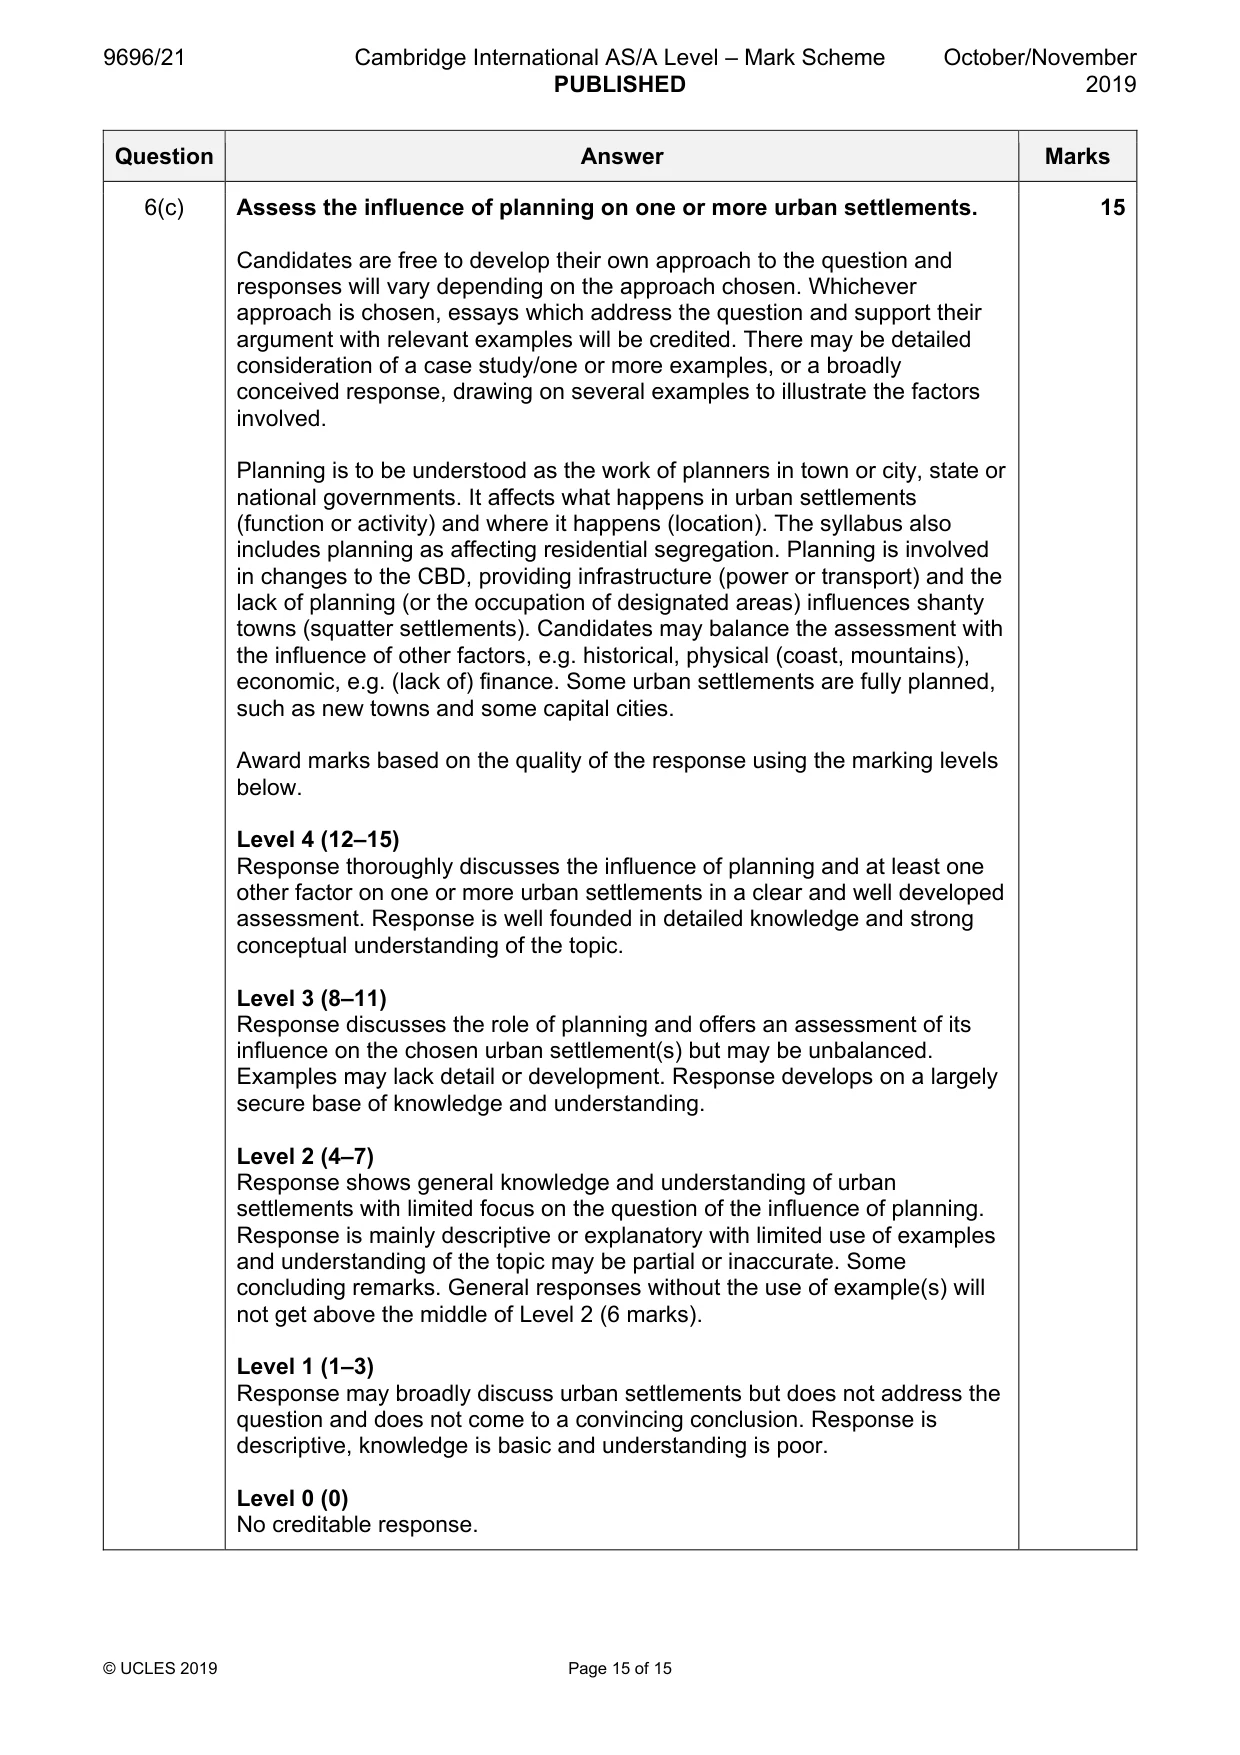
Mark scheme: 6(a) With the aid of one or more examples, describe three ways that central 7 business districts (CBDs) are changing. Any CBD context(s) (LIC, MIC or HIC) are valid. Description of changes to the CBD may include: • expansion • urban renewal • increase in height of buildings • zones of discard and accretion • transport changes, e.g. new stations, pedestrianisation • clustering of services • relocation outwards of key functions • new ‘flagship’ or ‘iconic’ developments • increase in negative externalities, e.g. crime, pollution • increase in positive externalities, e.g. greening • other Do not credit explanation as the command is ‘describe’. Credit a simple way 1 mark and a developed way, with detail, depth or the use of an example, 2 marks or 3 marks, to the maximum. For the identification of three ways without the example(s), max. 3. 6(b) Explain how competition for space (spatial competition) affects where 8 retailing locates within urban areas. Candidates will develop their own explanation integrating knowledge and understanding of spatial competition and the location of retailing. Spatial competition occurs in urban areas because: • urban locations are desirable, especially central ones and easily accessible ones, e.g. at route nodes, because of market potential and profitability • space within urban areas is limited, especially central space • retailers bid for space and the highest bidder gains the use of that space The type of retailing found in CBDs is usually high threshold/high turnover such as department stores, prestige shops, specialist shops, comparison shops, e.g. clothing, shoes. There may be small convenience shops selling food, newspapers etc. Retailers needing more space, e.g. supermarkets, furniture, DIY, vehicle sales, bid for larger plots in outer urban areas with space for parking. These are often close to main peripheral roads, major routes or route nodes, closer to where people live and where spatial competition is less intense than in central areas. Max. 3 marks for a generic answer without an example or examples. Award marks based on the quality of explanation and breadth of the response using the marking levels below. Level 3 (6–8) Response explains how competition for space (spatial competition) affects where retailing locates within urban areas in a clear and focussed manner. Response is well founded in detailed knowledge and strong conceptual understanding of the topic. Any examples used are appropriate and integrated effectively into the response. Level 2 (3–5) Response explains how competition for space (spatial competition) affects where retailing locates within urban areas in a limited way. Response develops on a largely secure base of knowledge and understanding. Examples may lack detail or development. Level 1 (1–2) Response comprises one or more points about retailing which may not be focussed on how competition for space (spatial competition) affects its location within urban areas. Knowledge is basic and understanding may be inaccurate. Examples are in name only or lacking entirely. Level 0 (0) No creditable response. 6(c) Assess the influence of planning on one or more urban settlements. 15 Candidates are free to develop their own approach to the question and responses will vary depending on the approach chosen. Whichever approach is chosen, essays which address the question and support their argument with relevant examples will be credited. There may be detailed consideration of a case study/one or more examples, or a broadly conceived response, drawing on several examples to illustrate the factors involved. Planning is to be understood as the work of planners in town or city, state or national governments. It affects what happens in urban settlements (function or activity) and where it happens (location). The syllabus also includes planning as affecting residential segregation. Planning is involved in changes to the CBD, providing infrastructure (power or transport) and the lack of planning (or the occupation of designated areas) influences shanty towns (squatter settlements). Candidates may balance the assessment with the influence of other factors, e.g. historical, physical (coast, mountains), economic, e.g. (lack of) finance. Some urban settlements are fully planned, such as new towns and some capital cities. Award marks based on the quality of the response using the marking levels below. Level 4 (12–15) Response thoroughly discusses the influence of planning and at least one other factor on one or more urban settlements in a clear and well developed assessment. Response is well founded in detailed knowledge and strong conceptual understanding of the topic. Level 3 (8–11) Response discusses the role of planning and offers an assessment of its influence on the chosen urban settlement(s) but may be unbalanced. Examples may lack detail or development. Response develops on a largely secure base of knowledge and understanding. Level 2 (4–7) Response shows general knowledge and understanding of urban settlements with limited focus on the question of the influence of planning. Response is mainly descriptive or explanatory with limited use of examples and understanding of the topic may be partial or inaccurate. Some concluding remarks. General responses without the use of example(s) will not get above the middle of Level 2 (6 marks). Level 1 (1–3) Response may broadly discuss urban settlements but does not address the question and does not come to a convincing conclusion. Response is descriptive, knowledge is basic and understanding is poor. Level 0 (0) No creditable response.
What was in this paper
The subtopics covered by these 6 questions, and how many questions each got. Open one in a new tab to see every Cambridge question on it.
What you needed in this session
Cambridge’s own grade thresholds for 2019 Oct/Nov, Paper 2 · Variant 1. A higher threshold means an easier paper — the bar moves with how the cohort did.