Cambridge A Level Geography 9696 — 2019 Oct/Nov Paper 2 · Variant 2
9696/22/O/N/19 · 60 marks · ≈68 min
The question paper and its mark scheme, free to read here and free to download. This is Cambridge’s own paper, exactly as it was sat.
Question paper4 pages

Mark scheme16 pages
Answers below. Sit the paper first if you are practising.


Paper as text
Question paper, page 1
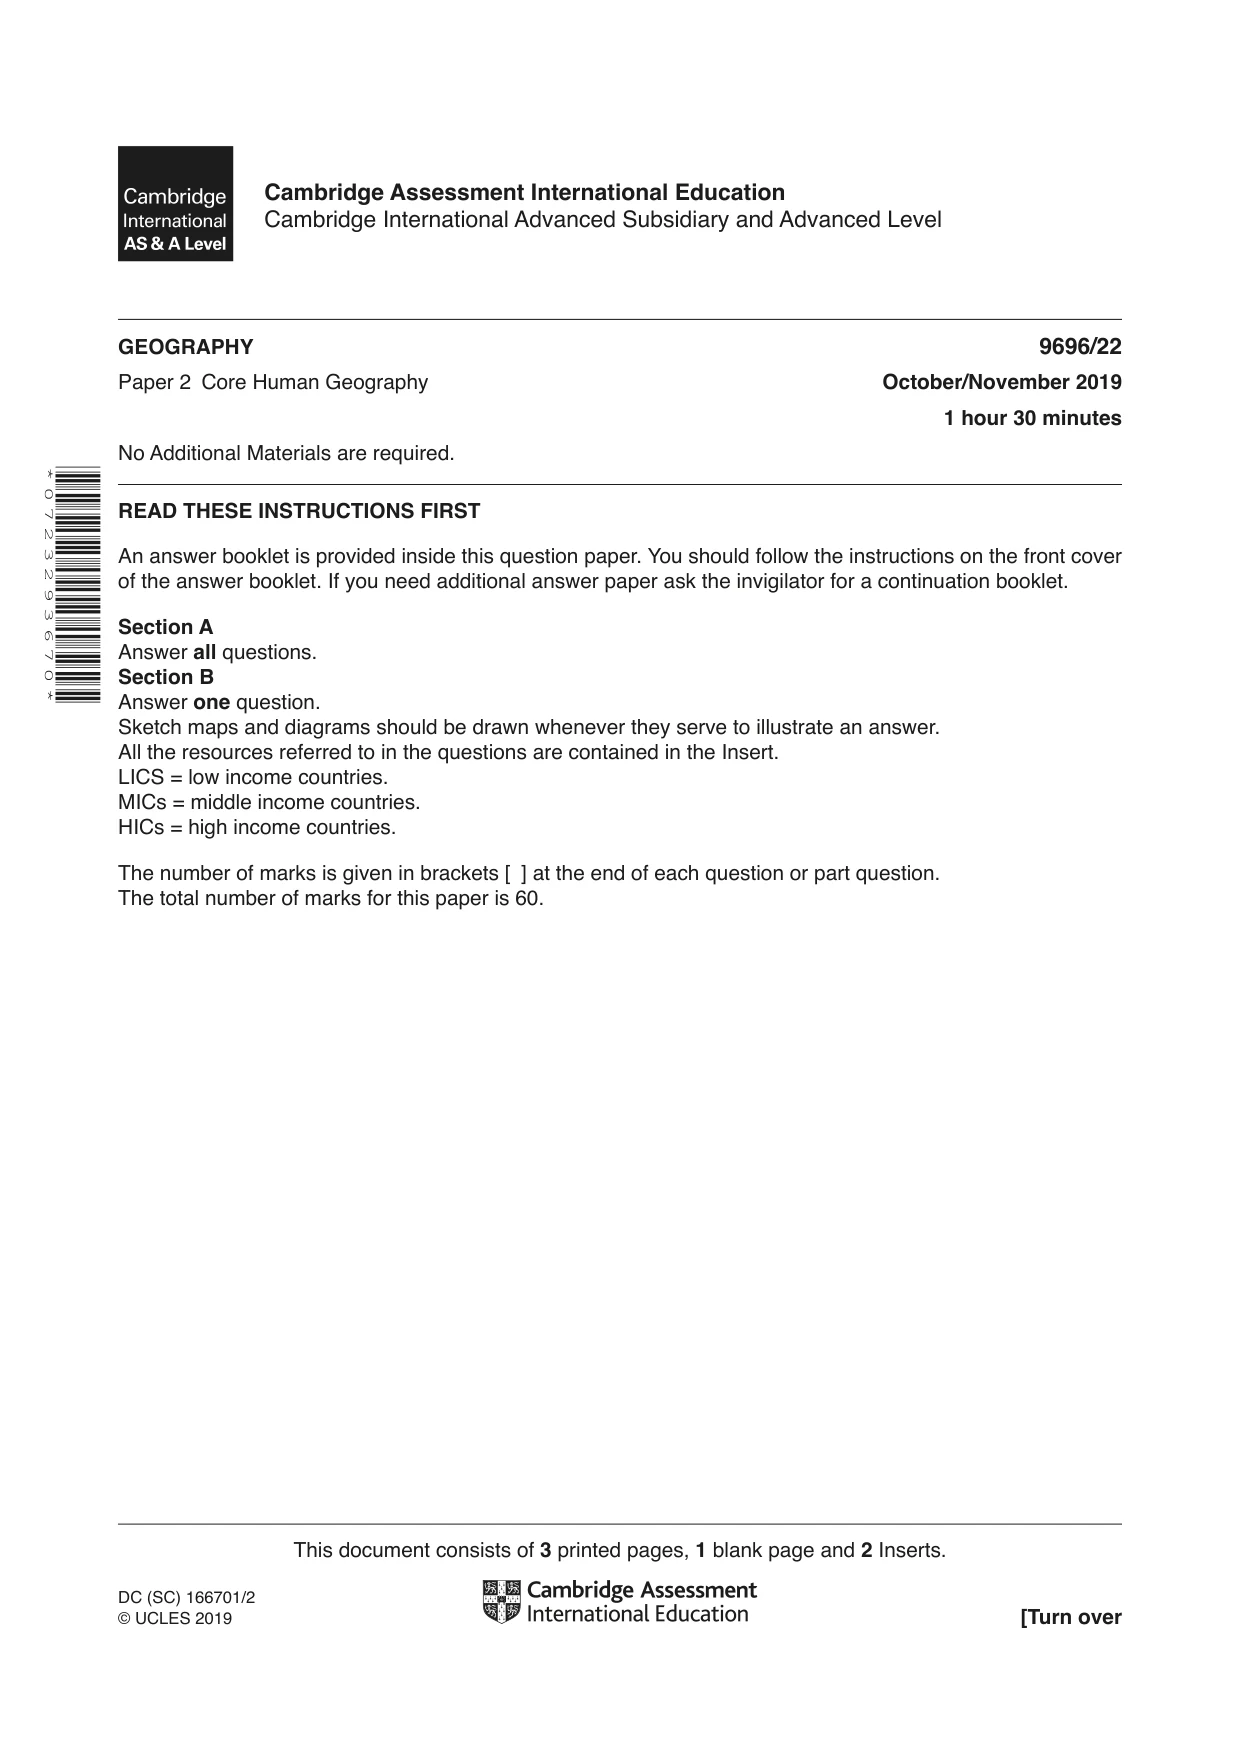
This document consists of 3 printed pages, 1 blank page and 2 Inserts. DC (SC) 166701/2 © UCLES 2019 [Turn over Cambridge Assessment International Education Cambridge International Advanced Subsidiary and Advanced Level * 0 7 2 3 2 9 3 6 7 0 * GEOGRAPHY 9696/22 Paper 2 Core Human Geography October/November 2019 1 hour 30 minutes No Additional Materials are required. READ THESE INSTRUCTIONS FIRST An answer booklet is provided inside this question paper. You should follow the instructions on the front cover of the answer booklet. If you need additional answer paper ask the invigilator for a continuation booklet. Section A Answer all questions. Section B Answer one question. Sketch maps and diagrams should be drawn whenever they serve to illustrate an answer. All the resources referred to in the questions are contained in the Insert. LICS = low income countries. MICs = middle income countries. HICs = high income countries. The number of marks is given in brackets [ ] at the end of each question or part question. The total number of marks for this paper is 60.
Question paper, page 2
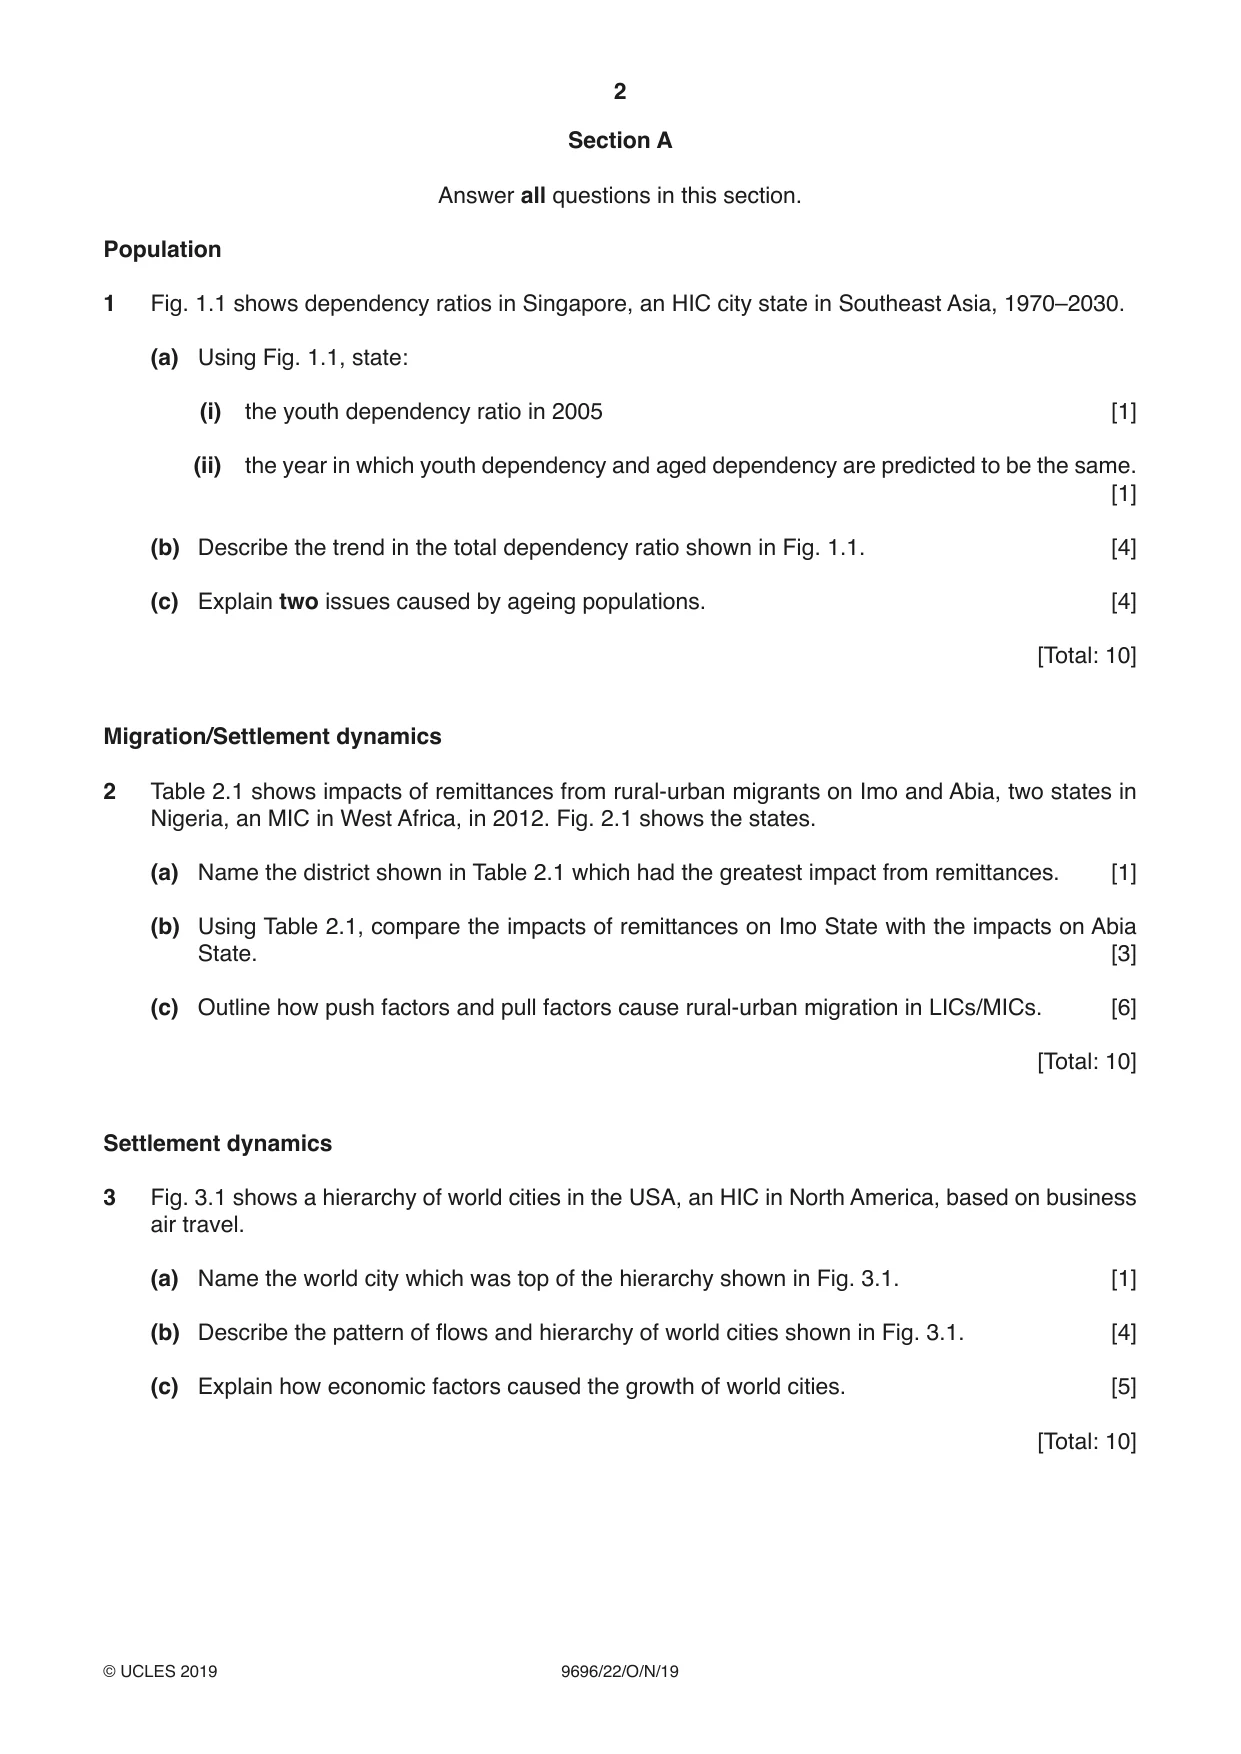
2 9696/22/O/N/19 © UCLES 2019 Section A Answer all questions in this section. Population 1 Fig. 1.1 shows dependency ratios in Singapore, an HIC city state in Southeast Asia, 1970–2030. (a) Using Fig. 1.1, state: (i) the youth dependency ratio in 2005 [1] (ii) the year in which youth dependency and aged dependency are predicted to be the same. [1] (b) Describe the trend in the total dependency ratio shown in Fig. 1.1. [4] (c) Explain two issues caused by ageing populations. [4] [Total: 10] Migration/Settlement dynamics 2 Table 2.1 shows impacts of remittances from rural-urban migrants on Imo and Abia, two states in Nigeria, an MIC in West Africa, in 2012. Fig. 2.1 shows the states. (a) Name the district shown in Table 2.1 which had the greatest impact from remittances. [1] (b) Using Table 2.1, compare the impacts of remittances on Imo State with the impacts on Abia State. [3] (c) Outline how push factors and pull factors cause rural-urban migration in LICs/MICs. [6] [Total: 10] Settlement dynamics 3 Fig. 3.1 shows a hierarchy of world cities in the USA, an HIC in North America, based on business air travel. (a) Name the world city which was top of the hierarchy shown in Fig. 3.1. [1] (b) Describe the pattern of flows and hierarchy of world cities shown in Fig. 3.1. [4] (c) Explain how economic factors caused the growth of world cities. [5] [Total: 10]
Question paper, page 3
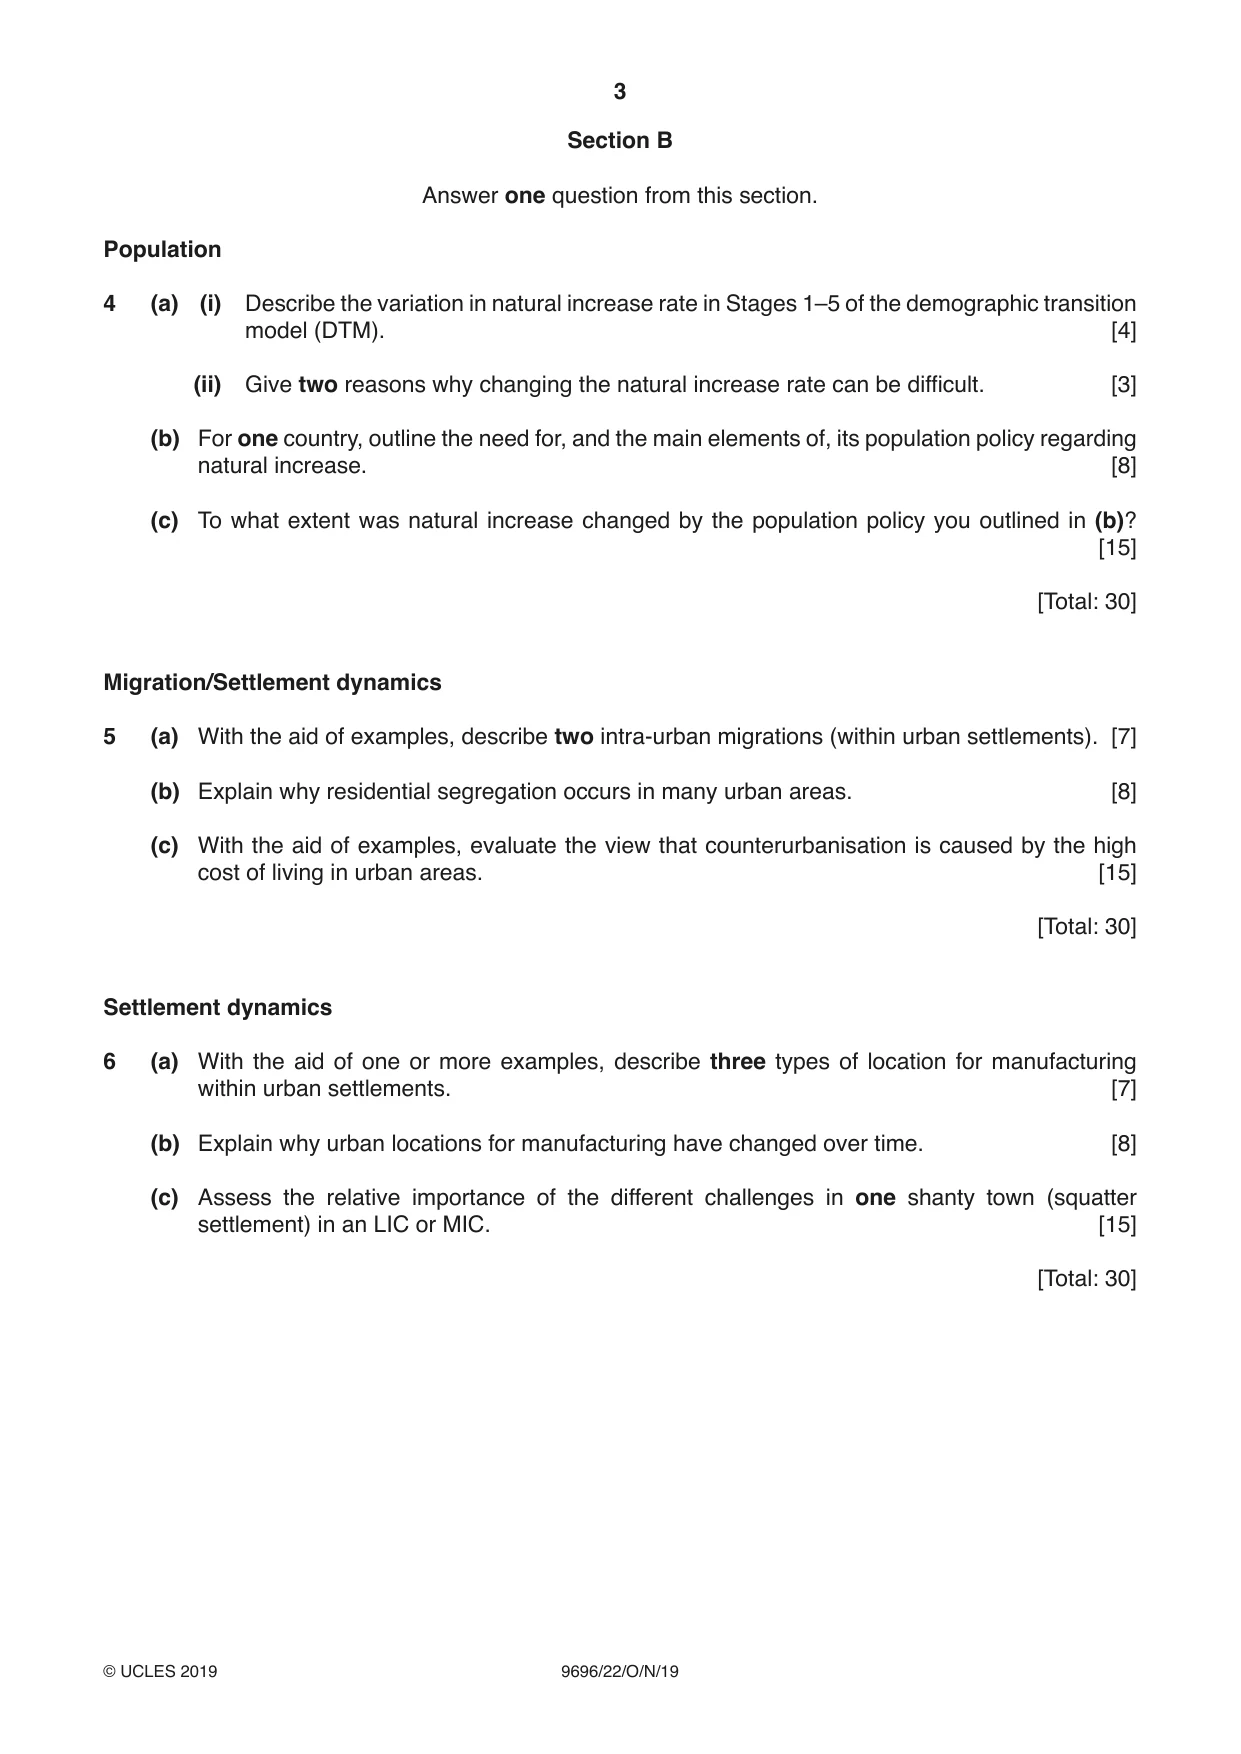
3 9696/22/O/N/19 © UCLES 2019 Section B Answer one question from this section. Population 4 (a) (i) Describe the variation in natural increase rate in Stages 1–5 of the demographic transition model (DTM). [4] (ii) Give two reasons why changing the natural increase rate can be difficult. [3] (b) For one country, outline the need for, and the main elements of, its population policy regarding natural increase. [8] (c) To what extent was natural increase changed by the population policy you outlined in (b)? [15] [Total: 30] Migration/Settlement dynamics 5 (a) With the aid of examples, describe two intra-urban migrations (within urban settlements). [7] (b) Explain why residential segregation occurs in many urban areas. [8] (c) With the aid of examples, evaluate the view that counterurbanisation is caused by the high cost of living in urban areas. [15] [Total: 30] Settlement dynamics 6 (a) With the aid of one or more examples, describe three types of location for manufacturing within urban settlements. [7] (b) Explain why urban locations for manufacturing have changed over time. [8] (c) Assess the relative importance of the different challenges in one shanty town (squatter settlement) in an LIC or MIC. [15] [Total: 30]
Question paper, page 4
4 9696/22/O/N/19 © UCLES 2019 BLANK PAGE Permission to reproduce items where third-party owned material protected by copyright is included has been sought and cleared where possible. Every reasonable effort has been made by the publisher (UCLES) to trace copyright holders, but if any items requiring clearance have unwittingly been included, the publisher will be pleased to make amends at the earliest possible opportunity. To avoid the issue of disclosure of answer-related information to candidates, all copyright acknowledgements are reproduced online in the Cambridge Assessment International Education Copyright Acknowledgements Booklet. This is produced for each series of examinations and is freely available to download at www.cambridgeinternational.org after the live examination series. Cambridge Assessment International Education is part of the Cambridge Assessment Group. Cambridge Assessment is the brand name of the University of Cambridge Local Examinations Syndicate (UCLES), which itself is a department of the University of Cambridge.
Mark scheme, page 1
This document consists of 16 printed pages. © UCLES 2019 [Turn over Cambridge Assessment International Education Cambridge International Advanced Subsidiary and Advanced Level GEOGRAPHY 9696/22 Paper 2 Core Human Geography October/November 2019 MARK SCHEME Maximum Mark: 60 Published This mark scheme is published as an aid to teachers and candidates, to indicate the requirements of the examination. It shows the basis on which Examiners were instructed to award marks. It does not indicate the details of the discussions that took place at an Examiners’ meeting before marking began, which would have considered the acceptability of alternative answers. Mark schemes should be read in conjunction with the question paper and the Principal Examiner Report for Teachers. Cambridge International will not enter into discussions about these mark schemes. Cambridge International is publishing the mark schemes for the October/November 2019 series for most Cambridge IGCSE™, Cambridge International A and AS Level components and some Cambridge O Level components.
Mark scheme, page 2
9696/22 Cambridge International AS/A Level – Mark Scheme PUBLISHED October/November 2019 © UCLES 2019 Page 2 of 16 Generic Marking Principles These general marking principles must be applied by all examiners when marking candidate answers. They should be applied alongside the specific content of the mark scheme or generic level descriptors for a question. Each question paper and mark scheme will also comply with these marking principles. GENERIC MARKING PRINCIPLE 1: Marks must be awarded in line with: • the specific content of the mark scheme or the generic level descriptors for the question • the specific skills defined in the mark scheme or in the generic level descriptors for the question • the standard of response required by a candidate as exemplified by the standardisation scripts. GENERIC MARKING PRINCIPLE 2: Marks awarded are always whole marks (not half marks, or other fractions). GENERIC MARKING PRINCIPLE 3: Marks must be awarded positively: • marks are awarded for correct/valid answers, as defined in the mark scheme. However, credit is given for valid answers which go beyond the scope of the syllabus and mark scheme, referring to your Team Leader as appropriate • marks are awarded when candidates clearly demonstrate what they know and can do • marks are not deducted for errors • marks are not deducted for omissions • answers should only be judged on the quality of spelling, punctuation and grammar when these features are specifically assessed by the question as indicated by the mark scheme. The meaning, however, should be unambiguous. GENERIC MARKING PRINCIPLE 4: Rules must be applied consistently e.g. in situations where candidates have not followed instructions or in the application of generic level descriptors. GENERIC MARKING PRINCIPLE 5: Marks should be awarded using the full range of marks defined in the mark scheme for the question (however; the use of the full mark range may be limited according to the quality of the candidate responses seen). GENERIC MARKING PRINCIPLE 6: Marks awarded are based solely on the requirements as defined in the mark scheme. Marks should not be awarded with grade thresholds or grade descriptors in mind.
Mark scheme, page 3
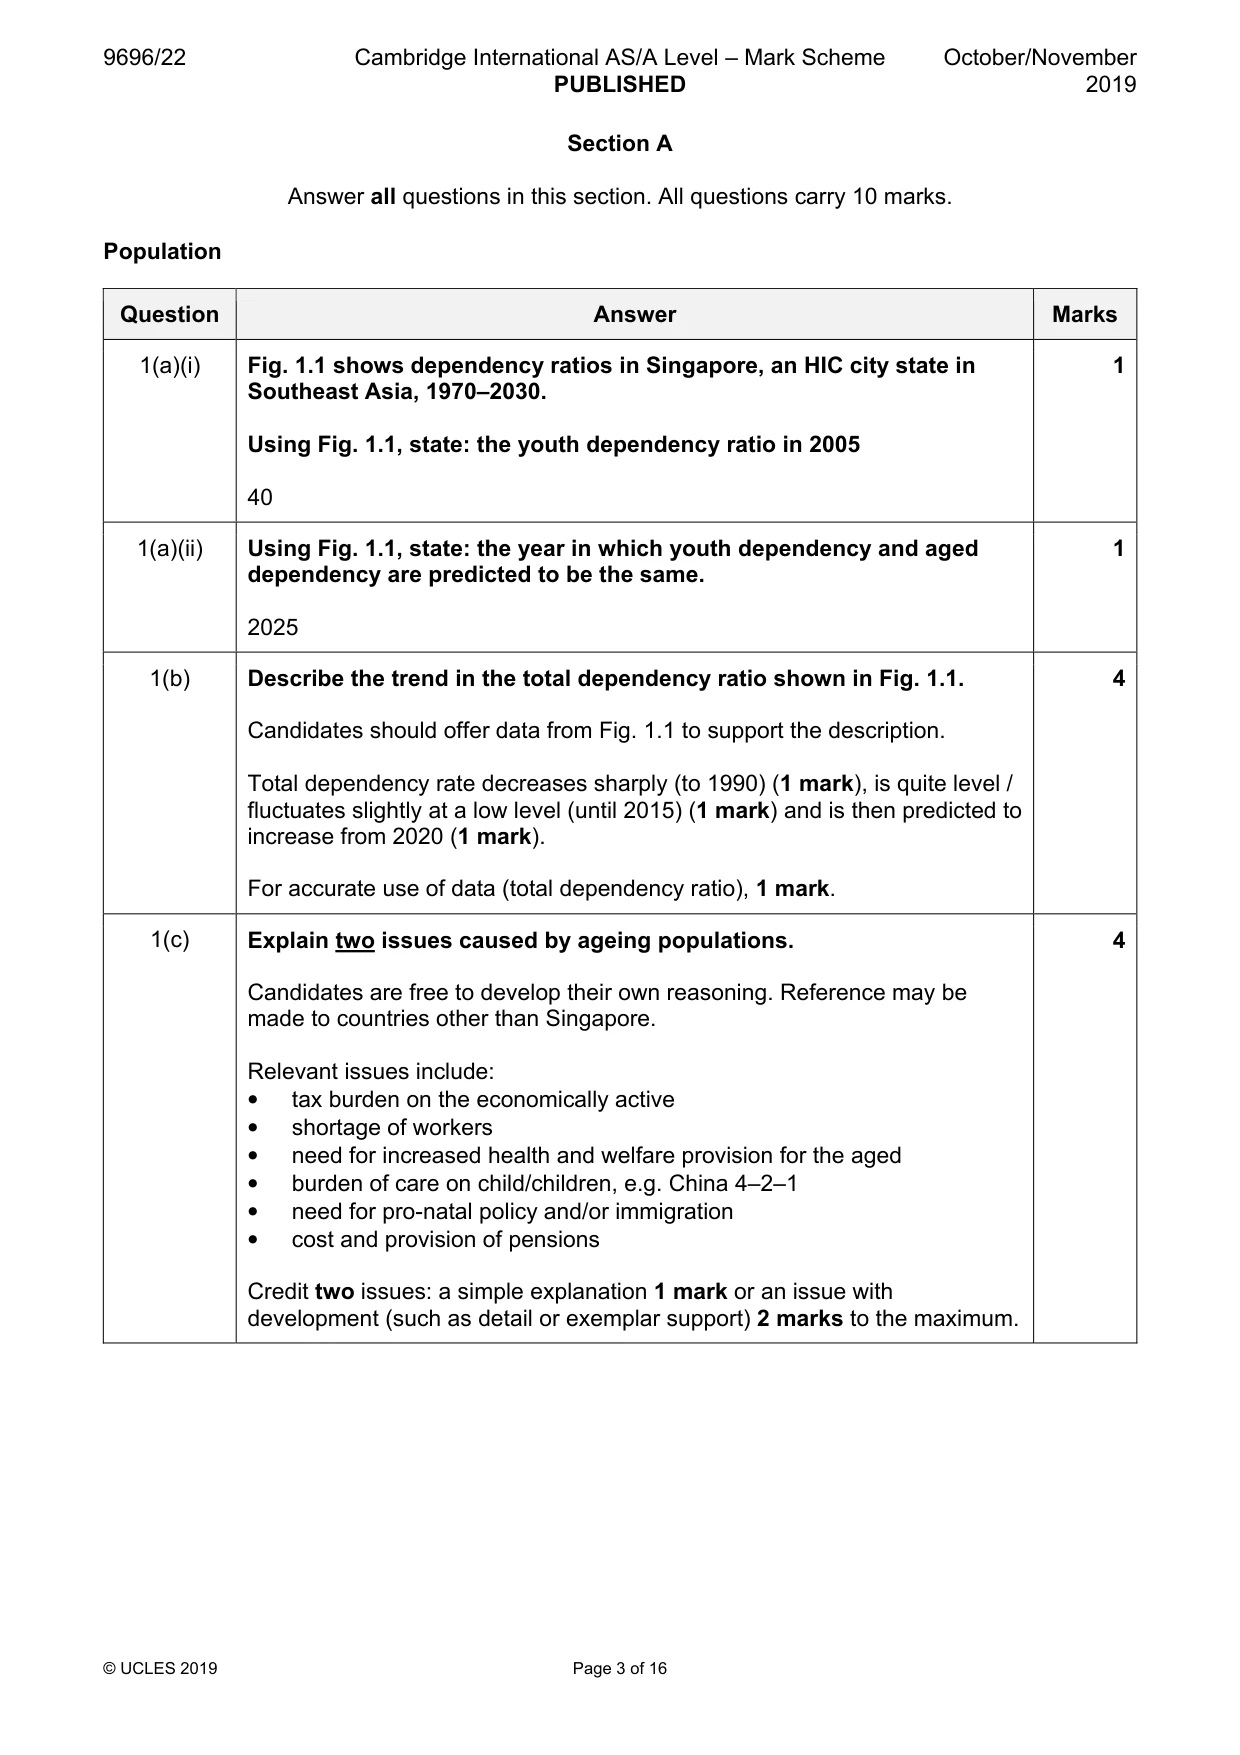
9696/22 Cambridge International AS/A Level – Mark Scheme PUBLISHED October/November 2019 © UCLES 2019 Page 3 of 16 Section A Answer all questions in this section. All questions carry 10 marks. Population Question Answer Marks 1(a)(i) Fig. 1.1 shows dependency ratios in Singapore, an HIC city state in Southeast Asia, 1970–2030. Using Fig. 1.1, state: the youth dependency ratio in 2005 40 1 1(a)(ii) Using Fig. 1.1, state: the year in which youth dependency and aged dependency are predicted to be the same. 2025 1 1(b) Describe the trend in the total dependency ratio shown in Fig. 1.1. Candidates should offer data from Fig. 1.1 to support the description. Total dependency rate decreases sharply (to 1990) (1 mark), is quite level / fluctuates slightly at a low level (until 2015) (1 mark) and is then predicted to increase from 2020 (1 mark). For accurate use of data (total dependency ratio), 1 mark. 4 1(c) Explain two issues caused by ageing populations. Candidates are free to develop their own reasoning. Reference may be made to countries other than Singapore. Relevant issues include: • tax burden on the economically active • shortage of workers • need for increased health and welfare provision for the aged • burden of care on child/children, e.g. China 4–2–1 • need for pro-natal policy and/or immigration • cost and provision of pensions Credit two issues: a simple explanation 1 mark or an issue with development (such as detail or exemplar support) 2 marks to the maximum. 4
Mark scheme, page 4
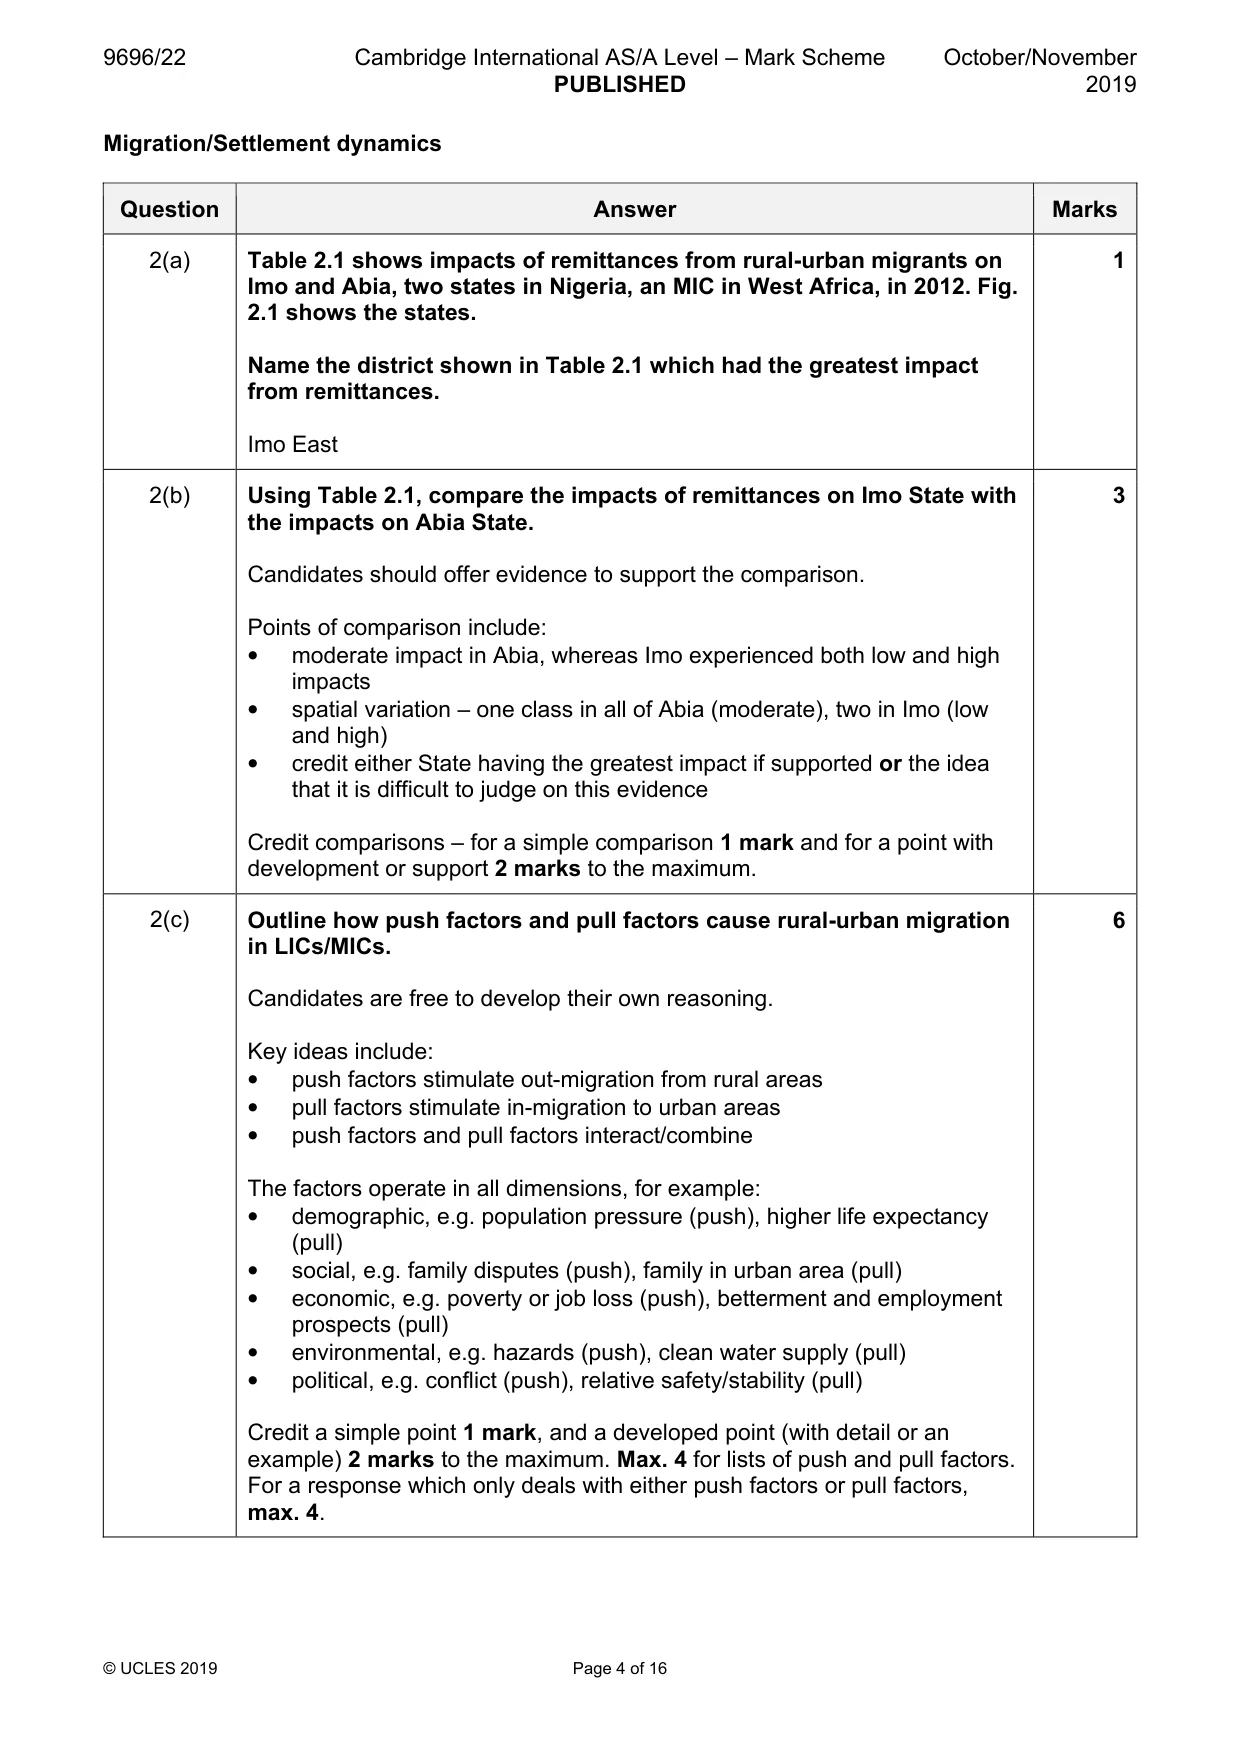
9696/22 Cambridge International AS/A Level – Mark Scheme PUBLISHED October/November 2019 © UCLES 2019 Page 4 of 16 Migration/Settlement dynamics Question Answer Marks 2(a) Table 2.1 shows impacts of remittances from rural-urban migrants on Imo and Abia, two states in Nigeria, an MIC in West Africa, in 2012. Fig. 2.1 shows the states. Name the district shown in Table 2.1 which had the greatest impact from remittances. Imo East 1 2(b) Using Table 2.1, compare the impacts of remittances on Imo State with the impacts on Abia State. Candidates should offer evidence to support the comparison. Points of comparison include: • moderate impact in Abia, whereas Imo experienced both low and high impacts • spatial variation – one class in all of Abia (moderate), two in Imo (low and high) • credit either State having the greatest impact if supported or the idea that it is difficult to judge on this evidence Credit comparisons – for a simple comparison 1 mark and for a point with development or support 2 marks to the maximum. 3 2(c) Outline how push factors and pull factors cause rural-urban migration in LICs/MICs. Candidates are free to develop their own reasoning. Key ideas include: • push factors stimulate out-migration from rural areas • pull factors stimulate in-migration to urban areas • push factors and pull factors interact/combine The factors operate in all dimensions, for example: • demographic, e.g. population pressure (push), higher life expectancy (pull) • social, e.g. family disputes (push), family in urban area (pull) • economic, e.g. poverty or job loss (push), betterment and employment prospects (pull) • environmental, e.g. hazards (push), clean water supply (pull) • political, e.g. conflict (push), relative safety/stability (pull) Credit a simple point 1 mark, and a developed point (with detail or an example) 2 marks to the maximum. Max. 4 for lists of push and pull factors. For a response which only deals with either push factors or pull factors, max. 4. 6
Mark scheme, page 5
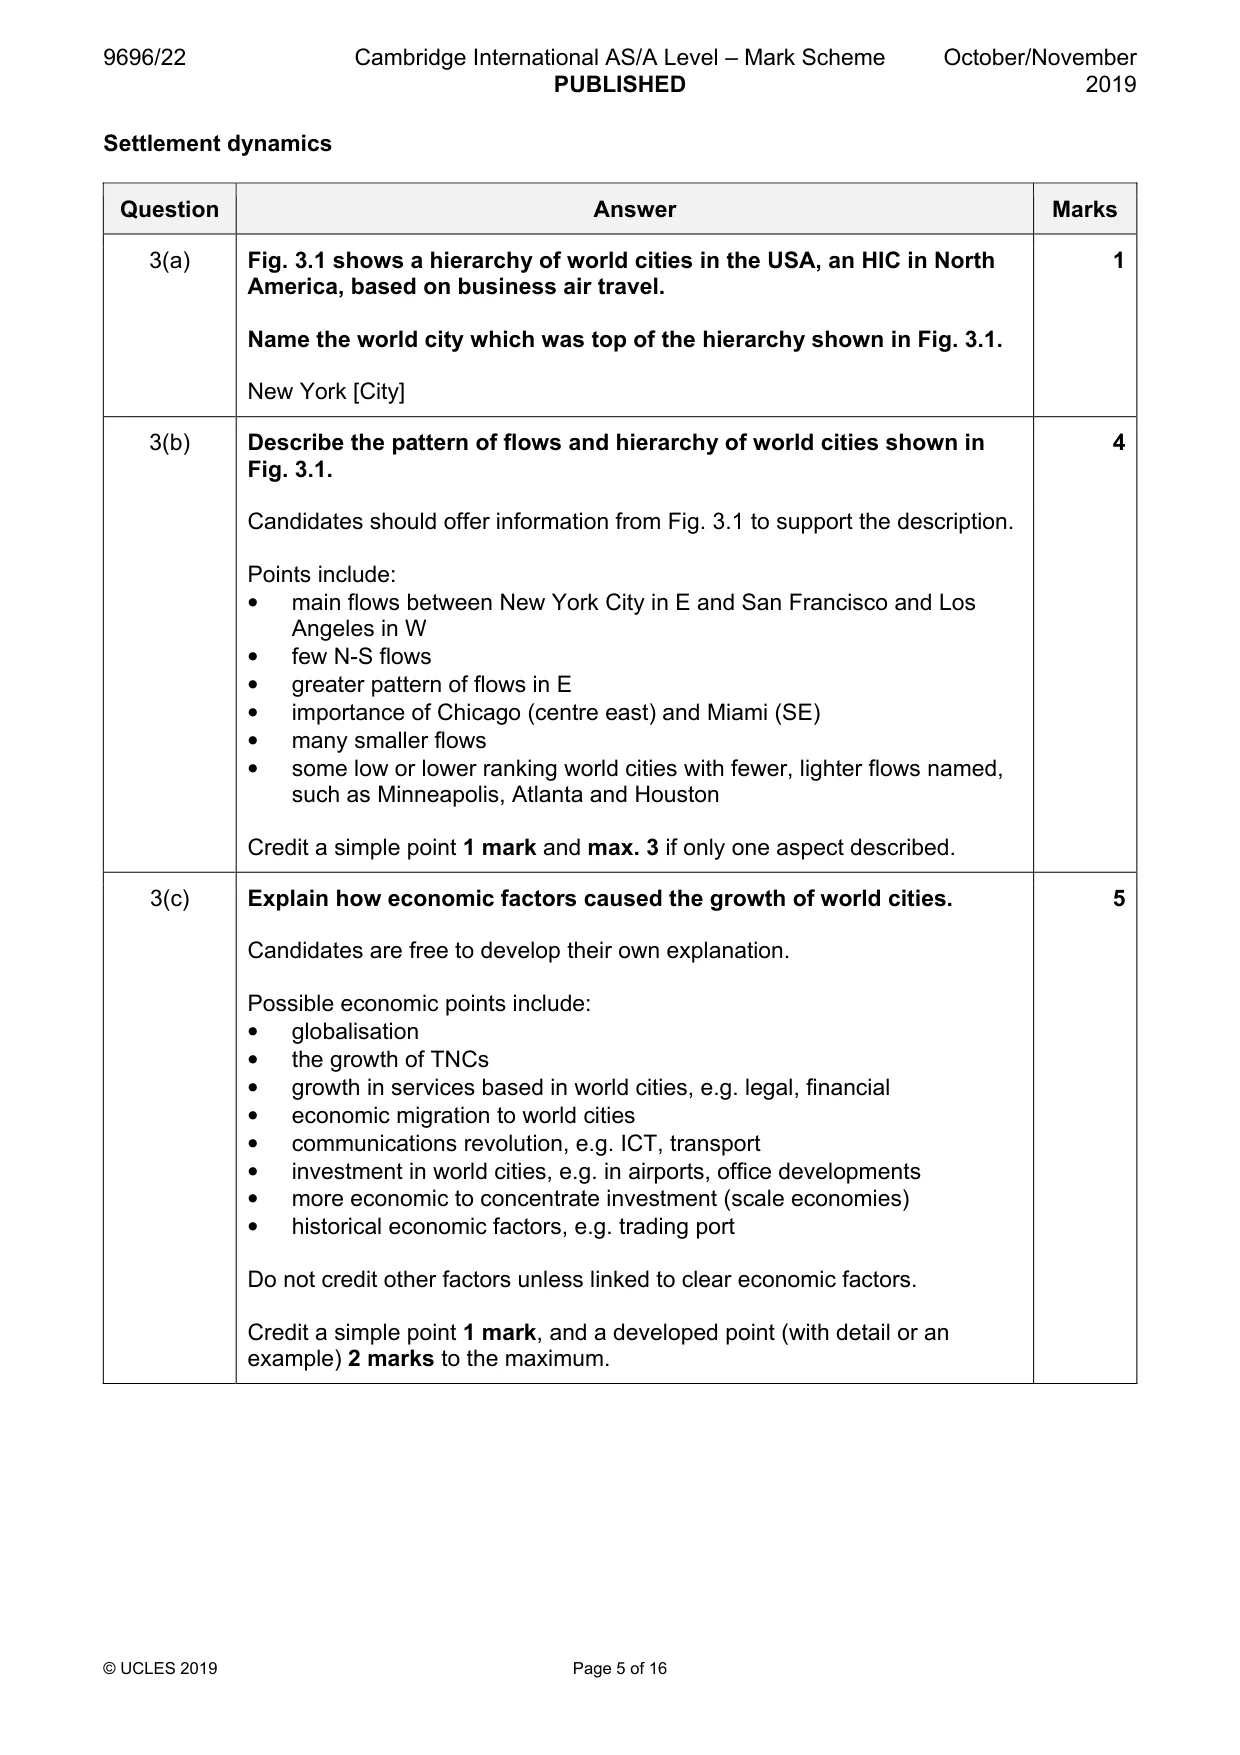
9696/22 Cambridge International AS/A Level – Mark Scheme PUBLISHED October/November 2019 © UCLES 2019 Page 5 of 16 Settlement dynamics Question Answer Marks 3(a) Fig. 3.1 shows a hierarchy of world cities in the USA, an HIC in North America, based on business air travel. Name the world city which was top of the hierarchy shown in Fig. 3.1. New York [City] 1 3(b) Describe the pattern of flows and hierarchy of world cities shown in Fig. 3.1. Candidates should offer information from Fig. 3.1 to support the description. Points include: • main flows between New York City in E and San Francisco and Los Angeles in W • few N-S flows • greater pattern of flows in E • importance of Chicago (centre east) and Miami (SE) • many smaller flows • some low or lower ranking world cities with fewer, lighter flows named, such as Minneapolis, Atlanta and Houston Credit a simple point 1 mark and max. 3 if only one aspect described. 4 3(c) Explain how economic factors caused the growth of world cities. Candidates are free to develop their own explanation. Possible economic points include: • globalisation • the growth of TNCs • growth in services based in world cities, e.g. legal, financial • economic migration to world cities • communications revolution, e.g. ICT, transport • investment in world cities, e.g. in airports, office developments • more economic to concentrate investment (scale economies) • historical economic factors, e.g. trading port Do not credit other factors unless linked to clear economic factors. Credit a simple point 1 mark, and a developed point (with detail or an example) 2 marks to the maximum. 5
Mark scheme, page 6
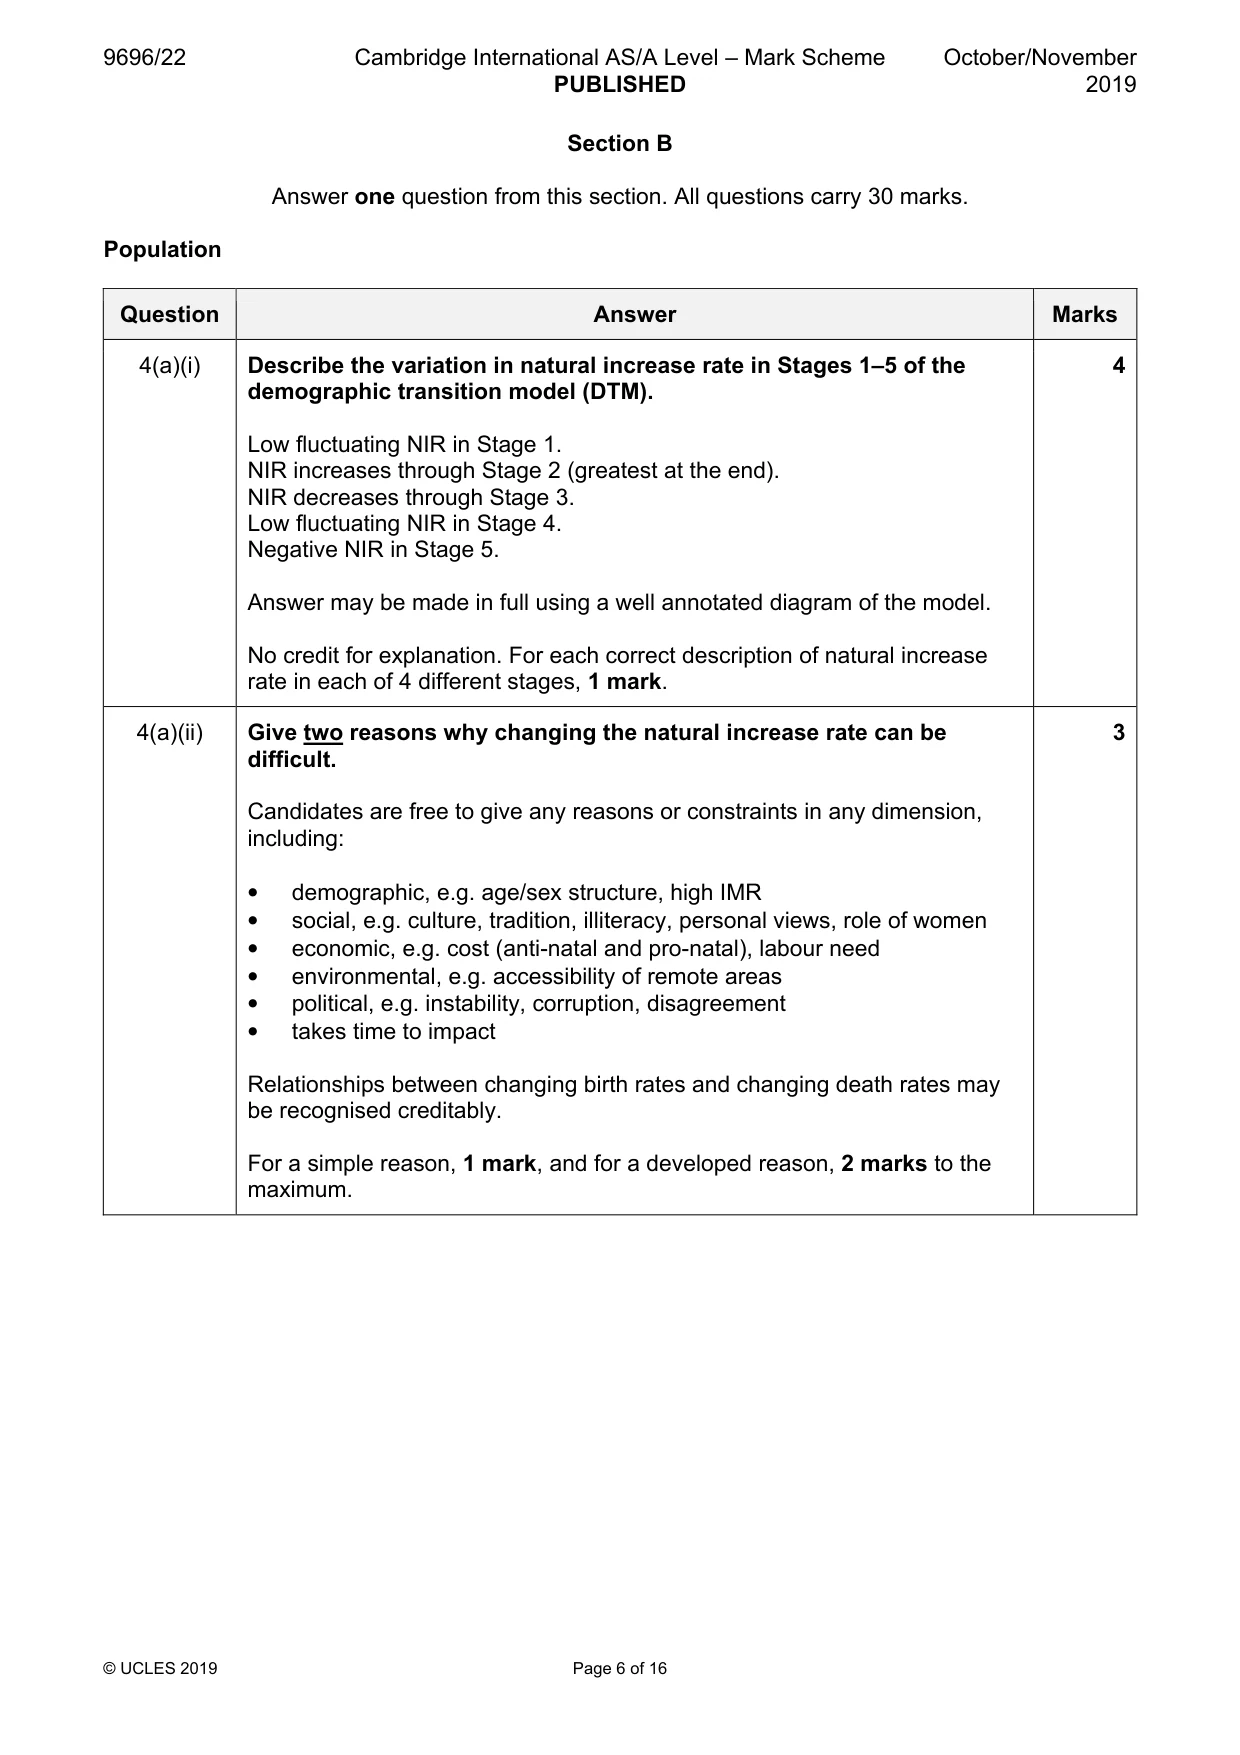
9696/22 Cambridge International AS/A Level – Mark Scheme PUBLISHED October/November 2019 © UCLES 2019 Page 6 of 16 Section B Answer one question from this section. All questions carry 30 marks. Population Question Answer Marks 4(a)(i) Describe the variation in natural increase rate in Stages 1–5 of the demographic transition model (DTM). Low fluctuating NIR in Stage 1. NIR increases through Stage 2 (greatest at the end). NIR decreases through Stage 3. Low fluctuating NIR in Stage 4. Negative NIR in Stage 5. Answer may be made in full using a well annotated diagram of the model. No credit for explanation. For each correct description of natural increase rate in each of 4 different stages, 1 mark. 4 4(a)(ii) Give two reasons why changing the natural increase rate can be difficult. Candidates are free to give any reasons or constraints in any dimension, including: • demographic, e.g. age/sex structure, high IMR • social, e.g. culture, tradition, illiteracy, personal views, role of women • economic, e.g. cost (anti-natal and pro-natal), labour need • environmental, e.g. accessibility of remote areas • political, e.g. instability, corruption, disagreement • takes time to impact Relationships between changing birth rates and changing death rates may be recognised creditably. For a simple reason, 1 mark, and for a developed reason, 2 marks to the maximum. 3
Mark scheme, page 7
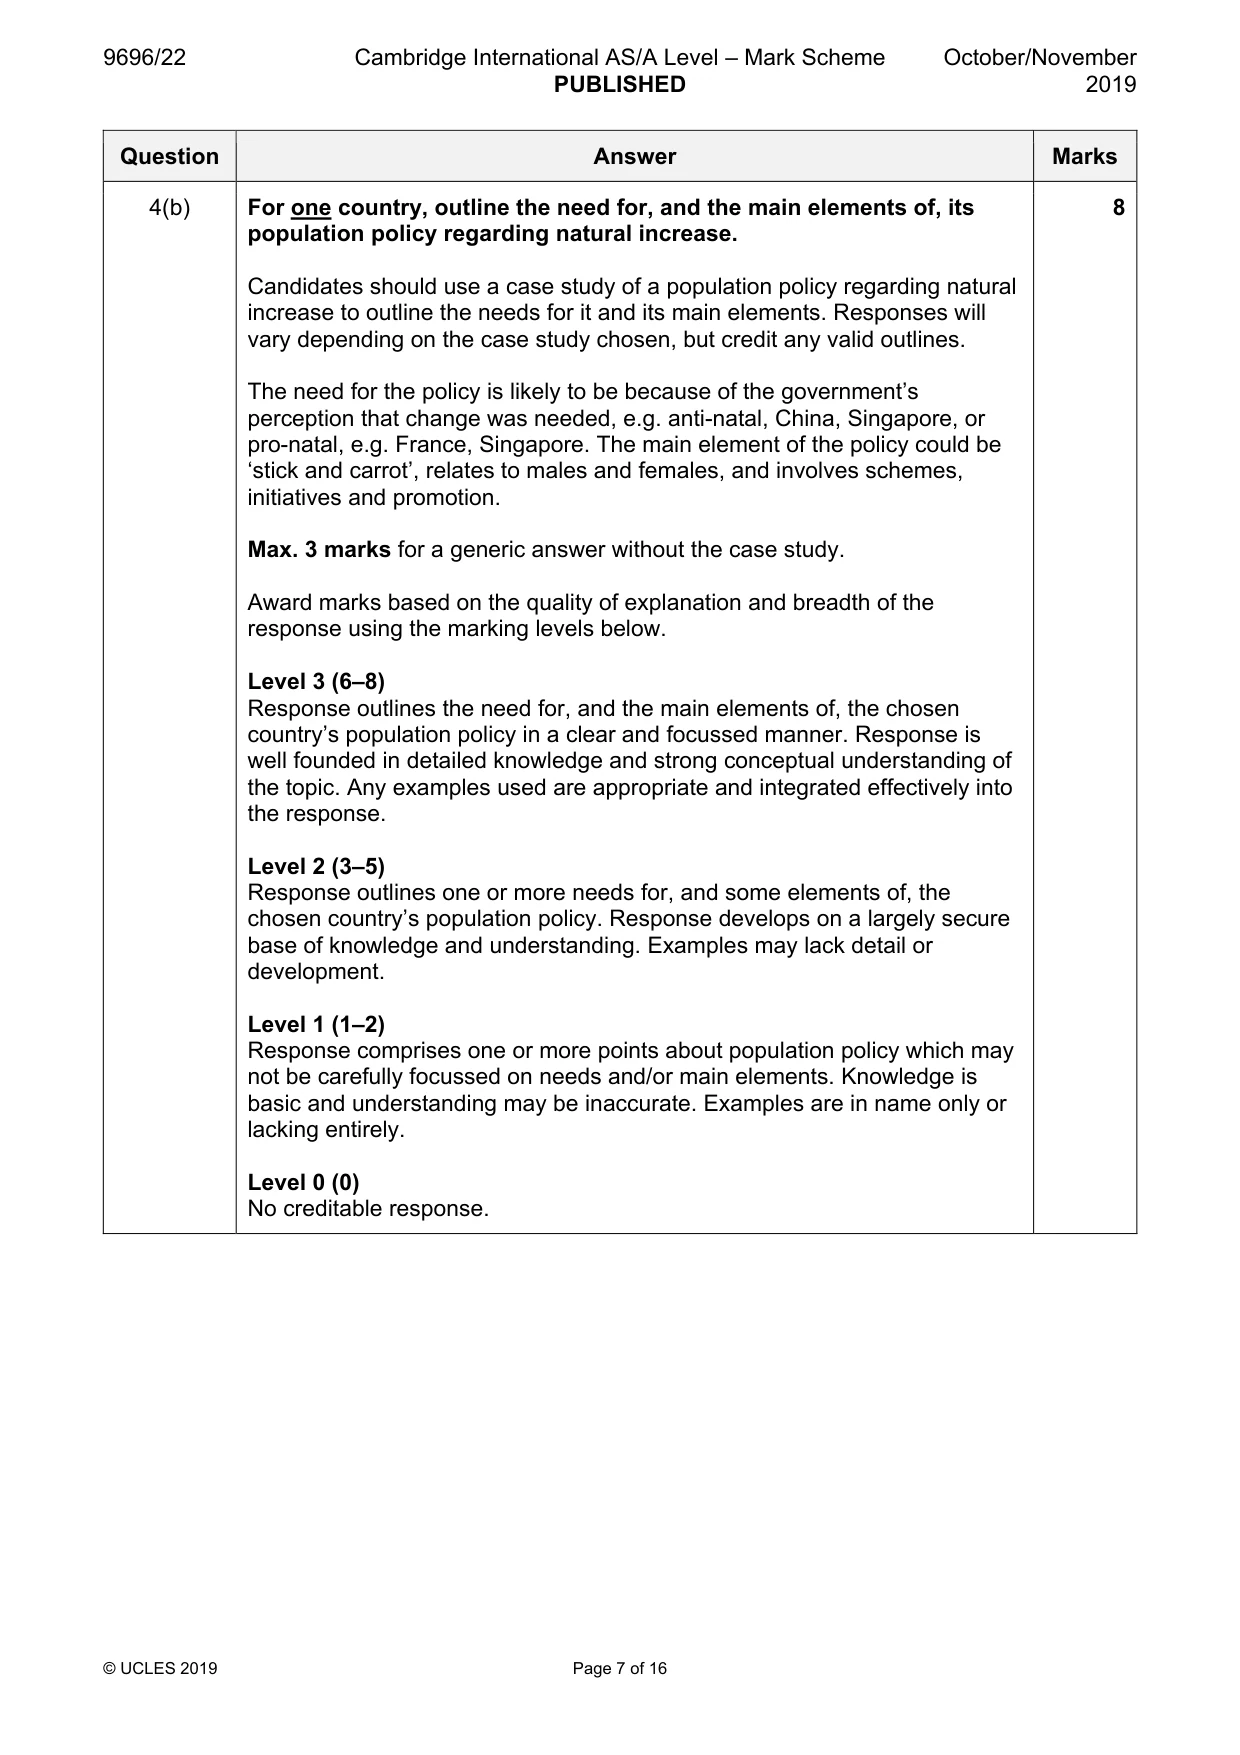
9696/22 Cambridge International AS/A Level – Mark Scheme PUBLISHED October/November 2019 © UCLES 2019 Page 7 of 16 Question Answer Marks 4(b) For one country, outline the need for, and the main elements of, its population policy regarding natural increase. Candidates should use a case study of a population policy regarding natural increase to outline the needs for it and its main elements. Responses will vary depending on the case study chosen, but credit any valid outlines. The need for the policy is likely to be because of the government’s perception that change was needed, e.g. anti-natal, China, Singapore, or pro-natal, e.g. France, Singapore. The main element of the policy could be ‘stick and carrot’, relates to males and females, and involves schemes, initiatives and promotion. Max. 3 marks for a generic answer without the case study. Award marks based on the quality of explanation and breadth of the response using the marking levels below. Level 3 (6–8) Response outlines the need for, and the main elements of, the chosen country’s population policy in a clear and focussed manner. Response is well founded in detailed knowledge and strong conceptual understanding of the topic. Any examples used are appropriate and integrated effectively into the response. Level 2 (3–5) Response outlines one or more needs for, and some elements of, the chosen country’s population policy. Response develops on a largely secure base of knowledge and understanding. Examples may lack detail or development. Level 1 (1–2) Response comprises one or more points about population policy which may not be carefully focussed on needs and/or main elements. Knowledge is basic and understanding may be inaccurate. Examples are in name only or lacking entirely. Level 0 (0) No creditable response. 8
Mark scheme, page 8
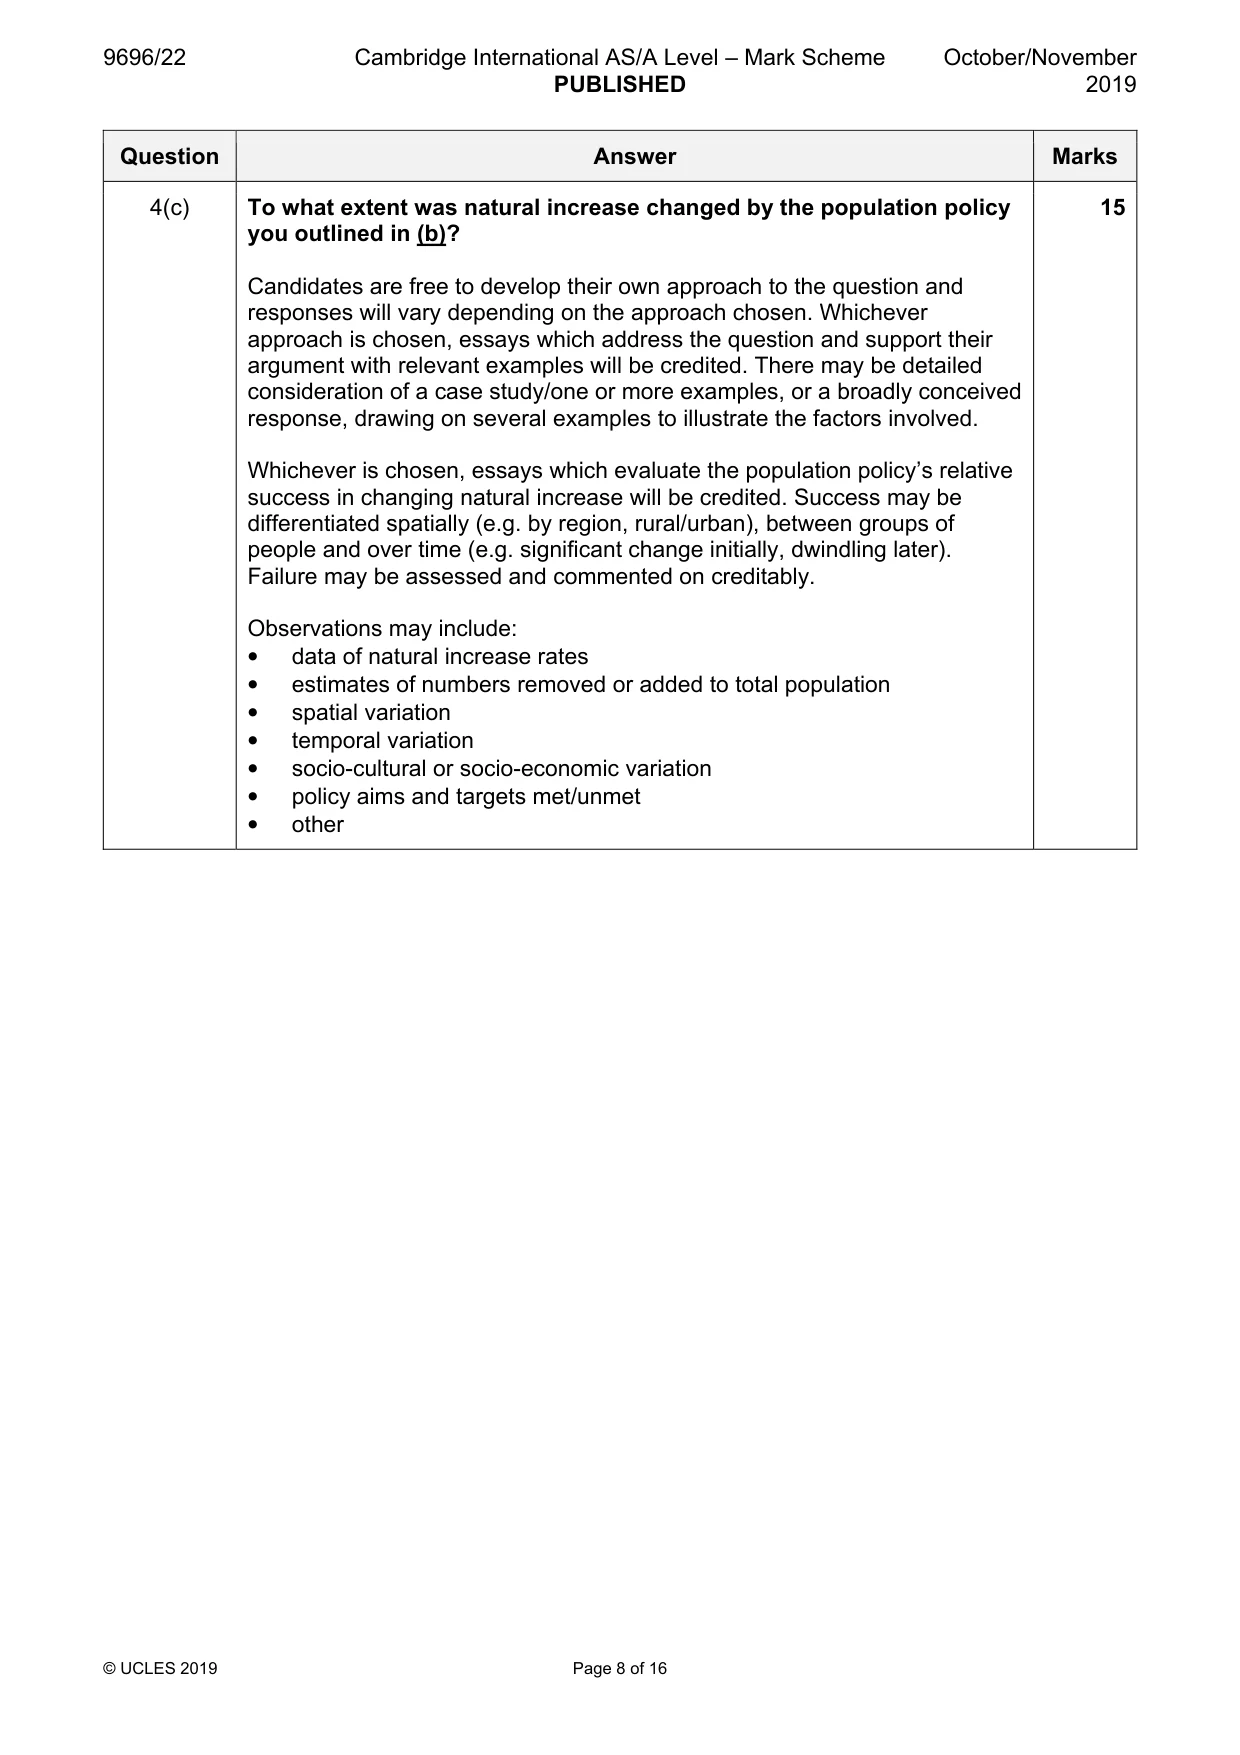
9696/22 Cambridge International AS/A Level – Mark Scheme PUBLISHED October/November 2019 © UCLES 2019 Page 8 of 16 Question Answer Marks 4(c) To what extent was natural increase changed by the population policy you outlined in (b)? Candidates are free to develop their own approach to the question and responses will vary depending on the approach chosen. Whichever approach is chosen, essays which address the question and support their argument with relevant examples will be credited. There may be detailed consideration of a case study/one or more examples, or a broadly conceived response, drawing on several examples to illustrate the factors involved. Whichever is chosen, essays which evaluate the population policy’s relative success in changing natural increase will be credited. Success may be differentiated spatially (e.g. by region, rural/urban), between groups of people and over time (e.g. significant change initially, dwindling later). Failure may be assessed and commented on creditably. Observations may include: • data of natural increase rates • estimates of numbers removed or added to total population • spatial variation • temporal variation • socio-cultural or socio-economic variation • policy aims and targets met/unmet • other 15
Mark scheme, page 9
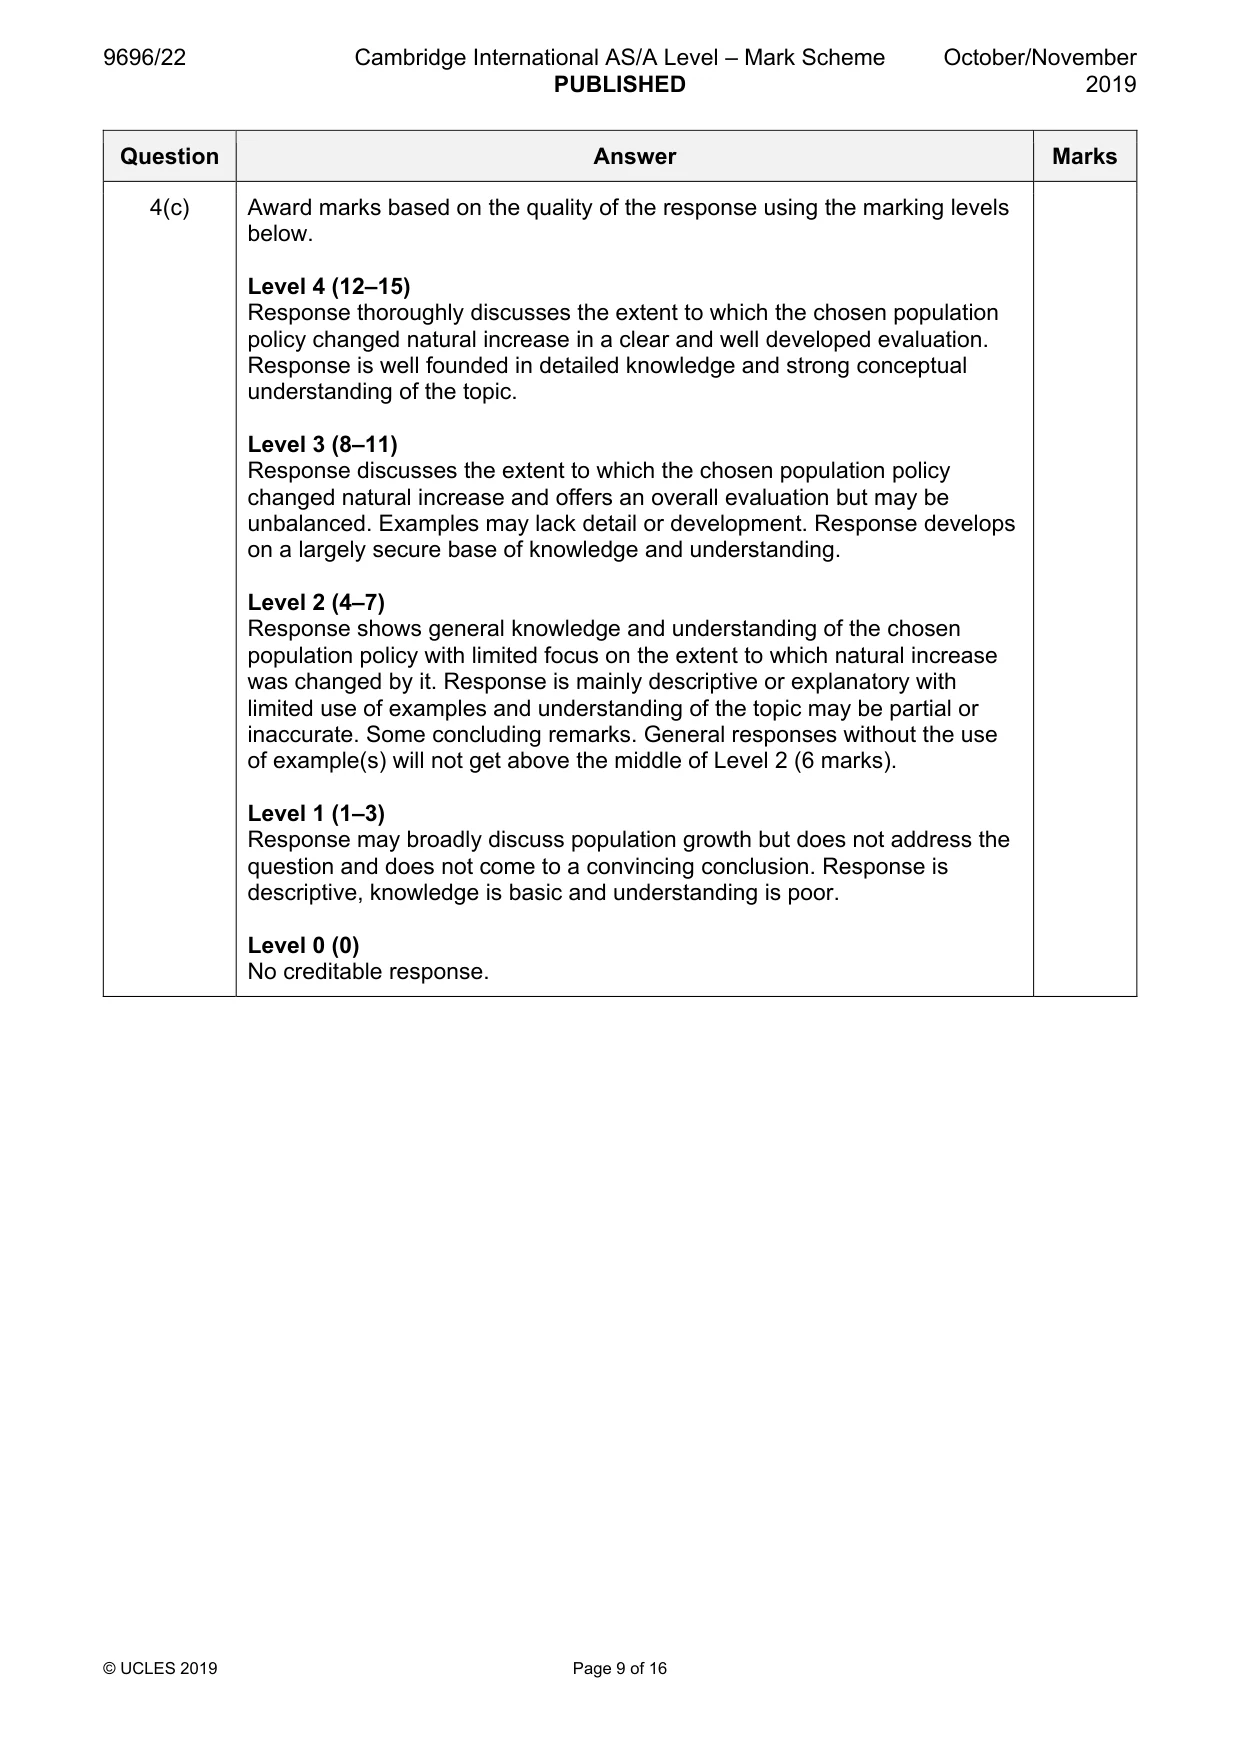
9696/22 Cambridge International AS/A Level – Mark Scheme PUBLISHED October/November 2019 © UCLES 2019 Page 9 of 16 Question Answer Marks 4(c) Award marks based on the quality of the response using the marking levels below. Level 4 (12–15) Response thoroughly discusses the extent to which the chosen population policy changed natural increase in a clear and well developed evaluation. Response is well founded in detailed knowledge and strong conceptual understanding of the topic. Level 3 (8–11) Response discusses the extent to which the chosen population policy changed natural increase and offers an overall evaluation but may be unbalanced. Examples may lack detail or development. Response develops on a largely secure base of knowledge and understanding. Level 2 (4–7) Response shows general knowledge and understanding of the chosen population policy with limited focus on the extent to which natural increase was changed by it. Response is mainly descriptive or explanatory with limited use of examples and understanding of the topic may be partial or inaccurate. Some concluding remarks. General responses without the use of example(s) will not get above the middle of Level 2 (6 marks). Level 1 (1–3) Response may broadly discuss population growth but does not address the question and does not come to a convincing conclusion. Response is descriptive, knowledge is basic and understanding is poor. Level 0 (0) No creditable response.
Mark scheme, page 10
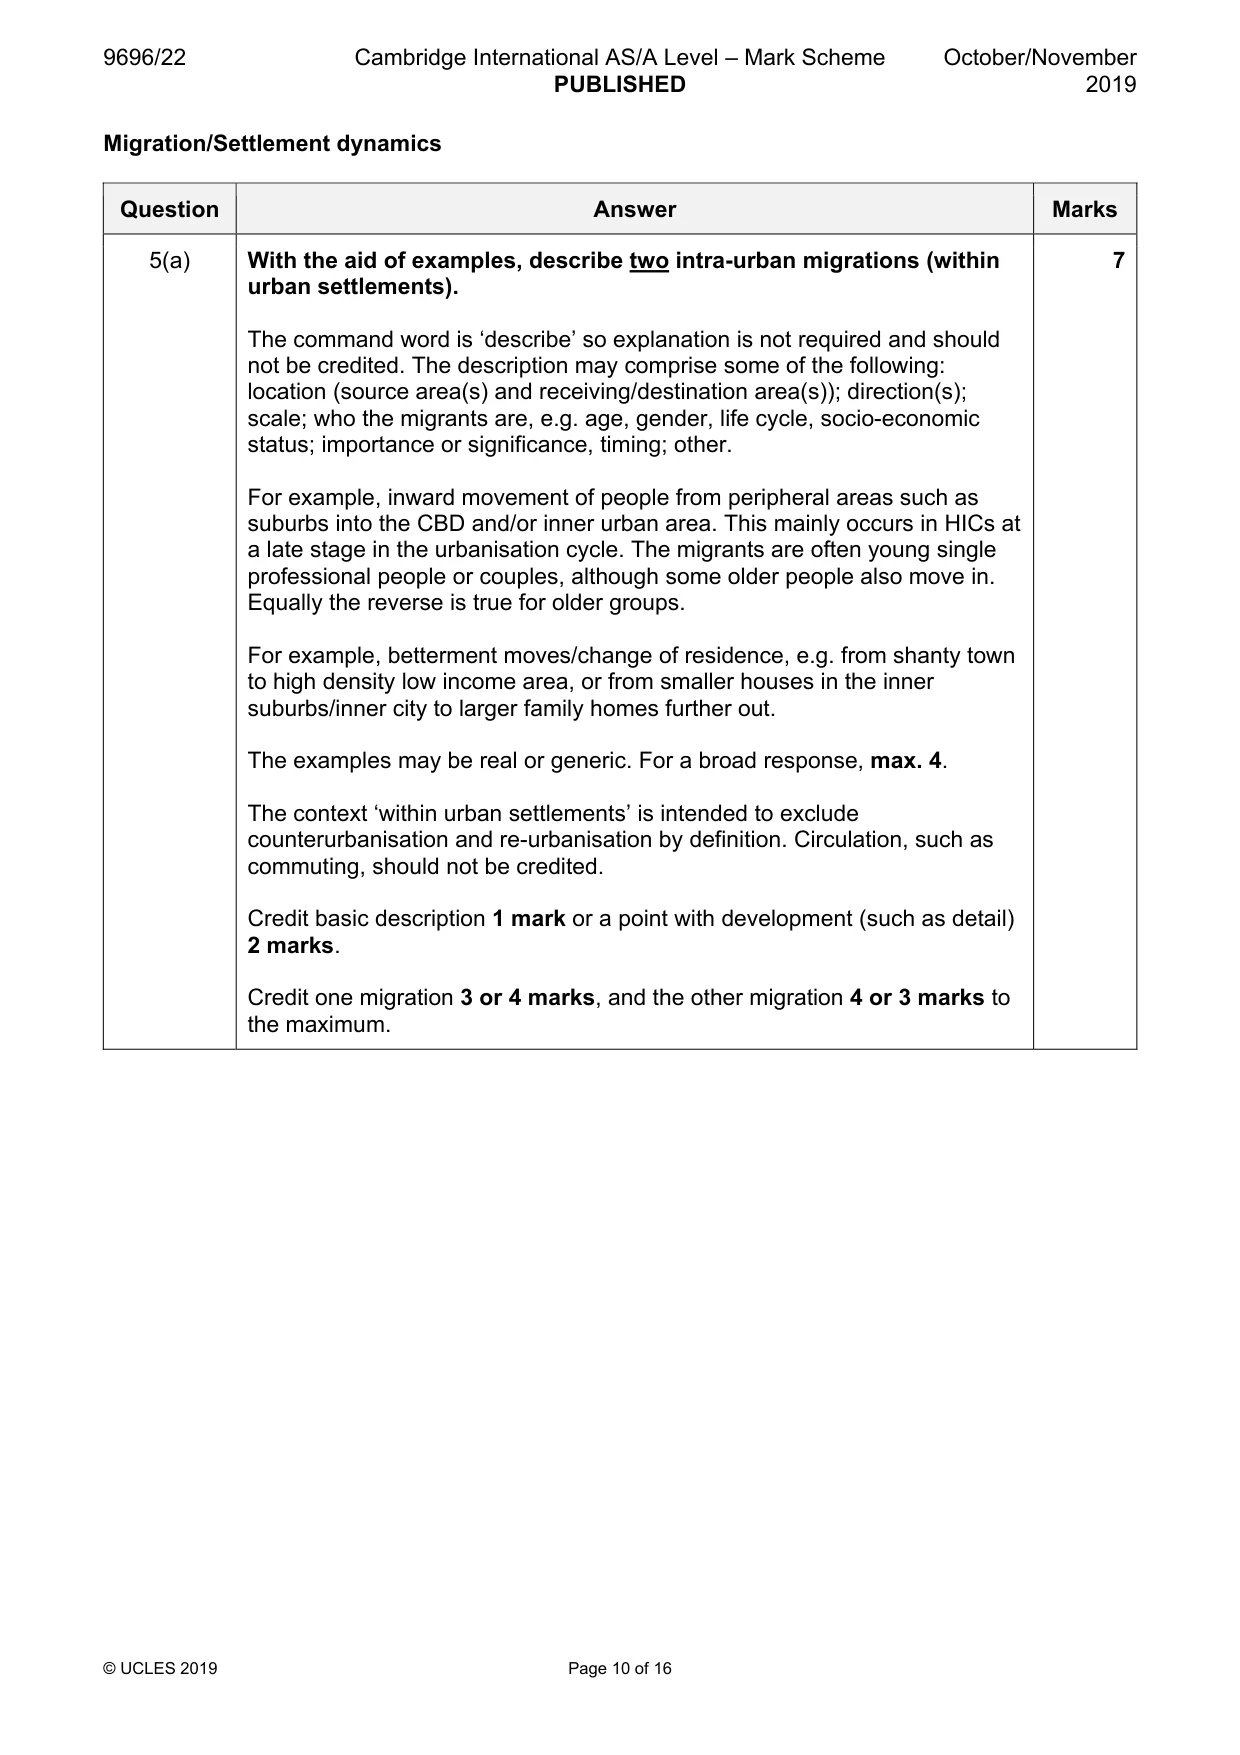
9696/22 Cambridge International AS/A Level – Mark Scheme PUBLISHED October/November 2019 © UCLES 2019 Page 10 of 16 Migration/Settlement dynamics Question Answer Marks 5(a) With the aid of examples, describe two intra-urban migrations (within urban settlements). The command word is ‘describe’ so explanation is not required and should not be credited. The description may comprise some of the following: location (source area(s) and receiving/destination area(s)); direction(s); scale; who the migrants are, e.g. age, gender, life cycle, socio-economic status; importance or significance, timing; other. For example, inward movement of people from peripheral areas such as suburbs into the CBD and/or inner urban area. This mainly occurs in HICs at a late stage in the urbanisation cycle. The migrants are often young single professional people or couples, although some older people also move in. Equally the reverse is true for older groups. For example, betterment moves/change of residence, e.g. from shanty town to high density low income area, or from smaller houses in the inner suburbs/inner city to larger family homes further out. The examples may be real or generic. For a broad response, max. 4. The context ‘within urban settlements’ is intended to exclude counterurbanisation and re-urbanisation by definition. Circulation, such as commuting, should not be credited. Credit basic description 1 mark or a point with development (such as detail) 2 marks. Credit one migration 3 or 4 marks, and the other migration 4 or 3 marks to the maximum. 7
Mark scheme, page 11
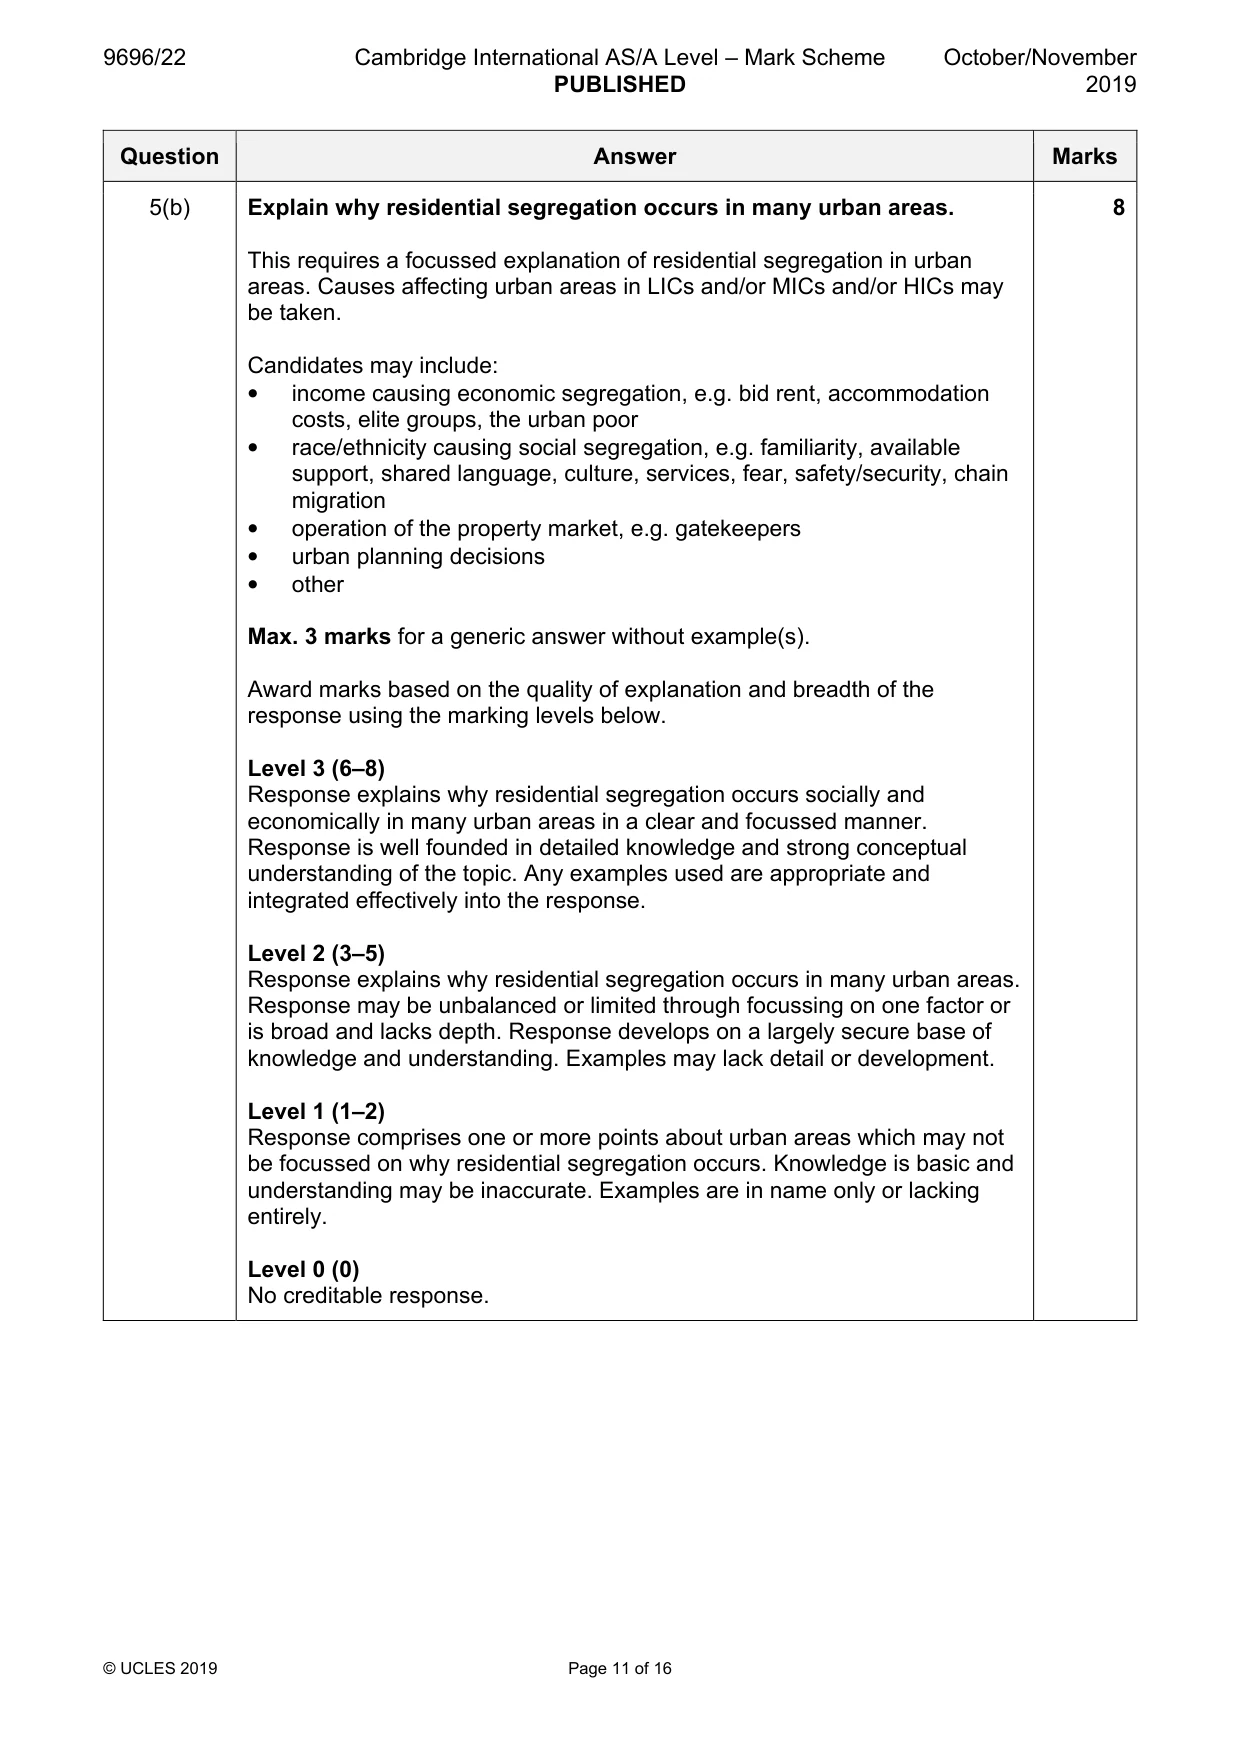
9696/22 Cambridge International AS/A Level – Mark Scheme PUBLISHED October/November 2019 © UCLES 2019 Page 11 of 16 Question Answer Marks 5(b) Explain why residential segregation occurs in many urban areas. This requires a focussed explanation of residential segregation in urban areas. Causes affecting urban areas in LICs and/or MICs and/or HICs may be taken. Candidates may include: • income causing economic segregation, e.g. bid rent, accommodation costs, elite groups, the urban poor • race/ethnicity causing social segregation, e.g. familiarity, available support, shared language, culture, services, fear, safety/security, chain migration • operation of the property market, e.g. gatekeepers • urban planning decisions • other Max. 3 marks for a generic answer without example(s). Award marks based on the quality of explanation and breadth of the response using the marking levels below. Level 3 (6–8) Response explains why residential segregation occurs socially and economically in many urban areas in a clear and focussed manner. Response is well founded in detailed knowledge and strong conceptual understanding of the topic. Any examples used are appropriate and integrated effectively into the response. Level 2 (3–5) Response explains why residential segregation occurs in many urban areas. Response may be unbalanced or limited through focussing on one factor or is broad and lacks depth. Response develops on a largely secure base of knowledge and understanding. Examples may lack detail or development. Level 1 (1–2) Response comprises one or more points about urban areas which may not be focussed on why residential segregation occurs. Knowledge is basic and understanding may be inaccurate. Examples are in name only or lacking entirely. Level 0 (0) No creditable response. 8
Mark scheme, page 12
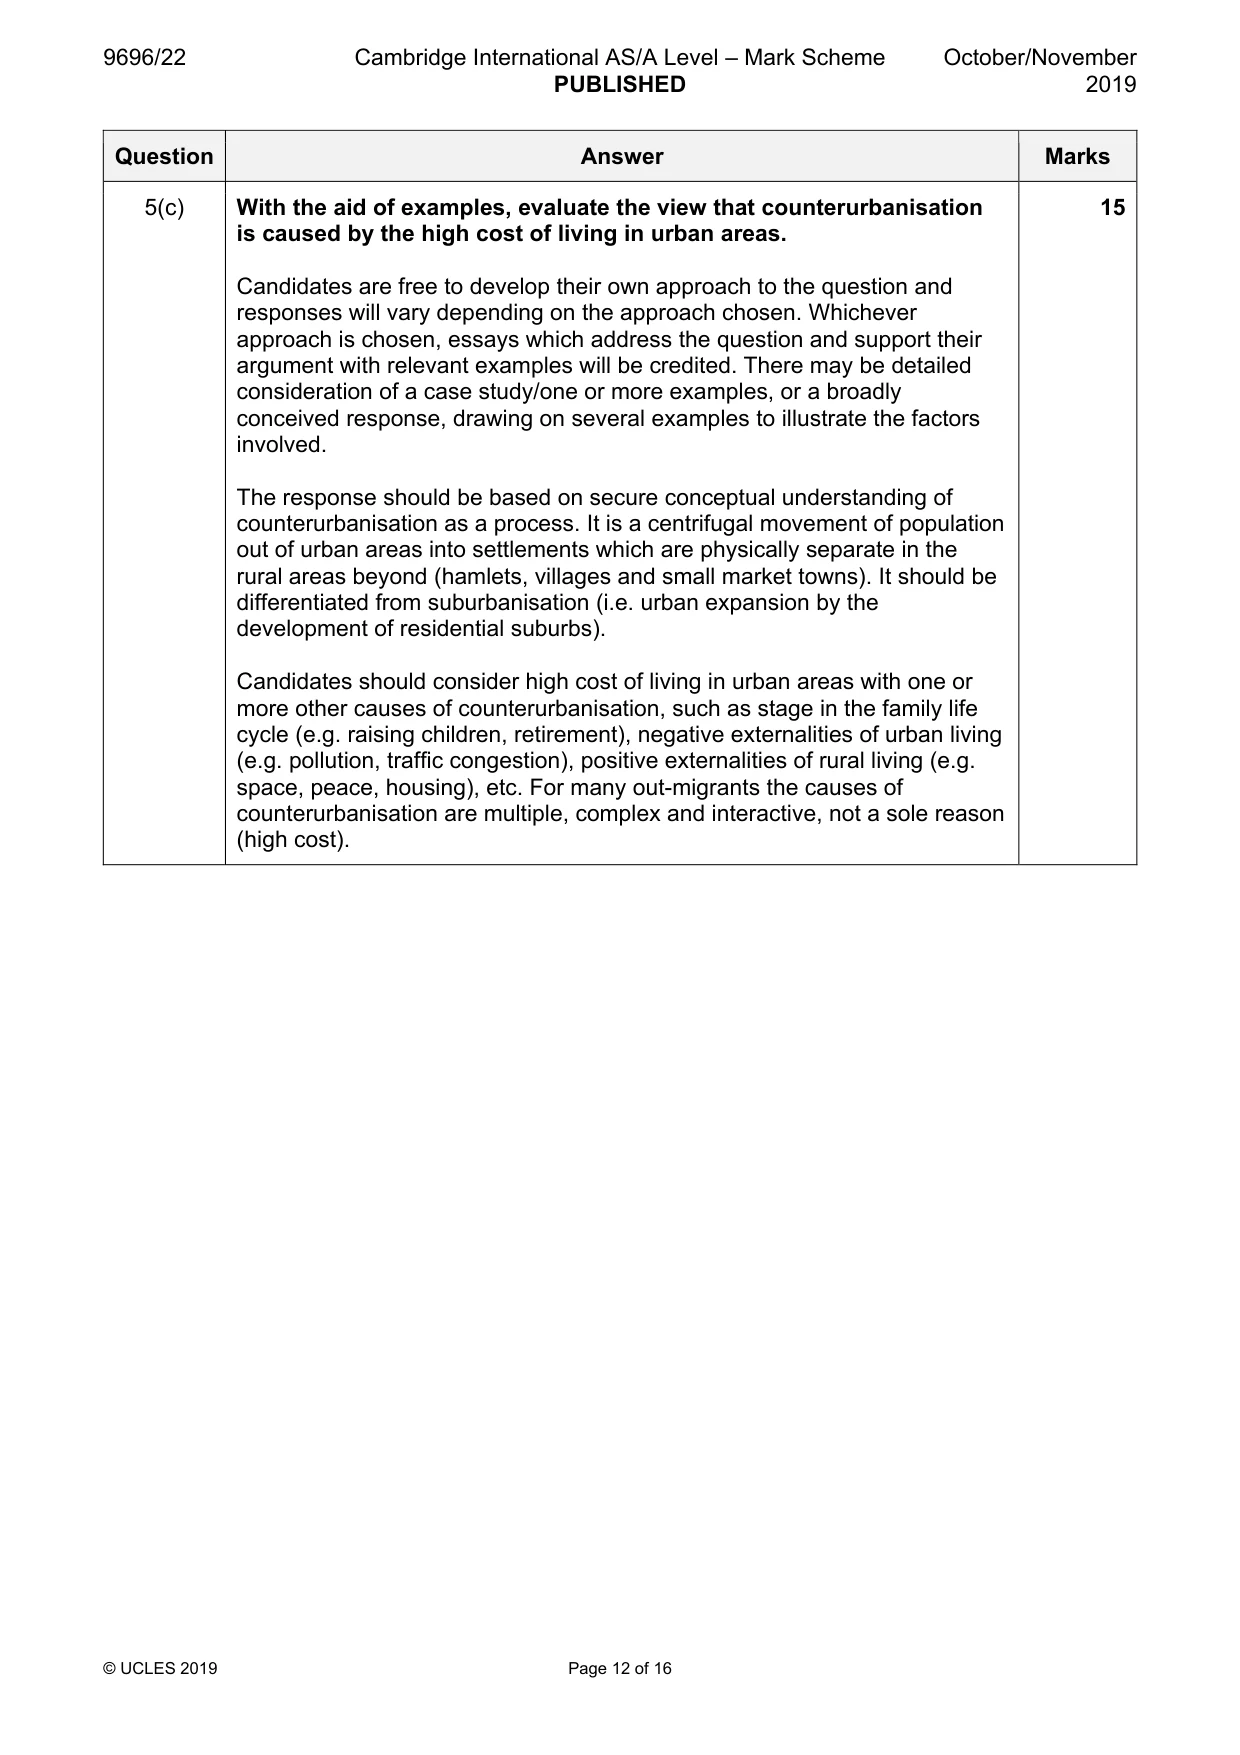
9696/22 Cambridge International AS/A Level – Mark Scheme PUBLISHED October/November 2019 © UCLES 2019 Page 12 of 16 Question Answer Marks 5(c) With the aid of examples, evaluate the view that counterurbanisation is caused by the high cost of living in urban areas. Candidates are free to develop their own approach to the question and responses will vary depending on the approach chosen. Whichever approach is chosen, essays which address the question and support their argument with relevant examples will be credited. There may be detailed consideration of a case study/one or more examples, or a broadly conceived response, drawing on several examples to illustrate the factors involved. The response should be based on secure conceptual understanding of counterurbanisation as a process. It is a centrifugal movement of population out of urban areas into settlements which are physically separate in the rural areas beyond (hamlets, villages and small market towns). It should be differentiated from suburbanisation (i.e. urban expansion by the development of residential suburbs). Candidates should consider high cost of living in urban areas with one or more other causes of counterurbanisation, such as stage in the family life cycle (e.g. raising children, retirement), negative externalities of urban living (e.g. pollution, traffic congestion), positive externalities of rural living (e.g. space, peace, housing), etc. For many out-migrants the causes of counterurbanisation are multiple, complex and interactive, not a sole reason (high cost). 15
Mark scheme, page 13
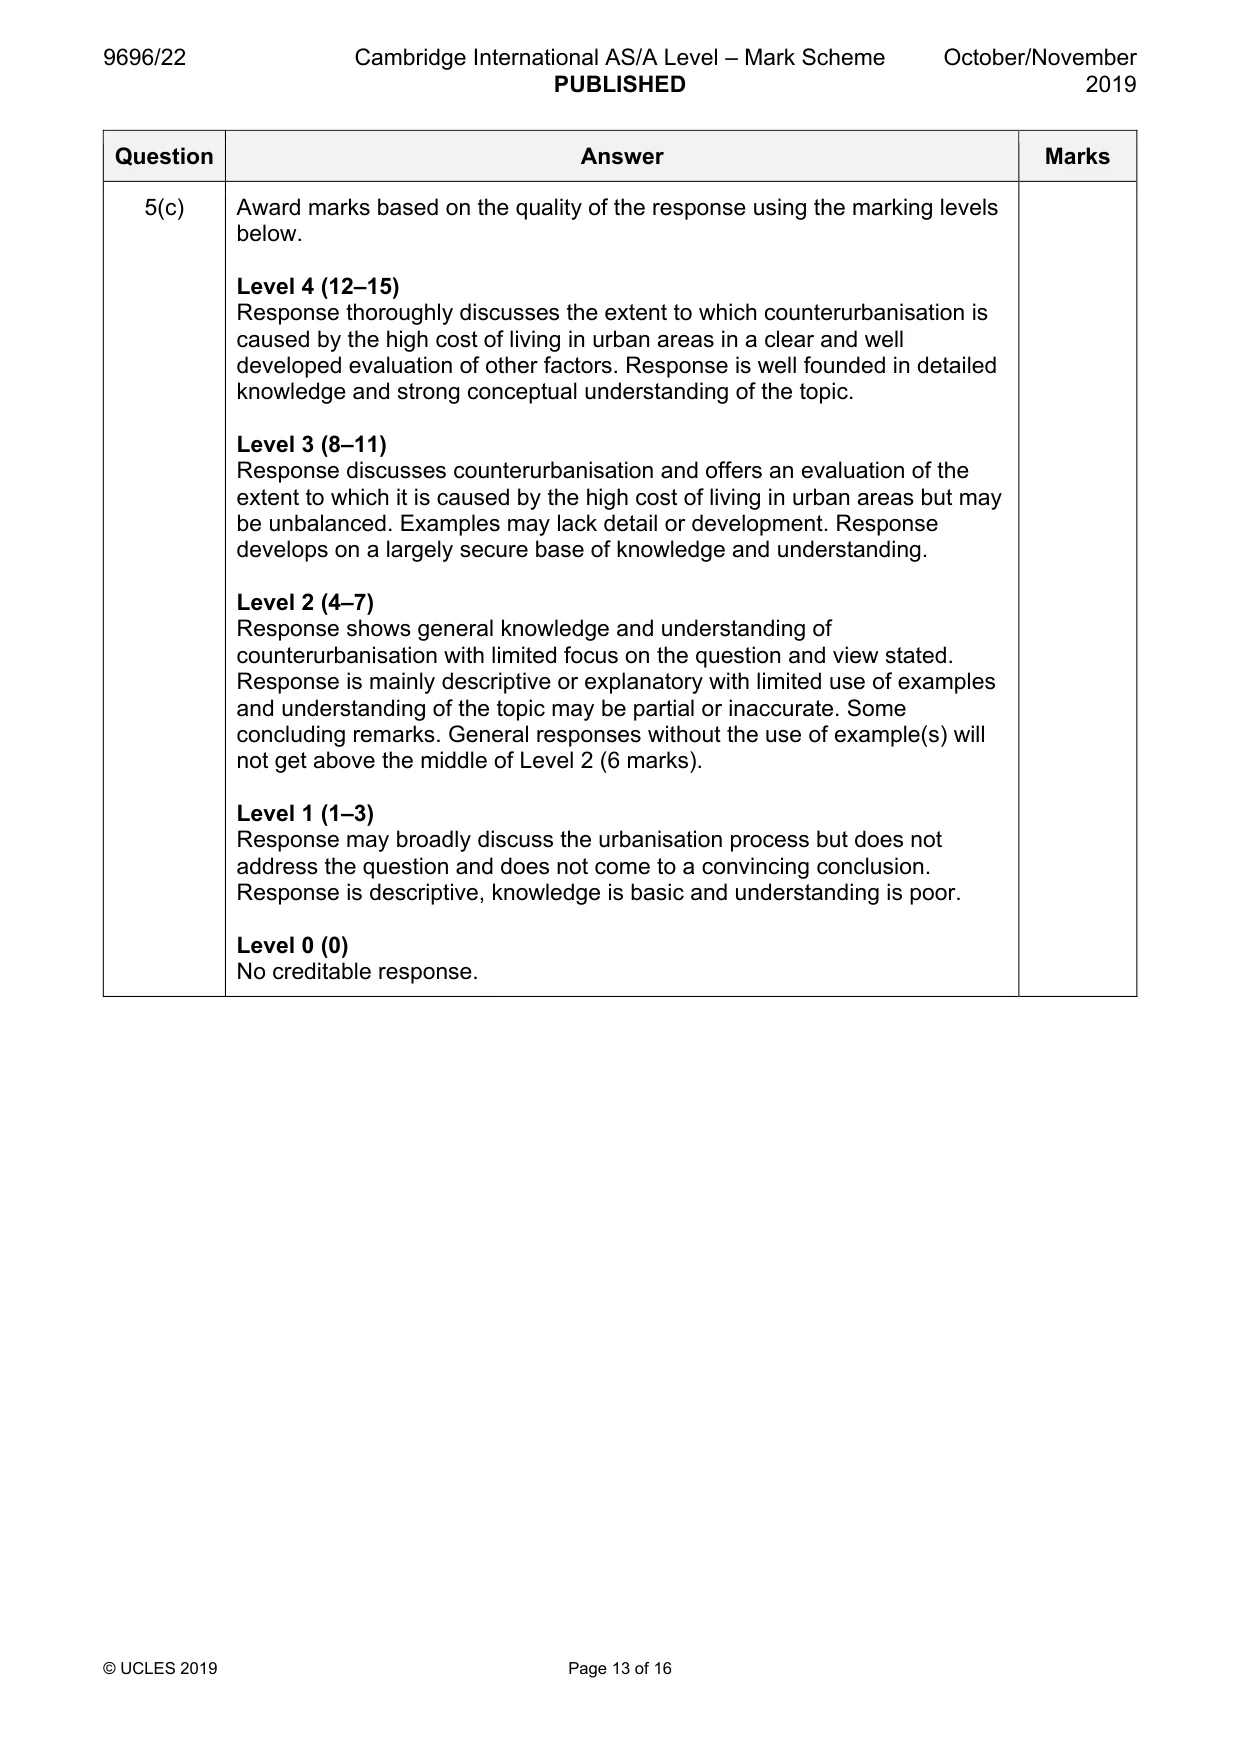
9696/22 Cambridge International AS/A Level – Mark Scheme PUBLISHED October/November 2019 © UCLES 2019 Page 13 of 16 Question Answer Marks 5(c) Award marks based on the quality of the response using the marking levels below. Level 4 (12–15) Response thoroughly discusses the extent to which counterurbanisation is caused by the high cost of living in urban areas in a clear and well developed evaluation of other factors. Response is well founded in detailed knowledge and strong conceptual understanding of the topic. Level 3 (8–11) Response discusses counterurbanisation and offers an evaluation of the extent to which it is caused by the high cost of living in urban areas but may be unbalanced. Examples may lack detail or development. Response develops on a largely secure base of knowledge and understanding. Level 2 (4–7) Response shows general knowledge and understanding of counterurbanisation with limited focus on the question and view stated. Response is mainly descriptive or explanatory with limited use of examples and understanding of the topic may be partial or inaccurate. Some concluding remarks. General responses without the use of example(s) will not get above the middle of Level 2 (6 marks). Level 1 (1–3) Response may broadly discuss the urbanisation process but does not address the question and does not come to a convincing conclusion. Response is descriptive, knowledge is basic and understanding is poor. Level 0 (0) No creditable response.
Mark scheme, page 14
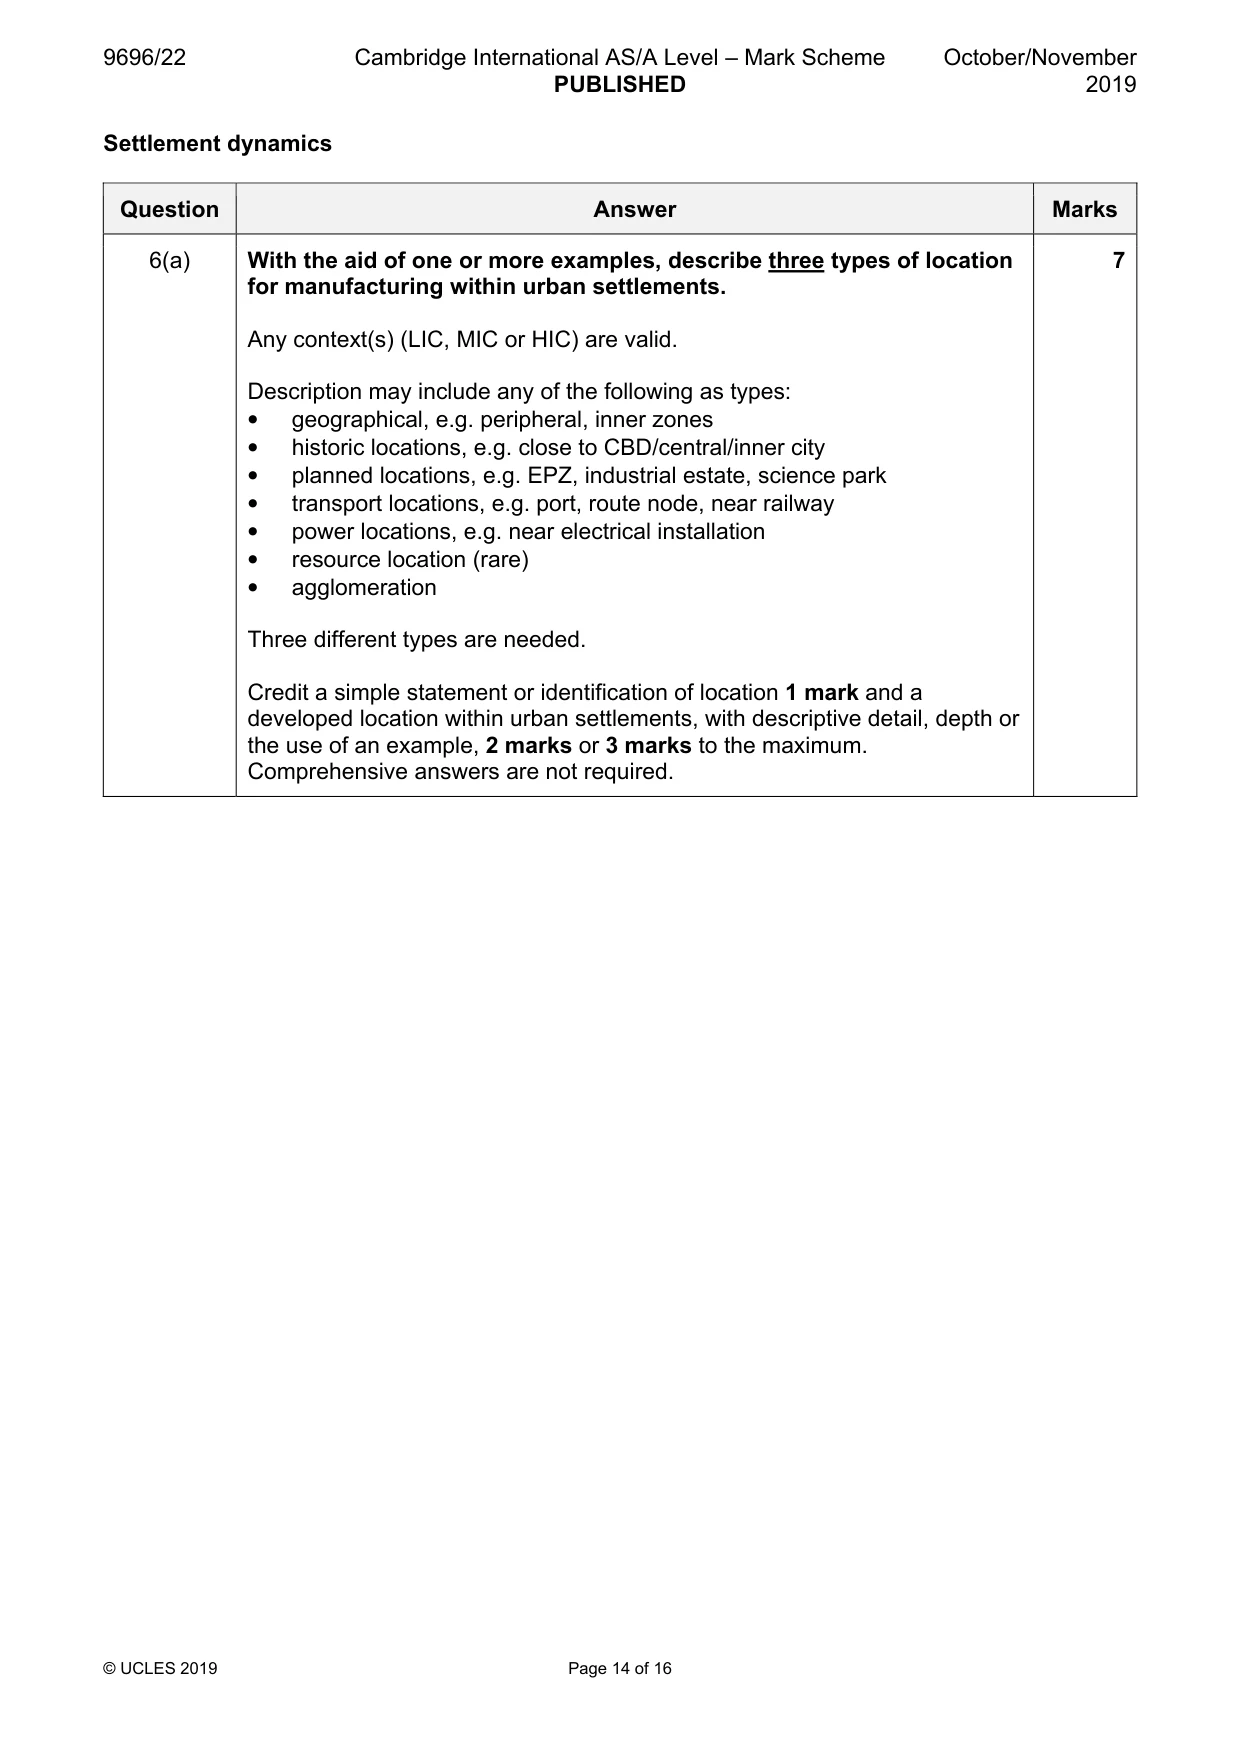
9696/22 Cambridge International AS/A Level – Mark Scheme PUBLISHED October/November 2019 © UCLES 2019 Page 14 of 16 Settlement dynamics Question Answer Marks 6(a) With the aid of one or more examples, describe three types of location for manufacturing within urban settlements. Any context(s) (LIC, MIC or HIC) are valid. Description may include any of the following as types: • geographical, e.g. peripheral, inner zones • historic locations, e.g. close to CBD/central/inner city • planned locations, e.g. EPZ, industrial estate, science park • transport locations, e.g. port, route node, near railway • power locations, e.g. near electrical installation • resource location (rare) • agglomeration Three different types are needed. Credit a simple statement or identification of location 1 mark and a developed location within urban settlements, with descriptive detail, depth or the use of an example, 2 marks or 3 marks to the maximum. Comprehensive answers are not required. 7
Mark scheme, page 15
9696/22 Cambridge International AS/A Level – Mark Scheme PUBLISHED October/November 2019 © UCLES 2019 Page 15 of 16 Question Answer Marks 6(b) Explain why urban locations for manufacturing have changed over time. Candidates will develop their own explanation and may use any context(s), LIC, MIC and/or HIC. The explanation may combine the disadvantages of old locations with the advantages of new ones, as urban areas and the characteristics of manufacturing change and develop over time, such as in the table below. Explanatory ideas include planning, costs, access, labour supply, markets, etc. disadvantage of old location advantage of new location lack of space for expansion or storage of materials/goods room for expansion and for new processes, e.g. assembly line traffic congestion and delays impact process and workers shorter delivery times and easier commuting pollutes urban area (land, air, water) waste management, peripheral location limits pollution impact out-of-date, e.g. disused harbour designed for 21st century, e.g. industrial estate, EPZ A generic answer may perform well so no maximum is applied. Award marks based on the quality of explanation and breadth of the response using the marking levels below. Level 3 (6–8) Response explains why urban locations for manufacturing have changed over time in a clear and focussed manner. Response is well founded in detailed knowledge and strong conceptual understanding of the topic. Any examples used are appropriate and integrated effectively into the response. Level 2 (3–5) Response explains why urban locations for manufacturing have changed over time in a limited way. Response develops on a largely secure base of knowledge and understanding. Examples may lack detail or development. Level 1 (1–2) Response comprises one or more points about manufacturing in urban areas which may not be focussed on why its location has changed over time. Knowledge is basic and understanding may be inaccurate. Examples are in name only or lacking entirely. Level 0 (0) No creditable response. 8
Mark scheme, page 16
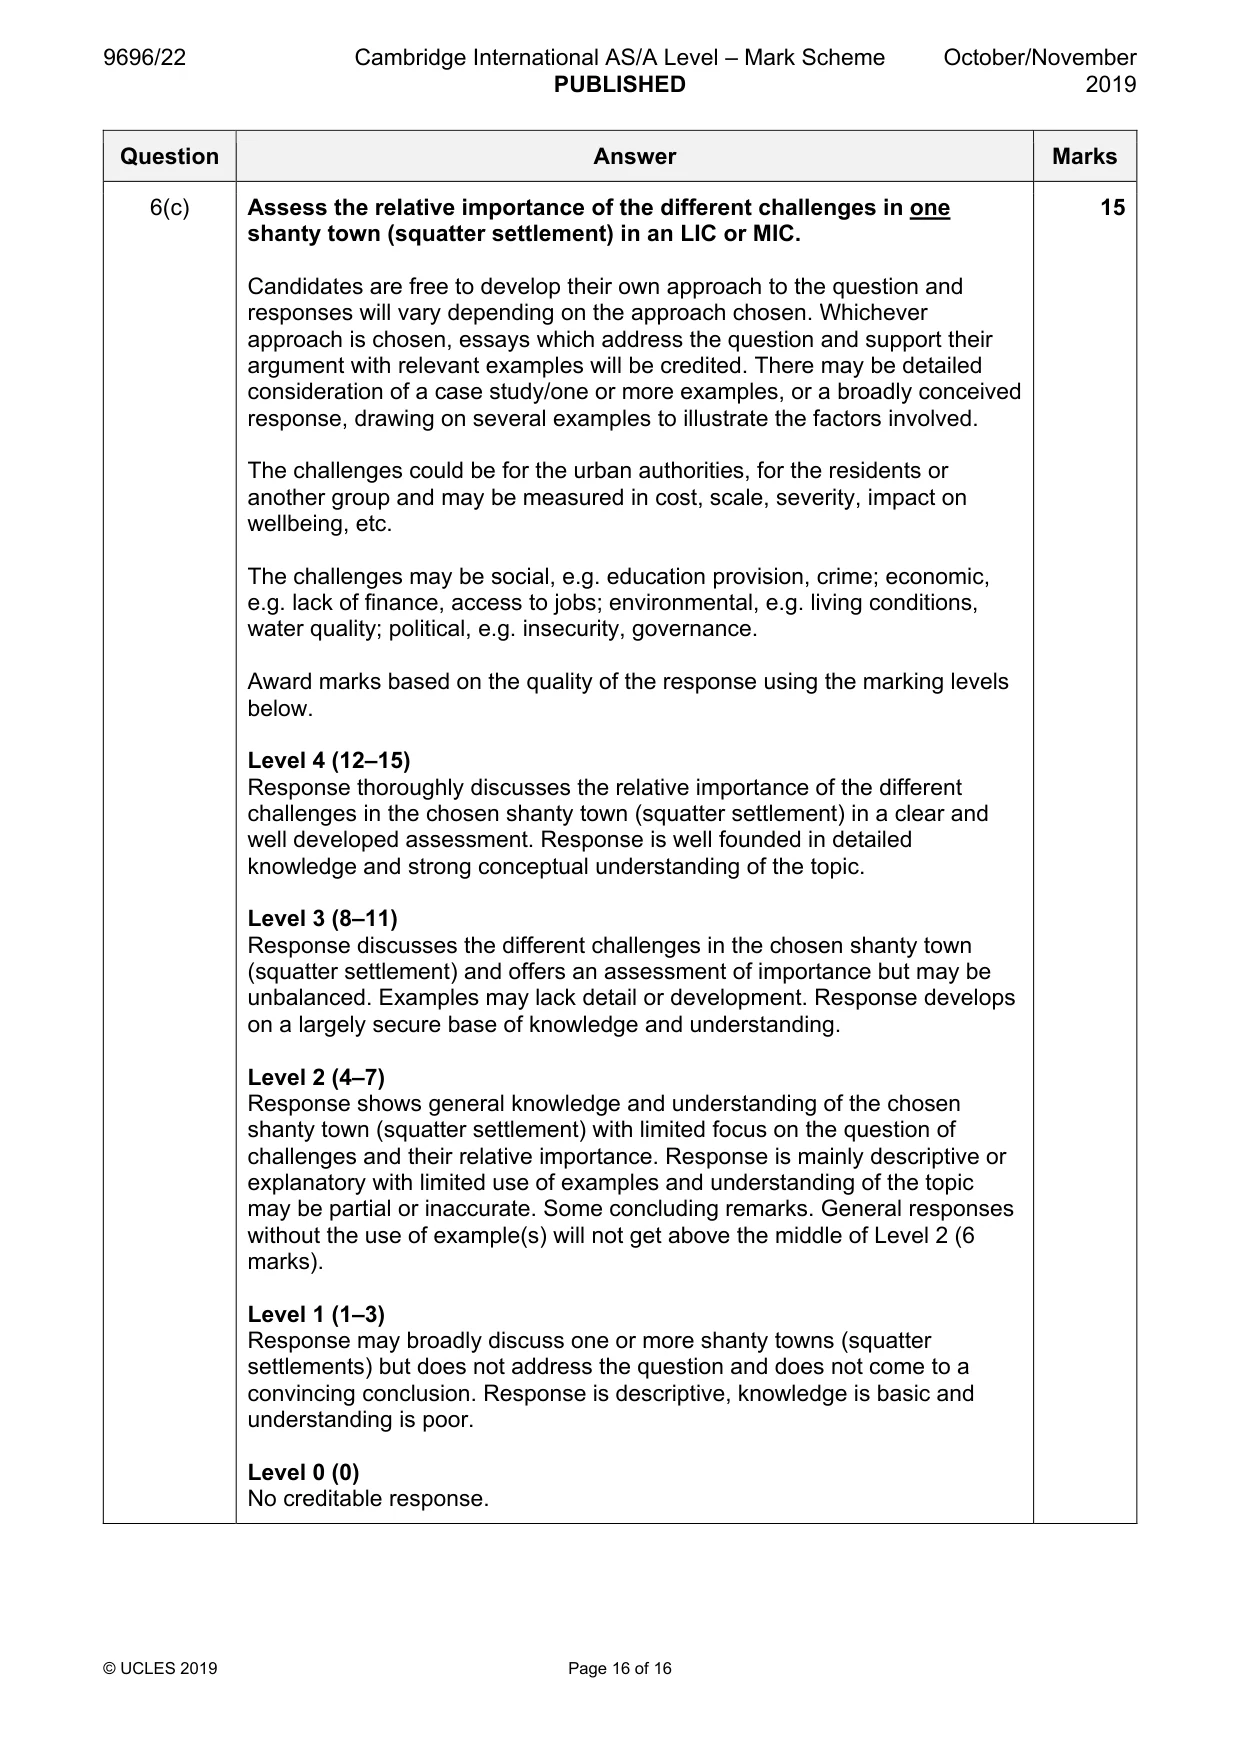
9696/22 Cambridge International AS/A Level – Mark Scheme PUBLISHED October/November 2019 © UCLES 2019 Page 16 of 16 Question Answer Marks 6(c) Assess the relative importance of the different challenges in one shanty town (squatter settlement) in an LIC or MIC. Candidates are free to develop their own approach to the question and responses will vary depending on the approach chosen. Whichever approach is chosen, essays which address the question and support their argument with relevant examples will be credited. There may be detailed consideration of a case study/one or more examples, or a broadly conceived response, drawing on several examples to illustrate the factors involved. The challenges could be for the urban authorities, for the residents or another group and may be measured in cost, scale, severity, impact on wellbeing, etc. The challenges may be social, e.g. education provision, crime; economic, e.g. lack of finance, access to jobs; environmental, e.g. living conditions, water quality; political, e.g. insecurity, governance. Award marks based on the quality of the response using the marking levels below. Level 4 (12–15) Response thoroughly discusses the relative importance of the different challenges in the chosen shanty town (squatter settlement) in a clear and well developed assessment. Response is well founded in detailed knowledge and strong conceptual understanding of the topic. Level 3 (8–11) Response discusses the different challenges in the chosen shanty town (squatter settlement) and offers an assessment of importance but may be unbalanced. Examples may lack detail or development. Response develops on a largely secure base of knowledge and understanding. Level 2 (4–7) Response shows general knowledge and understanding of the chosen shanty town (squatter settlement) with limited focus on the question of challenges and their relative importance. Response is mainly descriptive or explanatory with limited use of examples and understanding of the topic may be partial or inaccurate. Some concluding remarks. General responses without the use of example(s) will not get above the middle of Level 2 (6 marks). Level 1 (1–3) Response may broadly discuss one or more shanty towns (squatter settlements) but does not address the question and does not come to a convincing conclusion. Response is descriptive, knowledge is basic and understanding is poor. Level 0 (0) No creditable response. 15
What you needed in this session
Cambridge’s own grade thresholds for 2019 Oct/Nov, Paper 2 · Variant 2. A higher threshold means an easier paper — the bar moves with how the cohort did.