Cambridge A Level Geography 9696 — 2019 Oct/Nov Paper 2 · Variant 3
9696/23/O/N/19 · 6 questions · 60 marks · ≈68 min
The question paper and its mark scheme, free to read here and free to download. This is Cambridge’s own paper, exactly as it was sat.
Question paper4 pages
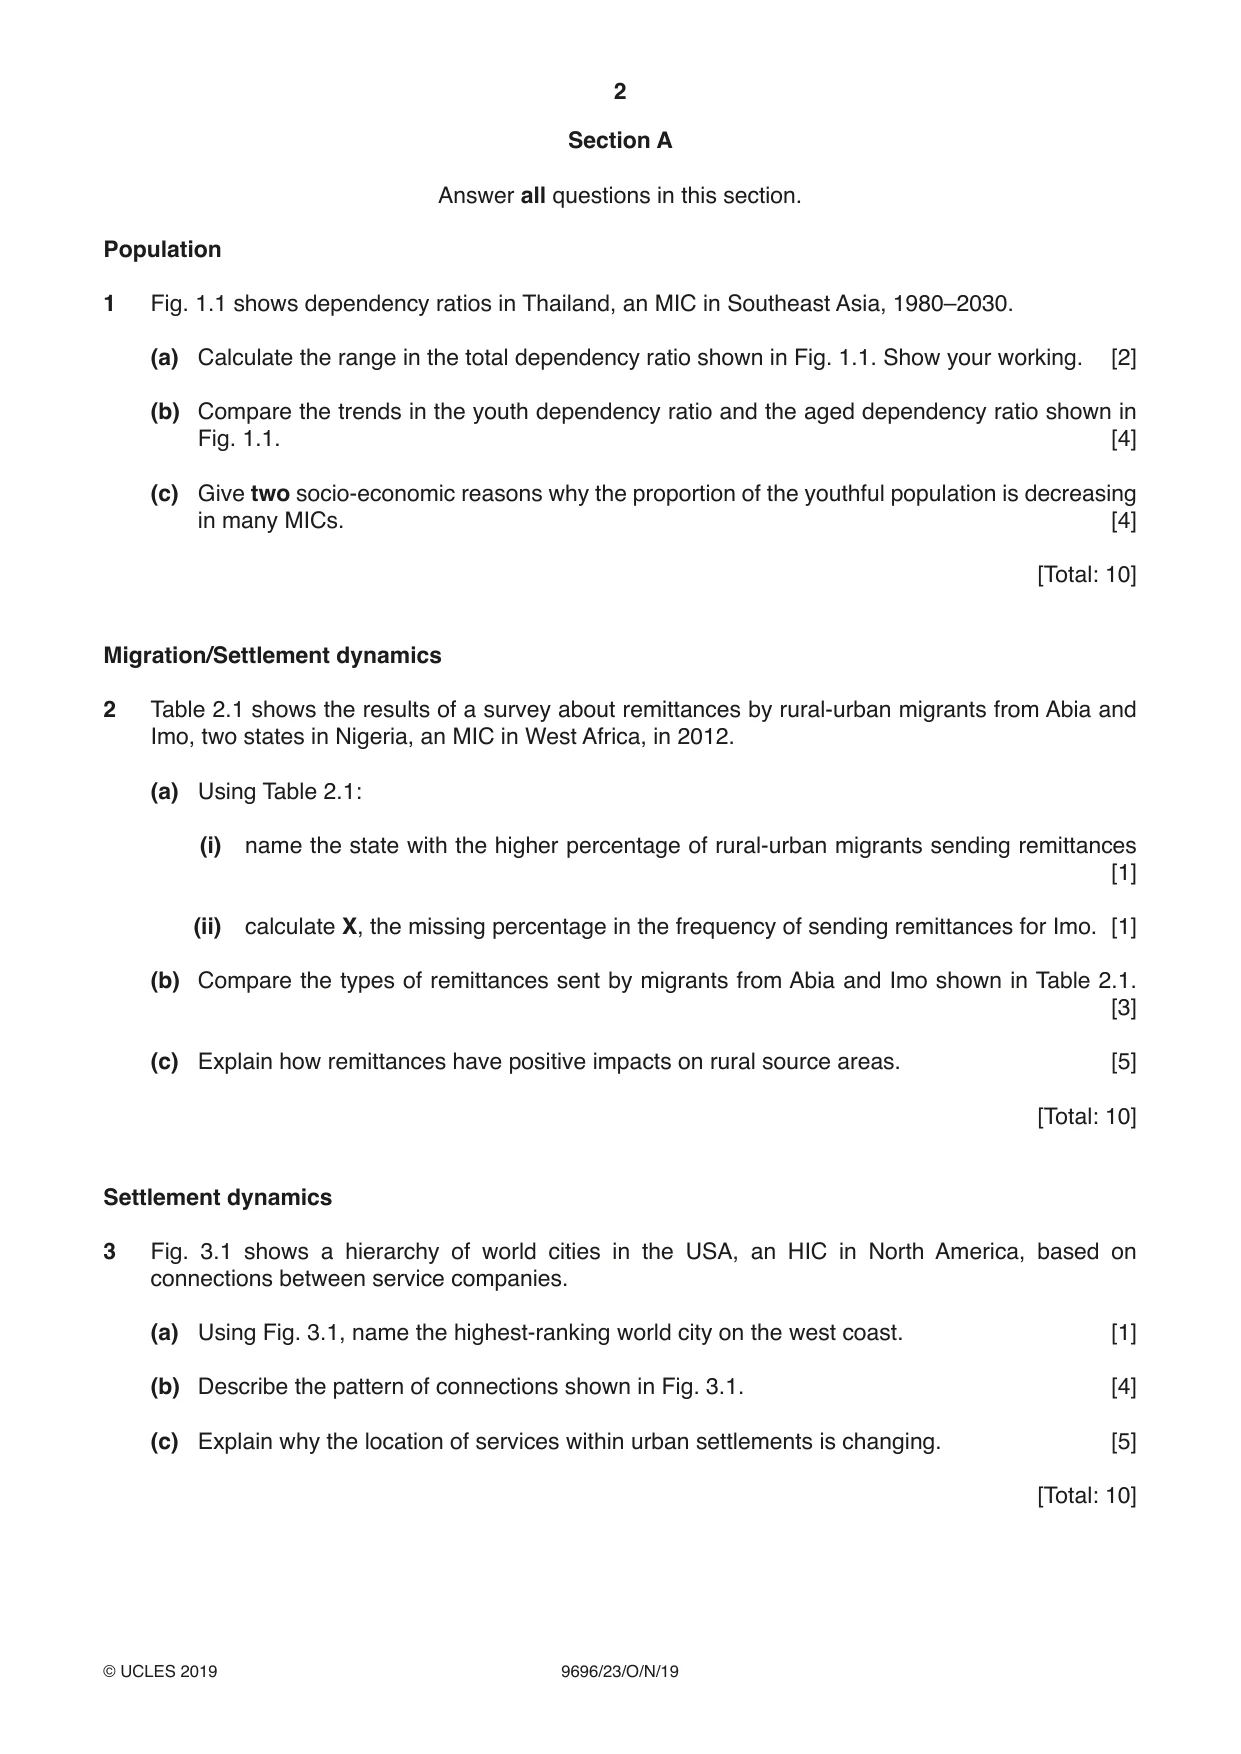

Mark scheme15 pages
Answers below. Sit the paper first if you are practising.

Questions as text
Q1 · Dependency ratios in Thailand, an MIC in Southeast Asia, 1980–2030
1 Fig. 1.1 shows dependency ratios in Thailand, an MIC in Southeast Asia, 1980–2030. (a) Calculate the range in the total dependency ratio shown in Fig. 1.1. Show your working. [2] (b) Compare the trends in the youth dependency ratio and the aged dependency ratio shown in Fig. 1.1. [4] (c) Give two socio-economic reasons why the proportion of the youthful population is decreasing in many MICs. [4] [Total: 10] Migration/Settlement dynamics
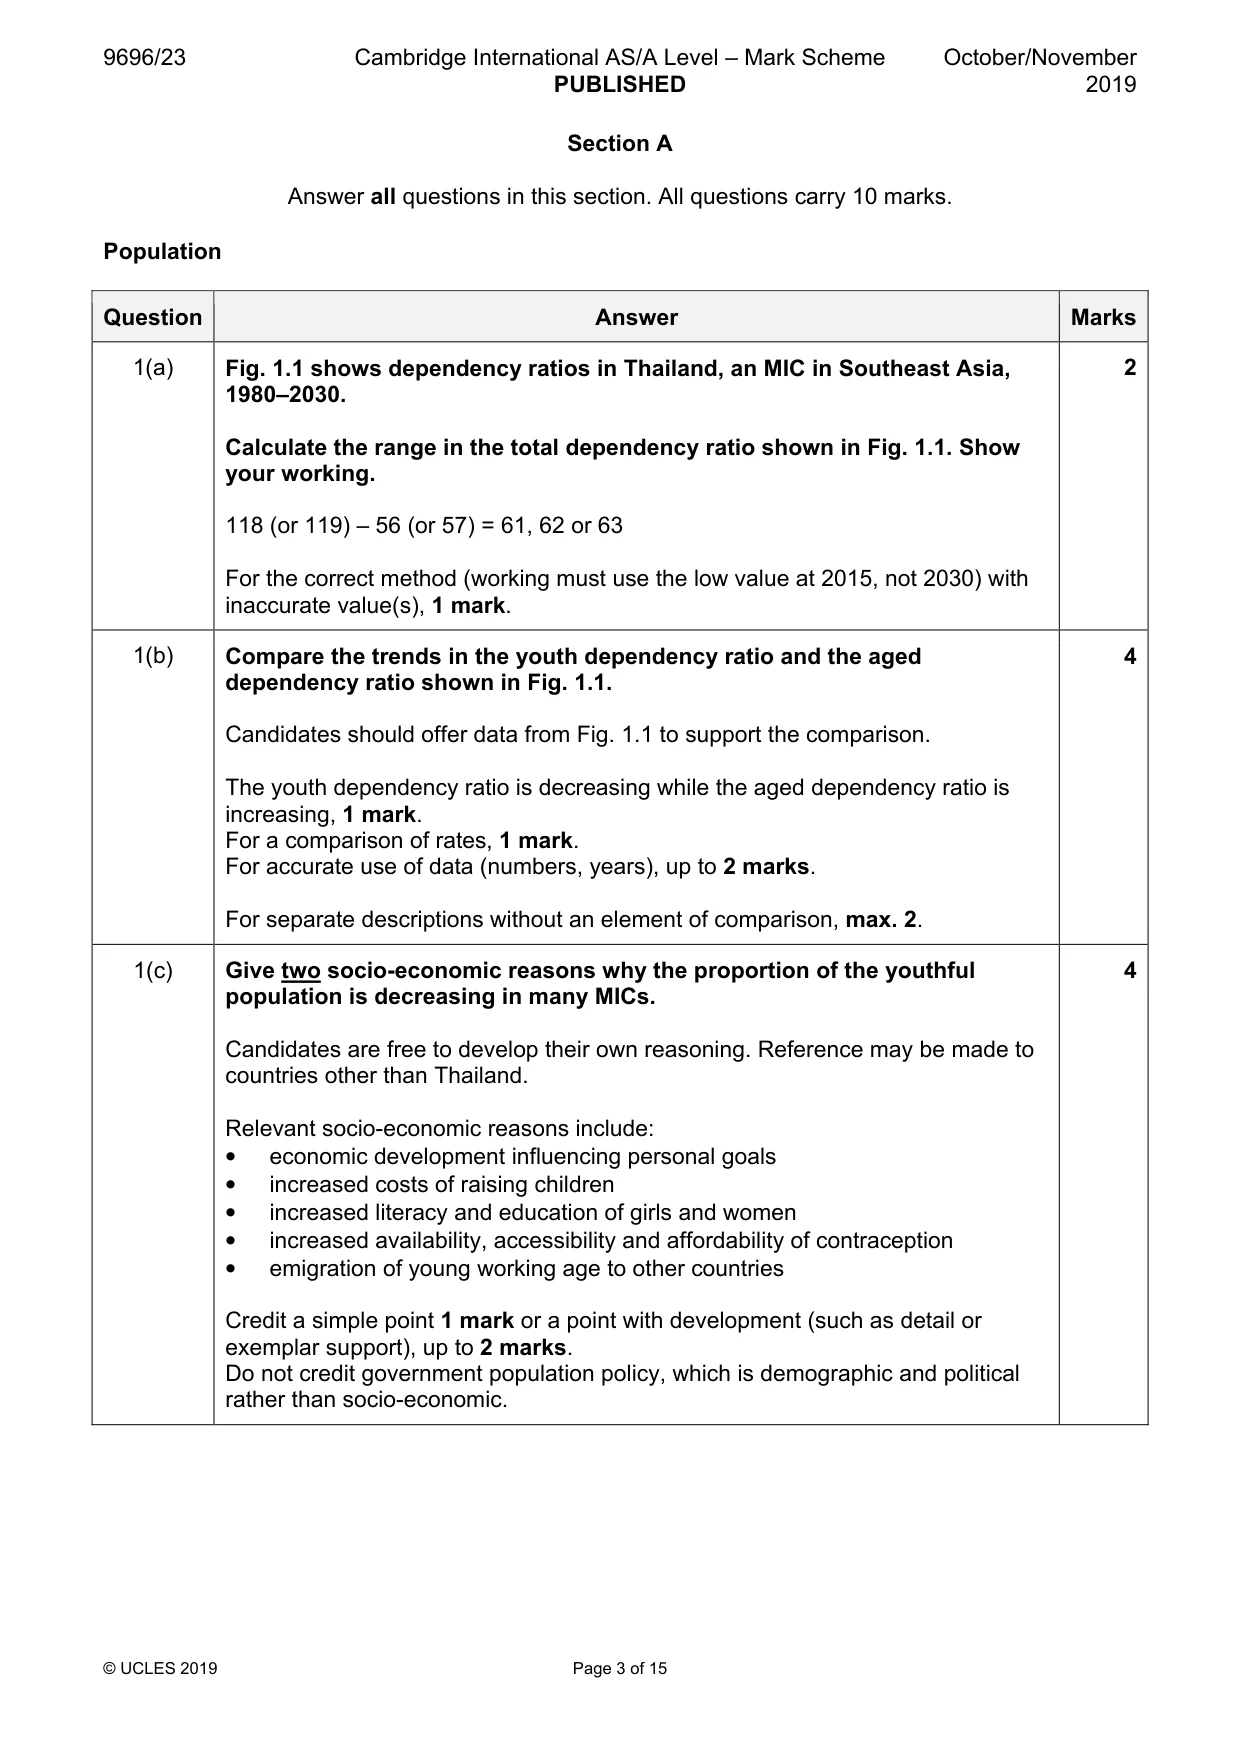
Mark scheme: Question Answer Marks 1(a) Fig. 1.1 shows dependency ratios in Thailand, an MIC in Southeast Asia, 2 1980–2030. Calculate the range in the total dependency ratio shown in Fig. 1.1. Show your working. 118 (or 119) – 56 (or 57) = 61, 62 or 63 For the correct method (working must use the low value at 2015, not 2030) with inaccurate value(s), 1 mark. 1(b) Compare the trends in the youth dependency ratio and the aged 4 dependency ratio shown in Fig. 1.1. Candidates should offer data from Fig. 1.1 to support the comparison. The youth dependency ratio is decreasing while the aged dependency ratio is increasing, 1 mark. For a comparison of rates, 1 mark. For accurate use of data (numbers, years), up to 2 marks. For separate descriptions without an element of comparison, max. 2. 1(c) Give two socio-economic reasons why the proportion of the youthful 4 population is decreasing in many MICs. Candidates are free to develop their own reasoning. Reference may be made to countries other than Thailand. Relevant socio-economic reasons include: • economic development influencing personal goals • increased costs of raising children • increased literacy and education of girls and women • increased availability, accessibility and affordability of contraception • emigration of young working age to other countries Credit a simple point 1 mark or a point with development (such as detail or exemplar support), up to 2 marks. Do not credit government population policy, which is demographic and political rather than socio-economic. Migration/Settlement dynamics
Q2 · The results of a survey about remittances by rural-urban migrants from Abia and Imo, two…
2 Table 2.1 shows the results of a survey about remittances by rural-urban migrants from Abia and Imo, two states in Nigeria, an MIC in West Africa, in 2012. (a) Using Table 2.1: (i) name the state with the higher percentage of rural-urban migrants sending remittances [1] (ii) calculate X, the missing percentage in the frequency of sending remittances for Imo. [1] (b) Compare the types of remittances sent by migrants from Abia and Imo shown in Table 2.1. [3] (c) Explain how remittances have positive impacts on rural source areas. [5] [Total: 10] Settlement dynamics
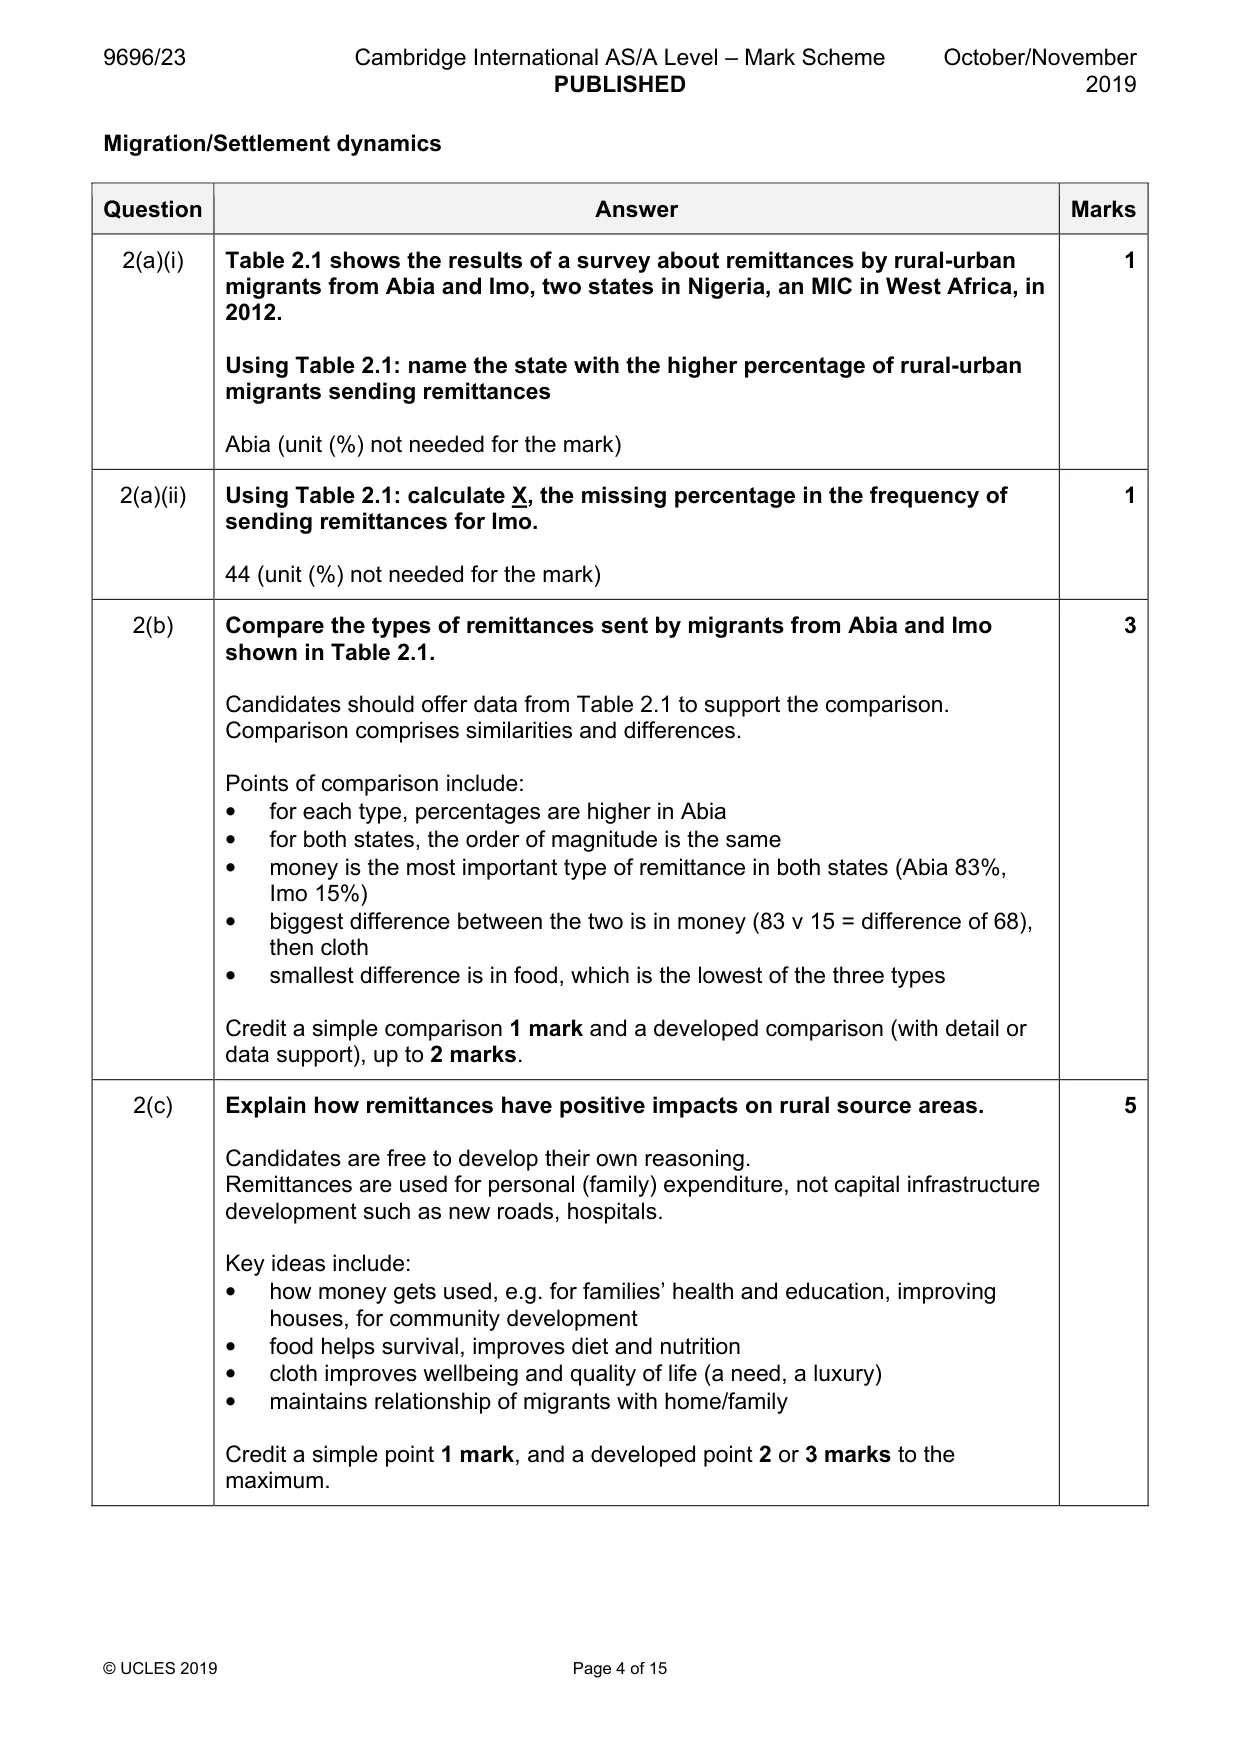
Mark scheme: 2(a)(i) Table 2.1 shows the results of a survey about remittances by rural-urban 1 migrants from Abia and Imo, two states in Nigeria, an MIC in West Africa, in 2012. Using Table 2.1: name the state with the higher percentage of rural-urban migrants sending remittances Abia (unit (%) not needed for the mark) 2(a)(ii) Using Table 2.1: calculate X, the missing percentage in the frequency of 1 sending remittances for Imo. 44 (unit (%) not needed for the mark) 2(b) Compare the types of remittances sent by migrants from Abia and Imo 3 shown in Table 2.1. Candidates should offer data from Table 2.1 to support the comparison. Comparison comprises similarities and differences. Points of comparison include: • for each type, percentages are higher in Abia • for both states, the order of magnitude is the same • money is the most important type of remittance in both states (Abia 83%, Imo 15%) • biggest difference between the two is in money (83 v 15 = difference of 68), then cloth • smallest difference is in food, which is the lowest of the three types Credit a simple comparison 1 mark and a developed comparison (with detail or data support), up to 2 marks. 2(c) Explain how remittances have positive impacts on rural source areas. 5 Candidates are free to develop their own reasoning. Remittances are used for personal (family) expenditure, not capital infrastructure development such as new roads, hospitals. Key ideas include: • how money gets used, e.g. for families’ health and education, improving houses, for community development • food helps survival, improves diet and nutrition • cloth improves wellbeing and quality of life (a need, a luxury) • maintains relationship of migrants with home/family Credit a simple point 1 mark, and a developed point 2 or 3 marks to the maximum. Settlement dynamics
Q3 · A hierarchy of world cities in the USA, an HIC in North America, based on connections…
3 Fig. 3.1 shows a hierarchy of world cities in the USA, an HIC in North America, based on connections between service companies. (a) Using Fig. 3.1, name the highest-ranking world city on the west coast. [1] (b) Describe the pattern of connections shown in Fig. 3.1. [4] (c) Explain why the location of services within urban settlements is changing. [5] [Total: 10]
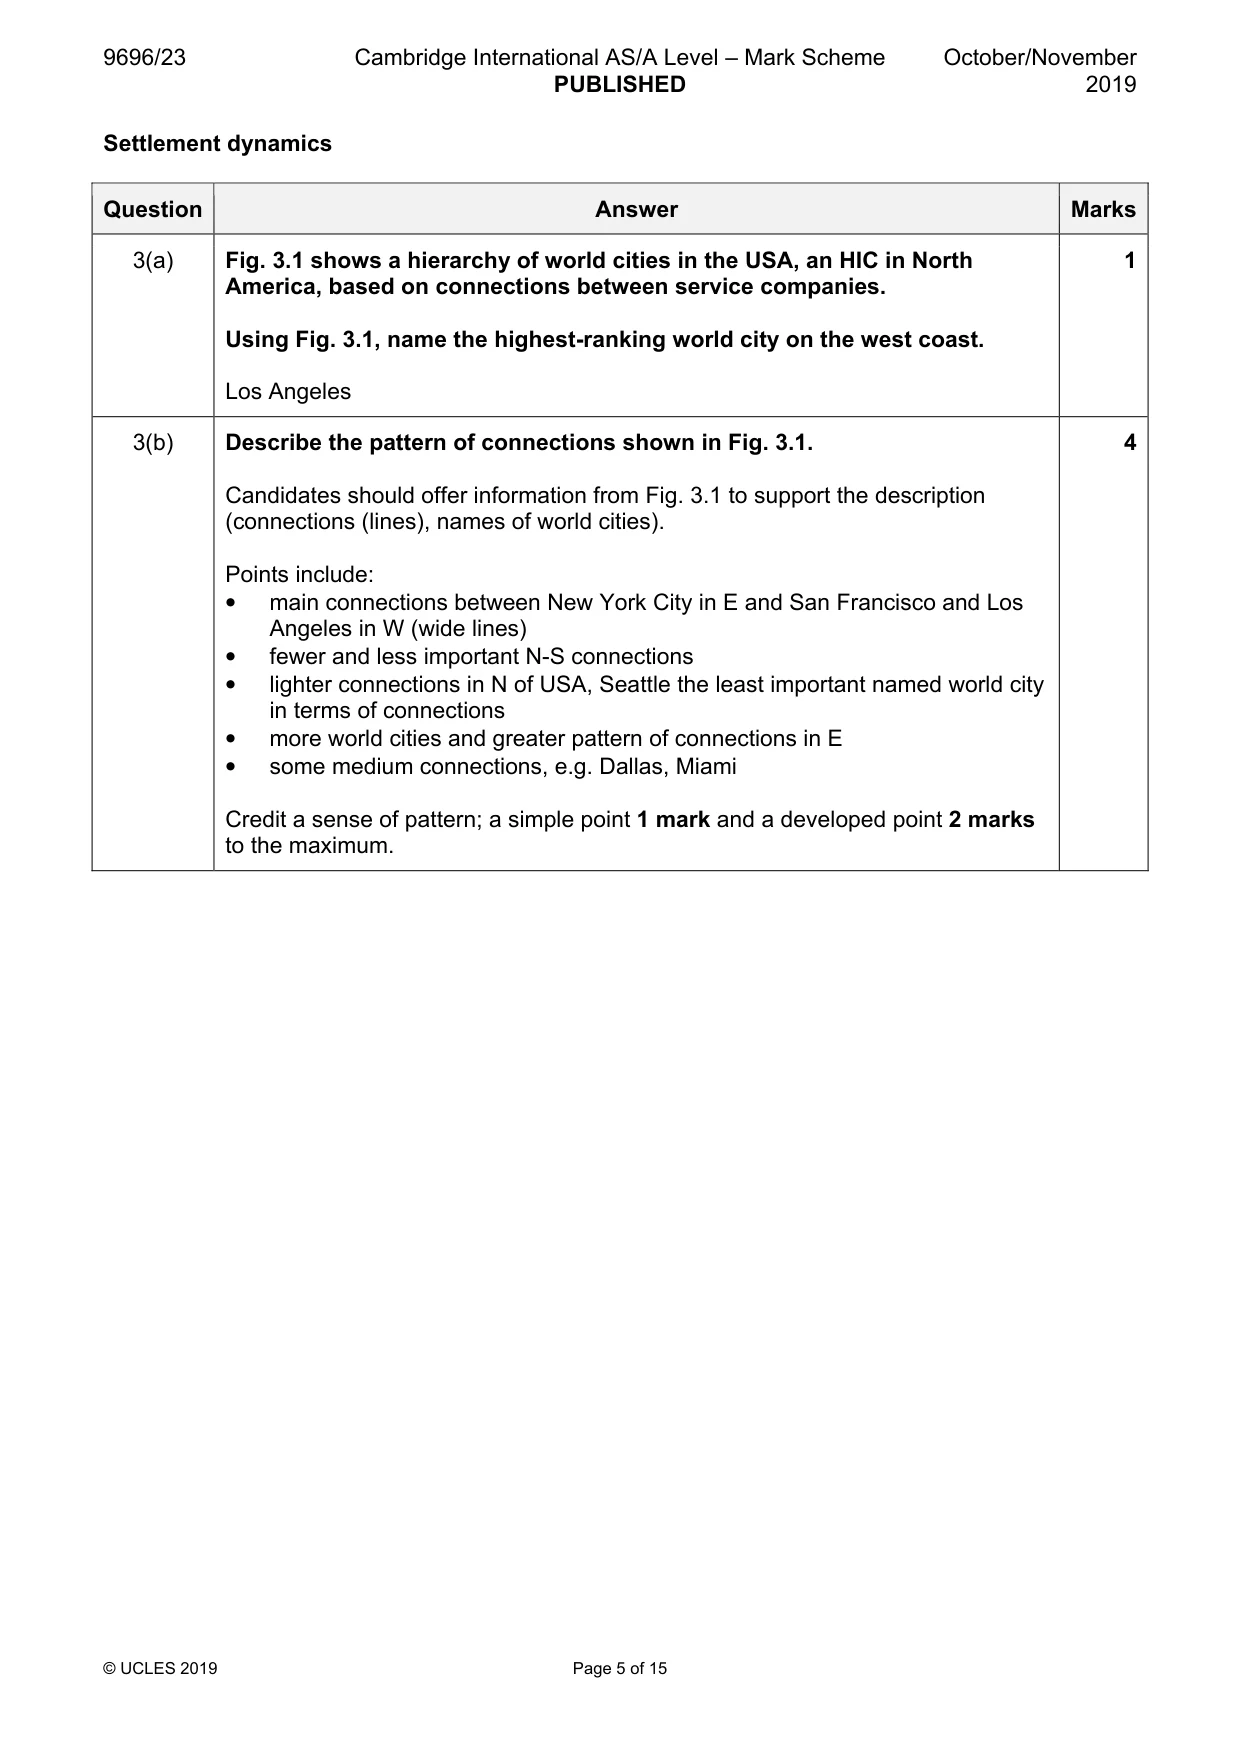
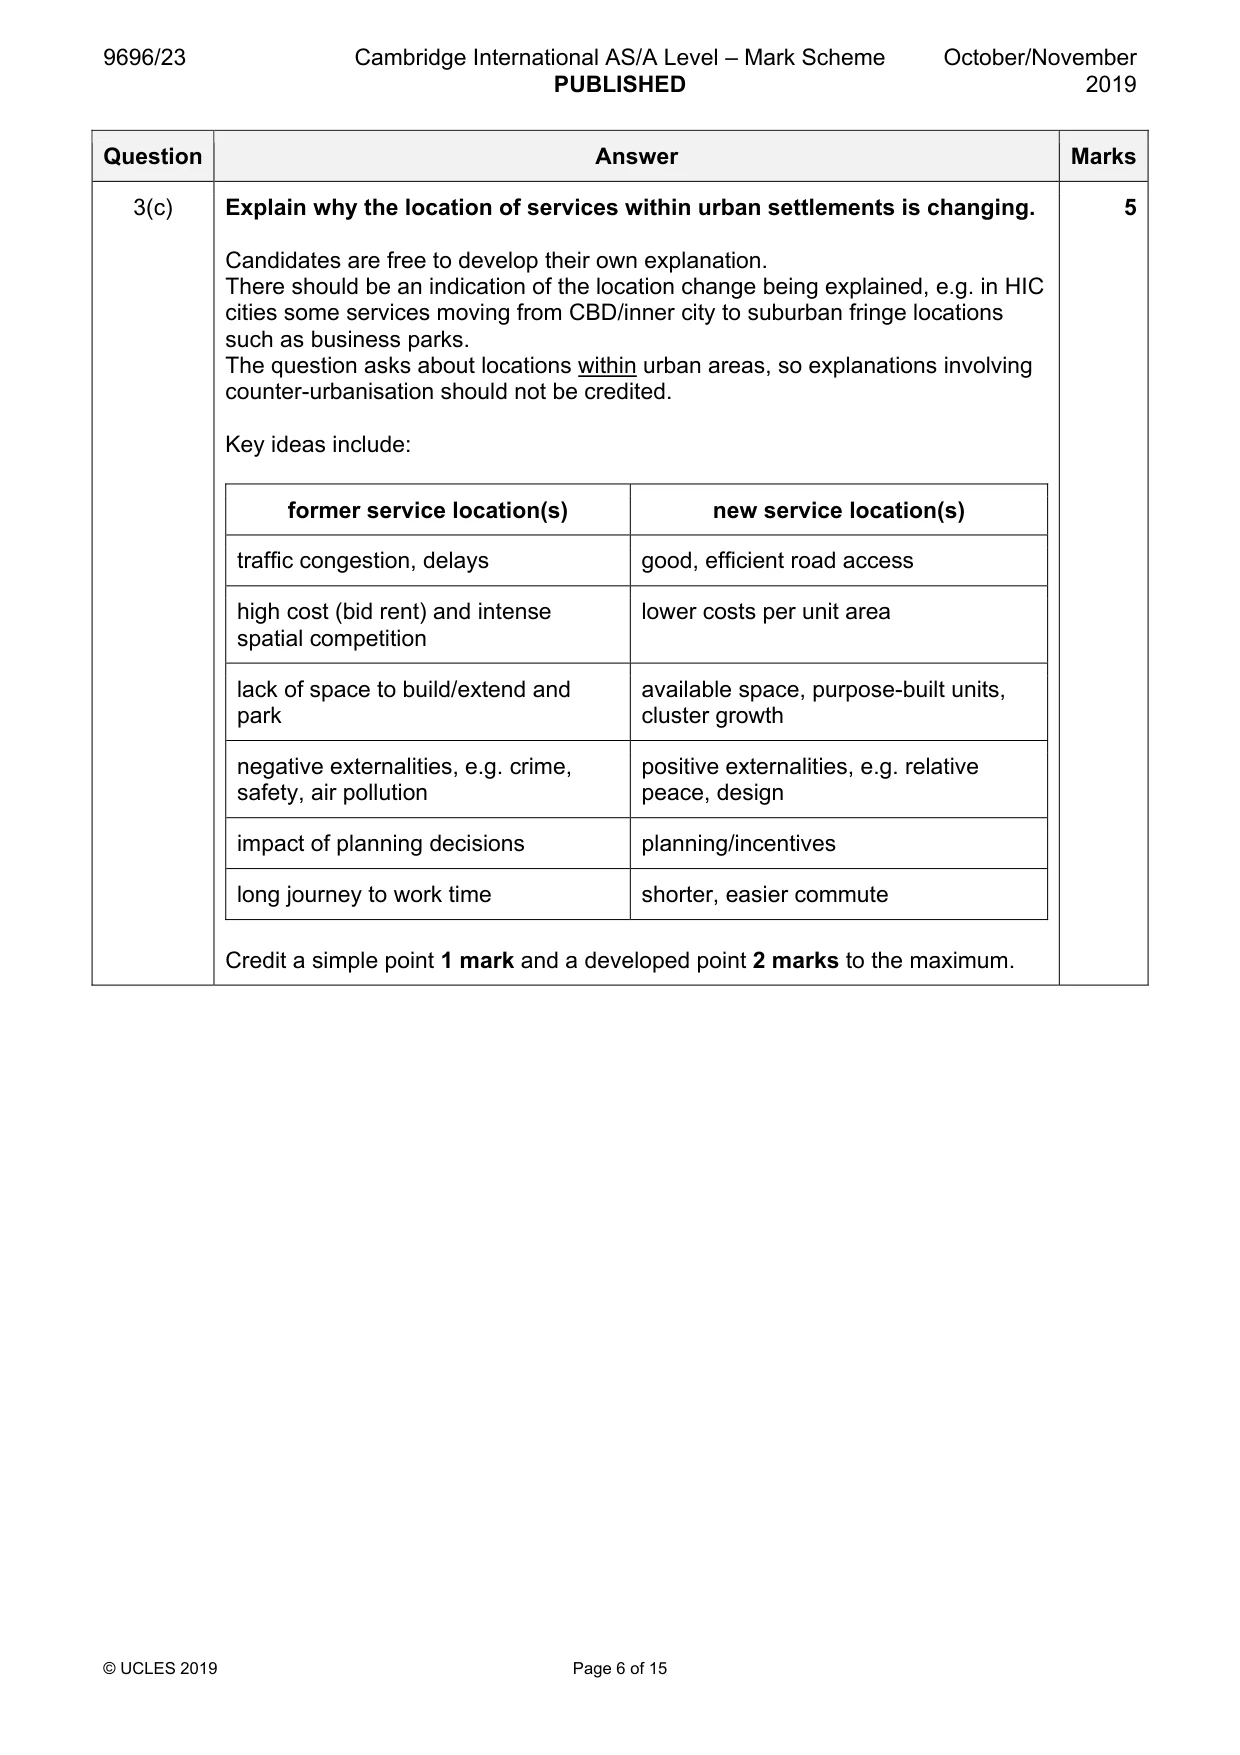
Mark scheme: 3(a) Fig. 3.1 shows a hierarchy of world cities in the USA, an HIC in North 1 America, based on connections between service companies. Using Fig. 3.1, name the highest-ranking world city on the west coast. Los Angeles 3(b) Describe the pattern of connections shown in Fig. 3.1. 4 Candidates should offer information from Fig. 3.1 to support the description (connections (lines), names of world cities). Points include: • main connections between New York City in E and San Francisco and Los Angeles in W (wide lines) • fewer and less important N-S connections • lighter connections in N of USA, Seattle the least important named world city in terms of connections • more world cities and greater pattern of connections in E • some medium connections, e.g. Dallas, Miami Credit a sense of pattern; a simple point 1 mark and a developed point 2 marks to the maximum. 3(c) Explain why the location of services within urban settlements is changing. 5 Candidates are free to develop their own explanation. There should be an indication of the location change being explained, e.g. in HIC cities some services moving from CBD/inner city to suburban fringe locations such as business parks. The question asks about locations within urban areas, so explanations involving counter-urbanisation should not be credited. Key ideas include: former service location(s) new service location(s) traffic congestion, delays good, efficient road access high cost (bid rent) and intense lower costs per unit area spatial competition lack of space to build/extend and available space, purpose-built units, park cluster growth negative externalities, e.g. crime, positive externalities, e.g. relative safety, air pollution peace, design impact of planning decisions planning/incentives long journey to work time shorter, easier commute Credit a simple point 1 mark and a developed point 2 marks to the maximum. Section B Answer one question from this section. All questions carry 30 marks. Population
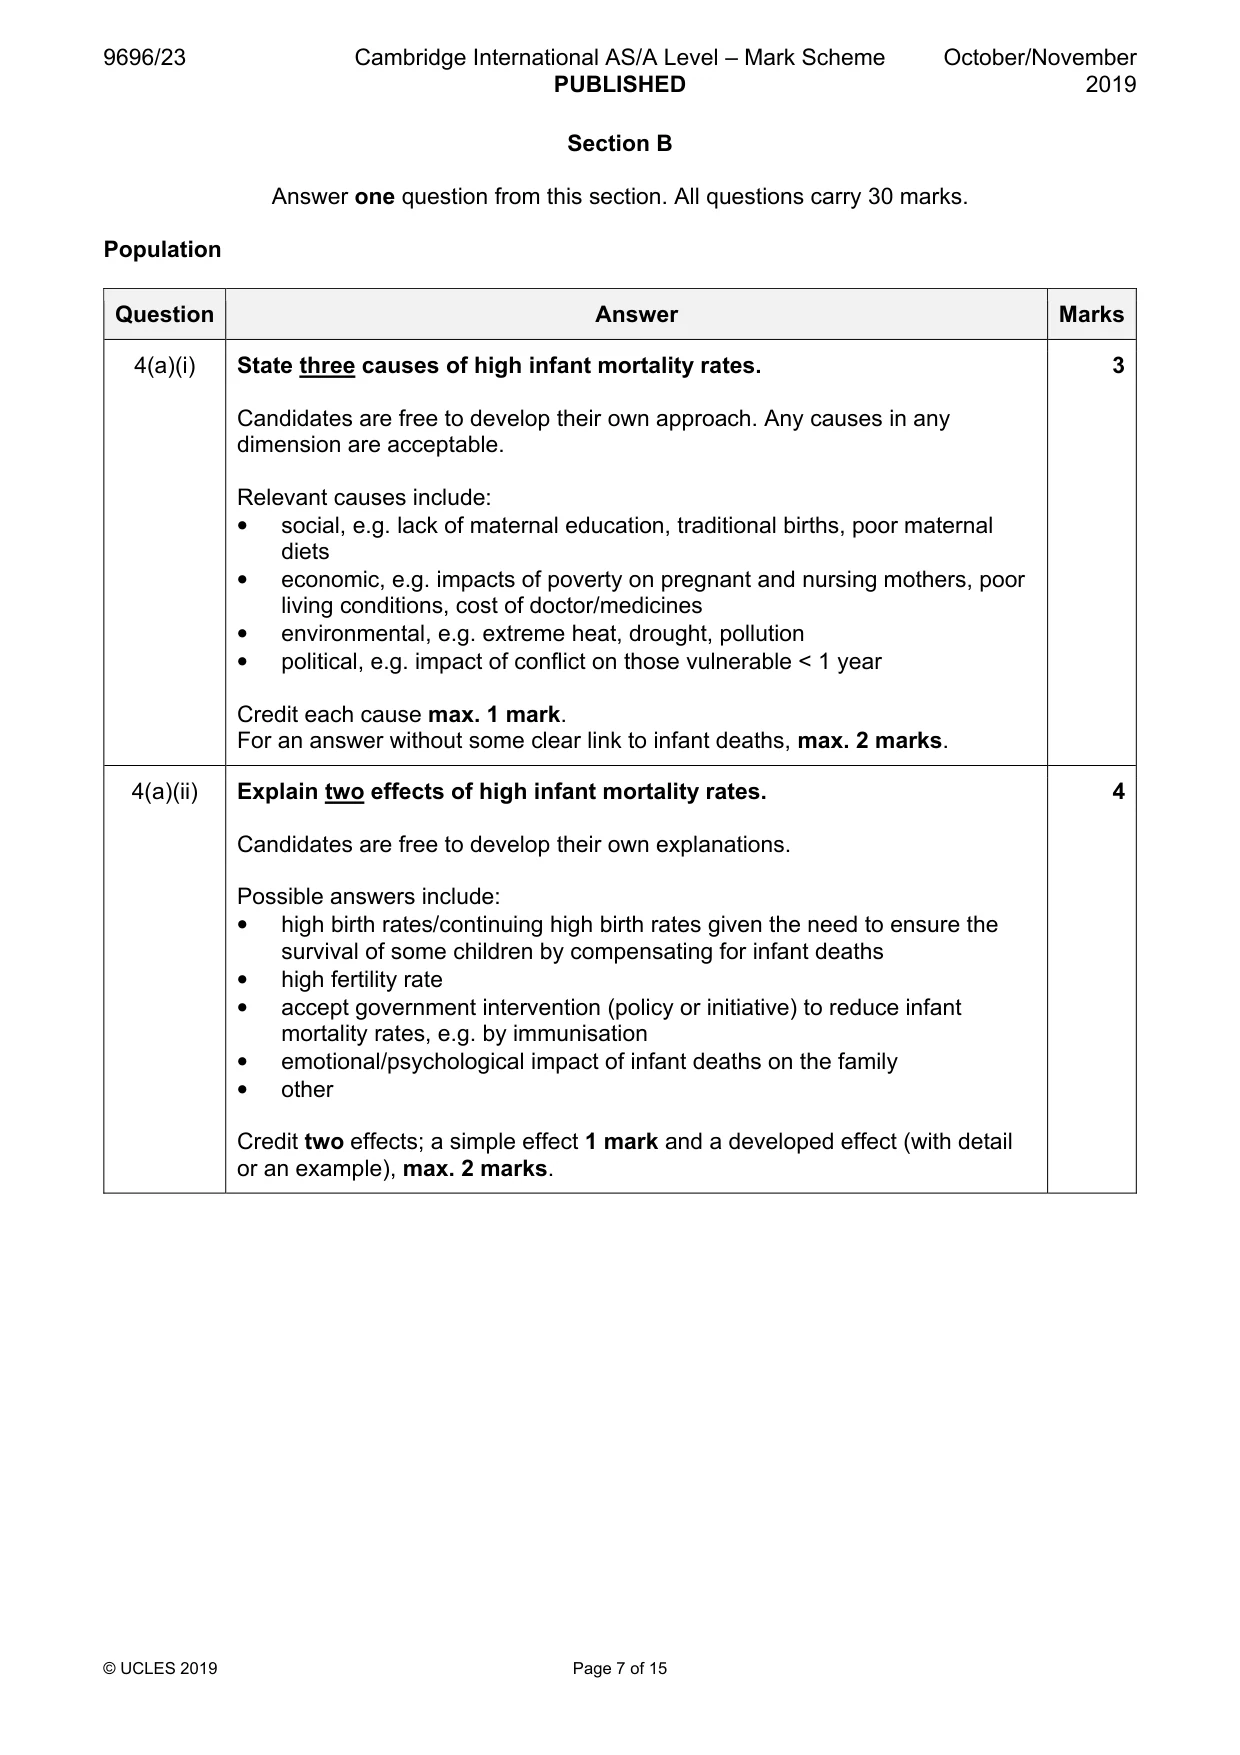
Q4 · State three causes of high infant mortality rates
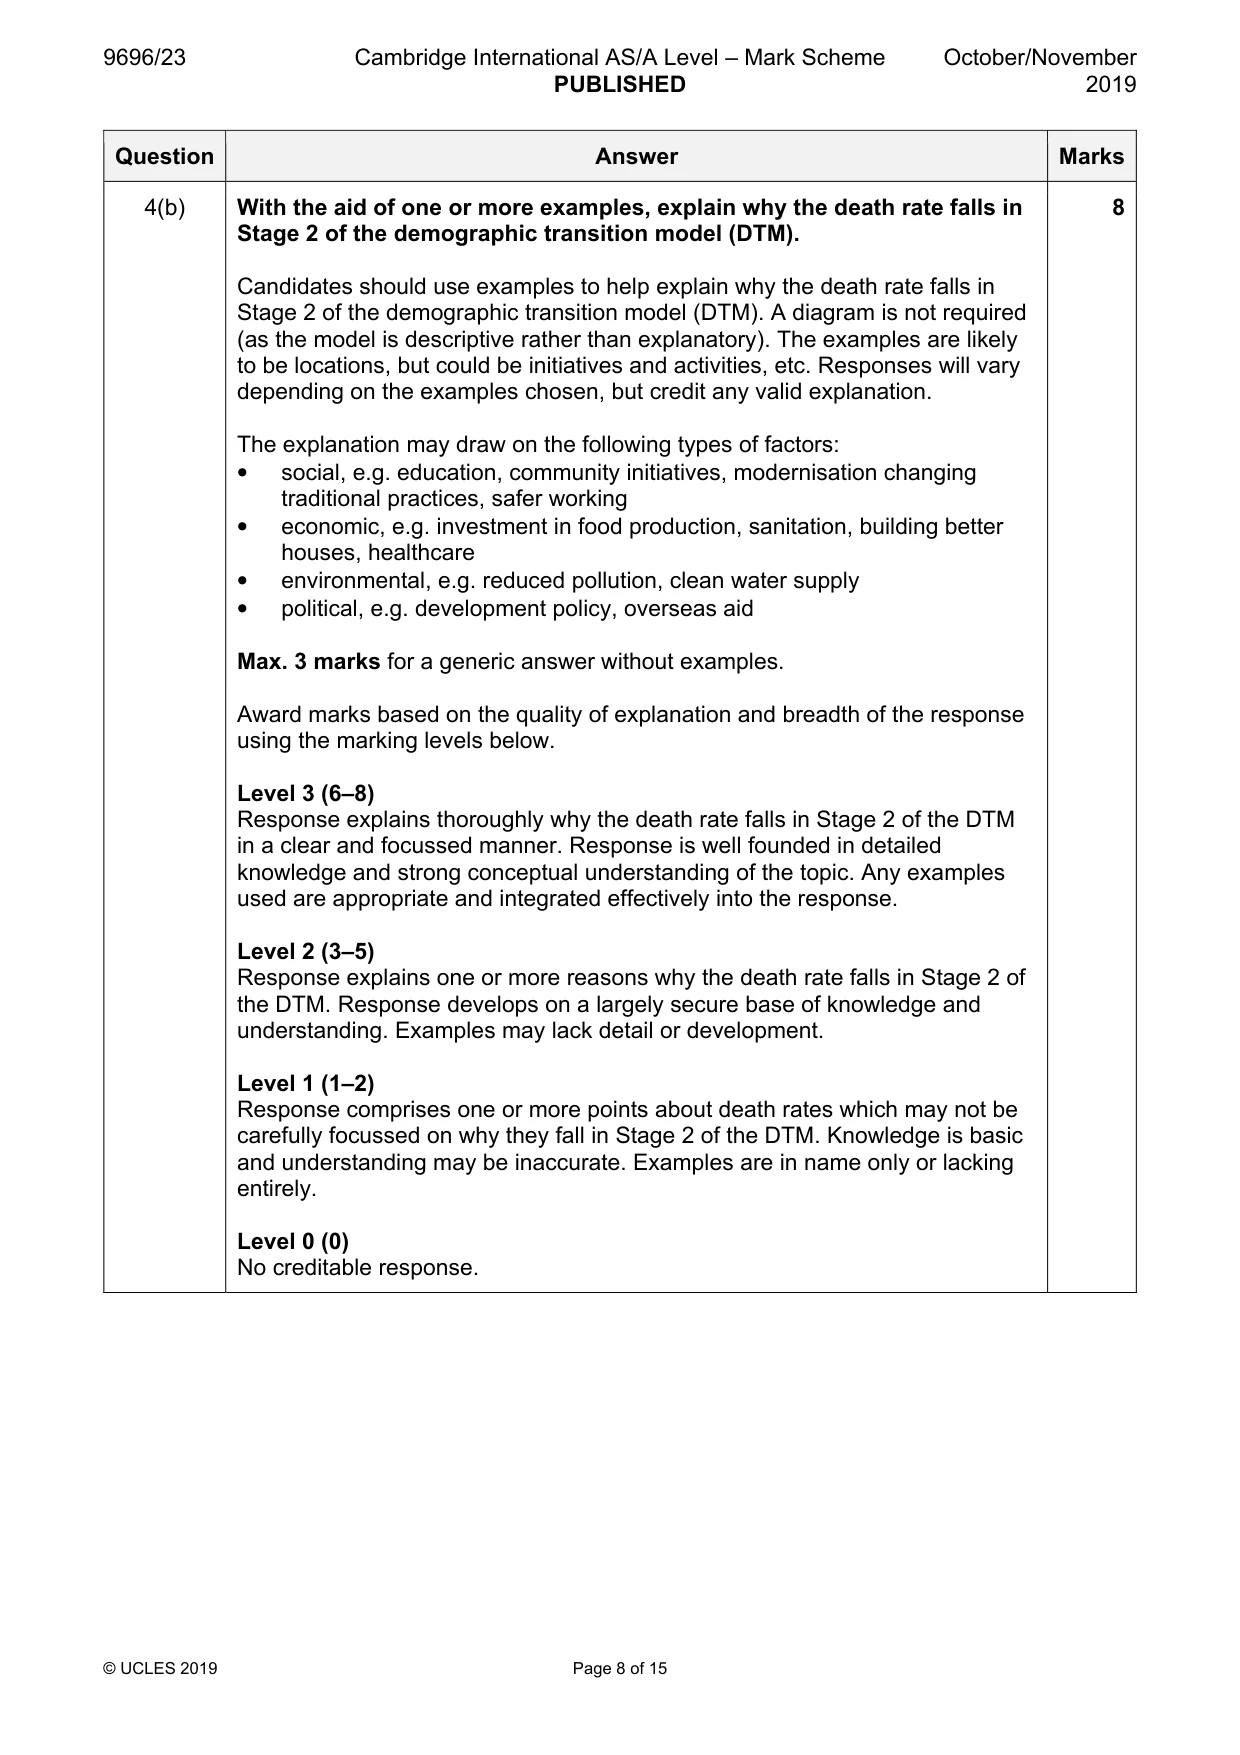
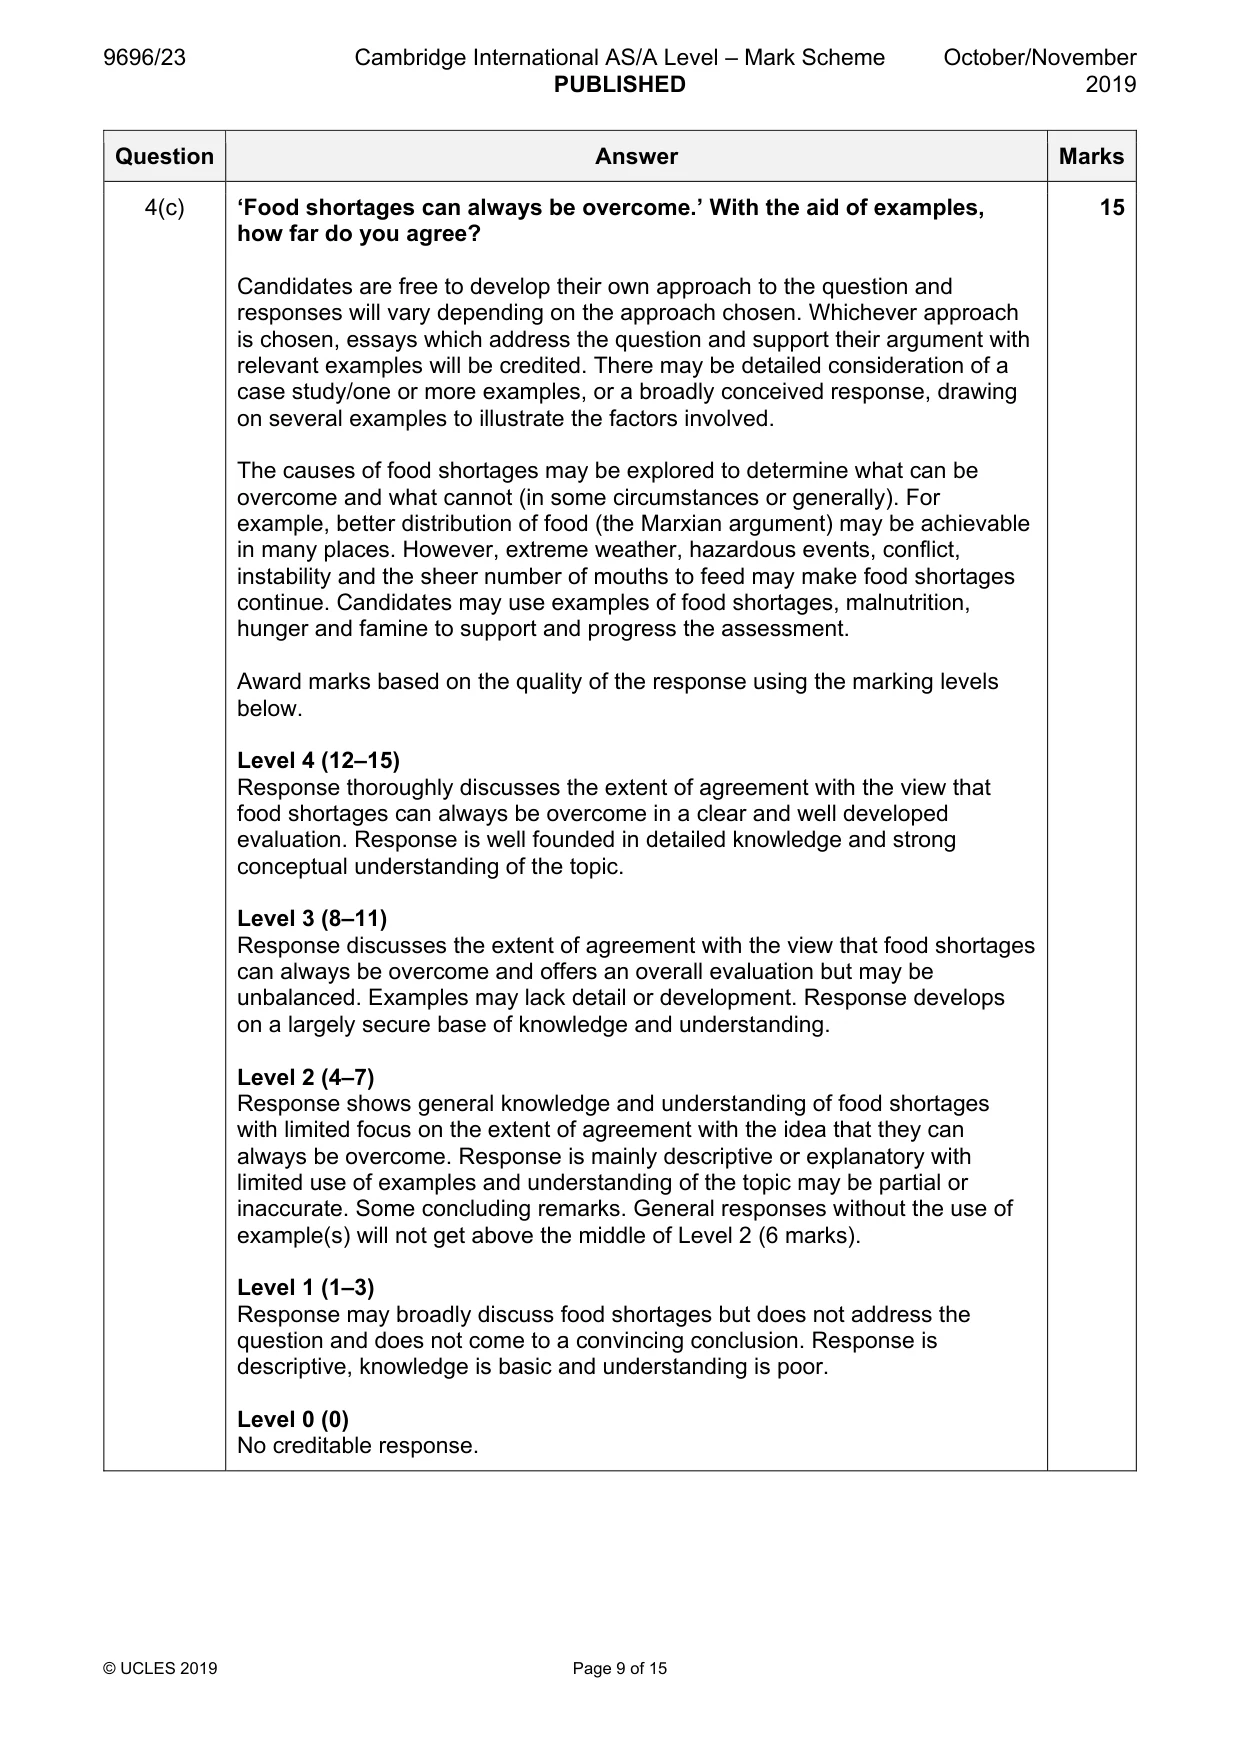
4 (a) (i) State three causes of high infant mortality rates. [3] (ii) Explain two effects of high infant mortality rates. [4] (b) With the aid of one or more examples, explain why the death rate falls in Stage 2 of the demographic transition model (DTM). [8] (c) ‘Food shortages can always be overcome.’ With the aid of examples, how far do you agree? [15] [Total: 30] Migration
Mark scheme: 4(a)(i) State three causes of high infant mortality rates. 3 Candidates are free to develop their own approach. Any causes in any dimension are acceptable. Relevant causes include: • social, e.g. lack of maternal education, traditional births, poor maternal diets • economic, e.g. impacts of poverty on pregnant and nursing mothers, poor living conditions, cost of doctor/medicines • environmental, e.g. extreme heat, drought, pollution • political, e.g. impact of conflict on those vulnerable < 1 year Credit each cause max. 1 mark. For an answer without some clear link to infant deaths, max. 2 marks. 4(a)(ii) Explain two effects of high infant mortality rates. 4 Candidates are free to develop their own explanations. Possible answers include: • high birth rates/continuing high birth rates given the need to ensure the survival of some children by compensating for infant deaths • high fertility rate • accept government intervention (policy or initiative) to reduce infant mortality rates, e.g. by immunisation • emotional/psychological impact of infant deaths on the family • other Credit two effects; a simple effect 1 mark and a developed effect (with detail or an example), max. 2 marks. 4(b) With the aid of one or more examples, explain why the death rate falls in 8 Stage 2 of the demographic transition model (DTM). Candidates should use examples to help explain why the death rate falls in Stage 2 of the demographic transition model (DTM). A diagram is not required (as the model is descriptive rather than explanatory). The examples are likely to be locations, but could be initiatives and activities, etc. Responses will vary depending on the examples chosen, but credit any valid explanation. The explanation may draw on the following types of factors: • social, e.g. education, community initiatives, modernisation changing traditional practices, safer working • economic, e.g. investment in food production, sanitation, building better houses, healthcare • environmental, e.g. reduced pollution, clean water supply • political, e.g. development policy, overseas aid Max. 3 marks for a generic answer without examples. Award marks based on the quality of explanation and breadth of the response using the marking levels below. Level 3 (6–8) Response explains thoroughly why the death rate falls in Stage 2 of the DTM in a clear and focussed manner. Response is well founded in detailed knowledge and strong conceptual understanding of the topic. Any examples used are appropriate and integrated effectively into the response. Level 2 (3–5) Response explains one or more reasons why the death rate falls in Stage 2 of the DTM. Response develops on a largely secure base of knowledge and understanding. Examples may lack detail or development. Level 1 (1–2) Response comprises one or more points about death rates which may not be carefully focussed on why they fall in Stage 2 of the DTM. Knowledge is basic and understanding may be inaccurate. Examples are in name only or lacking entirely. Level 0 (0) No creditable response. 4(c) ‘Food shortages can always be overcome.’ With the aid of examples, 15 how far do you agree? Candidates are free to develop their own approach to the question and responses will vary depending on the approach chosen. Whichever approach is chosen, essays which address the question and support their argument with relevant examples will be credited. There may be detailed consideration of a case study/one or more examples, or a broadly conceived response, drawing on several examples to illustrate the factors involved. The causes of food shortages may be explored to determine what can be overcome and what cannot (in some circumstances or generally). For example, better distribution of food (the Marxian argument) may be achievable in many places. However, extreme weather, hazardous events, conflict, instability and the sheer number of mouths to feed may make food shortages continue. Candidates may use examples of food shortages, malnutrition, hunger and famine to support and progress the assessment. Award marks based on the quality of the response using the marking levels below. Level 4 (12–15) Response thoroughly discusses the extent of agreement with the view that food shortages can always be overcome in a clear and well developed evaluation. Response is well founded in detailed knowledge and strong conceptual understanding of the topic. Level 3 (8–11) Response discusses the extent of agreement with the view that food shortages can always be overcome and offers an overall evaluation but may be unbalanced. Examples may lack detail or development. Response develops on a largely secure base of knowledge and understanding. Level 2 (4–7) Response shows general knowledge and understanding of food shortages with limited focus on the extent of agreement with the idea that they can always be overcome. Response is mainly descriptive or explanatory with limited use of examples and understanding of the topic may be partial or inaccurate. Some concluding remarks. General responses without the use of example(s) will not get above the middle of Level 2 (6 marks). Level 1 (1–3) Response may broadly discuss food shortages but does not address the question and does not come to a convincing conclusion. Response is descriptive, knowledge is basic and understanding is poor. Level 0 (0) No creditable response. Migration
Q5 · Give the meaning of the term international forced (involuntary) migration
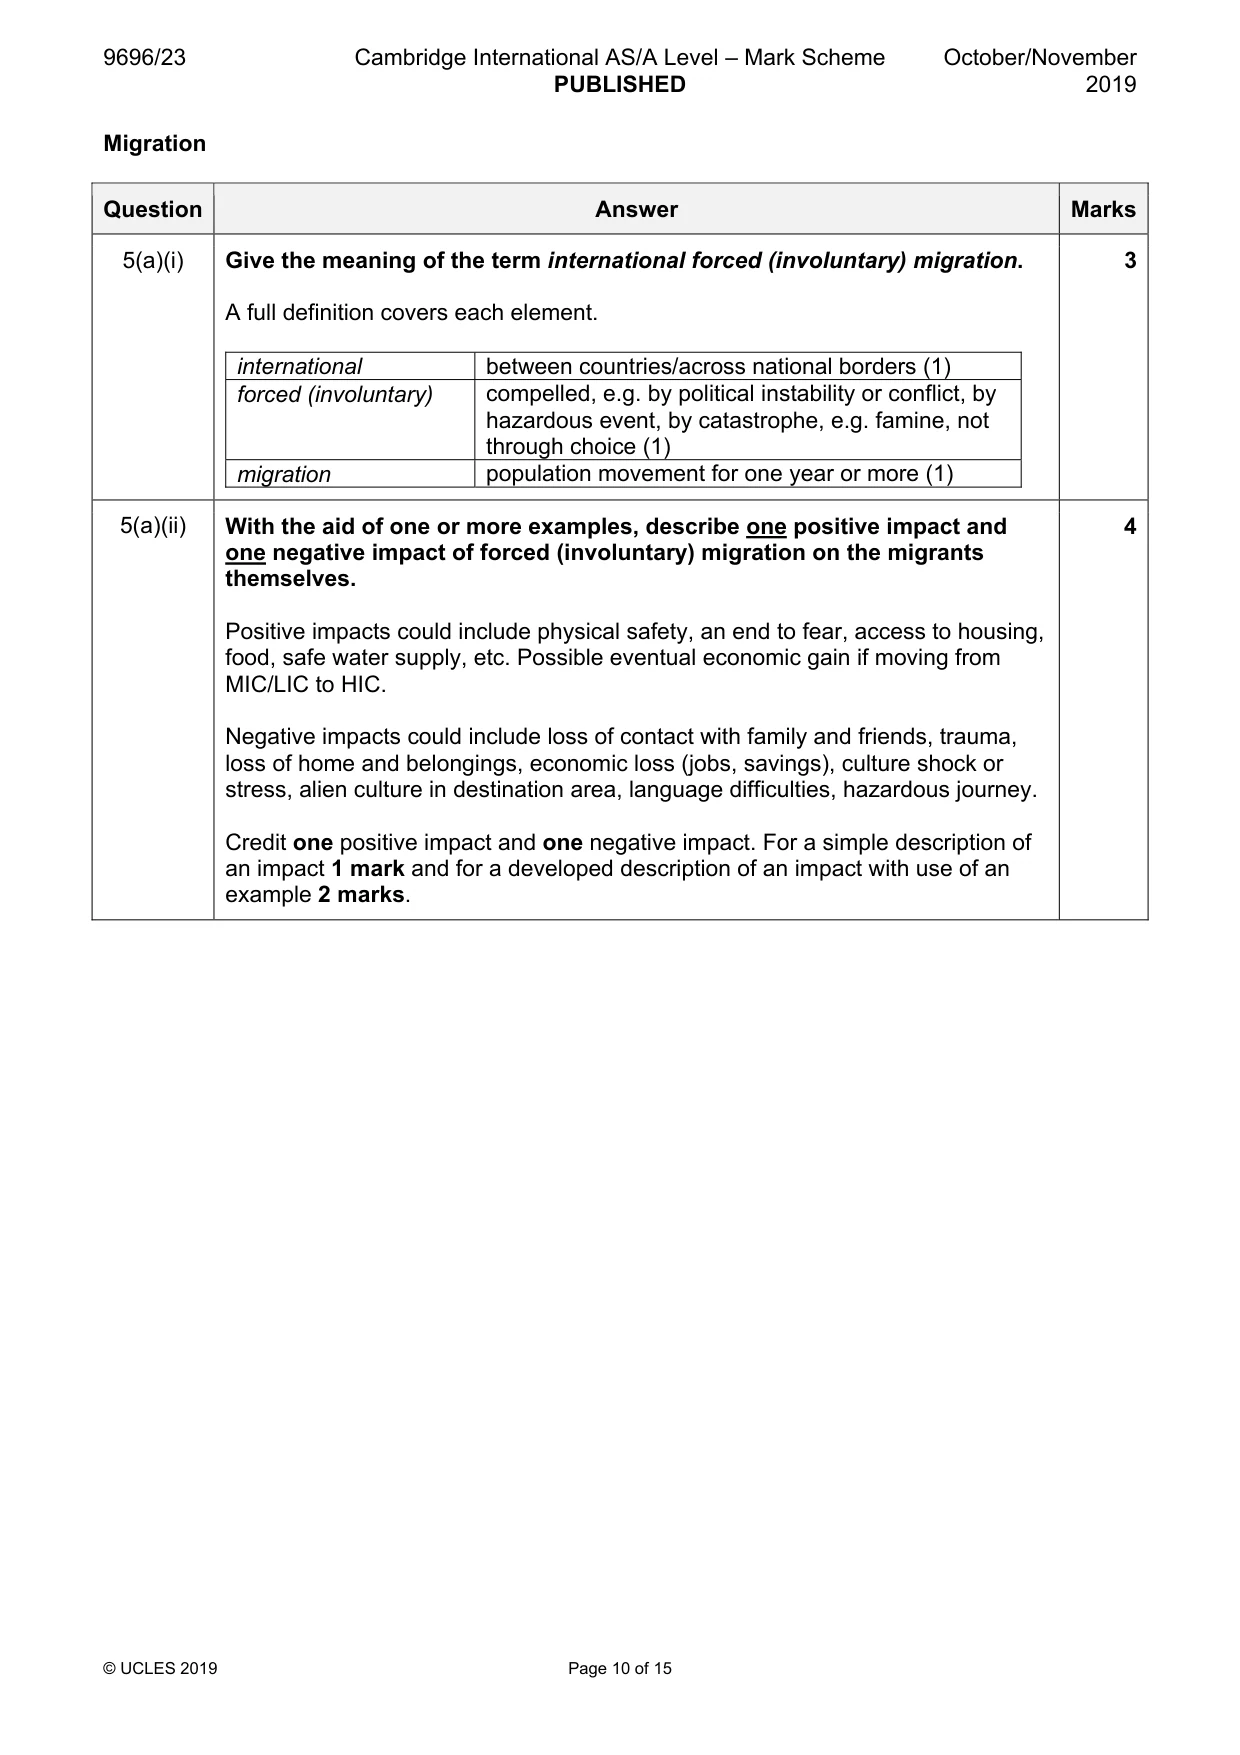
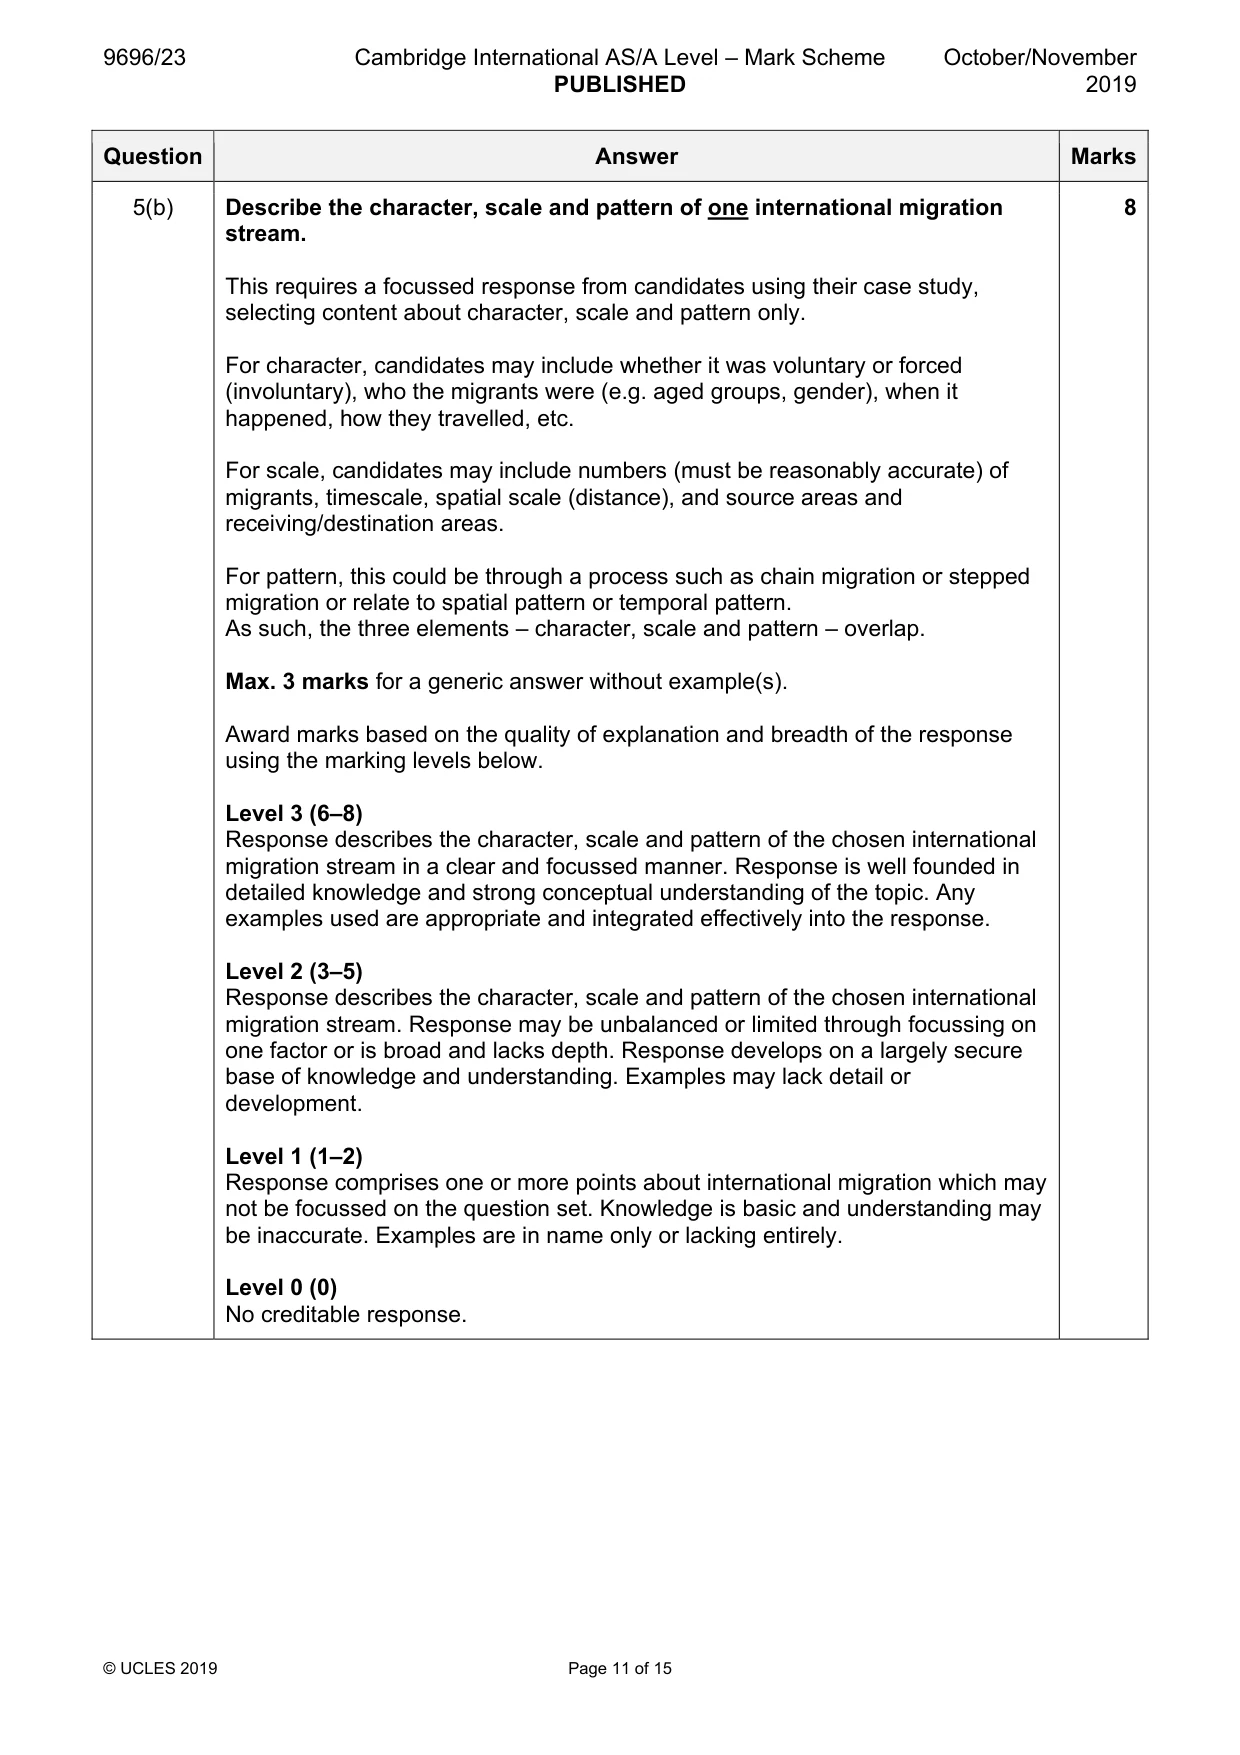
5 (a) (i) Give the meaning of the term international forced (involuntary) migration. [3] (ii) With the aid of one or more examples, describe one positive impact and one negative impact of forced (involuntary) migration on the migrants themselves. [4] (b) Describe the character, scale and pattern of one international migration stream. [8] (c) With the aid of examples, assess the extent to which pull factors cause international economic migration. [15] [Total: 30] Migration/Settlement dynamics
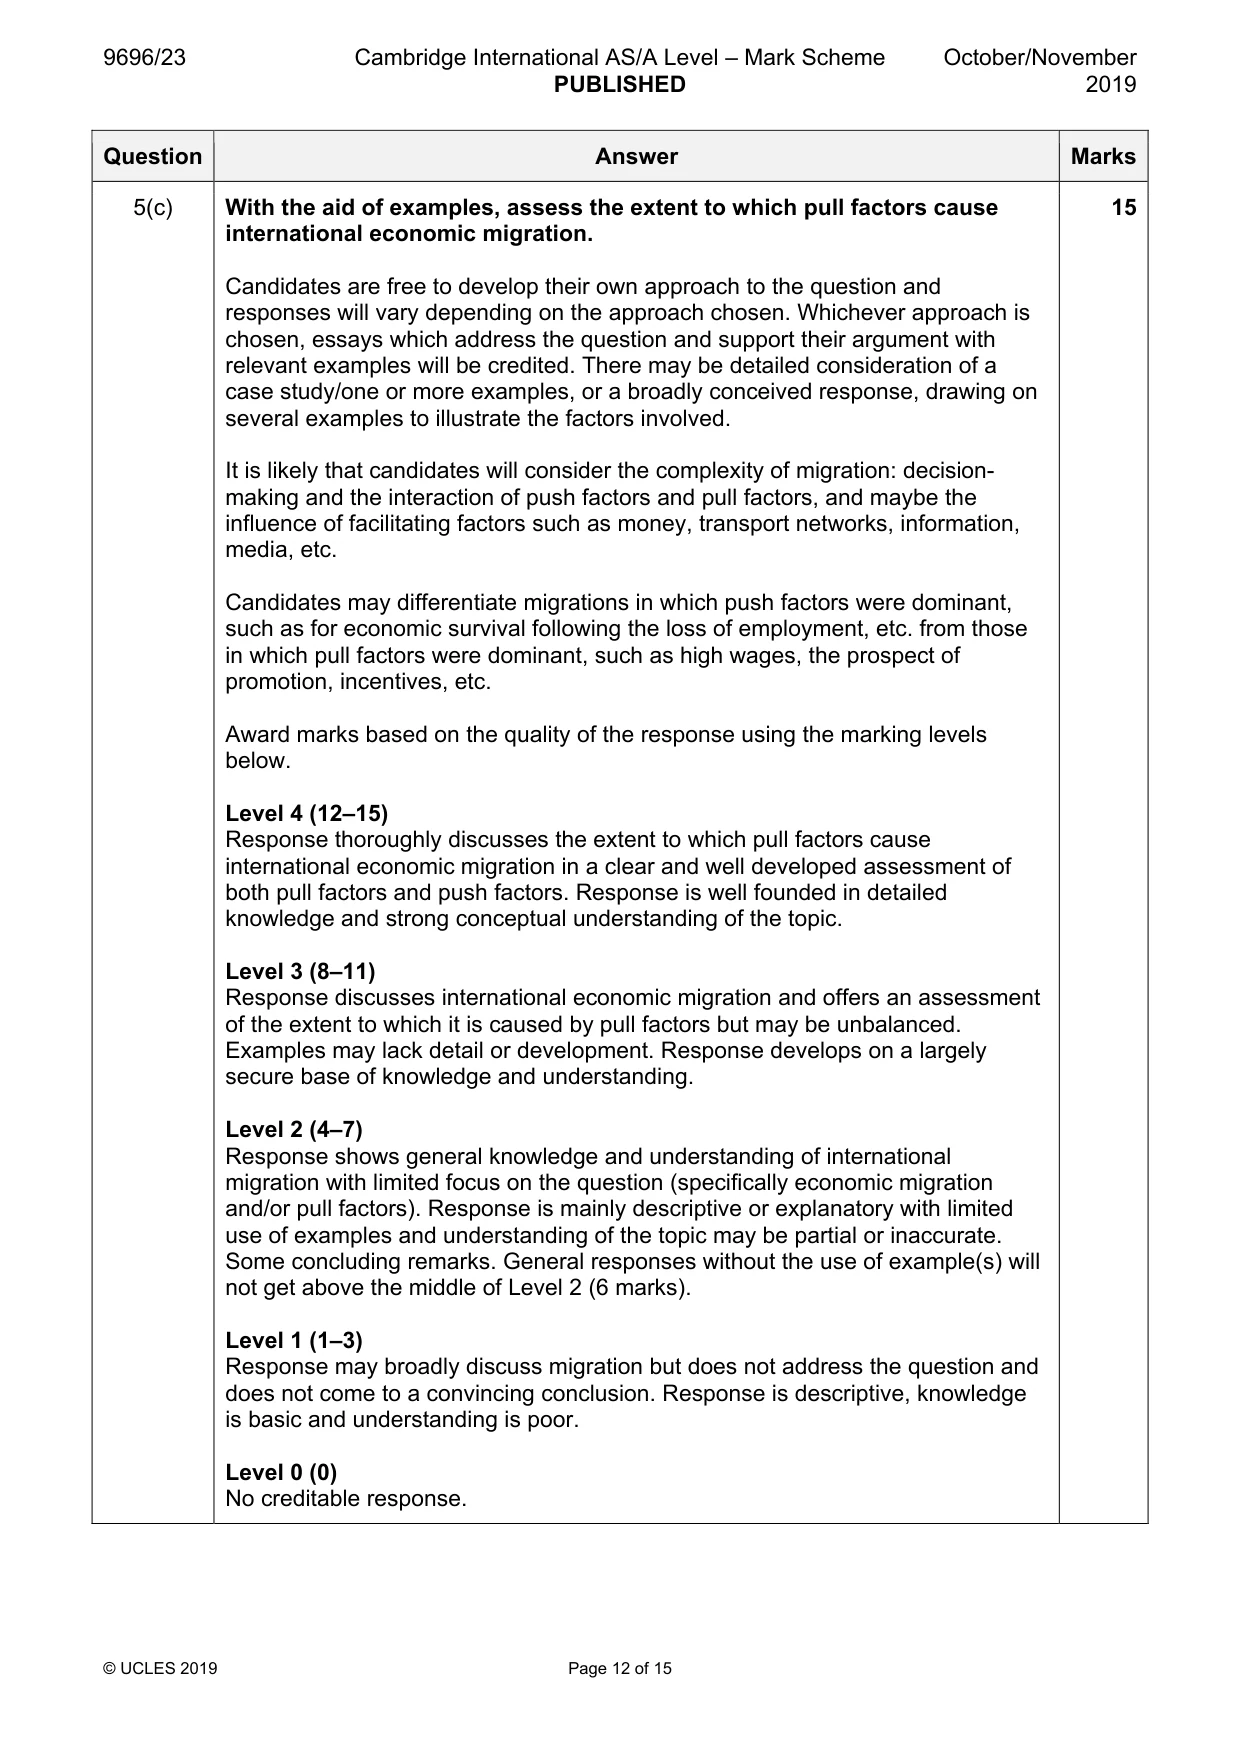
Mark scheme: 5(a)(i) Give the meaning of the term international forced (involuntary) migration. 3 A full definition covers each element. international between countries/across national borders (1) forced (involuntary) compelled, e.g. by political instability or conflict, by hazardous event, by catastrophe, e.g. famine, not through choice (1) migration population movement for one year or more (1) 5(a)(ii) With the aid of one or more examples, describe one positive impact and 4 one negative impact of forced (involuntary) migration on the migrants themselves. Positive impacts could include physical safety, an end to fear, access to housing, food, safe water supply, etc. Possible eventual economic gain if moving from MIC/LIC to HIC. Negative impacts could include loss of contact with family and friends, trauma, loss of home and belongings, economic loss (jobs, savings), culture shock or stress, alien culture in destination area, language difficulties, hazardous journey. Credit one positive impact and one negative impact. For a simple description of an impact 1 mark and for a developed description of an impact with use of an example 2 marks. 5(b) Describe the character, scale and pattern of one international migration 8 stream. This requires a focussed response from candidates using their case study, selecting content about character, scale and pattern only. For character, candidates may include whether it was voluntary or forced (involuntary), who the migrants were (e.g. aged groups, gender), when it happened, how they travelled, etc. For scale, candidates may include numbers (must be reasonably accurate) of migrants, timescale, spatial scale (distance), and source areas and receiving/destination areas. For pattern, this could be through a process such as chain migration or stepped migration or relate to spatial pattern or temporal pattern. As such, the three elements – character, scale and pattern – overlap. Max. 3 marks for a generic answer without example(s). Award marks based on the quality of explanation and breadth of the response using the marking levels below. Level 3 (6–8) Response describes the character, scale and pattern of the chosen international migration stream in a clear and focussed manner. Response is well founded in detailed knowledge and strong conceptual understanding of the topic. Any examples used are appropriate and integrated effectively into the response. Level 2 (3–5) Response describes the character, scale and pattern of the chosen international migration stream. Response may be unbalanced or limited through focussing on one factor or is broad and lacks depth. Response develops on a largely secure base of knowledge and understanding. Examples may lack detail or development. Level 1 (1–2) Response comprises one or more points about international migration which may not be focussed on the question set. Knowledge is basic and understanding may be inaccurate. Examples are in name only or lacking entirely. Level 0 (0) No creditable response. 5(c) With the aid of examples, assess the extent to which pull factors cause 15 international economic migration. Candidates are free to develop their own approach to the question and responses will vary depending on the approach chosen. Whichever approach is chosen, essays which address the question and support their argument with relevant examples will be credited. There may be detailed consideration of a case study/one or more examples, or a broadly conceived response, drawing on several examples to illustrate the factors involved. It is likely that candidates will consider the complexity of migration: decision- making and the interaction of push factors and pull factors, and maybe the influence of facilitating factors such as money, transport networks, information, media, etc. Candidates may differentiate migrations in which push factors were dominant, such as for economic survival following the loss of employment, etc. from those in which pull factors were dominant, such as high wages, the prospect of promotion, incentives, etc. Award marks based on the quality of the response using the marking levels below. Level 4 (12–15) Response thoroughly discusses the extent to which pull factors cause international economic migration in a clear and well developed assessment of both pull factors and push factors. Response is well founded in detailed knowledge and strong conceptual understanding of the topic. Level 3 (8–11) Response discusses international economic migration and offers an assessment of the extent to which it is caused by pull factors but may be unbalanced. Examples may lack detail or development. Response develops on a largely secure base of knowledge and understanding. Level 2 (4–7) Response shows general knowledge and understanding of international migration with limited focus on the question (specifically economic migration and/or pull factors). Response is mainly descriptive or explanatory with limited use of examples and understanding of the topic may be partial or inaccurate. Some concluding remarks. General responses without the use of example(s) will not get above the middle of Level 2 (6 marks). Level 1 (1–3) Response may broadly discuss migration but does not address the question and does not come to a convincing conclusion. Response is descriptive, knowledge is basic and understanding is poor. Level 0 (0) No creditable response. Migrant/Settlement dynamics
Q6 · With the aid of an example, give the meaning of the term re‑urbanisation
6 (a) (i) With the aid of an example, give the meaning of the term re‑urbanisation. [3] (ii) Explain two reasons why re-urbanisation occurs. [4] (b) Explain why functional zonation develops in urban areas. [8] (c) ‘It is their large scale that makes it difficult to manage urban settlements.’ With the aid of one or more examples, how far do you agree? [15] [Total: 30]
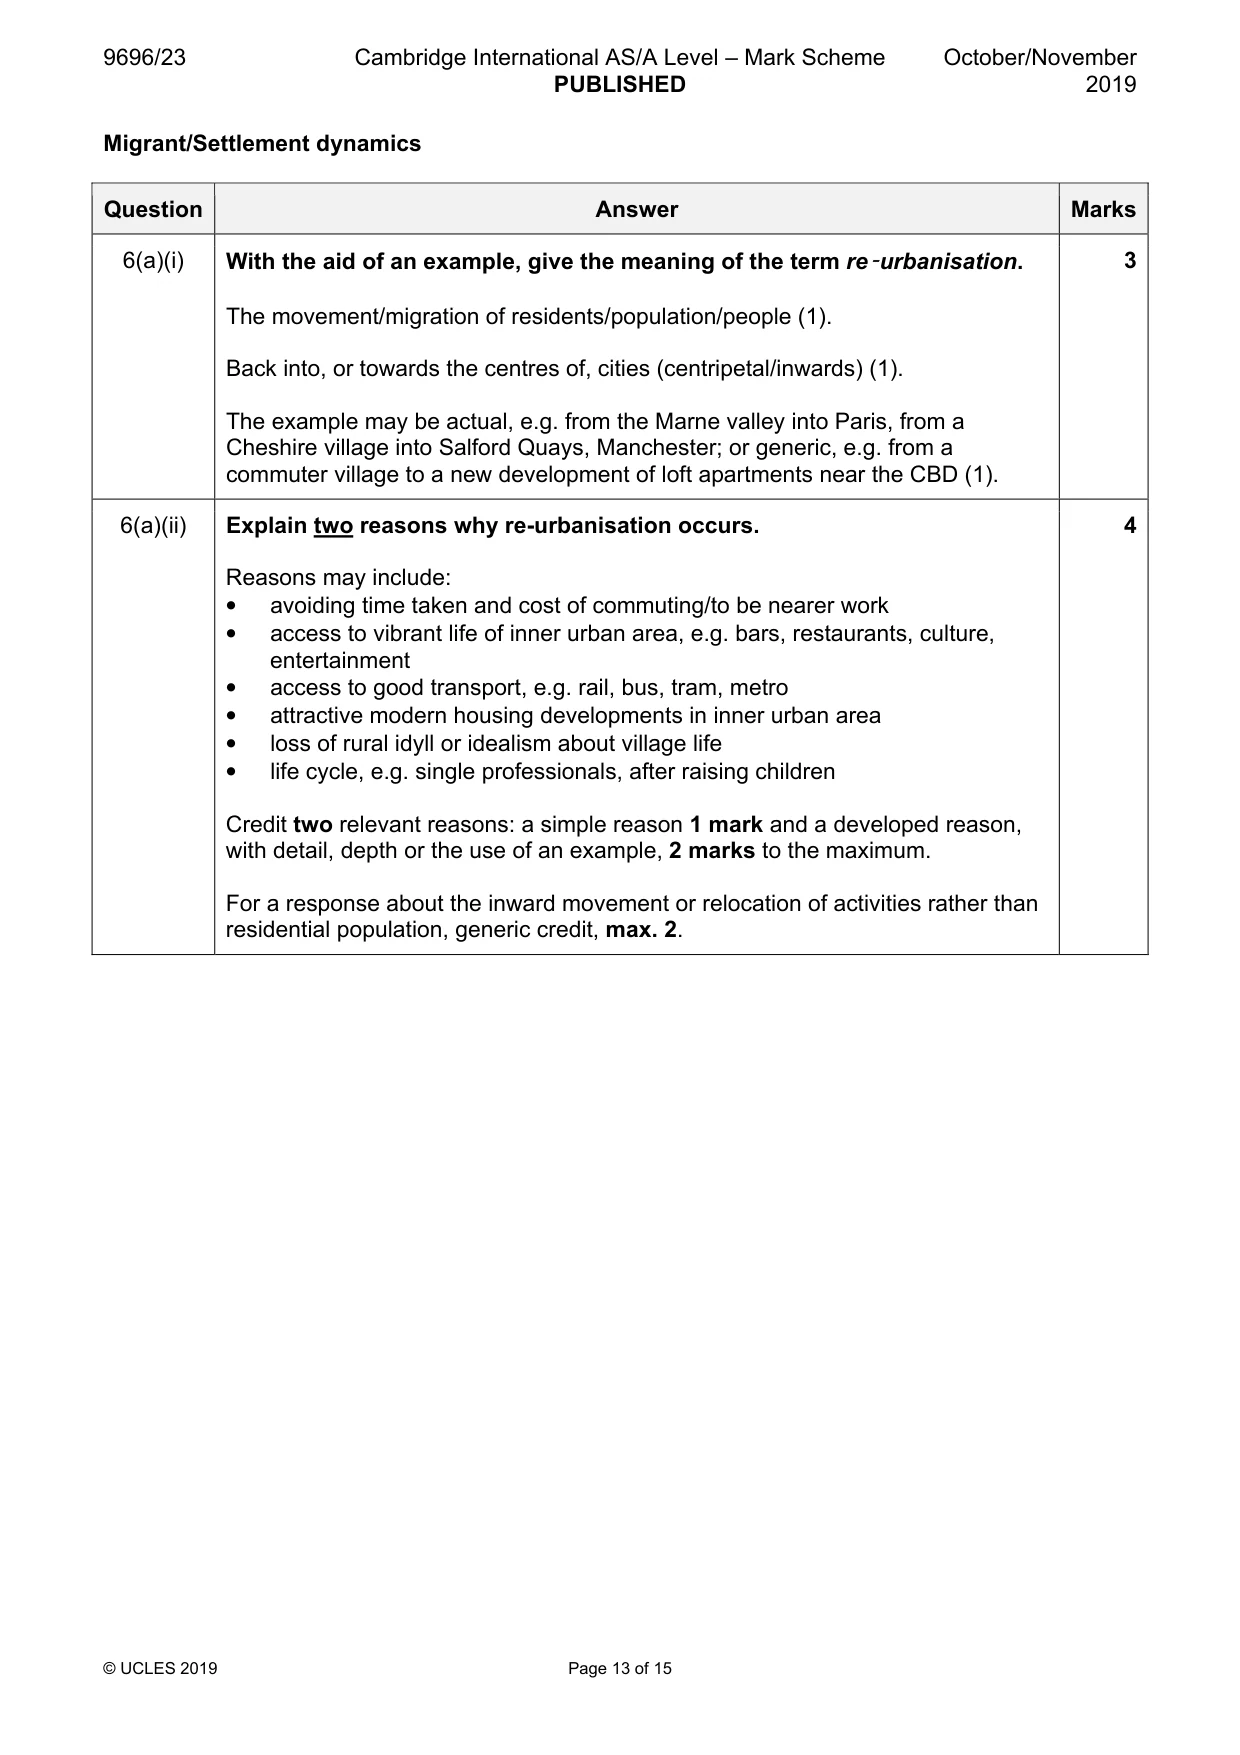
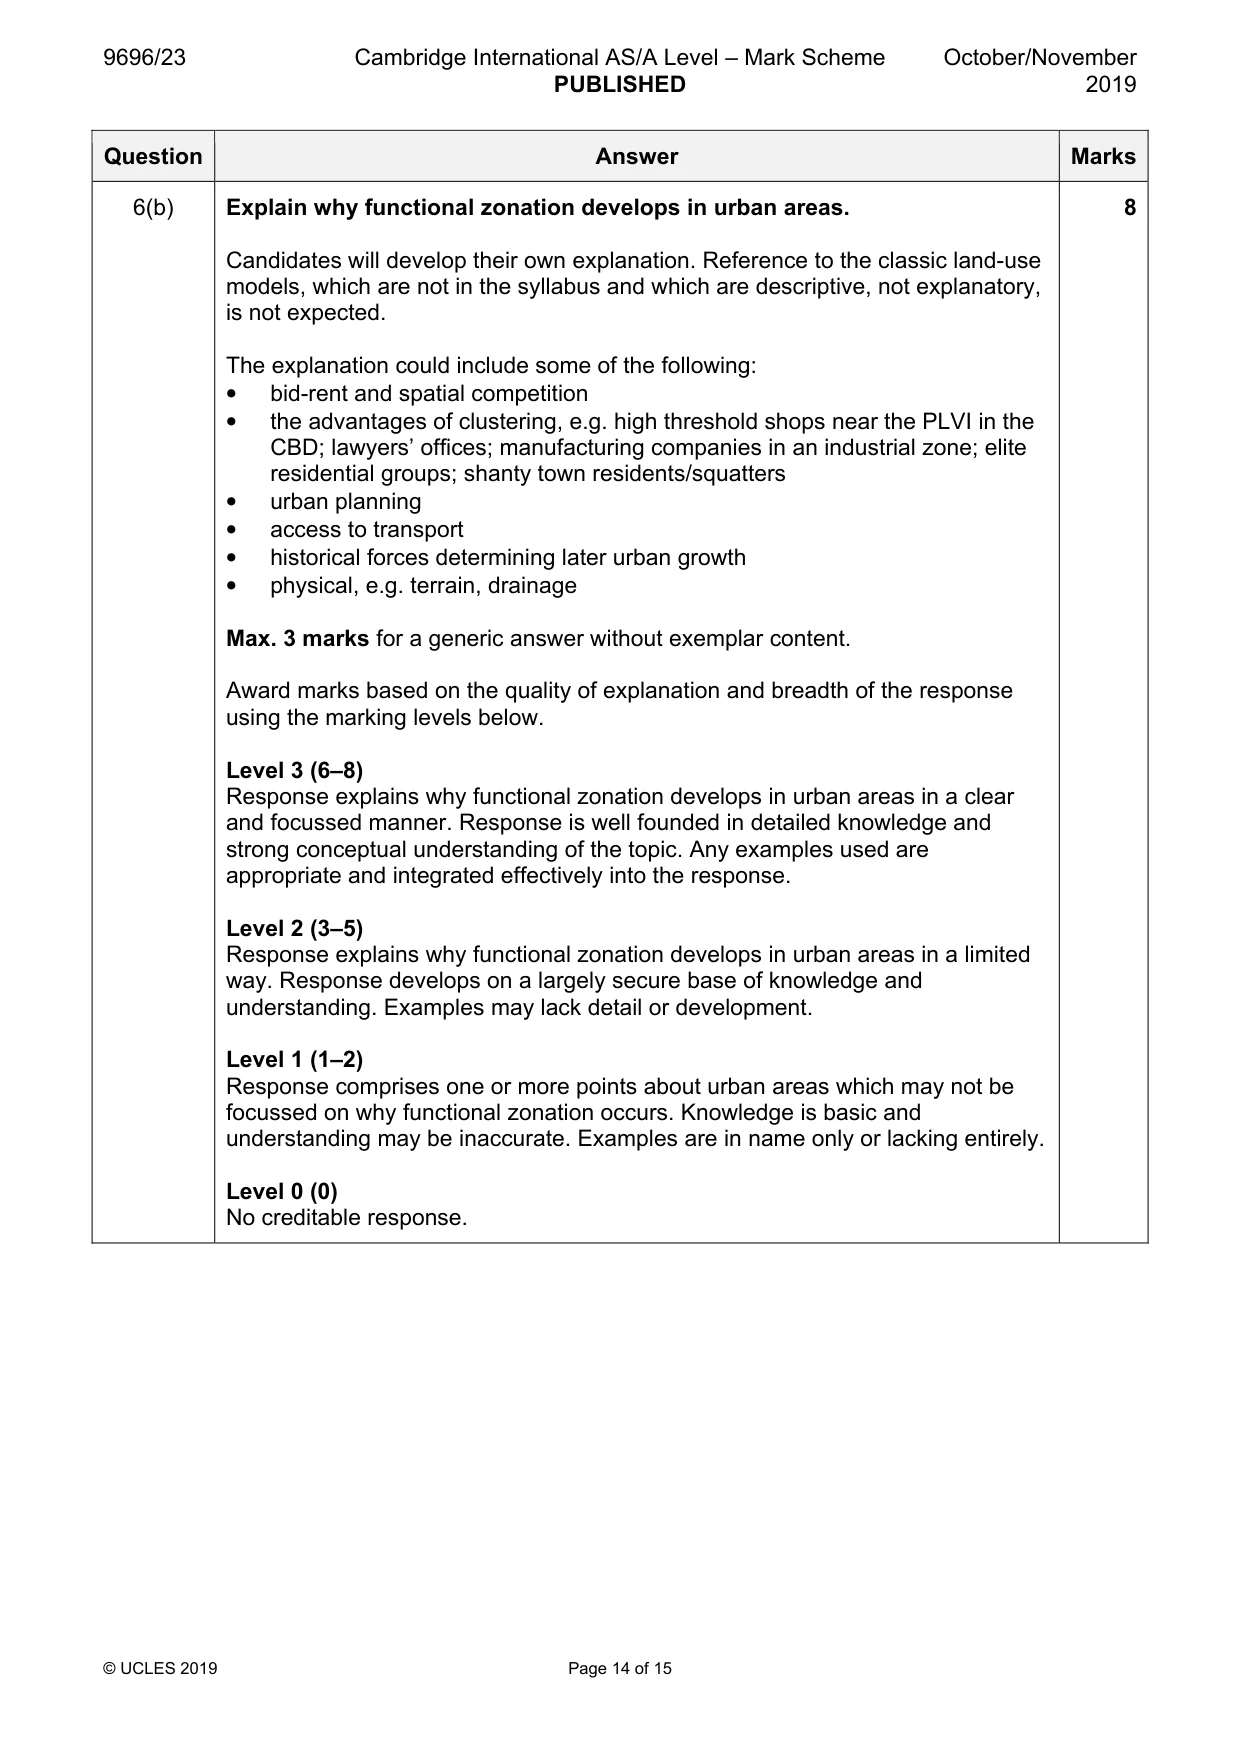
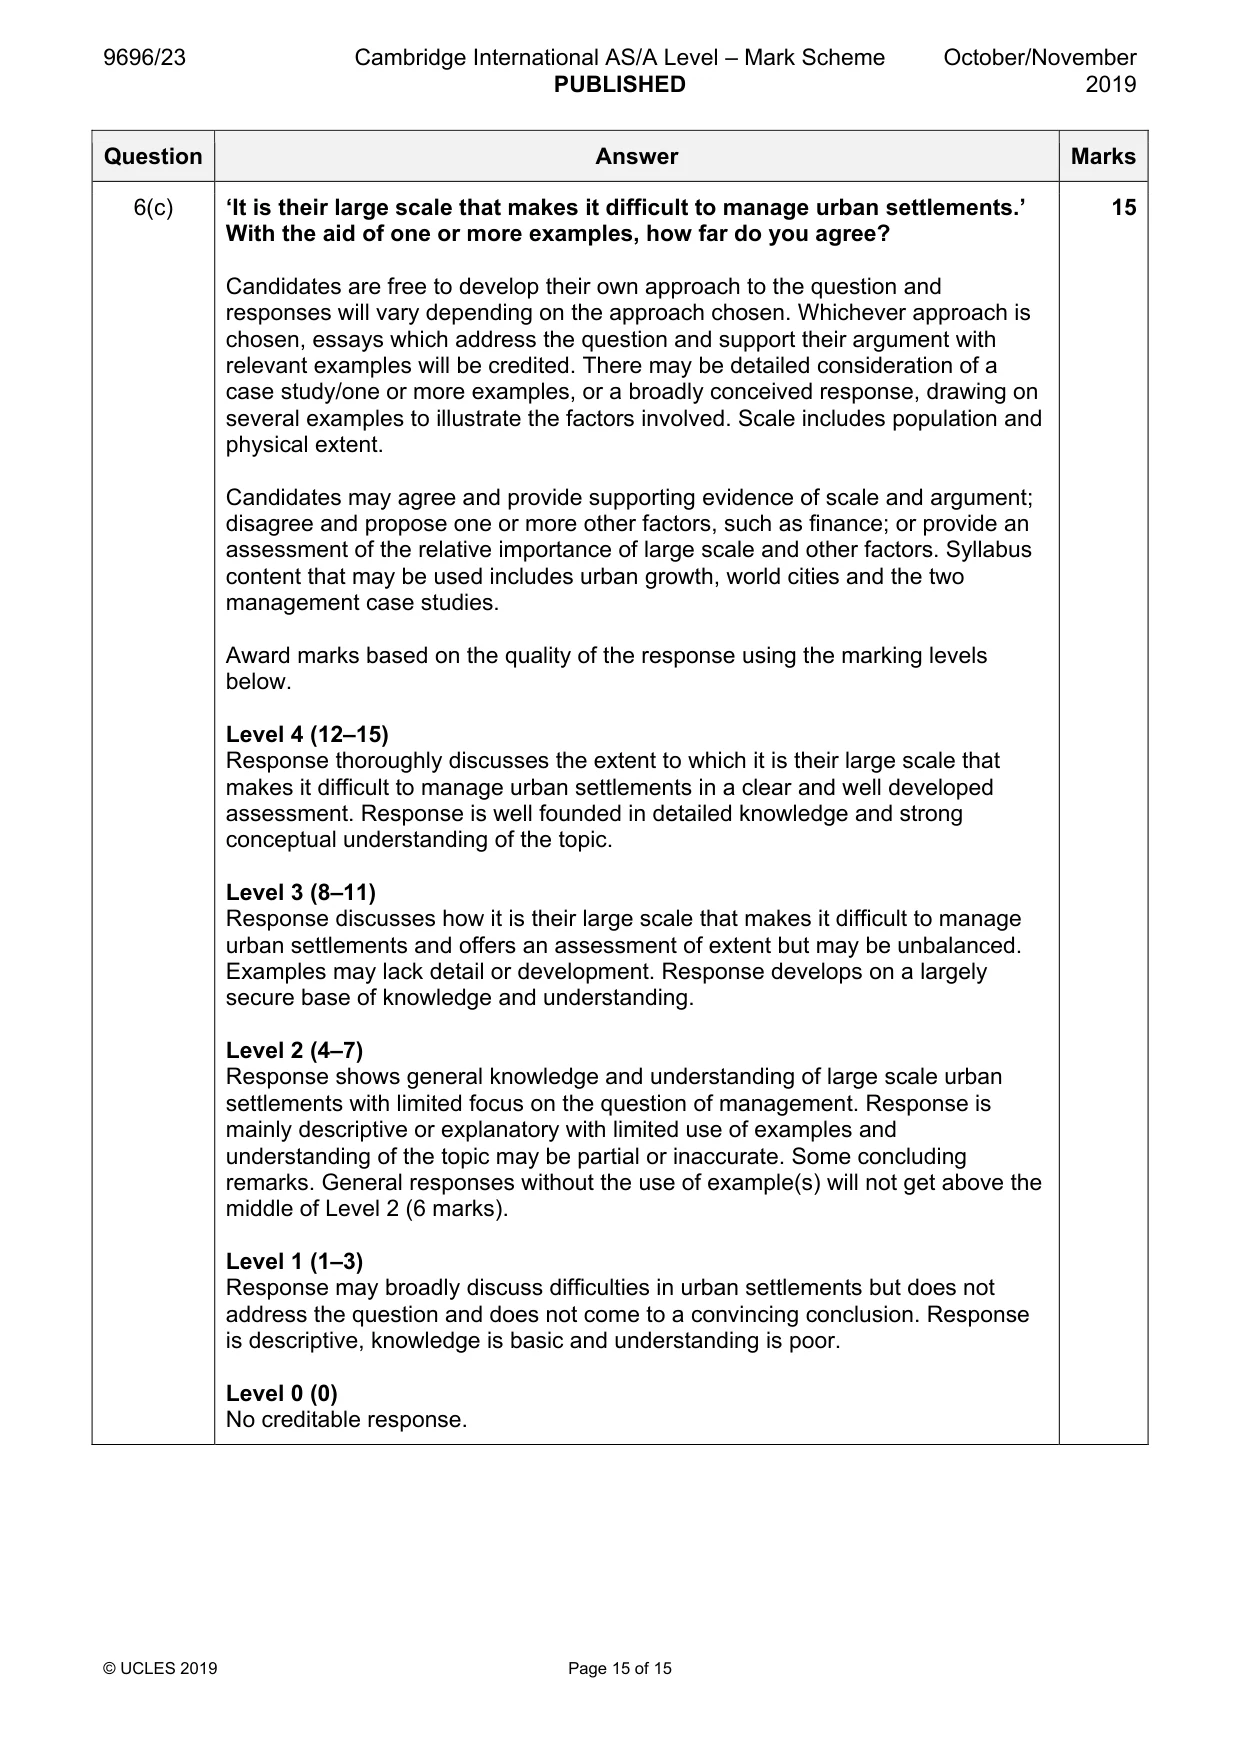
Mark scheme: 6(a)(i) With the aid of an example, give the meaning of the term re‑urbanisation. 3 The movement/migration of residents/population/people (1). Back into, or towards the centres of, cities (centripetal/inwards) (1). The example may be actual, e.g. from the Marne valley into Paris, from a Cheshire village into Salford Quays, Manchester; or generic, e.g. from a commuter village to a new development of loft apartments near the CBD (1). 6(a)(ii) Explain two reasons why re-urbanisation occurs. 4 Reasons may include: • avoiding time taken and cost of commuting/to be nearer work • access to vibrant life of inner urban area, e.g. bars, restaurants, culture, entertainment • access to good transport, e.g. rail, bus, tram, metro • attractive modern housing developments in inner urban area • loss of rural idyll or idealism about village life • life cycle, e.g. single professionals, after raising children Credit two relevant reasons: a simple reason 1 mark and a developed reason, with detail, depth or the use of an example, 2 marks to the maximum. For a response about the inward movement or relocation of activities rather than residential population, generic credit, max. 2. 6(b) Explain why functional zonation develops in urban areas. 8 Candidates will develop their own explanation. Reference to the classic land-use models, which are not in the syllabus and which are descriptive, not explanatory, is not expected. The explanation could include some of the following: • bid-rent and spatial competition • the advantages of clustering, e.g. high threshold shops near the PLVI in the CBD; lawyers’ offices; manufacturing companies in an industrial zone; elite residential groups; shanty town residents/squatters • urban planning • access to transport • historical forces determining later urban growth • physical, e.g. terrain, drainage Max. 3 marks for a generic answer without exemplar content. Award marks based on the quality of explanation and breadth of the response using the marking levels below. Level 3 (6–8) Response explains why functional zonation develops in urban areas in a clear and focussed manner. Response is well founded in detailed knowledge and strong conceptual understanding of the topic. Any examples used are appropriate and integrated effectively into the response. Level 2 (3–5) Response explains why functional zonation develops in urban areas in a limited way. Response develops on a largely secure base of knowledge and understanding. Examples may lack detail or development. Level 1 (1–2) Response comprises one or more points about urban areas which may not be focussed on why functional zonation occurs. Knowledge is basic and understanding may be inaccurate. Examples are in name only or lacking entirely. Level 0 (0) No creditable response. 6(c) ‘It is their large scale that makes it difficult to manage urban settlements.’ 15 With the aid of one or more examples, how far do you agree? Candidates are free to develop their own approach to the question and responses will vary depending on the approach chosen. Whichever approach is chosen, essays which address the question and support their argument with relevant examples will be credited. There may be detailed consideration of a case study/one or more examples, or a broadly conceived response, drawing on several examples to illustrate the factors involved. Scale includes population and physical extent. Candidates may agree and provide supporting evidence of scale and argument; disagree and propose one or more other factors, such as finance; or provide an assessment of the relative importance of large scale and other factors. Syllabus content that may be used includes urban growth, world cities and the two management case studies. Award marks based on the quality of the response using the marking levels below. Level 4 (12–15) Response thoroughly discusses the extent to which it is their large scale that makes it difficult to manage urban settlements in a clear and well developed assessment. Response is well founded in detailed knowledge and strong conceptual understanding of the topic. Level 3 (8–11) Response discusses how it is their large scale that makes it difficult to manage urban settlements and offers an assessment of extent but may be unbalanced. Examples may lack detail or development. Response develops on a largely secure base of knowledge and understanding. Level 2 (4–7) Response shows general knowledge and understanding of large scale urban settlements with limited focus on the question of management. Response is mainly descriptive or explanatory with limited use of examples and understanding of the topic may be partial or inaccurate. Some concluding remarks. General responses without the use of example(s) will not get above the middle of Level 2 (6 marks). Level 1 (1–3) Response may broadly discuss difficulties in urban settlements but does not address the question and does not come to a convincing conclusion. Response is descriptive, knowledge is basic and understanding is poor. Level 0 (0) No creditable response.
What was in this paper
The subtopics covered by these 6 questions, and how many questions each got. Open one in a new tab to see every Cambridge question on it.
What you needed in this session
Cambridge’s own grade thresholds for 2019 Oct/Nov, Paper 2 · Variant 3. A higher threshold means an easier paper — the bar moves with how the cohort did.