Cambridge A Level Geography 9696 — 2019 May/June Paper 2 · Variant 1
9696/21/M/J/19 · 6 questions · 60 marks · ≈68 min
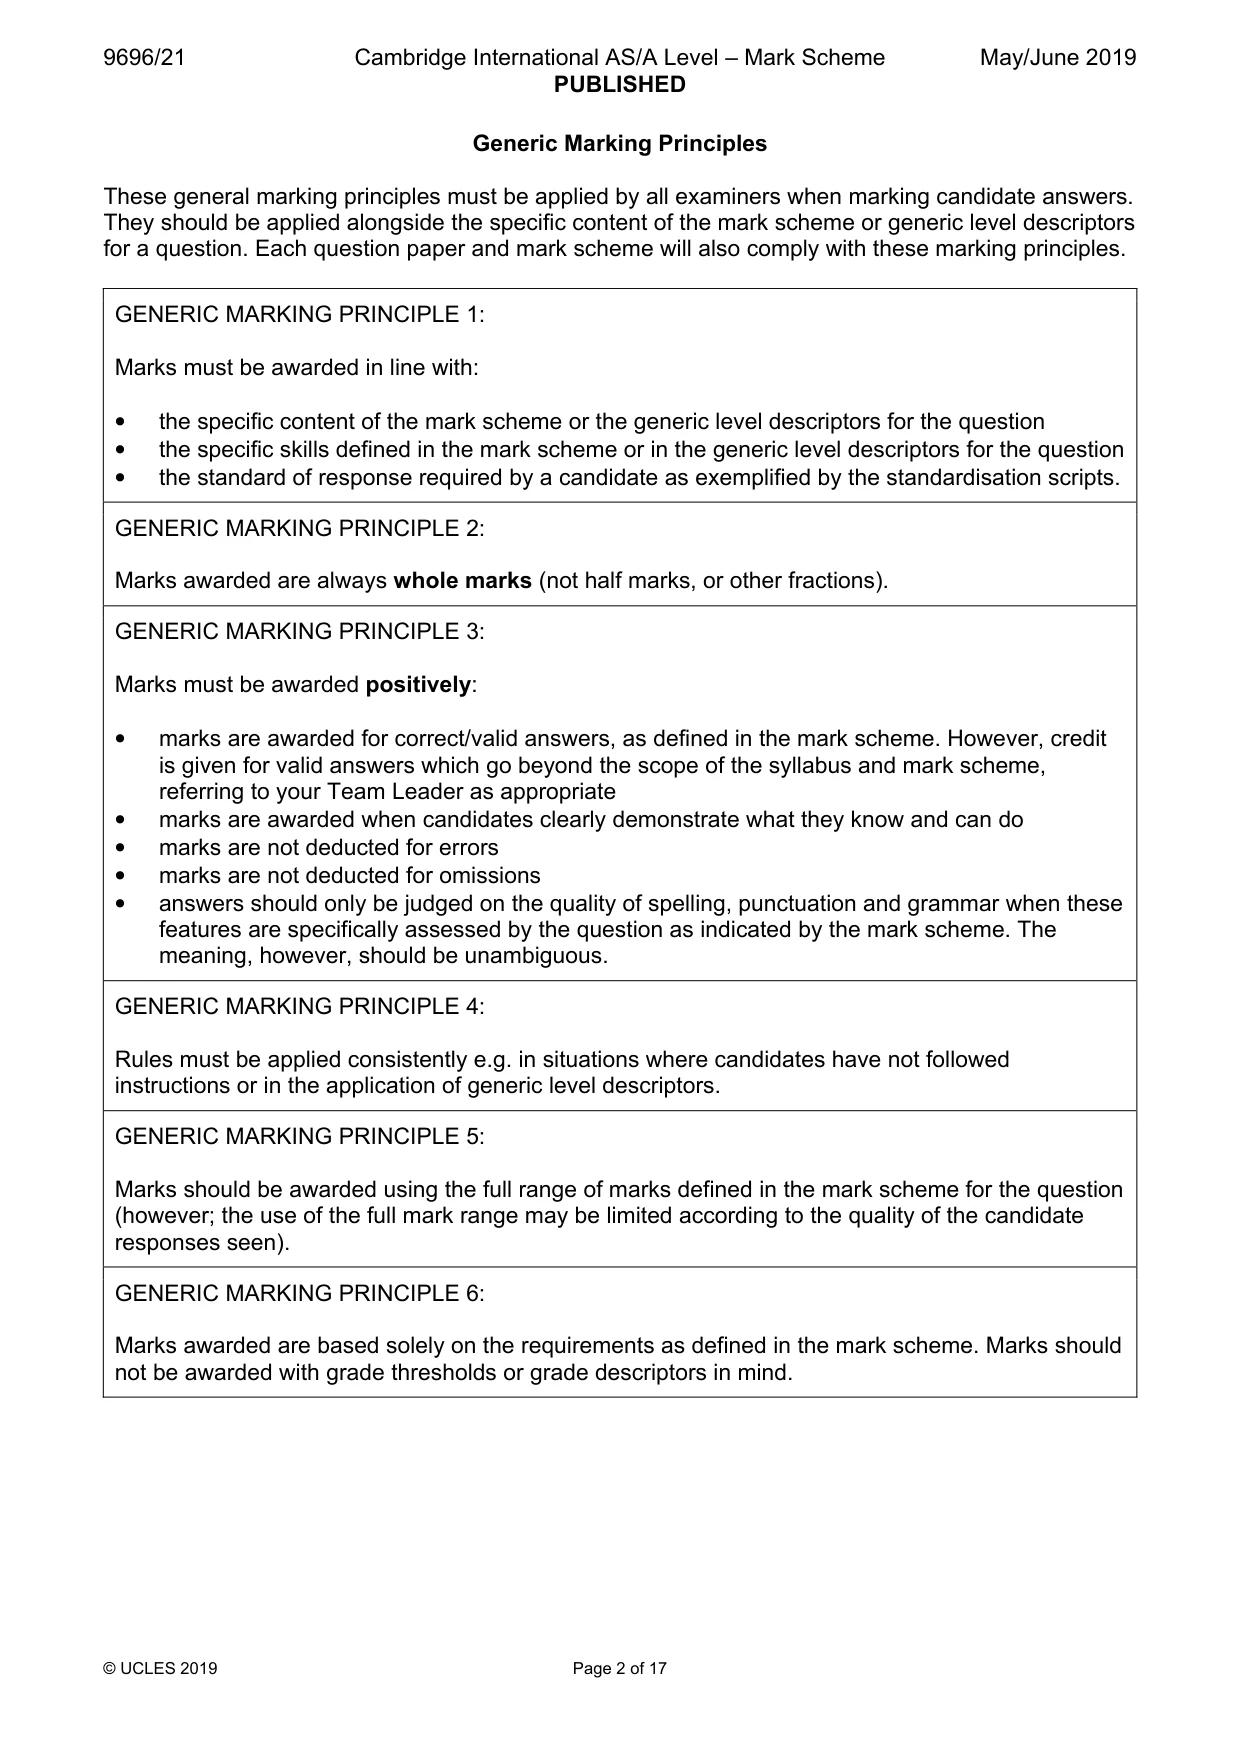
The question paper and its mark scheme, free to read here and free to download. This is Cambridge’s own paper, exactly as it was sat.
Question paper4 pages

Mark scheme17 pages
Answers below. Sit the paper first if you are practising.
Questions as text
Q1 · Average calorie consumption per person per day (kcals) for South America, 2006–10
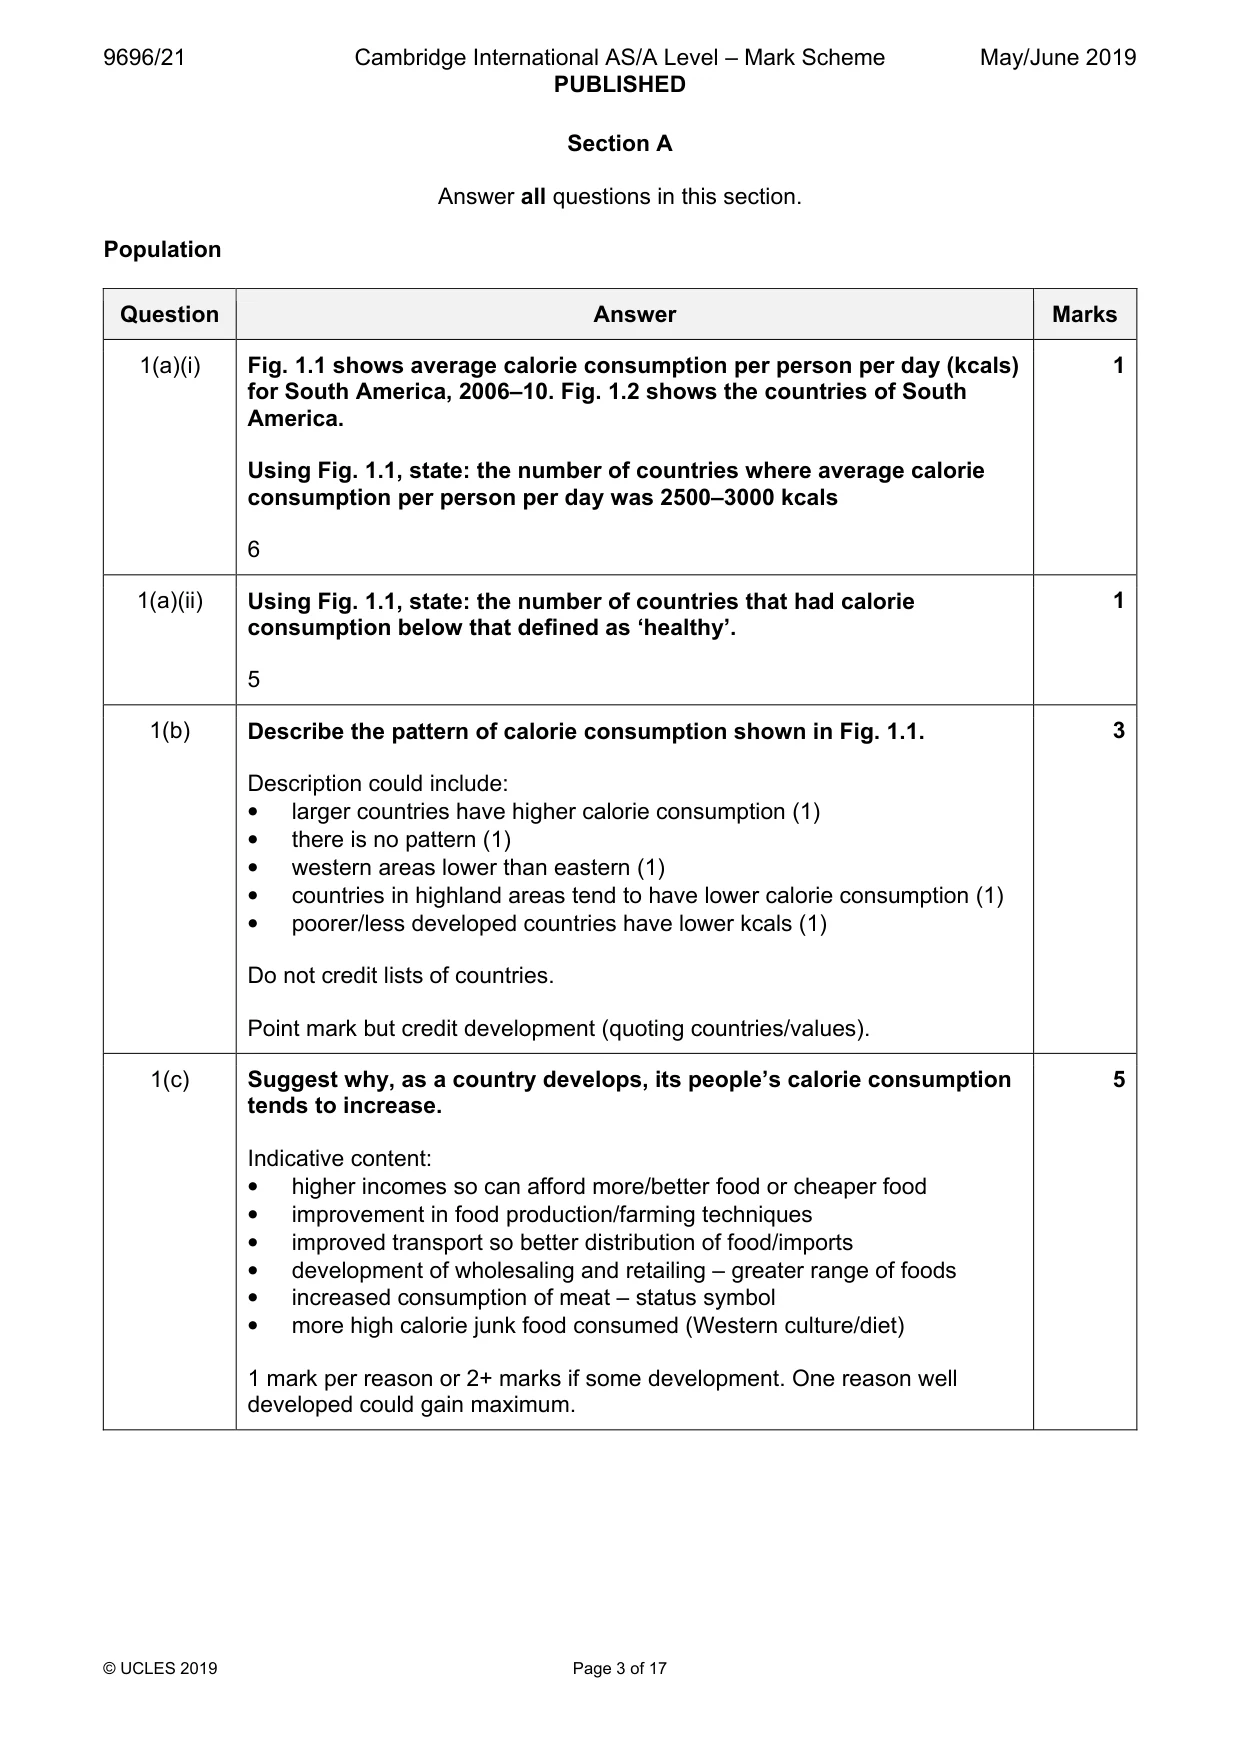
1 Fig. 1.1 shows average calorie consumption per person per day (kcals) for South America, 2006–10. Fig. 1.2 shows the countries of South America. (a) Using Fig. 1.1, state: (i) the number of countries where average calorie consumption per person per day was 2500–3000 kcals [1] (ii) the number of countries that had calorie consumption below that defined as ‘healthy’. [1] (b) Describe the pattern of calorie consumption shown in Fig. 1.1. [3] (c) Suggest why, as a country develops, its people’s calorie consumption tends to increase. [5] [Total: 10] Population/Migration/Settlement dynamics
Mark scheme: Question Answer Marks 1(a)(i) Fig. 1.1 shows average calorie consumption per person per day (kcals) 1 for South America, 2006–10. Fig. 1.2 shows the countries of South America. Using Fig. 1.1, state: the number of countries where average calorie consumption per person per day was 2500–3000 kcals 6 1(a)(ii) Using Fig. 1.1, state: the number of countries that had calorie 1 consumption below that defined as ‘healthy’. 5 1(b) Describe the pattern of calorie consumption shown in Fig. 1.1. 3 Description could include: • larger countries have higher calorie consumption (1) • there is no pattern (1) • western areas lower than eastern (1) • countries in highland areas tend to have lower calorie consumption (1) • poorer/less developed countries have lower kcals (1) Do not credit lists of countries. Point mark but credit development (quoting countries/values). 1(c) Suggest why, as a country develops, its people’s calorie consumption 5 tends to increase. Indicative content: • higher incomes so can afford more/better food or cheaper food • improvement in food production/farming techniques • improved transport so better distribution of food/imports • development of wholesaling and retailing – greater range of foods • increased consumption of meat – status symbol • more high calorie junk food consumed (Western culture/diet) 1 mark per reason or 2+ marks if some development. One reason well developed could gain maximum. Population/Migration/Settlement dynamics
Q2 · The simplified age/sex structure of a rural area in an HIC in 1975 and 2015
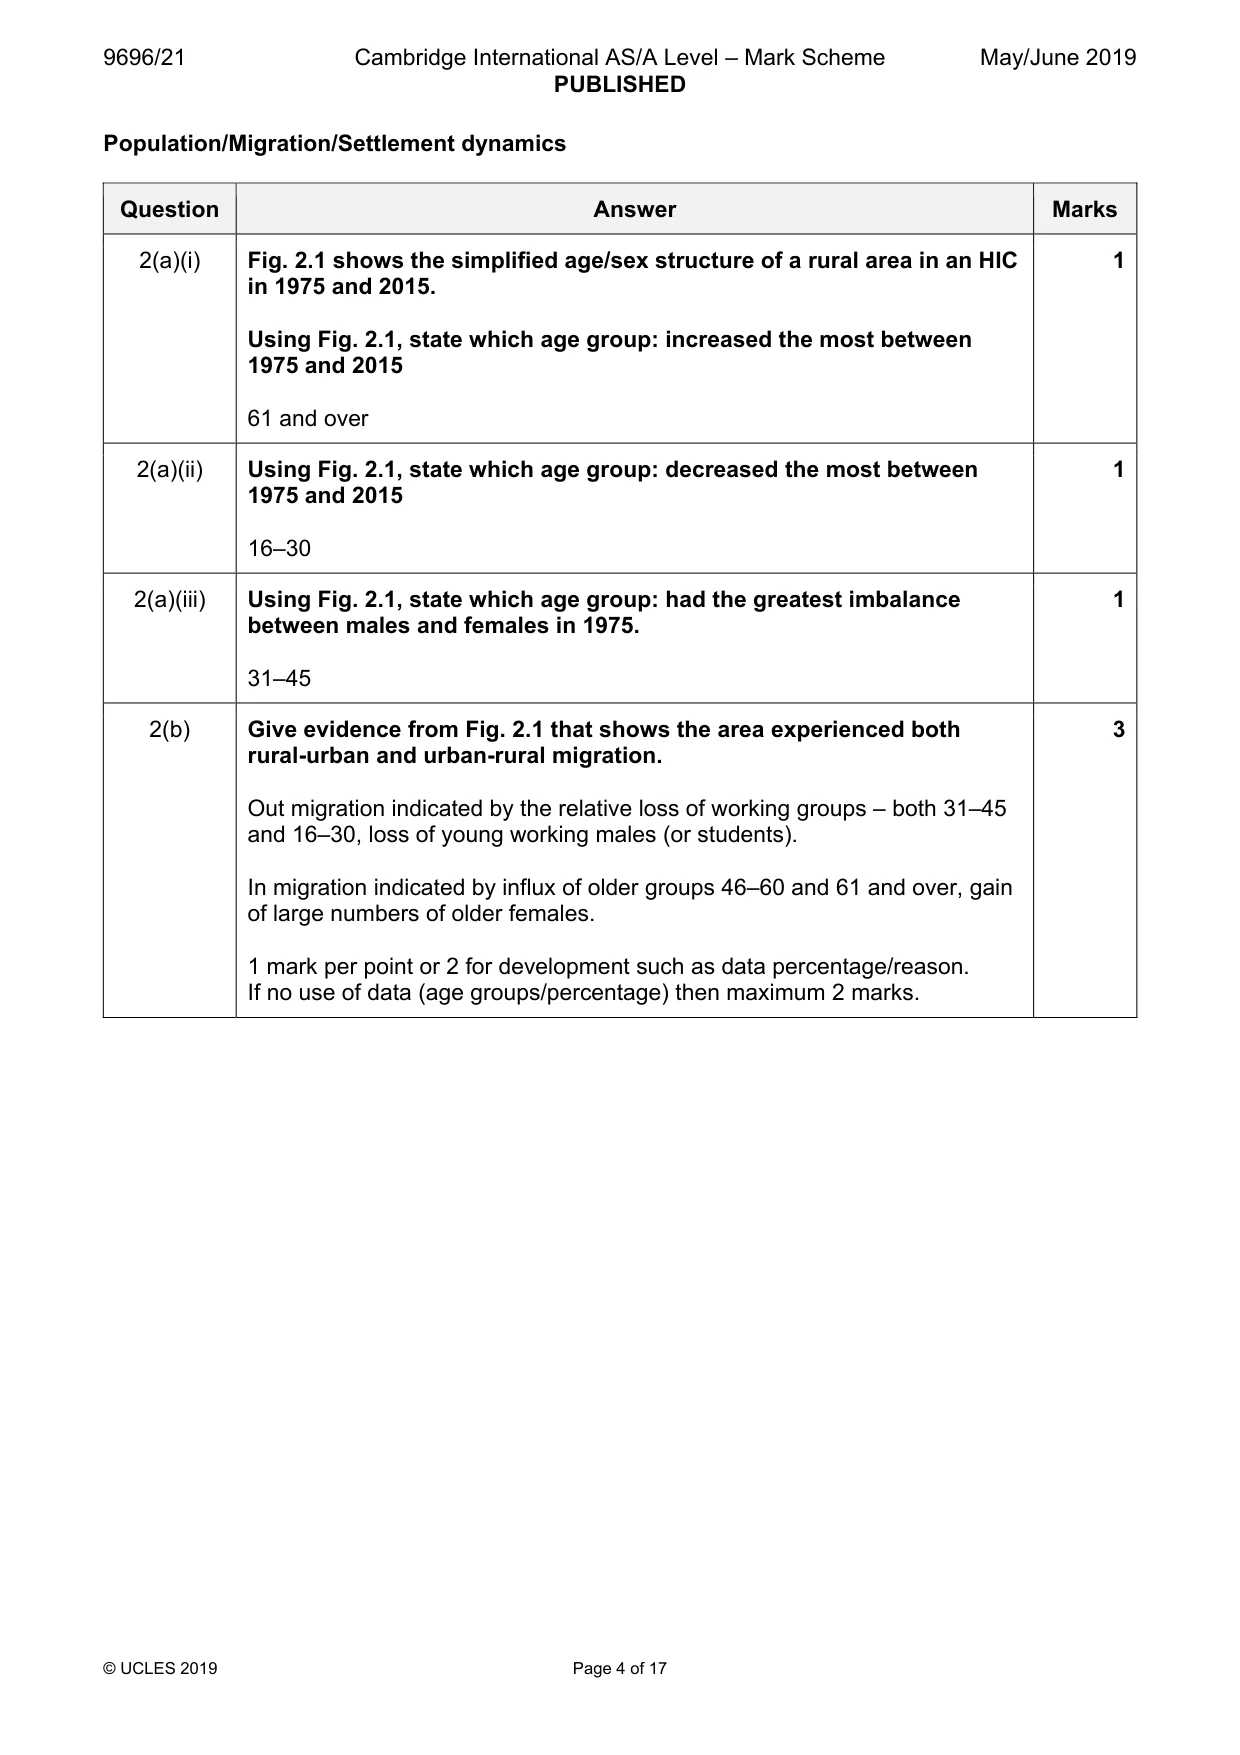
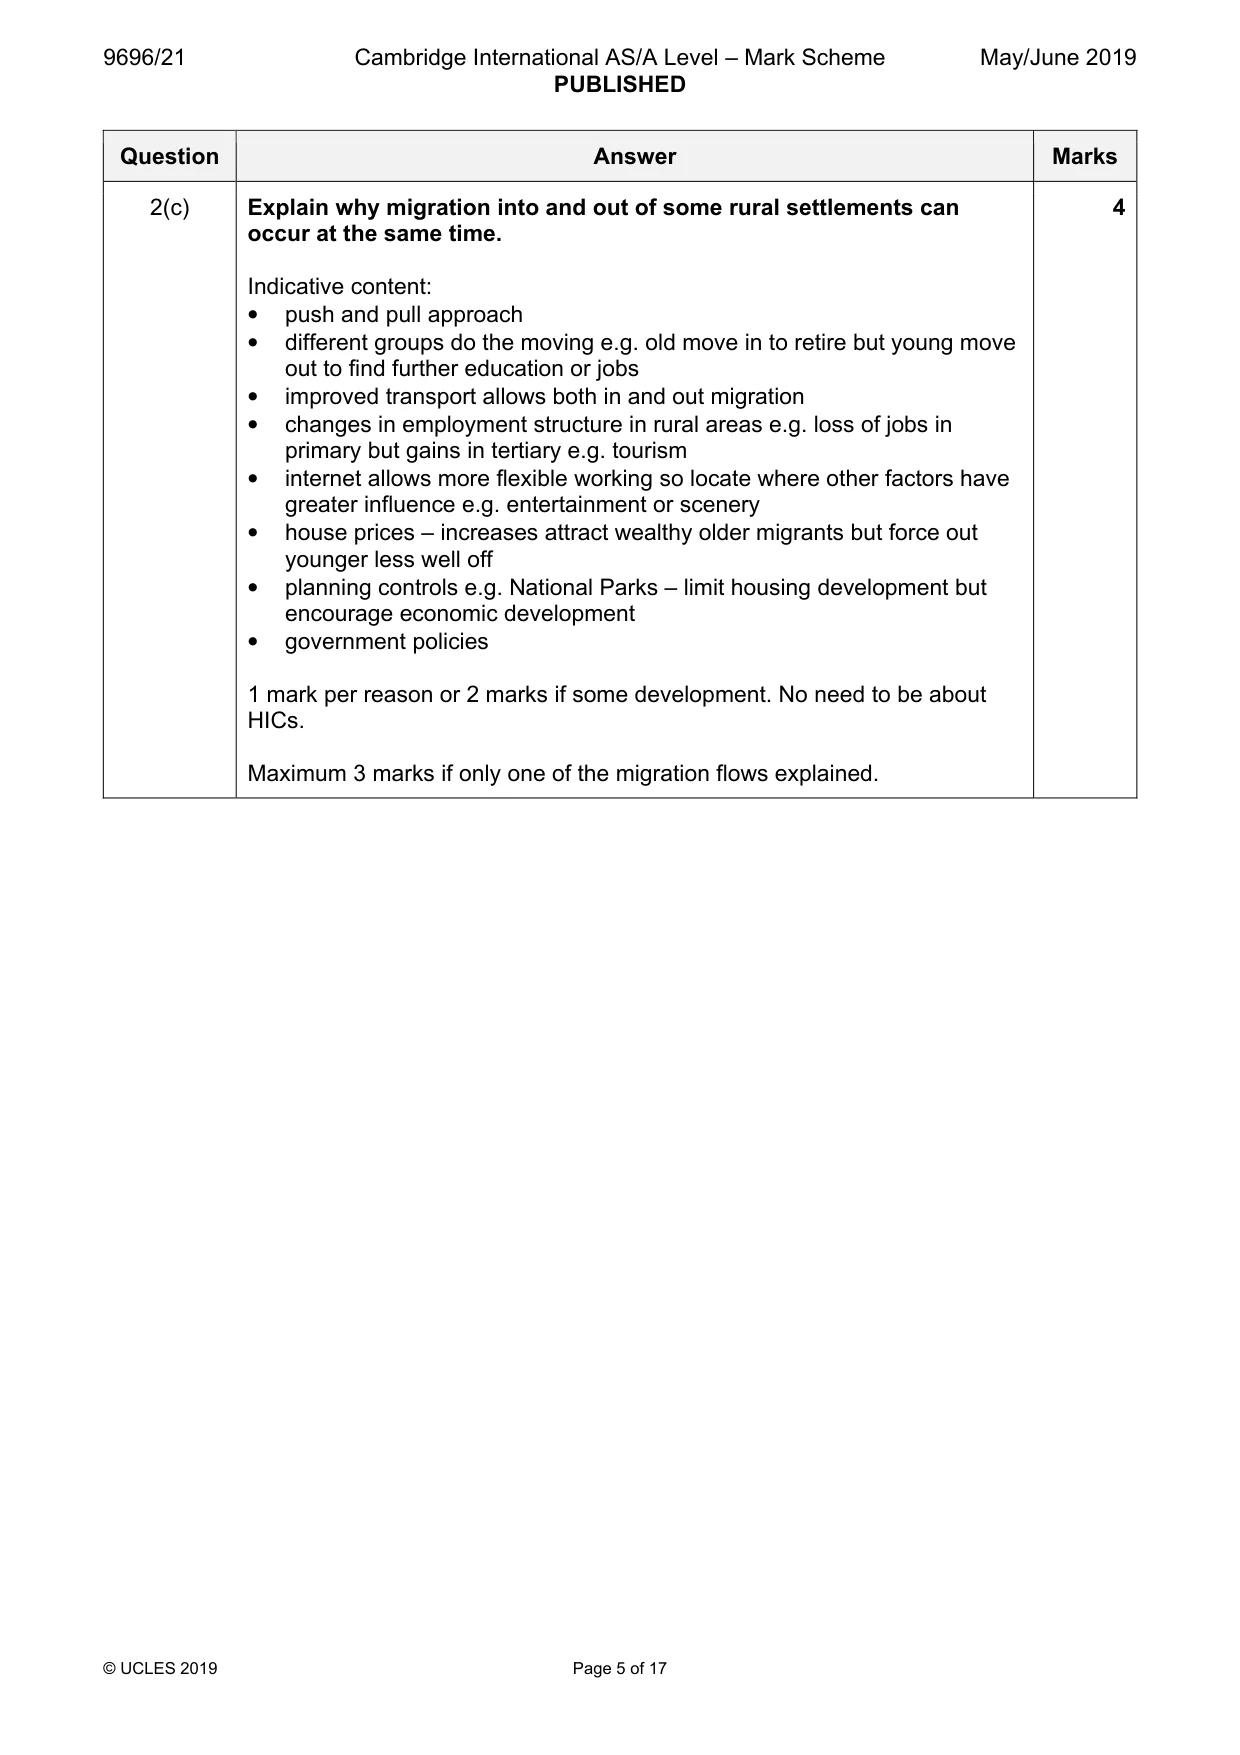
2 Fig. 2.1 shows the simplified age/sex structure of a rural area in an HIC in 1975 and 2015. (a) Using Fig. 2.1, state which age group: (i) increased the most between 1975 and 2015 [1] (ii) decreased the most between 1975 and 2015 [1] (iii) had the greatest imbalance between males and females in 1975. [1] (b) Give evidence from Fig. 2.1 that shows the area experienced both rural-urban and urban-rural migration. [3] (c) Explain why migration into and out of some rural settlements can occur at the same time. [4] [Total: 10] Settlement dynamics
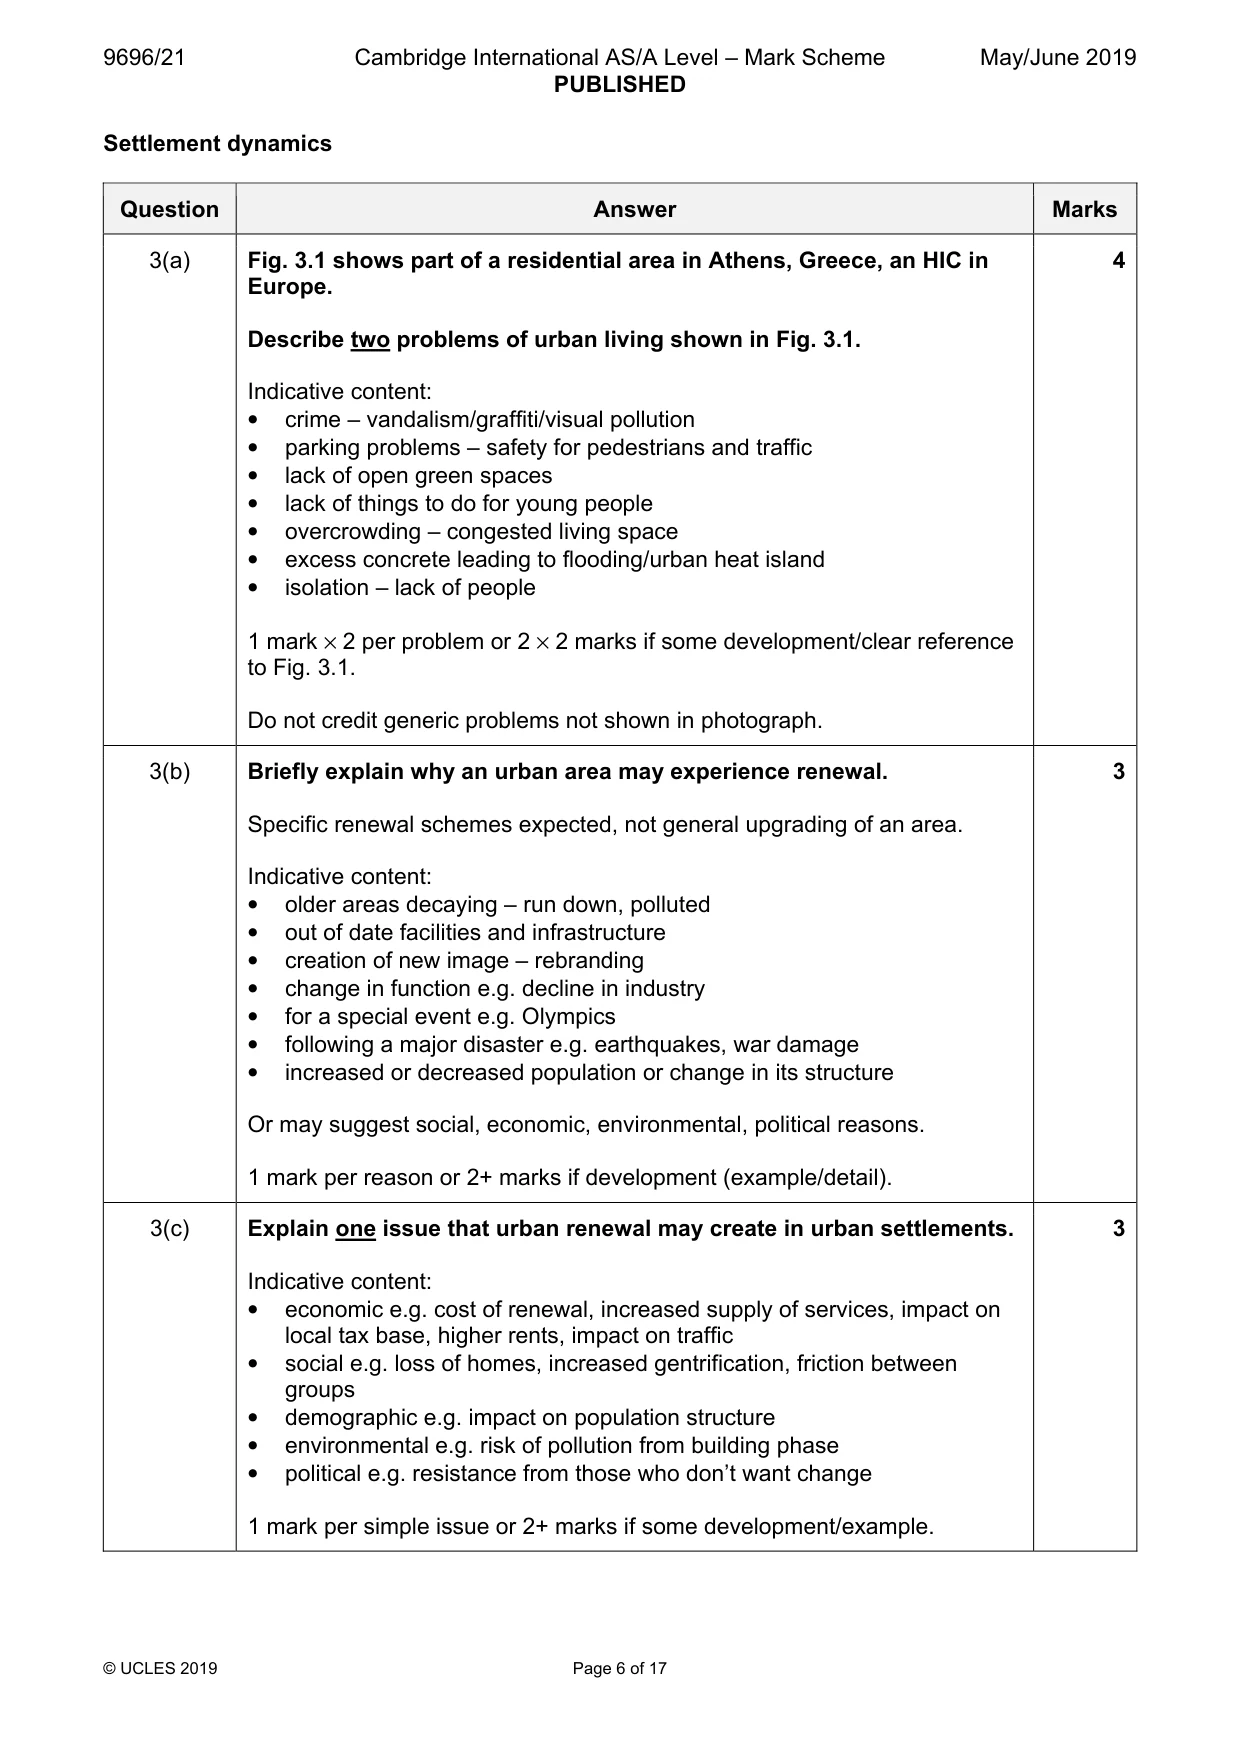
Mark scheme: 2(a)(i) Fig. 2.1 shows the simplified age/sex structure of a rural area in an HIC 1 in 1975 and 2015. Using Fig. 2.1, state which age group: increased the most between 1975 and 2015 61 and over 2(a)(ii) Using Fig. 2.1, state which age group: decreased the most between 1 1975 and 2015 16–30 2(a)(iii) Using Fig. 2.1, state which age group: had the greatest imbalance 1 between males and females in 1975. 31–45 2(b) Give evidence from Fig. 2.1 that shows the area experienced both 3 rural-urban and urban-rural migration. Out migration indicated by the relative loss of working groups – both 31–45 and 16–30, loss of young working males (or students). In migration indicated by influx of older groups 46–60 and 61 and over, gain of large numbers of older females. 1 mark per point or 2 for development such as data percentage/reason. If no use of data (age groups/percentage) then maximum 2 marks. 2(c) Explain why migration into and out of some rural settlements can 4 occur at the same time. Indicative content: • push and pull approach • different groups do the moving e.g. old move in to retire but young move out to find further education or jobs • improved transport allows both in and out migration • changes in employment structure in rural areas e.g. loss of jobs in primary but gains in tertiary e.g. tourism • internet allows more flexible working so locate where other factors have greater influence e.g. entertainment or scenery • house prices – increases attract wealthy older migrants but force out younger less well off • planning controls e.g. National Parks – limit housing development but encourage economic development • government policies 1 mark per reason or 2 marks if some development. No need to be about HICs. Maximum 3 marks if only one of the migration flows explained. Settlement dynamics
Q3 · Part of a residential area in Athens, Greece, an HIC in Europe
3 Fig. 3.1 shows part of a residential area in Athens, Greece, an HIC in Europe. (a) Describe two problems of urban living shown in Fig. 3.1. [4] (b) Briefly explain why an urban area may experience renewal. [3] (c) Explain one issue that urban renewal may create in urban settlements. [3] [Total: 10]
Mark scheme: 3(a) Fig. 3.1 shows part of a residential area in Athens, Greece, an HIC in 4 Europe. Describe two problems of urban living shown in Fig. 3.1. Indicative content: • crime – vandalism/graffiti/visual pollution • parking problems – safety for pedestrians and traffic • lack of open green spaces • lack of things to do for young people • overcrowding – congested living space • excess concrete leading to flooding/urban heat island • isolation – lack of people 1 mark × 2 per problem or 2 × 2 marks if some development/clear reference to Fig. 3.1. Do not credit generic problems not shown in photograph. 3(b) Briefly explain why an urban area may experience renewal. 3 Specific renewal schemes expected, not general upgrading of an area. Indicative content: • older areas decaying – run down, polluted • out of date facilities and infrastructure • creation of new image – rebranding • change in function e.g. decline in industry • for a special event e.g. Olympics • following a major disaster e.g. earthquakes, war damage • increased or decreased population or change in its structure Or may suggest social, economic, environmental, political reasons. 1 mark per reason or 2+ marks if development (example/detail). 3(c) Explain one issue that urban renewal may create in urban settlements. 3 Indicative content: • economic e.g. cost of renewal, increased supply of services, impact on local tax base, higher rents, impact on traffic • social e.g. loss of homes, increased gentrification, friction between groups • demographic e.g. impact on population structure • environmental e.g. risk of pollution from building phase • political e.g. resistance from those who don’t want change 1 mark per simple issue or 2+ marks if some development/example. Section B Answer one question from this section. Population
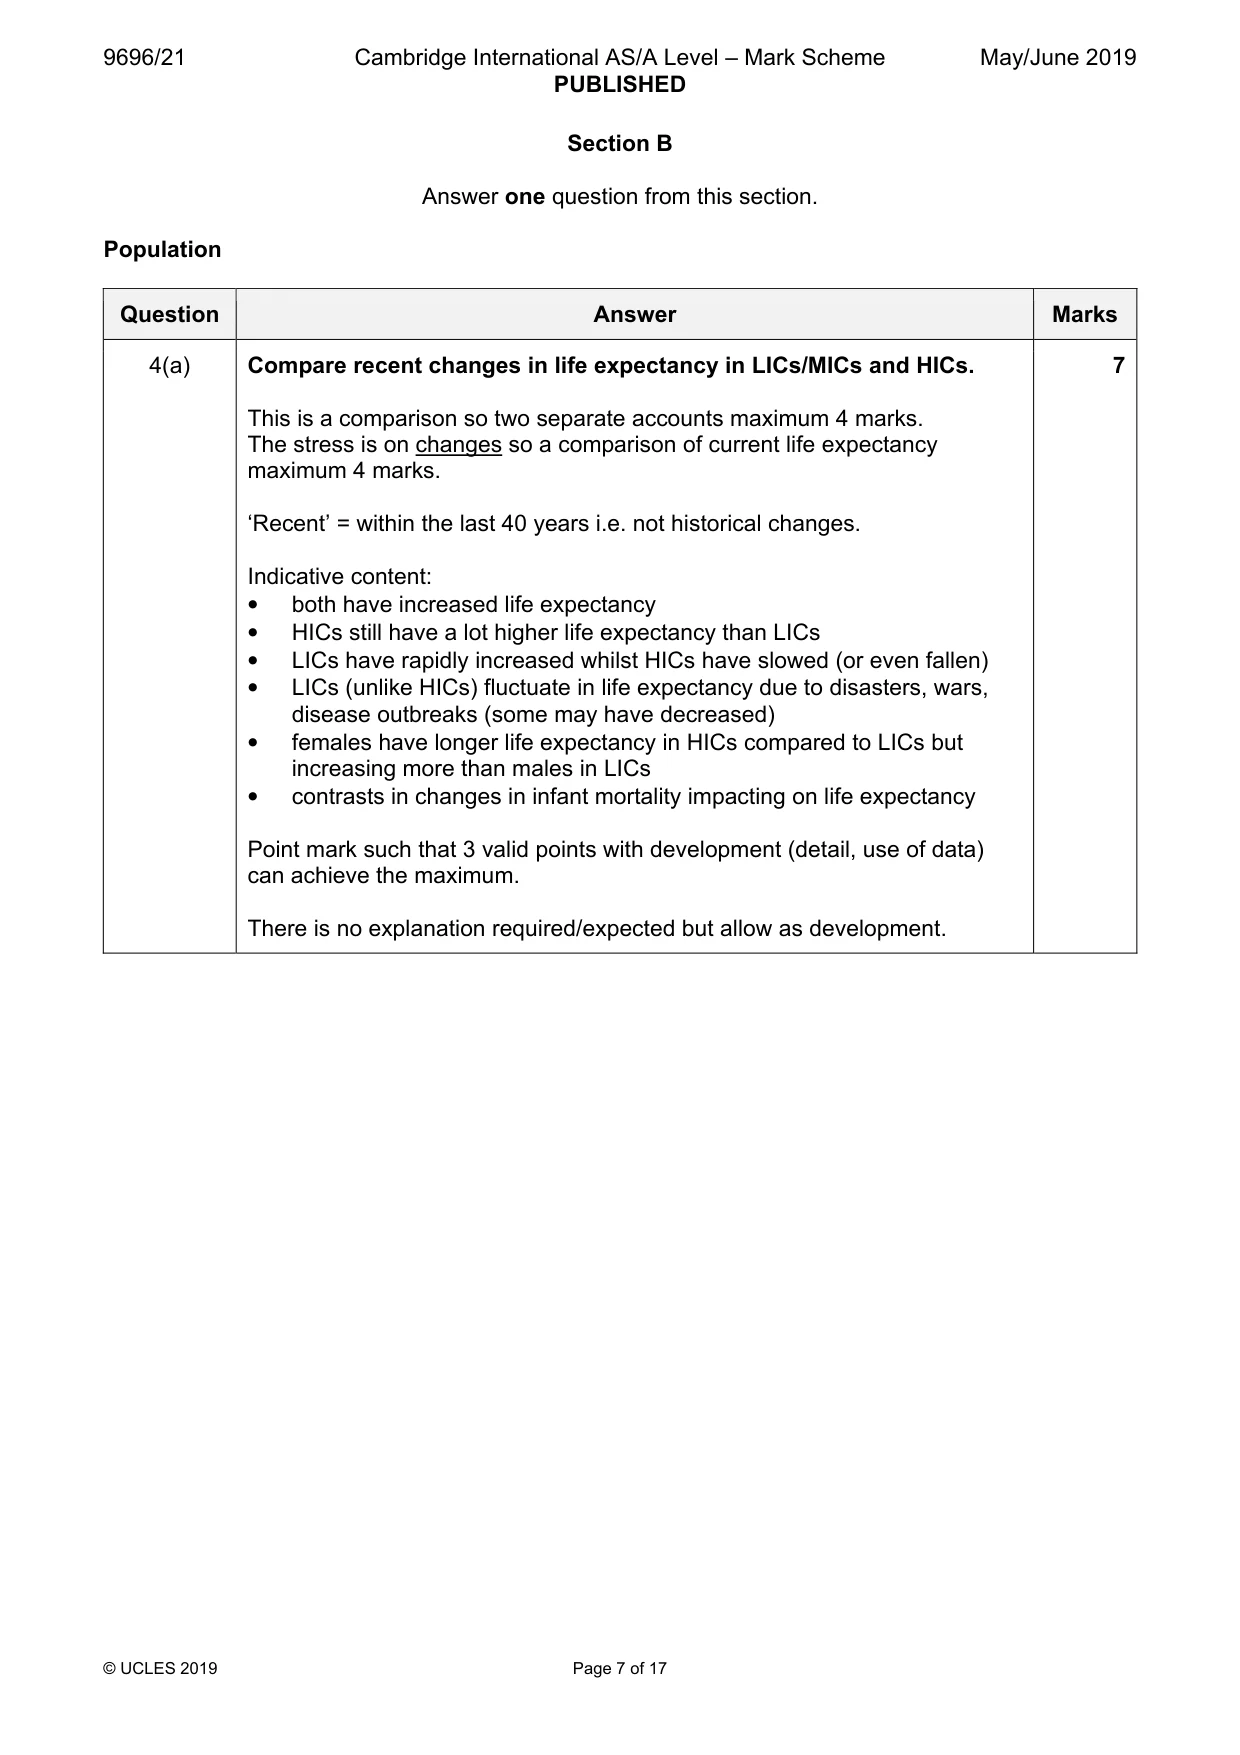
Q4 · Compare recent changes in life expectancy in LICs/MICs and HICs
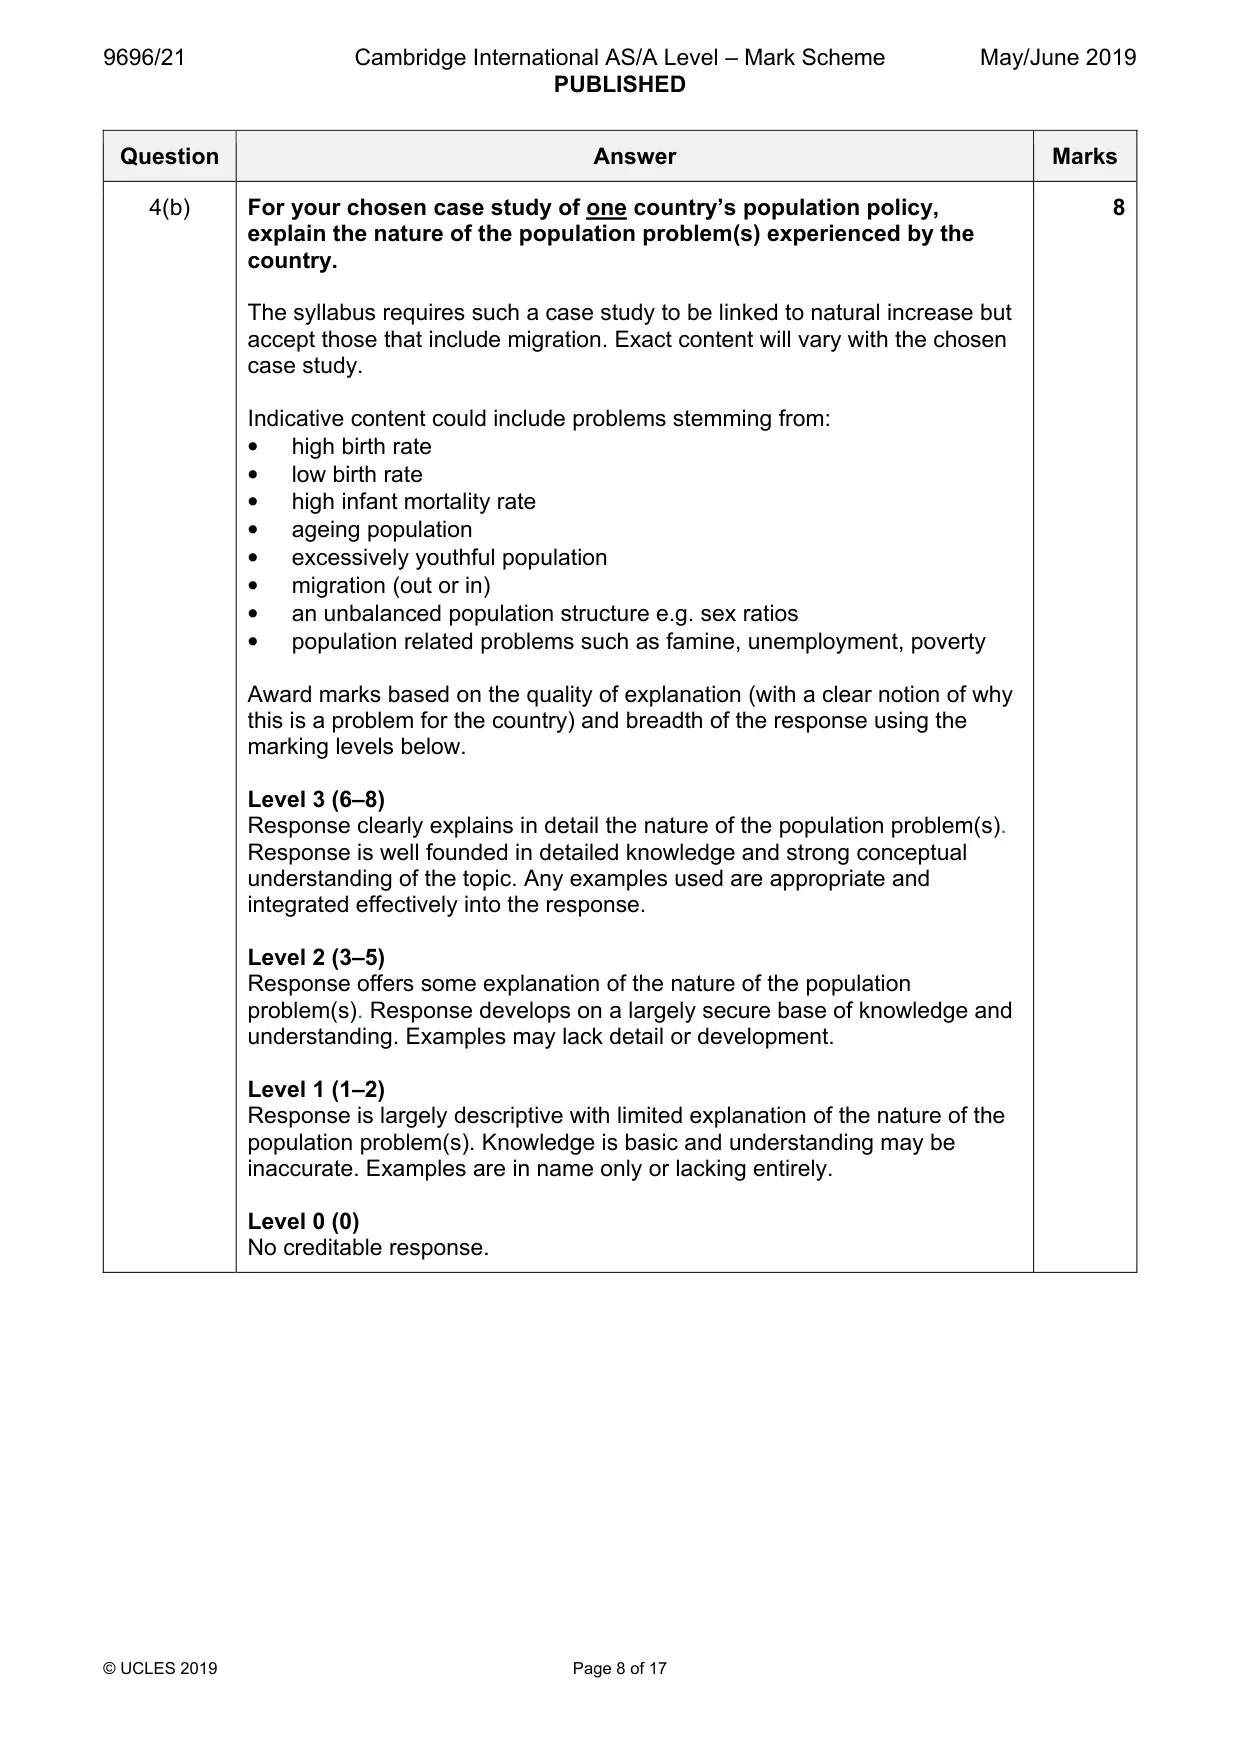
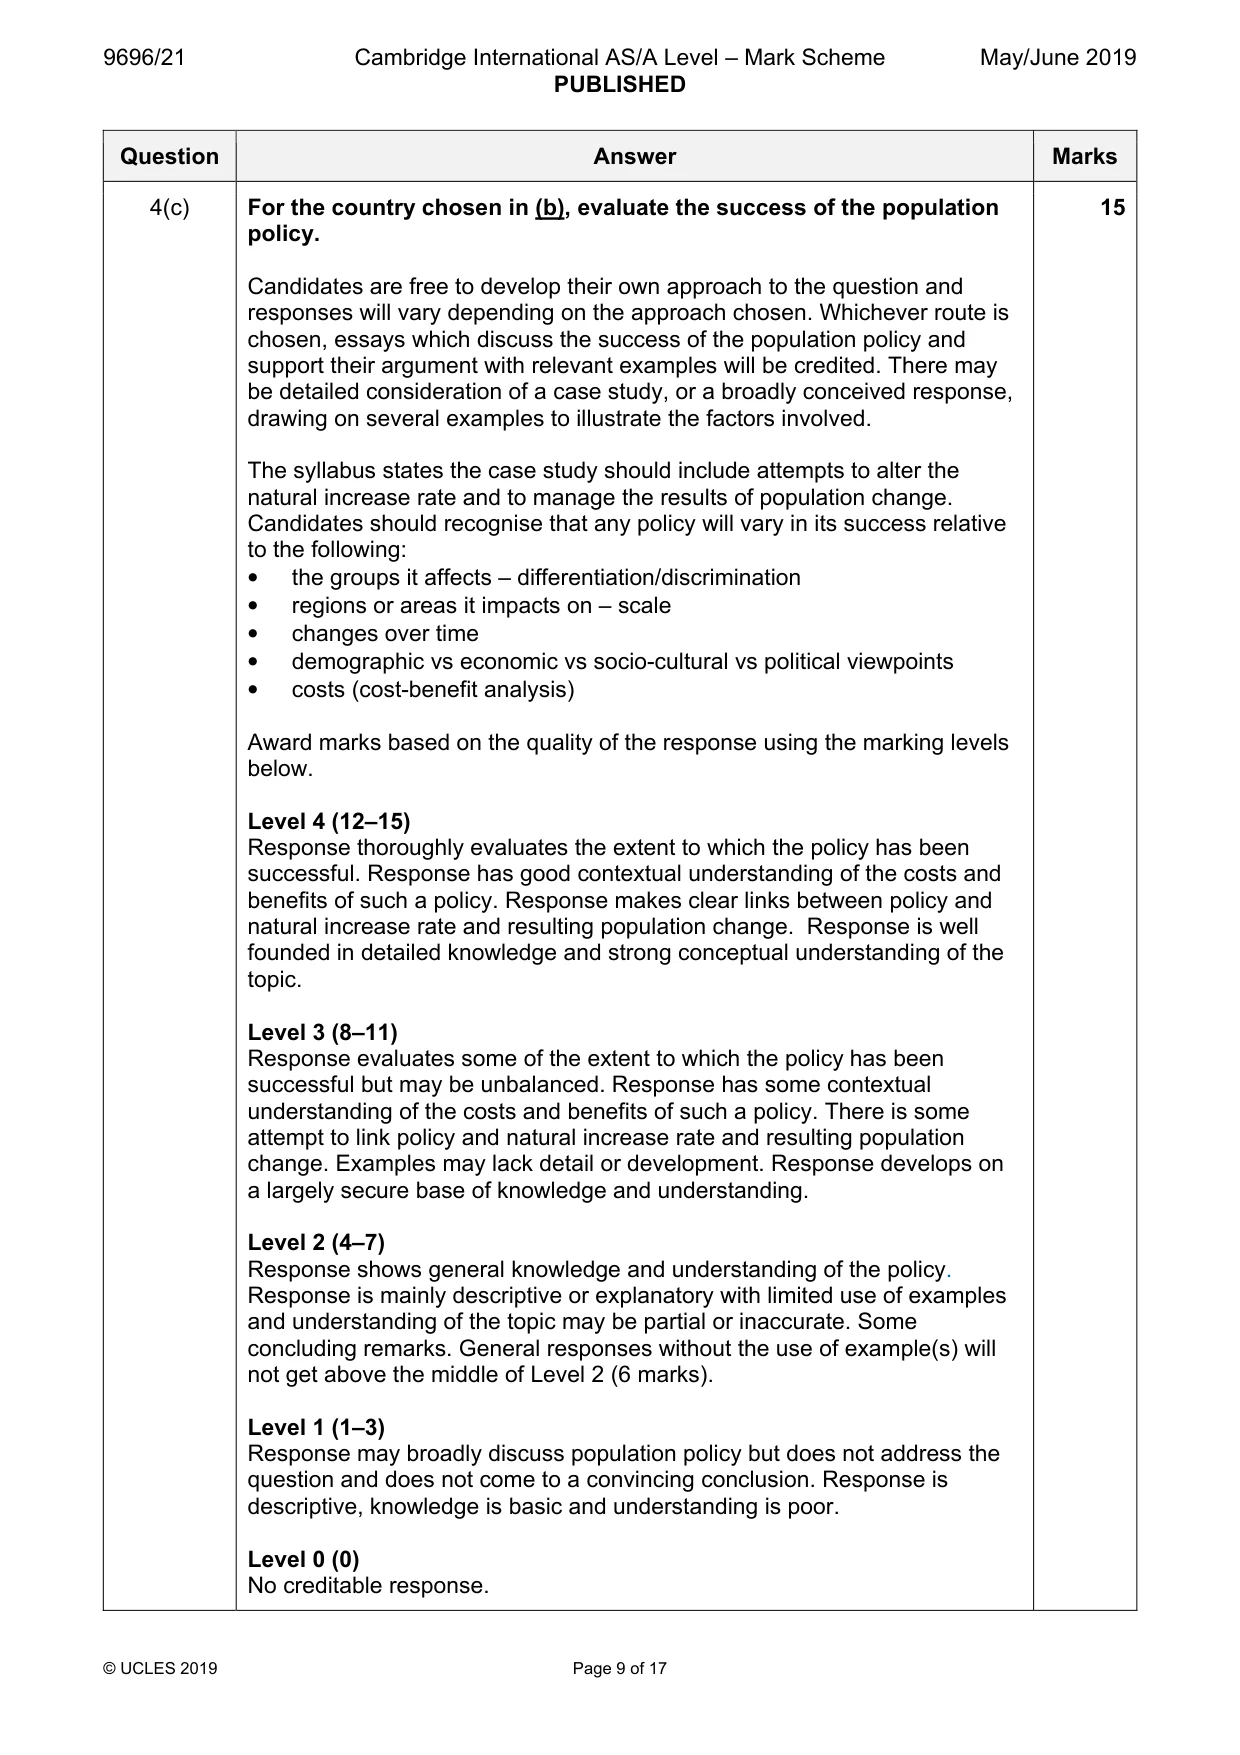
4 (a) Compare recent changes in life expectancy in LICs/MICs and HICs. [7] (b) For your chosen case study of one country’s population policy, explain the nature of the population problem(s) experienced by the country. [8] (c) For the country chosen in (b), evaluate the success of the population policy. [15] [Total: 30] Migration
Mark scheme: 4(a) Compare recent changes in life expectancy in LICs/MICs and HICs. 7 This is a comparison so two separate accounts maximum 4 marks. The stress is on changes so a comparison of current life expectancy maximum 4 marks. ‘Recent’ = within the last 40 years i.e. not historical changes. Indicative content: • both have increased life expectancy • HICs still have a lot higher life expectancy than LICs • LICs have rapidly increased whilst HICs have slowed (or even fallen) • LICs (unlike HICs) fluctuate in life expectancy due to disasters, wars, disease outbreaks (some may have decreased) • females have longer life expectancy in HICs compared to LICs but increasing more than males in LICs • contrasts in changes in infant mortality impacting on life expectancy Point mark such that 3 valid points with development (detail, use of data) can achieve the maximum. There is no explanation required/expected but allow as development. 4(b) For your chosen case study of one country’s population policy, 8 explain the nature of the population problem(s) experienced by the country. The syllabus requires such a case study to be linked to natural increase but accept those that include migration. Exact content will vary with the chosen case study. Indicative content could include problems stemming from: • high birth rate • low birth rate • high infant mortality rate • ageing population • excessively youthful population • migration (out or in) • an unbalanced population structure e.g. sex ratios • population related problems such as famine, unemployment, poverty Award marks based on the quality of explanation (with a clear notion of why this is a problem for the country) and breadth of the response using the marking levels below. Level 3 (6–8) Response clearly explains in detail the nature of the population problem(s). Response is well founded in detailed knowledge and strong conceptual understanding of the topic. Any examples used are appropriate and integrated effectively into the response. Level 2 (3–5) Response offers some explanation of the nature of the population problem(s). Response develops on a largely secure base of knowledge and understanding. Examples may lack detail or development. Level 1 (1–2) Response is largely descriptive with limited explanation of the nature of the population problem(s). Knowledge is basic and understanding may be inaccurate. Examples are in name only or lacking entirely. Level 0 (0) No creditable response. 4(c) For the country chosen in (b), evaluate the success of the population 15 policy. Candidates are free to develop their own approach to the question and responses will vary depending on the approach chosen. Whichever route is chosen, essays which discuss the success of the population policy and support their argument with relevant examples will be credited. There may be detailed consideration of a case study, or a broadly conceived response, drawing on several examples to illustrate the factors involved. The syllabus states the case study should include attempts to alter the natural increase rate and to manage the results of population change. Candidates should recognise that any policy will vary in its success relative to the following: • the groups it affects – differentiation/discrimination • regions or areas it impacts on – scale • changes over time • demographic vs economic vs socio-cultural vs political viewpoints • costs (cost-benefit analysis) Award marks based on the quality of the response using the marking levels below. Level 4 (12–15) Response thoroughly evaluates the extent to which the policy has been successful. Response has good contextual understanding of the costs and benefits of such a policy. Response makes clear links between policy and natural increase rate and resulting population change. Response is well founded in detailed knowledge and strong conceptual understanding of the topic. Level 3 (8–11) Response evaluates some of the extent to which the policy has been successful but may be unbalanced. Response has some contextual understanding of the costs and benefits of such a policy. There is some attempt to link policy and natural increase rate and resulting population change. Examples may lack detail or development. Response develops on a largely secure base of knowledge and understanding. Level 2 (4–7) Response shows general knowledge and understanding of the policy. Response is mainly descriptive or explanatory with limited use of examples and understanding of the topic may be partial or inaccurate. Some concluding remarks. General responses without the use of example(s) will not get above the middle of Level 2 (6 marks). Level 1 (1–3) Response may broadly discuss population policy but does not address the question and does not come to a convincing conclusion. Response is descriptive, knowledge is basic and understanding is poor. Level 0 (0) No creditable response. Migration
Q5 · Compare the characteristics of voluntary and forced (involuntary) international movements…
5 (a) Compare the characteristics of voluntary and forced (involuntary) international movements of people. [7] (b) Using examples, explain the pattern of international refugee flows. [8] (c) Evaluate the impacts of one international migration stream on its destination(s). [15] [Total: 30] Settlement dynamics
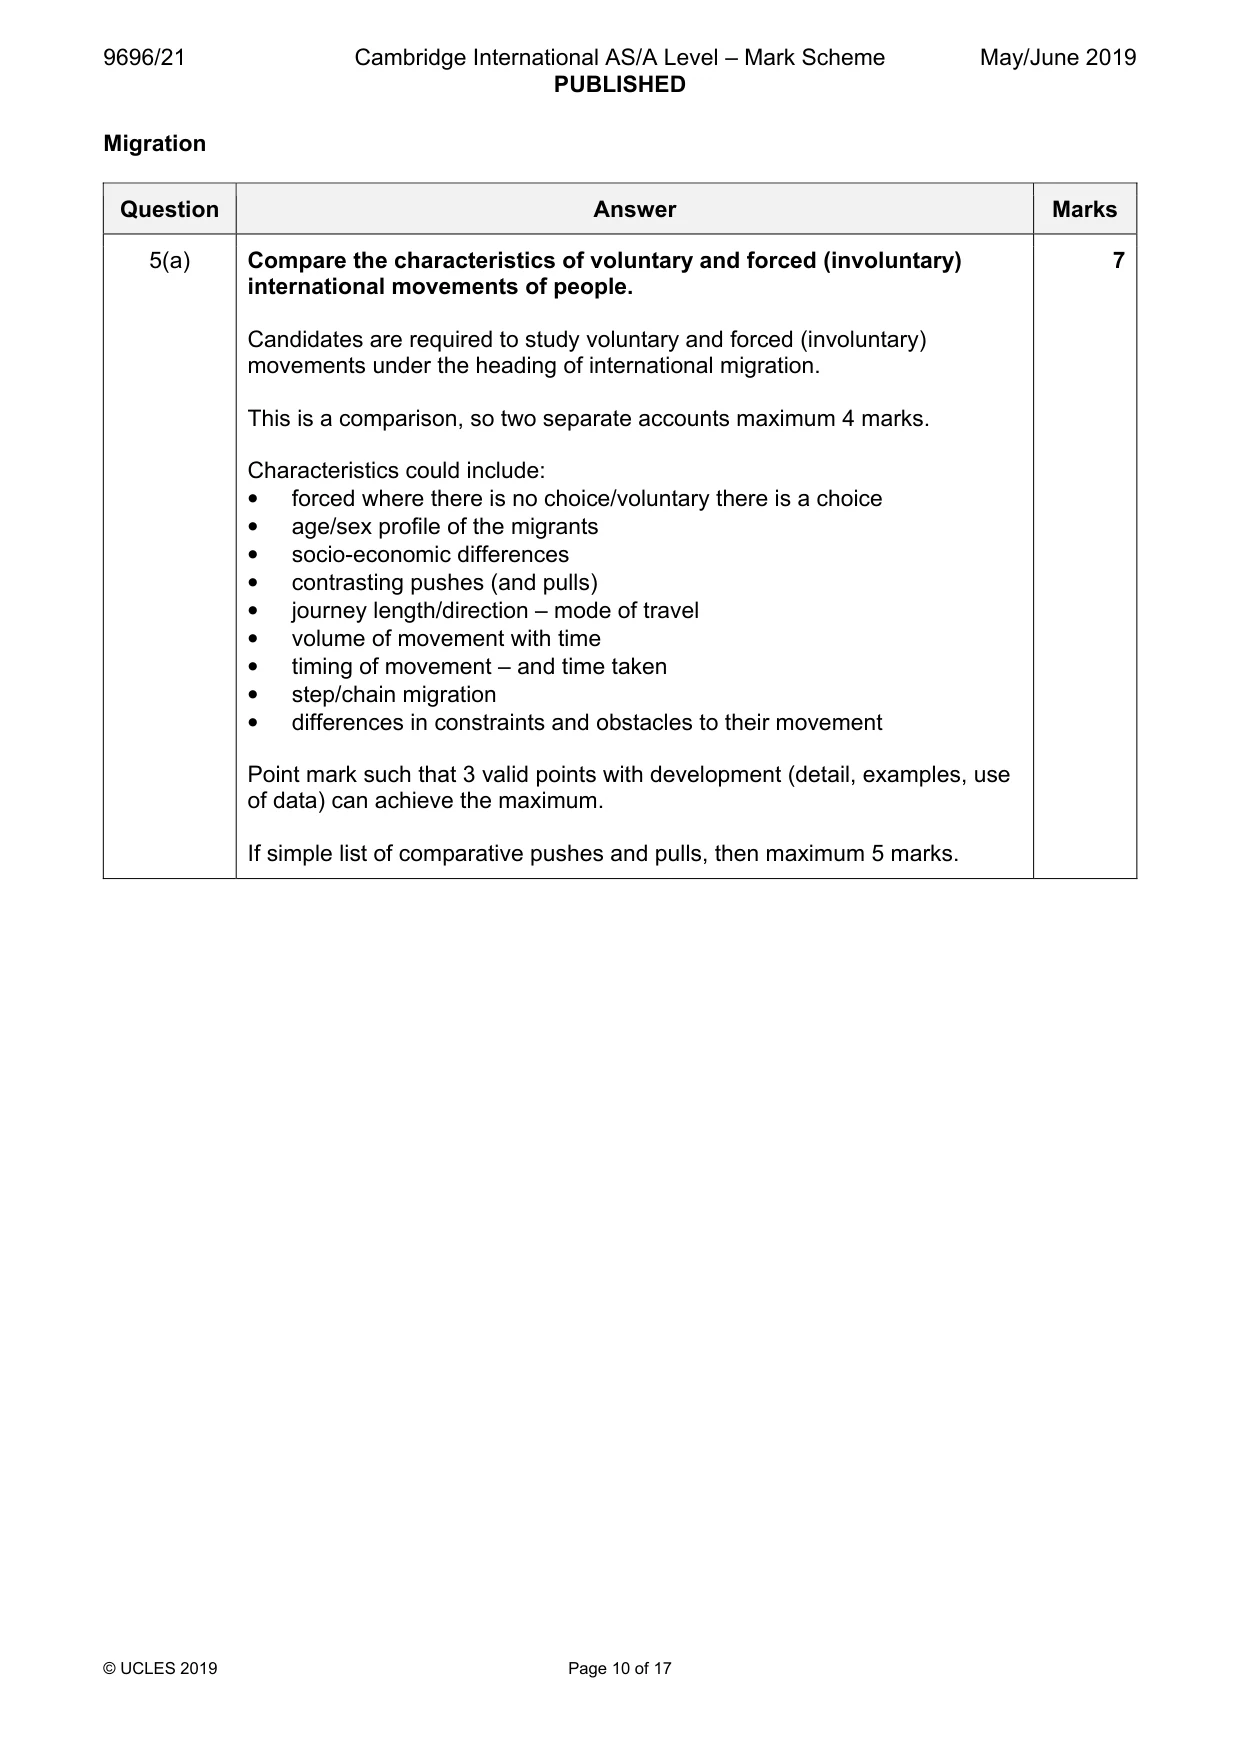
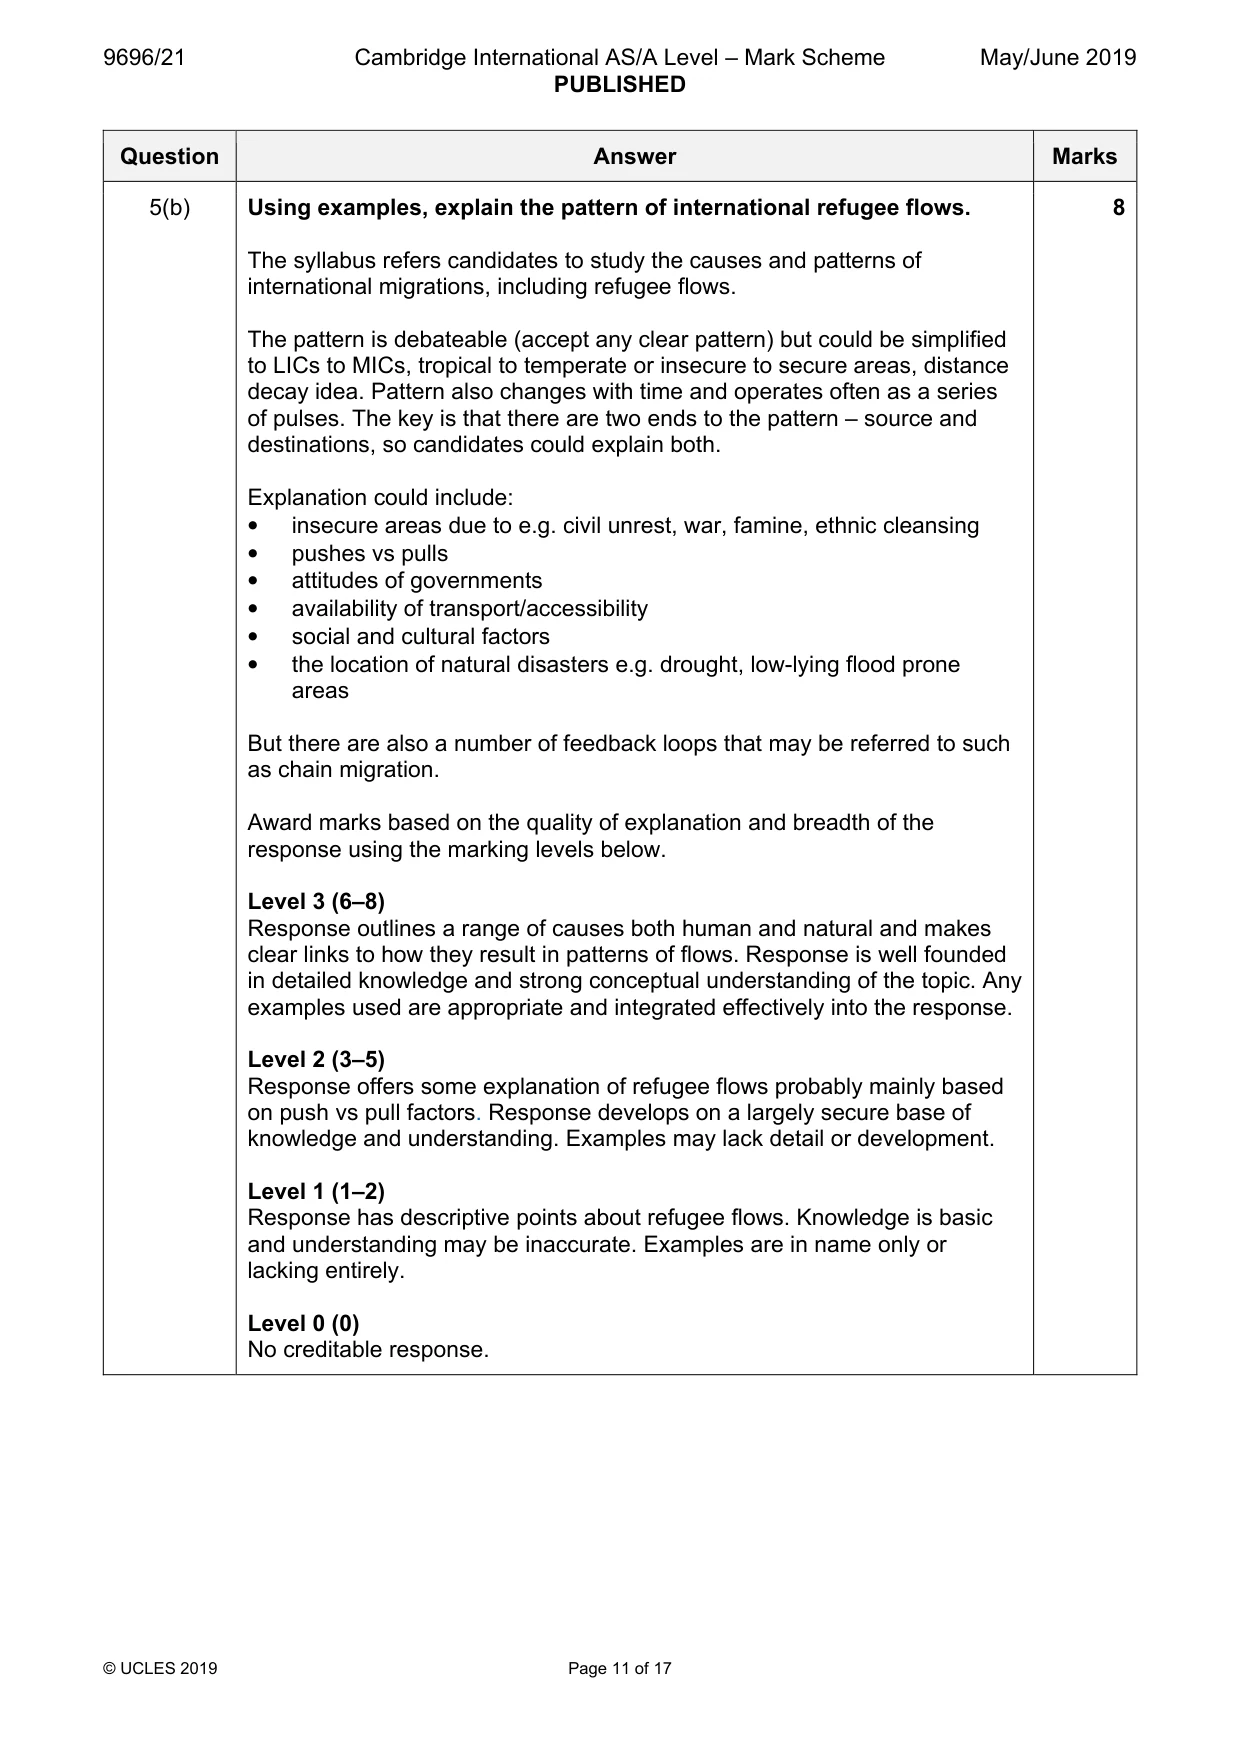
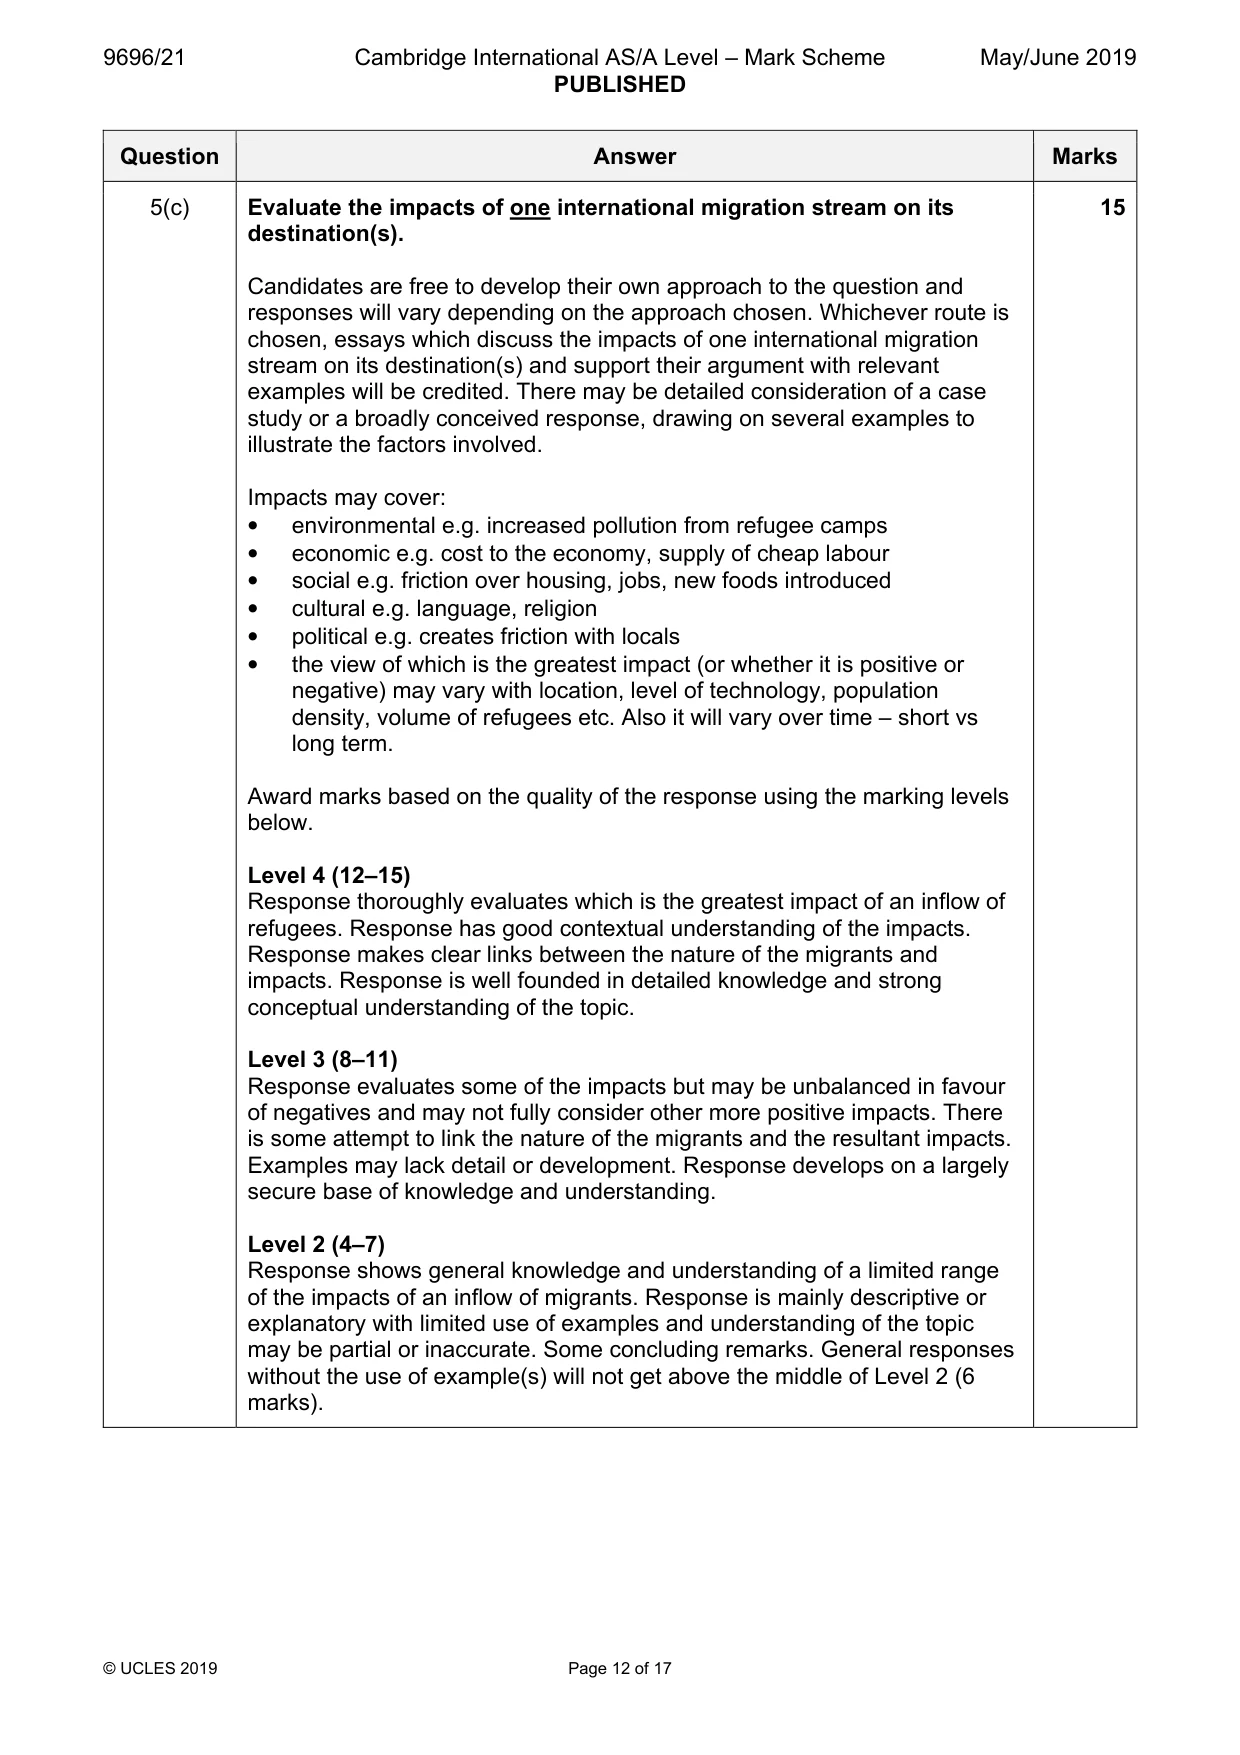
Mark scheme: 5(a) Compare the characteristics of voluntary and forced (involuntary) 7 international movements of people. Candidates are required to study voluntary and forced (involuntary) movements under the heading of international migration. This is a comparison, so two separate accounts maximum 4 marks. Characteristics could include: • forced where there is no choice/voluntary there is a choice • age/sex profile of the migrants • socio-economic differences • contrasting pushes (and pulls) • journey length/direction – mode of travel • volume of movement with time • timing of movement – and time taken • step/chain migration • differences in constraints and obstacles to their movement Point mark such that 3 valid points with development (detail, examples, use of data) can achieve the maximum. If simple list of comparative pushes and pulls, then maximum 5 marks. 5(b) Using examples, explain the pattern of international refugee flows. 8 The syllabus refers candidates to study the causes and patterns of international migrations, including refugee flows. The pattern is debateable (accept any clear pattern) but could be simplified to LICs to MICs, tropical to temperate or insecure to secure areas, distance decay idea. Pattern also changes with time and operates often as a series of pulses. The key is that there are two ends to the pattern – source and destinations, so candidates could explain both. Explanation could include: • insecure areas due to e.g. civil unrest, war, famine, ethnic cleansing • pushes vs pulls • attitudes of governments • availability of transport/accessibility • social and cultural factors • the location of natural disasters e.g. drought, low-lying flood prone areas But there are also a number of feedback loops that may be referred to such as chain migration. Award marks based on the quality of explanation and breadth of the response using the marking levels below. Level 3 (6–8) Response outlines a range of causes both human and natural and makes clear links to how they result in patterns of flows. Response is well founded in detailed knowledge and strong conceptual understanding of the topic. Any examples used are appropriate and integrated effectively into the response. Level 2 (3–5) Response offers some explanation of refugee flows probably mainly based on push vs pull factors. Response develops on a largely secure base of knowledge and understanding. Examples may lack detail or development. Level 1 (1–2) Response has descriptive points about refugee flows. Knowledge is basic and understanding may be inaccurate. Examples are in name only or lacking entirely. Level 0 (0) No creditable response. 5(c) Evaluate the impacts of one international migration stream on its 15 destination(s). Candidates are free to develop their own approach to the question and responses will vary depending on the approach chosen. Whichever route is chosen, essays which discuss the impacts of one international migration stream on its destination(s) and support their argument with relevant examples will be credited. There may be detailed consideration of a case study or a broadly conceived response, drawing on several examples to illustrate the factors involved. Impacts may cover: • environmental e.g. increased pollution from refugee camps • economic e.g. cost to the economy, supply of cheap labour • social e.g. friction over housing, jobs, new foods introduced • cultural e.g. language, religion • political e.g. creates friction with locals • the view of which is the greatest impact (or whether it is positive or negative) may vary with location, level of technology, population density, volume of refugees etc. Also it will vary over time – short vs long term. Award marks based on the quality of the response using the marking levels below. Level 4 (12–15) Response thoroughly evaluates which is the greatest impact of an inflow of refugees. Response has good contextual understanding of the impacts. Response makes clear links between the nature of the migrants and impacts. Response is well founded in detailed knowledge and strong conceptual understanding of the topic. Level 3 (8–11) Response evaluates some of the impacts but may be unbalanced in favour of negatives and may not fully consider other more positive impacts. There is some attempt to link the nature of the migrants and the resultant impacts. Examples may lack detail or development. Response develops on a largely secure base of knowledge and understanding. Level 2 (4–7) Response shows general knowledge and understanding of a limited range of the impacts of an inflow of migrants. Response is mainly descriptive or explanatory with limited use of examples and understanding of the topic may be partial or inaccurate. Some concluding remarks. General responses without the use of example(s) will not get above the middle of Level 2 (6 marks). 5(c) Level 1 (1–3) Response may broadly discuss the impacts of migration but does not address the question and does not come to a convincing conclusion. Response is descriptive, knowledge is basic and understanding is poor. Level 0 (0) No creditable response. Settlement dynamics
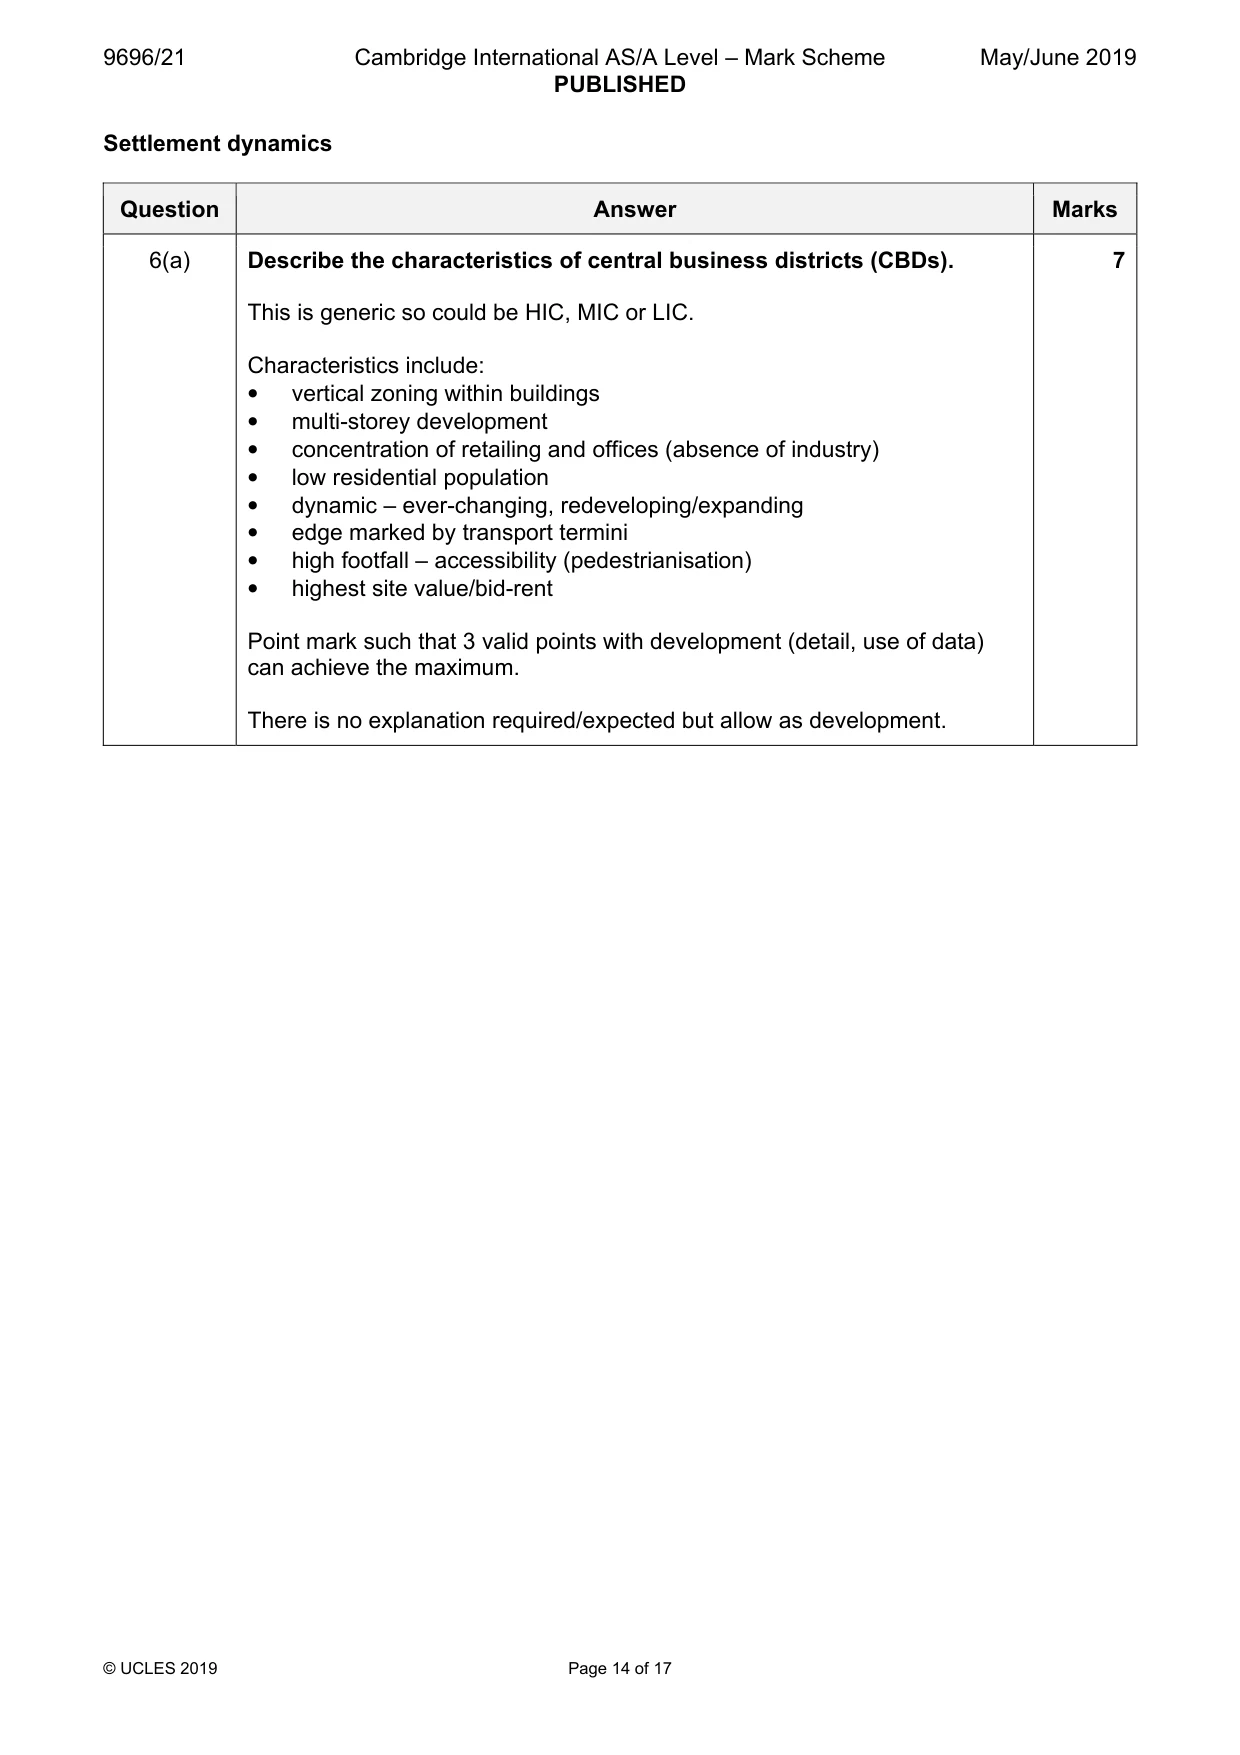
Q6 · Describe the characteristics of central business districts (CBDs)
6 (a) Describe the characteristics of central business districts (CBDs). [7] (b) Explain why CBDs have distinct functional zones. [8] (c) With the aid of examples, assess the extent to which retailing is still located in the central areas of urban settlements. [15] [Total: 30]
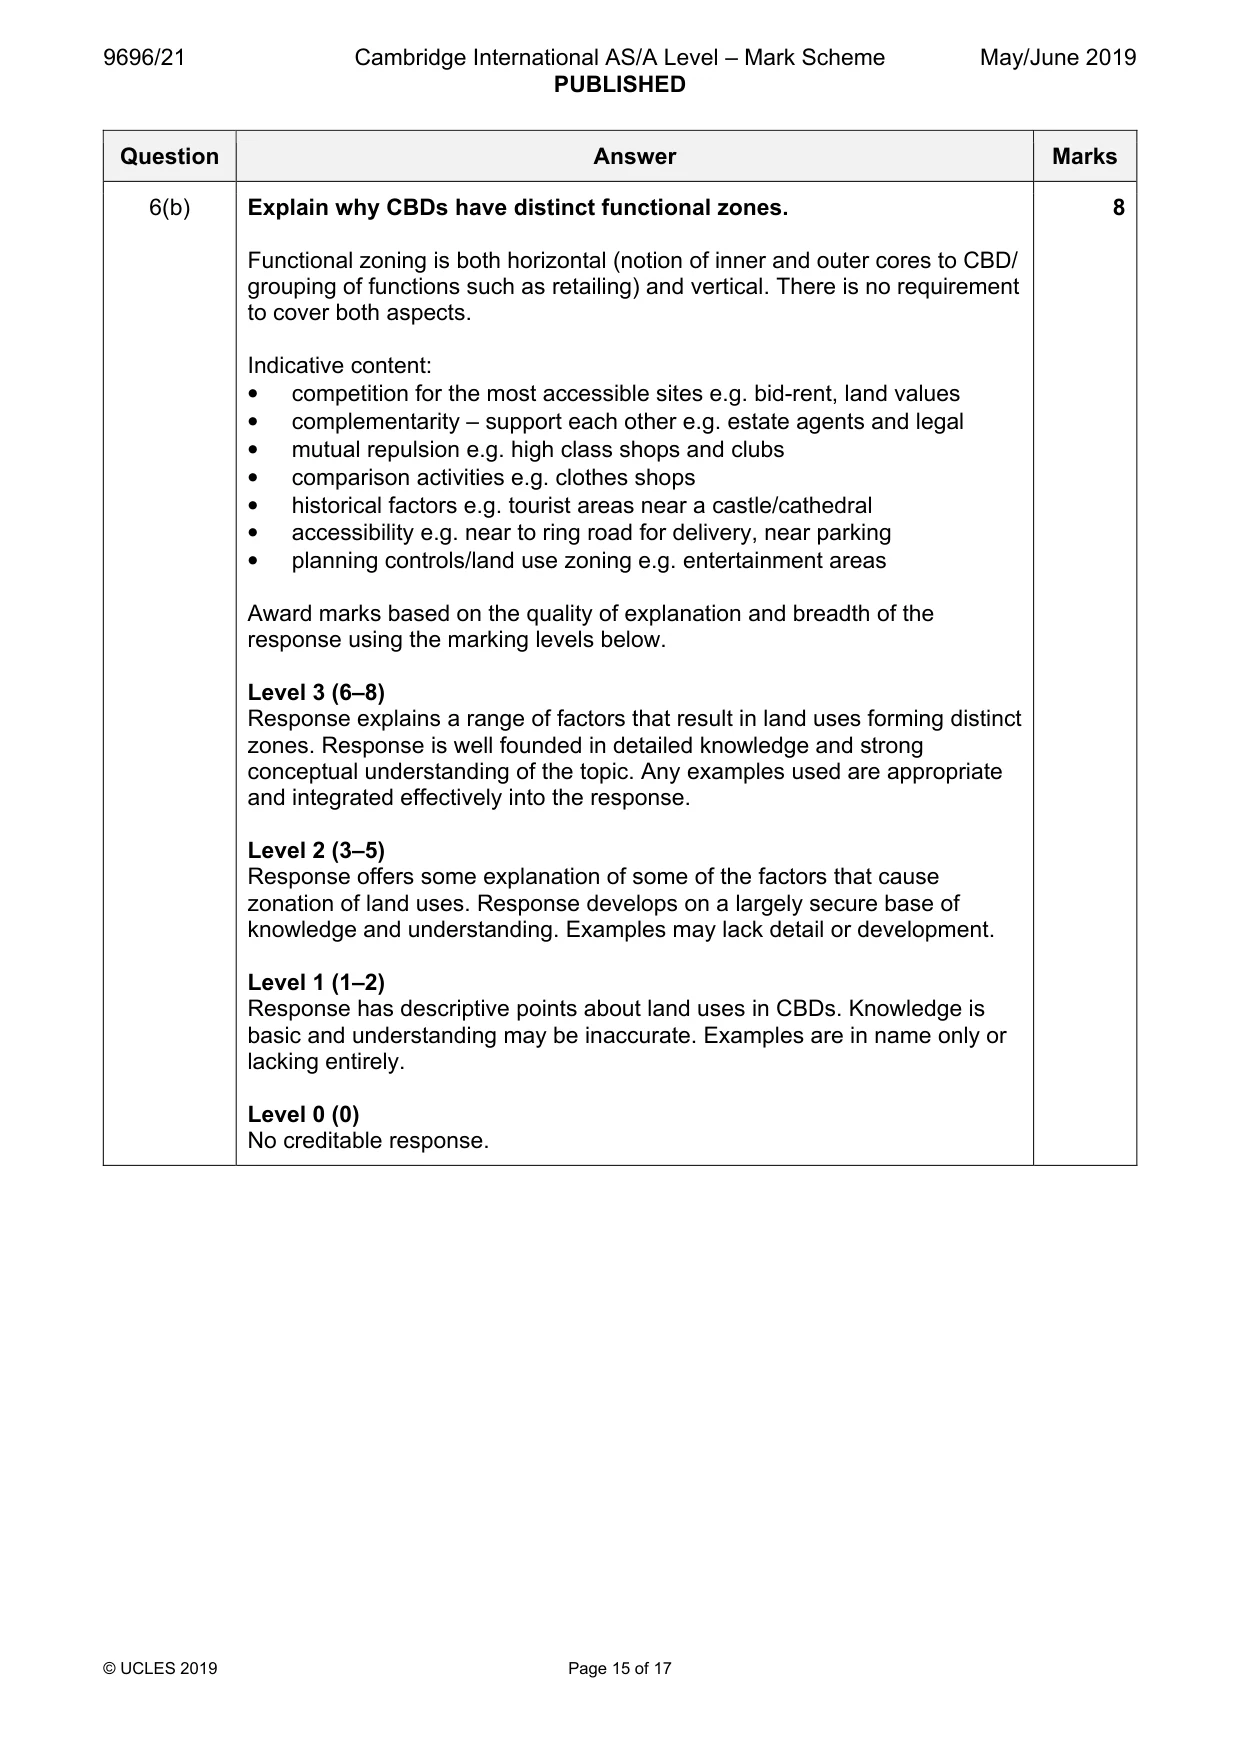
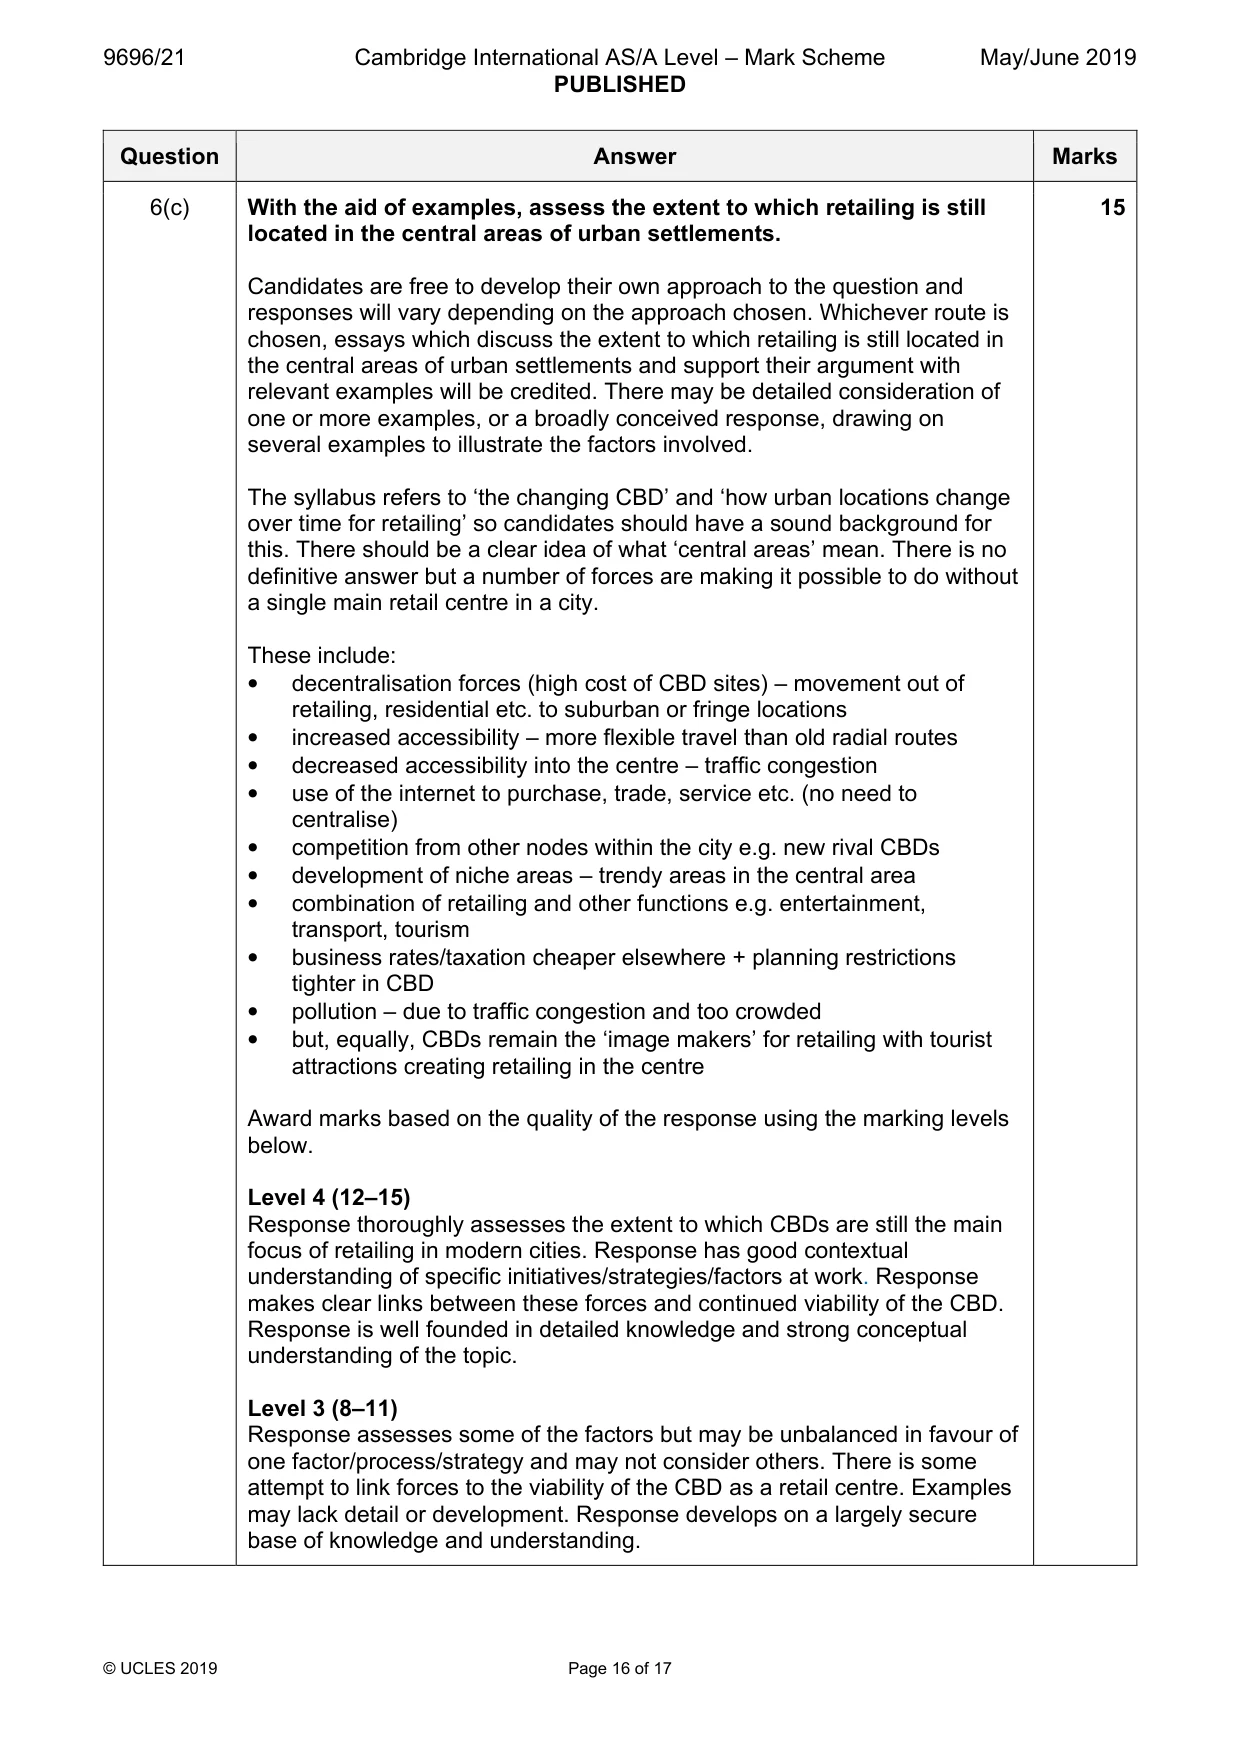
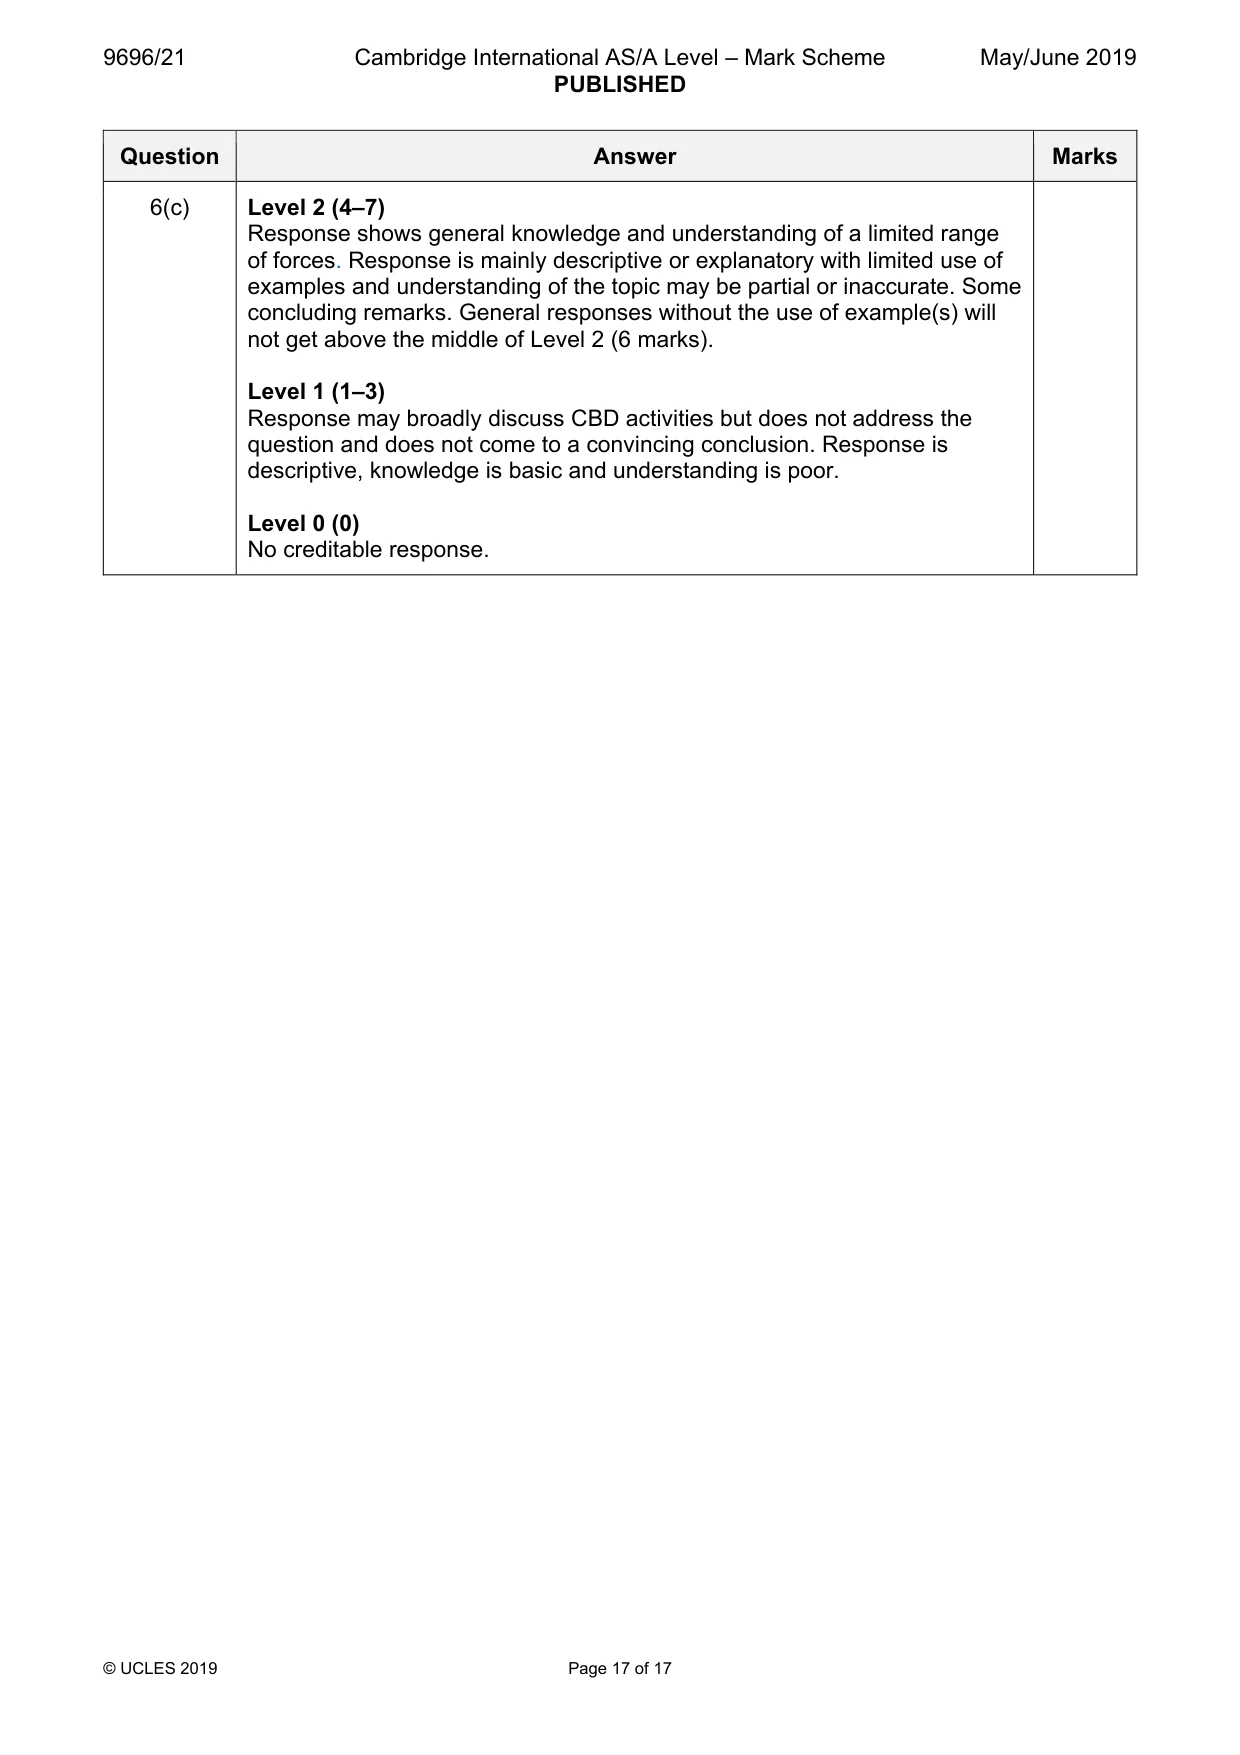
Mark scheme: 6(a) Describe the characteristics of central business districts (CBDs). 7 This is generic so could be HIC, MIC or LIC. Characteristics include: • vertical zoning within buildings • multi-storey development • concentration of retailing and offices (absence of industry) • low residential population • dynamic – ever-changing, redeveloping/expanding • edge marked by transport termini • high footfall – accessibility (pedestrianisation) • highest site value/bid-rent Point mark such that 3 valid points with development (detail, use of data) can achieve the maximum. There is no explanation required/expected but allow as development. 6(b) Explain why CBDs have distinct functional zones. 8 Functional zoning is both horizontal (notion of inner and outer cores to CBD/ grouping of functions such as retailing) and vertical. There is no requirement to cover both aspects. Indicative content: • competition for the most accessible sites e.g. bid-rent, land values • complementarity – support each other e.g. estate agents and legal • mutual repulsion e.g. high class shops and clubs • comparison activities e.g. clothes shops • historical factors e.g. tourist areas near a castle/cathedral • accessibility e.g. near to ring road for delivery, near parking • planning controls/land use zoning e.g. entertainment areas Award marks based on the quality of explanation and breadth of the response using the marking levels below. Level 3 (6–8) Response explains a range of factors that result in land uses forming distinct zones. Response is well founded in detailed knowledge and strong conceptual understanding of the topic. Any examples used are appropriate and integrated effectively into the response. Level 2 (3–5) Response offers some explanation of some of the factors that cause zonation of land uses. Response develops on a largely secure base of knowledge and understanding. Examples may lack detail or development. Level 1 (1–2) Response has descriptive points about land uses in CBDs. Knowledge is basic and understanding may be inaccurate. Examples are in name only or lacking entirely. Level 0 (0) No creditable response. 6(c) With the aid of examples, assess the extent to which retailing is still 15 located in the central areas of urban settlements. Candidates are free to develop their own approach to the question and responses will vary depending on the approach chosen. Whichever route is chosen, essays which discuss the extent to which retailing is still located in the central areas of urban settlements and support their argument with relevant examples will be credited. There may be detailed consideration of one or more examples, or a broadly conceived response, drawing on several examples to illustrate the factors involved. The syllabus refers to ‘the changing CBD’ and ‘how urban locations change over time for retailing’ so candidates should have a sound background for this. There should be a clear idea of what ‘central areas’ mean. There is no definitive answer but a number of forces are making it possible to do without a single main retail centre in a city. These include: • decentralisation forces (high cost of CBD sites) – movement out of retailing, residential etc. to suburban or fringe locations • increased accessibility – more flexible travel than old radial routes • decreased accessibility into the centre – traffic congestion • use of the internet to purchase, trade, service etc. (no need to centralise) • competition from other nodes within the city e.g. new rival CBDs • development of niche areas – trendy areas in the central area • combination of retailing and other functions e.g. entertainment, transport, tourism • business rates/taxation cheaper elsewhere + planning restrictions tighter in CBD • pollution – due to traffic congestion and too crowded • but, equally, CBDs remain the ‘image makers’ for retailing with tourist attractions creating retailing in the centre Award marks based on the quality of the response using the marking levels below. Level 4 (12–15) Response thoroughly assesses the extent to which CBDs are still the main focus of retailing in modern cities. Response has good contextual understanding of specific initiatives/strategies/factors at work. Response makes clear links between these forces and continued viability of the CBD. Response is well founded in detailed knowledge and strong conceptual understanding of the topic. Level 3 (8–11) Response assesses some of the factors but may be unbalanced in favour of one factor/process/strategy and may not consider others. There is some attempt to link forces to the viability of the CBD as a retail centre. Examples may lack detail or development. Response develops on a largely secure base of knowledge and understanding. 6(c) Level 2 (4–7) Response shows general knowledge and understanding of a limited range of forces. Response is mainly descriptive or explanatory with limited use of examples and understanding of the topic may be partial or inaccurate. Some concluding remarks. General responses without the use of example(s) will not get above the middle of Level 2 (6 marks). Level 1 (1–3) Response may broadly discuss CBD activities but does not address the question and does not come to a convincing conclusion. Response is descriptive, knowledge is basic and understanding is poor. Level 0 (0) No creditable response.
What was in this paper
The subtopics covered by these 6 questions, and how many questions each got. Open one in a new tab to see every Cambridge question on it.
What you needed in this session
Cambridge’s own grade thresholds for 2019 May/June, Paper 2 · Variant 1. A higher threshold means an easier paper — the bar moves with how the cohort did.