Cambridge A Level Geography 9696 — 2019 May/June Paper 2 · Variant 2
9696/22/M/J/19 · 6 questions · 60 marks · ≈68 min
The question paper and its mark scheme, free to read here and free to download. This is Cambridge’s own paper, exactly as it was sat.
Question paper4 pages

Mark scheme17 pages
Answers below. Sit the paper first if you are practising.

Questions as text
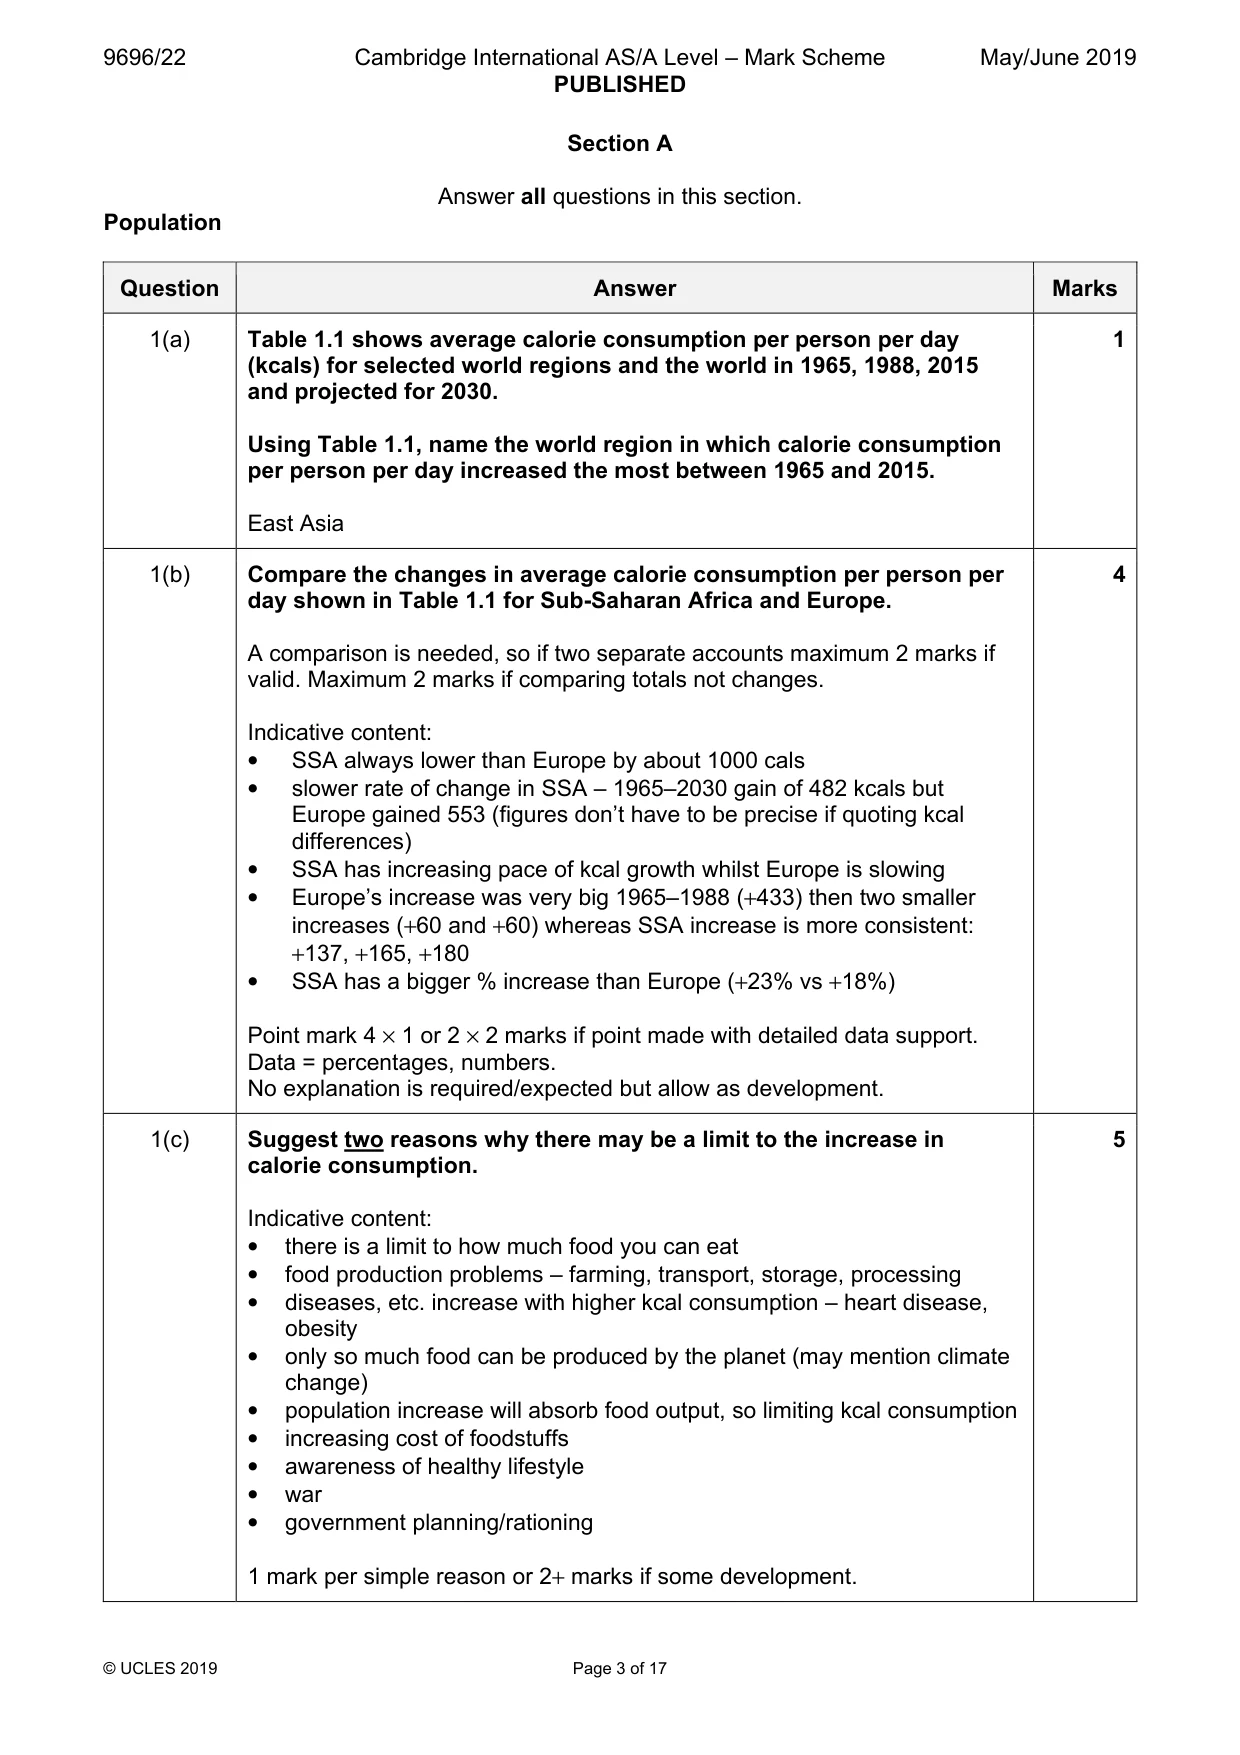
Q1 · Average calorie consumption per person per day (kcals) for selected world regions and the…
1 Table 1.1 shows average calorie consumption per person per day (kcals) for selected world regions and the world in 1965, 1988, 2015 and projected for 2030. (a) Using Table 1.1, name the world region in which calorie consumption per person per day increased the most between 1965 and 2015. [1] (b) Compare the changes in average calorie consumption per person per day shown in Table 1.1 for Sub‑Saharan Africa and Europe. [4] (c) Suggest two reasons why there may be a limit to the increase in calorie consumption. [5] [Total: 10] Population/Migration/Settlement dynamics
Mark scheme: Question Answer Marks 1(a) Table 1.1 shows average calorie consumption per person per day 1 (kcals) for selected world regions and the world in 1965, 1988, 2015 and projected for 2030. Using Table 1.1, name the world region in which calorie consumption per person per day increased the most between 1965 and 2015. East Asia 1(b) Compare the changes in average calorie consumption per person per 4 day shown in Table 1.1 for Sub-Saharan Africa and Europe. A comparison is needed, so if two separate accounts maximum 2 marks if valid. Maximum 2 marks if comparing totals not changes. Indicative content: • SSA always lower than Europe by about 1000 cals • slower rate of change in SSA – 1965–2030 gain of 482 kcals but Europe gained 553 (figures don’t have to be precise if quoting kcal differences) • SSA has increasing pace of kcal growth whilst Europe is slowing • Europe’s increase was very big 1965–1988 (+433) then two smaller increases (+60 and +60) whereas SSA increase is more consistent: +137, +165, +180 • SSA has a bigger % increase than Europe (+23% vs +18%) Point mark 4 × 1 or 2 × 2 marks if point made with detailed data support. Data = percentages, numbers. No explanation is required/expected but allow as development. 1(c) Suggest two reasons why there may be a limit to the increase in 5 calorie consumption. Indicative content: • there is a limit to how much food you can eat • food production problems – farming, transport, storage, processing • diseases, etc. increase with higher kcal consumption – heart disease, obesity • only so much food can be produced by the planet (may mention climate change) • population increase will absorb food output, so limiting kcal consumption • increasing cost of foodstuffs • awareness of healthy lifestyle • war • government planning/rationing 1 mark per simple reason or 2+ marks if some development. Population/Migration/Settlement dynamics
Q2 · Simplified age/sex structures for two urban settlements in 2017
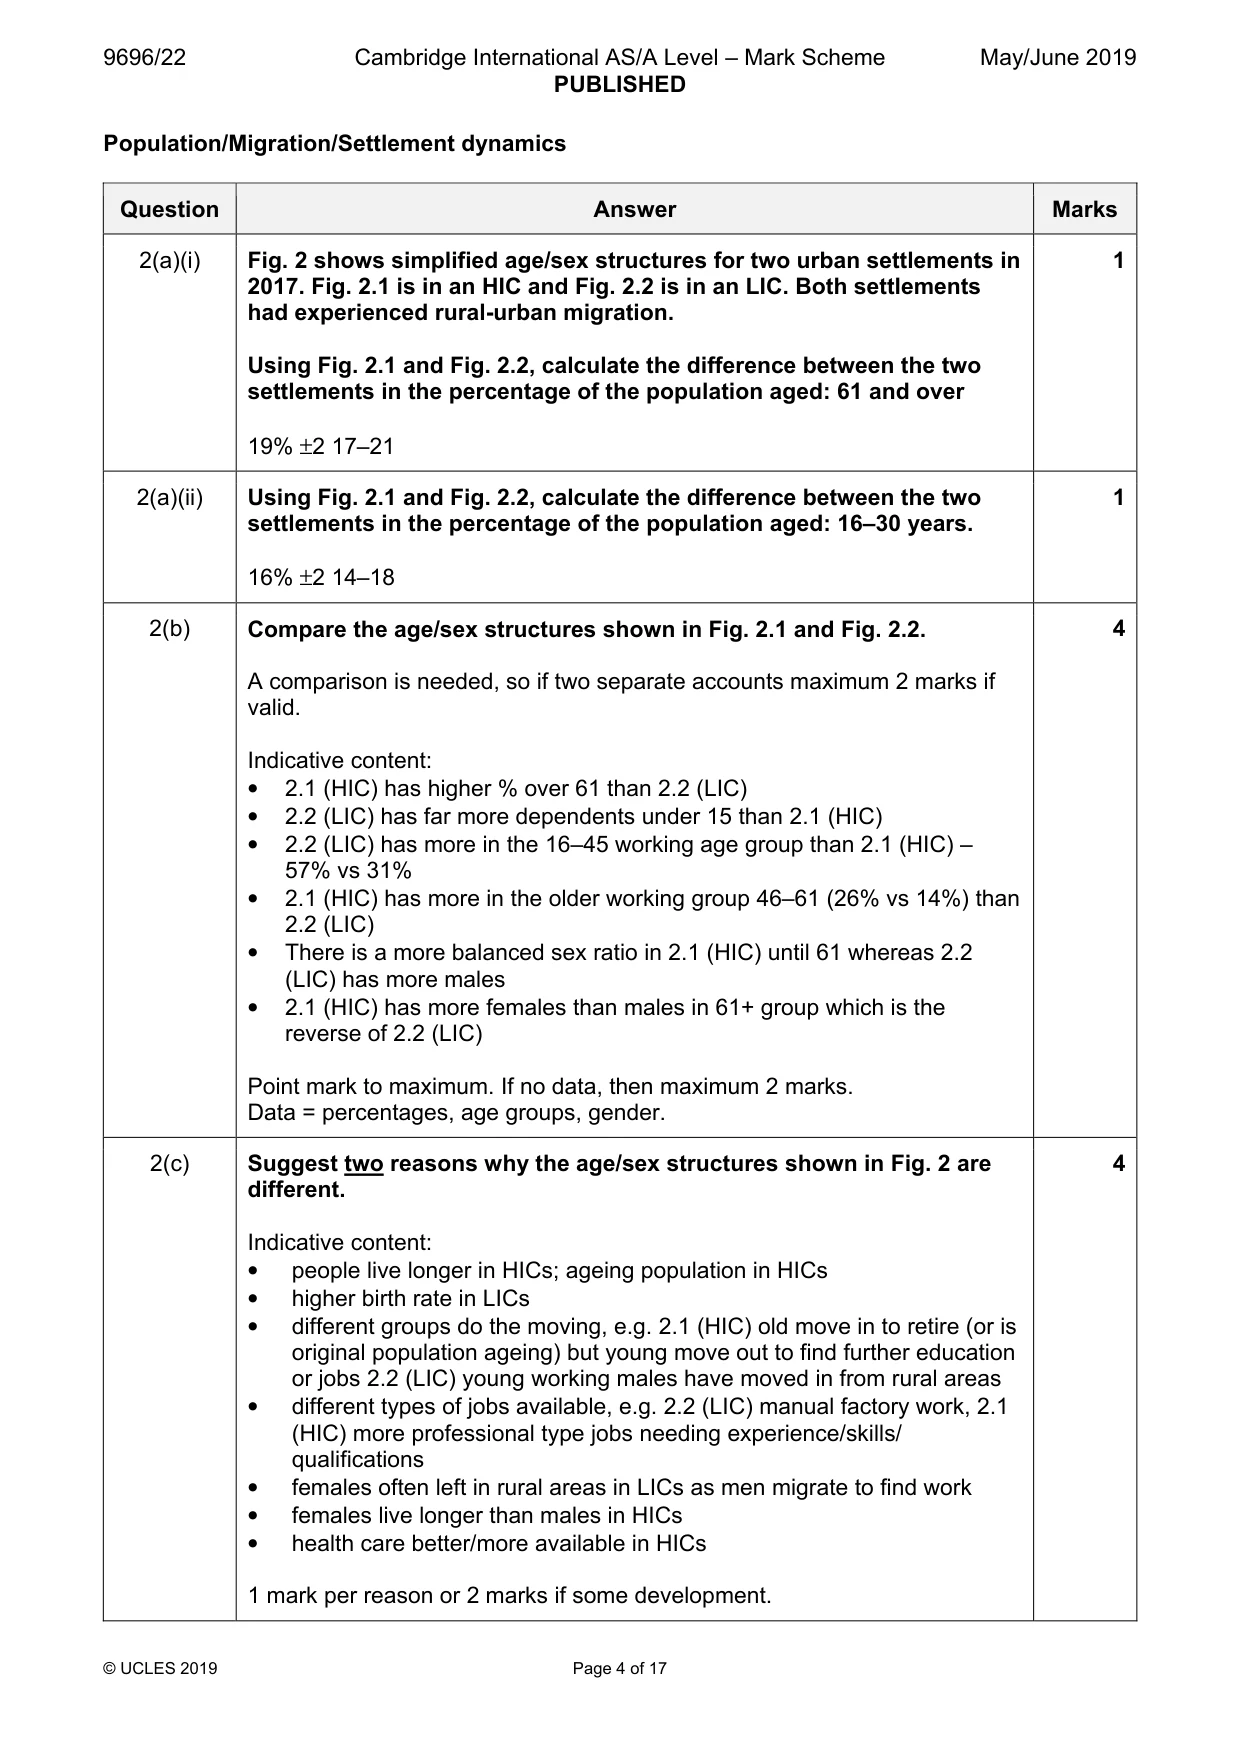
2 Fig. 2 shows simplified age/sex structures for two urban settlements in 2017. Fig. 2.1 is in an HIC and Fig. 2.2 is in an LIC. Both settlements had experienced rural‑urban migration. (a) Using Fig. 2.1 and Fig. 2.2, calculate the difference between the two settlements in the percentage of the population aged: (i) 61 and over [1] (ii) 16–30 years. [1] (b) Compare the age/sex structures shown in Fig. 2.1 and Fig. 2.2. [4] (c) Suggest two reasons why the age/sex structures shown in Fig. 2 are different. [4] [Total: 10] Settlement dynamics
Mark scheme: 2(a)(i) Fig. 2 shows simplified age/sex structures for two urban settlements in 1 2017. Fig. 2.1 is in an HIC and Fig. 2.2 is in an LIC. Both settlements had experienced rural-urban migration. Using Fig. 2.1 and Fig. 2.2, calculate the difference between the two settlements in the percentage of the population aged: 61 and over 19% ±2 17–21 2(a)(ii) Using Fig. 2.1 and Fig. 2.2, calculate the difference between the two 1 settlements in the percentage of the population aged: 16–30 years. 16% ±2 14–18 2(b) Compare the age/sex structures shown in Fig. 2.1 and Fig. 2.2. 4 A comparison is needed, so if two separate accounts maximum 2 marks if valid. Indicative content: • 2.1 (HIC) has higher % over 61 than 2.2 (LIC) • 2.2 (LIC) has far more dependents under 15 than 2.1 (HIC) • 2.2 (LIC) has more in the 16–45 working age group than 2.1 (HIC) – 57% vs 31% • 2.1 (HIC) has more in the older working group 46–61 (26% vs 14%) than 2.2 (LIC) • There is a more balanced sex ratio in 2.1 (HIC) until 61 whereas 2.2 (LIC) has more males • 2.1 (HIC) has more females than males in 61+ group which is the reverse of 2.2 (LIC) Point mark to maximum. If no data, then maximum 2 marks. Data = percentages, age groups, gender. 2(c) Suggest two reasons why the age/sex structures shown in Fig. 2 are 4 different. Indicative content: • people live longer in HICs; ageing population in HICs • higher birth rate in LICs • different groups do the moving, e.g. 2.1 (HIC) old move in to retire (or is original population ageing) but young move out to find further education or jobs 2.2 (LIC) young working males have moved in from rural areas • different types of jobs available, e.g. 2.2 (LIC) manual factory work, 2.1 (HIC) more professional type jobs needing experience/skills/ qualifications • females often left in rural areas in LICs as men migrate to find work • females live longer than males in HICs • health care better/more available in HICs 1 mark per reason or 2 marks if some development. Settlement dynamics
Q3 · A squatter settlement along a railway line in Mumbai, India, an MIC in South Asia
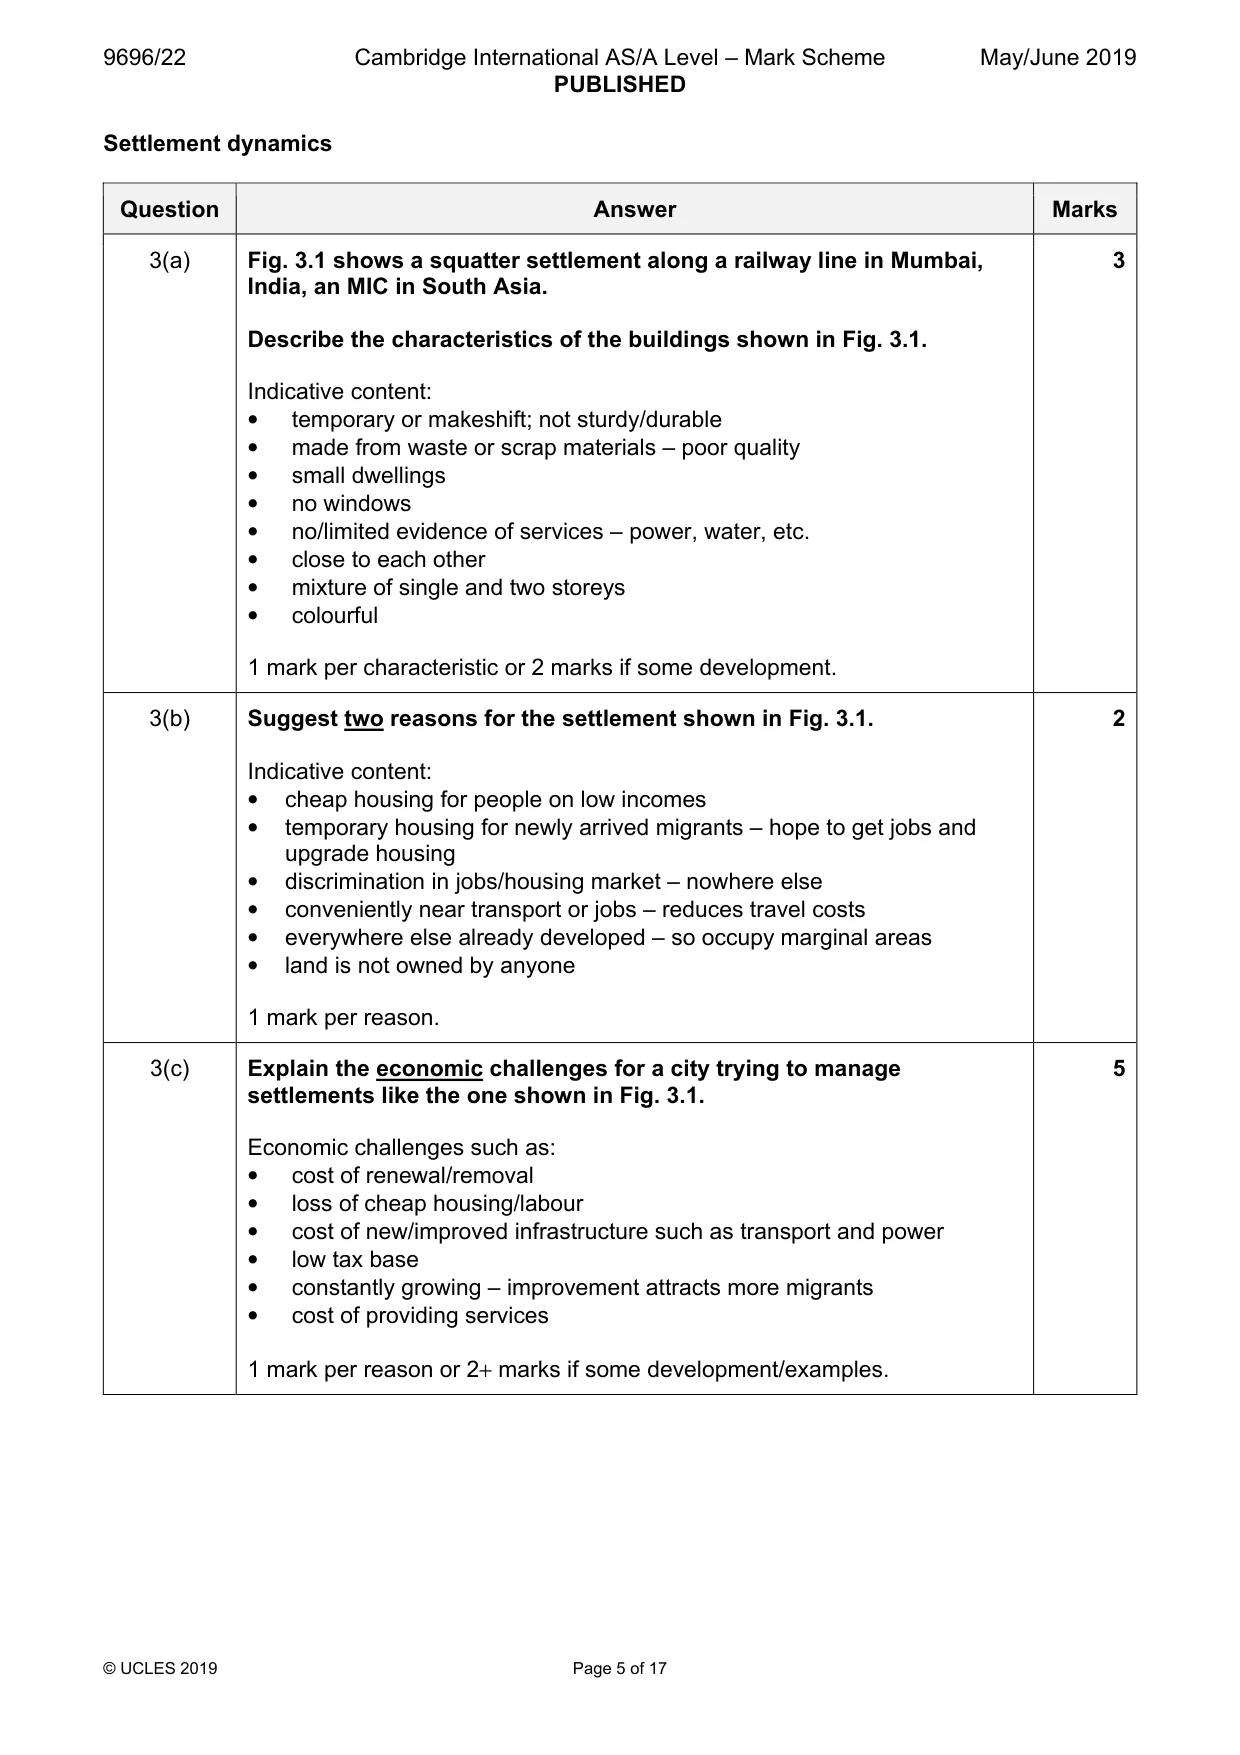
3 Fig. 3.1 shows a squatter settlement along a railway line in Mumbai, India, an MIC in South Asia. (a) Describe the characteristics of the buildings shown in Fig. 3.1. [3] (b) Suggest two reasons for the settlement shown in Fig. 3.1. [2] (c) Explain the economic challenges for a city trying to manage settlements like the one shown in Fig. 3.1. [5] [Total: 10]
Mark scheme: 3(a) Fig. 3.1 shows a squatter settlement along a railway line in Mumbai, 3 India, an MIC in South Asia. Describe the characteristics of the buildings shown in Fig. 3.1. Indicative content: • temporary or makeshift; not sturdy/durable • made from waste or scrap materials – poor quality • small dwellings • no windows • no/limited evidence of services – power, water, etc. • close to each other • mixture of single and two storeys • colourful 1 mark per characteristic or 2 marks if some development. 3(b) Suggest two reasons for the settlement shown in Fig. 3.1. 2 Indicative content: • cheap housing for people on low incomes • temporary housing for newly arrived migrants – hope to get jobs and upgrade housing • discrimination in jobs/housing market – nowhere else • conveniently near transport or jobs – reduces travel costs • everywhere else already developed – so occupy marginal areas • land is not owned by anyone 1 mark per reason. 3(c) Explain the economic challenges for a city trying to manage 5 settlements like the one shown in Fig. 3.1. Economic challenges such as: • cost of renewal/removal • loss of cheap housing/labour • cost of new/improved infrastructure such as transport and power • low tax base • constantly growing – improvement attracts more migrants • cost of providing services 1 mark per reason or 2+ marks if some development/examples. Section B Answer one question from this section. Population
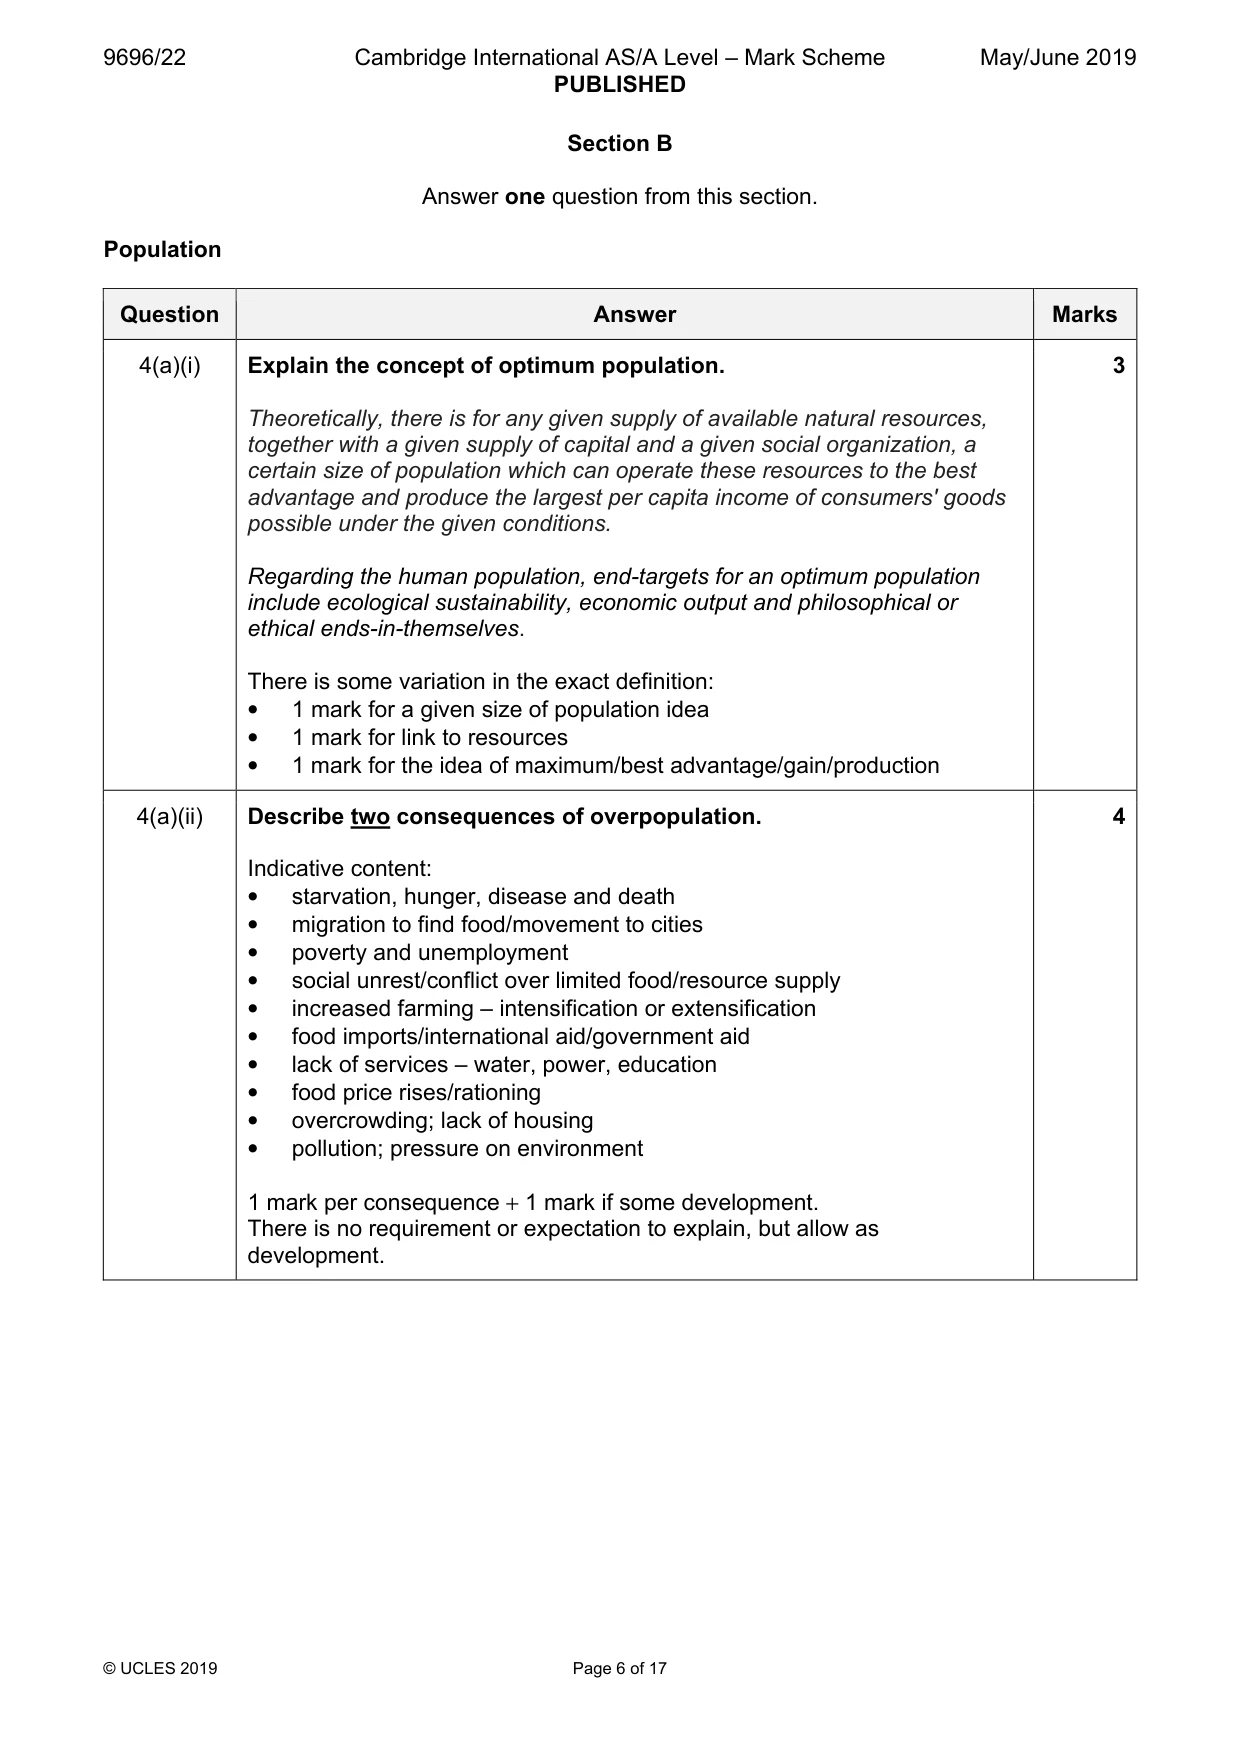
Q4 · Explain the concept of optimum population
4 (a) (i) Explain the concept of optimum population. [3] (ii) Describe two consequences of overpopulation. [4] (b) Explain the role of constraints in relation to sustaining population. [8] (c) ‘Countries are challenged more by underpopulation than by overpopulation.’ With the aid of examples, how far do you agree? [15] [Total: 30] Population/Migration
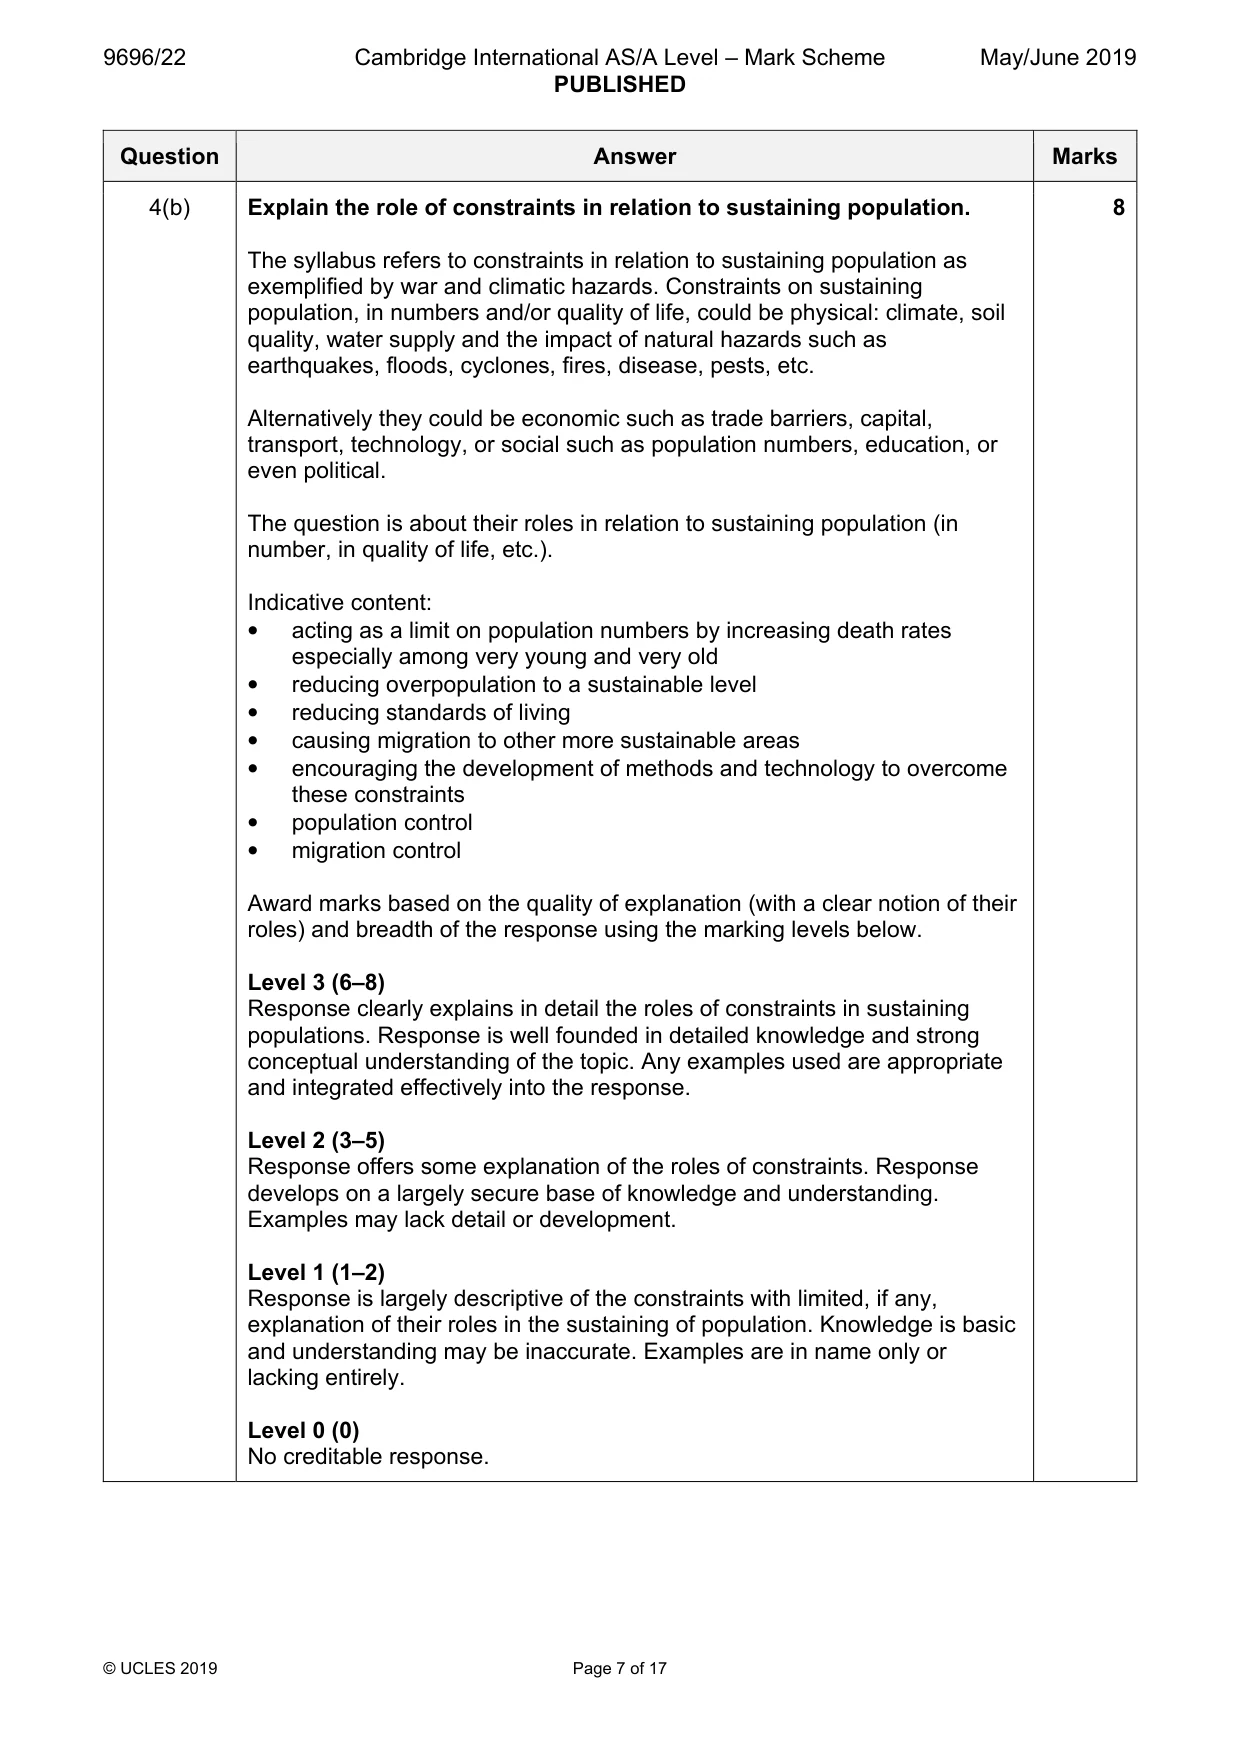
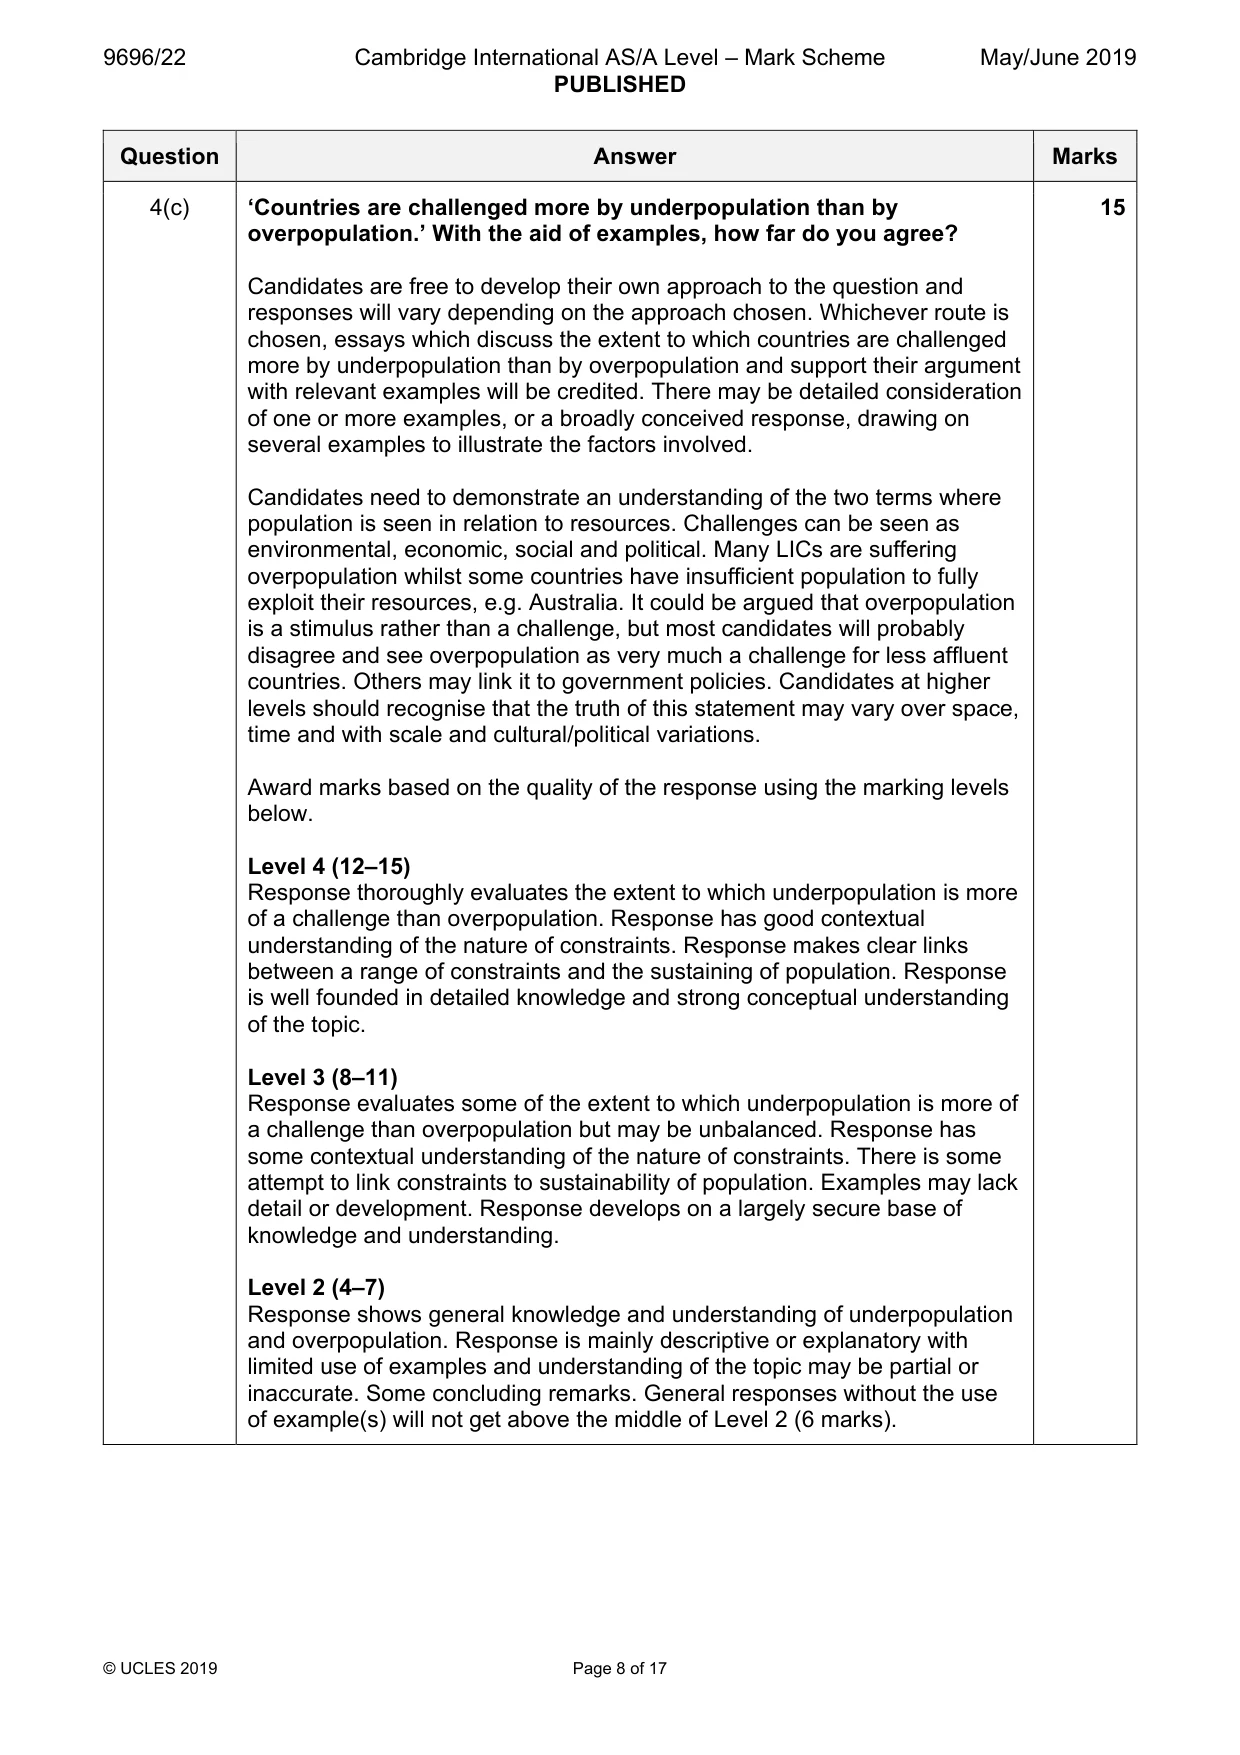
Mark scheme: 4(a)(i) Explain the concept of optimum population. 3 Theoretically, there is for any given supply of available natural resources, together with a given supply of capital and a given social organization, a certain size of population which can operate these resources to the best advantage and produce the largest per capita income of consumers' goods possible under the given conditions. Regarding the human population, end-targets for an optimum population include ecological sustainability, economic output and philosophical or ethical ends-in-themselves. There is some variation in the exact definition: • 1 mark for a given size of population idea • 1 mark for link to resources • 1 mark for the idea of maximum/best advantage/gain/production 4(a)(ii) Describe two consequences of overpopulation. 4 Indicative content: • starvation, hunger, disease and death • migration to find food/movement to cities • poverty and unemployment • social unrest/conflict over limited food/resource supply • increased farming – intensification or extensification • food imports/international aid/government aid • lack of services – water, power, education • food price rises/rationing • overcrowding; lack of housing • pollution; pressure on environment 1 mark per consequence + 1 mark if some development. There is no requirement or expectation to explain, but allow as development. 4(b) Explain the role of constraints in relation to sustaining population. 8 The syllabus refers to constraints in relation to sustaining population as exemplified by war and climatic hazards. Constraints on sustaining population, in numbers and/or quality of life, could be physical: climate, soil quality, water supply and the impact of natural hazards such as earthquakes, floods, cyclones, fires, disease, pests, etc. Alternatively they could be economic such as trade barriers, capital, transport, technology, or social such as population numbers, education, or even political. The question is about their roles in relation to sustaining population (in number, in quality of life, etc.). Indicative content: • acting as a limit on population numbers by increasing death rates especially among very young and very old • reducing overpopulation to a sustainable level • reducing standards of living • causing migration to other more sustainable areas • encouraging the development of methods and technology to overcome these constraints • population control • migration control Award marks based on the quality of explanation (with a clear notion of their roles) and breadth of the response using the marking levels below. Level 3 (6–8) Response clearly explains in detail the roles of constraints in sustaining populations. Response is well founded in detailed knowledge and strong conceptual understanding of the topic. Any examples used are appropriate and integrated effectively into the response. Level 2 (3–5) Response offers some explanation of the roles of constraints. Response develops on a largely secure base of knowledge and understanding. Examples may lack detail or development. Level 1 (1–2) Response is largely descriptive of the constraints with limited, if any, explanation of their roles in the sustaining of population. Knowledge is basic and understanding may be inaccurate. Examples are in name only or lacking entirely. Level 0 (0) No creditable response. 4(c) ‘Countries are challenged more by underpopulation than by 15 overpopulation.’ With the aid of examples, how far do you agree? Candidates are free to develop their own approach to the question and responses will vary depending on the approach chosen. Whichever route is chosen, essays which discuss the extent to which countries are challenged more by underpopulation than by overpopulation and support their argument with relevant examples will be credited. There may be detailed consideration of one or more examples, or a broadly conceived response, drawing on several examples to illustrate the factors involved. Candidates need to demonstrate an understanding of the two terms where population is seen in relation to resources. Challenges can be seen as environmental, economic, social and political. Many LICs are suffering overpopulation whilst some countries have insufficient population to fully exploit their resources, e.g. Australia. It could be argued that overpopulation is a stimulus rather than a challenge, but most candidates will probably disagree and see overpopulation as very much a challenge for less affluent countries. Others may link it to government policies. Candidates at higher levels should recognise that the truth of this statement may vary over space, time and with scale and cultural/political variations. Award marks based on the quality of the response using the marking levels below. Level 4 (12–15) Response thoroughly evaluates the extent to which underpopulation is more of a challenge than overpopulation. Response has good contextual understanding of the nature of constraints. Response makes clear links between a range of constraints and the sustaining of population. Response is well founded in detailed knowledge and strong conceptual understanding of the topic. Level 3 (8–11) Response evaluates some of the extent to which underpopulation is more of a challenge than overpopulation but may be unbalanced. Response has some contextual understanding of the nature of constraints. There is some attempt to link constraints to sustainability of population. Examples may lack detail or development. Response develops on a largely secure base of knowledge and understanding. Level 2 (4–7) Response shows general knowledge and understanding of underpopulation and overpopulation. Response is mainly descriptive or explanatory with limited use of examples and understanding of the topic may be partial or inaccurate. Some concluding remarks. General responses without the use of example(s) will not get above the middle of Level 2 (6 marks). 4(c) Level 1 (1–3) Response may broadly discuss pressures of population but does not address the question and does not come to a convincing conclusion. Response is descriptive, knowledge is basic and understanding is poor. Level 0 (0) No creditable response. Population/Migration
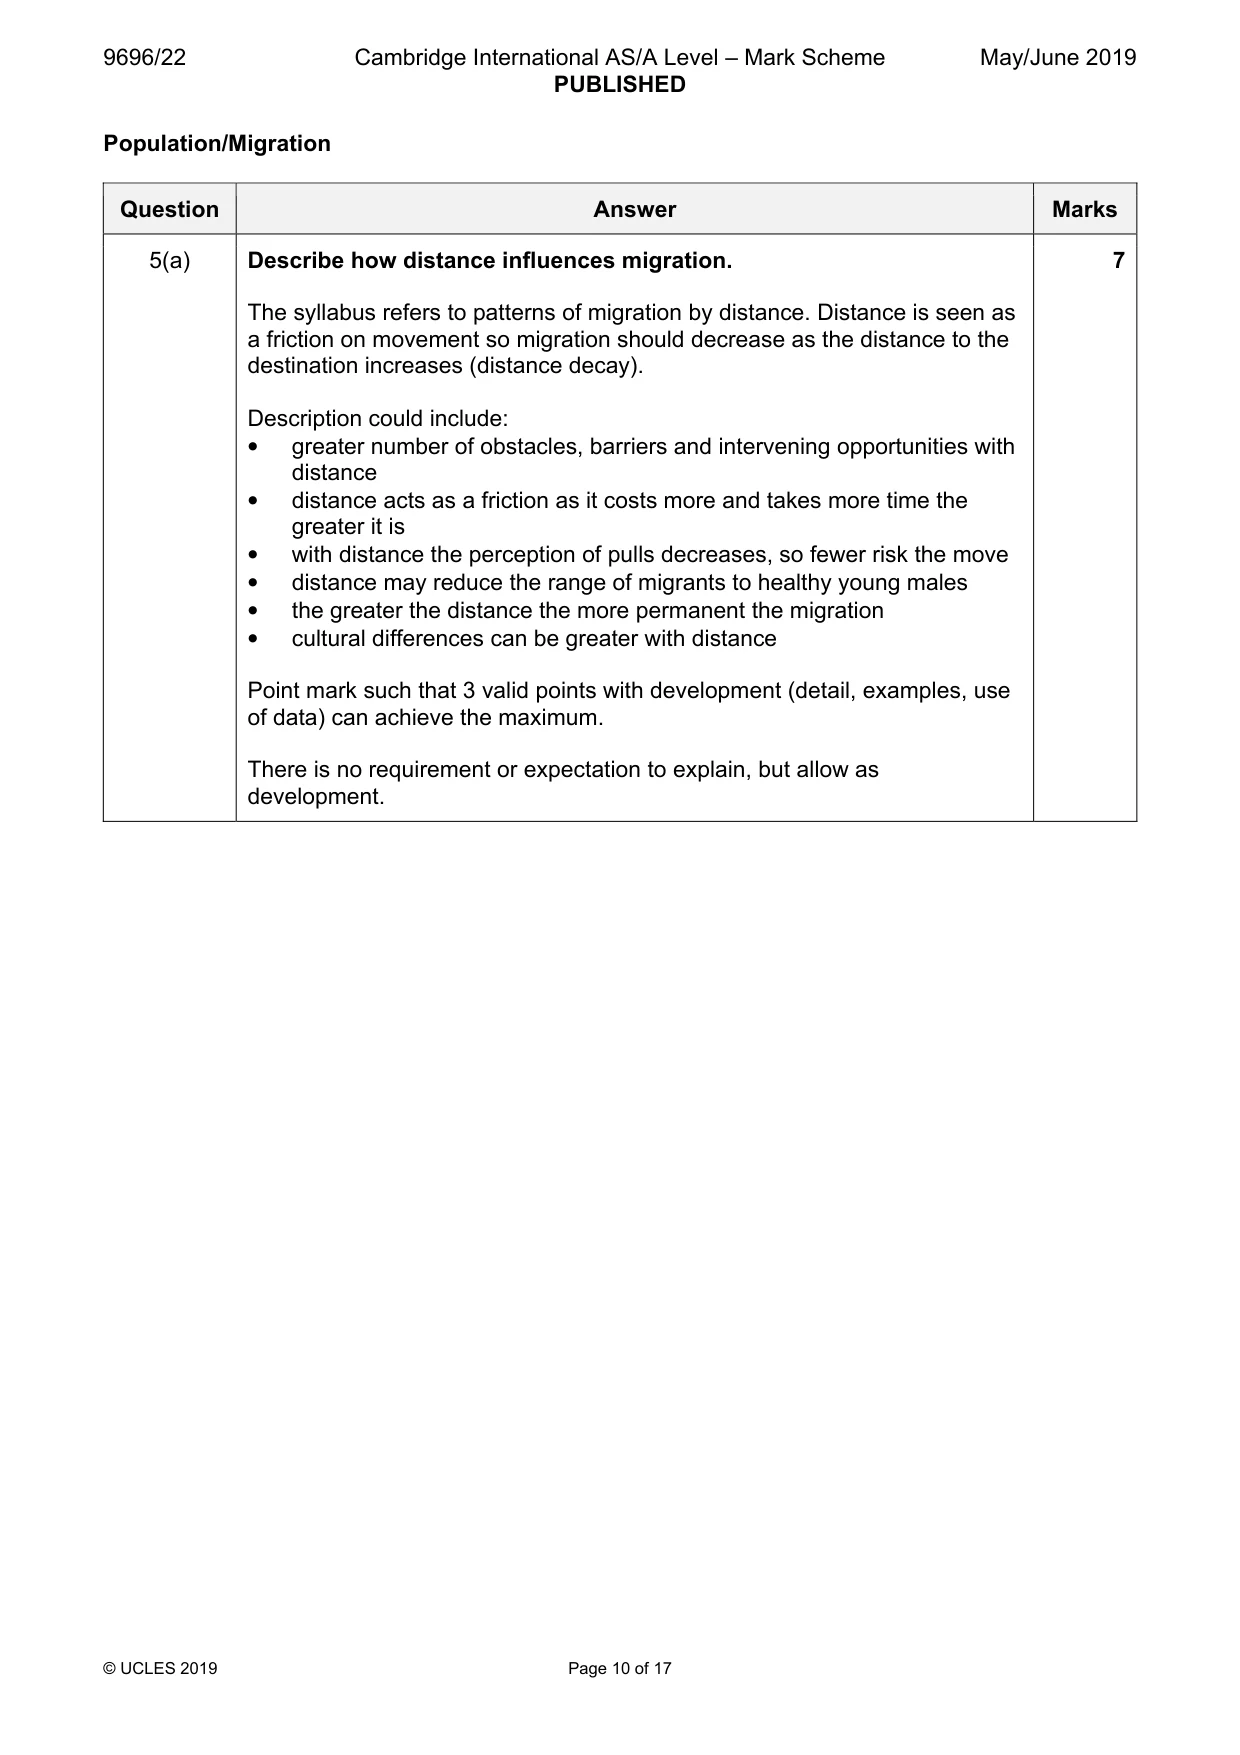
Q5 · Describe how distance influences migration
5 (a) Describe how distance influences migration. [7] (b) Explain the nature of obstacles and barriers, other than distance, that limit migration. [8] (c) With the aid of examples, assess the extent to which a person’s age is the greatest constraint on migration. [15] [Total: 30] Migration/Settlement dynamics
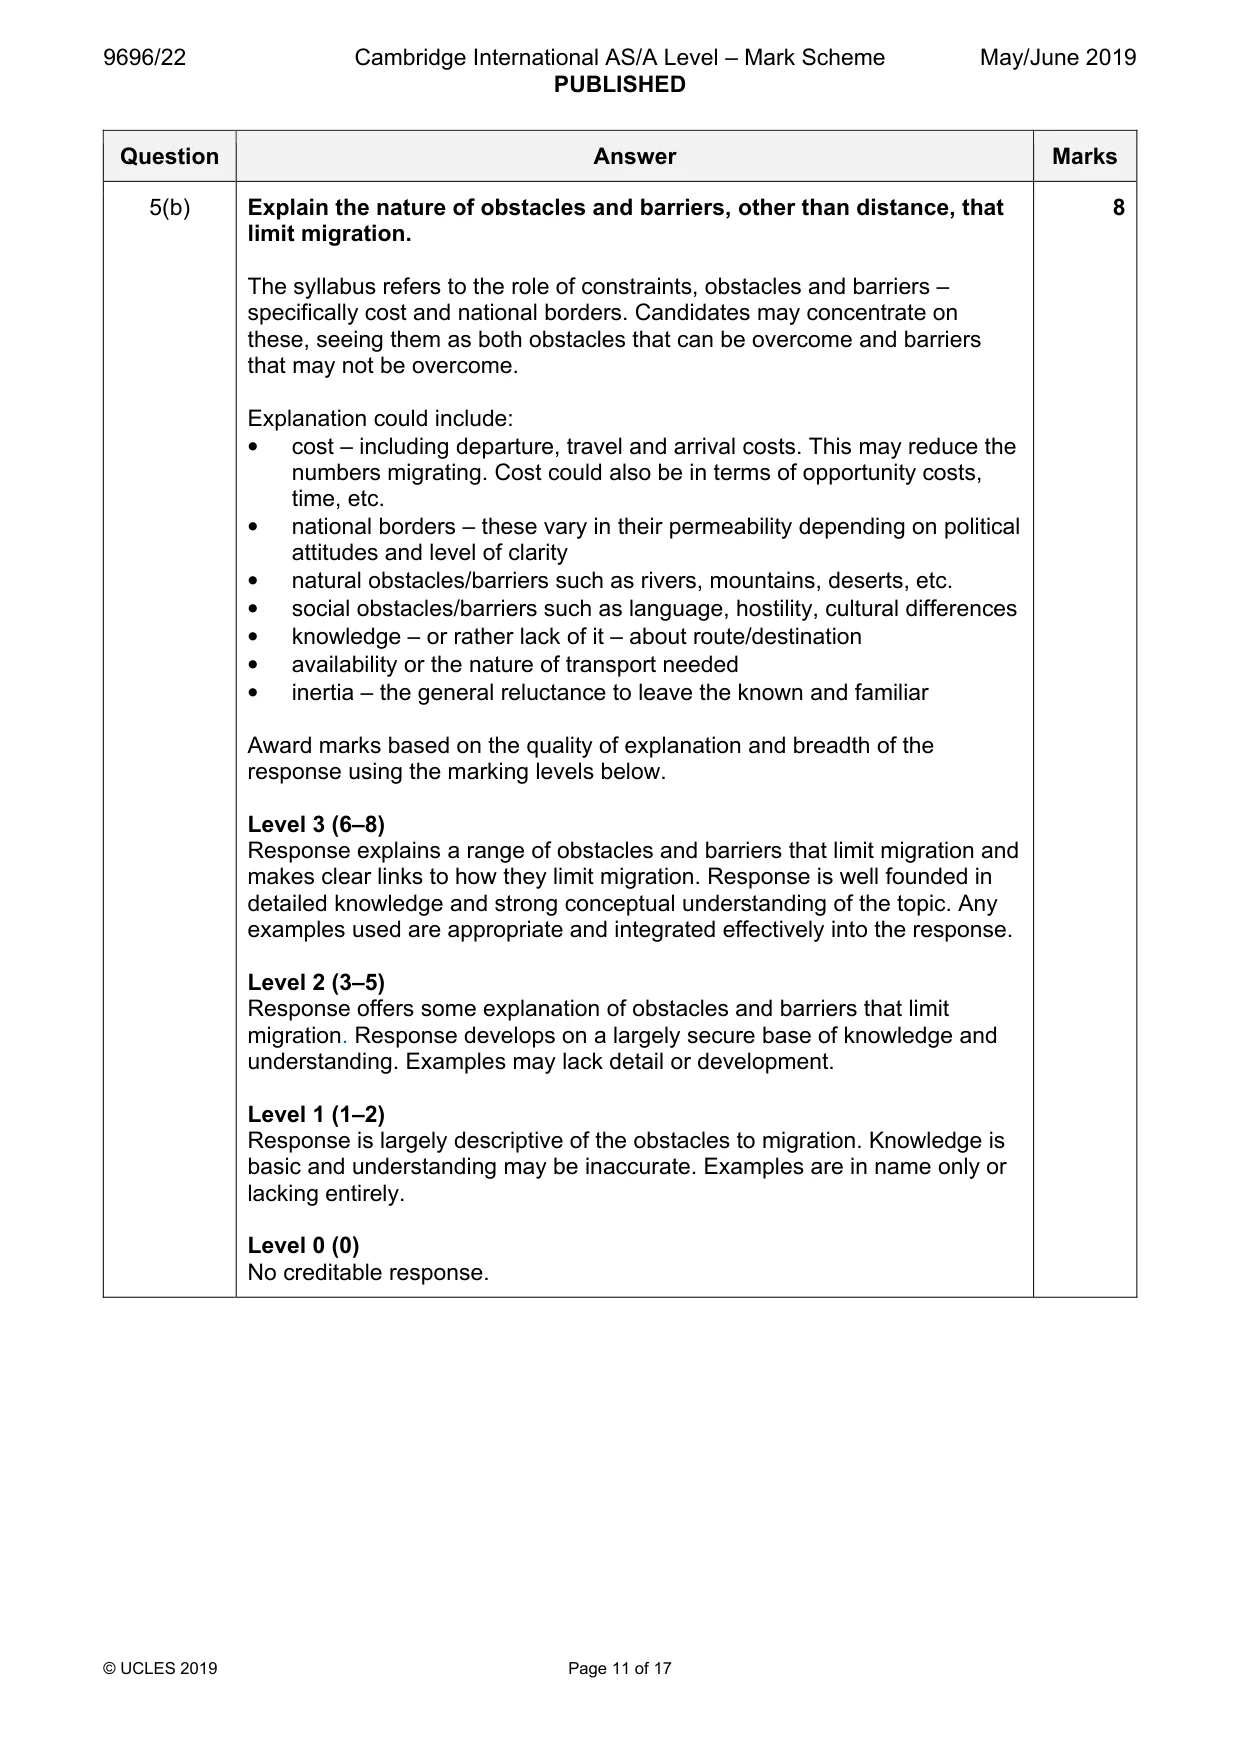
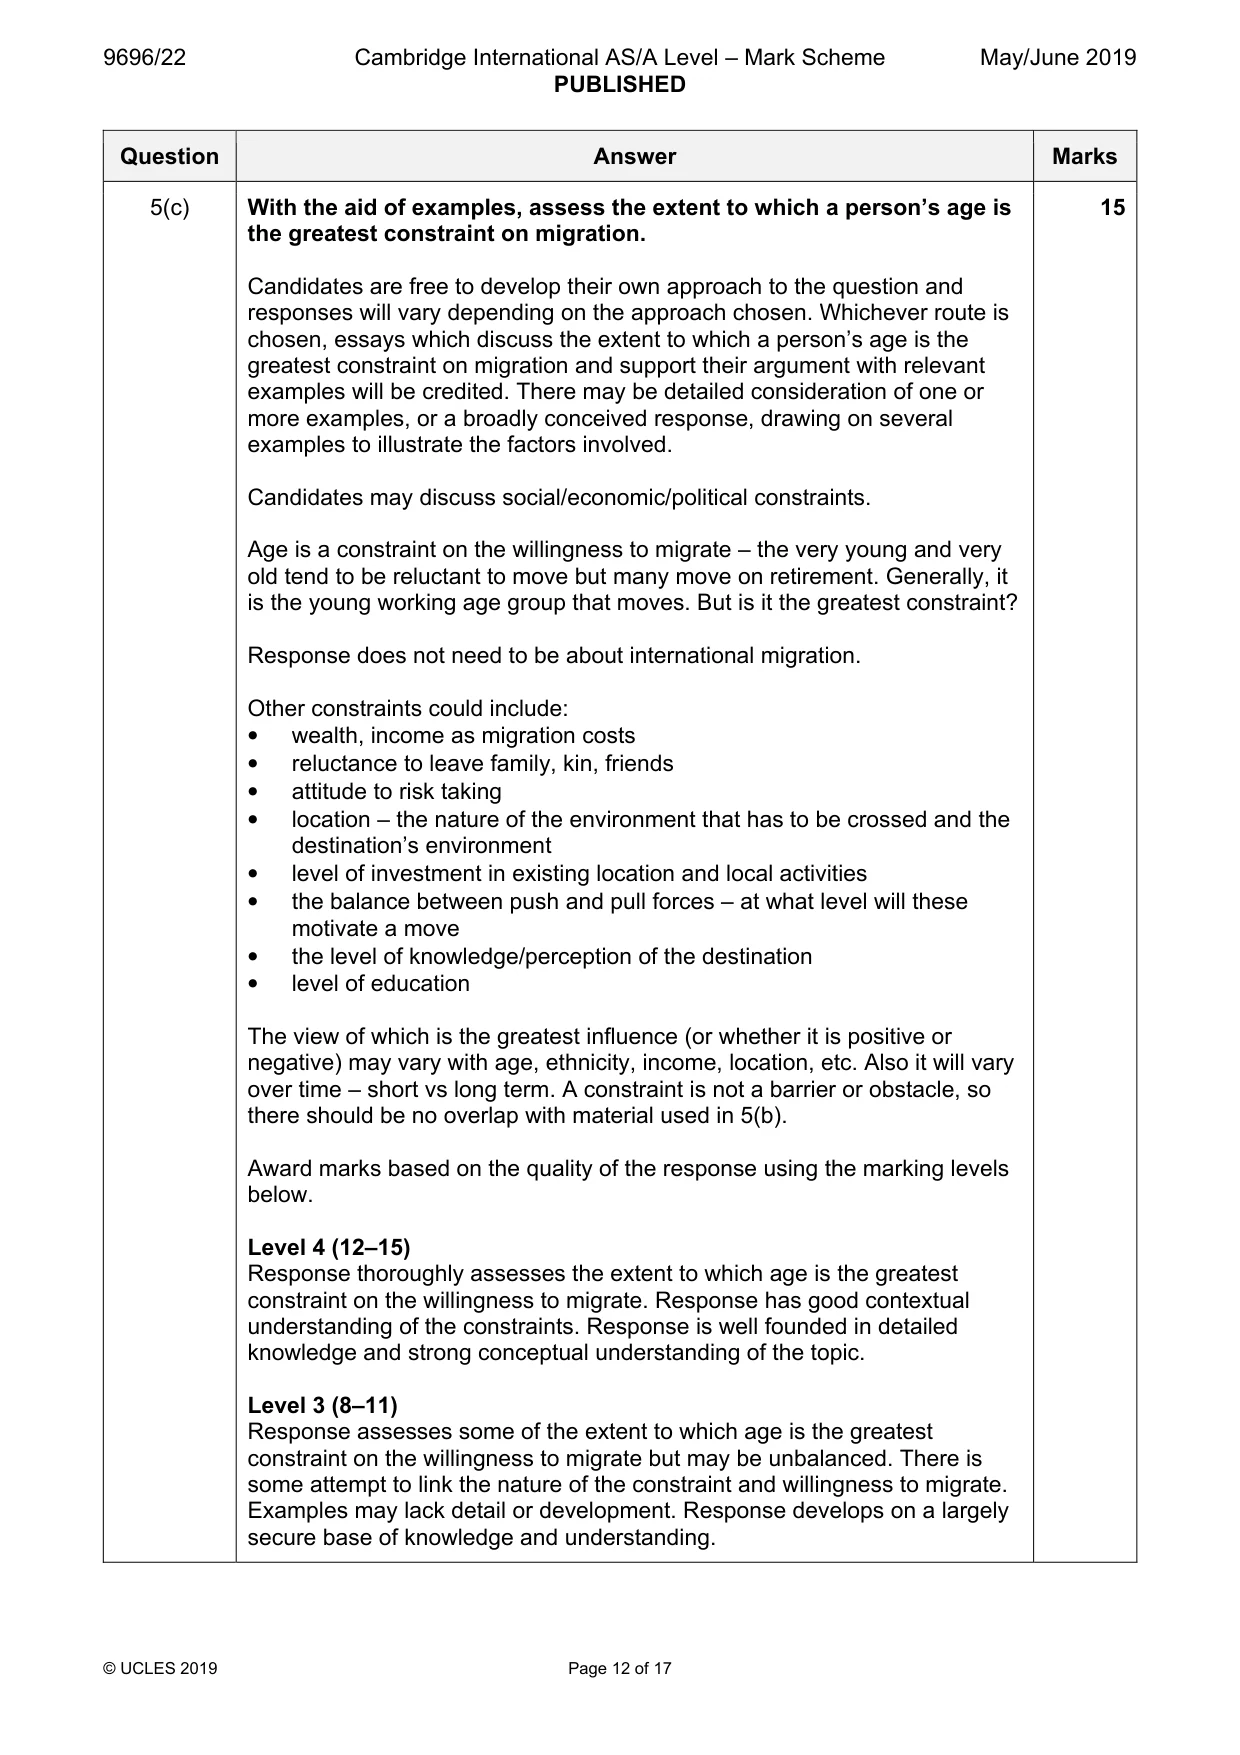
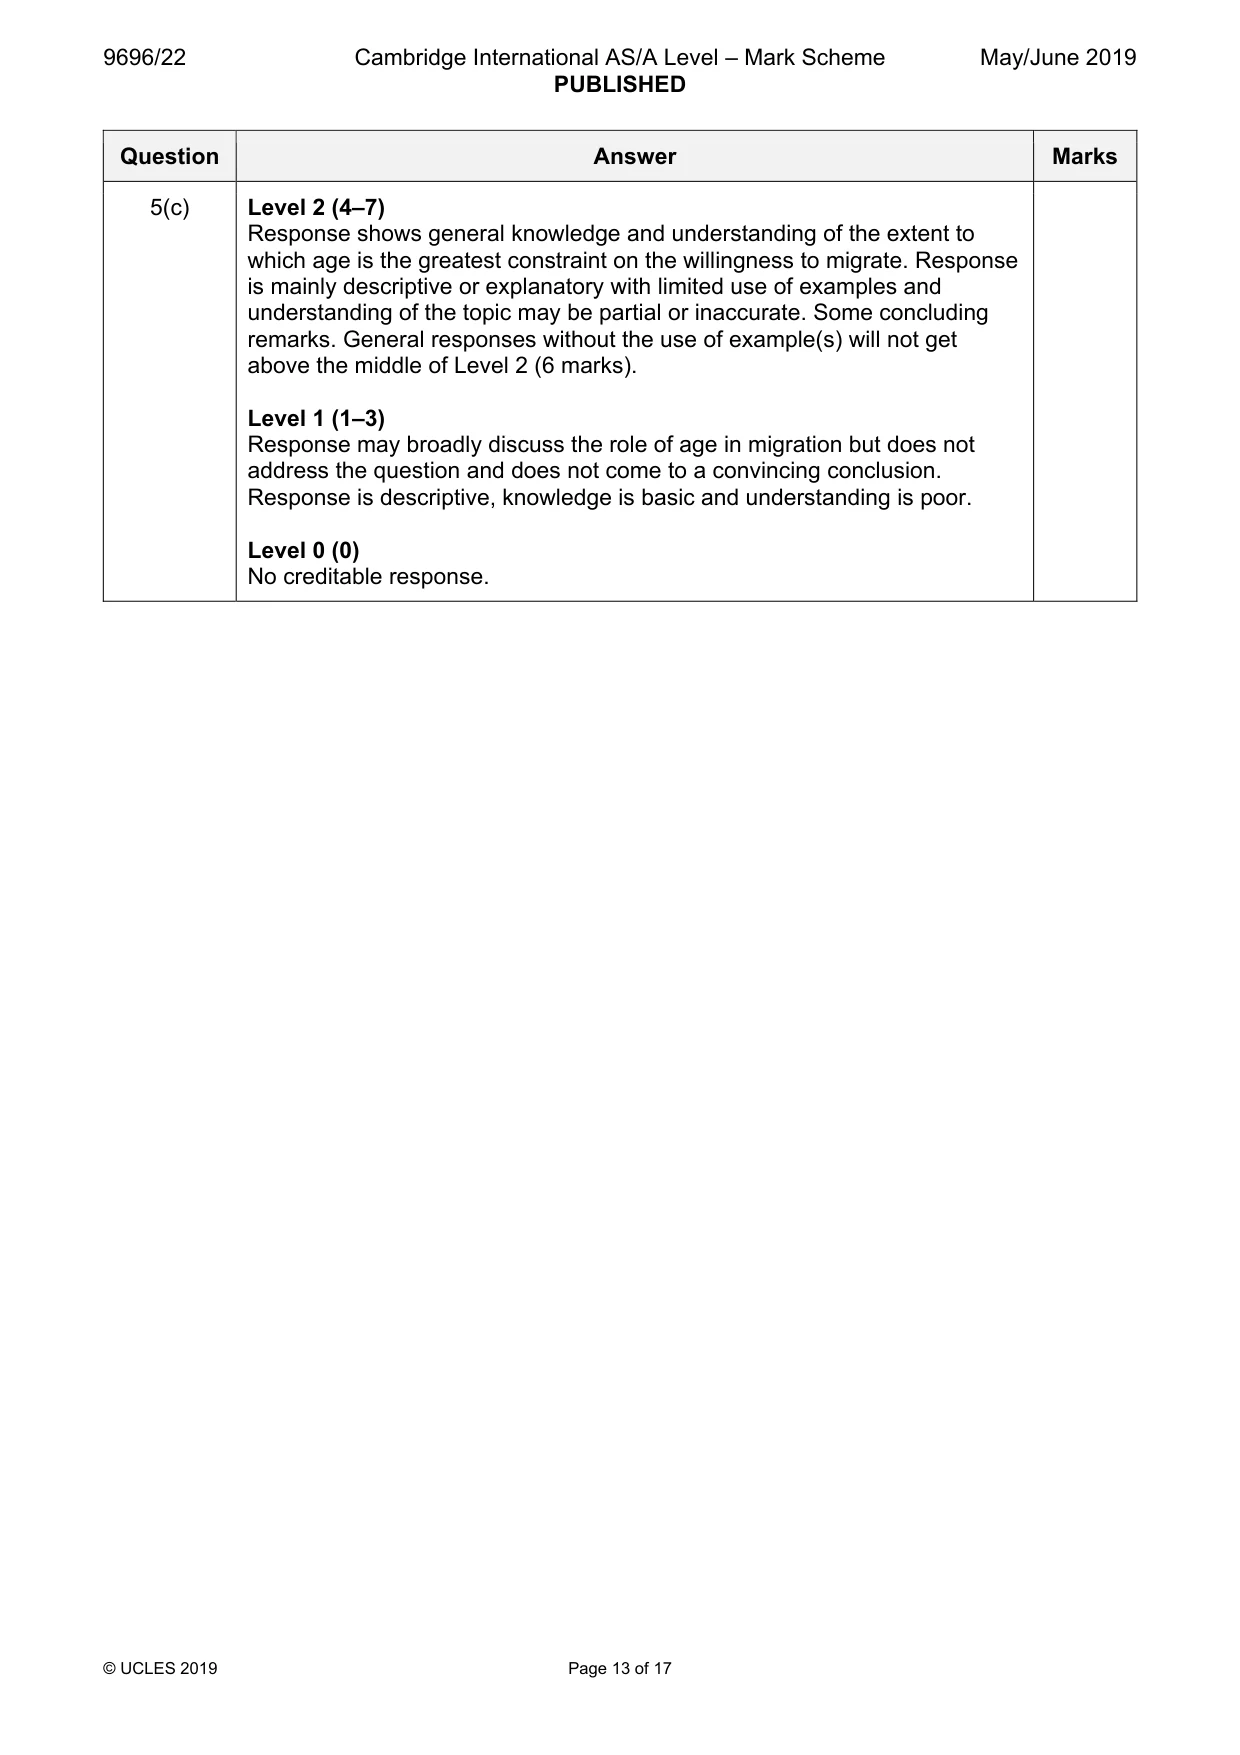
Mark scheme: 5(a) Describe how distance influences migration. 7 The syllabus refers to patterns of migration by distance. Distance is seen as a friction on movement so migration should decrease as the distance to the destination increases (distance decay). Description could include: • greater number of obstacles, barriers and intervening opportunities with distance • distance acts as a friction as it costs more and takes more time the greater it is • with distance the perception of pulls decreases, so fewer risk the move • distance may reduce the range of migrants to healthy young males • the greater the distance the more permanent the migration • cultural differences can be greater with distance Point mark such that 3 valid points with development (detail, examples, use of data) can achieve the maximum. There is no requirement or expectation to explain, but allow as development. 5(b) Explain the nature of obstacles and barriers, other than distance, that 8 limit migration. The syllabus refers to the role of constraints, obstacles and barriers – specifically cost and national borders. Candidates may concentrate on these, seeing them as both obstacles that can be overcome and barriers that may not be overcome. Explanation could include: • cost – including departure, travel and arrival costs. This may reduce the numbers migrating. Cost could also be in terms of opportunity costs, time, etc. • national borders – these vary in their permeability depending on political attitudes and level of clarity • natural obstacles/barriers such as rivers, mountains, deserts, etc. • social obstacles/barriers such as language, hostility, cultural differences • knowledge – or rather lack of it – about route/destination • availability or the nature of transport needed • inertia – the general reluctance to leave the known and familiar Award marks based on the quality of explanation and breadth of the response using the marking levels below. Level 3 (6–8) Response explains a range of obstacles and barriers that limit migration and makes clear links to how they limit migration. Response is well founded in detailed knowledge and strong conceptual understanding of the topic. Any examples used are appropriate and integrated effectively into the response. Level 2 (3–5) Response offers some explanation of obstacles and barriers that limit migration. Response develops on a largely secure base of knowledge and understanding. Examples may lack detail or development. Level 1 (1–2) Response is largely descriptive of the obstacles to migration. Knowledge is basic and understanding may be inaccurate. Examples are in name only or lacking entirely. Level 0 (0) No creditable response. 5(c) With the aid of examples, assess the extent to which a person’s age is 15 the greatest constraint on migration. Candidates are free to develop their own approach to the question and responses will vary depending on the approach chosen. Whichever route is chosen, essays which discuss the extent to which a person’s age is the greatest constraint on migration and support their argument with relevant examples will be credited. There may be detailed consideration of one or more examples, or a broadly conceived response, drawing on several examples to illustrate the factors involved. Candidates may discuss social/economic/political constraints. Age is a constraint on the willingness to migrate – the very young and very old tend to be reluctant to move but many move on retirement. Generally, it is the young working age group that moves. But is it the greatest constraint? Response does not need to be about international migration. Other constraints could include: • wealth, income as migration costs • reluctance to leave family, kin, friends • attitude to risk taking • location – the nature of the environment that has to be crossed and the destination’s environment • level of investment in existing location and local activities • the balance between push and pull forces – at what level will these motivate a move • the level of knowledge/perception of the destination • level of education The view of which is the greatest influence (or whether it is positive or negative) may vary with age, ethnicity, income, location, etc. Also it will vary over time – short vs long term. A constraint is not a barrier or obstacle, so there should be no overlap with material used in 5(b). Award marks based on the quality of the response using the marking levels below. Level 4 (12–15) Response thoroughly assesses the extent to which age is the greatest constraint on the willingness to migrate. Response has good contextual understanding of the constraints. Response is well founded in detailed knowledge and strong conceptual understanding of the topic. Level 3 (8–11) Response assesses some of the extent to which age is the greatest constraint on the willingness to migrate but may be unbalanced. There is some attempt to link the nature of the constraint and willingness to migrate. Examples may lack detail or development. Response develops on a largely secure base of knowledge and understanding. 5(c) Level 2 (4–7) Response shows general knowledge and understanding of the extent to which age is the greatest constraint on the willingness to migrate. Response is mainly descriptive or explanatory with limited use of examples and understanding of the topic may be partial or inaccurate. Some concluding remarks. General responses without the use of example(s) will not get above the middle of Level 2 (6 marks). Level 1 (1–3) Response may broadly discuss the role of age in migration but does not address the question and does not come to a convincing conclusion. Response is descriptive, knowledge is basic and understanding is poor. Level 0 (0) No creditable response. Migration/Settlement dynamics
Q6 · Explain why the population of some cities is decreasing
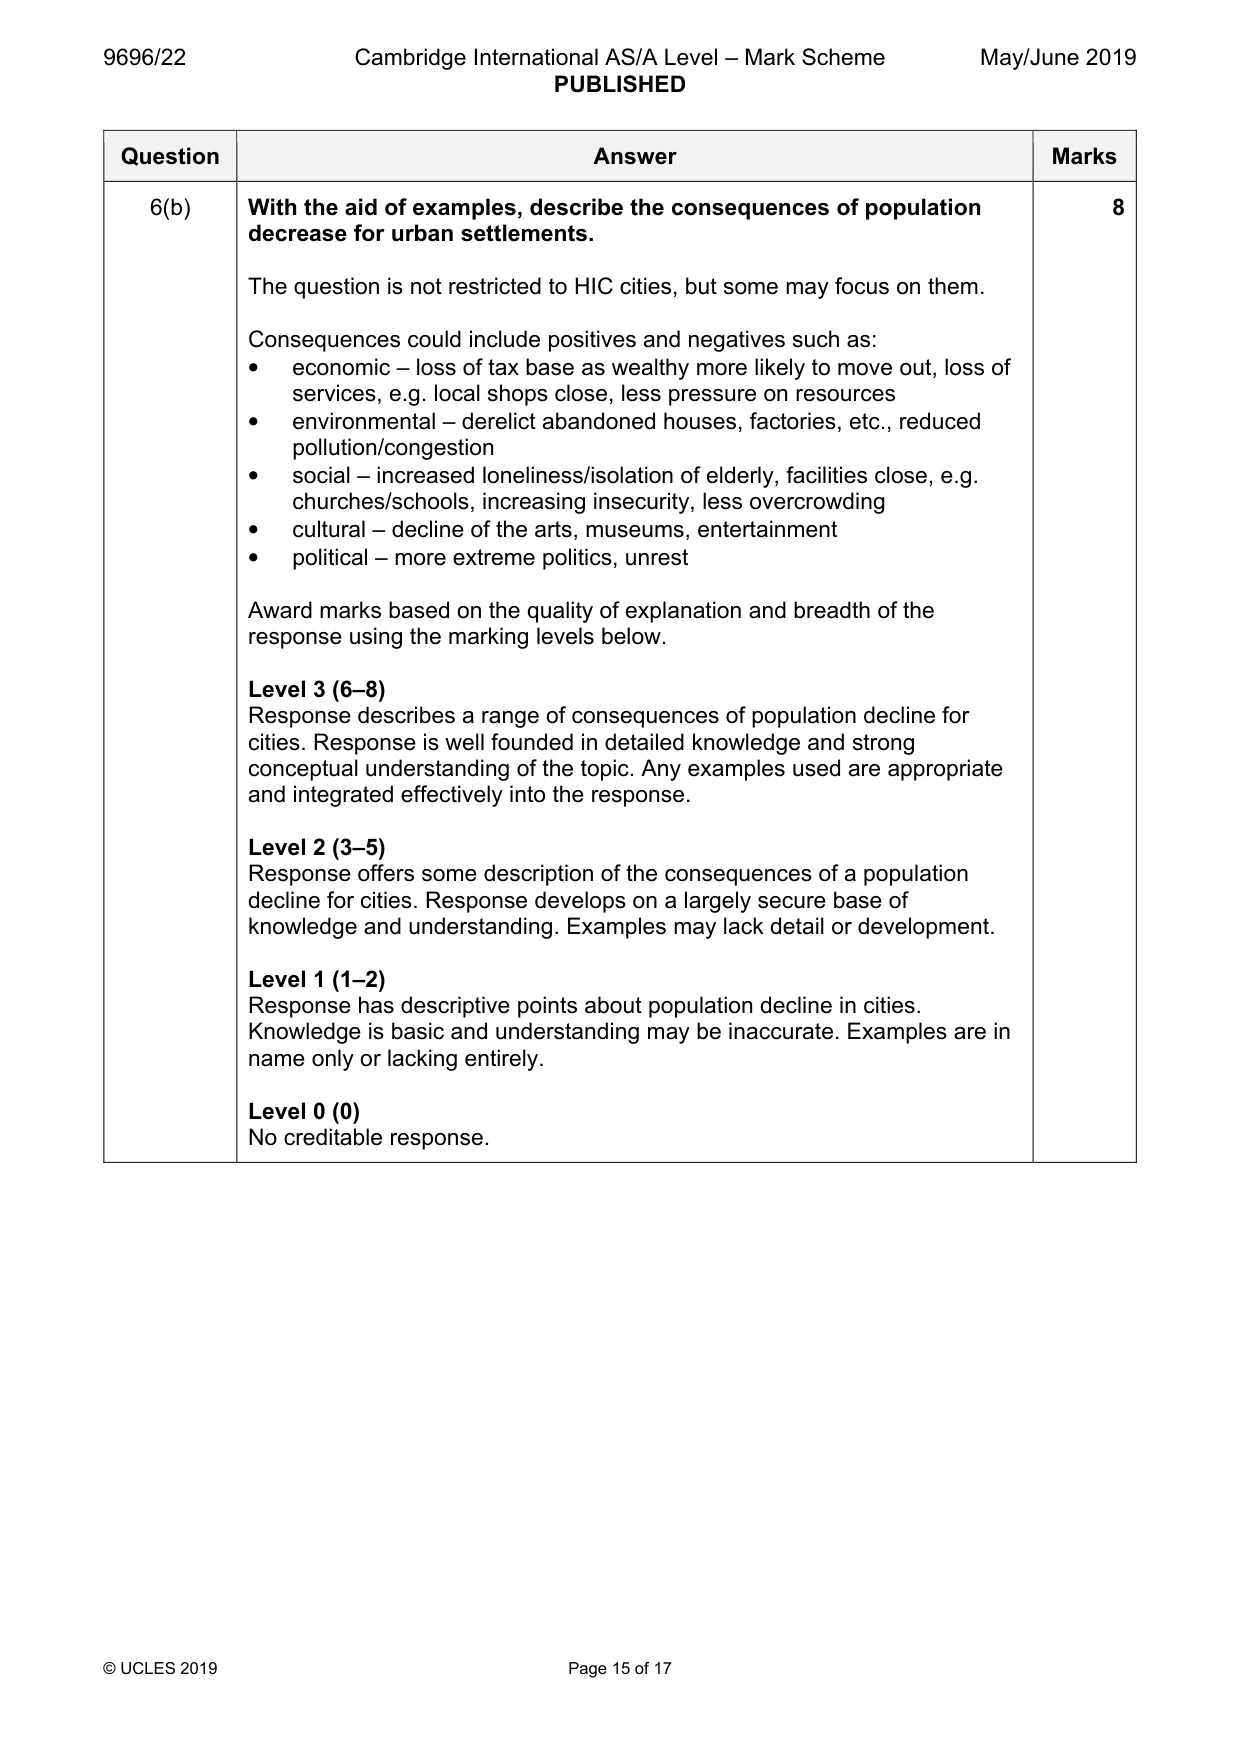
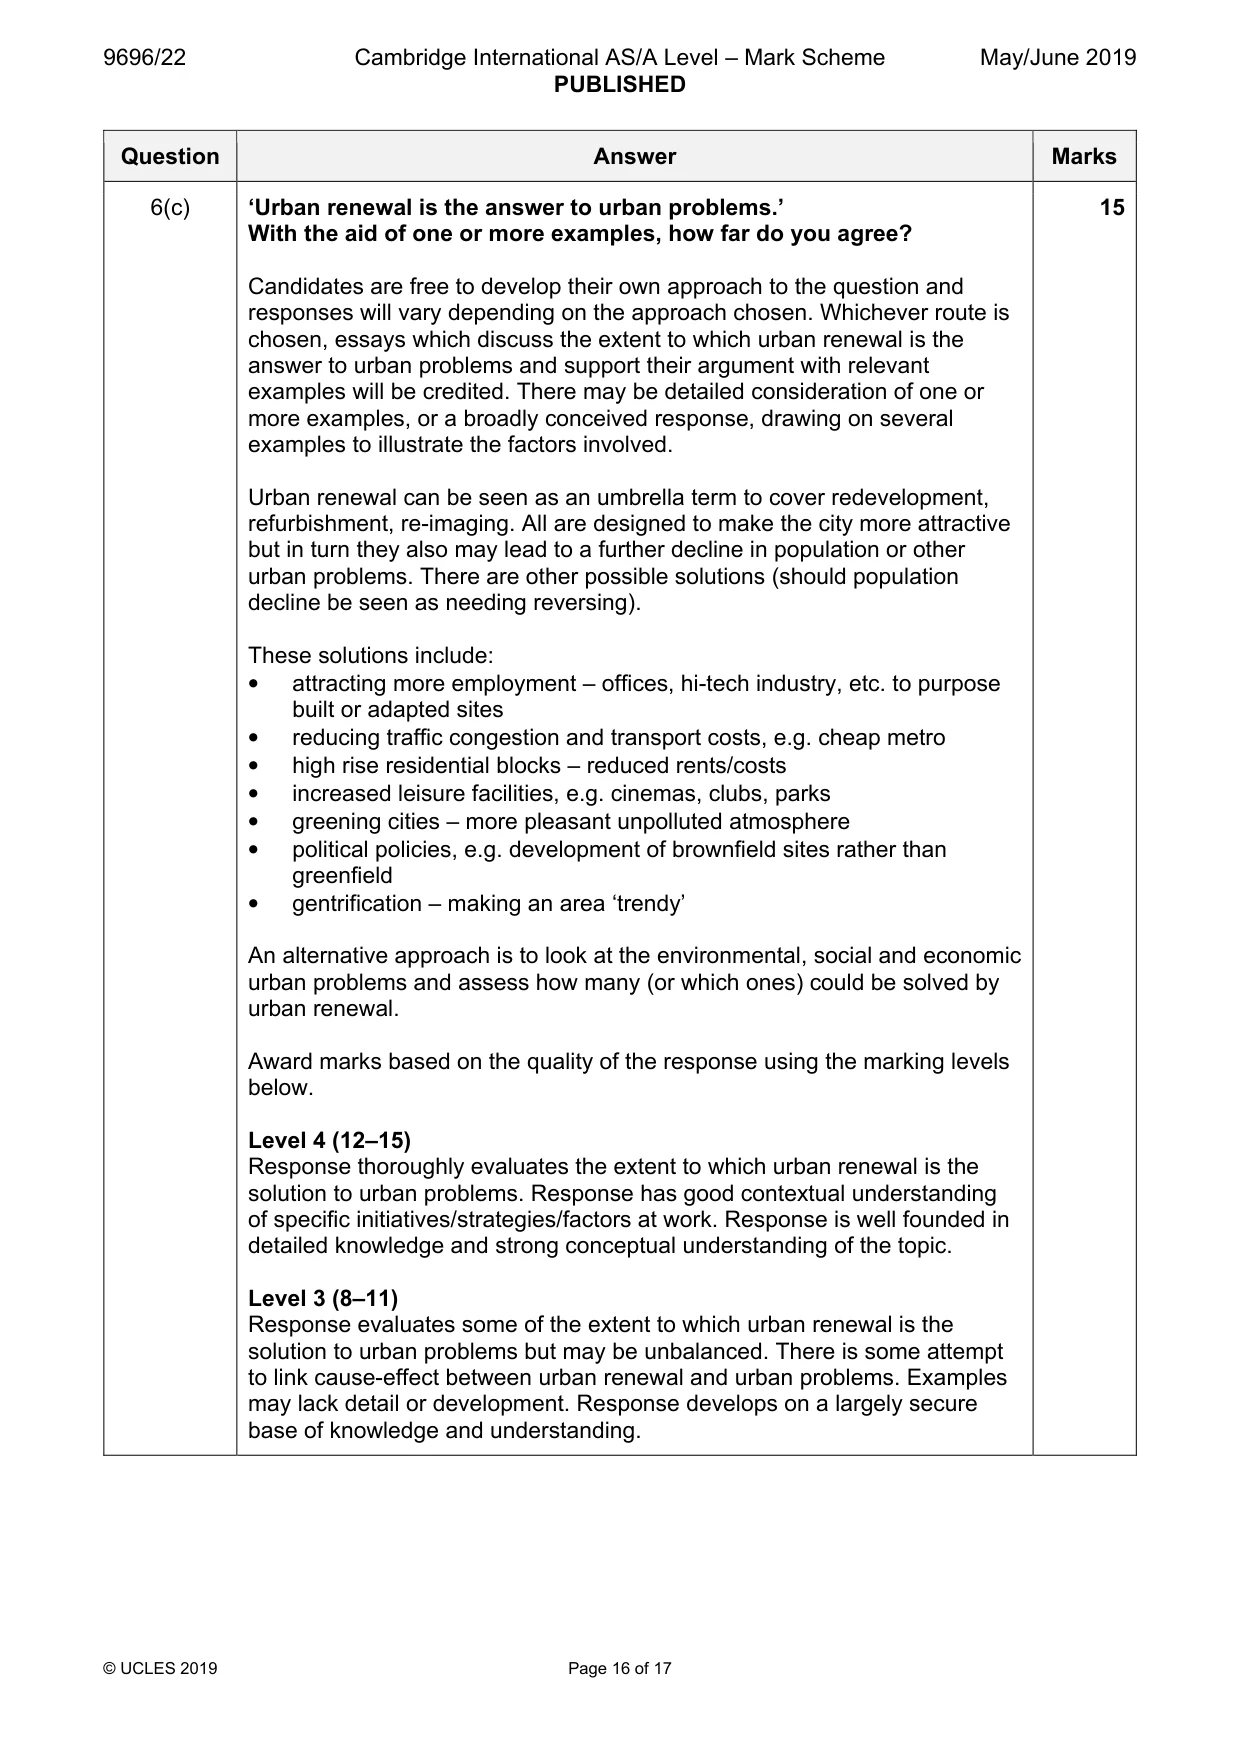
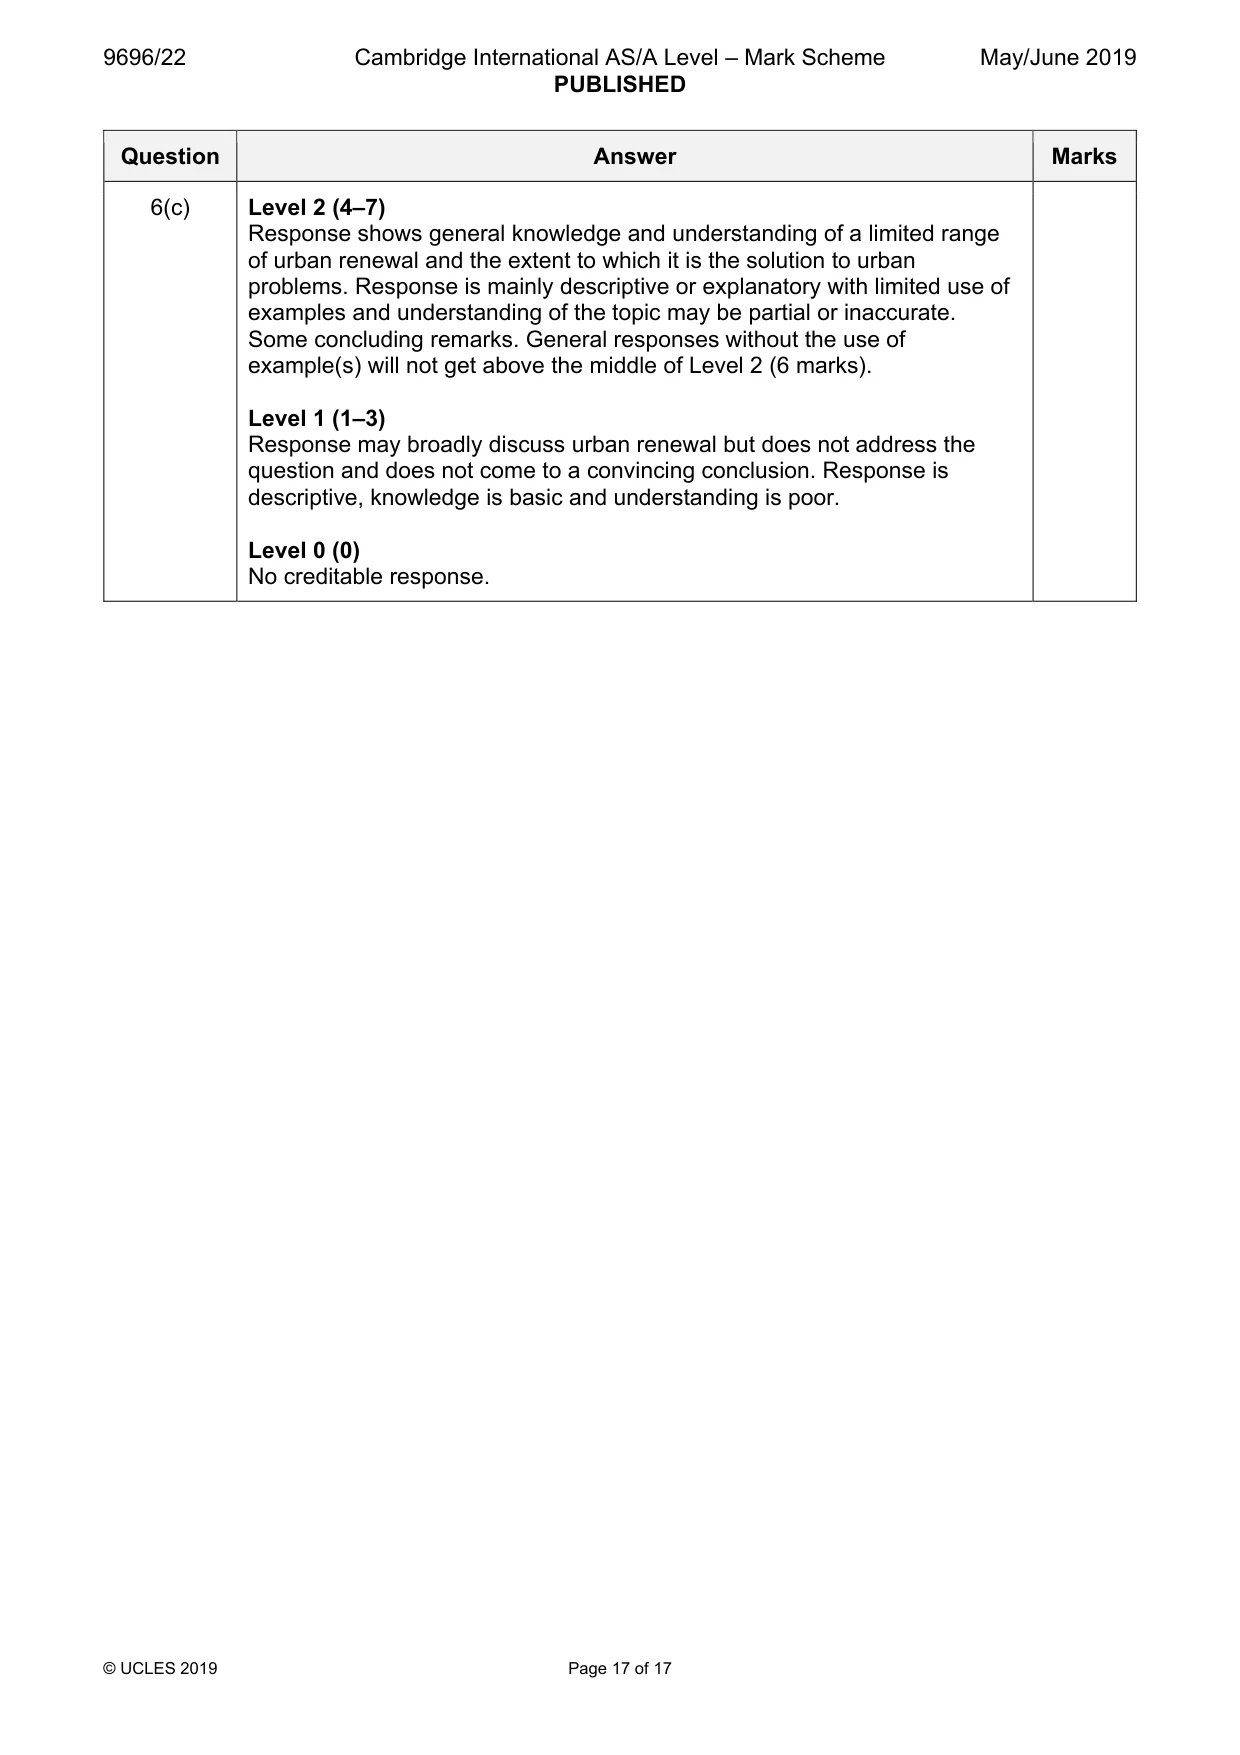
6 (a) Explain why the population of some cities is decreasing. [7] (b) With the aid of examples, describe the consequences of population decrease for urban settlements. [8] (c) ‘Urban renewal is the answer to urban problems.’ With the aid of one or more examples, how far do you agree? [15] [Total: 30]
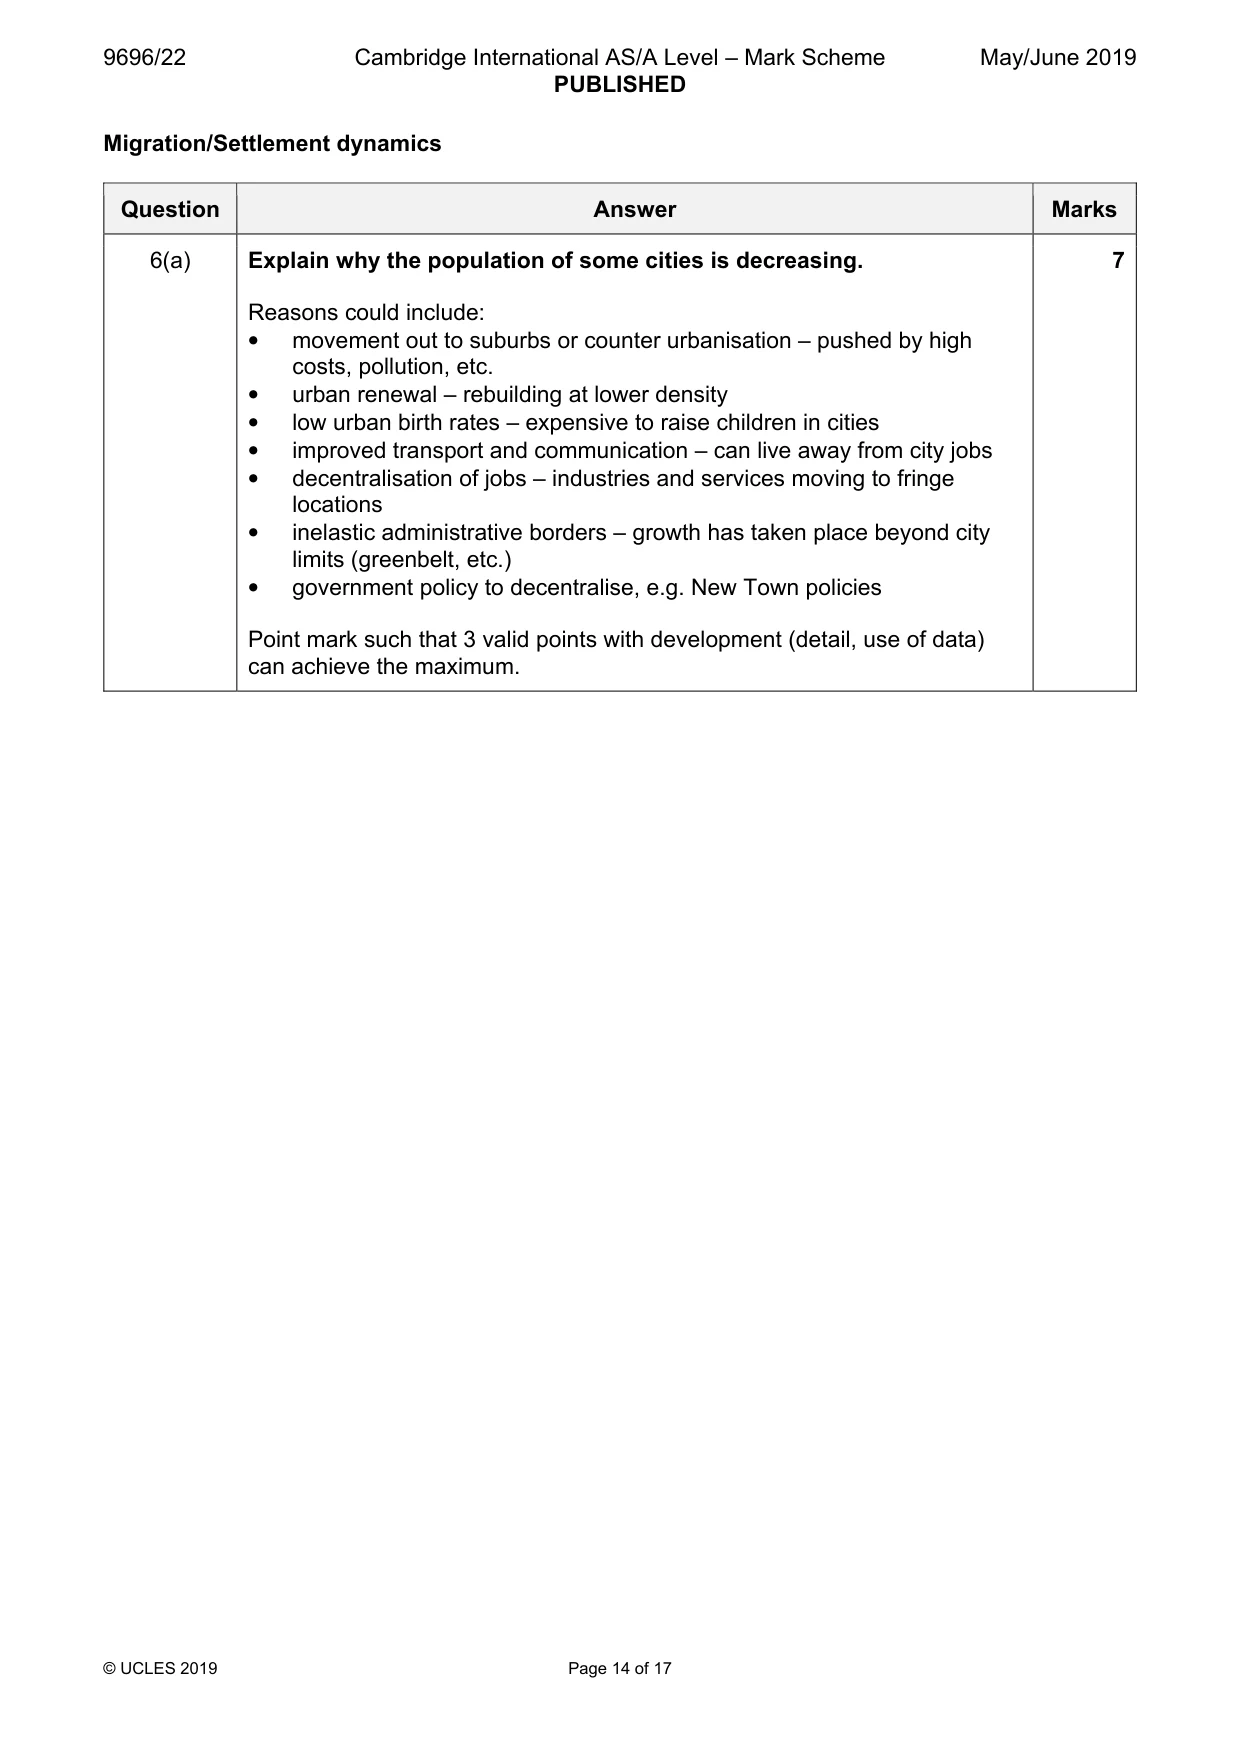
Mark scheme: 6(a) Explain why the population of some cities is decreasing. 7 Reasons could include: • movement out to suburbs or counter urbanisation – pushed by high costs, pollution, etc. • urban renewal – rebuilding at lower density • low urban birth rates – expensive to raise children in cities • improved transport and communication – can live away from city jobs • decentralisation of jobs – industries and services moving to fringe locations • inelastic administrative borders – growth has taken place beyond city limits (greenbelt, etc.) • government policy to decentralise, e.g. New Town policies Point mark such that 3 valid points with development (detail, use of data) can achieve the maximum. 6(b) With the aid of examples, describe the consequences of population 8 decrease for urban settlements. The question is not restricted to HIC cities, but some may focus on them. Consequences could include positives and negatives such as: • economic – loss of tax base as wealthy more likely to move out, loss of services, e.g. local shops close, less pressure on resources • environmental – derelict abandoned houses, factories, etc., reduced pollution/congestion • social – increased loneliness/isolation of elderly, facilities close, e.g. churches/schools, increasing insecurity, less overcrowding • cultural – decline of the arts, museums, entertainment • political – more extreme politics, unrest Award marks based on the quality of explanation and breadth of the response using the marking levels below. Level 3 (6–8) Response describes a range of consequences of population decline for cities. Response is well founded in detailed knowledge and strong conceptual understanding of the topic. Any examples used are appropriate and integrated effectively into the response. Level 2 (3–5) Response offers some description of the consequences of a population decline for cities. Response develops on a largely secure base of knowledge and understanding. Examples may lack detail or development. Level 1 (1–2) Response has descriptive points about population decline in cities. Knowledge is basic and understanding may be inaccurate. Examples are in name only or lacking entirely. Level 0 (0) No creditable response. 6(c) ‘Urban renewal is the answer to urban problems.’ 15 With the aid of one or more examples, how far do you agree? Candidates are free to develop their own approach to the question and responses will vary depending on the approach chosen. Whichever route is chosen, essays which discuss the extent to which urban renewal is the answer to urban problems and support their argument with relevant examples will be credited. There may be detailed consideration of one or more examples, or a broadly conceived response, drawing on several examples to illustrate the factors involved. Urban renewal can be seen as an umbrella term to cover redevelopment, refurbishment, re-imaging. All are designed to make the city more attractive but in turn they also may lead to a further decline in population or other urban problems. There are other possible solutions (should population decline be seen as needing reversing). These solutions include: • attracting more employment – offices, hi-tech industry, etc. to purpose built or adapted sites • reducing traffic congestion and transport costs, e.g. cheap metro • high rise residential blocks – reduced rents/costs • increased leisure facilities, e.g. cinemas, clubs, parks • greening cities – more pleasant unpolluted atmosphere • political policies, e.g. development of brownfield sites rather than greenfield • gentrification – making an area ‘trendy’ An alternative approach is to look at the environmental, social and economic urban problems and assess how many (or which ones) could be solved by urban renewal. Award marks based on the quality of the response using the marking levels below. Level 4 (12–15) Response thoroughly evaluates the extent to which urban renewal is the solution to urban problems. Response has good contextual understanding of specific initiatives/strategies/factors at work. Response is well founded in detailed knowledge and strong conceptual understanding of the topic. Level 3 (8–11) Response evaluates some of the extent to which urban renewal is the solution to urban problems but may be unbalanced. There is some attempt to link cause-effect between urban renewal and urban problems. Examples may lack detail or development. Response develops on a largely secure base of knowledge and understanding. 6(c) Level 2 (4–7) Response shows general knowledge and understanding of a limited range of urban renewal and the extent to which it is the solution to urban problems. Response is mainly descriptive or explanatory with limited use of examples and understanding of the topic may be partial or inaccurate. Some concluding remarks. General responses without the use of example(s) will not get above the middle of Level 2 (6 marks). Level 1 (1–3) Response may broadly discuss urban renewal but does not address the question and does not come to a convincing conclusion. Response is descriptive, knowledge is basic and understanding is poor. Level 0 (0) No creditable response.
What was in this paper
The subtopics covered by these 6 questions, and how many questions each got. Open one in a new tab to see every Cambridge question on it.
What you needed in this session
Cambridge’s own grade thresholds for 2019 May/June, Paper 2 · Variant 2. A higher threshold means an easier paper — the bar moves with how the cohort did.