Cambridge A Level Geography 9696 — 2019 May/June Paper 2 · Variant 3
9696/23/M/J/19 · 6 questions · 60 marks · ≈68 min
The question paper and its mark scheme, free to read here and free to download. This is Cambridge’s own paper, exactly as it was sat.
Question paper4 pages
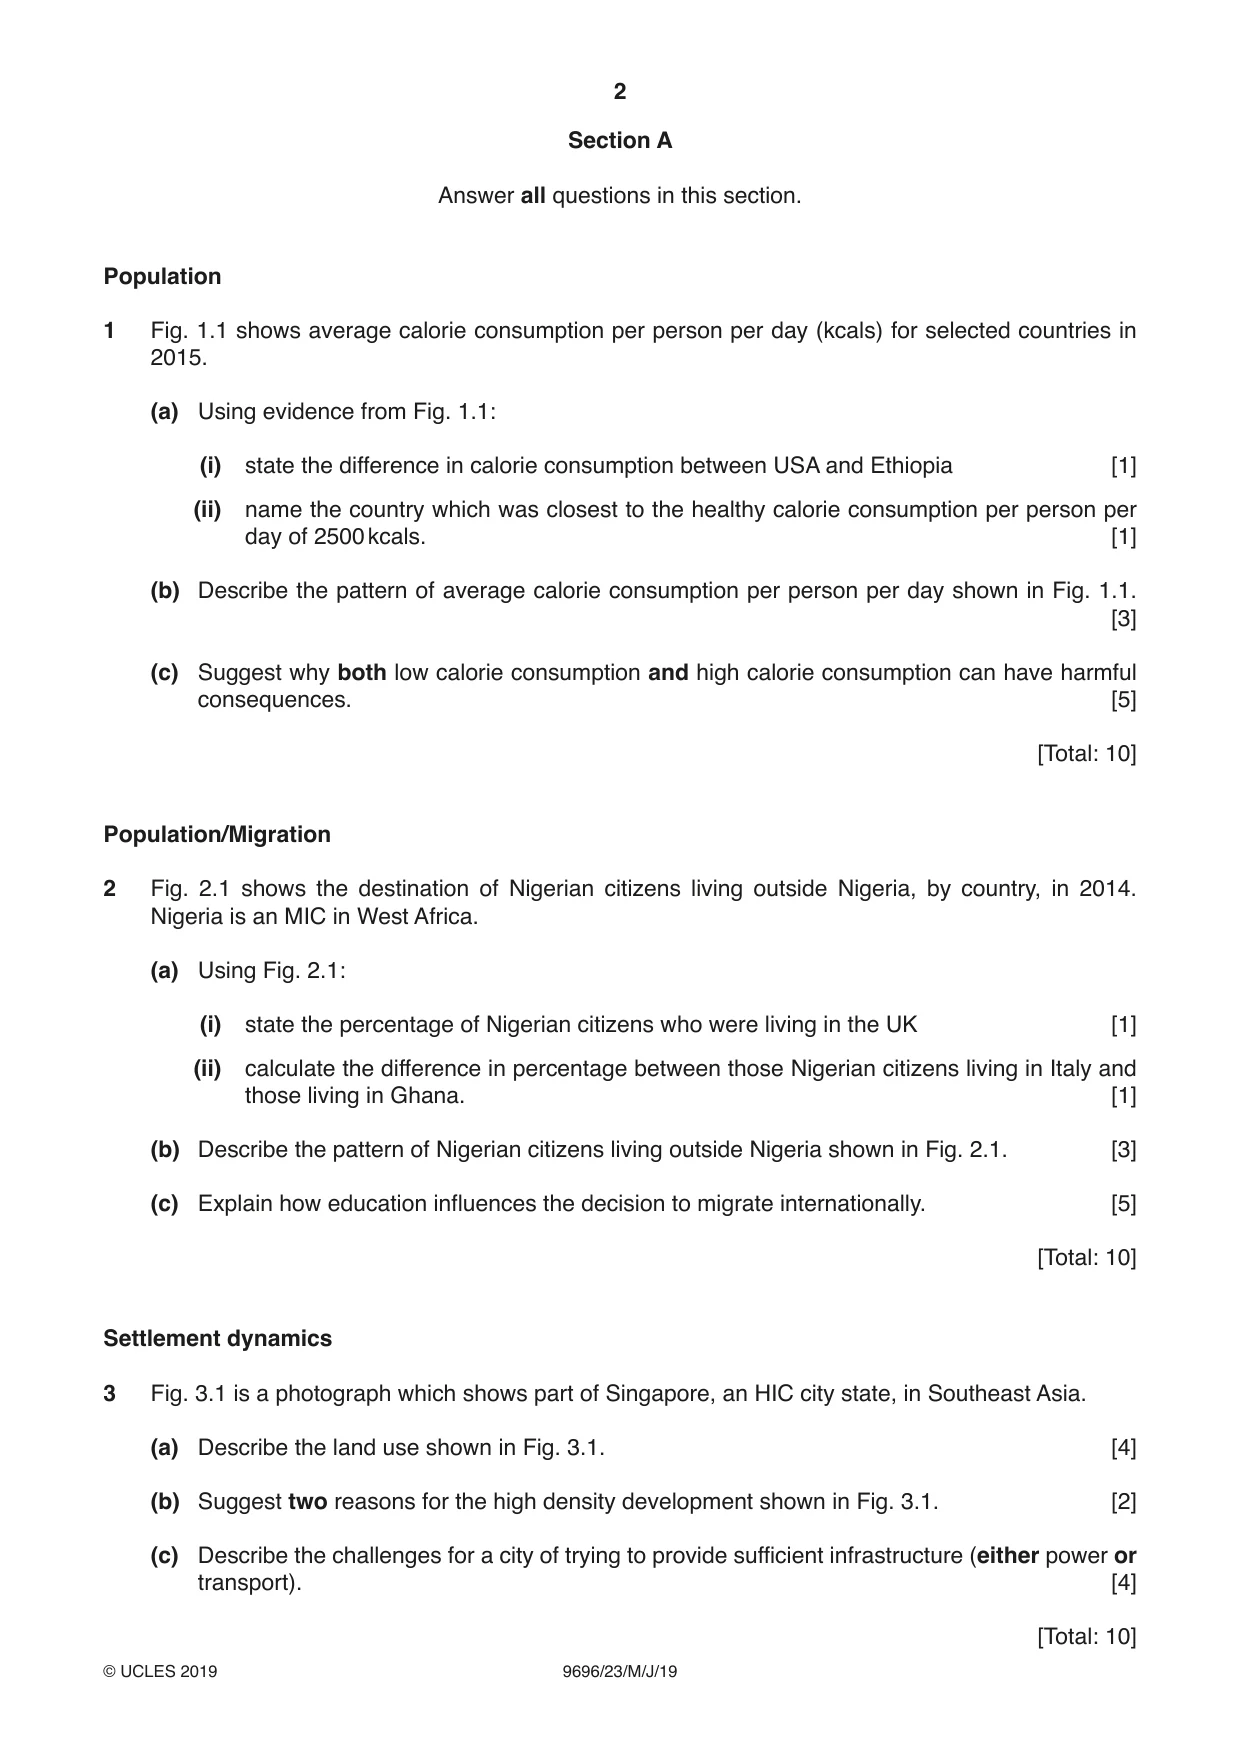
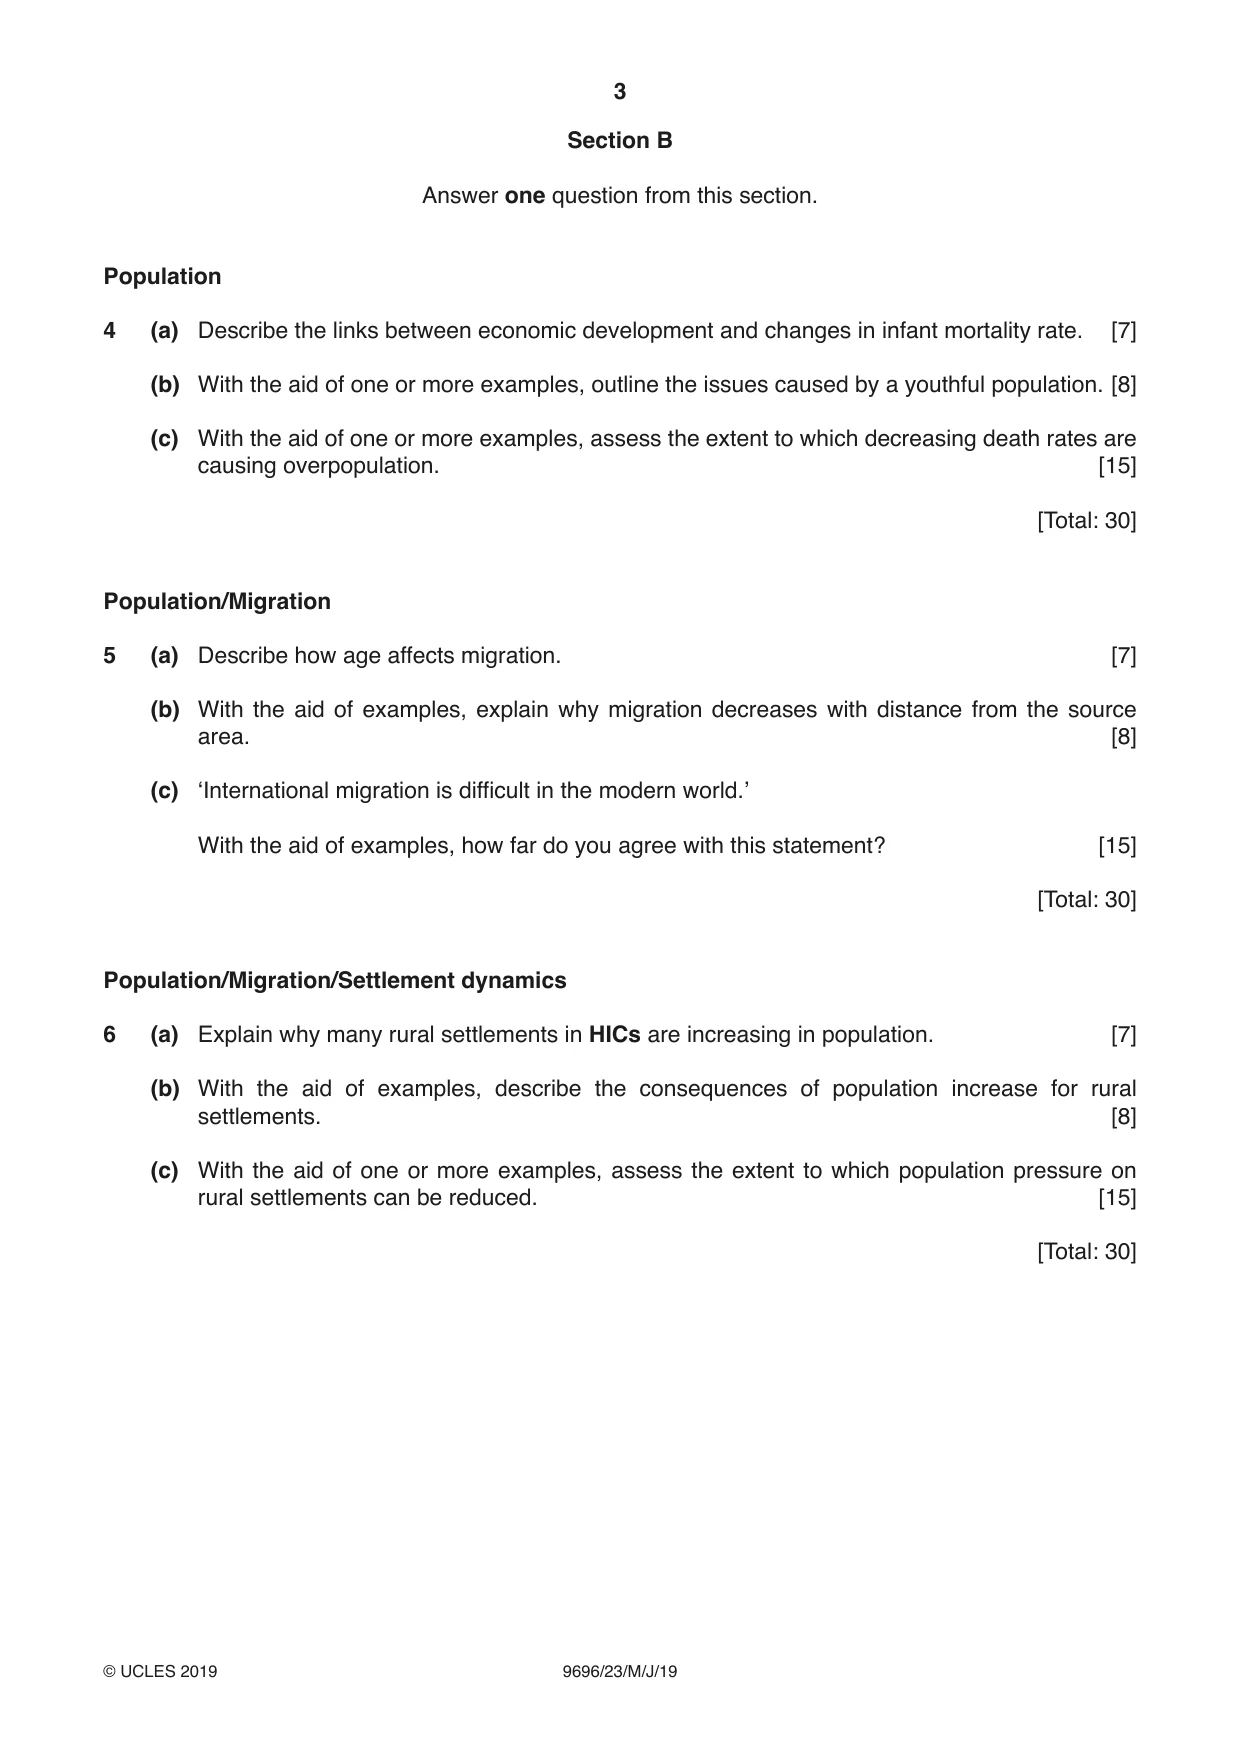

Mark scheme16 pages
Answers below. Sit the paper first if you are practising.


Questions as text
Q1 · Average calorie consumption per person per day (kcals) for selected countries in 2015
1 Fig. 1.1 shows average calorie consumption per person per day (kcals) for selected countries in 2015. (a) Using evidence from Fig. 1.1: (i) state the difference in calorie consumption between USA and Ethiopia [1] (ii) name the country which was closest to the healthy calorie consumption per person per day of 2500 kcals. [1] (b) Describe the pattern of average calorie consumption per person per day shown in Fig. 1.1. [3] (c) Suggest why both low calorie consumption and high calorie consumption can have harmful consequences. [5] [Total: 10] Population/Migration
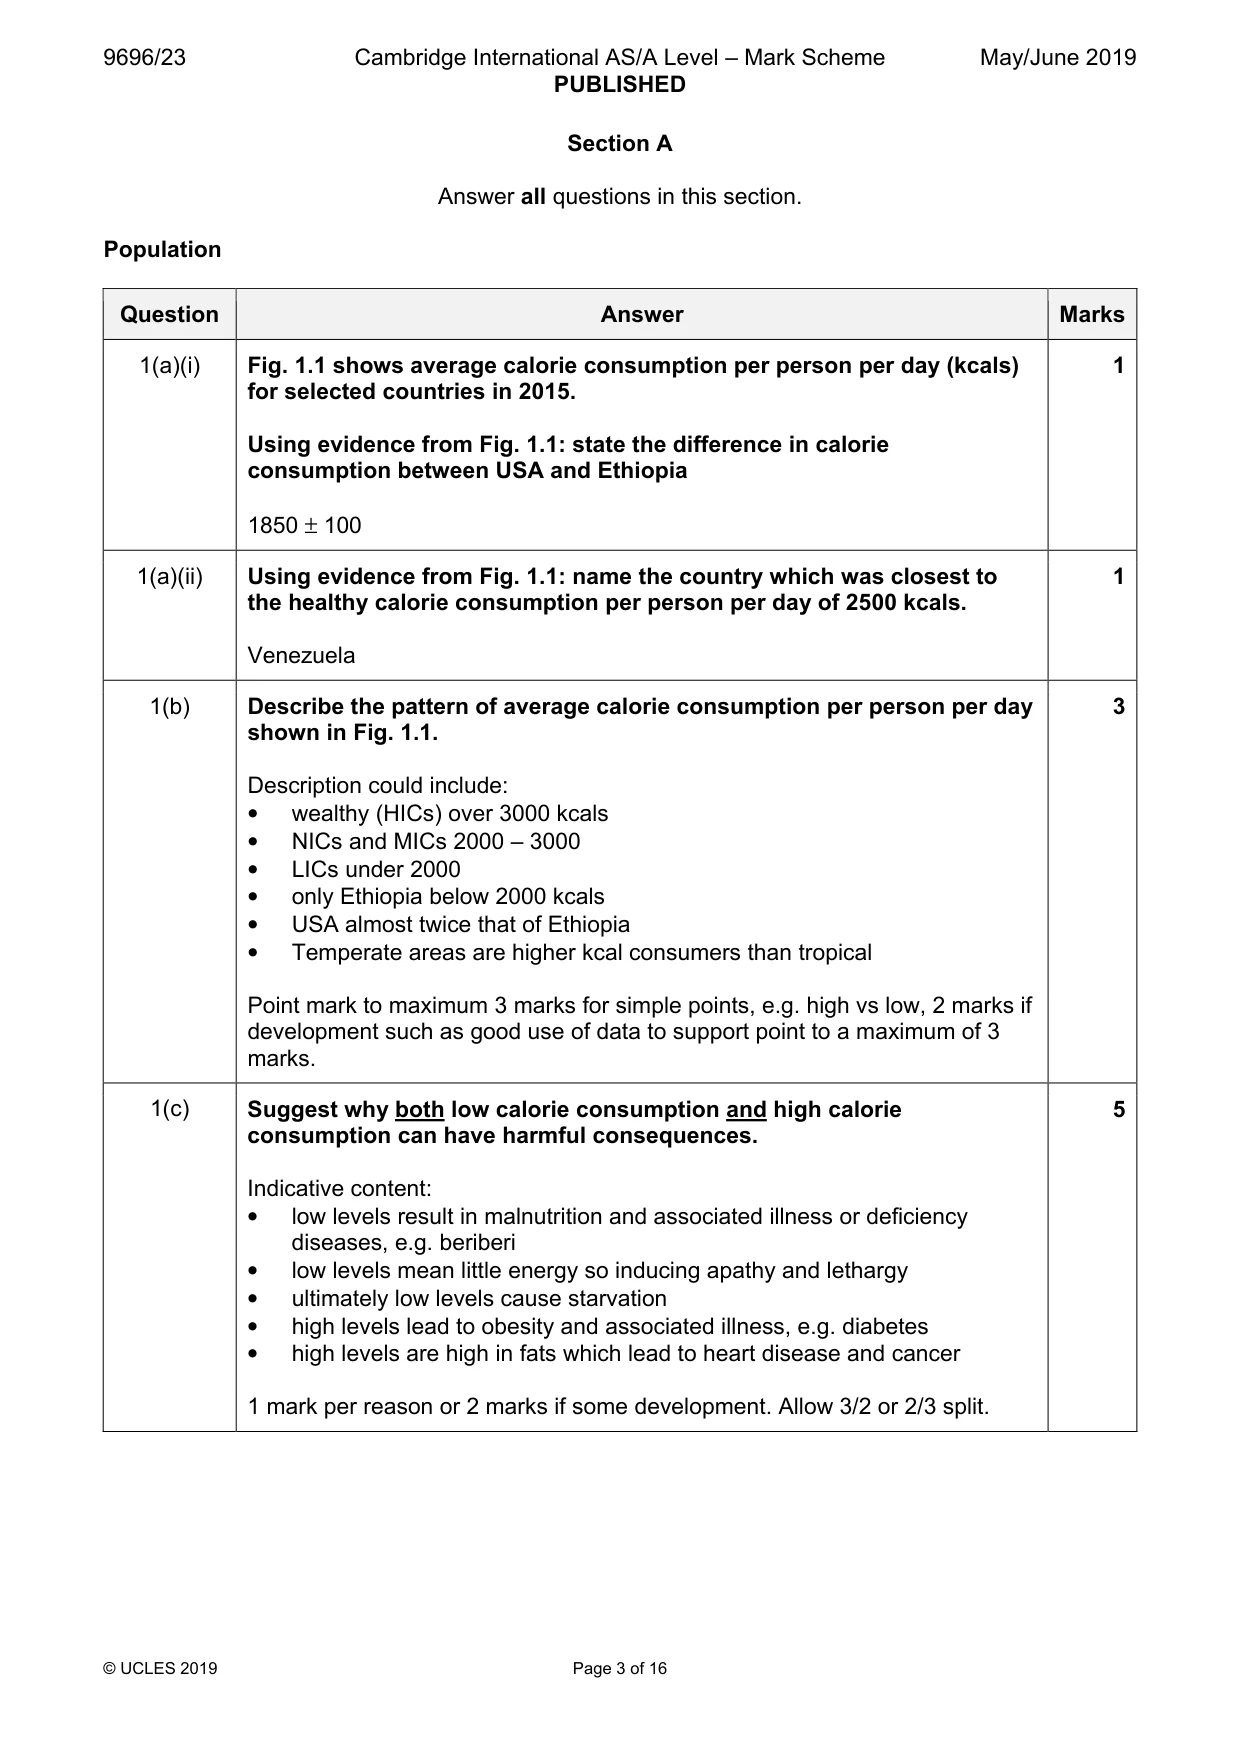
Mark scheme: Question Answer Marks 1(a)(i) Fig. 1.1 shows average calorie consumption per person per day (kcals) 1 for selected countries in 2015. Using evidence from Fig. 1.1: state the difference in calorie consumption between USA and Ethiopia 1850 ± 100 1(a)(ii) Using evidence from Fig. 1.1: name the country which was closest to 1 the healthy calorie consumption per person per day of 2500 kcals. Venezuela 1(b) Describe the pattern of average calorie consumption per person per day 3 shown in Fig. 1.1. Description could include: • wealthy (HICs) over 3000 kcals • NICs and MICs 2000 – 3000 • LICs under 2000 • only Ethiopia below 2000 kcals • USA almost twice that of Ethiopia • Temperate areas are higher kcal consumers than tropical Point mark to maximum 3 marks for simple points, e.g. high vs low, 2 marks if development such as good use of data to support point to a maximum of 3 marks. 1(c) Suggest why both low calorie consumption and high calorie 5 consumption can have harmful consequences. Indicative content: • low levels result in malnutrition and associated illness or deficiency diseases, e.g. beriberi • low levels mean little energy so inducing apathy and lethargy • ultimately low levels cause starvation • high levels lead to obesity and associated illness, e.g. diabetes • high levels are high in fats which lead to heart disease and cancer 1 mark per reason or 2 marks if some development. Allow 3/2 or 2/3 split. Population/Migration
Q2 · The destination of Nigerian citizens living outside Nigeria, by country, in 2014
2 Fig. 2.1 shows the destination of Nigerian citizens living outside Nigeria, by country, in 2014. Nigeria is an MIC in West Africa. (a) Using Fig. 2.1: (i) state the percentage of Nigerian citizens who were living in the UK [1] (ii) calculate the difference in percentage between those Nigerian citizens living in Italy and those living in Ghana. [1] (b) Describe the pattern of Nigerian citizens living outside Nigeria shown in Fig. 2.1. [3] (c) Explain how education influences the decision to migrate internationally. [5] [Total: 10] Settlement dynamics
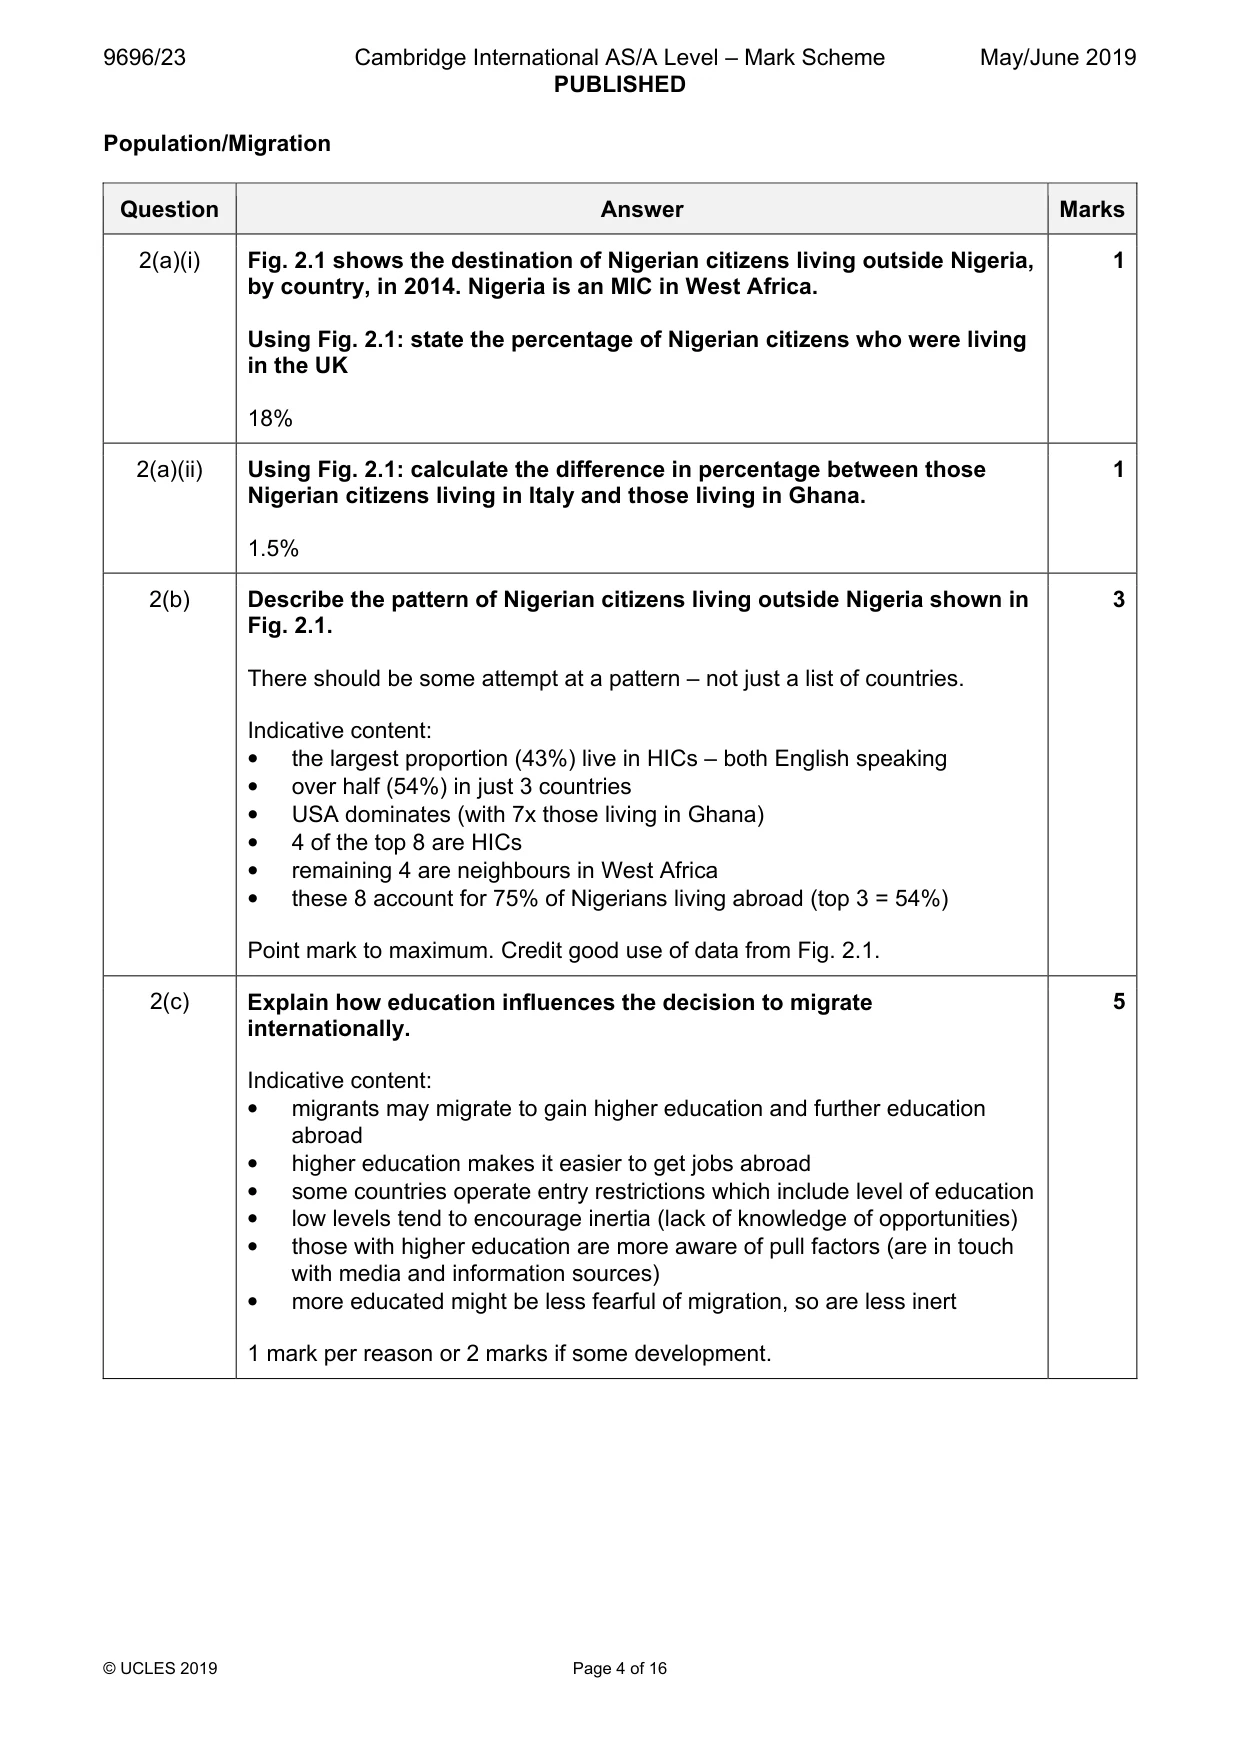
Mark scheme: 2(a)(i) Fig. 2.1 shows the destination of Nigerian citizens living outside Nigeria, 1 by country, in 2014. Nigeria is an MIC in West Africa. Using Fig. 2.1: state the percentage of Nigerian citizens who were living in the UK 18% 2(a)(ii) Using Fig. 2.1: calculate the difference in percentage between those 1 Nigerian citizens living in Italy and those living in Ghana. 1.5% 2(b) Describe the pattern of Nigerian citizens living outside Nigeria shown in 3 Fig. 2.1. There should be some attempt at a pattern – not just a list of countries. Indicative content: • the largest proportion (43%) live in HICs – both English speaking • over half (54%) in just 3 countries • USA dominates (with 7x those living in Ghana) • 4 of the top 8 are HICs • remaining 4 are neighbours in West Africa • these 8 account for 75% of Nigerians living abroad (top 3 = 54%) Point mark to maximum. Credit good use of data from Fig. 2.1. 2(c) Explain how education influences the decision to migrate 5 internationally. Indicative content: • migrants may migrate to gain higher education and further education abroad • higher education makes it easier to get jobs abroad • some countries operate entry restrictions which include level of education • low levels tend to encourage inertia (lack of knowledge of opportunities) • those with higher education are more aware of pull factors (are in touch with media and information sources) • more educated might be less fearful of migration, so are less inert 1 mark per reason or 2 marks if some development. Settlement dynamics
Q3 · A photograph which shows part of Singapore, an HIC city state, in Southeast Asia
3 Fig. 3.1 is a photograph which shows part of Singapore, an HIC city state, in Southeast Asia. (a) Describe the land use shown in Fig. 3.1. [4] (b) Suggest two reasons for the high density development shown in Fig. 3.1. [2] (c) Describe the challenges for a city of trying to provide sufficient infrastructure (either power or transport). [4] [Total: 10]
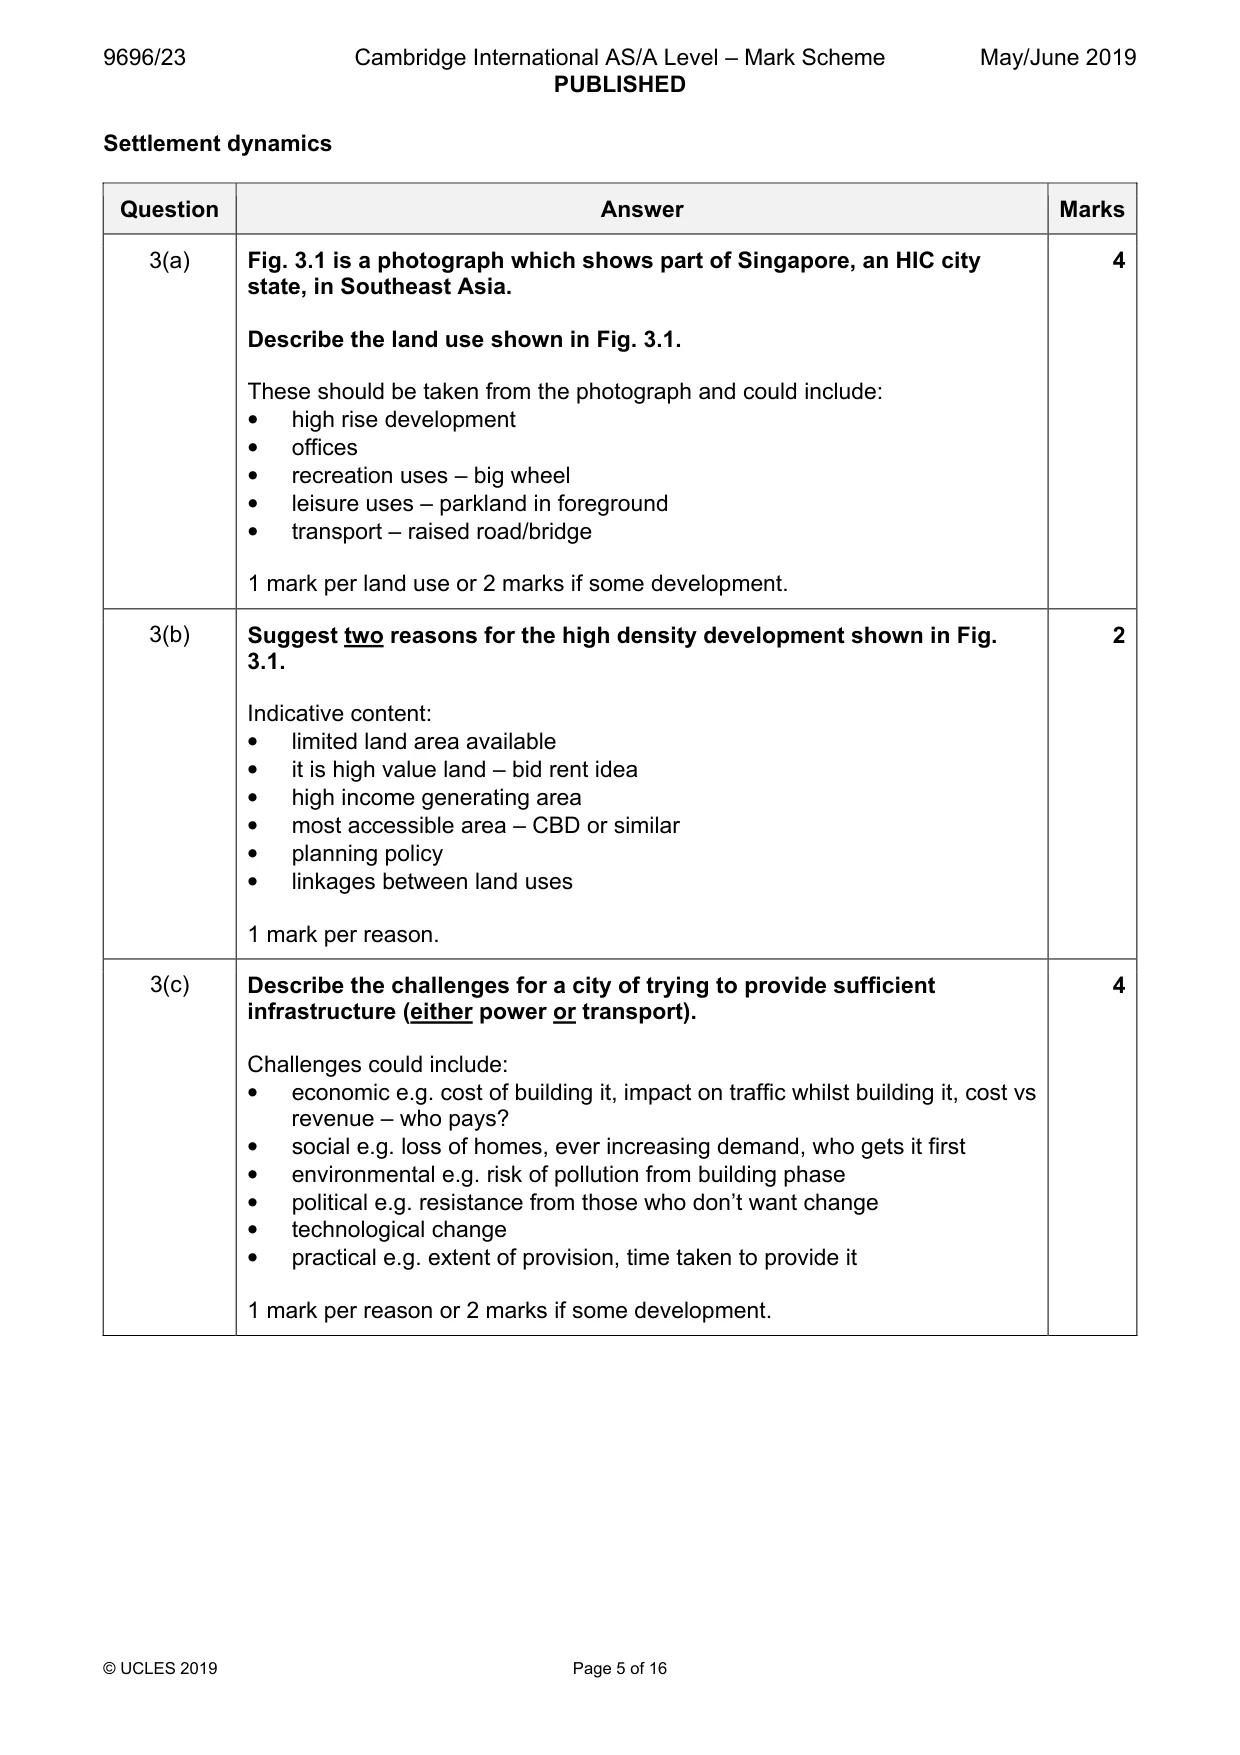
Mark scheme: 3(a) Fig. 3.1 is a photograph which shows part of Singapore, an HIC city 4 state, in Southeast Asia. Describe the land use shown in Fig. 3.1. These should be taken from the photograph and could include: • high rise development • offices • recreation uses – big wheel • leisure uses – parkland in foreground • transport – raised road/bridge 1 mark per land use or 2 marks if some development. 3(b) Suggest two reasons for the high density development shown in Fig. 2 3.1. Indicative content: • limited land area available • it is high value land – bid rent idea • high income generating area • most accessible area – CBD or similar • planning policy • linkages between land uses 1 mark per reason. 3(c) Describe the challenges for a city of trying to provide sufficient 4 infrastructure (either power or transport). Challenges could include: • economic e.g. cost of building it, impact on traffic whilst building it, cost vs revenue – who pays? • social e.g. loss of homes, ever increasing demand, who gets it first • environmental e.g. risk of pollution from building phase • political e.g. resistance from those who don’t want change • technological change • practical e.g. extent of provision, time taken to provide it 1 mark per reason or 2 marks if some development. Section B Answer one question from this section. Population
Q4 · Describe the links between economic development and changes in infant mortality rate
4 (a) Describe the links between economic development and changes in infant mortality rate. [7] (b) With the aid of one or more examples, outline the issues caused by a youthful population. [8] (c) With the aid of one or more examples, assess the extent to which decreasing death rates are causing overpopulation. [15] [Total: 30] Population/Migration
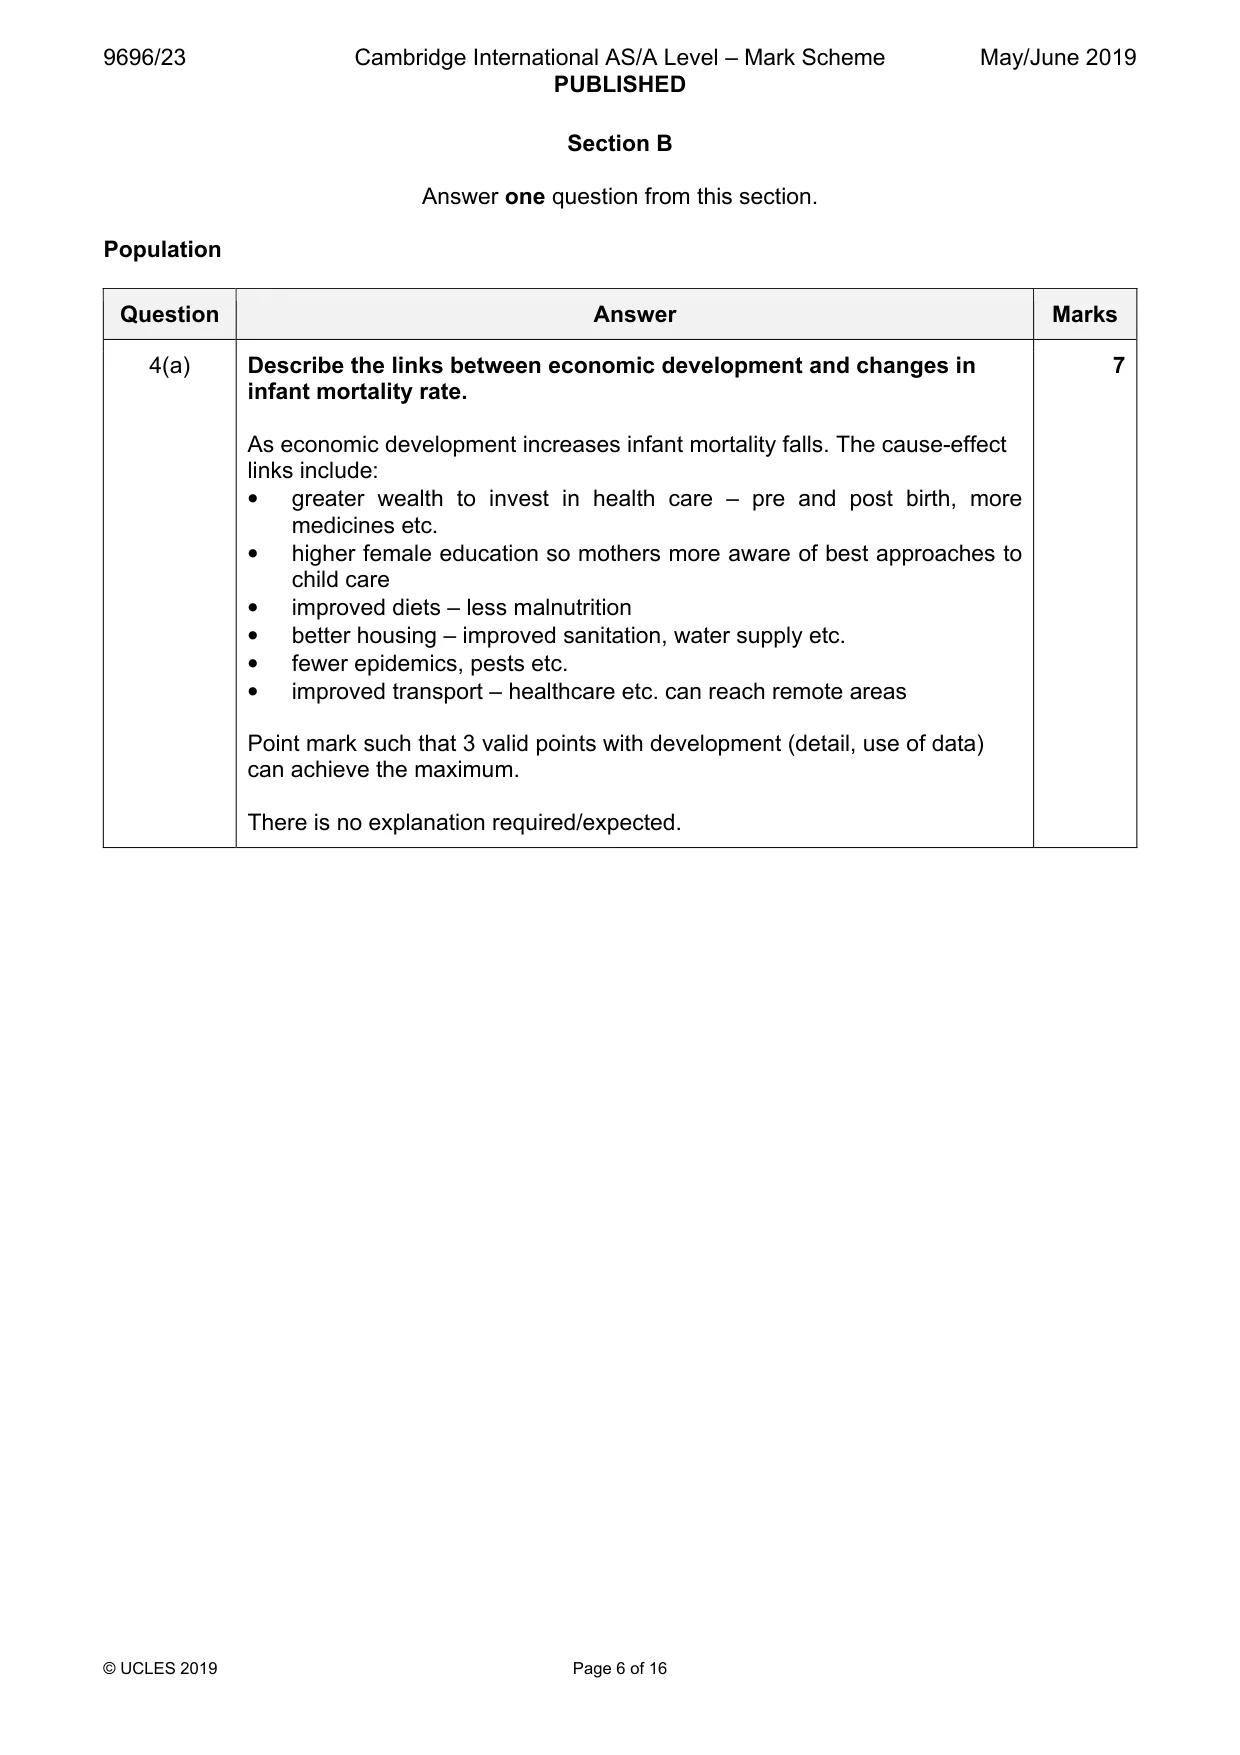
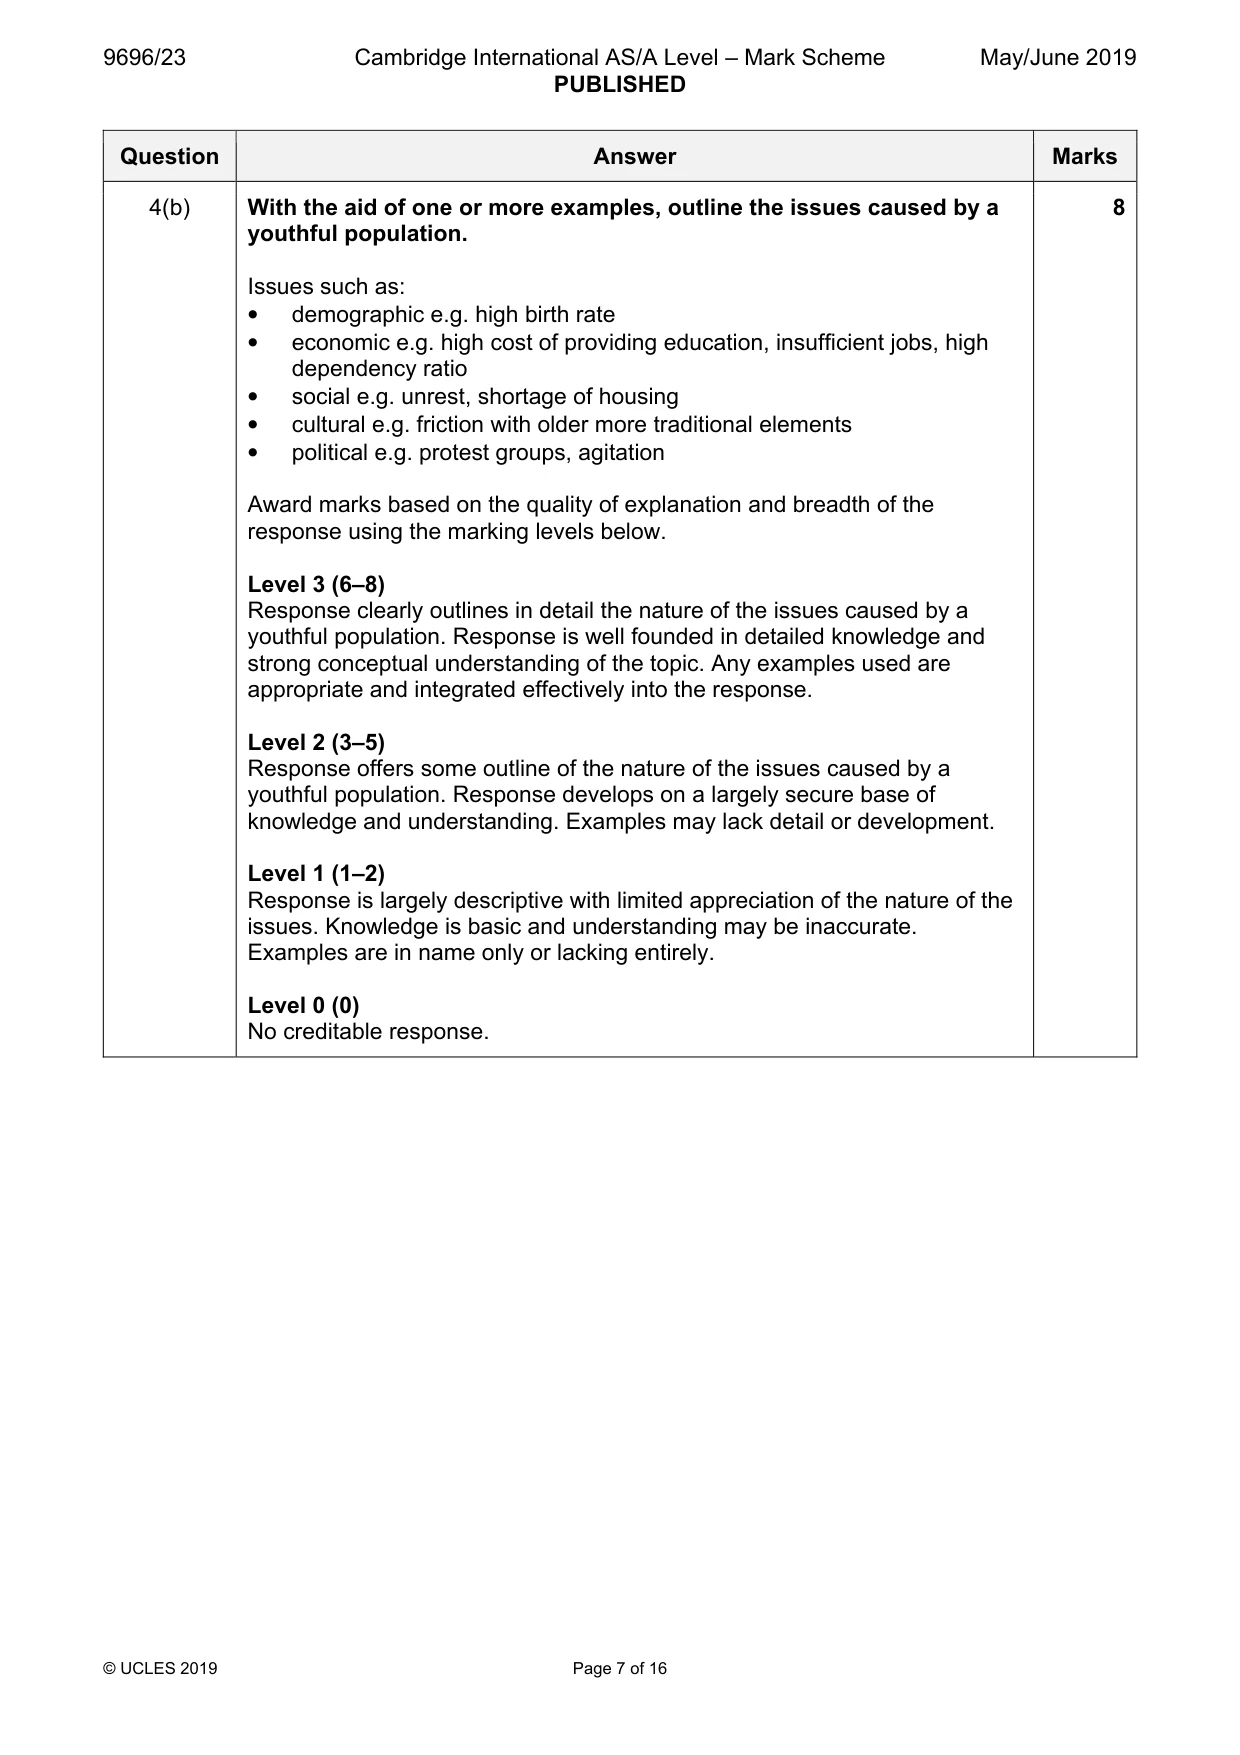
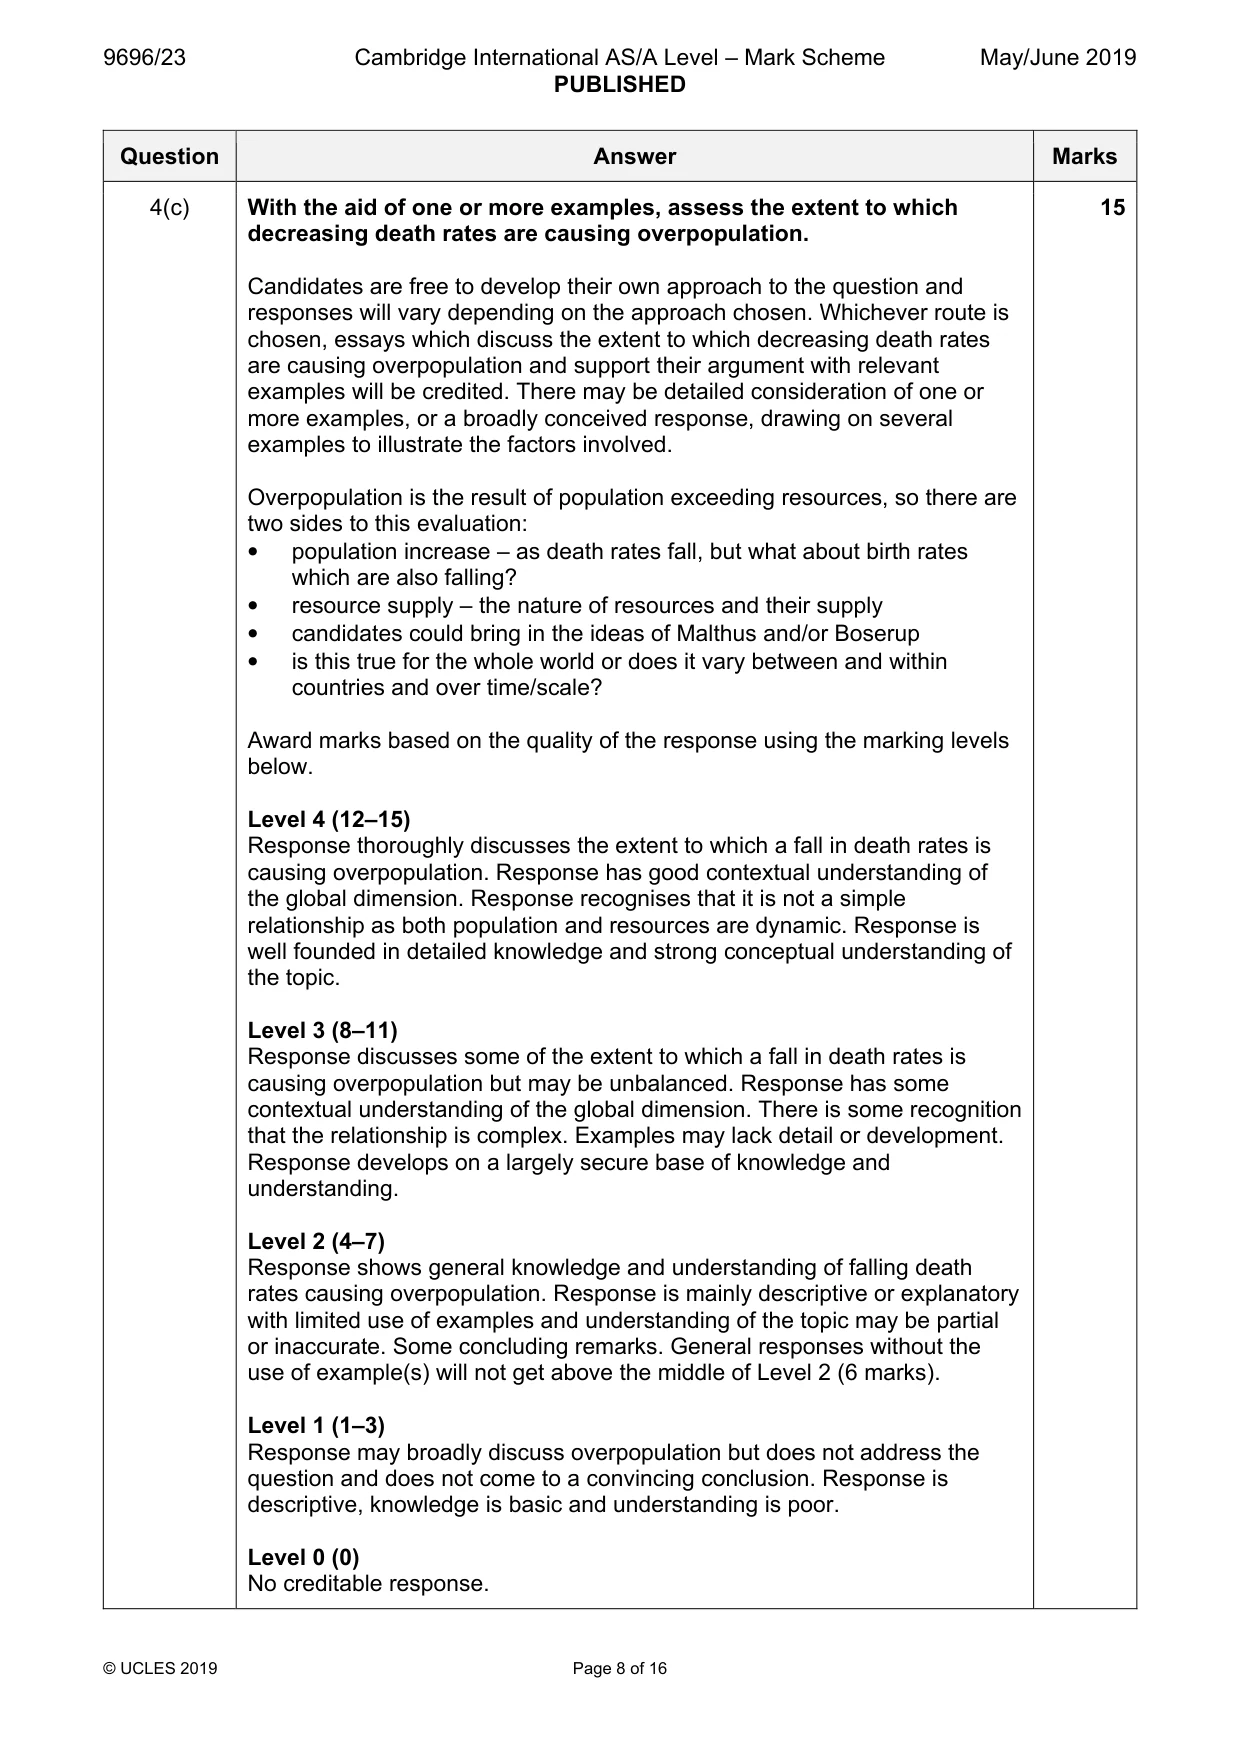
Mark scheme: 4(a) Describe the links between economic development and changes in 7 infant mortality rate. As economic development increases infant mortality falls. The cause-effect links include: • greater wealth to invest in health care – pre and post birth, more medicines etc. • higher female education so mothers more aware of best approaches to child care • improved diets – less malnutrition • better housing – improved sanitation, water supply etc. • fewer epidemics, pests etc. • improved transport – healthcare etc. can reach remote areas Point mark such that 3 valid points with development (detail, use of data) can achieve the maximum. There is no explanation required/expected. 4(b) With the aid of one or more examples, outline the issues caused by a 8 youthful population. Issues such as: • demographic e.g. high birth rate • economic e.g. high cost of providing education, insufficient jobs, high dependency ratio • social e.g. unrest, shortage of housing • cultural e.g. friction with older more traditional elements • political e.g. protest groups, agitation Award marks based on the quality of explanation and breadth of the response using the marking levels below. Level 3 (6–8) Response clearly outlines in detail the nature of the issues caused by a youthful population. Response is well founded in detailed knowledge and strong conceptual understanding of the topic. Any examples used are appropriate and integrated effectively into the response. Level 2 (3–5) Response offers some outline of the nature of the issues caused by a youthful population. Response develops on a largely secure base of knowledge and understanding. Examples may lack detail or development. Level 1 (1–2) Response is largely descriptive with limited appreciation of the nature of the issues. Knowledge is basic and understanding may be inaccurate. Examples are in name only or lacking entirely. Level 0 (0) No creditable response. 4(c) With the aid of one or more examples, assess the extent to which 15 decreasing death rates are causing overpopulation. Candidates are free to develop their own approach to the question and responses will vary depending on the approach chosen. Whichever route is chosen, essays which discuss the extent to which decreasing death rates are causing overpopulation and support their argument with relevant examples will be credited. There may be detailed consideration of one or more examples, or a broadly conceived response, drawing on several examples to illustrate the factors involved. Overpopulation is the result of population exceeding resources, so there are two sides to this evaluation: • population increase – as death rates fall, but what about birth rates which are also falling? • resource supply – the nature of resources and their supply • candidates could bring in the ideas of Malthus and/or Boserup • is this true for the whole world or does it vary between and within countries and over time/scale? Award marks based on the quality of the response using the marking levels below. Level 4 (12–15) Response thoroughly discusses the extent to which a fall in death rates is causing overpopulation. Response has good contextual understanding of the global dimension. Response recognises that it is not a simple relationship as both population and resources are dynamic. Response is well founded in detailed knowledge and strong conceptual understanding of the topic. Level 3 (8–11) Response discusses some of the extent to which a fall in death rates is causing overpopulation but may be unbalanced. Response has some contextual understanding of the global dimension. There is some recognition that the relationship is complex. Examples may lack detail or development. Response develops on a largely secure base of knowledge and understanding. Level 2 (4–7) Response shows general knowledge and understanding of falling death rates causing overpopulation. Response is mainly descriptive or explanatory with limited use of examples and understanding of the topic may be partial or inaccurate. Some concluding remarks. General responses without the use of example(s) will not get above the middle of Level 2 (6 marks). Level 1 (1–3) Response may broadly discuss overpopulation but does not address the question and does not come to a convincing conclusion. Response is descriptive, knowledge is basic and understanding is poor. Level 0 (0) No creditable response. Population/Migration
Q5 · Describe how age affects migration
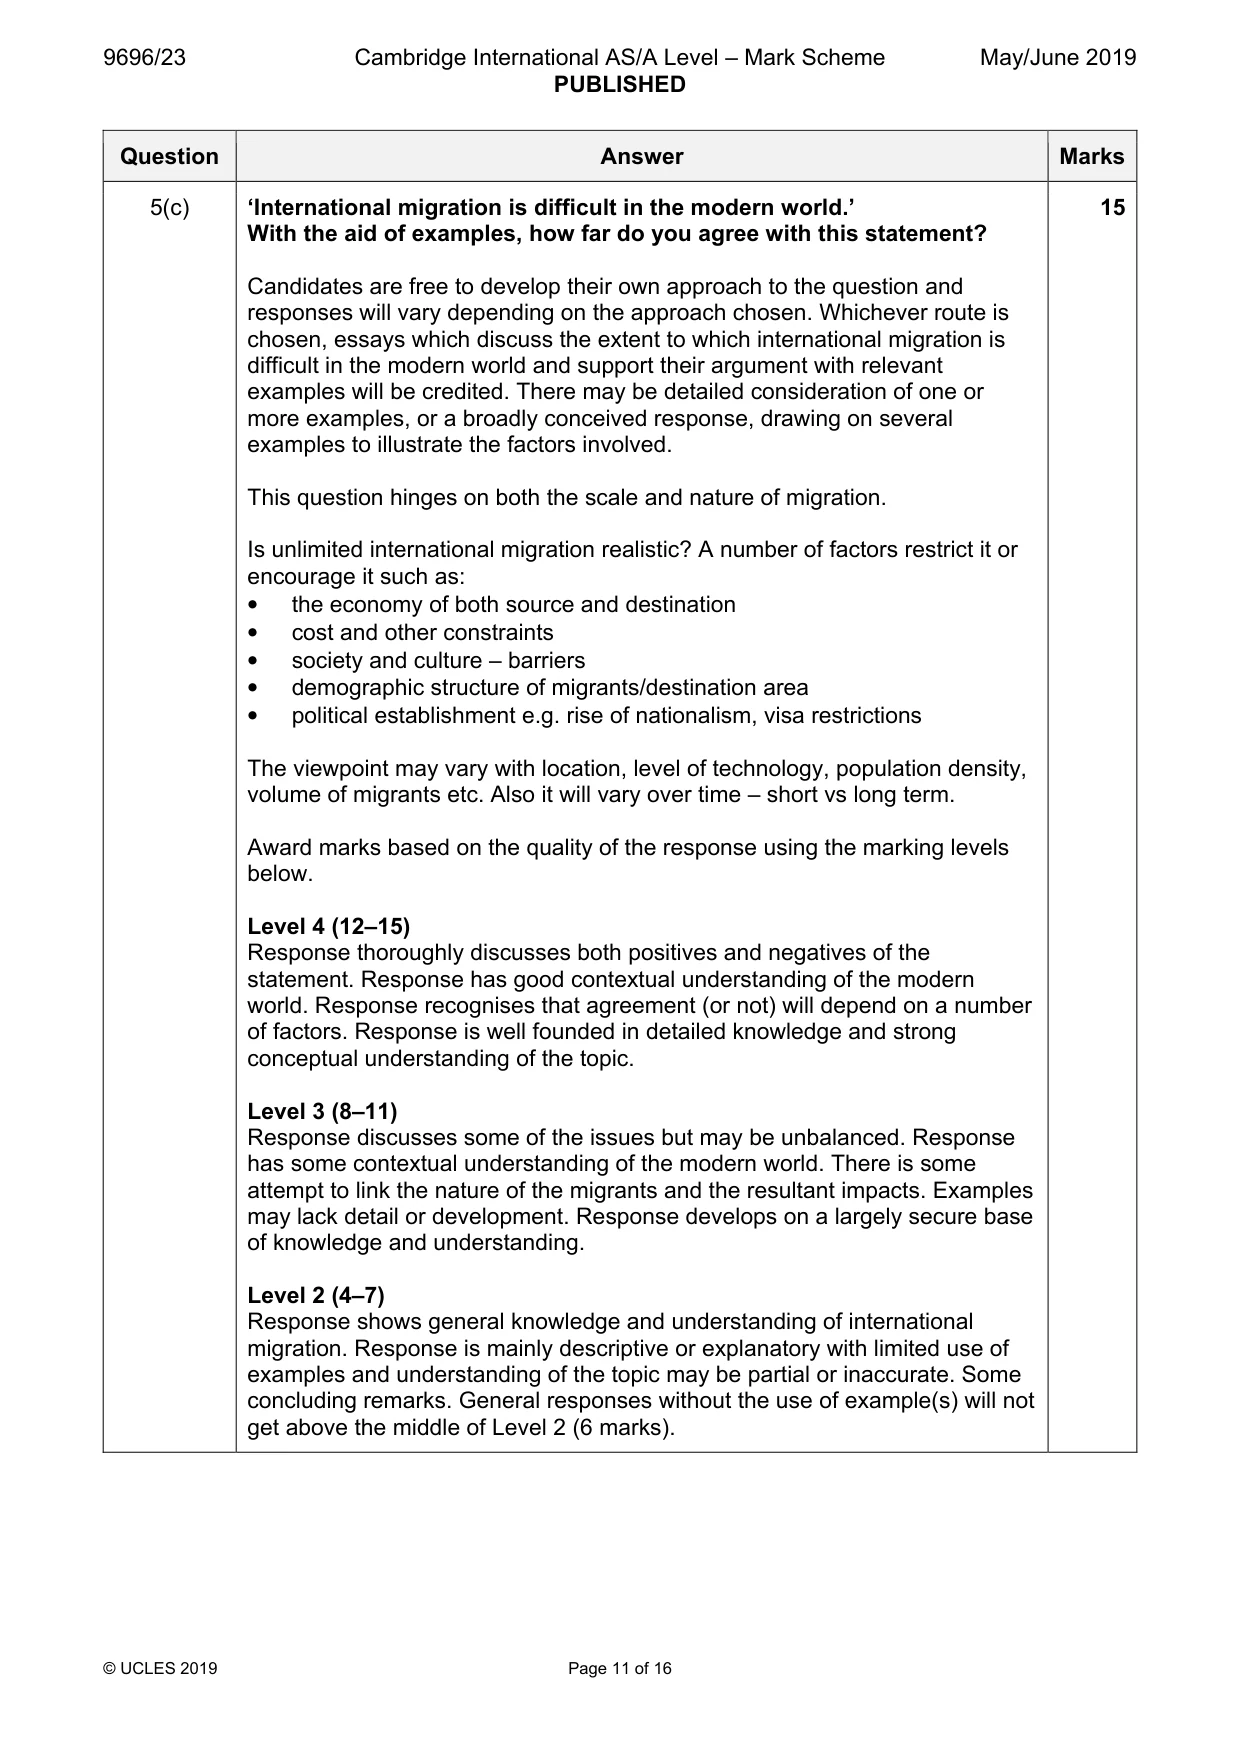
5 (a) Describe how age affects migration. [7] (b) With the aid of examples, explain why migration decreases with distance from the source area. [8] (c) ‘International migration is difficult in the modern world.’ With the aid of examples, how far do you agree with this statement? [15] [Total: 30] Population/Migration/Settlement dynamics
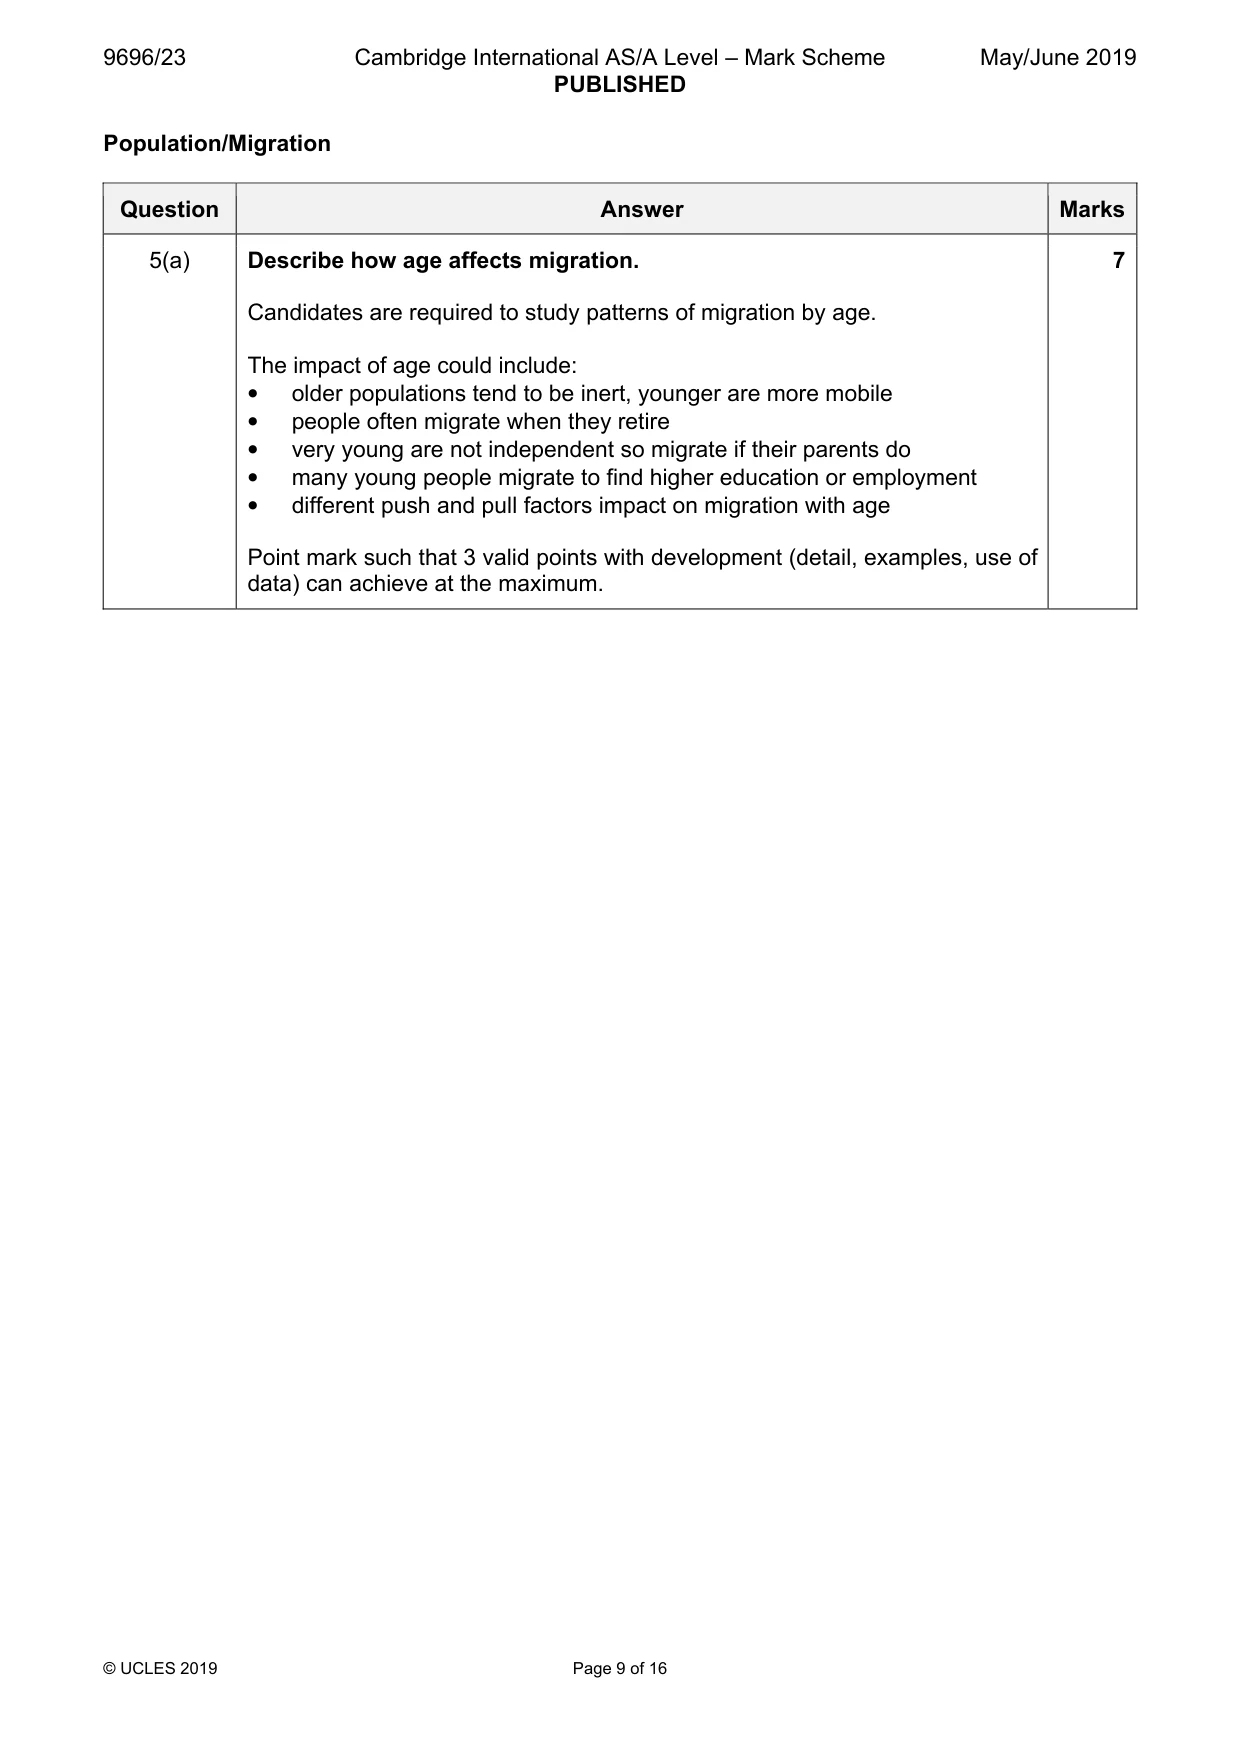
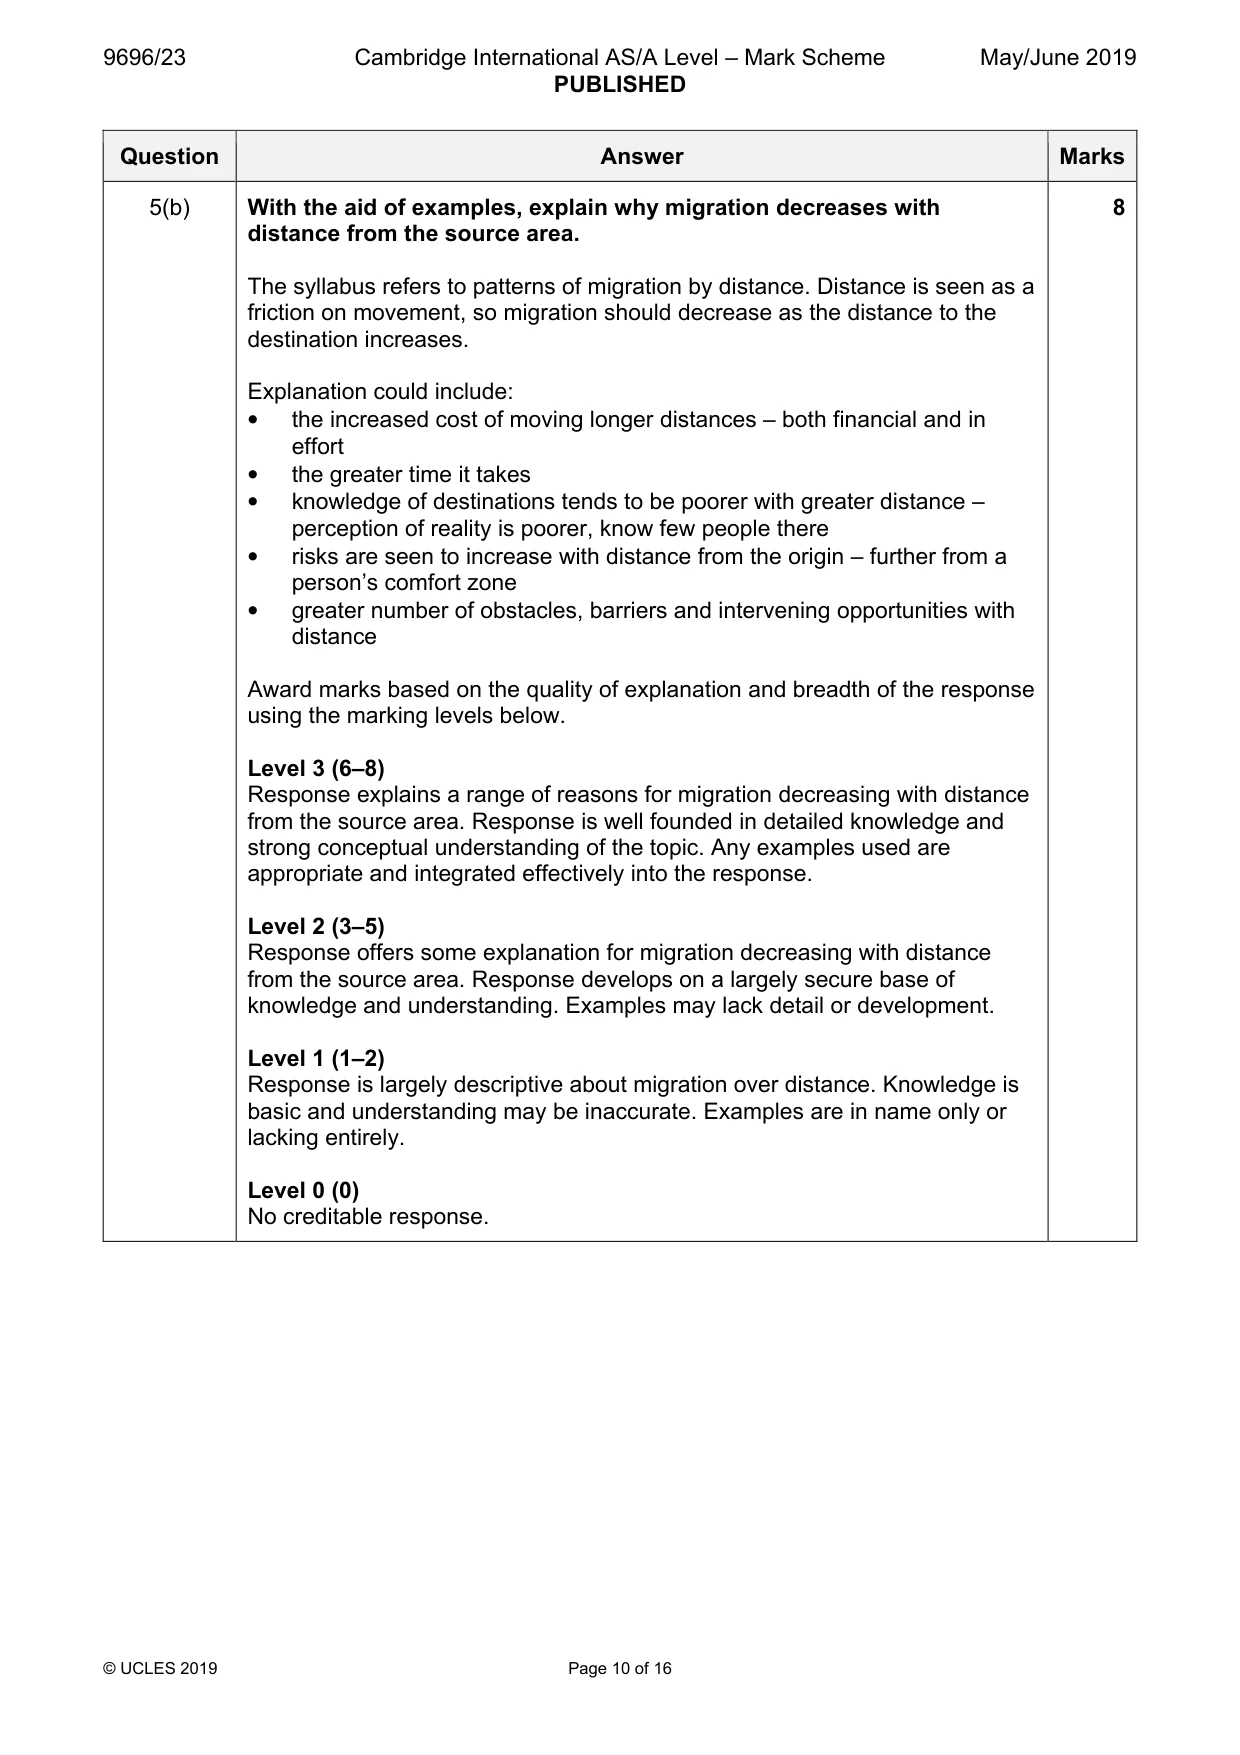
Mark scheme: 5(a) Describe how age affects migration. 7 Candidates are required to study patterns of migration by age. The impact of age could include: • older populations tend to be inert, younger are more mobile • people often migrate when they retire • very young are not independent so migrate if their parents do • many young people migrate to find higher education or employment • different push and pull factors impact on migration with age Point mark such that 3 valid points with development (detail, examples, use of data) can achieve at the maximum. 5(b) With the aid of examples, explain why migration decreases with 8 distance from the source area. The syllabus refers to patterns of migration by distance. Distance is seen as a friction on movement, so migration should decrease as the distance to the destination increases. Explanation could include: • the increased cost of moving longer distances – both financial and in effort • the greater time it takes • knowledge of destinations tends to be poorer with greater distance – perception of reality is poorer, know few people there • risks are seen to increase with distance from the origin – further from a person’s comfort zone • greater number of obstacles, barriers and intervening opportunities with distance Award marks based on the quality of explanation and breadth of the response using the marking levels below. Level 3 (6–8) Response explains a range of reasons for migration decreasing with distance from the source area. Response is well founded in detailed knowledge and strong conceptual understanding of the topic. Any examples used are appropriate and integrated effectively into the response. Level 2 (3–5) Response offers some explanation for migration decreasing with distance from the source area. Response develops on a largely secure base of knowledge and understanding. Examples may lack detail or development. Level 1 (1–2) Response is largely descriptive about migration over distance. Knowledge is basic and understanding may be inaccurate. Examples are in name only or lacking entirely. Level 0 (0) No creditable response. 5(c) ‘International migration is difficult in the modern world.’ 15 With the aid of examples, how far do you agree with this statement? Candidates are free to develop their own approach to the question and responses will vary depending on the approach chosen. Whichever route is chosen, essays which discuss the extent to which international migration is difficult in the modern world and support their argument with relevant examples will be credited. There may be detailed consideration of one or more examples, or a broadly conceived response, drawing on several examples to illustrate the factors involved. This question hinges on both the scale and nature of migration. Is unlimited international migration realistic? A number of factors restrict it or encourage it such as: • the economy of both source and destination • cost and other constraints • society and culture – barriers • demographic structure of migrants/destination area • political establishment e.g. rise of nationalism, visa restrictions The viewpoint may vary with location, level of technology, population density, volume of migrants etc. Also it will vary over time – short vs long term. Award marks based on the quality of the response using the marking levels below. Level 4 (12–15) Response thoroughly discusses both positives and negatives of the statement. Response has good contextual understanding of the modern world. Response recognises that agreement (or not) will depend on a number of factors. Response is well founded in detailed knowledge and strong conceptual understanding of the topic. Level 3 (8–11) Response discusses some of the issues but may be unbalanced. Response has some contextual understanding of the modern world. There is some attempt to link the nature of the migrants and the resultant impacts. Examples may lack detail or development. Response develops on a largely secure base of knowledge and understanding. Level 2 (4–7) Response shows general knowledge and understanding of international migration. Response is mainly descriptive or explanatory with limited use of examples and understanding of the topic may be partial or inaccurate. Some concluding remarks. General responses without the use of example(s) will not get above the middle of Level 2 (6 marks). 5(c) Level 1 (1–3) Response may broadly discuss the impacts of migrants but does not address the question and does not come to a convincing conclusion. Response is descriptive, knowledge is basic and understanding is poor. Level 0 (0) No creditable response. Population/Migration/Settlement dynamics
Q6 · Explain why many rural settlements in HICs are increasing in population
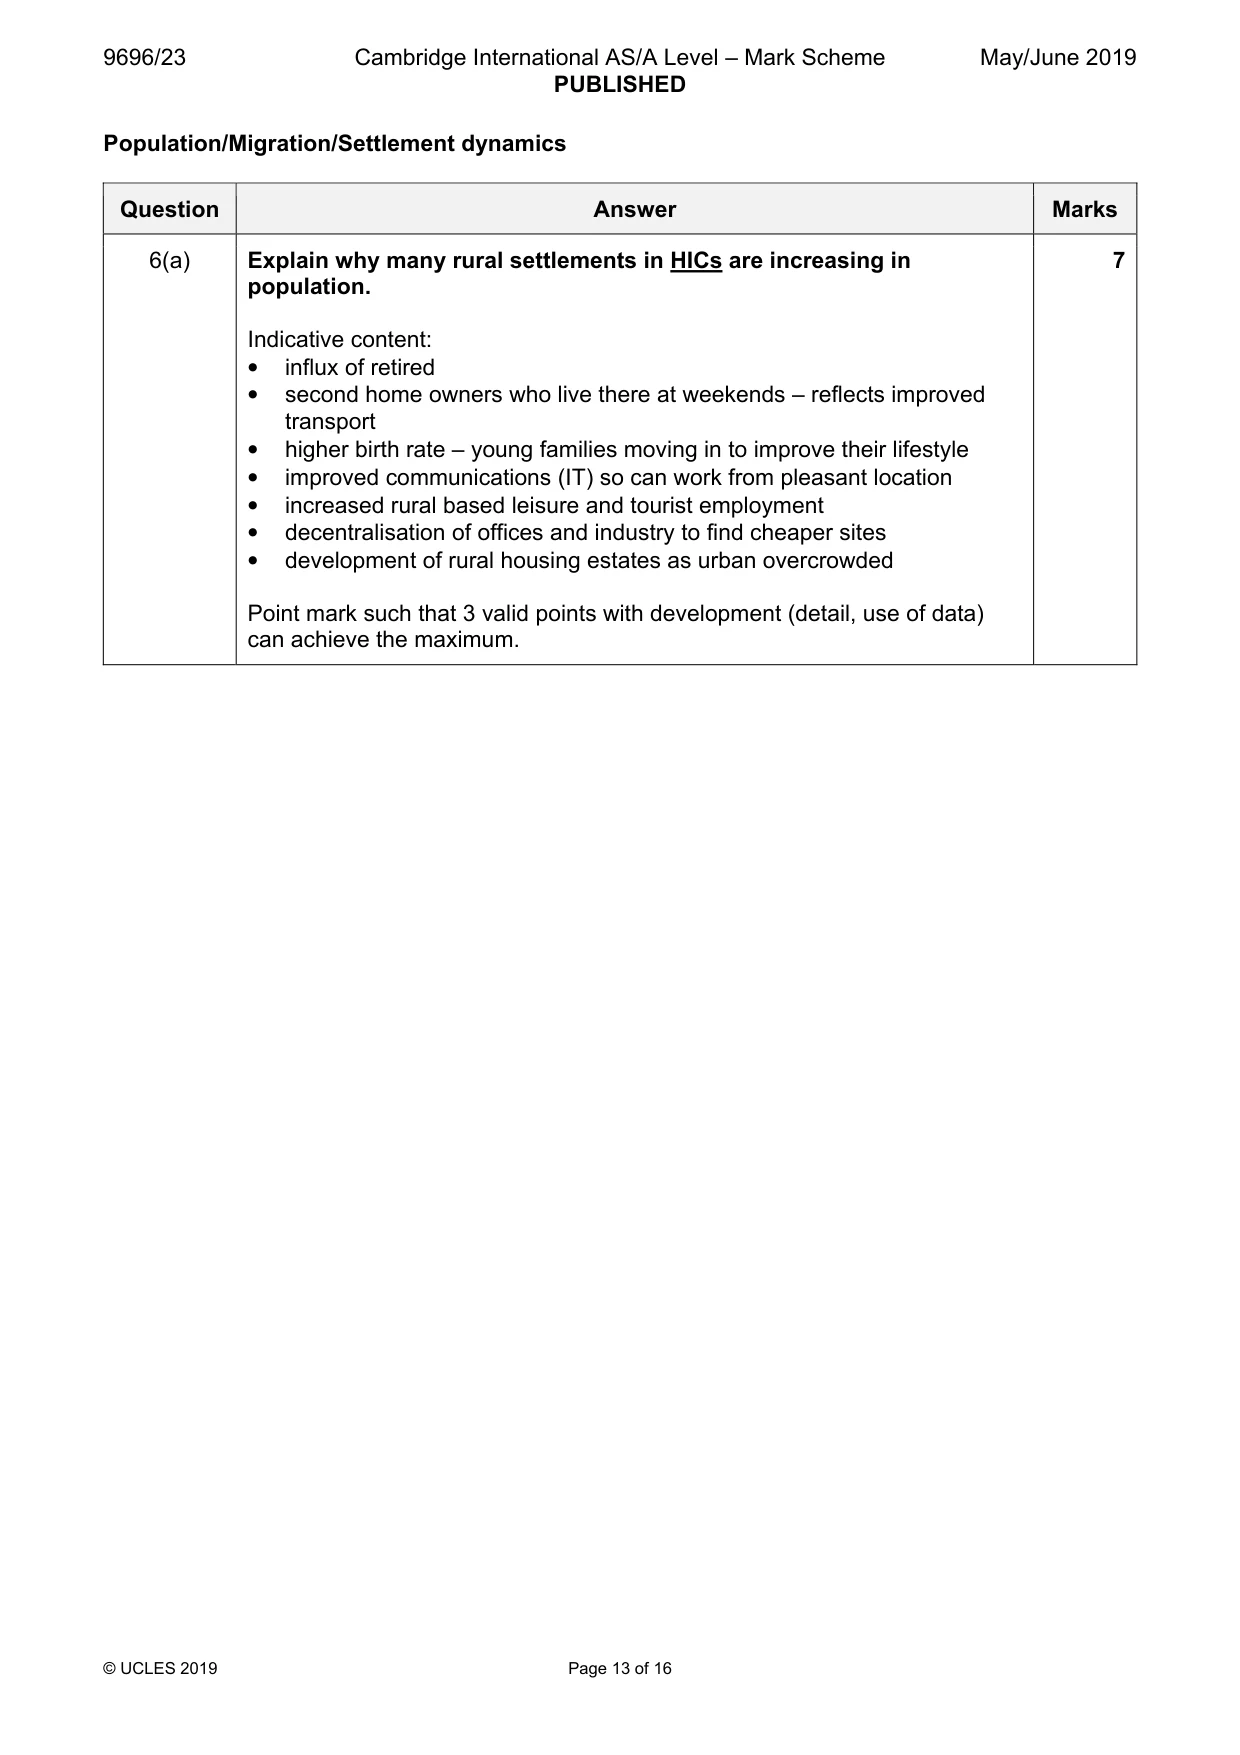
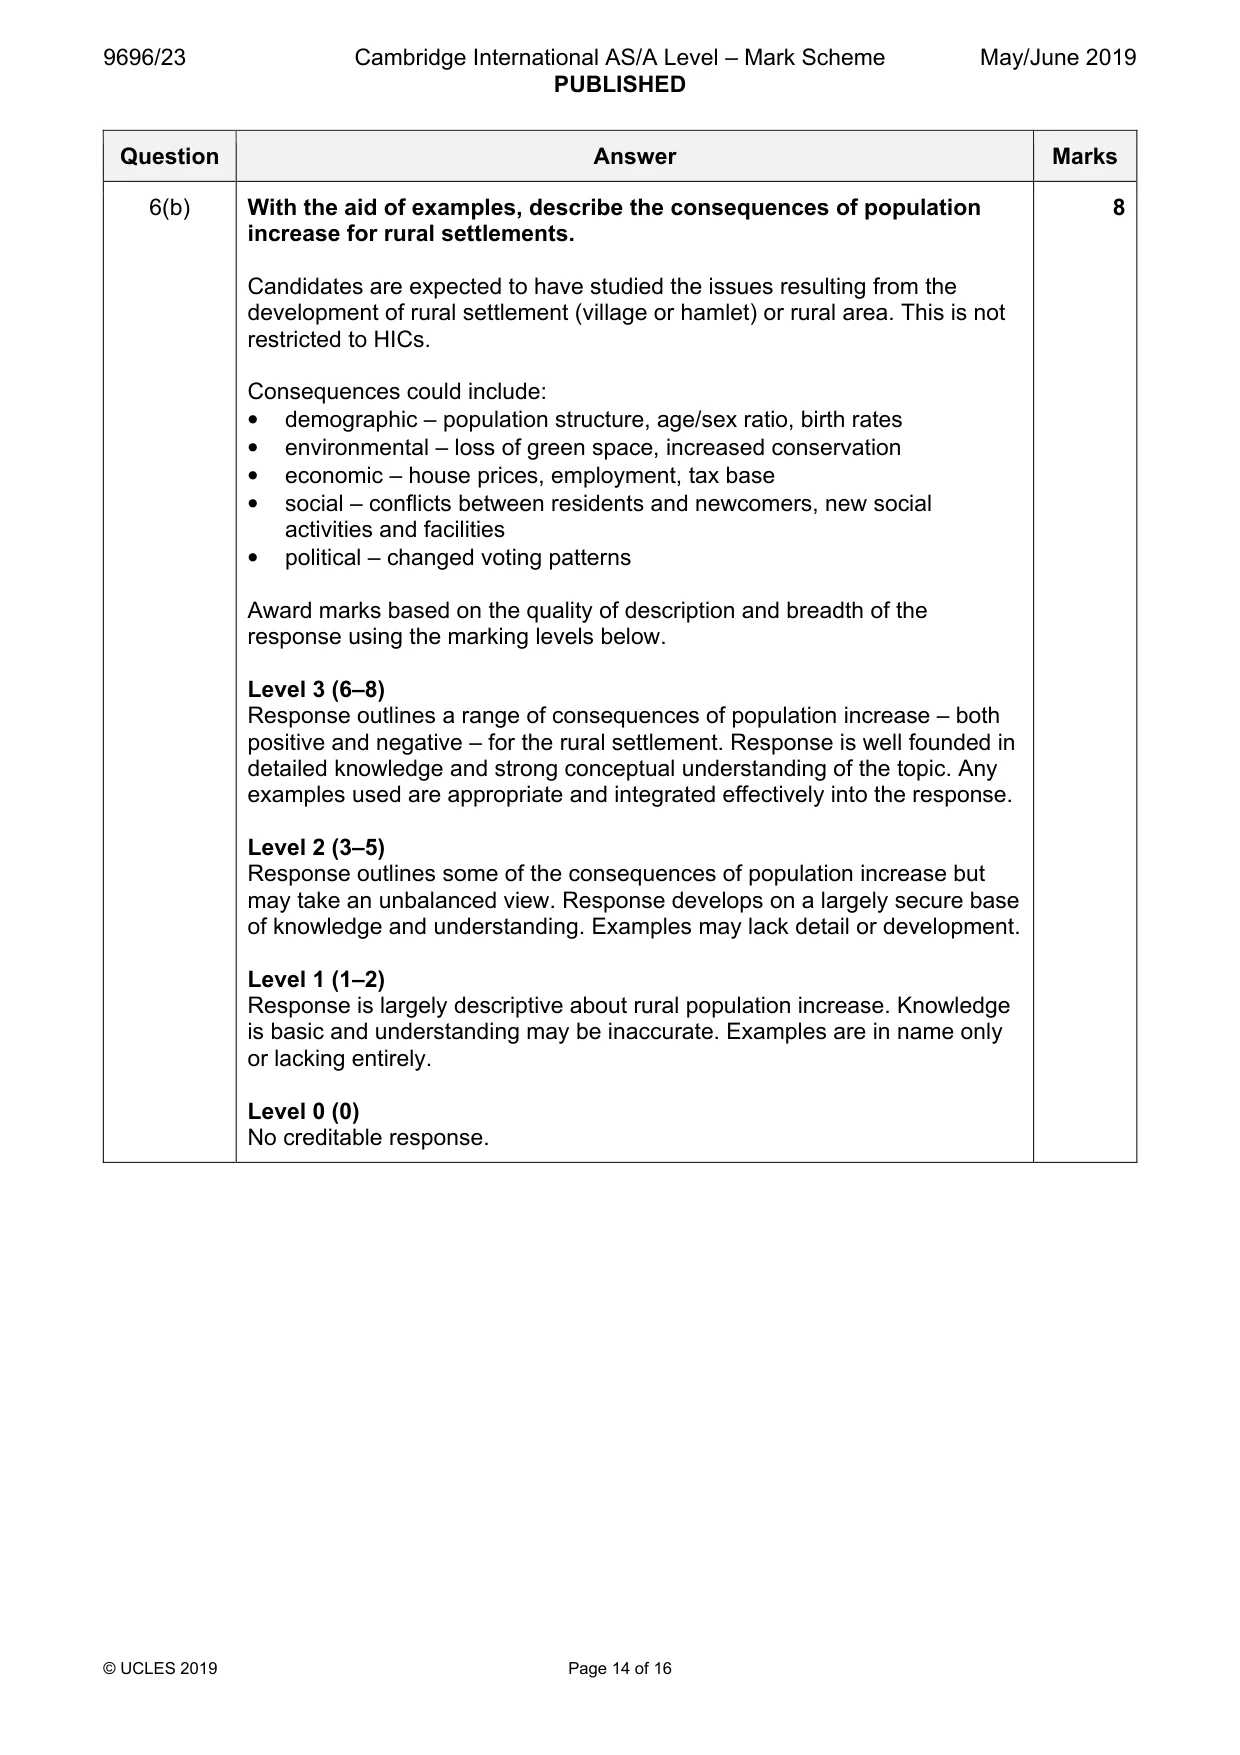
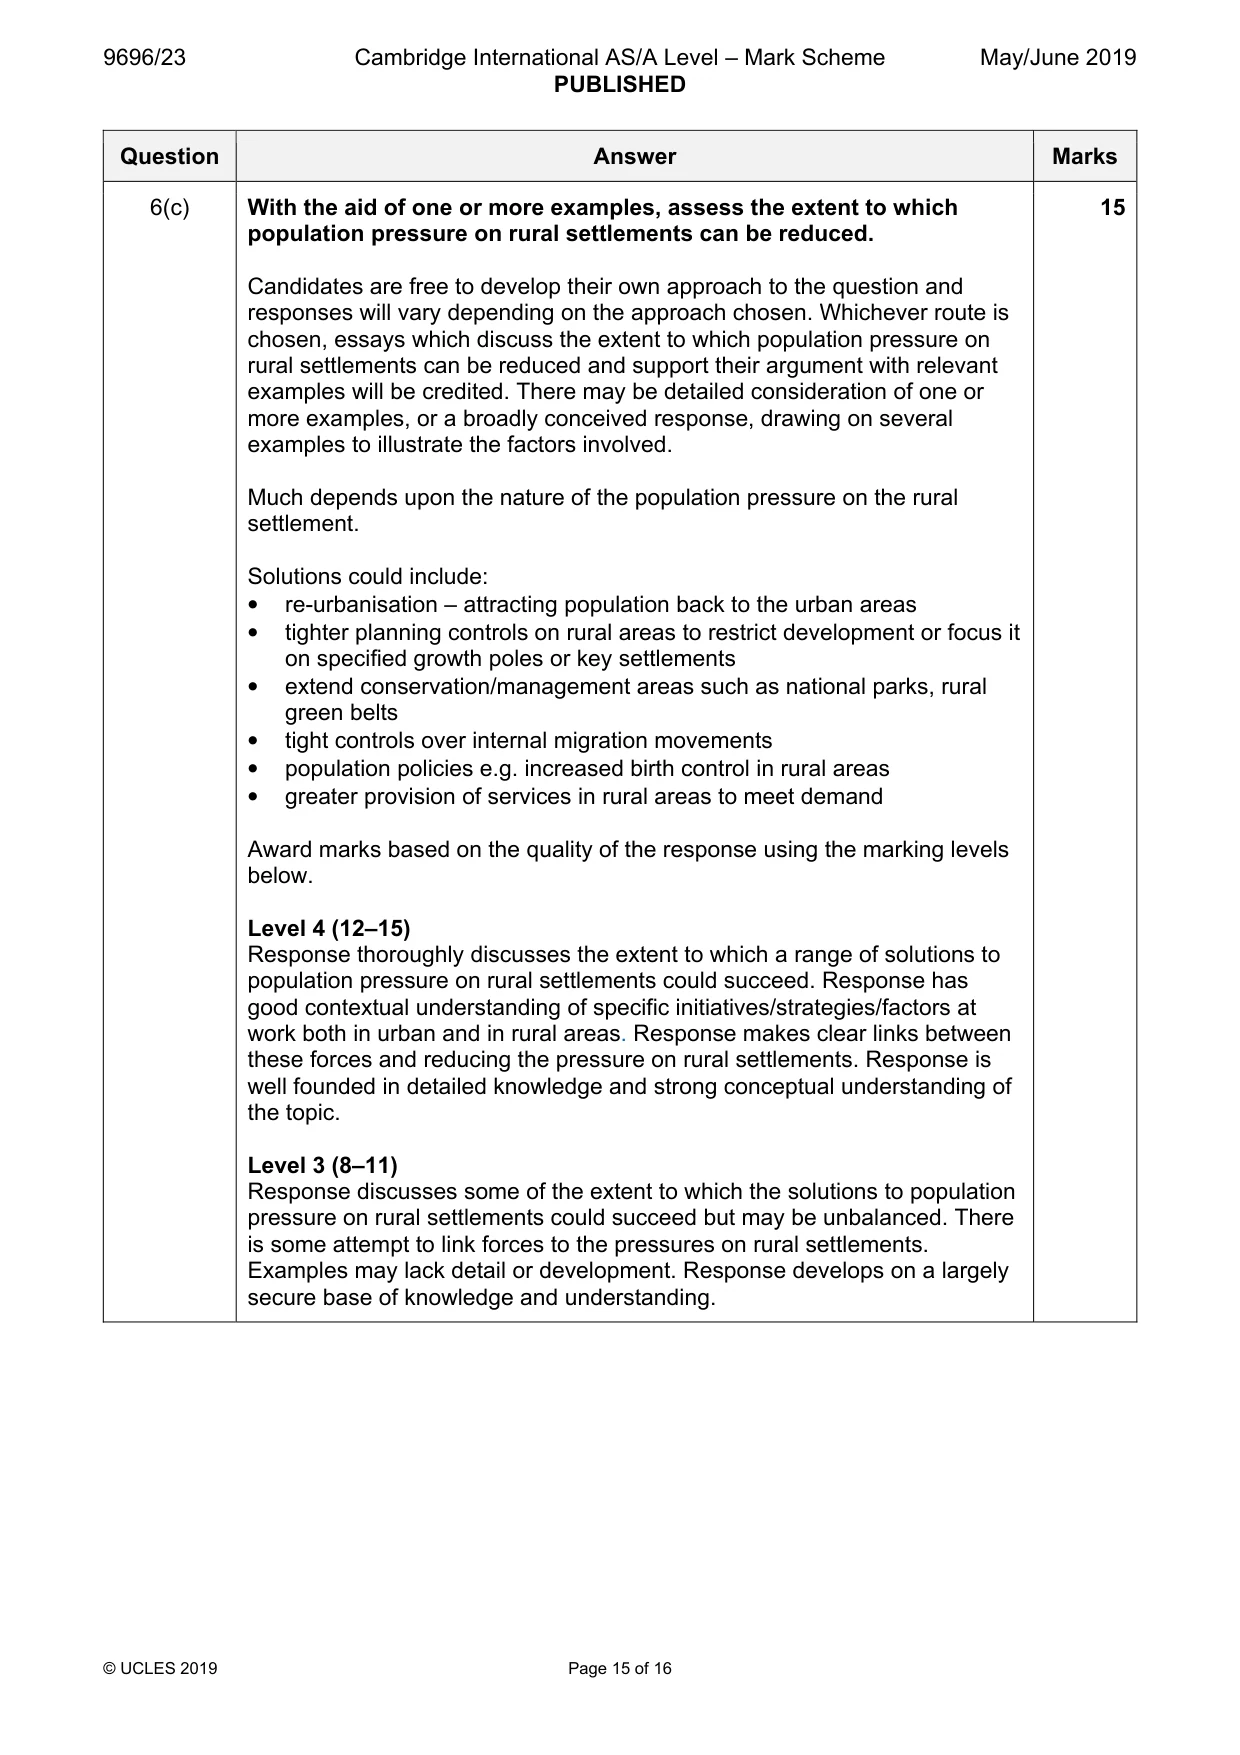
6 (a) Explain why many rural settlements in HICs are increasing in population. [7] (b) With the aid of examples, describe the consequences of population increase for rural settlements. [8] (c) With the aid of one or more examples, assess the extent to which population pressure on rural settlements can be reduced. [15] [Total: 30]
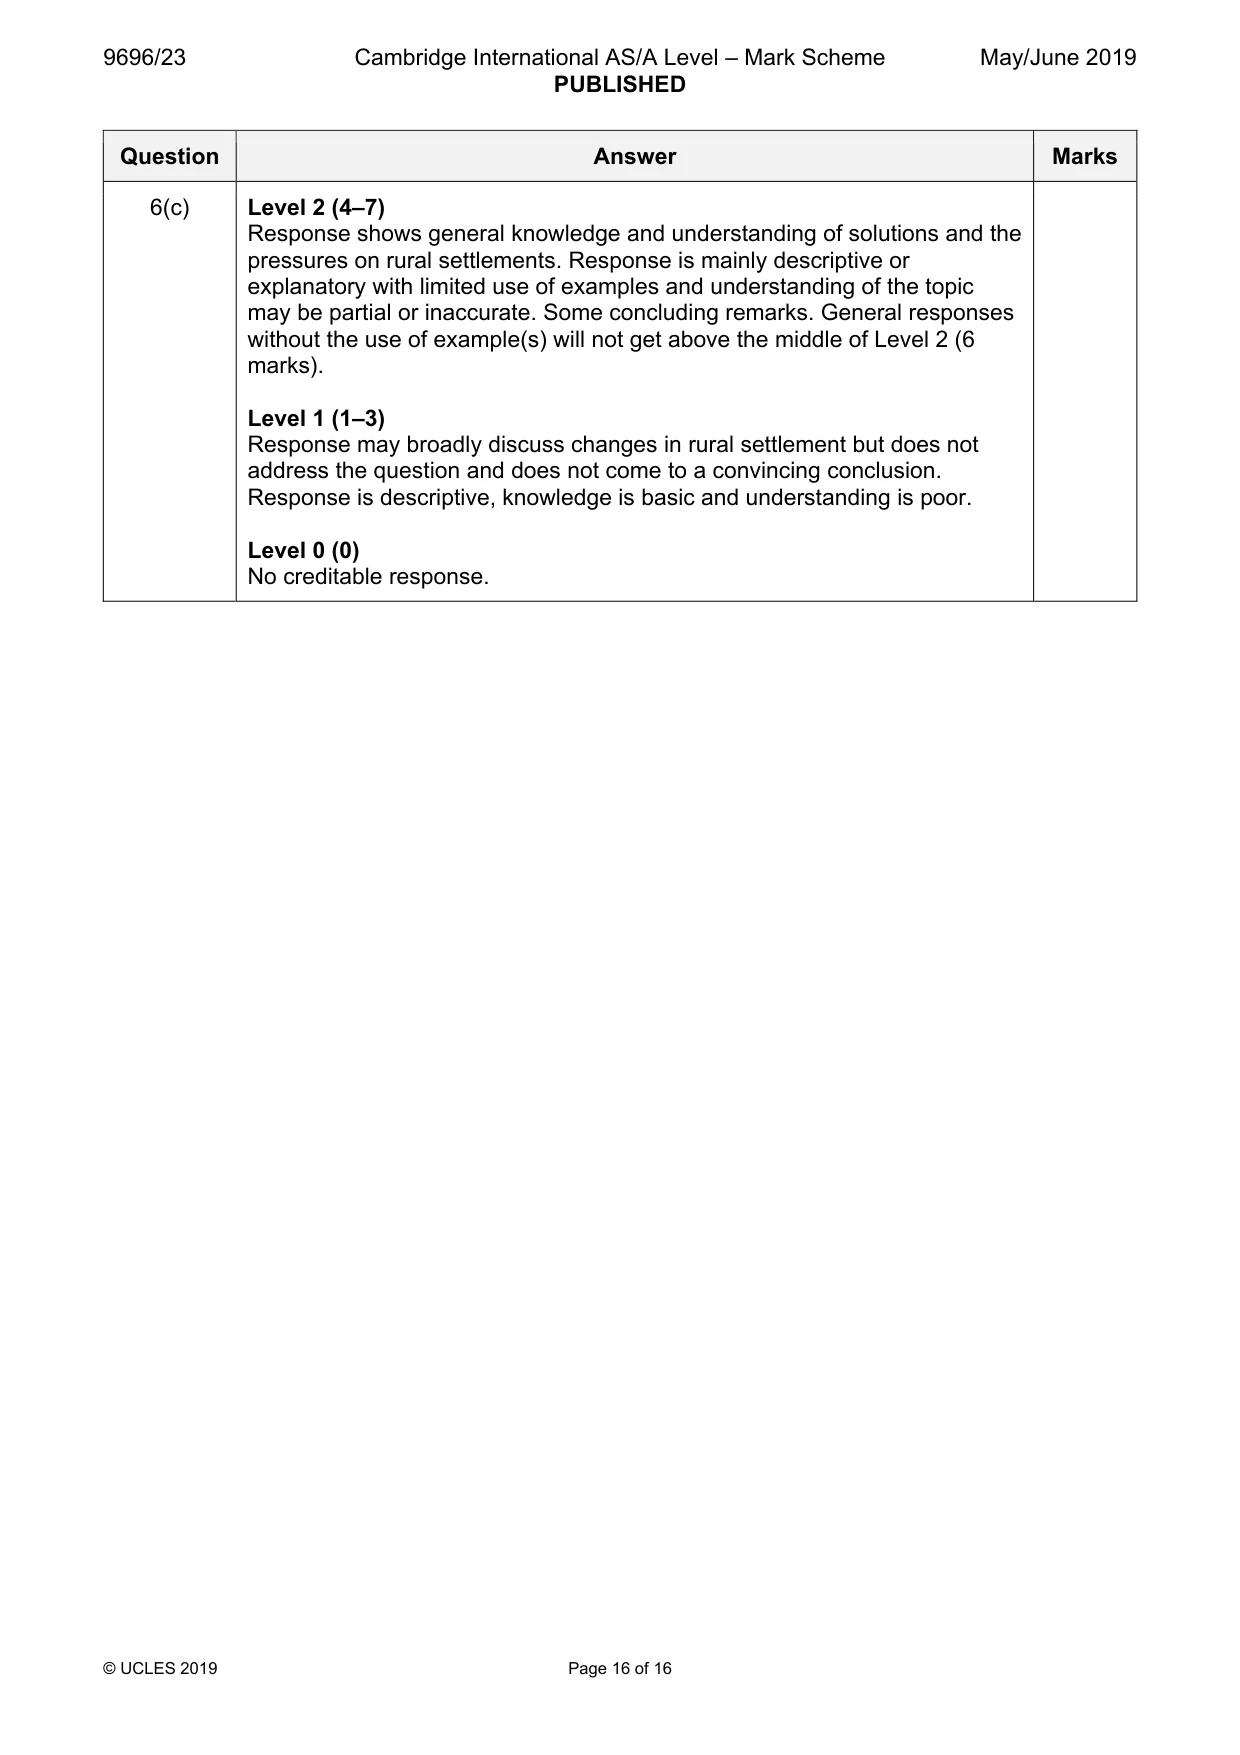
Mark scheme: 6(a) Explain why many rural settlements in HICs are increasing in 7 population. Indicative content: • influx of retired • second home owners who live there at weekends – reflects improved transport • higher birth rate – young families moving in to improve their lifestyle • improved communications (IT) so can work from pleasant location • increased rural based leisure and tourist employment • decentralisation of offices and industry to find cheaper sites • development of rural housing estates as urban overcrowded Point mark such that 3 valid points with development (detail, use of data) can achieve the maximum. 6(b) With the aid of examples, describe the consequences of population 8 increase for rural settlements. Candidates are expected to have studied the issues resulting from the development of rural settlement (village or hamlet) or rural area. This is not restricted to HICs. Consequences could include: • demographic – population structure, age/sex ratio, birth rates • environmental – loss of green space, increased conservation • economic – house prices, employment, tax base • social – conflicts between residents and newcomers, new social activities and facilities • political – changed voting patterns Award marks based on the quality of description and breadth of the response using the marking levels below. Level 3 (6–8) Response outlines a range of consequences of population increase – both positive and negative – for the rural settlement. Response is well founded in detailed knowledge and strong conceptual understanding of the topic. Any examples used are appropriate and integrated effectively into the response. Level 2 (3–5) Response outlines some of the consequences of population increase but may take an unbalanced view. Response develops on a largely secure base of knowledge and understanding. Examples may lack detail or development. Level 1 (1–2) Response is largely descriptive about rural population increase. Knowledge is basic and understanding may be inaccurate. Examples are in name only or lacking entirely. Level 0 (0) No creditable response. 6(c) With the aid of one or more examples, assess the extent to which 15 population pressure on rural settlements can be reduced. Candidates are free to develop their own approach to the question and responses will vary depending on the approach chosen. Whichever route is chosen, essays which discuss the extent to which population pressure on rural settlements can be reduced and support their argument with relevant examples will be credited. There may be detailed consideration of one or more examples, or a broadly conceived response, drawing on several examples to illustrate the factors involved. Much depends upon the nature of the population pressure on the rural settlement. Solutions could include: • re-urbanisation – attracting population back to the urban areas • tighter planning controls on rural areas to restrict development or focus it on specified growth poles or key settlements • extend conservation/management areas such as national parks, rural green belts • tight controls over internal migration movements • population policies e.g. increased birth control in rural areas • greater provision of services in rural areas to meet demand Award marks based on the quality of the response using the marking levels below. Level 4 (12–15) Response thoroughly discusses the extent to which a range of solutions to population pressure on rural settlements could succeed. Response has good contextual understanding of specific initiatives/strategies/factors at work both in urban and in rural areas. Response makes clear links between these forces and reducing the pressure on rural settlements. Response is well founded in detailed knowledge and strong conceptual understanding of the topic. Level 3 (8–11) Response discusses some of the extent to which the solutions to population pressure on rural settlements could succeed but may be unbalanced. There is some attempt to link forces to the pressures on rural settlements. Examples may lack detail or development. Response develops on a largely secure base of knowledge and understanding. 6(c) Level 2 (4–7) Response shows general knowledge and understanding of solutions and the pressures on rural settlements. Response is mainly descriptive or explanatory with limited use of examples and understanding of the topic may be partial or inaccurate. Some concluding remarks. General responses without the use of example(s) will not get above the middle of Level 2 (6 marks). Level 1 (1–3) Response may broadly discuss changes in rural settlement but does not address the question and does not come to a convincing conclusion. Response is descriptive, knowledge is basic and understanding is poor. Level 0 (0) No creditable response.
What was in this paper
The subtopics covered by these 6 questions, and how many questions each got. Open one in a new tab to see every Cambridge question on it.
What you needed in this session
Cambridge’s own grade thresholds for 2019 May/June, Paper 2 · Variant 3. A higher threshold means an easier paper — the bar moves with how the cohort did.