Cambridge A Level Geography 9696 — 2016 Oct/Nov Paper 3 · Variant 1
9696/31/O/N/16 · 50 marks · ≈56 min
The question paper and its mark scheme, free to read here and free to download. This is Cambridge’s own paper, exactly as it was sat.
Question paper4 pages


Mark scheme13 pages
Answers below. Sit the paper first if you are practising.

Paper as text
Question paper, page 1
This document consists of 3 printed pages, 1 blank page and 2 Inserts. DC (LK) 113766/2 © UCLES 2016 [Turn over Cambridge International Examinations Cambridge International Advanced Subsidiary and Advanced Level * 4 7 9 9 7 1 0 8 2 4 * GEOGRAPHY 9696/31 Paper 3 Advanced Human Options October/November 2016 1 hour 30 minutes No Additional Materials are required. READ THESE INSTRUCTIONS FIRST An answer booklet is provided inside this question paper. You should follow the instructions on the front cover of the answer booklet. If you need additional answer paper ask the invigilator for a continuation booklet. Answer two questions only. Each question answered must be from a different topic. Sketch maps and diagrams should be drawn whenever they serve to illustrate an answer. You should make reference to appropriate examples studied in the field or the classroom, even where such examples are not specifically requested by the question. The Photograph and all the Figures referred to in the questions are contained in the Insert. The number of marks is given in brackets [ ] at the end of each question or part question.
Question paper, page 2
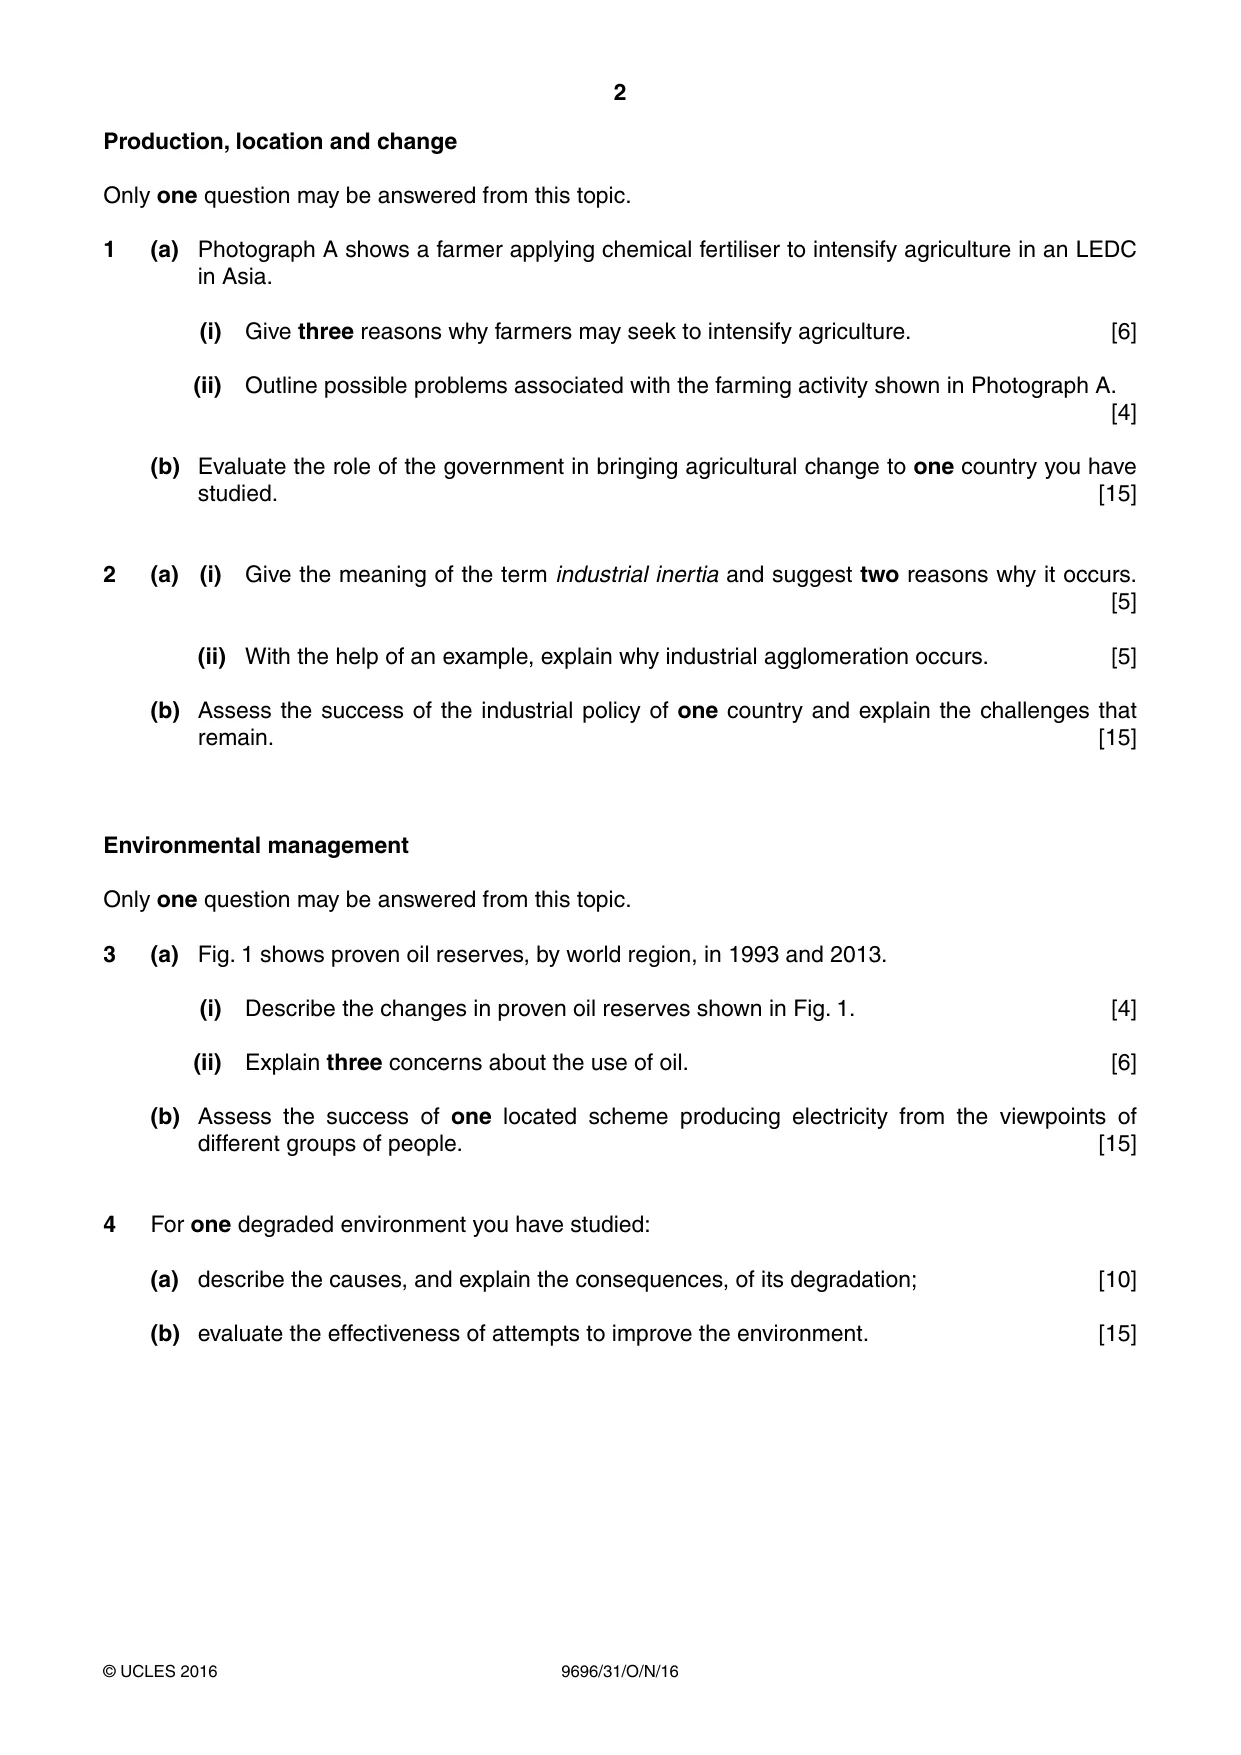
2 9696/31/O/N/16 © UCLES 2016 Production, location and change Only one question may be answered from this topic. 1 (a) Photograph A shows a farmer applying chemical fertiliser to intensify agriculture in an LEDC in Asia. (i) Give three reasons why farmers may seek to intensify agriculture. [6] (ii) Outline possible problems associated with the farming activity shown in Photograph A. [4] (b) Evaluate the role of the government in bringing agricultural change to one country you have studied. [15] 2 (a) (i) Give the meaning of the term industrial inertia and suggest two reasons why it occurs. [5] (ii) With the help of an example, explain why industrial agglomeration occurs. [5] (b) Assess the success of the industrial policy of one country and explain the challenges that remain. [15] Environmental management Only one question may be answered from this topic. 3 (a) Fig. 1 shows proven oil reserves, by world region, in 1993 and 2013. (i) Describe the changes in proven oil reserves shown in Fig. 1. [4] (ii) Explain three concerns about the use of oil. [6] (b) Assess the success of one located scheme producing electricity from the viewpoints of different groups of people. [15] 4 For one degraded environment you have studied: (a) describe the causes, and explain the consequences, of its degradation; [10] (b) evaluate the effectiveness of attempts to improve the environment. [15]
Question paper, page 3
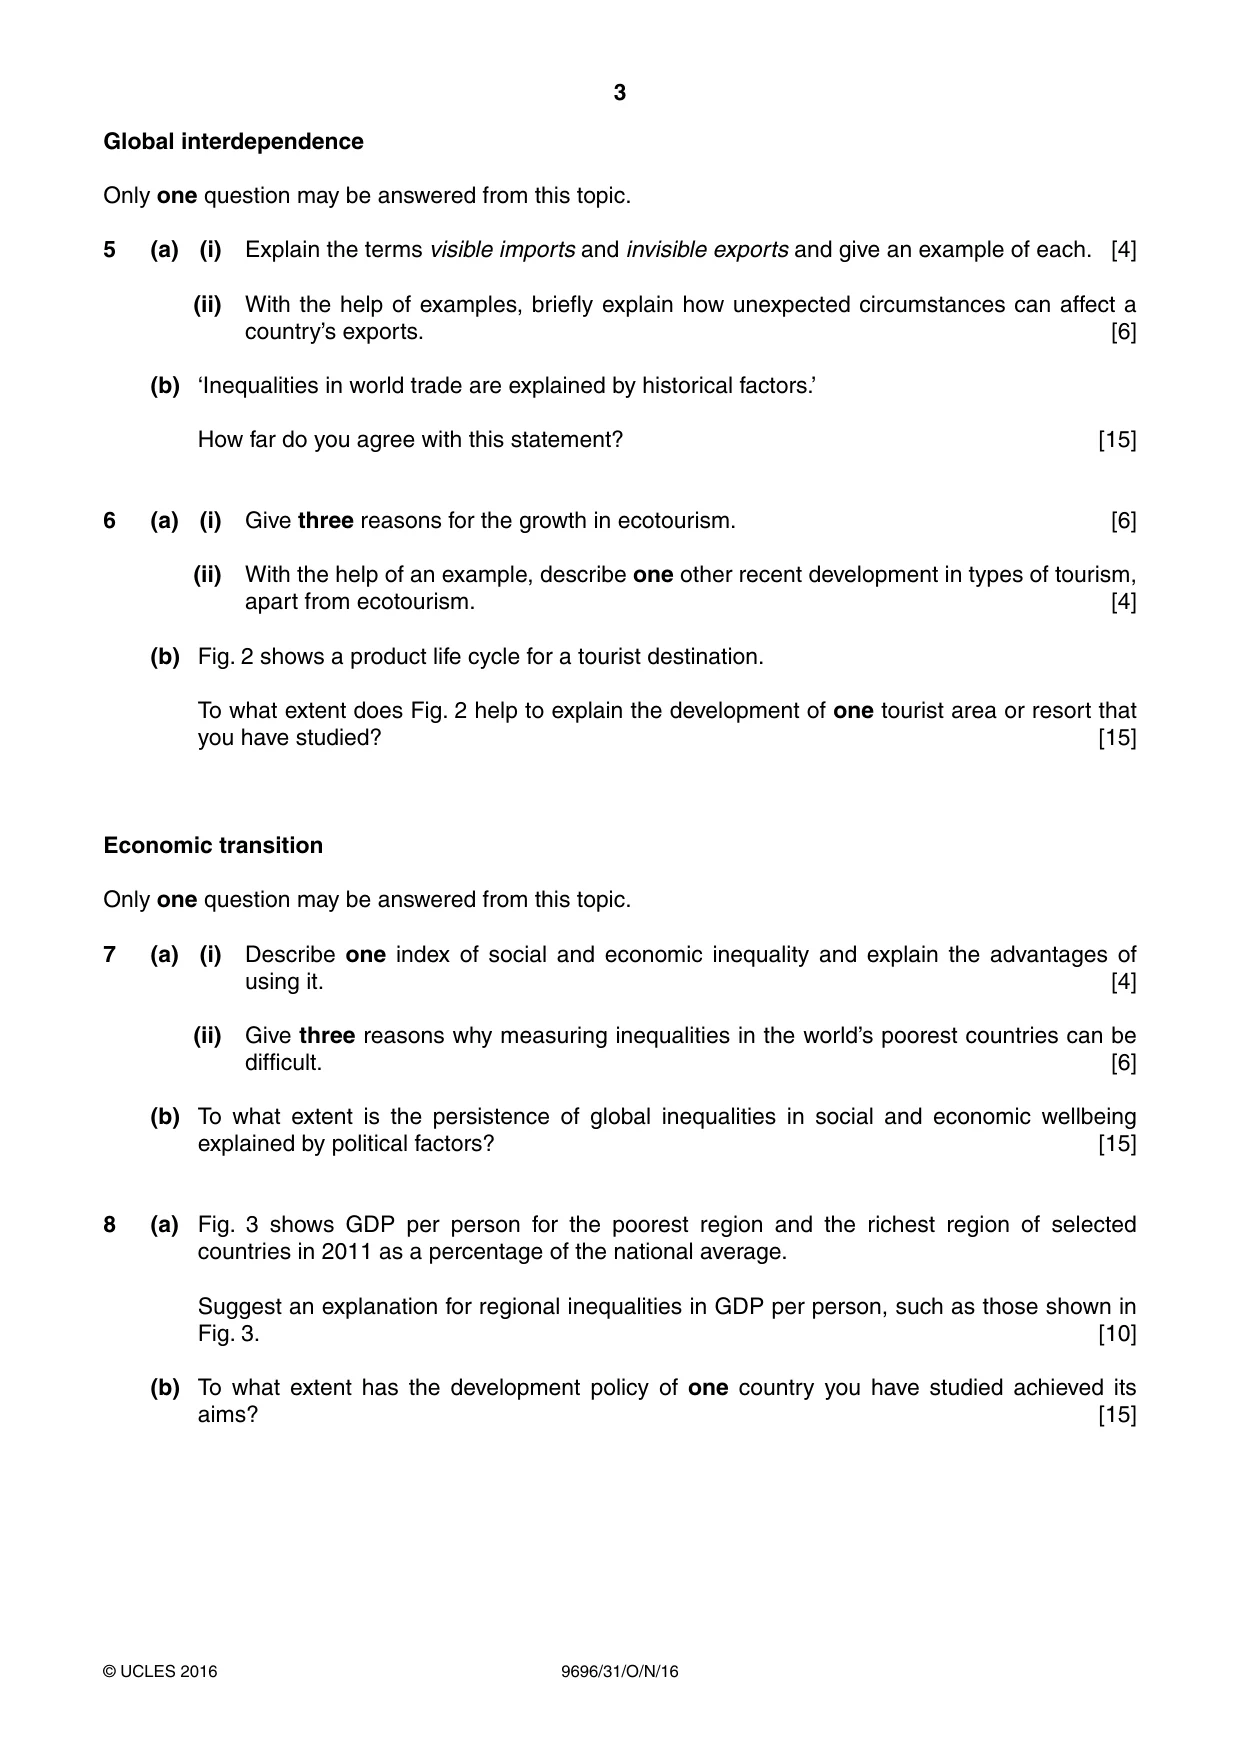
3 9696/31/O/N/16 © UCLES 2016 Global interdependence Only one question may be answered from this topic. 5 (a) (i) Explain the terms visible imports and invisible exports and give an example of each. [4] (ii) With the help of examples, briefly explain how unexpected circumstances can affect a country’s exports. [6] (b) ‘Inequalities in world trade are explained by historical factors.’ How far do you agree with this statement? [15] 6 (a) (i) Give three reasons for the growth in ecotourism. [6] (ii) With the help of an example, describe one other recent development in types of tourism, apart from ecotourism. [4] (b) Fig. 2 shows a product life cycle for a tourist destination. To what extent does Fig. 2 help to explain the development of one tourist area or resort that you have studied? [15] Economic transition Only one question may be answered from this topic. 7 (a) (i) Describe one index of social and economic inequality and explain the advantages of using it. [4] (ii) Give three reasons why measuring inequalities in the world’s poorest countries can be difficult. [6] (b) To what extent is the persistence of global inequalities in social and economic wellbeing explained by political factors? [15] 8 (a) Fig. 3 shows GDP per person for the poorest region and the richest region of selected countries in 2011 as a percentage of the national average. Suggest an explanation for regional inequalities in GDP per person, such as those shown in Fig. 3. [10] (b) To what extent has the development policy of one country you have studied achieved its aims? [15]
Question paper, page 4
4 9696/31/O/N/16 © UCLES 2016 BLANK PAGE Permission to reproduce items where third-party owned material protected by copyright is included has been sought and cleared where possible. Every reasonable effort has been made by the publisher (UCLES) to trace copyright holders, but if any items requiring clearance have unwittingly been included, the publisher will be pleased to make amends at the earliest possible opportunity. To avoid the issue of disclosure of answer-related information to candidates, all copyright acknowledgements are reproduced online in the Cambridge International Examinations Copyright Acknowledgements Booklet. This is produced for each series of examinations and is freely available to download at www.cie.org.uk after the live examination series. Cambridge International Examinations is part of the Cambridge Assessment Group. Cambridge Assessment is the brand name of University of Cambridge Local Examinations Syndicate (UCLES), which is itself a department of the University of Cambridge.
Mark scheme, page 1
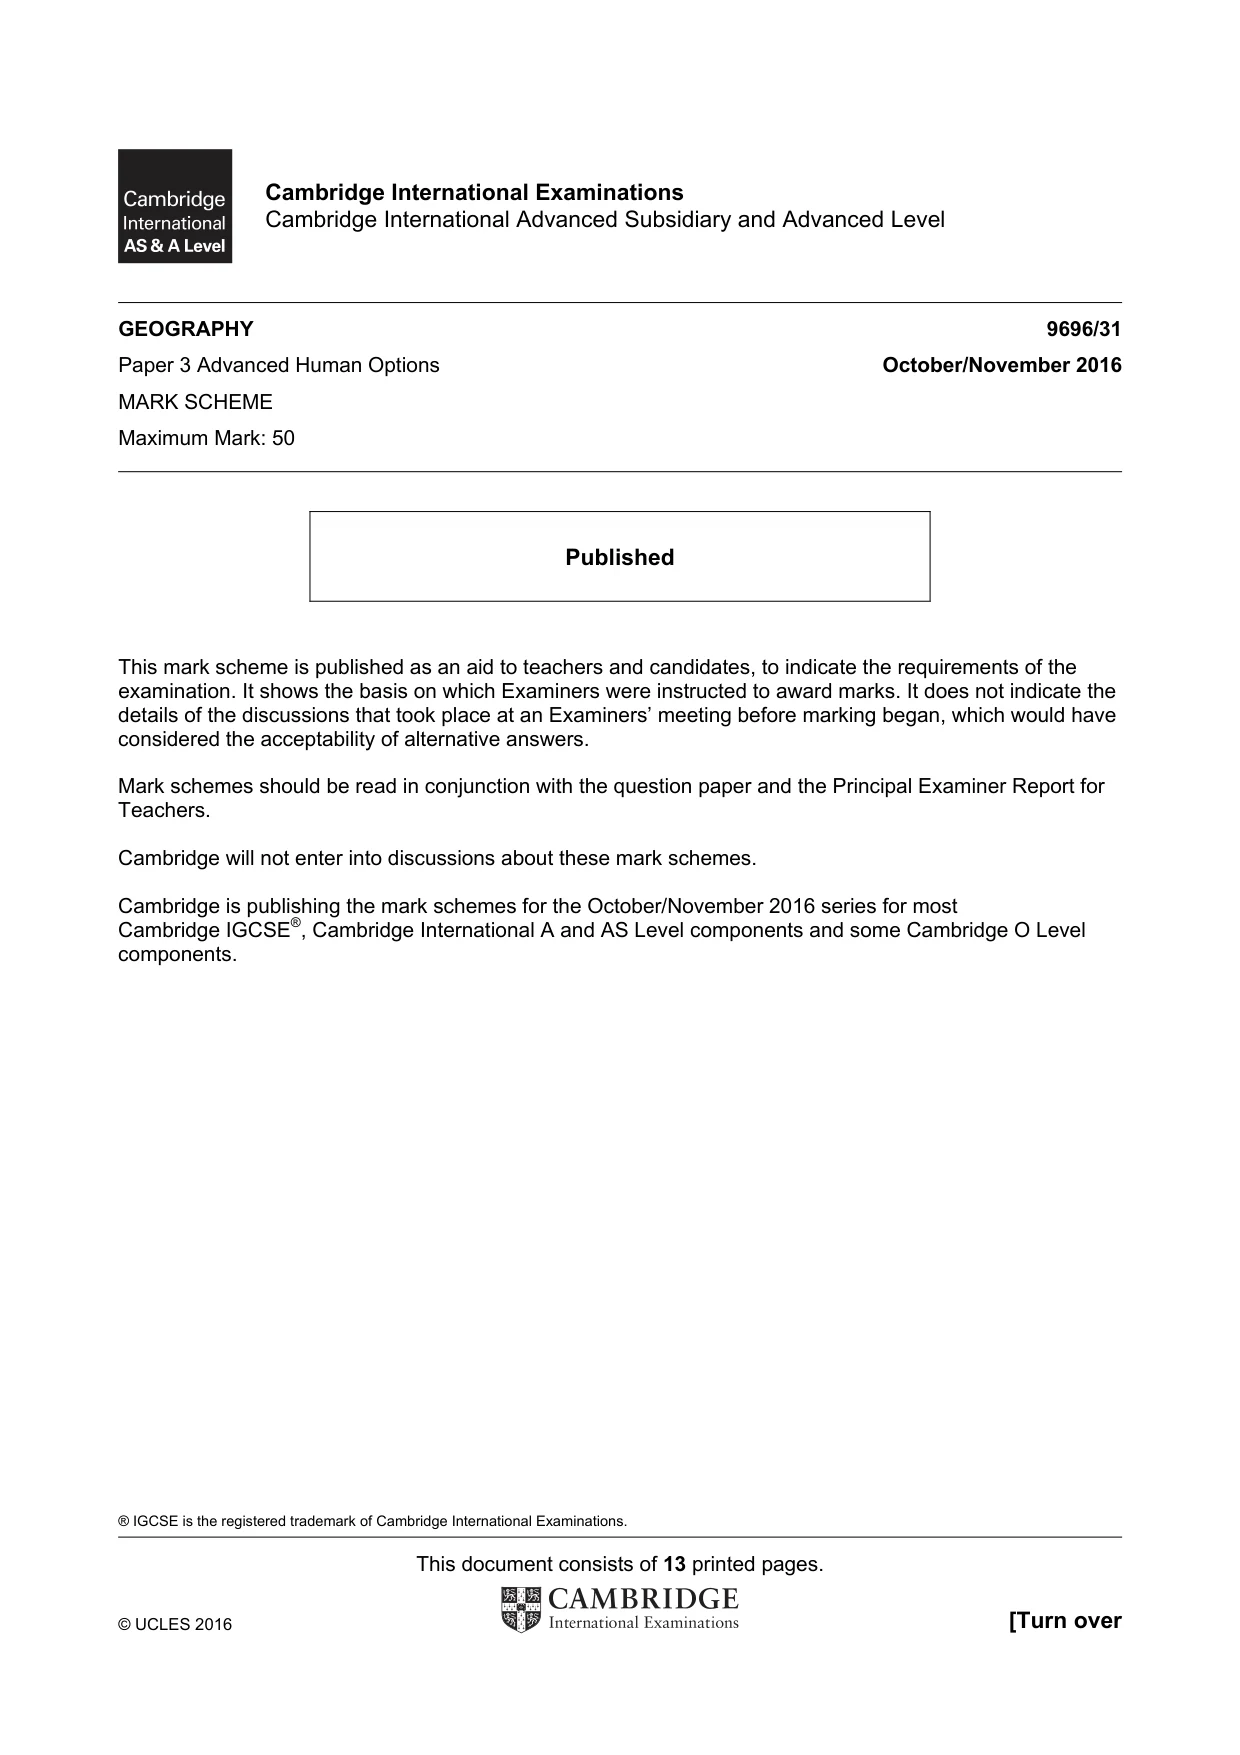
® IGCSE is the registered trademark of Cambridge International Examinations. This document consists of 13 printed pages. © UCLES 2016 [Turn over Cambridge International Examinations Cambridge International Advanced Subsidiary and Advanced Level GEOGRAPHY 9696/31 Paper 3 Advanced Human Options October/November 2016 MARK SCHEME Maximum Mark: 50 Published This mark scheme is published as an aid to teachers and candidates, to indicate the requirements of the examination. It shows the basis on which Examiners were instructed to award marks. It does not indicate the details of the discussions that took place at an Examiners’ meeting before marking began, which would have considered the acceptability of alternative answers. Mark schemes should be read in conjunction with the question paper and the Principal Examiner Report for Teachers. Cambridge will not enter into discussions about these mark schemes. Cambridge is publishing the mark schemes for the October/November 2016 series for most Cambridge IGCSE®, Cambridge International A and AS Level components and some Cambridge O Level components.
Mark scheme, page 2
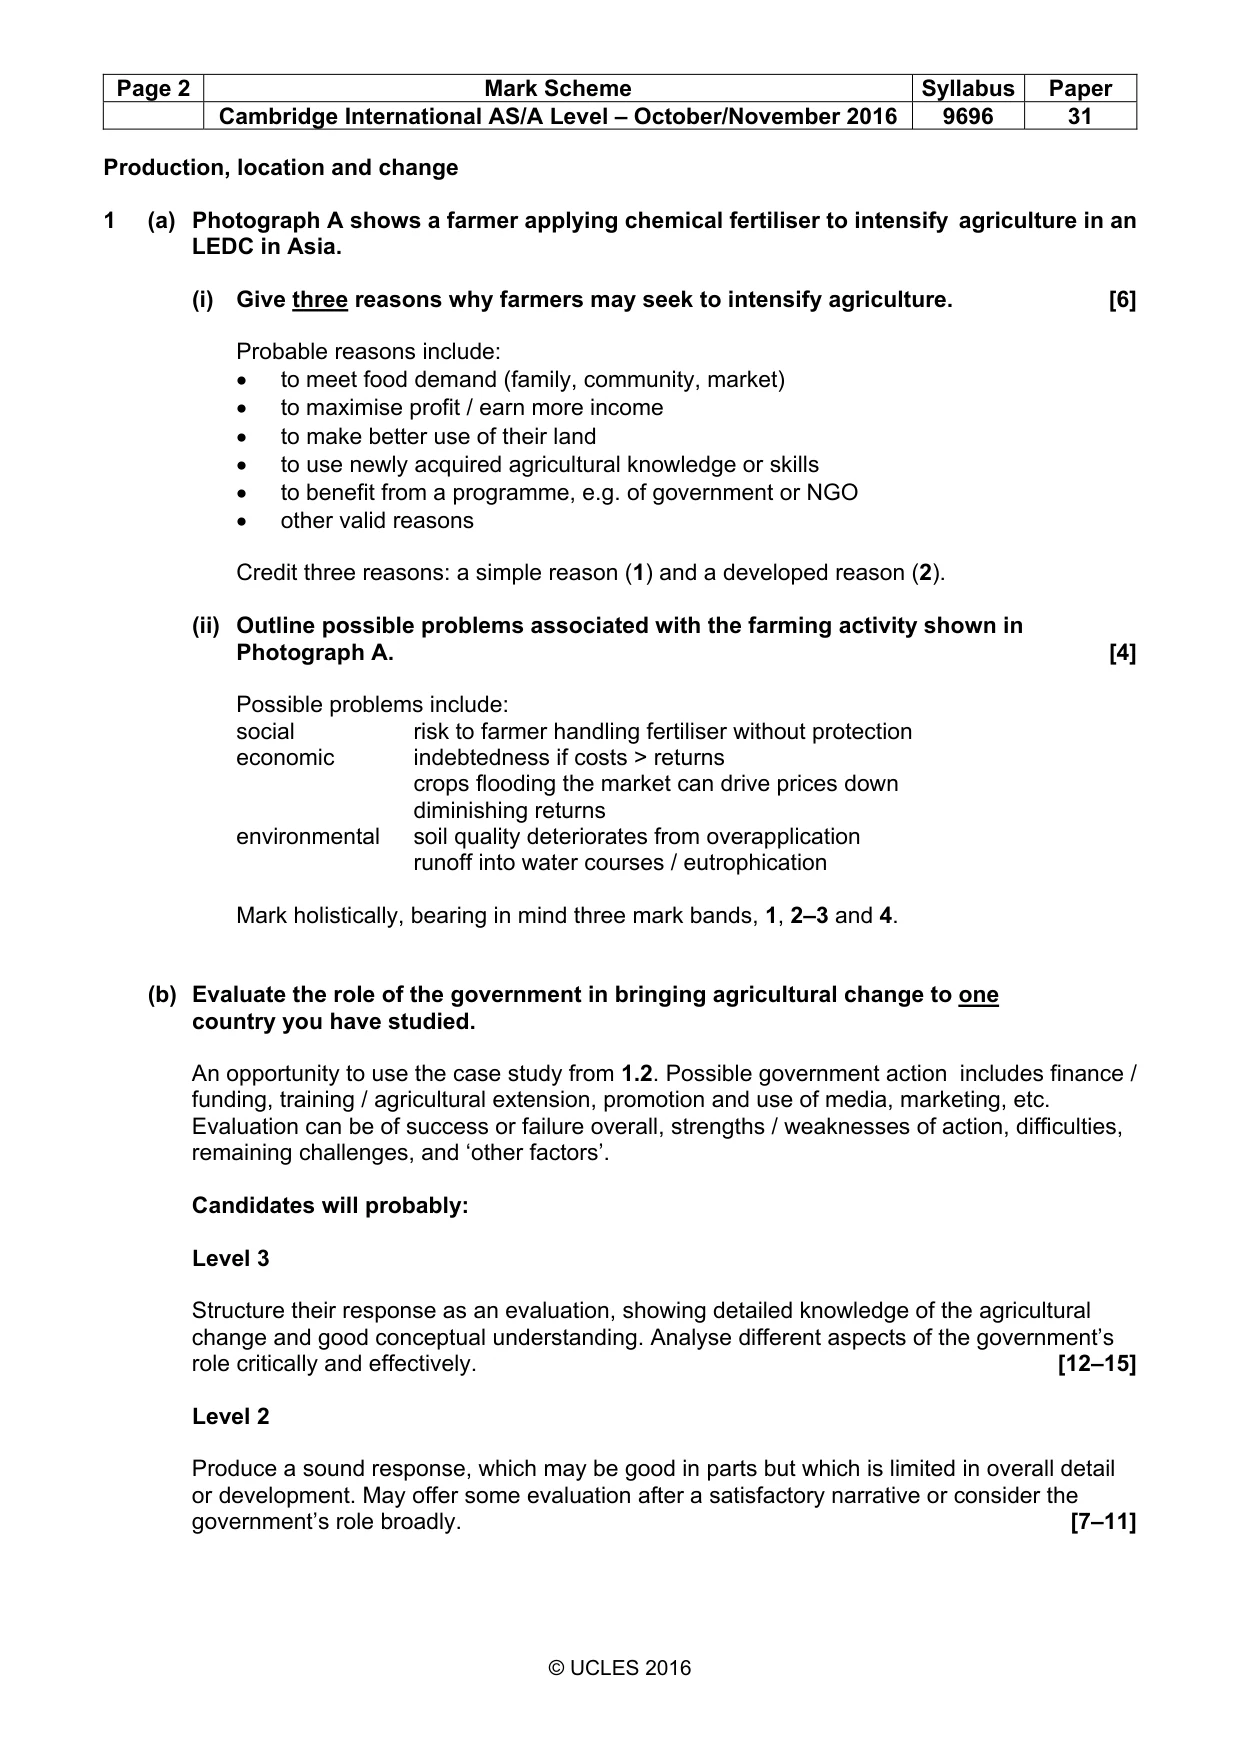
Page 2 Mark Scheme Syllabus Paper Cambridge International AS/A Level – October/November 2016 9696 31 © UCLES 2016 Production, location and change 1 (a) Photograph A shows a farmer applying chemical fertiliser to intensify agriculture in an LEDC in Asia. (i) Give three reasons why farmers may seek to intensify agriculture. [6] Probable reasons include: • to meet food demand (family, community, market) • to maximise profit / earn more income • to make better use of their land • to use newly acquired agricultural knowledge or skills • to benefit from a programme, e.g. of government or NGO • other valid reasons Credit three reasons: a simple reason (1) and a developed reason (2). (ii) Outline possible problems associated with the farming activity shown in Photograph A. [4] Possible problems include: social risk to farmer handling fertiliser without protection economic indebtedness if costs > returns crops flooding the market can drive prices down diminishing returns environmental soil quality deteriorates from overapplication runoff into water courses / eutrophication Mark holistically, bearing in mind three mark bands, 1, 2–3 and 4. (b) Evaluate the role of the government in bringing agricultural change to one country you have studied. An opportunity to use the case study from 1.2. Possible government action includes finance / funding, training / agricultural extension, promotion and use of media, marketing, etc. Evaluation can be of success or failure overall, strengths / weaknesses of action, difficulties, remaining challenges, and ‘other factors’. Candidates will probably: Level 3 Structure their response as an evaluation, showing detailed knowledge of the agricultural change and good conceptual understanding. Analyse different aspects of the government’s role critically and effectively. [12–15] Level 2 Produce a sound response, which may be good in parts but which is limited in overall detail or development. May offer some evaluation after a satisfactory narrative or consider the government’s role broadly. [7–11]
Mark scheme, page 3
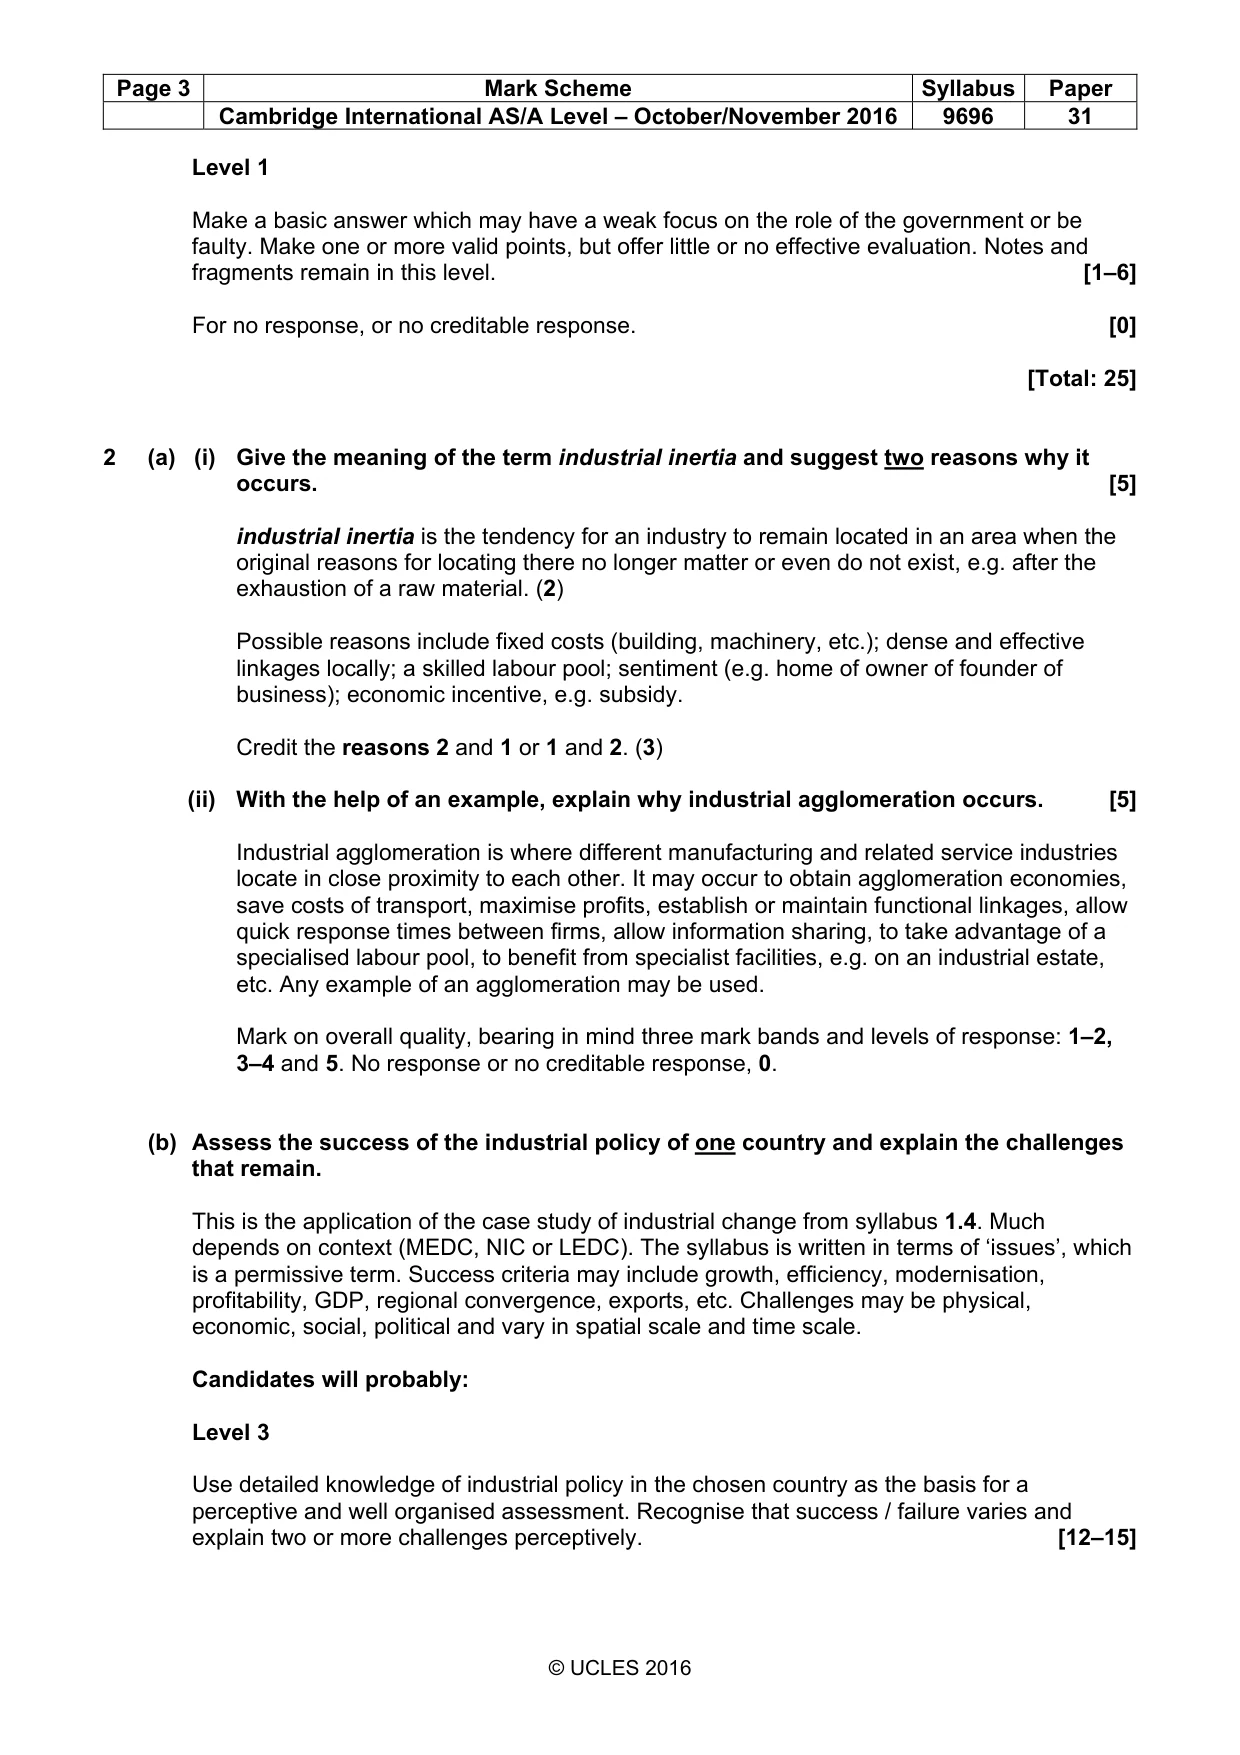
Page 3 Mark Scheme Syllabus Paper Cambridge International AS/A Level – October/November 2016 9696 31 © UCLES 2016 Level 1 Make a basic answer which may have a weak focus on the role of the government or be faulty. Make one or more valid points, but offer little or no effective evaluation. Notes and fragments remain in this level. [1–6] For no response, or no creditable response. [0] [Total: 25] 2 (a) (i) Give the meaning of the term industrial inertia and suggest two reasons why it occurs. [5] industrial inertia is the tendency for an industry to remain located in an area when the original reasons for locating there no longer matter or even do not exist, e.g. after the exhaustion of a raw material. (2) Possible reasons include fixed costs (building, machinery, etc.); dense and effective linkages locally; a skilled labour pool; sentiment (e.g. home of owner of founder of business); economic incentive, e.g. subsidy. Credit the reasons 2 and 1 or 1 and 2. (3) (ii) With the help of an example, explain why industrial agglomeration occurs. [5] Industrial agglomeration is where different manufacturing and related service industries locate in close proximity to each other. It may occur to obtain agglomeration economies, save costs of transport, maximise profits, establish or maintain functional linkages, allow quick response times between firms, allow information sharing, to take advantage of a specialised labour pool, to benefit from specialist facilities, e.g. on an industrial estate, etc. Any example of an agglomeration may be used. Mark on overall quality, bearing in mind three mark bands and levels of response: 1–2, 3–4 and 5. No response or no creditable response, 0. (b) Assess the success of the industrial policy of one country and explain the challenges that remain. This is the application of the case study of industrial change from syllabus 1.4. Much depends on context (MEDC, NIC or LEDC). The syllabus is written in terms of ‘issues’, which is a permissive term. Success criteria may include growth, efficiency, modernisation, profitability, GDP, regional convergence, exports, etc. Challenges may be physical, economic, social, political and vary in spatial scale and time scale. Candidates will probably: Level 3 Use detailed knowledge of industrial policy in the chosen country as the basis for a perceptive and well organised assessment. Recognise that success / failure varies and explain two or more challenges perceptively. [12–15]
Mark scheme, page 4
Page 4 Mark Scheme Syllabus Paper Cambridge International AS/A Level – October/November 2016 9696 31 © UCLES 2016 Level 2 Show reasonable to good knowledge of industrial change in the chosen country. May describe policy and then make an assessment which is partial or limited. At the lower end, the response may be quite general and challenges may be identified rather than explained, or remain implicit. [7–11] Level 1 Produce a response of basic quality which may be broadly located. Write descriptively of industry, offering little or no real assessment. Give one or more challenges or omit this element. Offer notes or fragments. [1–6] For no response, or no creditable response. [0] [Total: 25]
Mark scheme, page 5
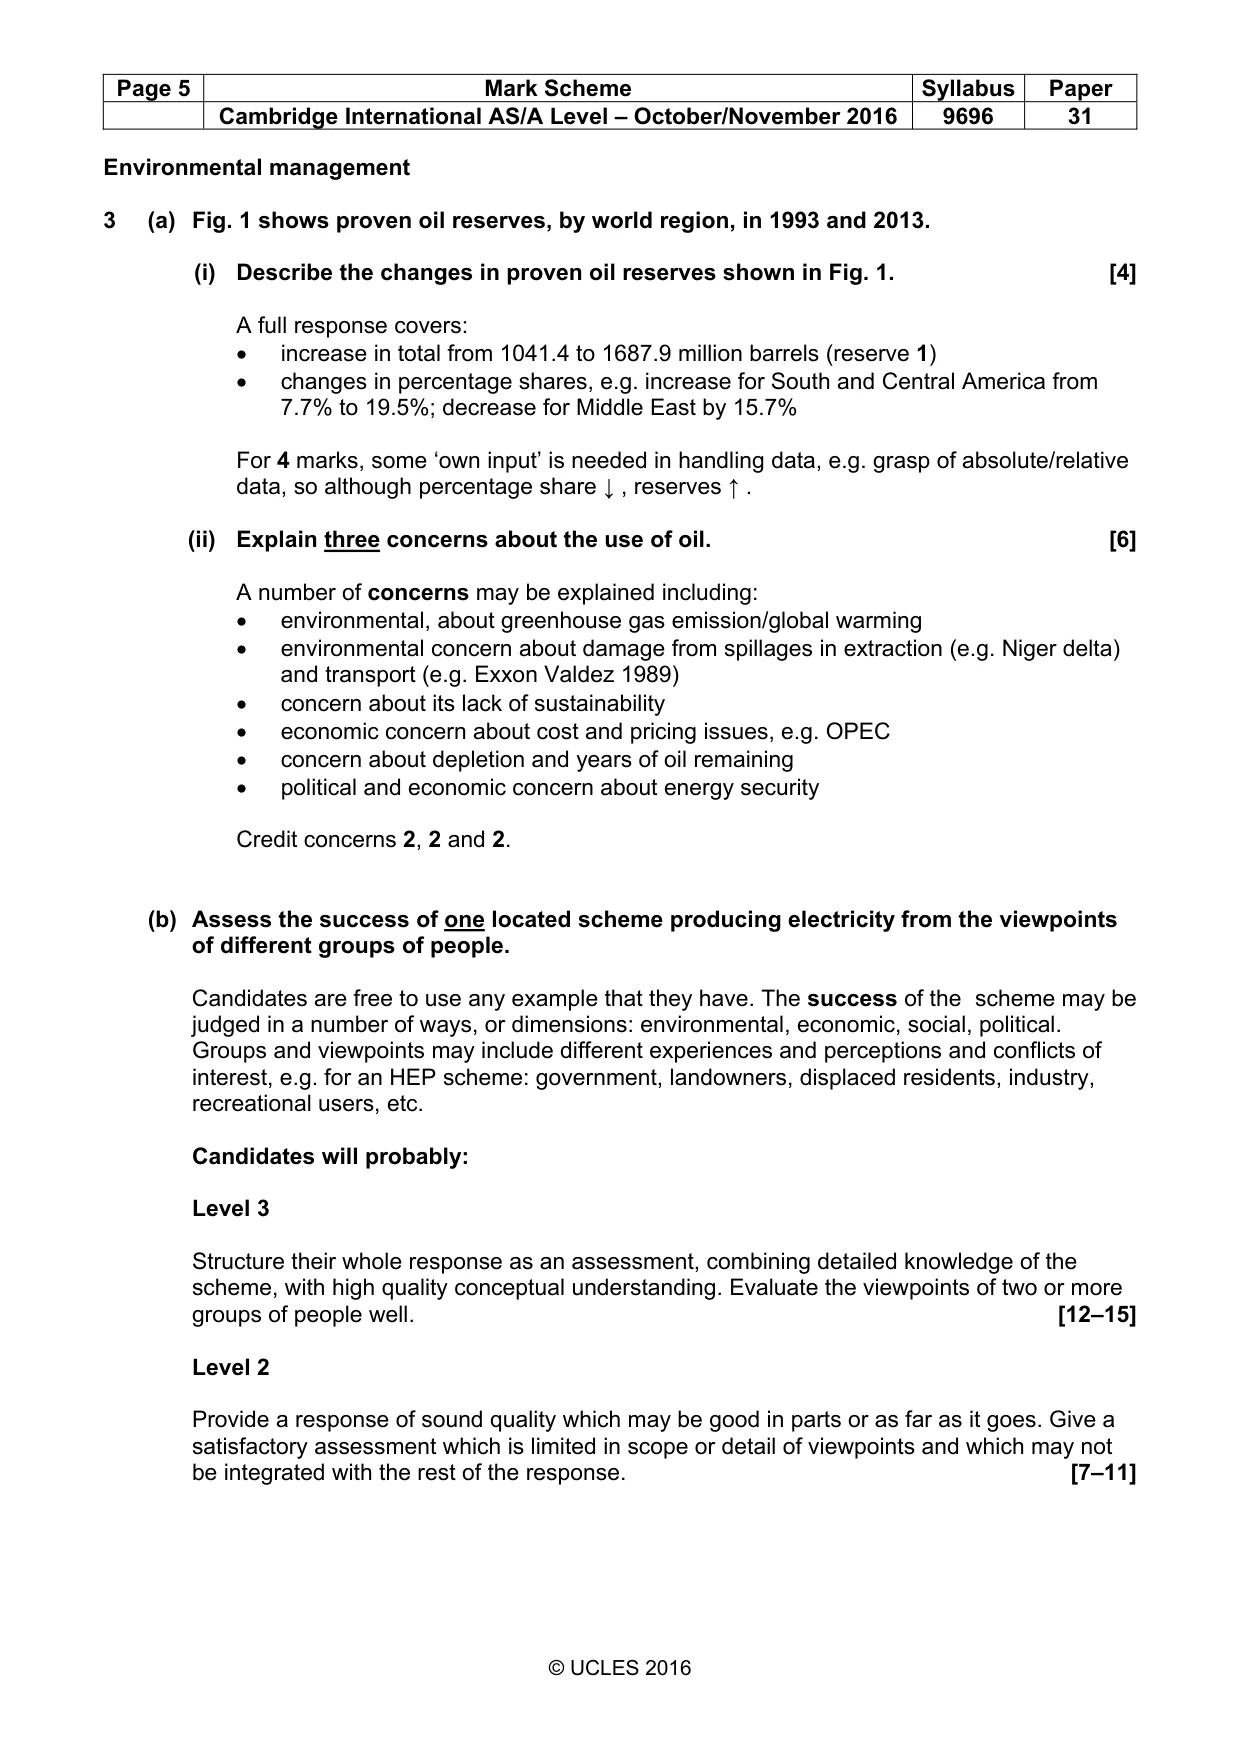
Page 5 Mark Scheme Syllabus Paper Cambridge International AS/A Level – October/November 2016 9696 31 © UCLES 2016 Environmental management 3 (a) Fig. 1 shows proven oil reserves, by world region, in 1993 and 2013. (i) Describe the changes in proven oil reserves shown in Fig. 1. [4] A full response covers: • increase in total from 1041.4 to 1687.9 million barrels (reserve 1) • changes in percentage shares, e.g. increase for South and Central America from 7.7% to 19.5%; decrease for Middle East by 15.7% For 4 marks, some ‘own input’ is needed in handling data, e.g. grasp of absolute/relative data, so although percentage share ↓ , reserves ↑ . (ii) Explain three concerns about the use of oil. [6] A number of concerns may be explained including: • environmental, about greenhouse gas emission/global warming • environmental concern about damage from spillages in extraction (e.g. Niger delta) and transport (e.g. Exxon Valdez 1989) • concern about its lack of sustainability • economic concern about cost and pricing issues, e.g. OPEC • concern about depletion and years of oil remaining • political and economic concern about energy security Credit concerns 2, 2 and 2. (b) Assess the success of one located scheme producing electricity from the viewpoints of different groups of people. Candidates are free to use any example that they have. The success of the scheme may be judged in a number of ways, or dimensions: environmental, economic, social, political. Groups and viewpoints may include different experiences and perceptions and conflicts of interest, e.g. for an HEP scheme: government, landowners, displaced residents, industry, recreational users, etc. Candidates will probably: Level 3 Structure their whole response as an assessment, combining detailed knowledge of the scheme, with high quality conceptual understanding. Evaluate the viewpoints of two or more groups of people well. [12–15] Level 2 Provide a response of sound quality which may be good in parts or as far as it goes. Give a satisfactory assessment which is limited in scope or detail of viewpoints and which may not be integrated with the rest of the response. [7–11]
Mark scheme, page 6
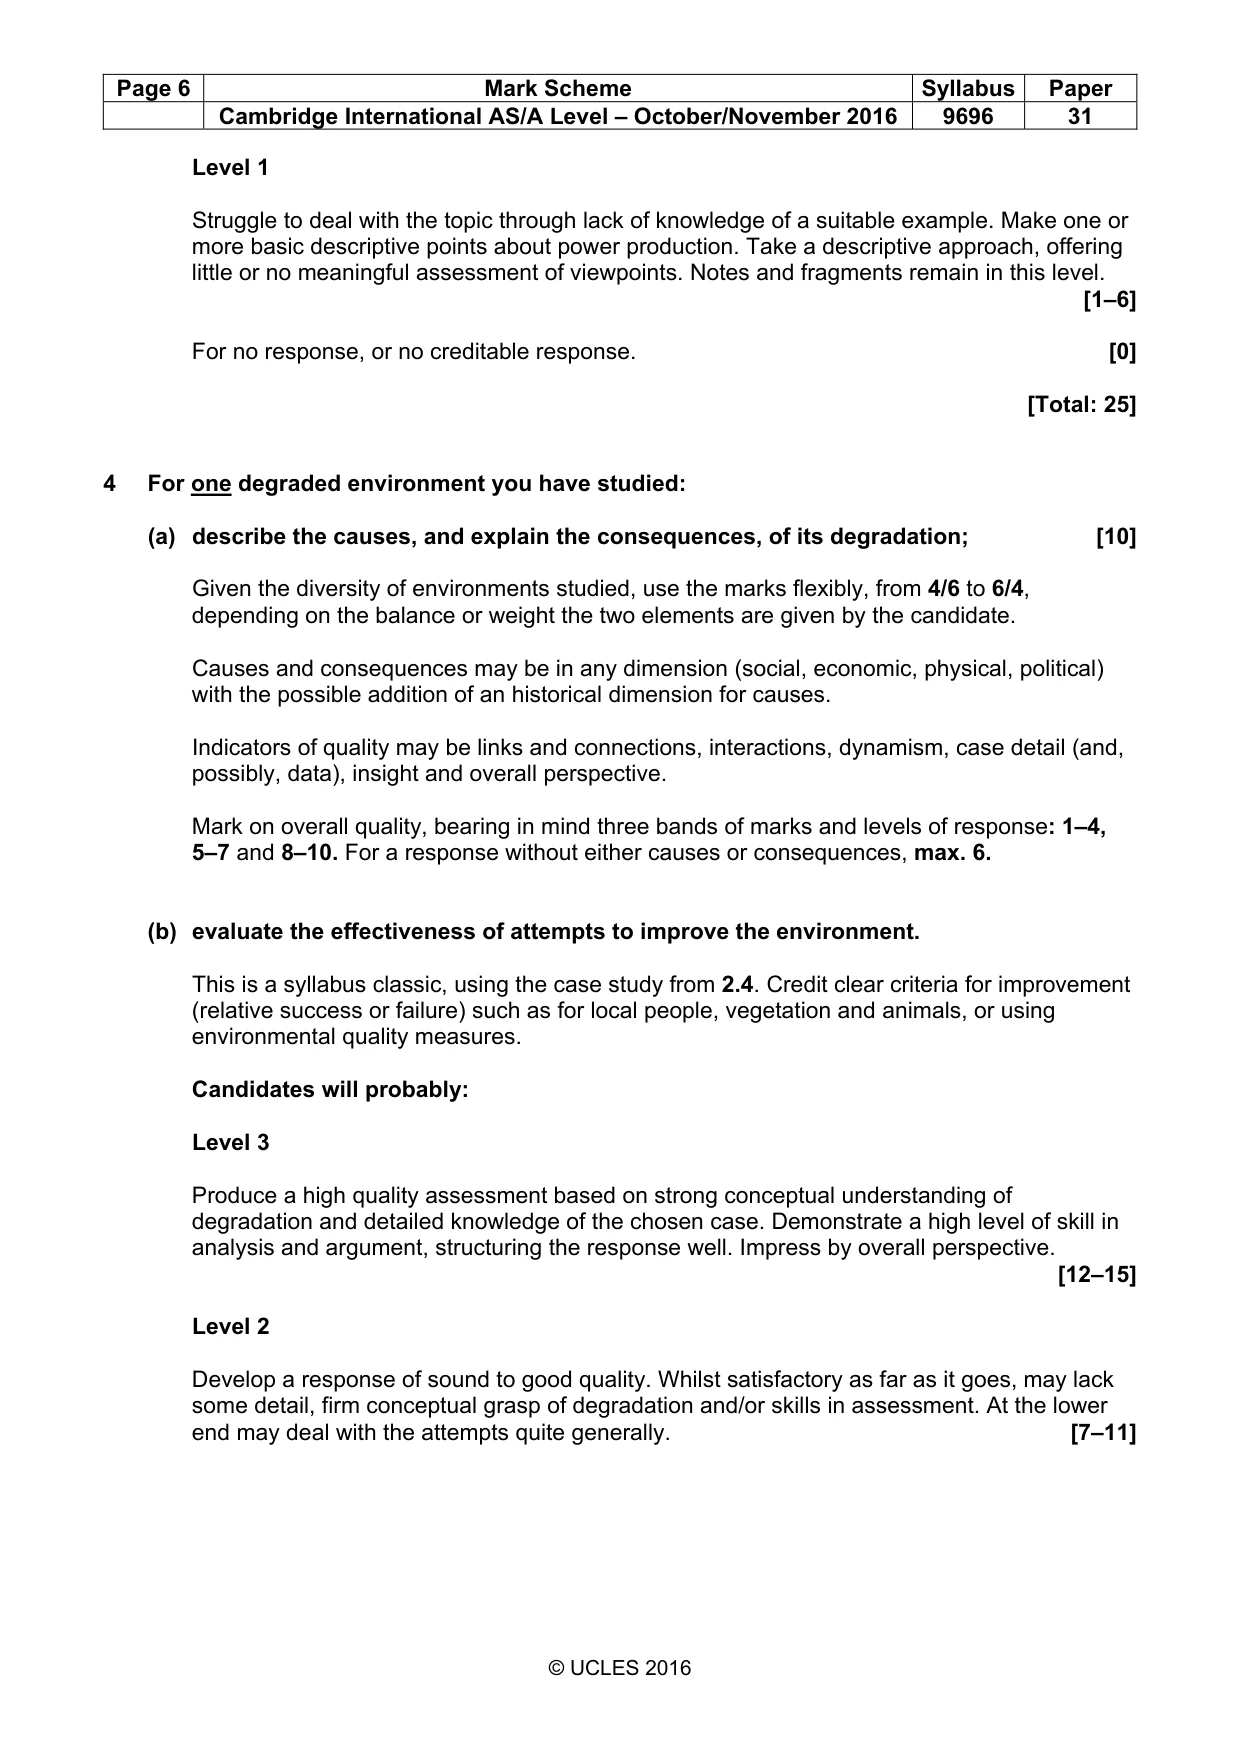
Page 6 Mark Scheme Syllabus Paper Cambridge International AS/A Level – October/November 2016 9696 31 © UCLES 2016 Level 1 Struggle to deal with the topic through lack of knowledge of a suitable example. Make one or more basic descriptive points about power production. Take a descriptive approach, offering little or no meaningful assessment of viewpoints. Notes and fragments remain in this level. [1–6] For no response, or no creditable response. [0] [Total: 25] 4 For one degraded environment you have studied: (a) describe the causes, and explain the consequences, of its degradation; [10] Given the diversity of environments studied, use the marks flexibly, from 4/6 to 6/4, depending on the balance or weight the two elements are given by the candidate. Causes and consequences may be in any dimension (social, economic, physical, political) with the possible addition of an historical dimension for causes. Indicators of quality may be links and connections, interactions, dynamism, case detail (and, possibly, data), insight and overall perspective. Mark on overall quality, bearing in mind three bands of marks and levels of response: 1–4, 5–7 and 8–10. For a response without either causes or consequences, max. 6. (b) evaluate the effectiveness of attempts to improve the environment. This is a syllabus classic, using the case study from 2.4. Credit clear criteria for improvement (relative success or failure) such as for local people, vegetation and animals, or using environmental quality measures. Candidates will probably: Level 3 Produce a high quality assessment based on strong conceptual understanding of degradation and detailed knowledge of the chosen case. Demonstrate a high level of skill in analysis and argument, structuring the response well. Impress by overall perspective. [12–15] Level 2 Develop a response of sound to good quality. Whilst satisfactory as far as it goes, may lack some detail, firm conceptual grasp of degradation and/or skills in assessment. At the lower end may deal with the attempts quite generally. [7–11]
Mark scheme, page 7
Page 7 Mark Scheme Syllabus Paper Cambridge International AS/A Level – October/November 2016 9696 31 © UCLES 2016 Level 1 Make a response which is more a description than an assessment. Offer a few basic observations about the environment and what was done. Notes and fragmentary responses remain in this level. [1–6] For no response, or no creditable response. [0] [Total: 25]
Mark scheme, page 8
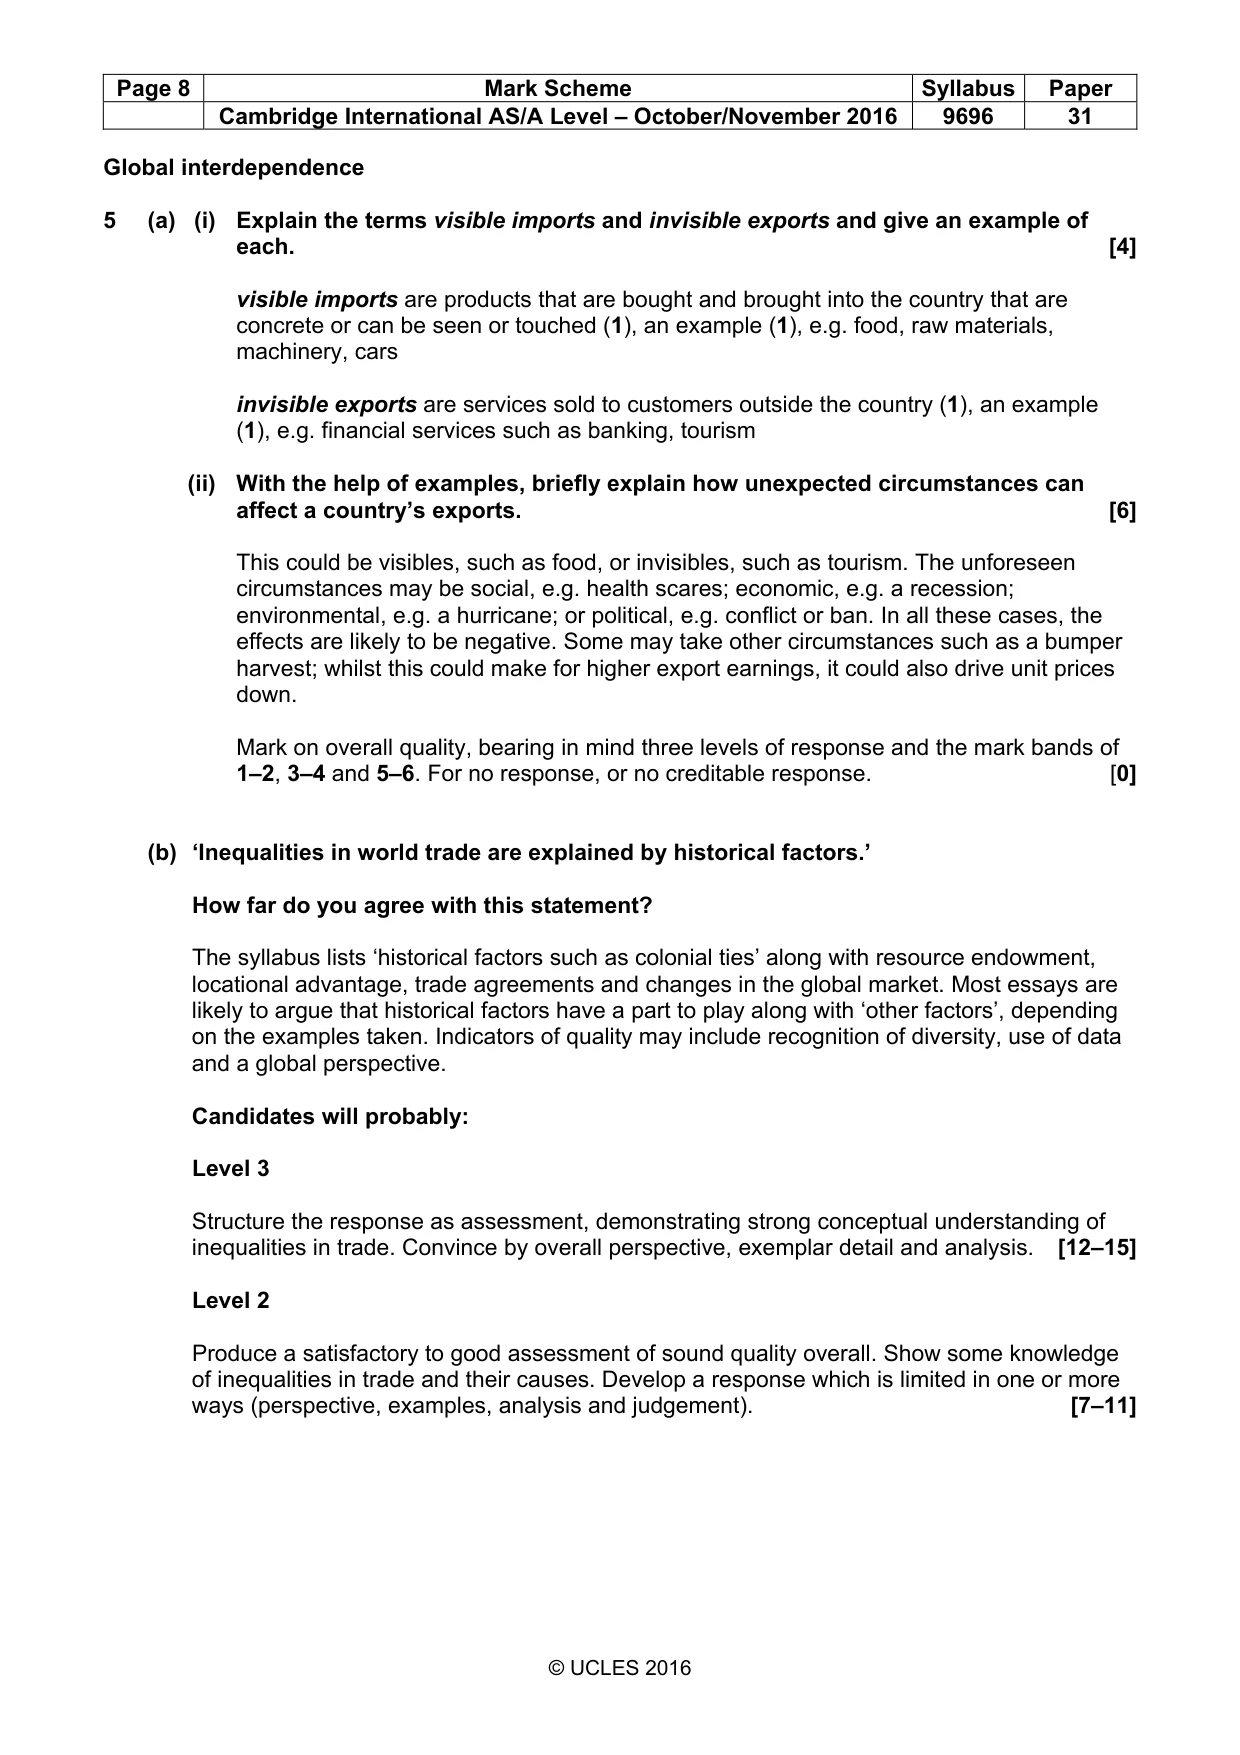
Page 8 Mark Scheme Syllabus Paper Cambridge International AS/A Level – October/November 2016 9696 31 © UCLES 2016 Global interdependence 5 (a) (i) Explain the terms visible imports and invisible exports and give an example of each. [4] visible imports are products that are bought and brought into the country that are concrete or can be seen or touched (1), an example (1), e.g. food, raw materials, machinery, cars invisible exports are services sold to customers outside the country (1), an example (1), e.g. financial services such as banking, tourism (ii) With the help of examples, briefly explain how unexpected circumstances can affect a country’s exports. [6] This could be visibles, such as food, or invisibles, such as tourism. The unforeseen circumstances may be social, e.g. health scares; economic, e.g. a recession; environmental, e.g. a hurricane; or political, e.g. conflict or ban. In all these cases, the effects are likely to be negative. Some may take other circumstances such as a bumper harvest; whilst this could make for higher export earnings, it could also drive unit prices down. Mark on overall quality, bearing in mind three levels of response and the mark bands of 1–2, 3–4 and 5–6. For no response, or no creditable response. [0] (b) ‘Inequalities in world trade are explained by historical factors.’ How far do you agree with this statement? The syllabus lists ‘historical factors such as colonial ties’ along with resource endowment, locational advantage, trade agreements and changes in the global market. Most essays are likely to argue that historical factors have a part to play along with ‘other factors’, depending on the examples taken. Indicators of quality may include recognition of diversity, use of data and a global perspective. Candidates will probably: Level 3 Structure the response as assessment, demonstrating strong conceptual understanding of inequalities in trade. Convince by overall perspective, exemplar detail and analysis. [12–15] Level 2 Produce a satisfactory to good assessment of sound quality overall. Show some knowledge of inequalities in trade and their causes. Develop a response which is limited in one or more ways (perspective, examples, analysis and judgement). [7–11]
Mark scheme, page 9
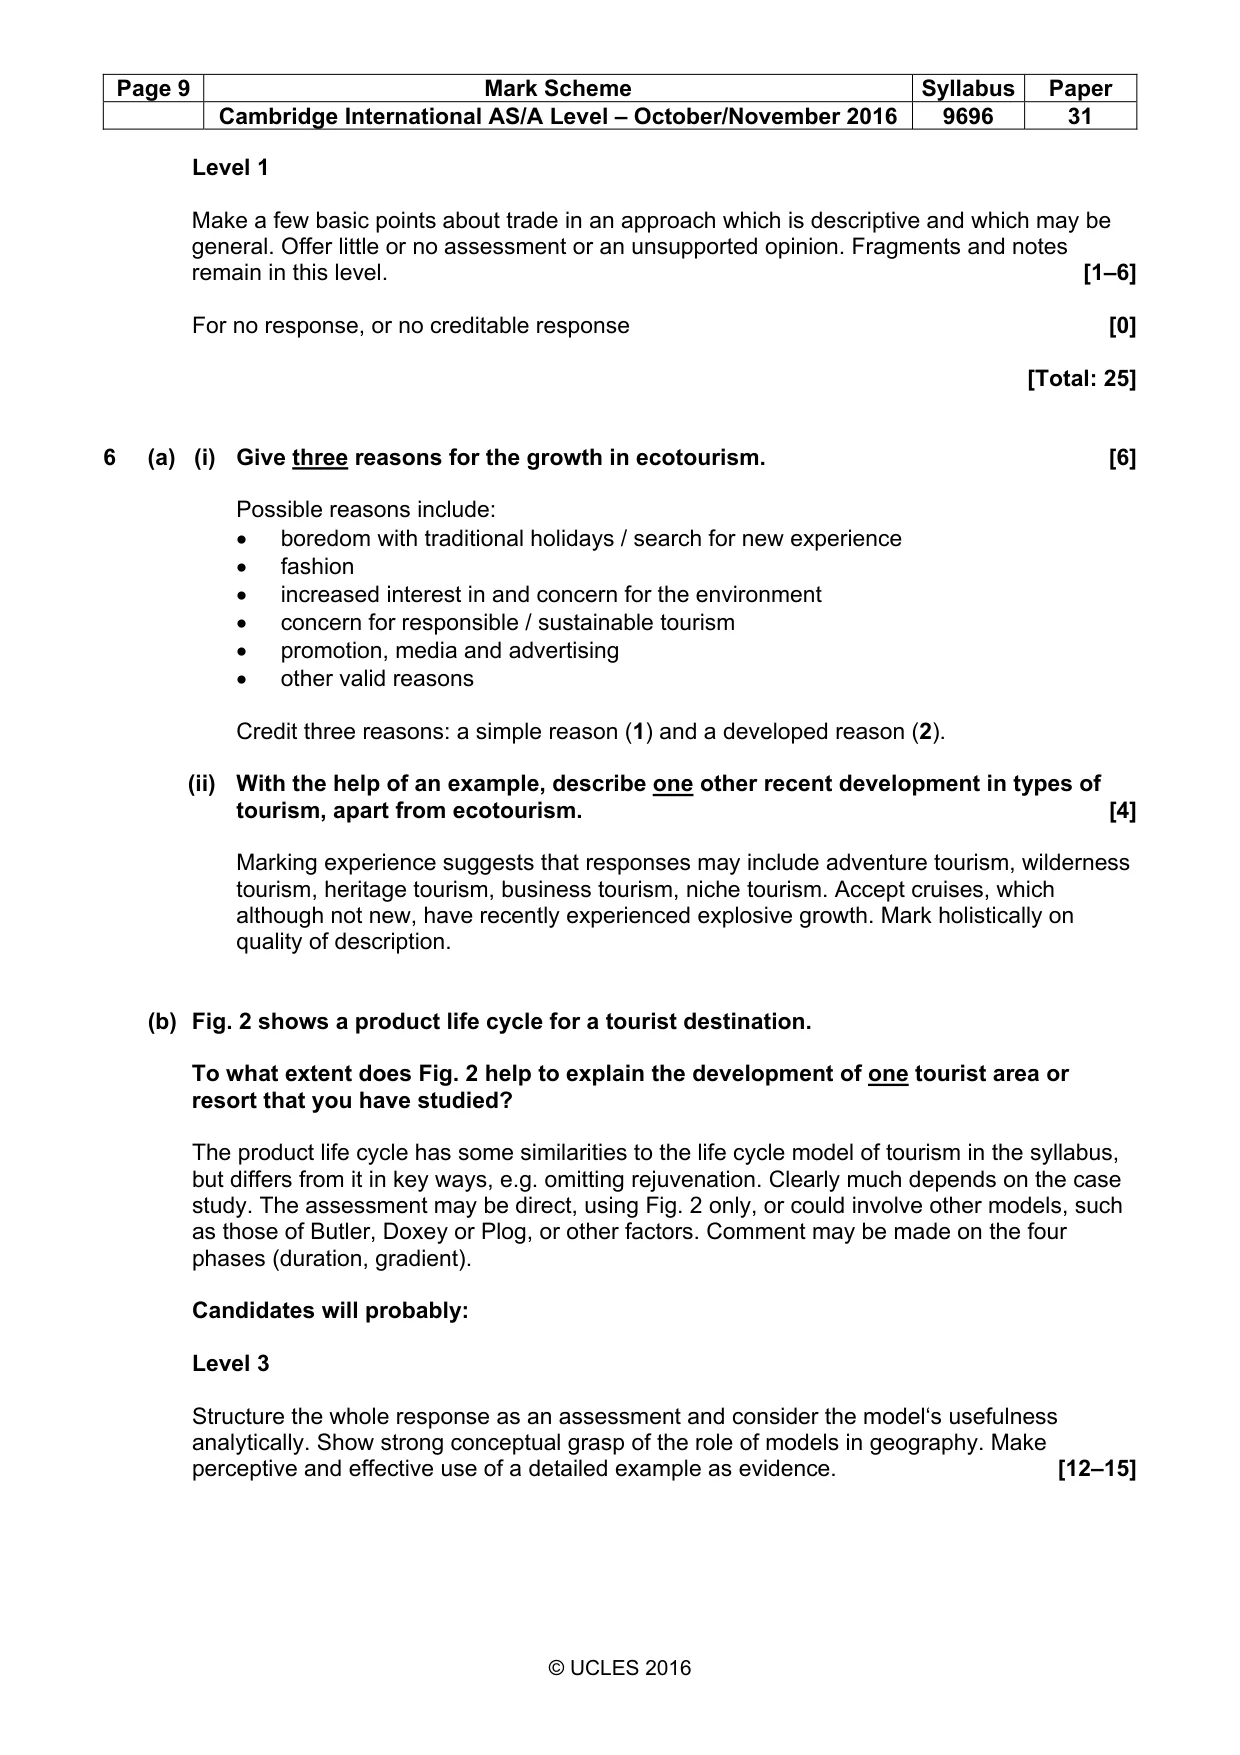
Page 9 Mark Scheme Syllabus Paper Cambridge International AS/A Level – October/November 2016 9696 31 © UCLES 2016 Level 1 Make a few basic points about trade in an approach which is descriptive and which may be general. Offer little or no assessment or an unsupported opinion. Fragments and notes remain in this level. [1–6] For no response, or no creditable response [0] [Total: 25] 6 (a) (i) Give three reasons for the growth in ecotourism. [6] Possible reasons include: • boredom with traditional holidays / search for new experience • fashion • increased interest in and concern for the environment • concern for responsible / sustainable tourism • promotion, media and advertising • other valid reasons Credit three reasons: a simple reason (1) and a developed reason (2). (ii) With the help of an example, describe one other recent development in types of tourism, apart from ecotourism. [4] Marking experience suggests that responses may include adventure tourism, wilderness tourism, heritage tourism, business tourism, niche tourism. Accept cruises, which although not new, have recently experienced explosive growth. Mark holistically on quality of description. (b) Fig. 2 shows a product life cycle for a tourist destination. To what extent does Fig. 2 help to explain the development of one tourist area or resort that you have studied? The product life cycle has some similarities to the life cycle model of tourism in the syllabus, but differs from it in key ways, e.g. omitting rejuvenation. Clearly much depends on the case study. The assessment may be direct, using Fig. 2 only, or could involve other models, such as those of Butler, Doxey or Plog, or other factors. Comment may be made on the four phases (duration, gradient). Candidates will probably: Level 3 Structure the whole response as an assessment and consider the model‘s usefulness analytically. Show strong conceptual grasp of the role of models in geography. Make perceptive and effective use of a detailed example as evidence. [12–15]
Mark scheme, page 10
Page 10 Mark Scheme Syllabus Paper Cambridge International AS/A Level – October/November 2016 9696 31 © UCLES 2016 Level 2 Provide a response of sound to good quality which is satisfactory as far as it goes, but which remains underdeveloped in detail or in the overall assessment offered. May ‘top and tail’ a narrative of the case with evaluative comments. At the lower end may focus on the life cycle model rather than the product life cycle. [7–11] Level 1 Make one or more simple observations about the product life cycle and how it relates to the named area. May offer a generalised piece lacking a clear located example. Take a descriptive more than an evaluative approach. Notes and fragments remain in this level. [1–6] For no response, or no creditable response. [0] [Total: 25]
Mark scheme, page 11
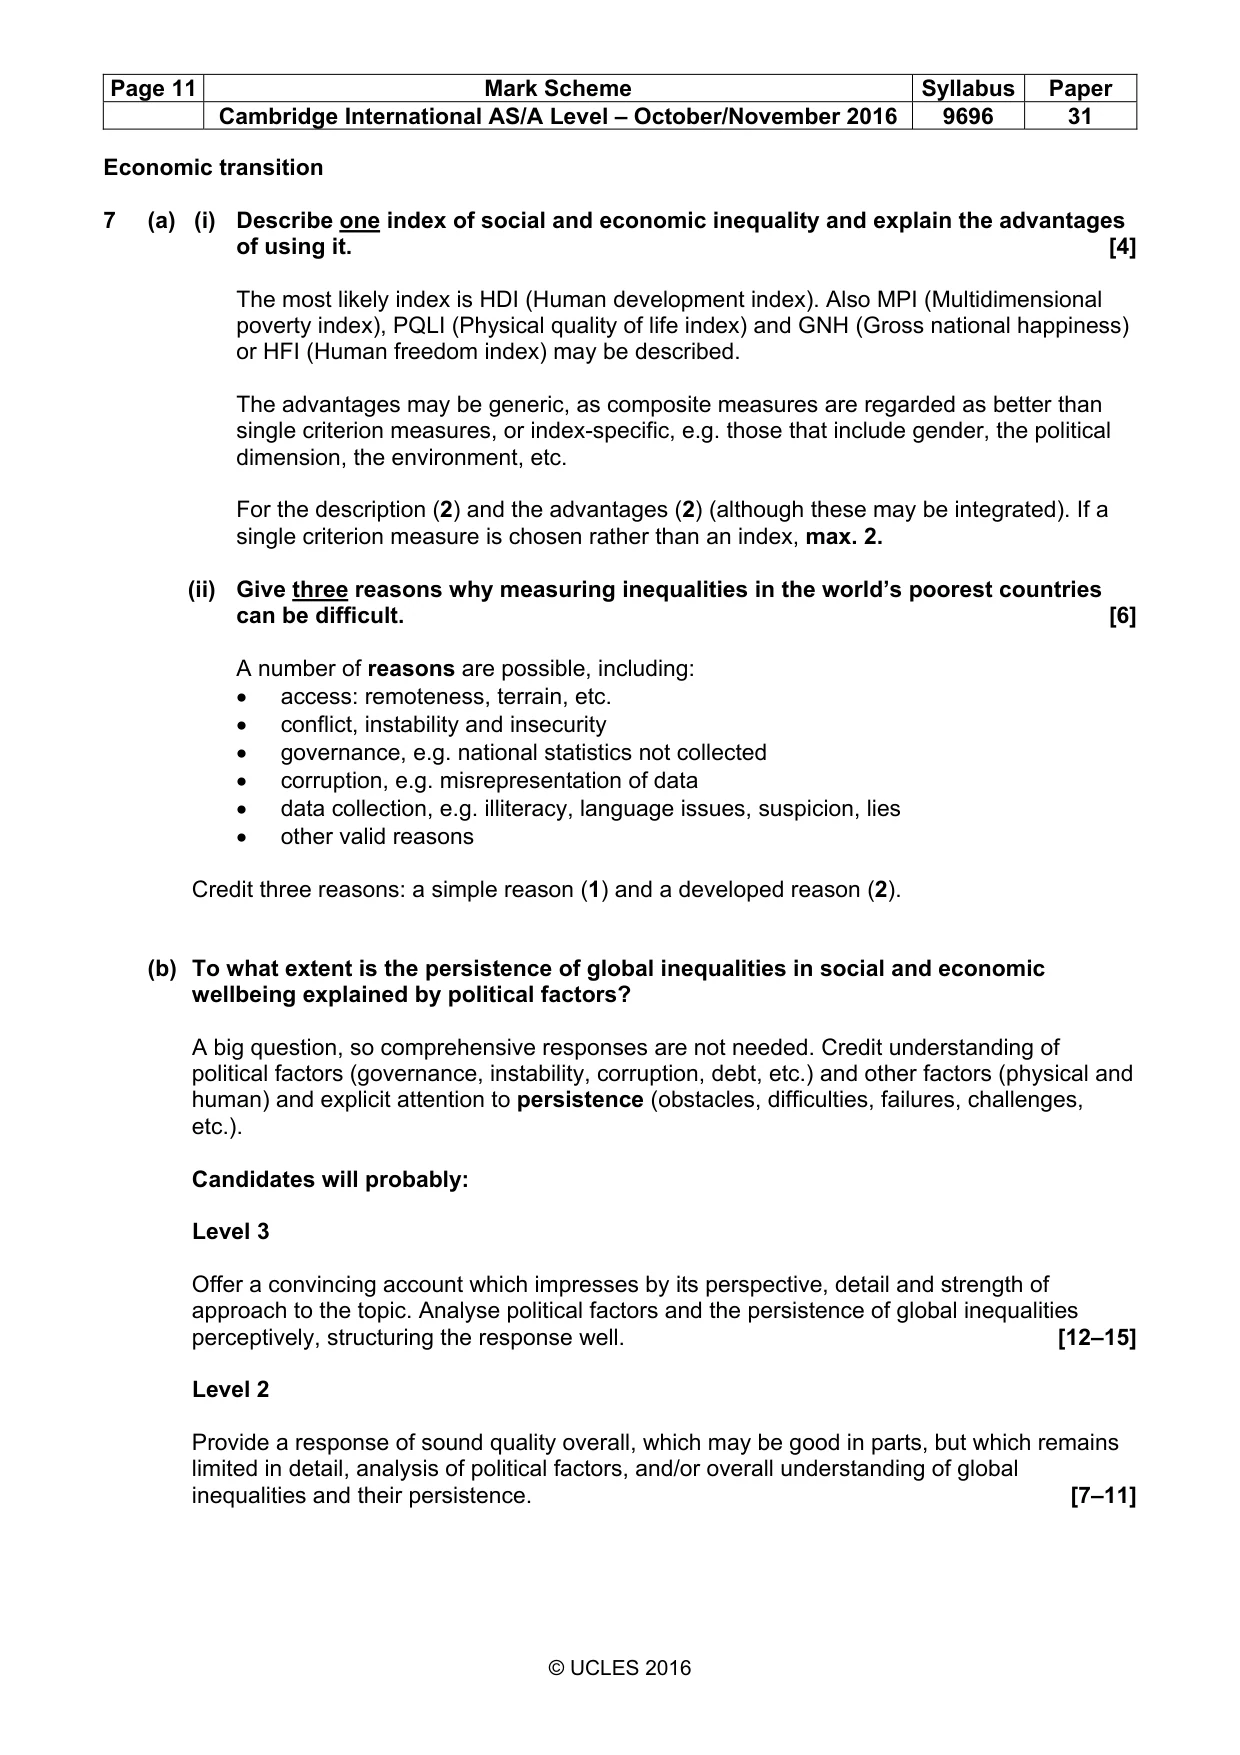
Page 11 Mark Scheme Syllabus Paper Cambridge International AS/A Level – October/November 2016 9696 31 © UCLES 2016 Economic transition 7 (a) (i) Describe one index of social and economic inequality and explain the advantages of using it. [4] The most likely index is HDI (Human development index). Also MPI (Multidimensional poverty index), PQLI (Physical quality of life index) and GNH (Gross national happiness) or HFI (Human freedom index) may be described. The advantages may be generic, as composite measures are regarded as better than single criterion measures, or index-specific, e.g. those that include gender, the political dimension, the environment, etc. For the description (2) and the advantages (2) (although these may be integrated). If a single criterion measure is chosen rather than an index, max. 2. (ii) Give three reasons why measuring inequalities in the world’s poorest countries can be difficult. [6] A number of reasons are possible, including: • access: remoteness, terrain, etc. • conflict, instability and insecurity • governance, e.g. national statistics not collected • corruption, e.g. misrepresentation of data • data collection, e.g. illiteracy, language issues, suspicion, lies • other valid reasons Credit three reasons: a simple reason (1) and a developed reason (2). (b) To what extent is the persistence of global inequalities in social and economic wellbeing explained by political factors? A big question, so comprehensive responses are not needed. Credit understanding of political factors (governance, instability, corruption, debt, etc.) and other factors (physical and human) and explicit attention to persistence (obstacles, difficulties, failures, challenges, etc.). Candidates will probably: Level 3 Offer a convincing account which impresses by its perspective, detail and strength of approach to the topic. Analyse political factors and the persistence of global inequalities perceptively, structuring the response well. [12–15] Level 2 Provide a response of sound quality overall, which may be good in parts, but which remains limited in detail, analysis of political factors, and/or overall understanding of global inequalities and their persistence. [7–11]
Mark scheme, page 12
Page 12 Mark Scheme Syllabus Paper Cambridge International AS/A Level – October/November 2016 9696 31 © UCLES 2016 Level 1 Make one or more simple observations about global inequalities. Struggle to select and apply learned material to the idea of persistence. Answer generally and/or descriptively, offering little or no political analysis. [1–6] For no response, or no creditable response. [0] [Total: 25] 8 (a) Fig. 3 shows GDP per person for the poorest region and the richest region of selected countries in 2011 as a percentage of the national average. Suggest an explanation for regional inequalities in GDP per person, such as those shown in Fig. 3. [10] The figure may be used as a general stimulus, or reference may be made to the countries in it, of which no knowledge is expected. Candidates are likely to make reference to a conceptual framework such as the core- periphery model (Friedmann, 1966) and/or cumulative causation (Myrdal, 1957) to establish regional divergence. They may then characterise core and periphery in terms of economic activity to help explain GDP per person further. The lack of a regional policy, its limitations or failure may also be contributory. Fully comprehensive responses are not needed; credit well an effective account. Mark on overall quality, bearing in mind three bands of marks and levels of response: 1–4, 5–7 and 8–10. For no response, or no creditable response, 0. As a general response may perform well, the usual maximum of 6 is not used. (b) To what extent has the development policy of one country you have studied achieved its aims? From syllabus 4.4. The policy may be national to develop the country further and so improve social and economic wellbeing overall, or regional, addressing development needs of the different regions. If a candidate writes about more than one country, mark each separately and credit the better or best. Candidates will probably: Level 3 Provide an effective evaluation of success, showing detailed knowledge of the chosen policy and a perceptive approach to its aims. Demonstrate strong conceptual understanding of development. Structure the response well. [12–15]
Mark scheme, page 13
Page 13 Mark Scheme Syllabus Paper Cambridge International AS/A Level – October/November 2016 9696 31 © UCLES 2016 Level 2 Produce a sound response which may be good in places. Take a broad but shallow approach to the chosen policy, or a rather restricted one, short on detail, conceptual understanding and/or evaluation. At the lower end, may produce rather a narrative of what was done and leave the aims implicit. [7–11] Level 1 Make a basic descriptive response about development more than an evaluative one. Write loosely or generally about what was done, leaving the policy’s aims unclear. Notes and fragmentary responses remain in this level. [1–6] For no response, or no creditable response. [0] [Total: 25]
What you needed in this session
Cambridge’s own grade thresholds for 2016 Oct/Nov, Paper 3 · Variant 1. A higher threshold means an easier paper — the bar moves with how the cohort did.