Cambridge A Level Geography 9696 — 2025 May/June Paper 3 · Variant 1
9696/31/M/J/25 · 11 questions · 60 marks · ≈68 min
The question paper and its mark scheme, free to read here and free to download. This is Cambridge’s own paper, exactly as it was sat.
Question paper4 pages

Mark scheme27 pages
Answers below. Sit the paper first if you are practising.













Questions as text
Q1 · A transect (A–B) showing the depth of weathered granite in northern Nigeria
1 Fig. 1.1 shows a transect (A–B) showing the depth of weathered granite in northern Nigeria. (a) Describe variations in the depth of weathered granite shown in Fig. 1.1. [4] (b) Suggest two reasons for the variations you described in (a). [6]
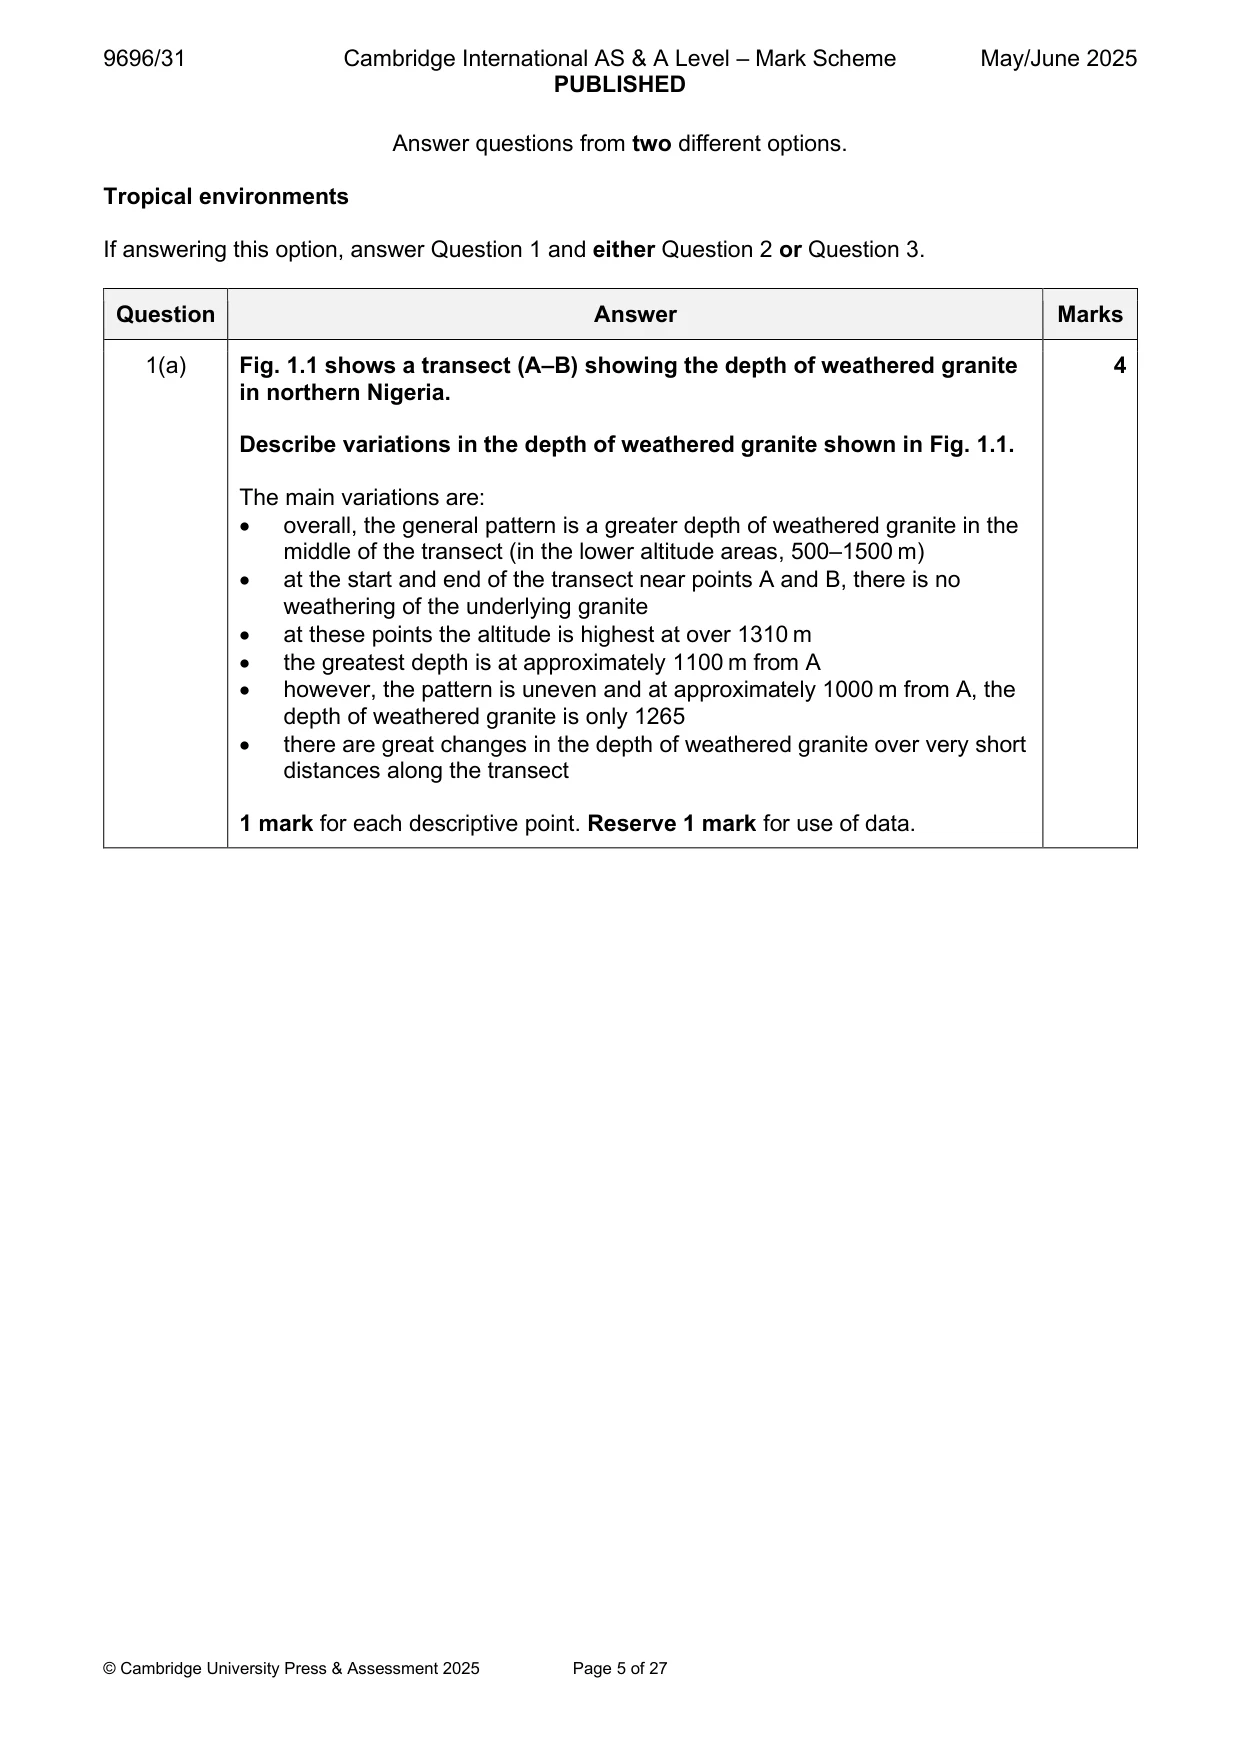
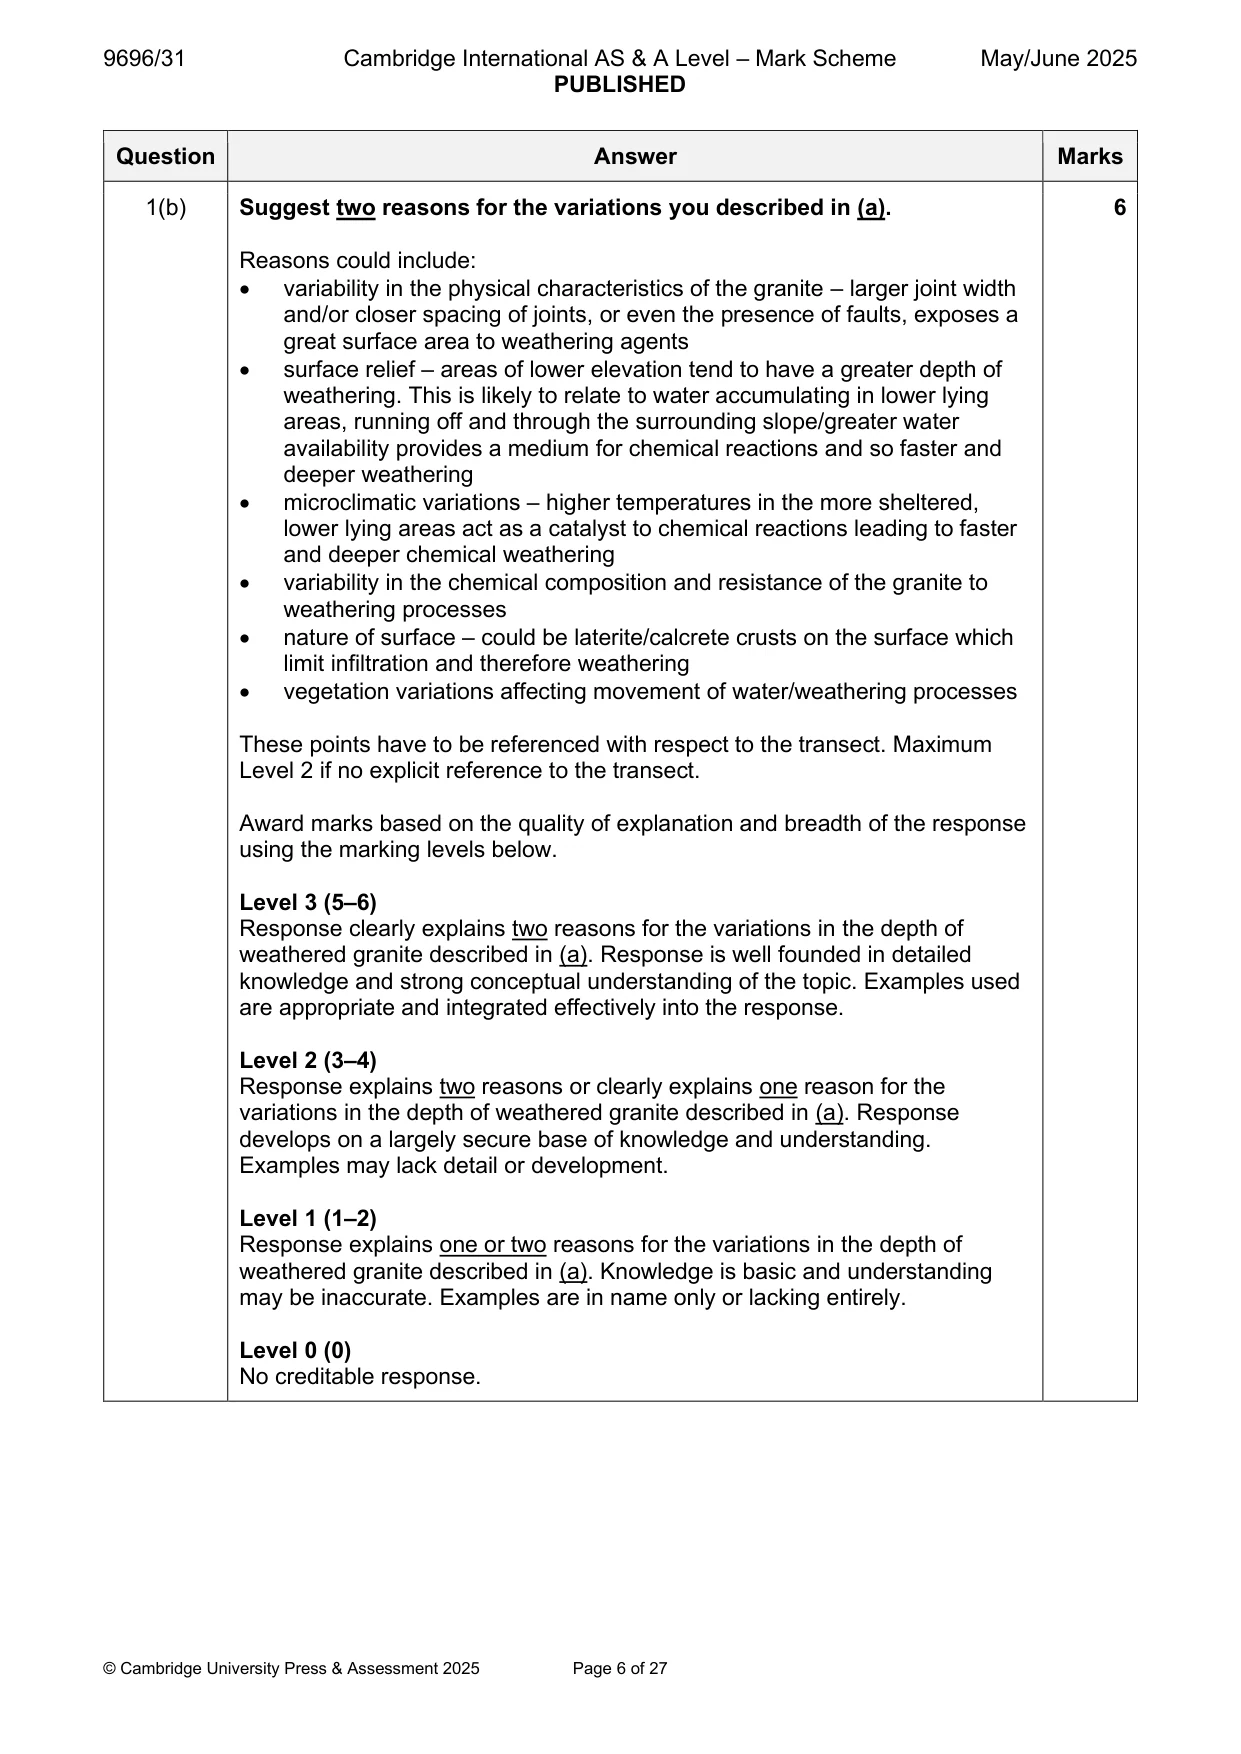
Mark scheme: Question Answer Marks 1(a) Fig. 1.1 shows a transect (A–B) showing the depth of weathered granite 4 in northern Nigeria. Describe variations in the depth of weathered granite shown in Fig. 1.1. The main variations are: • overall, the general pattern is a greater depth of weathered granite in the middle of the transect (in the lower altitude areas, 500–1500 m) • at the start and end of the transect near points A and B, there is no weathering of the underlying granite • at these points the altitude is highest at over 1310 m • the greatest depth is at approximately 1100 m from A • however, the pattern is uneven and at approximately 1000 m from A, the depth of weathered granite is only 1265 • there are great changes in the depth of weathered granite over very short distances along the transect 1 mark for each descriptive point. Reserve 1 mark for use of data. 1(b) Suggest two reasons for the variations you described in (a). 6 Reasons could include: • variability in the physical characteristics of the granite – larger joint width and/or closer spacing of joints, or even the presence of faults, exposes a great surface area to weathering agents • surface relief – areas of lower elevation tend to have a greater depth of weathering. This is likely to relate to water accumulating in lower lying areas, running off and through the surrounding slope/greater water availability provides a medium for chemical reactions and so faster and deeper weathering • microclimatic variations – higher temperatures in the more sheltered, lower lying areas act as a catalyst to chemical reactions leading to faster and deeper chemical weathering • variability in the chemical composition and resistance of the granite to weathering processes • nature of surface – could be laterite/calcrete crusts on the surface which limit infiltration and therefore weathering • vegetation variations affecting movement of water/weathering processes These points have to be referenced with respect to the transect. Maximum Level 2 if no explicit reference to the transect. Award marks based on the quality of explanation and breadth of the response using the marking levels below. Level 3 (5–6) Response clearly explains two reasons for the variations in the depth of weathered granite described in (a). Response is well founded in detailed knowledge and strong conceptual understanding of the topic. Examples used are appropriate and integrated effectively into the response. Level 2 (3–4) Response explains two reasons or clearly explains one reason for the variations in the depth of weathered granite described in (a). Response develops on a largely secure base of knowledge and understanding. Examples may lack detail or development. Level 1 (1–2) Response explains one or two reasons for the variations in the depth of weathered granite described in (a). Knowledge is basic and understanding may be inaccurate. Examples are in name only or lacking entirely. Level 0 (0) No creditable response.
Q2 · Using a case study of either a rainforest ecosystem or a savanna ecosystem, evaluate…
2 Using a case study of either a rainforest ecosystem or a savanna ecosystem, evaluate attempted solutions to the problems of its sustainable management. [20]
Mark scheme: 2 Using a case study of either a rainforest ecosystem or a savanna 20 ecosystem, evaluate attempted solutions to the problems of its sustainable management. Problems of sustainable management include: • deforestation/commercial/illegal • poaching • mining/oil exploration • commercial agriculture, including monoculture, ranching, plantations • population pressures • climate change • fire • capital requirements • political changes, corruption • amount of support/involvement from local peoples • conflicts • environmental degradation/desertification Solutions to the problems include: • National Parks/biosphere reserves/conservation areas • socially responsible logging • sustainable tourism/ecotourism • agroforestry • quotas • afforestation/reforestation schemes • education • legislation • work of independent organisation such as NGOs • community based initiatives Criteria for evaluating success should be established and this might include reference to different stakeholders, over different time periods, the extent to which the problems have been solved/removed. Reference might be made to economic, social, and environmental elements of sustainability. Award marks based on the quality of the response using the marking levels below. 2 Level 4 (16–20) Response thoroughly discusses attempted solutions to the problems of sustainable management for a case study of either a rainforest ecosystem or a savanna ecosystem. An effective and sustained evaluation with a sound conclusion. Response is well founded in detailed exemplar knowledge and strong conceptual understanding of the topic. Examples used are appropriate and integrated effectively into the response. Level 3 (11–15) Response discusses attempted solutions to the problems of sustainable management for a case study of either a rainforest ecosystem or a savanna ecosystem. Response is broadly evaluative in character, comprising some explanatory or narrative content and a conclusion. Response develops on a largely secure base of knowledge and understanding with the use of example(s). Level 2 (6–10) Response demonstrates some knowledge and understanding of attempted solutions to the problems of sustainable management for a case study of either a rainforest ecosystem or a savanna ecosystem. Response is mainly descriptive or explanatory in approach and contains a brief or thinly supported evaluation. Responses without the use of example(s) to support the response will not get above the middle of Level 2 (8 marks). Level 1 (1–5) Response makes a few general points about attempted solutions to the problems of sustainable management in tropical ecosystems. A descriptive response comprising a few simple points. Knowledge is basic and understanding may be poor and lack relevance to the question set. Level 0 (0) No creditable response.
Q3 · ‘Humid tropical and seasonally humid tropical environments have similar diurnal…
3 ‘Humid tropical and seasonally humid tropical environments have similar diurnal variations in their climates.’ How far do you agree with this statement? [20] Coastal environments If answering this option, answer Question 4 and either Question 5 or Question 6.
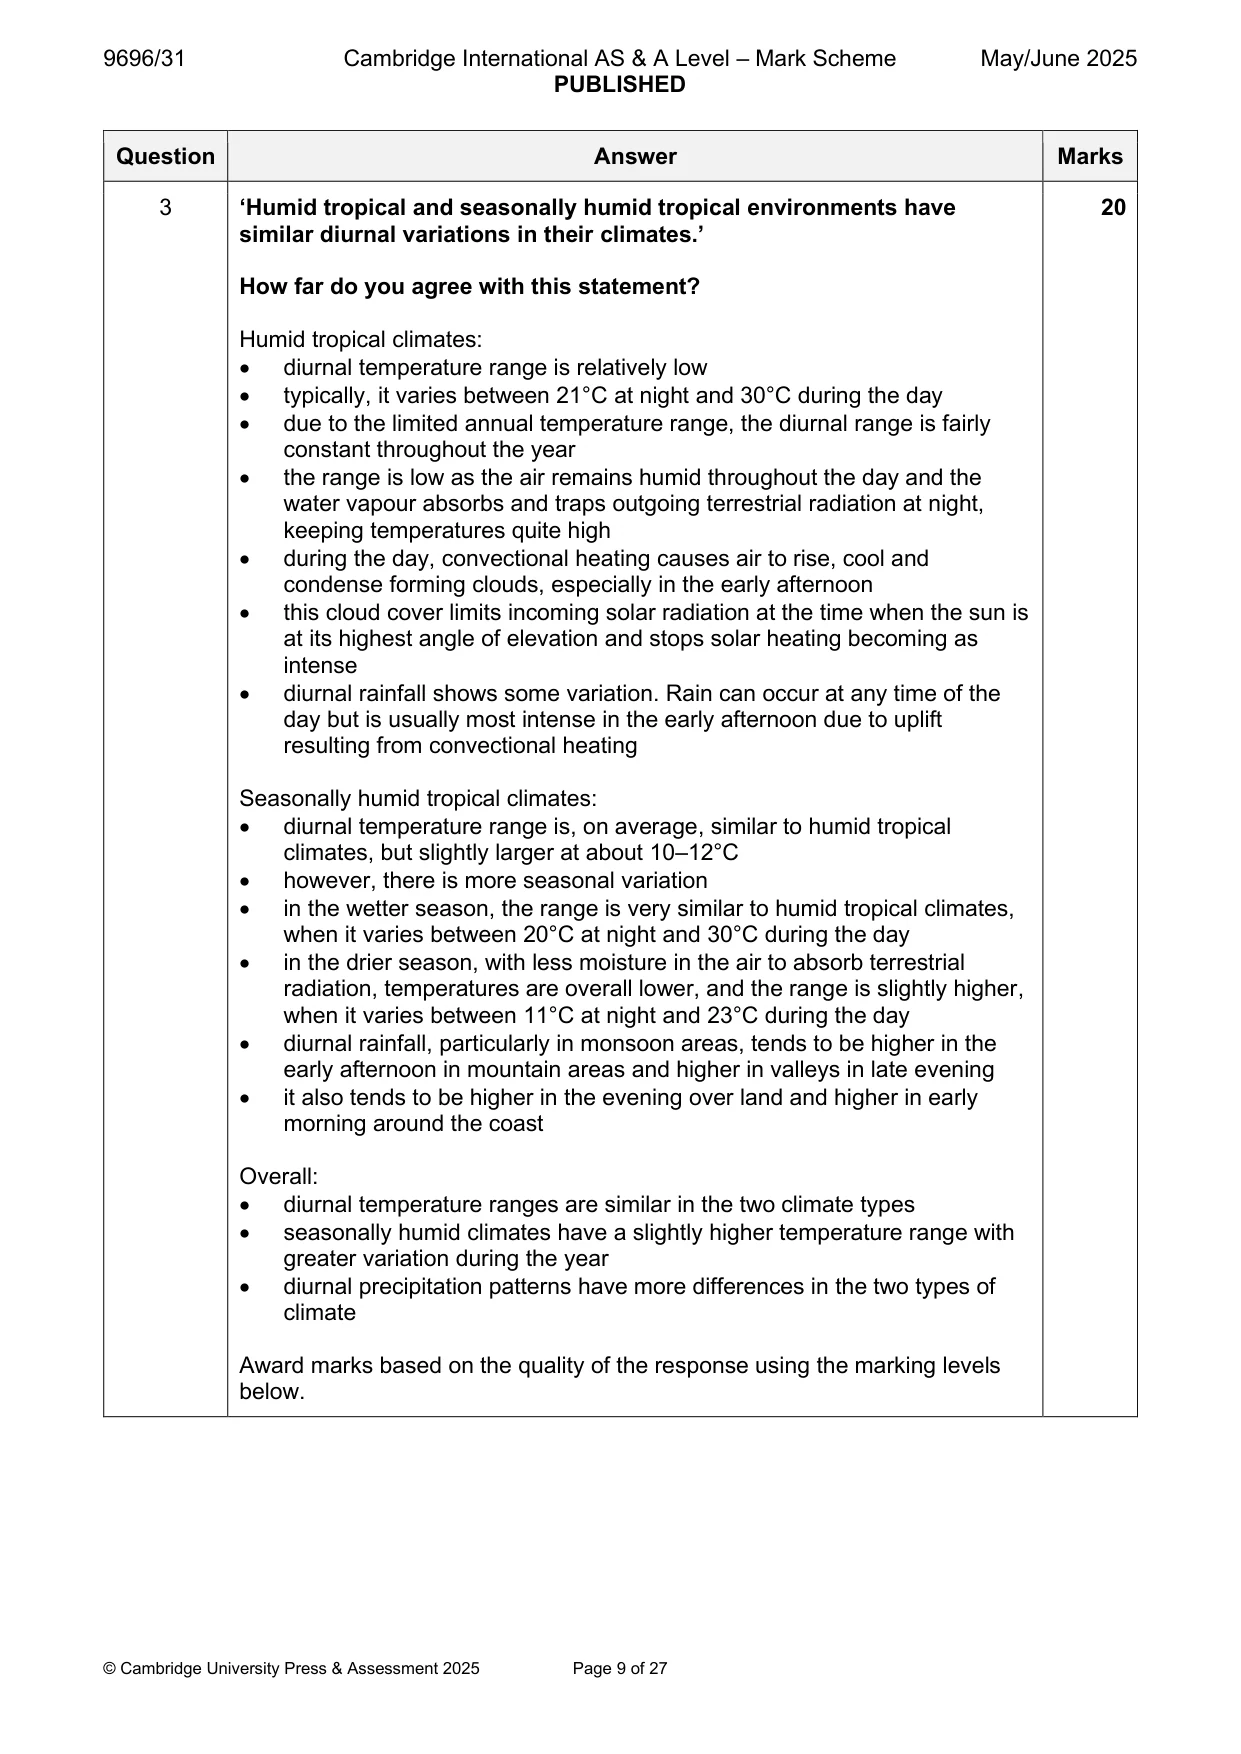
Mark scheme: 3 ‘Humid tropical and seasonally humid tropical environments have 20 similar diurnal variations in their climates.’ How far do you agree with this statement? Humid tropical climates: • diurnal temperature range is relatively low • typically, it varies between 21°C at night and 30°C during the day • due to the limited annual temperature range, the diurnal range is fairly constant throughout the year • the range is low as the air remains humid throughout the day and the water vapour absorbs and traps outgoing terrestrial radiation at night, keeping temperatures quite high • during the day, convectional heating causes air to rise, cool and condense forming clouds, especially in the early afternoon • this cloud cover limits incoming solar radiation at the time when the sun is at its highest angle of elevation and stops solar heating becoming as intense • diurnal rainfall shows some variation. Rain can occur at any time of the day but is usually most intense in the early afternoon due to uplift resulting from convectional heating Seasonally humid tropical climates: • diurnal temperature range is, on average, similar to humid tropical climates, but slightly larger at about 10–12°C • however, there is more seasonal variation • in the wetter season, the range is very similar to humid tropical climates, when it varies between 20°C at night and 30°C during the day • in the drier season, with less moisture in the air to absorb terrestrial radiation, temperatures are overall lower, and the range is slightly higher, when it varies between 11°C at night and 23°C during the day • diurnal rainfall, particularly in monsoon areas, tends to be higher in the early afternoon in mountain areas and higher in valleys in late evening • it also tends to be higher in the evening over land and higher in early morning around the coast Overall: • diurnal temperature ranges are similar in the two climate types • seasonally humid climates have a slightly higher temperature range with greater variation during the year • diurnal precipitation patterns have more differences in the two types of climate Award marks based on the quality of the response using the marking levels below. 3 Level 4 (16–20) Response thoroughly discusses the extent to which humid tropical and seasonally humid tropical environments have similar diurnal variations in their climates. An effective and sustained evaluation with a sound conclusion. Response is well founded in detailed exemplar knowledge and strong conceptual understanding of the topic. Examples used are appropriate and integrated effectively into the response. Level 3 (11–15) Response discusses the extent to which humid tropical and seasonally humid tropical environments have similar diurnal variations in their climates. Response is broadly evaluative in character, comprising some explanatory or narrative content and a conclusion. Response develops on a largely secure base of knowledge and understanding with the use of example(s). Level 2 (6–10) Response demonstrates some knowledge and understanding of the extent to which humid tropical and seasonally humid tropical environments have similar diurnal variations in their climates. Response is mainly descriptive or explanatory in approach and contains a brief or thinly supported evaluation. Responses without the use of example(s) to support the response will not get above the middle of Level 2 (8 marks). Level 1 (1–5) Response makes a few general points about diurnal variations in humid tropical and seasonally humid tropical environments. A descriptive response comprising a few simple points. Knowledge is basic and understanding may be poor and lack relevance to the question set. Level 0 (0) No creditable response. Coastal environments If answering this option, answer Question 4 and either Question 5 or Question 6.
Q4 · Changes to East Head spit, Sussex, UK, 1786–2005
4 Fig. 4.1 shows changes to East Head spit, Sussex, UK, 1786–2005. (a) Describe changes to the position of East Head spit shown in Fig. 4.1. [4] (b) Suggest reasons for the changes you described in (a). [6]
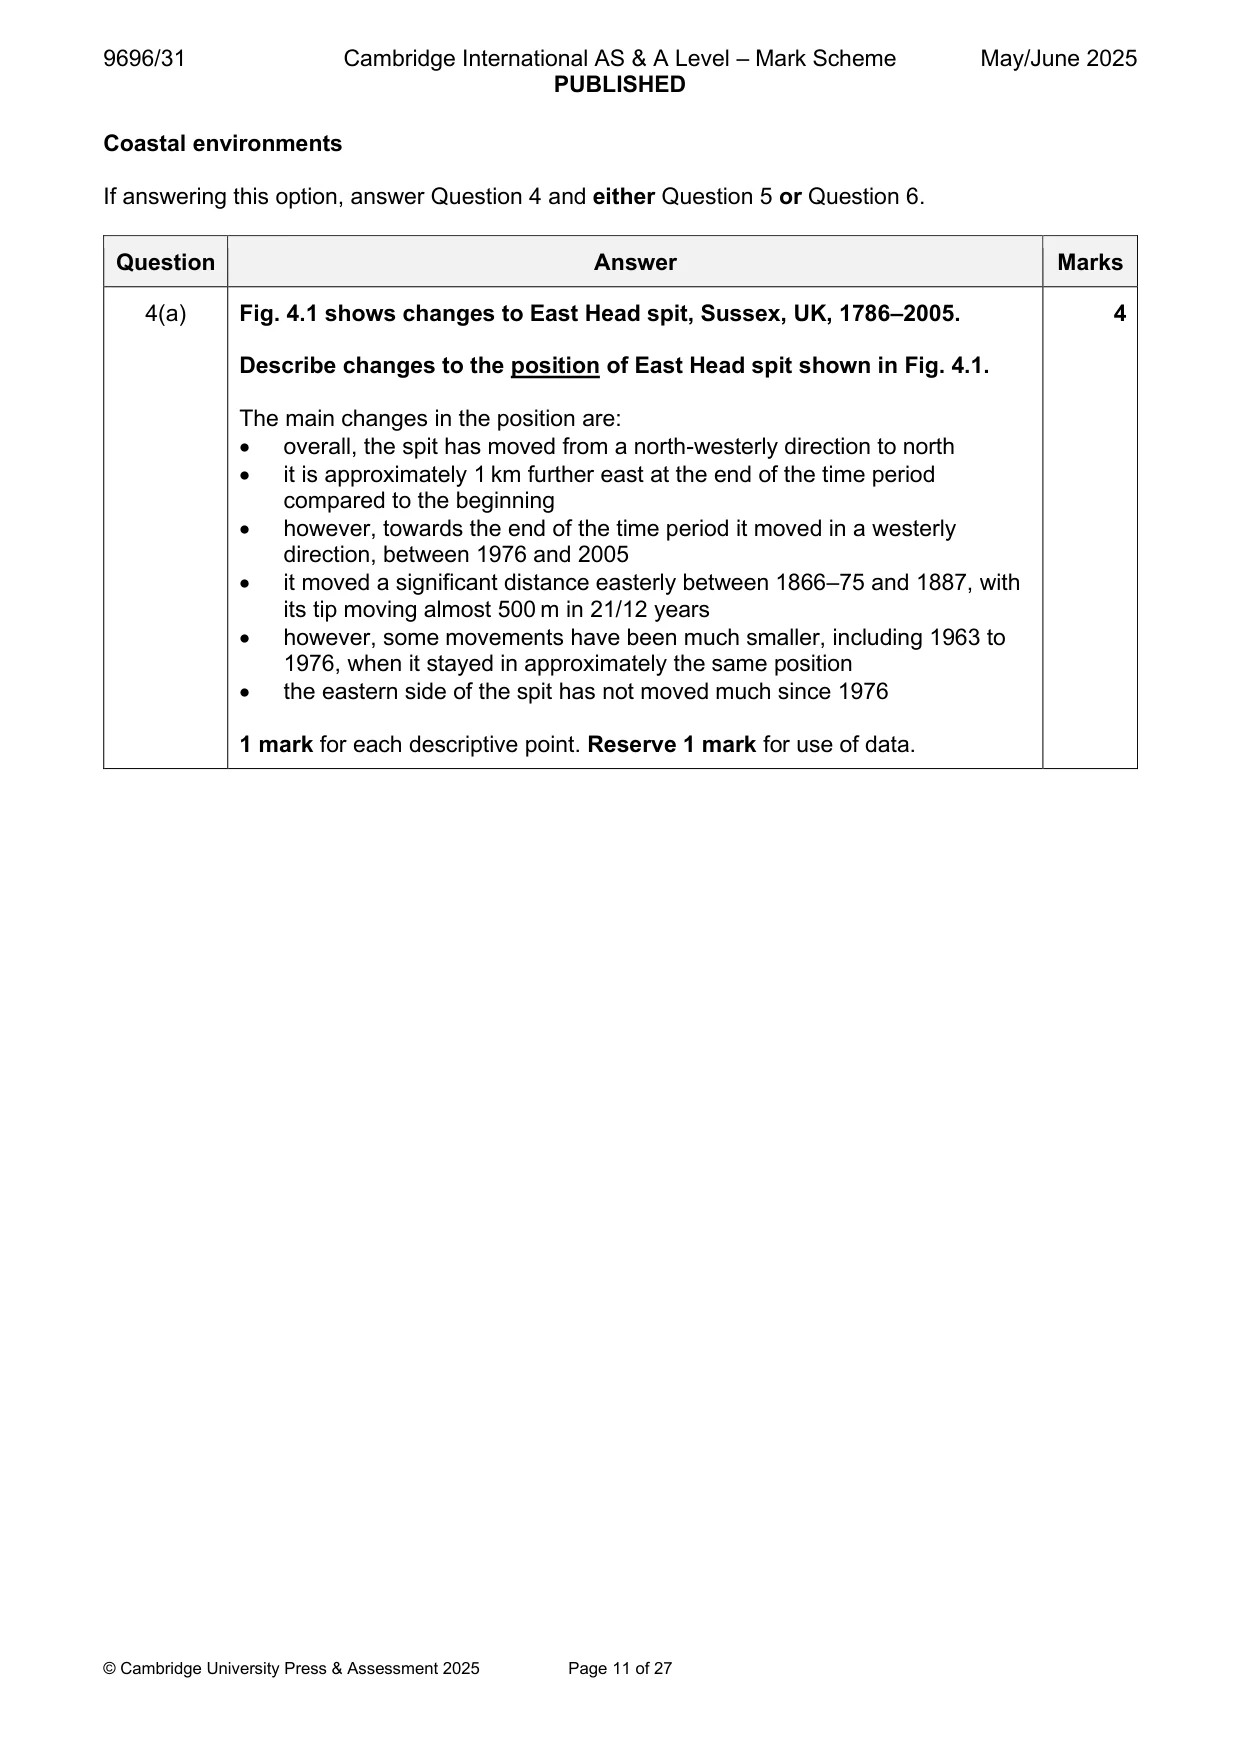
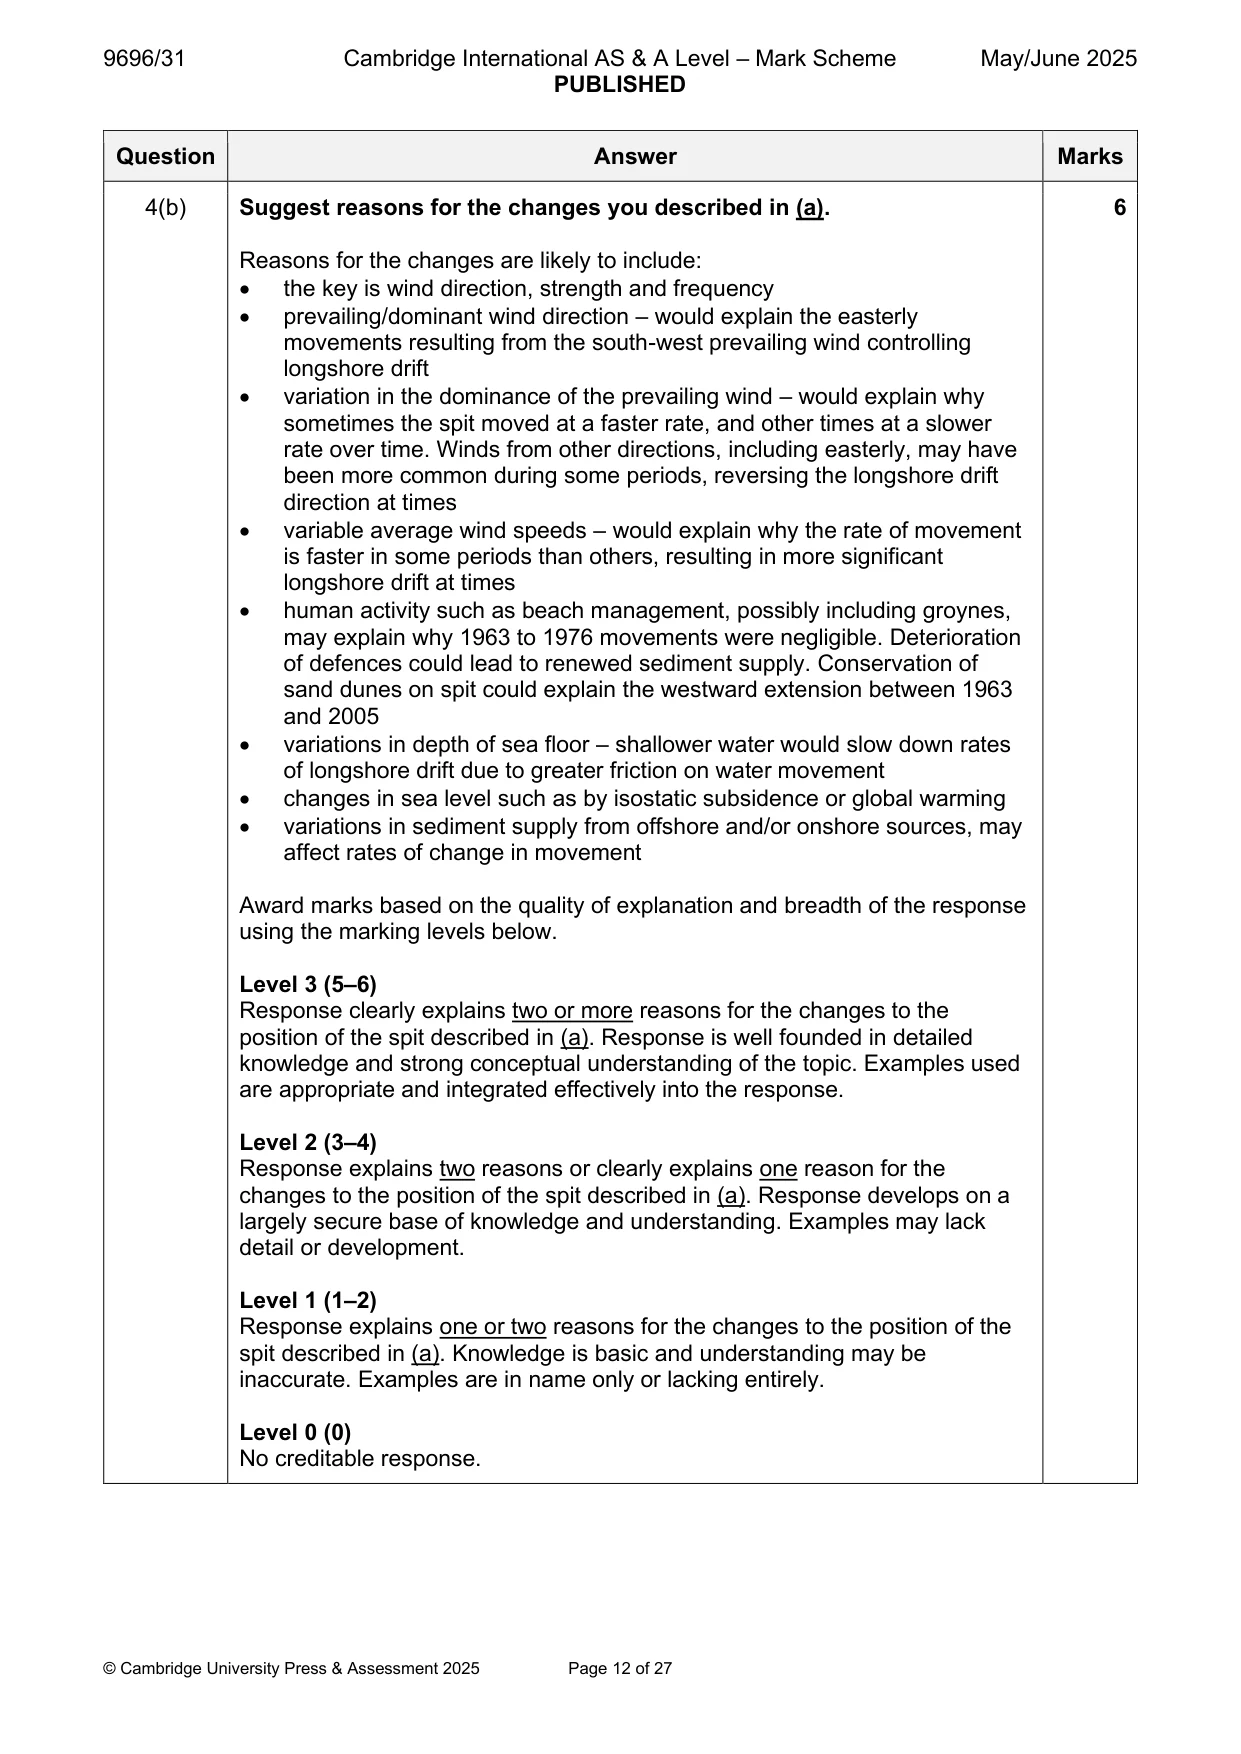
Mark scheme: 4(a) Fig. 4.1 shows changes to East Head spit, Sussex, UK, 1786–2005. 4 Describe changes to the position of East Head spit shown in Fig. 4.1. The main changes in the position are: • overall, the spit has moved from a north-westerly direction to north • it is approximately 1 km further east at the end of the time period compared to the beginning • however, towards the end of the time period it moved in a westerly direction, between 1976 and 2005 • it moved a significant distance easterly between 1866–75 and 1887, with its tip moving almost 500 m in 21/12 years • however, some movements have been much smaller, including 1963 to 1976, when it stayed in approximately the same position • the eastern side of the spit has not moved much since 1976 1 mark for each descriptive point. Reserve 1 mark for use of data. 4(b) Suggest reasons for the changes you described in (a). 6 Reasons for the changes are likely to include: • the key is wind direction, strength and frequency • prevailing/dominant wind direction – would explain the easterly movements resulting from the south-west prevailing wind controlling longshore drift • variation in the dominance of the prevailing wind – would explain why sometimes the spit moved at a faster rate, and other times at a slower rate over time. Winds from other directions, including easterly, may have been more common during some periods, reversing the longshore drift direction at times • variable average wind speeds – would explain why the rate of movement is faster in some periods than others, resulting in more significant longshore drift at times • human activity such as beach management, possibly including groynes, may explain why 1963 to 1976 movements were negligible. Deterioration of defences could lead to renewed sediment supply. Conservation of sand dunes on spit could explain the westward extension between 1963 and 2005 • variations in depth of sea floor – shallower water would slow down rates of longshore drift due to greater friction on water movement • changes in sea level such as by isostatic subsidence or global warming • variations in sediment supply from offshore and/or onshore sources, may affect rates of change in movement Award marks based on the quality of explanation and breadth of the response using the marking levels below. Level 3 (5–6) Response clearly explains two or more reasons for the changes to the position of the spit described in (a). Response is well founded in detailed knowledge and strong conceptual understanding of the topic. Examples used are appropriate and integrated effectively into the response. Level 2 (3–4) Response explains two reasons or clearly explains one reason for the changes to the position of the spit described in (a). Response develops on a largely secure base of knowledge and understanding. Examples may lack detail or development. Level 1 (1–2) Response explains one or two reasons for the changes to the position of the spit described in (a). Knowledge is basic and understanding may be inaccurate. Examples are in name only or lacking entirely. Level 0 (0) No creditable response.
Q5 · To what extent do sediment sources and characteristics vary in coastal environments?
5 To what extent do sediment sources and characteristics vary in coastal environments? [20]
Mark scheme: 5 To what extent do sediment sources and characteristics vary in coastal 20 environments? Sediment sources include: • river sediment transport and deposition • weathering, erosion and mass movement of cliff material • longshore drift from adjacent areas • marine deposition from offshore sources, such as sand bars • human activity, such as beach nourishment • sand dunes Sediment characteristics include: • shape of particles • size of particles • volume of material • mineral composition, linked to rock type of origin Varying factors – shape of coastline, geology, waves/energy (affecting amount of transportation), intensity of human activity in the area. Conclusion may depend on scale – less variation at local scale. Sediment characteristics vary more than sources, as only limited number of sources but wide range of sediment types. Award marks based on the quality of the response using the marking levels below. Level 4 (16–20) Response thoroughly discusses the extent to which sediment sources and characteristics vary in coastal environments. An effective and sustained evaluation with a sound conclusion. Response is well founded in detailed exemplar knowledge and strong conceptual understanding of the topic. Examples used are appropriate and integrated effectively into the response. Level 3 (11–15) Response discusses the extent to which sediment sources and characteristics vary in coastal environments. Response is broadly evaluative in character, comprising some explanatory or narrative content and a conclusion. Response develops on a largely secure base of knowledge and understanding with the use of example(s). Level 2 (6–10) Response demonstrates some knowledge and understanding of the extent to which sediment sources and characteristics vary in coastal environments. Response is mainly descriptive or explanatory in approach and contains a brief or thinly supported evaluation. Responses without the use of example(s) to support the response will not get above the middle of Level 2 (8 marks). 5 Level 1 (1–5) Response makes a few general points about sediment sources and/or characteristics in coastal environments. A descriptive response comprising a few simple points. Knowledge is basic and understanding may be poor and lack relevance to the question set. Level 0 (0) No creditable response.
Q6 · Hazardous environments If answering this option, answer Question 7 and either Question 8…
Hazardous environments If answering this option, answer Question 7 and either Question 8 or Question 9.
Mark scheme: 6 Assess the effectiveness of hard engineering and soft engineering in 20 sustainably managing a stretch or stretches of coastline. Hard engineering includes: • groynes • sea walls • revetments • gabions • rock armour/riprap • cliff drainage • cliff regrading • offshore reefs Soft engineering includes: • beach nourishment/recharge • sand dune stabilisation via planting • managed retreat • land use zoning/do nothing • beach reprofiling Effectiveness may be judged by cost-benefit analysis, with consideration of social, economic and environmental costs and benefits. Management strategies should be assessed in terms of their sustainability. Award marks based on the quality of the response using the marking levels below. Level 4 (16–20) Response thoroughly discusses the effectiveness of hard engineering and soft engineering in sustainably managing a stretch or stretches of coastline. An effective and sustained evaluation with a sound conclusion. Response is well founded in detailed exemplar knowledge and strong conceptual understanding of the topic. Examples used are appropriate and integrated effectively into the response. Level 3 (11–15) Response discusses the effectiveness of hard engineering and soft engineering in sustainably managing a stretch or stretches of coastline. Response is broadly evaluative in character, comprising some explanatory or narrative content and a conclusion. Response develops on a largely secure base of knowledge and understanding with the use of example(s). Level 2 (6–10) Response demonstrates some knowledge and understanding of the effectiveness of hard engineering and soft engineering in sustainably managing a stretch or stretches of coastline. Response is mainly descriptive or explanatory in approach and contains a brief or thinly supported evaluation. Responses without the use of example(s) to support the response will not get above the middle of Level 2 (8 marks). 6 Level 1 (1–5) Response makes a few general points about hard engineering and soft engineering in coastal management. A descriptive response comprising a few simple points. Knowledge is basic and understanding may be poor and lack relevance to the question set. Level 0 (0) No creditable response. Hazardous environments If answering this option, answer Question 7 and either Question 8 or Question 9.
Q7 · The frequency of Atlantic hurricanes, 1920–2020
7 Fig. 7.1 shows the frequency of Atlantic hurricanes, 1920–2020. (a) Compare the pattern of major hurricane frequency with the pattern of non-major hurricane frequency shown in Fig. 7.1. [4] (b) Suggest reasons for the variation in hurricane frequency shown in Fig. 7.1. [6]
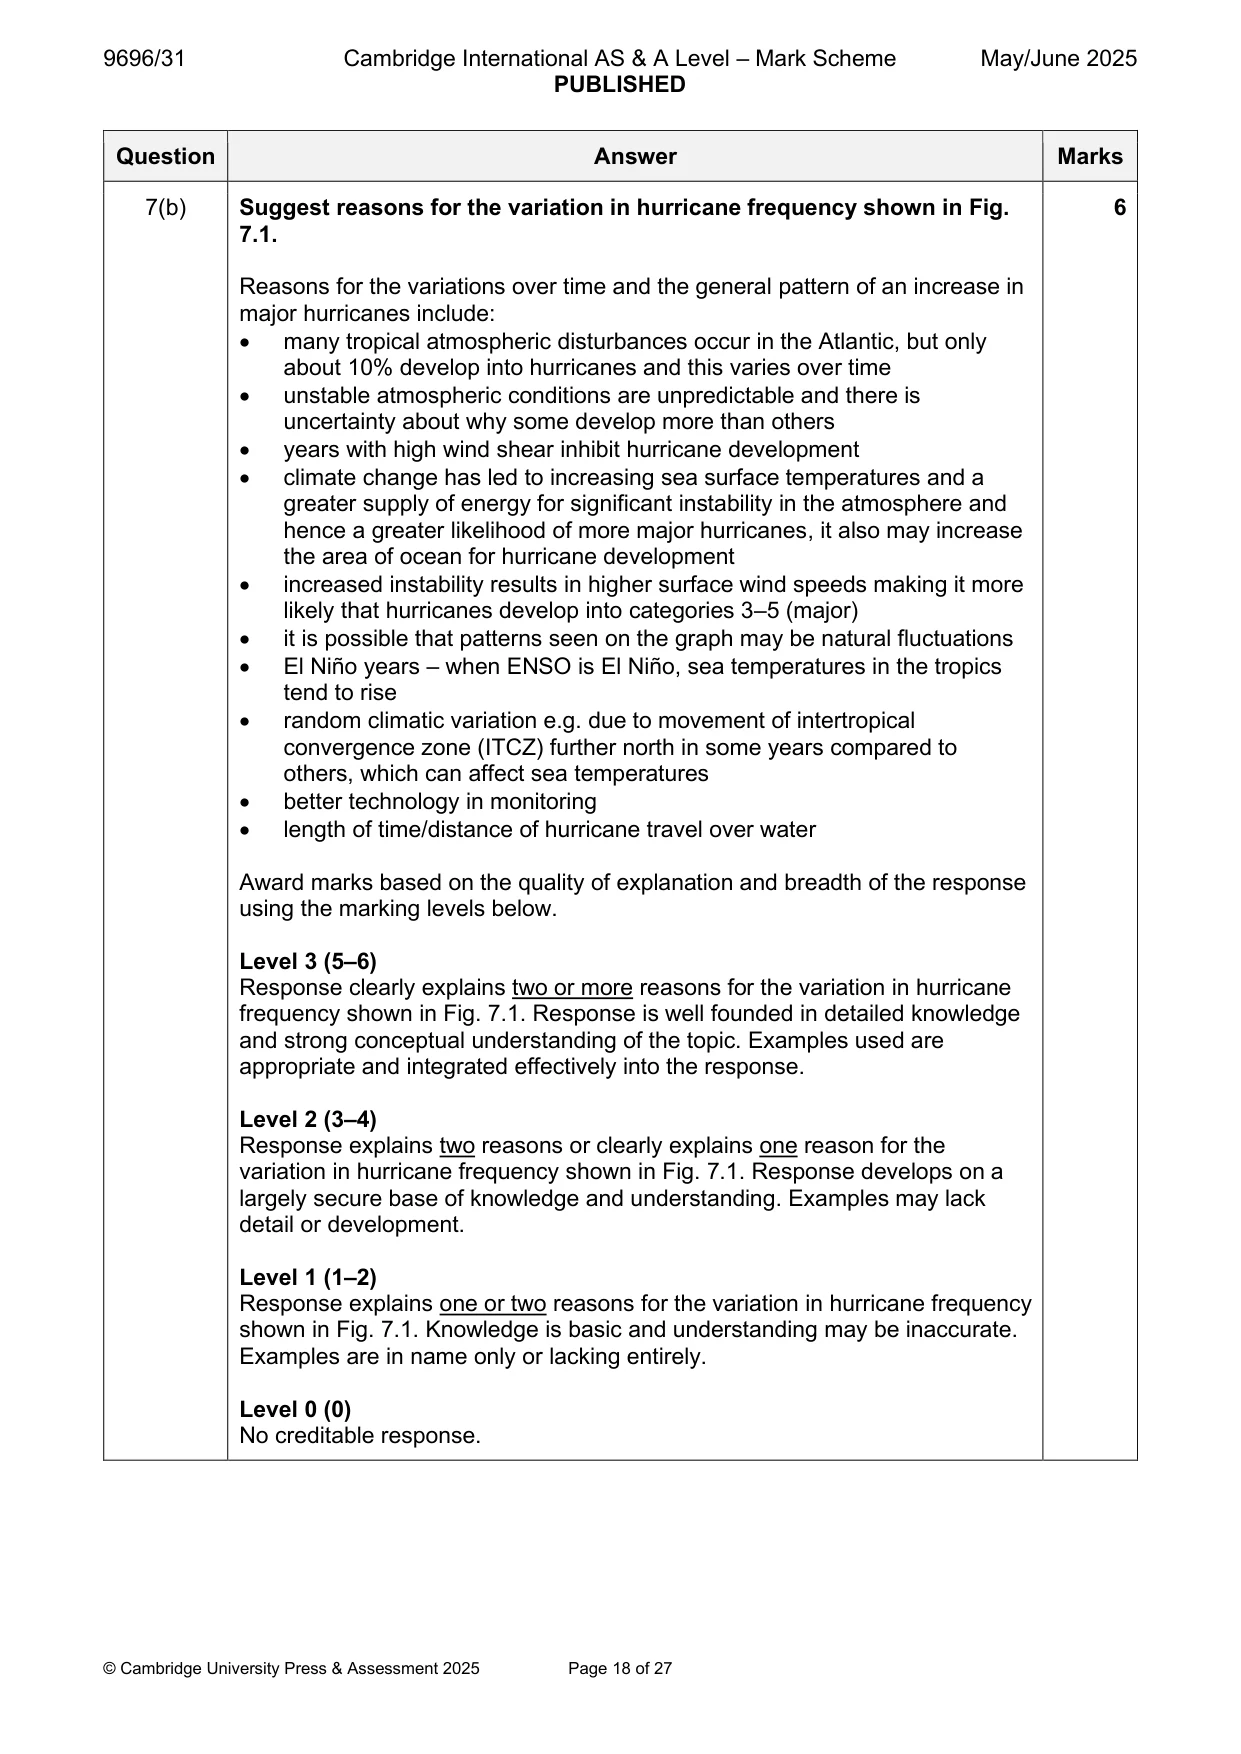
Mark scheme: 7(a) Fig. 7.1 shows the frequency of Atlantic hurricanes, 1920–2020. 4 Compare the pattern of major hurricane frequency with the pattern of non-major hurricane frequency shown in Fig. 7.1. The main patterns include: • both hurricane types increase in numbers over time • whereas the number of non-major hurricanes increase is not as much as major hurricanes • the number of major hurricanes is very variable, ranging from 0 in 1924 to 7 in 2005 similarly, for non-major hurricanes, numbers are also variable, ranging from 0 in 1929 to 8 in 2012 • in general, non-major hurricanes fluctuate less (are more constant) than major hurricanes • larger clusters of higher frequency major hurricanes e.g. 1946–1954 compared with non-major hurricanes • both peak at 2004–5 • 6 years with no major hurricanes and 2 years with no non-major hurricanes Both similarities and differences are required. Maximum 3 marks if only one of these. 1 mark for each comparison. Reserve 1 mark for use of data. 7(b) Suggest reasons for the variation in hurricane frequency shown in Fig. 6 7.1. Reasons for the variations over time and the general pattern of an increase in major hurricanes include: • many tropical atmospheric disturbances occur in the Atlantic, but only about 10% develop into hurricanes and this varies over time • unstable atmospheric conditions are unpredictable and there is uncertainty about why some develop more than others • years with high wind shear inhibit hurricane development • climate change has led to increasing sea surface temperatures and a greater supply of energy for significant instability in the atmosphere and hence a greater likelihood of more major hurricanes, it also may increase the area of ocean for hurricane development • increased instability results in higher surface wind speeds making it more likely that hurricanes develop into categories 3–5 (major) • it is possible that patterns seen on the graph may be natural fluctuations • El Niño years – when ENSO is El Niño, sea temperatures in the tropics tend to rise • random climatic variation e.g. due to movement of intertropical convergence zone (ITCZ) further north in some years compared to others, which can affect sea temperatures • better technology in monitoring • length of time/distance of hurricane travel over water Award marks based on the quality of explanation and breadth of the response using the marking levels below. Level 3 (5–6) Response clearly explains two or more reasons for the variation in hurricane frequency shown in Fig. 7.1. Response is well founded in detailed knowledge and strong conceptual understanding of the topic. Examples used are appropriate and integrated effectively into the response. Level 2 (3–4) Response explains two reasons or clearly explains one reason for the variation in hurricane frequency shown in Fig. 7.1. Response develops on a largely secure base of knowledge and understanding. Examples may lack detail or development. Level 1 (1–2) Response explains one or two reasons for the variation in hurricane frequency shown in Fig. 7.1. Knowledge is basic and understanding may be inaccurate. Examples are in name only or lacking entirely. Level 0 (0) No creditable response.
Q8 · Assess the effectiveness of different methods of managing volcanic hazards
8 Assess the effectiveness of different methods of managing volcanic hazards. [20]
Mark scheme: 8 Assess the effectiveness of different methods of managing volcanic 20 hazards. Volcanic hazards include: • lava flows • tephra/volcanic ash • lava bombs • pyroclastic flows • gases/acid rain • lahars (mudflows) • jökulhlaups Methods of managing volcanic hazards include: • prediction/monitoring – seismometers, chemical/gas sensors, ultrasound, visual observation, tiltmeters, GPS, historical records • diverting lava flows – barriers, spraying water, explosions • strengthening roofs – to cope with ash fall • education and drills – evacuation • provision of emergency services • exclusion zones/hazard mapping • increasing perception of risk Effectiveness may be assessed in terms of: • cost-benefit analysis • benefit includes number of lives/homes saved (social), protection of environment, maintenance of economic activity • cost includes economic losses, environmental damage, disruption to lives/injuries/homelessness (social) • effectiveness may vary according to the type of hazard and level of economic development of the location Award marks based on the quality of the response using the marking levels below. Level 4 (16–20) Response thoroughly discusses the effectiveness of different methods of managing volcanic hazards. An effective and sustained evaluation with a sound conclusion. Response is well founded in detailed exemplar knowledge and strong conceptual understanding of the topic. Examples used are appropriate and integrated effectively into the response. Level 3 (11–15) Response discusses the effectiveness of different methods of managing volcanic hazards. Response is broadly evaluative in character, comprising some explanatory or narrative content and a conclusion. Response develops on a largely secure base of knowledge and understanding with the use of example(s). 8 Level 2 (6–10) Response demonstrates some knowledge and understanding of the effectiveness of different methods of managing volcanic hazards. Response is mainly descriptive or explanatory in approach and contains a brief or thinly supported evaluation. Responses without the use of example(s) to support the response will not get above the middle of Level 2 (8 marks). Level 1 (1–5) Response makes a few general points about different methods of managing volcanic hazards. A descriptive response comprising a few simple points. Knowledge is basic and understanding may be poor and lack relevance to the question set. Level 0 (0) No creditable response.
Q9 · ‘Human activity is the most significant cause of mass movements.’ How far do you agree…
9 ‘Human activity is the most significant cause of mass movements.’ How far do you agree with this view? [20] Hot arid and semi-arid environments If answering this option, answer Question 10 and either Question 11 or Question 12.
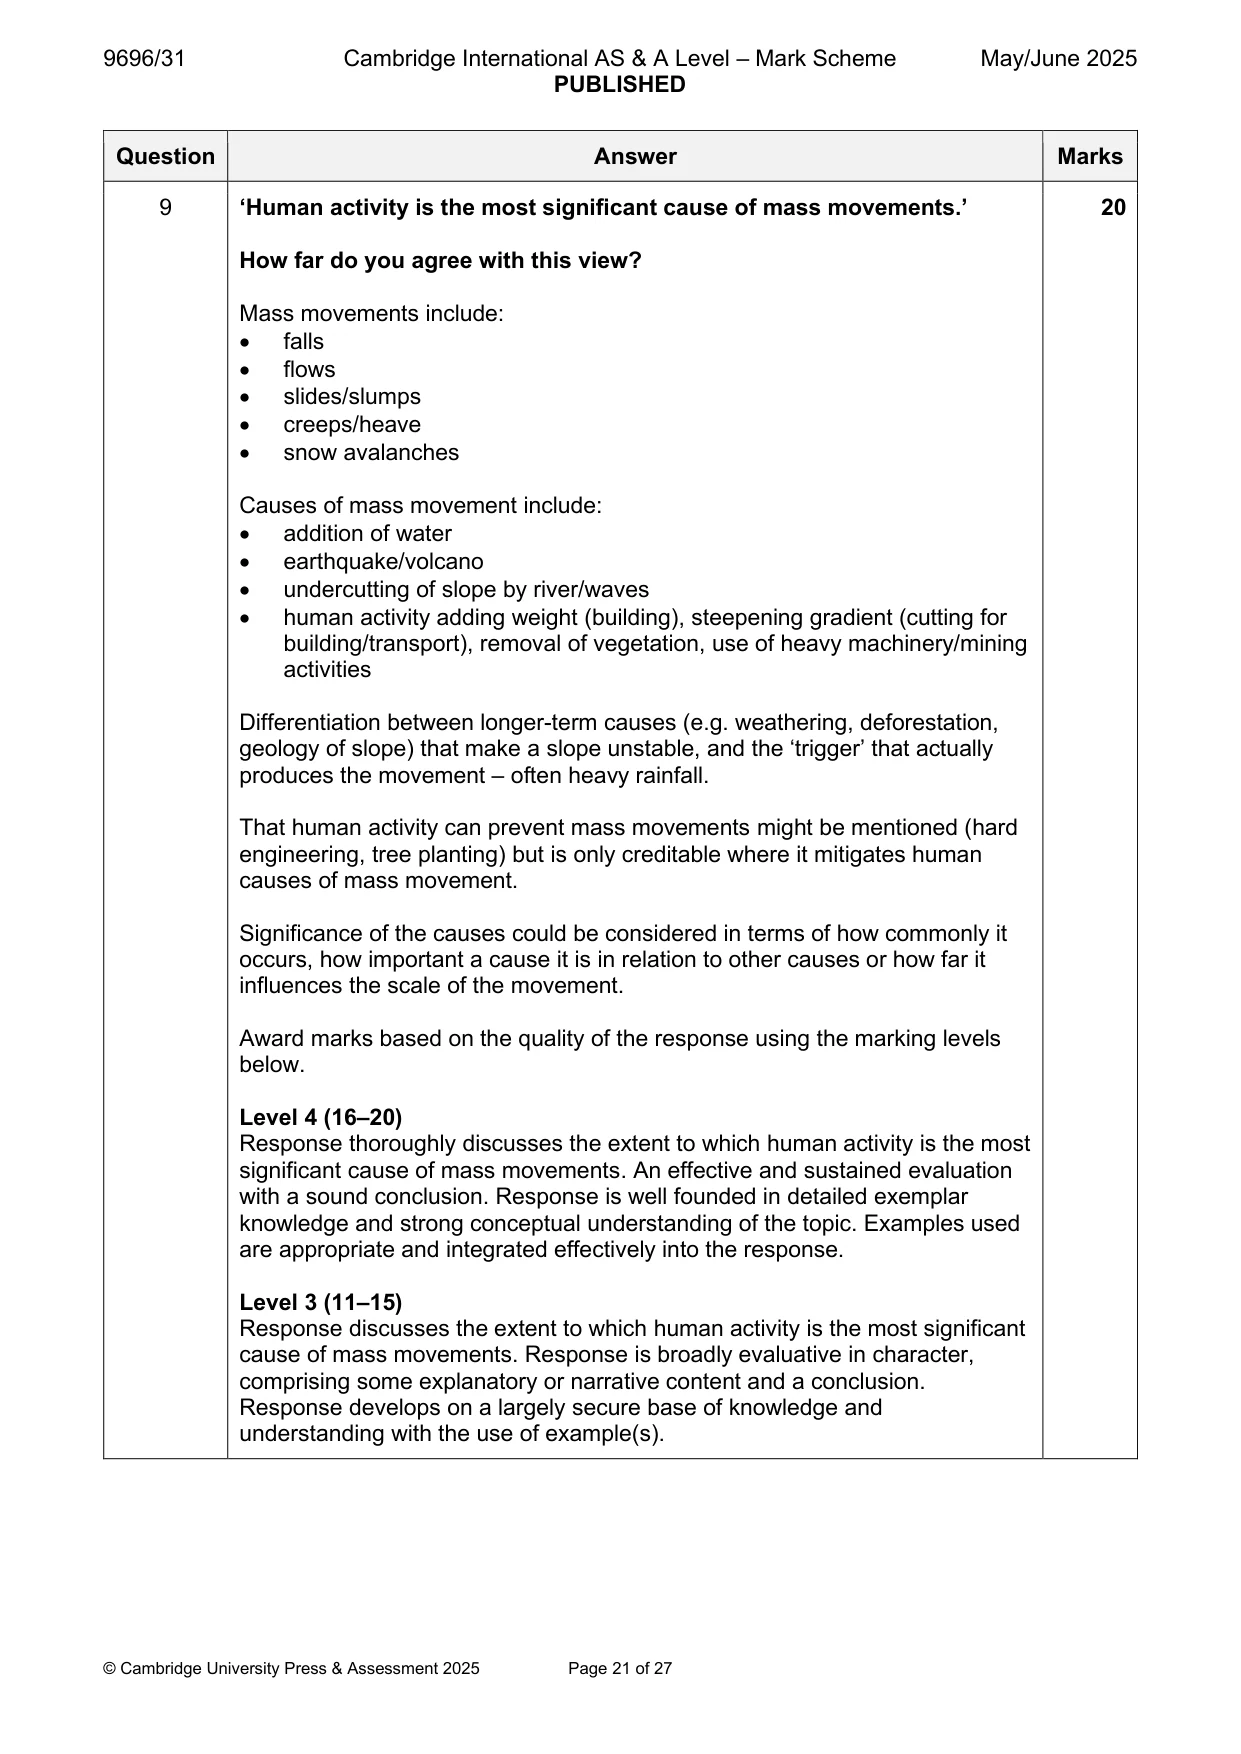
Mark scheme: 9 ‘Human activity is the most significant cause of mass movements.’ 20 How far do you agree with this view? Mass movements include: • falls • flows • slides/slumps • creeps/heave • snow avalanches Causes of mass movement include: • addition of water • earthquake/volcano • undercutting of slope by river/waves • human activity adding weight (building), steepening gradient (cutting for building/transport), removal of vegetation, use of heavy machinery/mining activities Differentiation between longer-term causes (e.g. weathering, deforestation, geology of slope) that make a slope unstable, and the ‘trigger’ that actually produces the movement – often heavy rainfall. That human activity can prevent mass movements might be mentioned (hard engineering, tree planting) but is only creditable where it mitigates human causes of mass movement. Significance of the causes could be considered in terms of how commonly it occurs, how important a cause it is in relation to other causes or how far it influences the scale of the movement. Award marks based on the quality of the response using the marking levels below. Level 4 (16–20) Response thoroughly discusses the extent to which human activity is the most significant cause of mass movements. An effective and sustained evaluation with a sound conclusion. Response is well founded in detailed exemplar knowledge and strong conceptual understanding of the topic. Examples used are appropriate and integrated effectively into the response. Level 3 (11–15) Response discusses the extent to which human activity is the most significant cause of mass movements. Response is broadly evaluative in character, comprising some explanatory or narrative content and a conclusion. Response develops on a largely secure base of knowledge and understanding with the use of example(s). 9 Level 2 (6–10) Response demonstrates some knowledge and understanding of the extent to which human activity is the most significant cause of mass movements. Response is mainly descriptive or explanatory in approach and contains a brief or thinly supported evaluation. Responses without the use of example(s) to support the response will not get above the middle of Level 2 (8 marks). Level 1 (1–5) Response makes a few general points about causes of mass movements. A descriptive response comprising a few simple points. Knowledge is basic and understanding may be poor and lack relevance to the question set. Level 0 (0) No creditable response Hot arid and semi-arid environments If answering this option, answer Question 10 and either Question 11 or Question 12.
Q10 · A photograph which shows a hot arid landscape in Egypt
10 Fig. 10.1 is a photograph which shows a hot arid landscape in Egypt. (a) Describe the main physical features of the landscape shown in Fig. 10.1. [4] (b) Suggest how water influenced the shaping of the landscape shown in Fig. 10.1. [6]
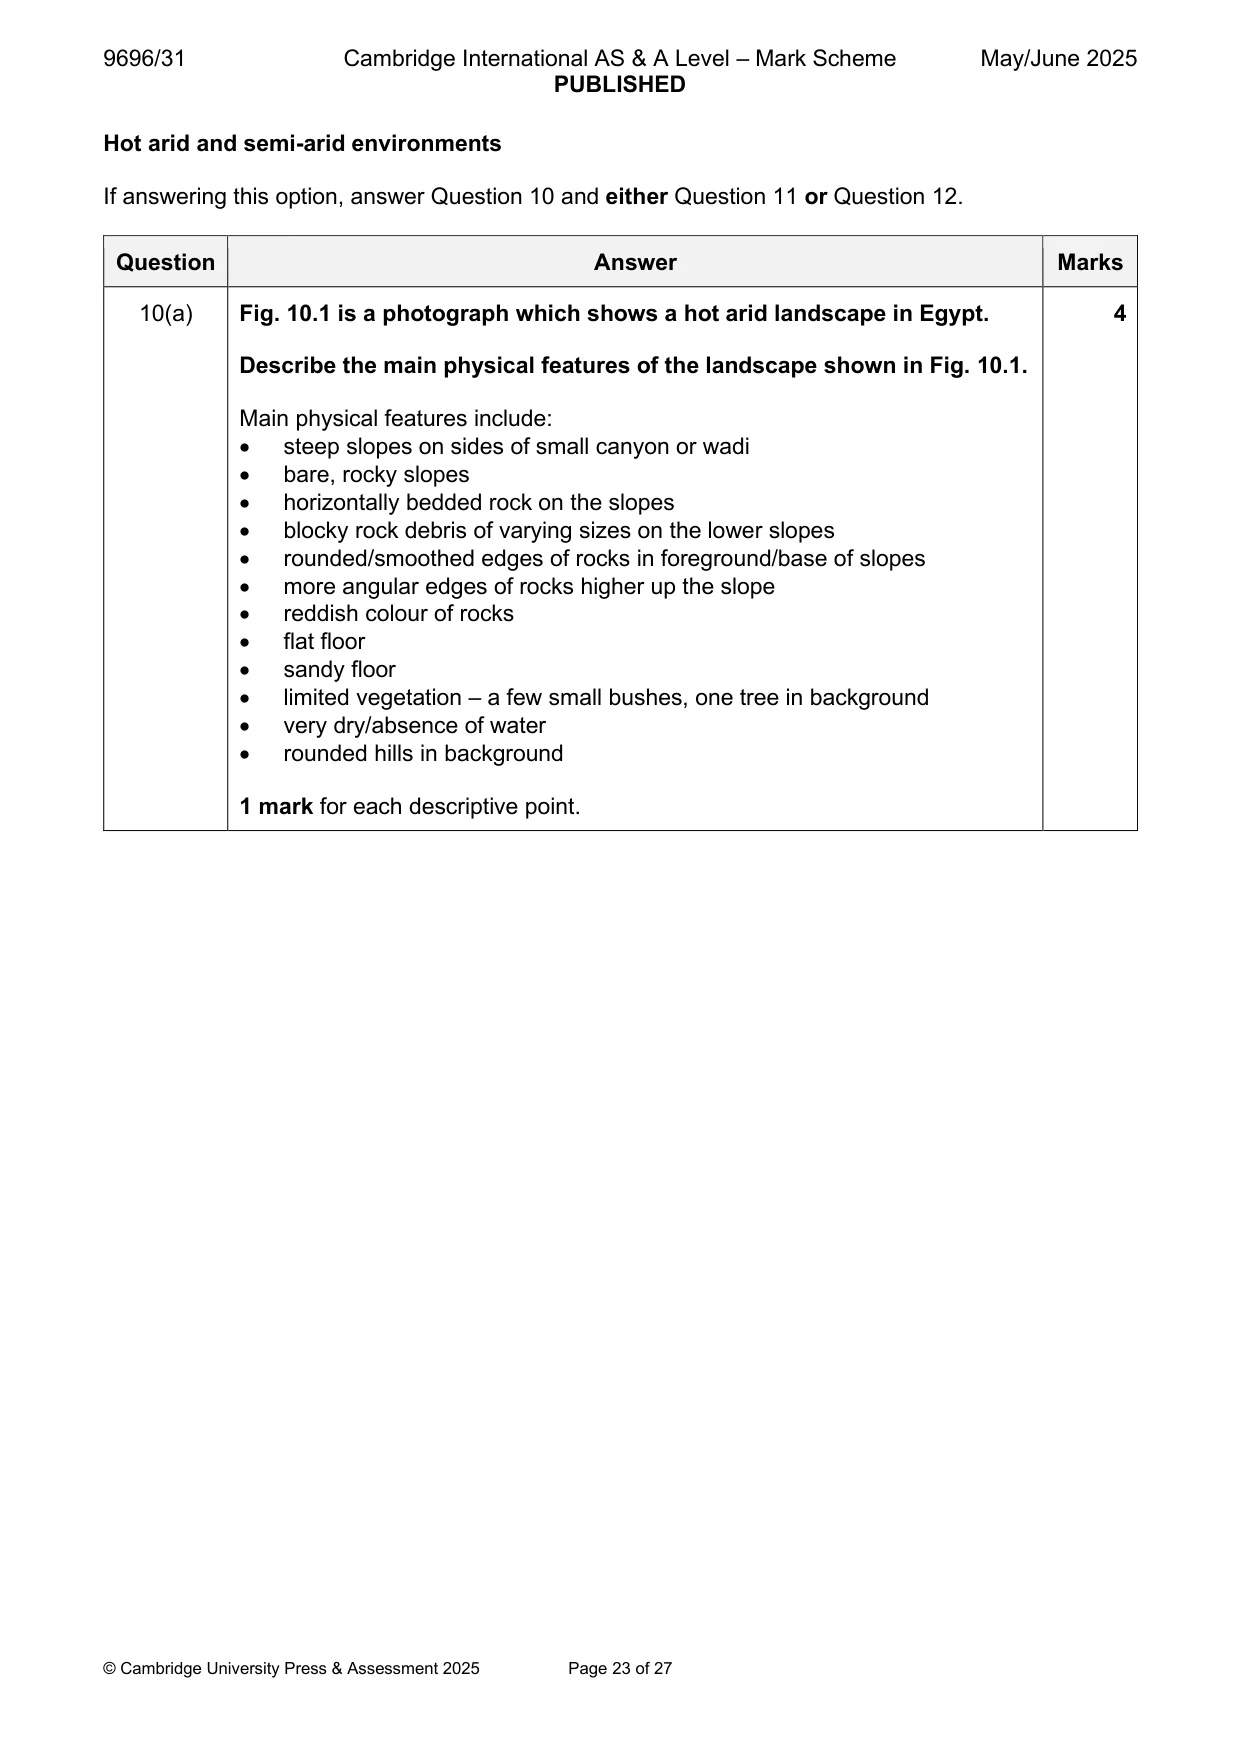
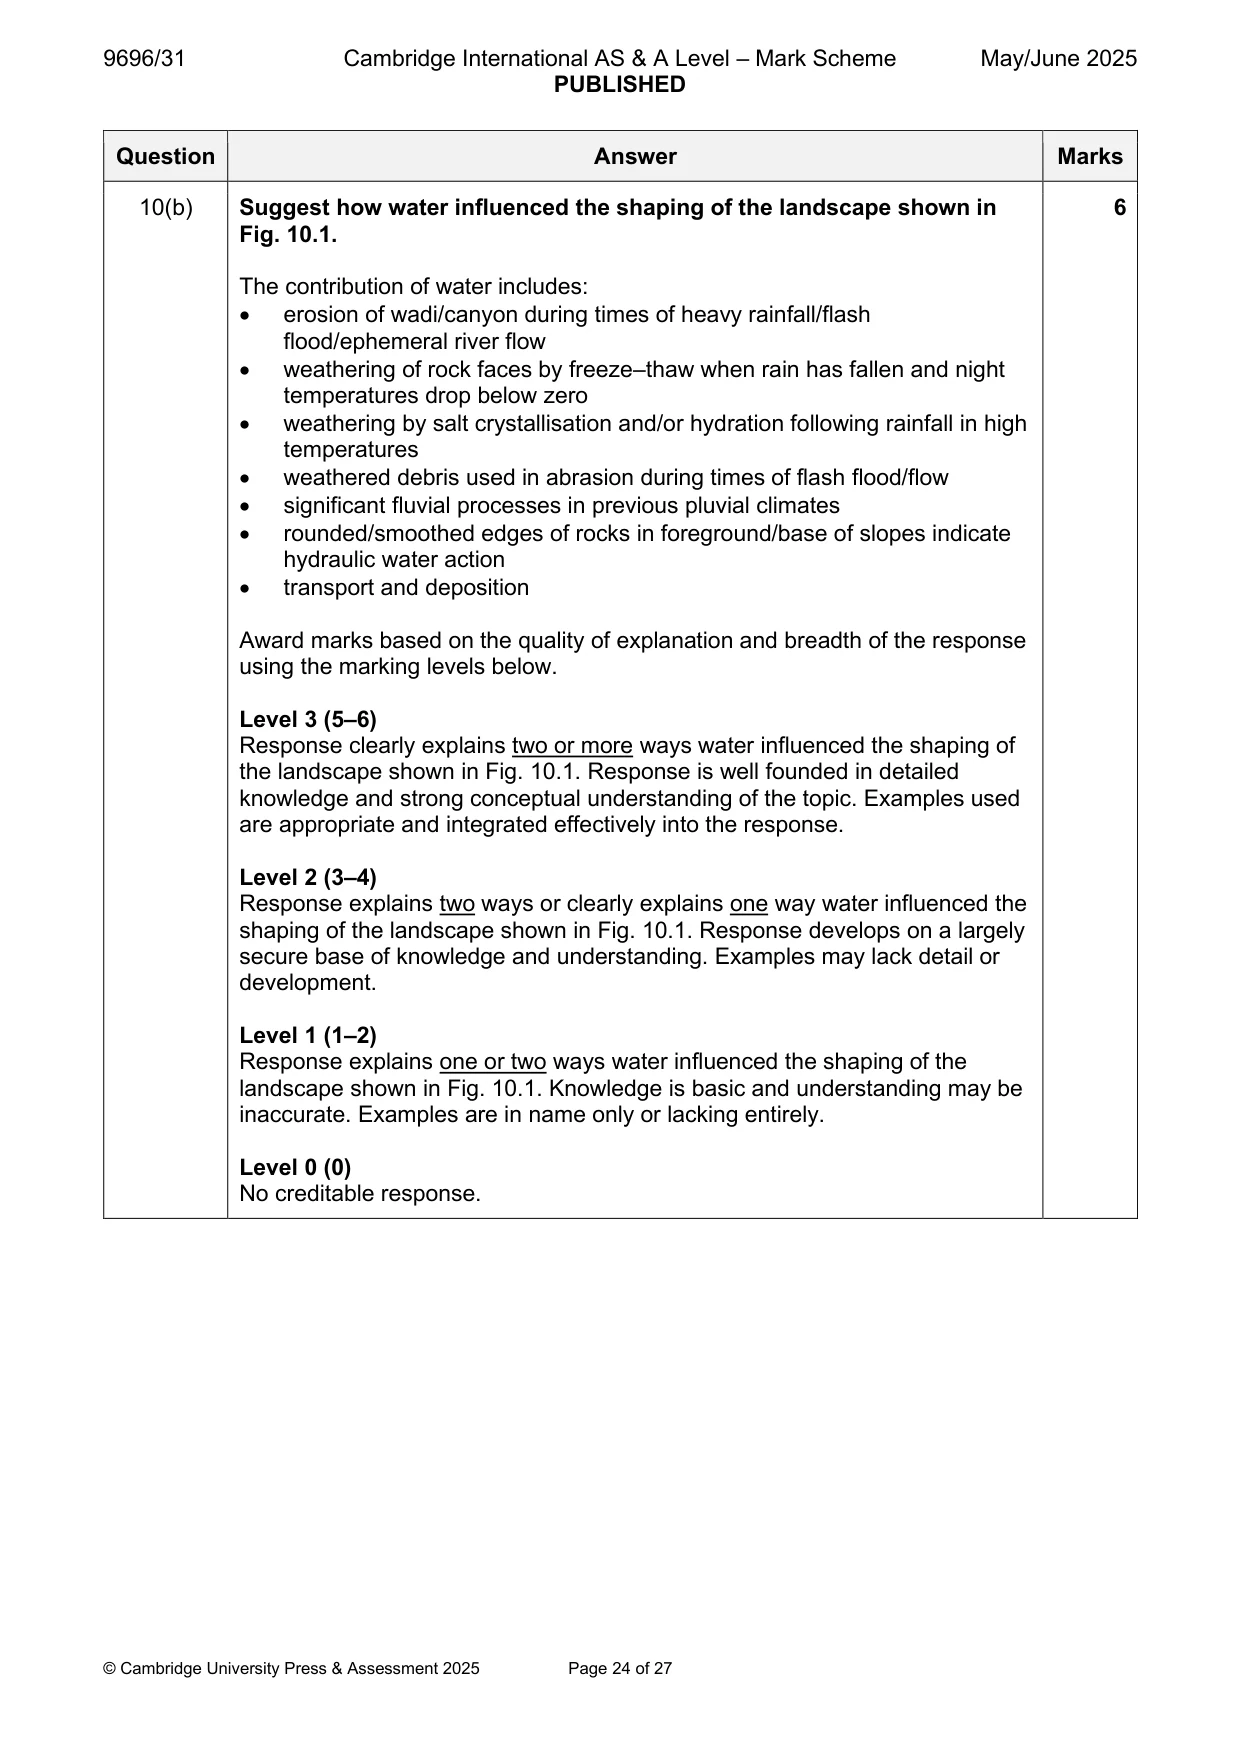
Mark scheme: 10(a) Fig. 10.1 is a photograph which shows a hot arid landscape in Egypt. 4 Describe the main physical features of the landscape shown in Fig. 10.1. Main physical features include: • steep slopes on sides of small canyon or wadi • bare, rocky slopes • horizontally bedded rock on the slopes • blocky rock debris of varying sizes on the lower slopes • rounded/smoothed edges of rocks in foreground/base of slopes • more angular edges of rocks higher up the slope • reddish colour of rocks • flat floor • sandy floor • limited vegetation – a few small bushes, one tree in background • very dry/absence of water • rounded hills in background 1 mark for each descriptive point. 10(b) Suggest how water influenced the shaping of the landscape shown in 6 Fig. 10.1. The contribution of water includes: • erosion of wadi/canyon during times of heavy rainfall/flash flood/ephemeral river flow • weathering of rock faces by freeze–thaw when rain has fallen and night temperatures drop below zero • weathering by salt crystallisation and/or hydration following rainfall in high temperatures • weathered debris used in abrasion during times of flash flood/flow • significant fluvial processes in previous pluvial climates • rounded/smoothed edges of rocks in foreground/base of slopes indicate hydraulic water action • transport and deposition Award marks based on the quality of explanation and breadth of the response using the marking levels below. Level 3 (5–6) Response clearly explains two or more ways water influenced the shaping of the landscape shown in Fig. 10.1. Response is well founded in detailed knowledge and strong conceptual understanding of the topic. Examples used are appropriate and integrated effectively into the response. Level 2 (3–4) Response explains two ways or clearly explains one way water influenced the shaping of the landscape shown in Fig. 10.1. Response develops on a largely secure base of knowledge and understanding. Examples may lack detail or development. Level 1 (1–2) Response explains one or two ways water influenced the shaping of the landscape shown in Fig. 10.1. Knowledge is basic and understanding may be inaccurate. Examples are in name only or lacking entirely. Level 0 (0) No creditable response.
Q11 · Evaluate the role of human factors and natural factors in the process of desertification
11 Evaluate the role of human factors and natural factors in the process of desertification. [20]
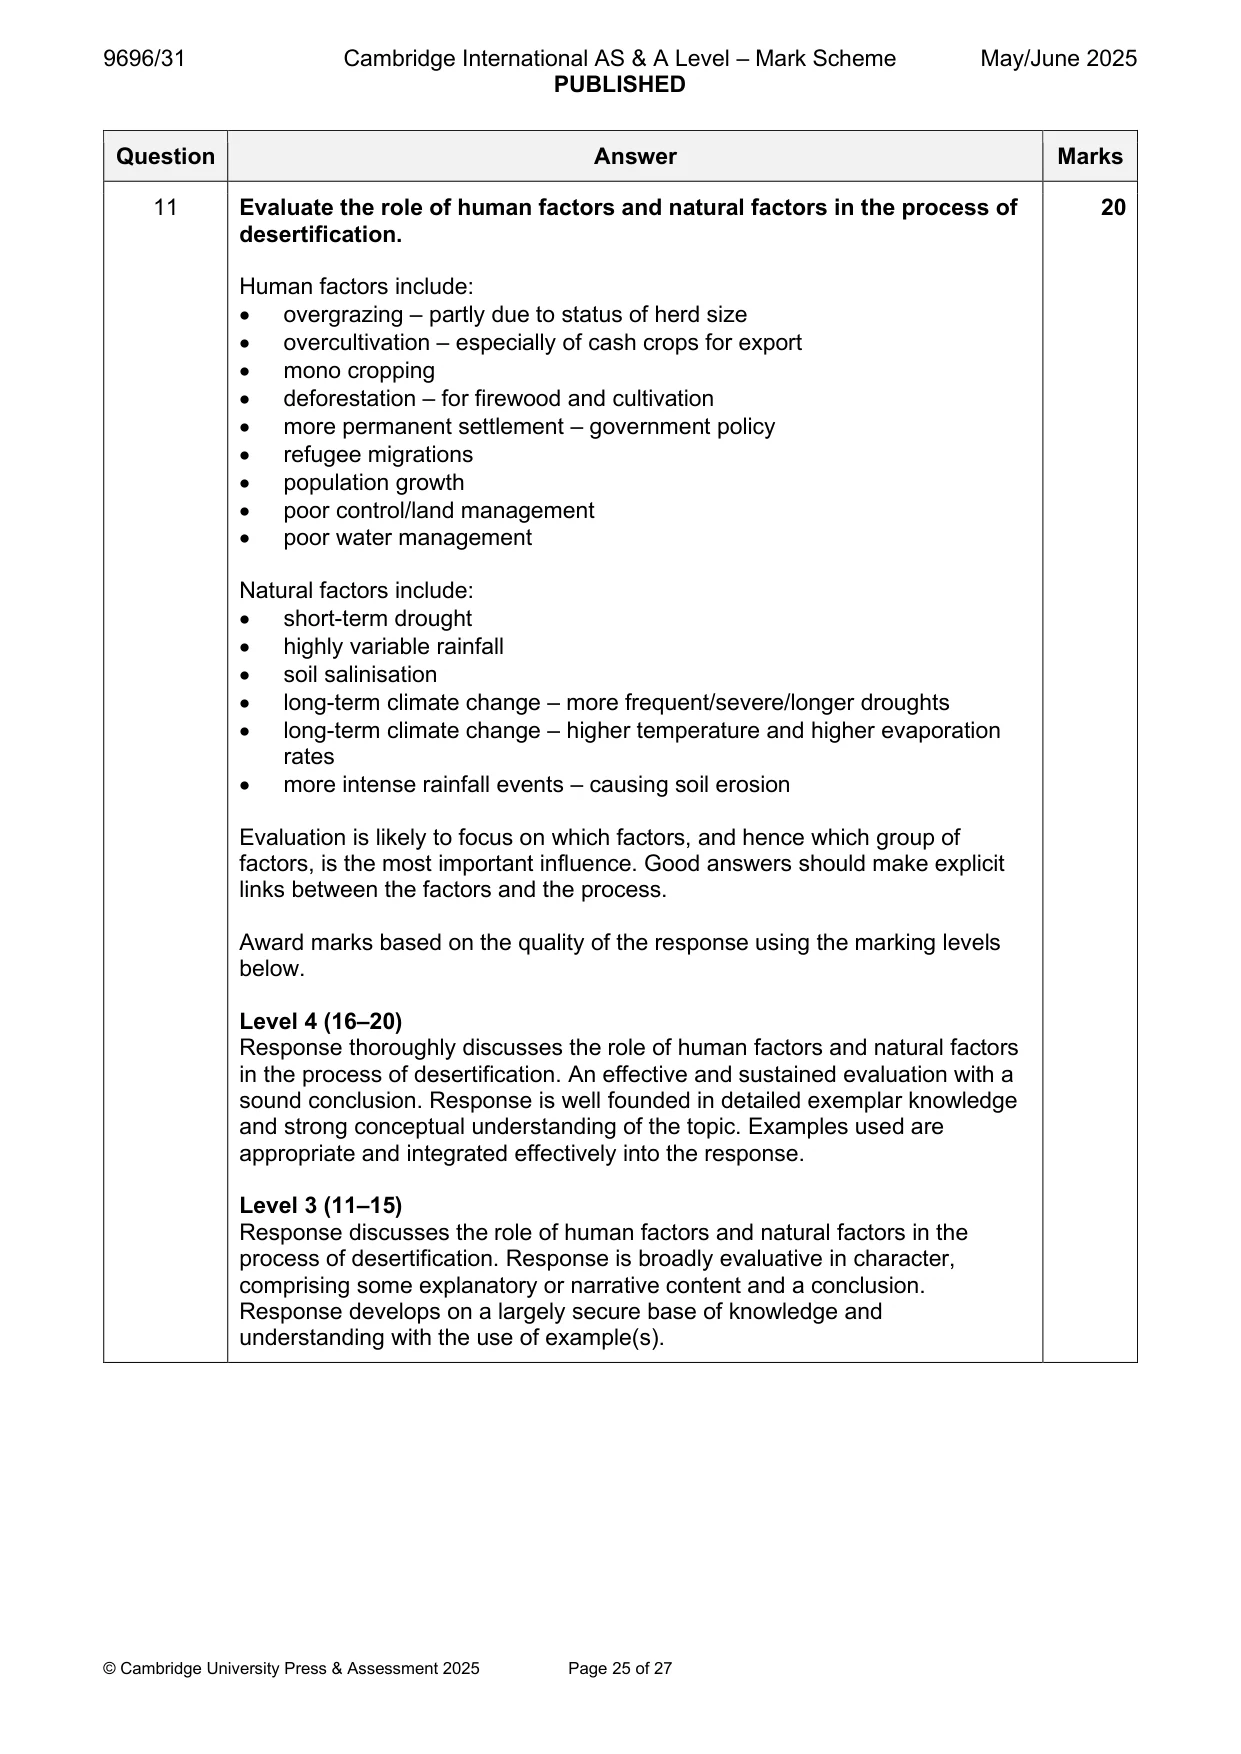
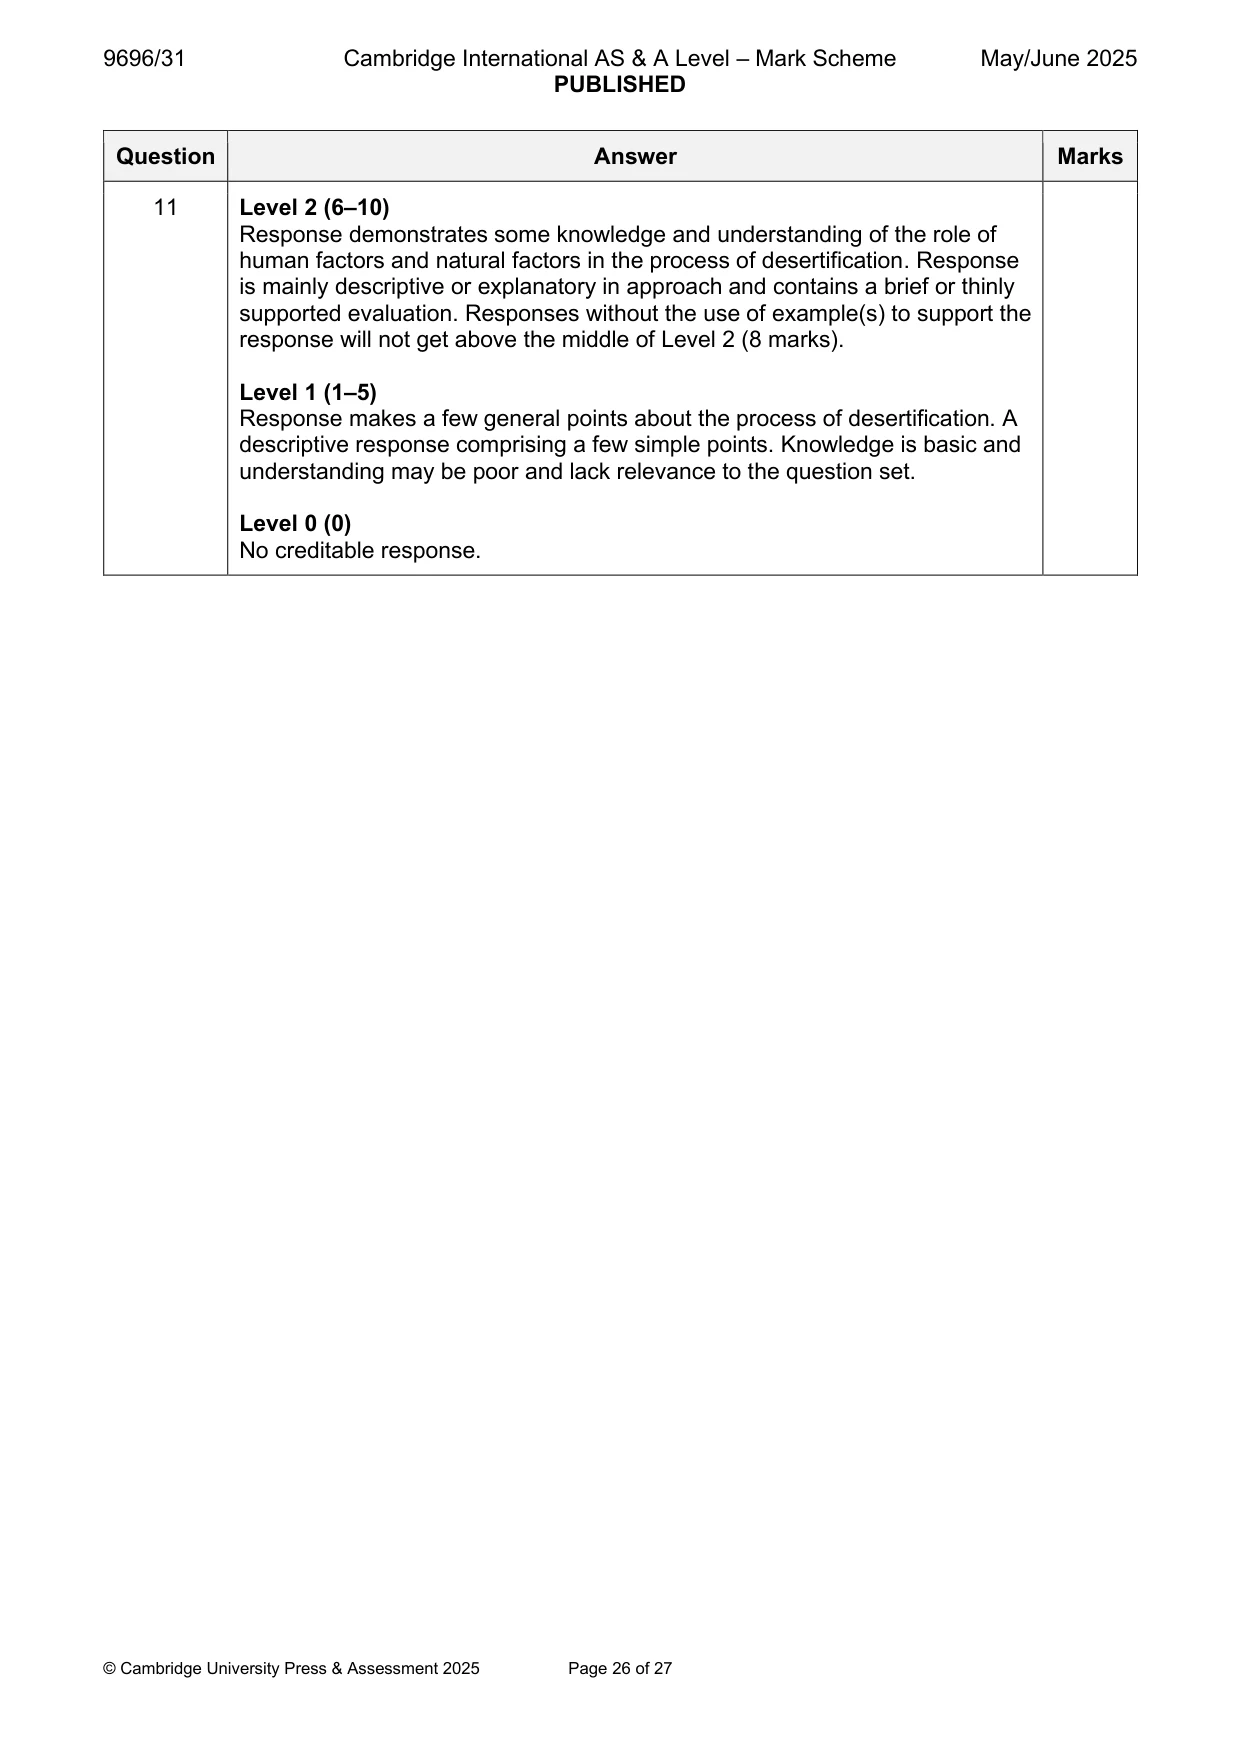
Mark scheme: 11 Evaluate the role of human factors and natural factors in the process of 20 desertification. Human factors include: • overgrazing – partly due to status of herd size • overcultivation – especially of cash crops for export • mono cropping • deforestation – for firewood and cultivation • more permanent settlement – government policy • refugee migrations • population growth • poor control/land management • poor water management Natural factors include: • short-term drought • highly variable rainfall • soil salinisation • long-term climate change – more frequent/severe/longer droughts • long-term climate change – higher temperature and higher evaporation rates • more intense rainfall events – causing soil erosion Evaluation is likely to focus on which factors, and hence which group of factors, is the most important influence. Good answers should make explicit links between the factors and the process. Award marks based on the quality of the response using the marking levels below. Level 4 (16–20) Response thoroughly discusses the role of human factors and natural factors in the process of desertification. An effective and sustained evaluation with a sound conclusion. Response is well founded in detailed exemplar knowledge and strong conceptual understanding of the topic. Examples used are appropriate and integrated effectively into the response. Level 3 (11–15) Response discusses the role of human factors and natural factors in the process of desertification. Response is broadly evaluative in character, comprising some explanatory or narrative content and a conclusion. Response develops on a largely secure base of knowledge and understanding with the use of example(s). 11 Level 2 (6–10) Response demonstrates some knowledge and understanding of the role of human factors and natural factors in the process of desertification. Response is mainly descriptive or explanatory in approach and contains a brief or thinly supported evaluation. Responses without the use of example(s) to support the response will not get above the middle of Level 2 (8 marks). Level 1 (1–5) Response makes a few general points about the process of desertification. A descriptive response comprising a few simple points. Knowledge is basic and understanding may be poor and lack relevance to the question set. Level 0 (0) No creditable response.
What was in this paper
The subtopics covered by these 11 questions, and how many questions each got. Open one in a new tab to see every Cambridge question on it.
2Sustainable management in hazardous environments2Environmental degradation1Hazards resulting from atmospheric disturbances1Hazards resulting from mass movements1Landforms of hot arid and semi-arid environments1Sustainable management of tropical environments1Tropical climates1Weathering1What you needed in this session
Cambridge’s own grade thresholds for 2025 May/June, Paper 3 · Variant 1. A higher threshold means an easier paper — the bar moves with how the cohort did.