Cambridge A Level Economics 9708 — 2025 Oct/Nov Paper 4 · Variant 2
9708/42/O/N/25 · 5 questions · 60 marks · ≈68 min
The question paper and its mark scheme, free to read here and free to download. This is Cambridge’s own paper, exactly as it was sat.
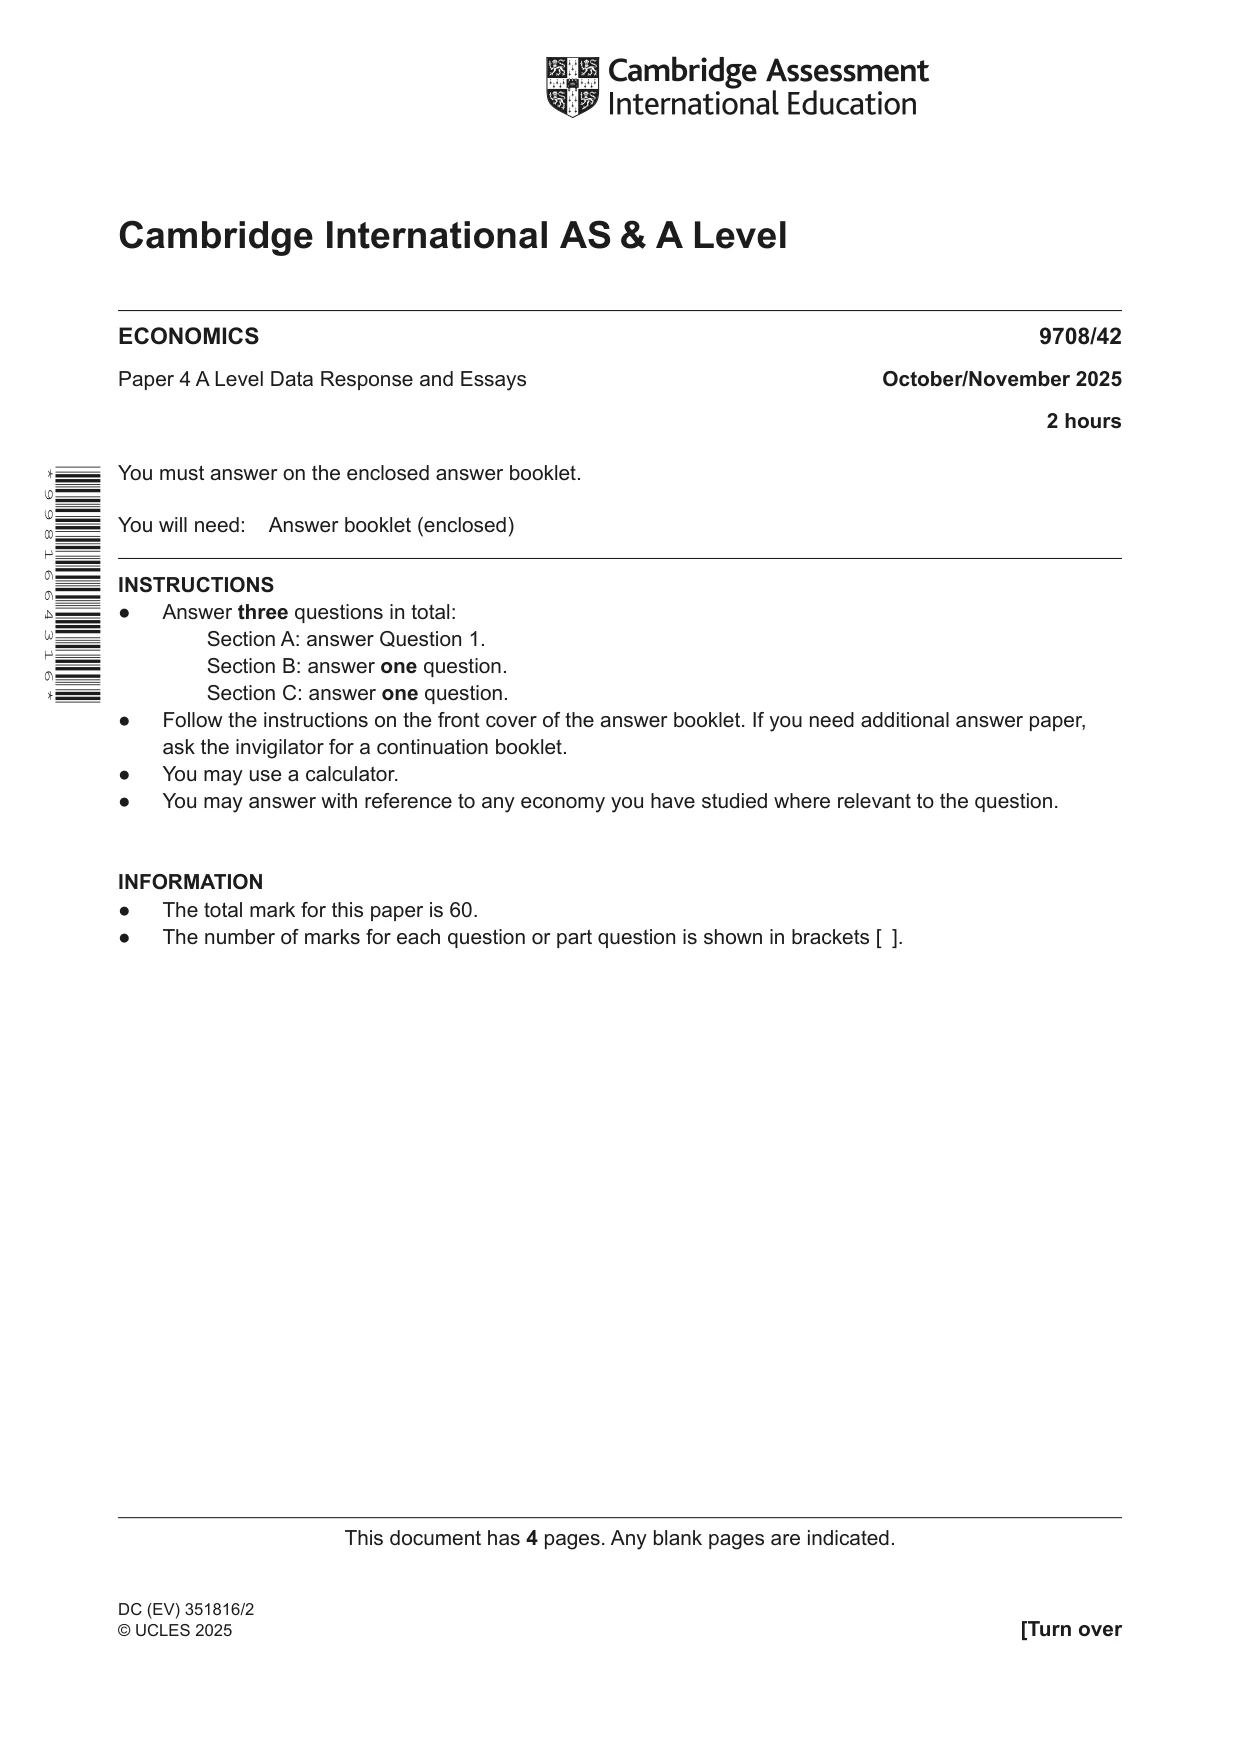
Question paper4 pages
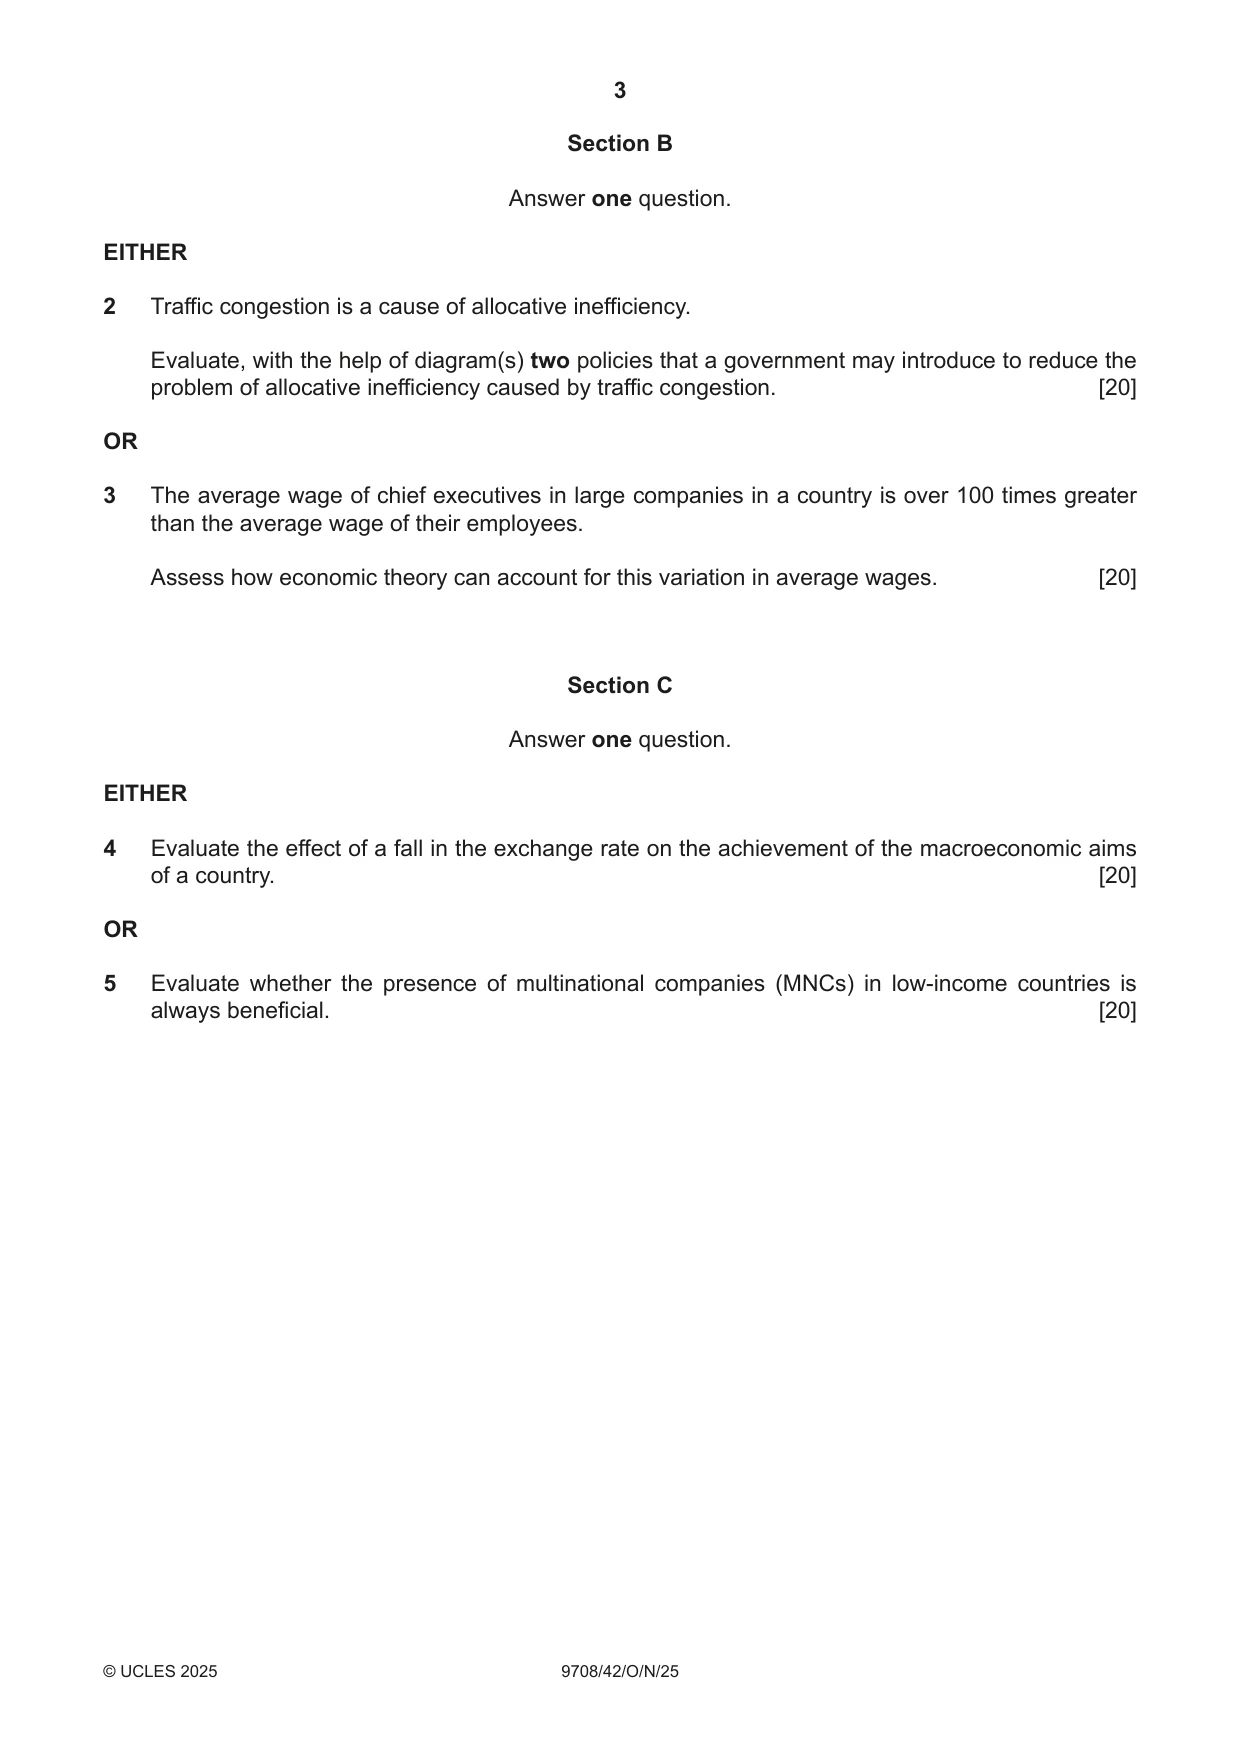

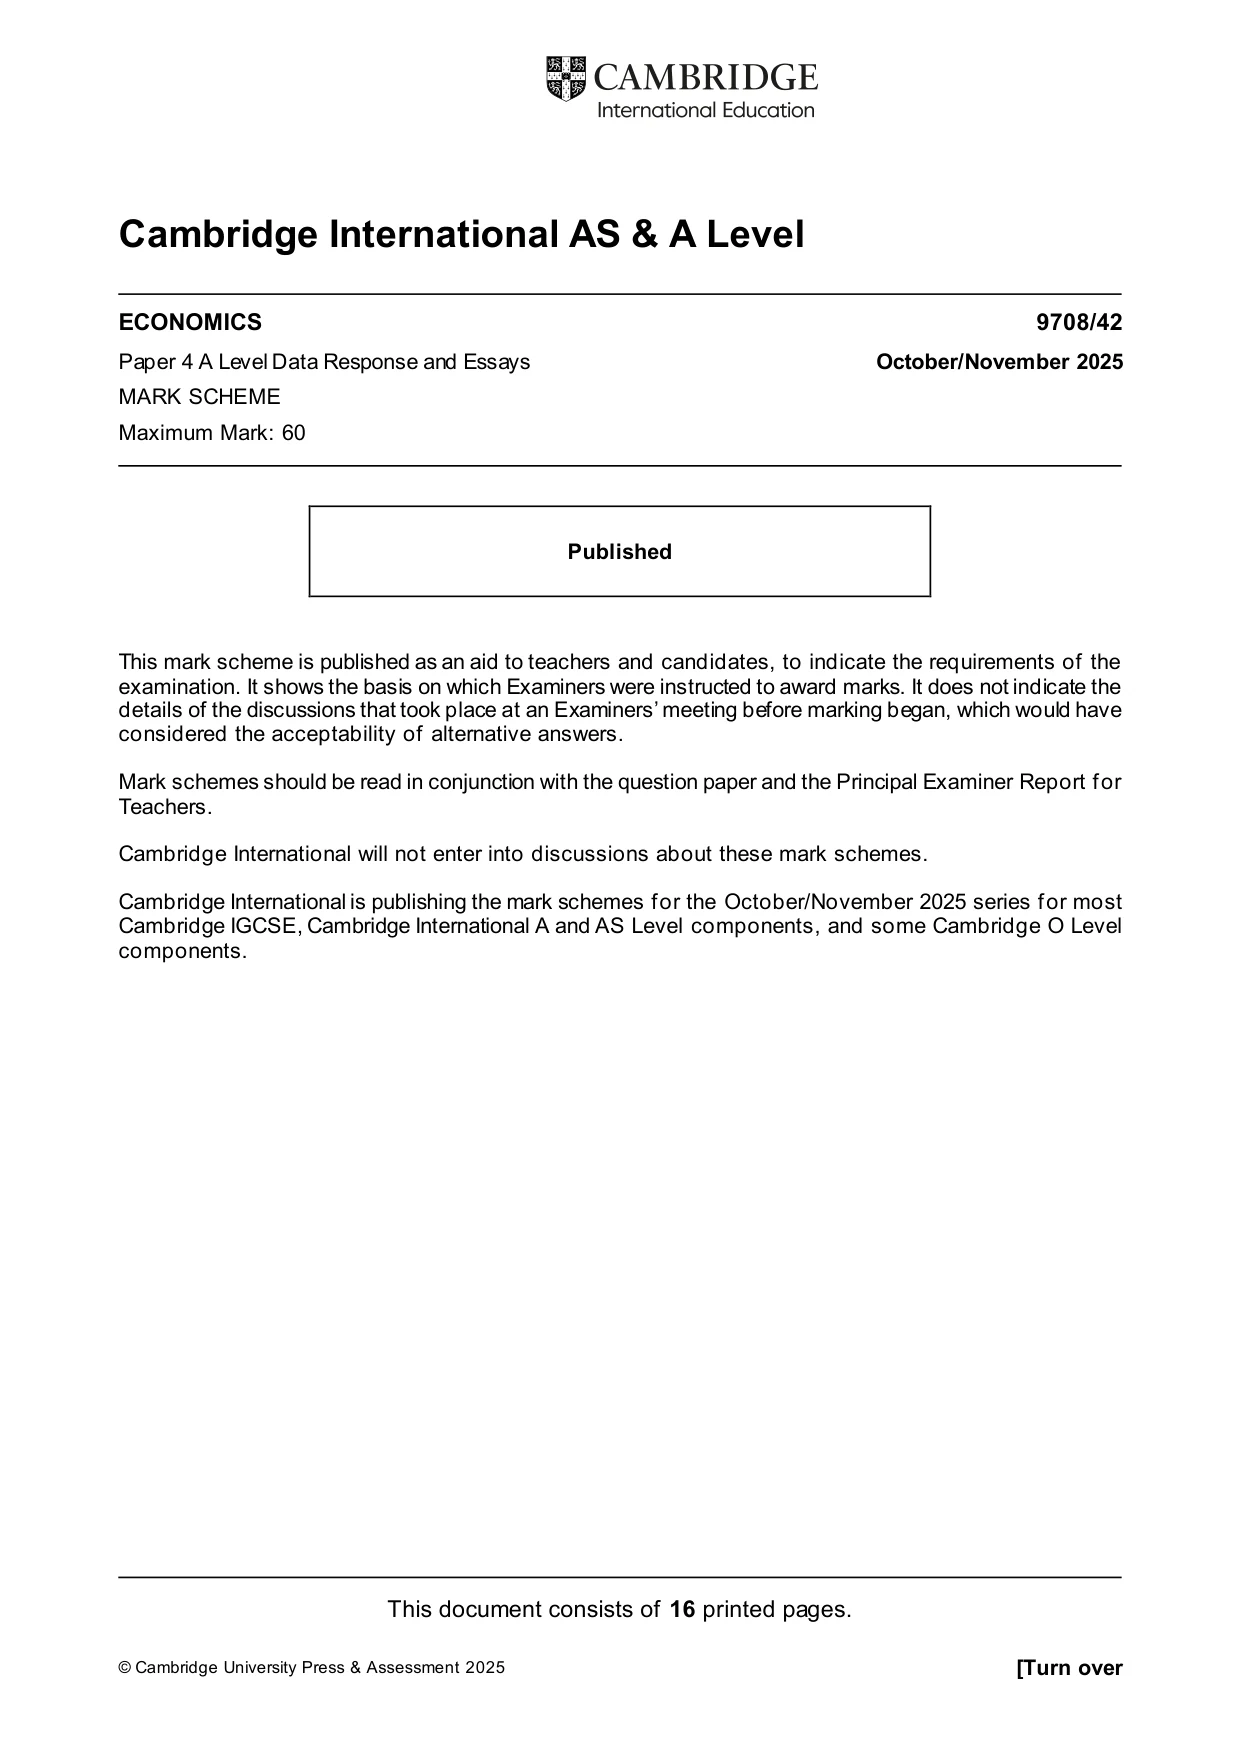
Mark scheme16 pages
Answers below. Sit the paper first if you are practising.





Questions as text
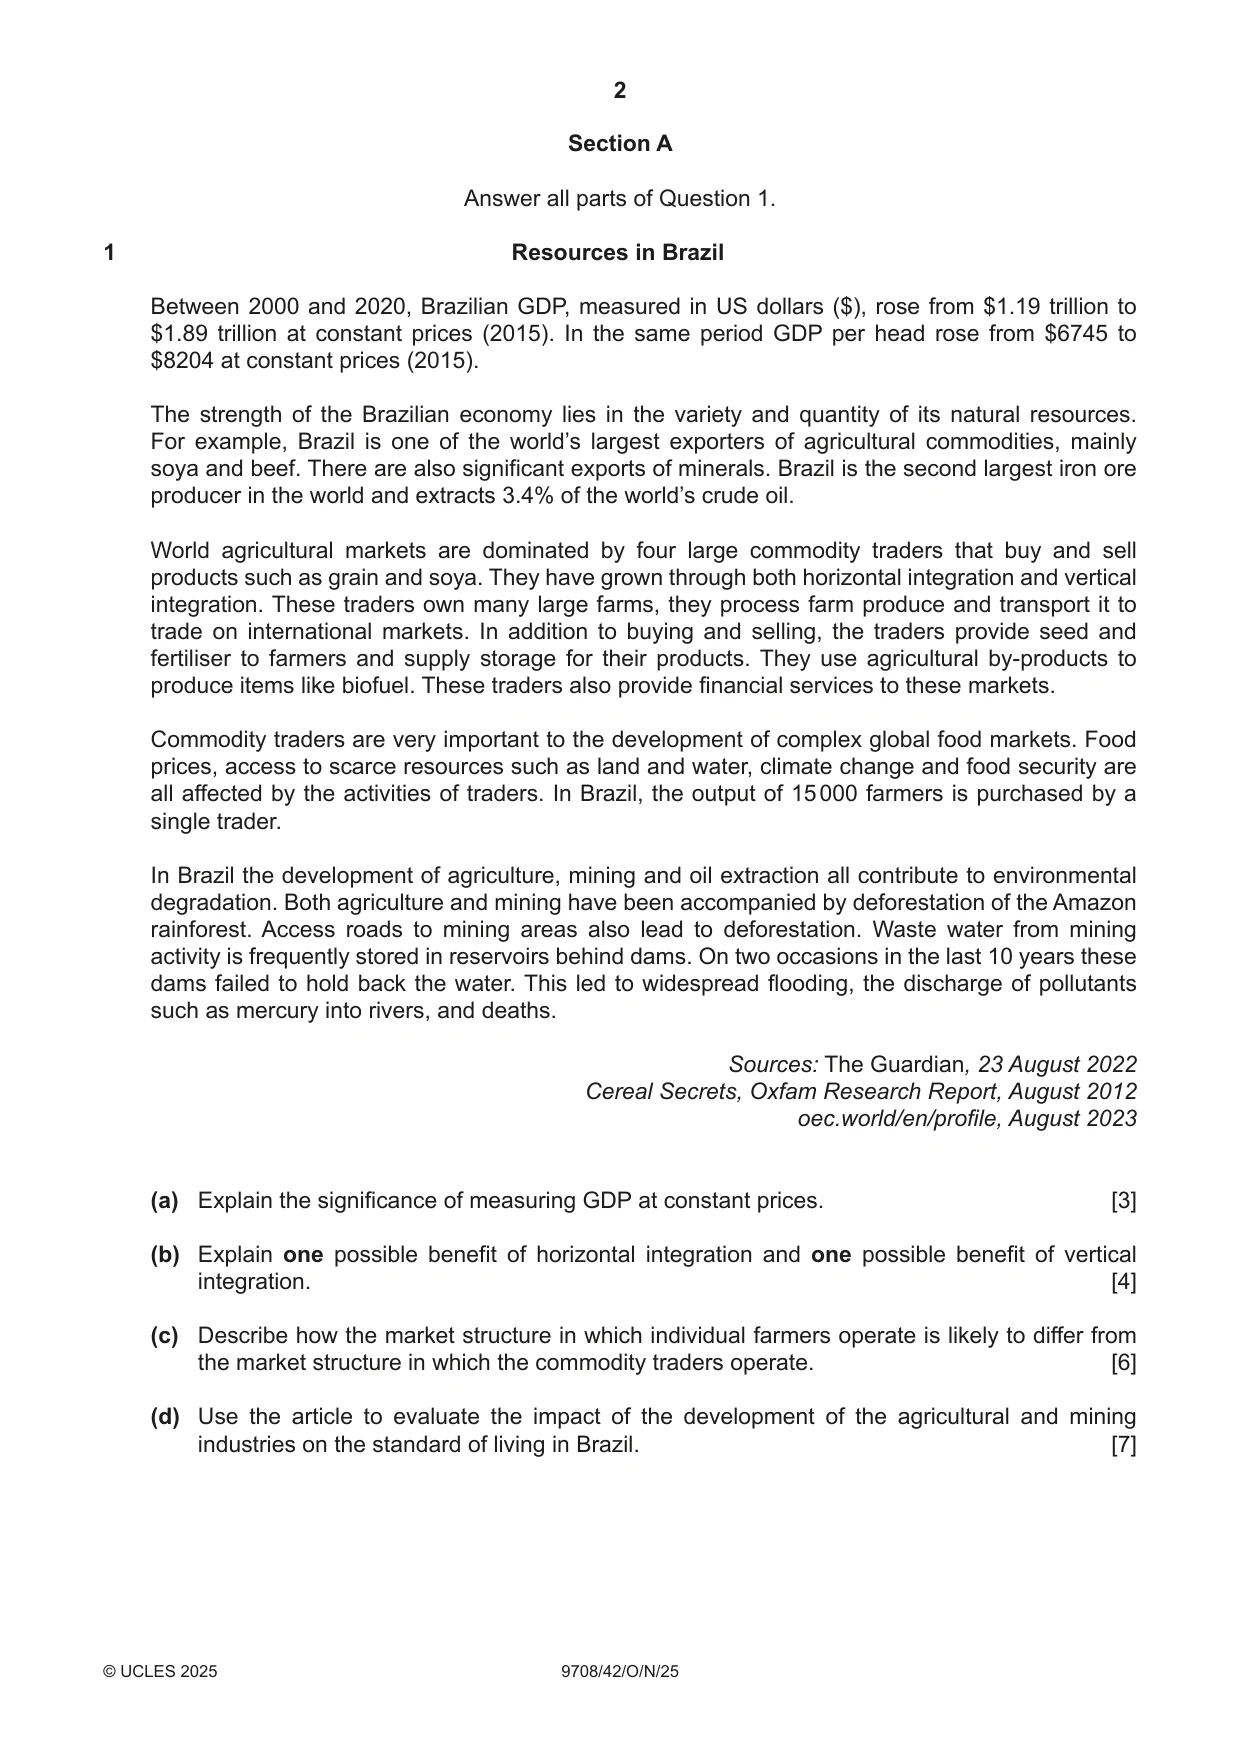
Q1 · Resources in Brazil Between 2000 and 2020, Brazilian GDP, measured in US dollars ($)…
1 Resources in Brazil Between 2000 and 2020, Brazilian GDP, measured in US dollars ($), rose from $1.19 trillion to $1.89 trillion at constant prices (2015). In the same period GDP per head rose from $6745 to $8204 at constant prices (2015). The strength of the Brazilian economy lies in the variety and quantity of its natural resources. For example, Brazil is one of the world’s largest exporters of agricultural commodities, mainly soya and beef. There are also significant exports of minerals. Brazil is the second largest iron ore producer in the world and extracts 3.4% of the world’s crude oil. World agricultural markets are dominated by four large commodity traders that buy and sell products such as grain and soya. They have grown through both horizontal integration and vertical integration. These traders own many large farms, they process farm produce and transport it to trade on international markets. In addition to buying and selling, the traders provide seed and fertiliser to farmers and supply storage for their products. They use agricultural by-products to produce items like biofuel. These traders also provide financial services to these markets. Commodity traders are very important to the development of complex global food markets. Food prices, access to scarce resources such as land and water, climate change and food security are all affected by the activities of traders. In Brazil, the output of 15 000 farmers is purchased by a single trader. In Brazil the development of agriculture, mining and oil extraction all contribute to environmental degradation. Both agriculture and mining have been accompanied by deforestation of the Amazon rainforest. Access roads to mining areas also lead to deforestation. Waste water from mining activity is frequently stored in reservoirs behind dams. On two occasions in the last 10 years these dams failed to hold back the water. This led to widespread flooding, the discharge of pollutants such as mercury into rivers, and deaths. Sources: The Guardian, 23 August 2022 Cereal Secrets, Oxfam Research Report, August 2012 oec.world/en/profile, August 2023 (a) Explain the significance of measuring GDP at constant prices. [3] (b) Explain one possible benefit of horizontal integration and one possible benefit of vertical integration. [4] (c) Describe how the market structure in which individual farmers operate is likely to differ from the market structure in which the commodity traders operate. [6] (d) Use the article to evaluate the impact of the development of the agricultural and mining industries on the standard of living in Brazil. [7]
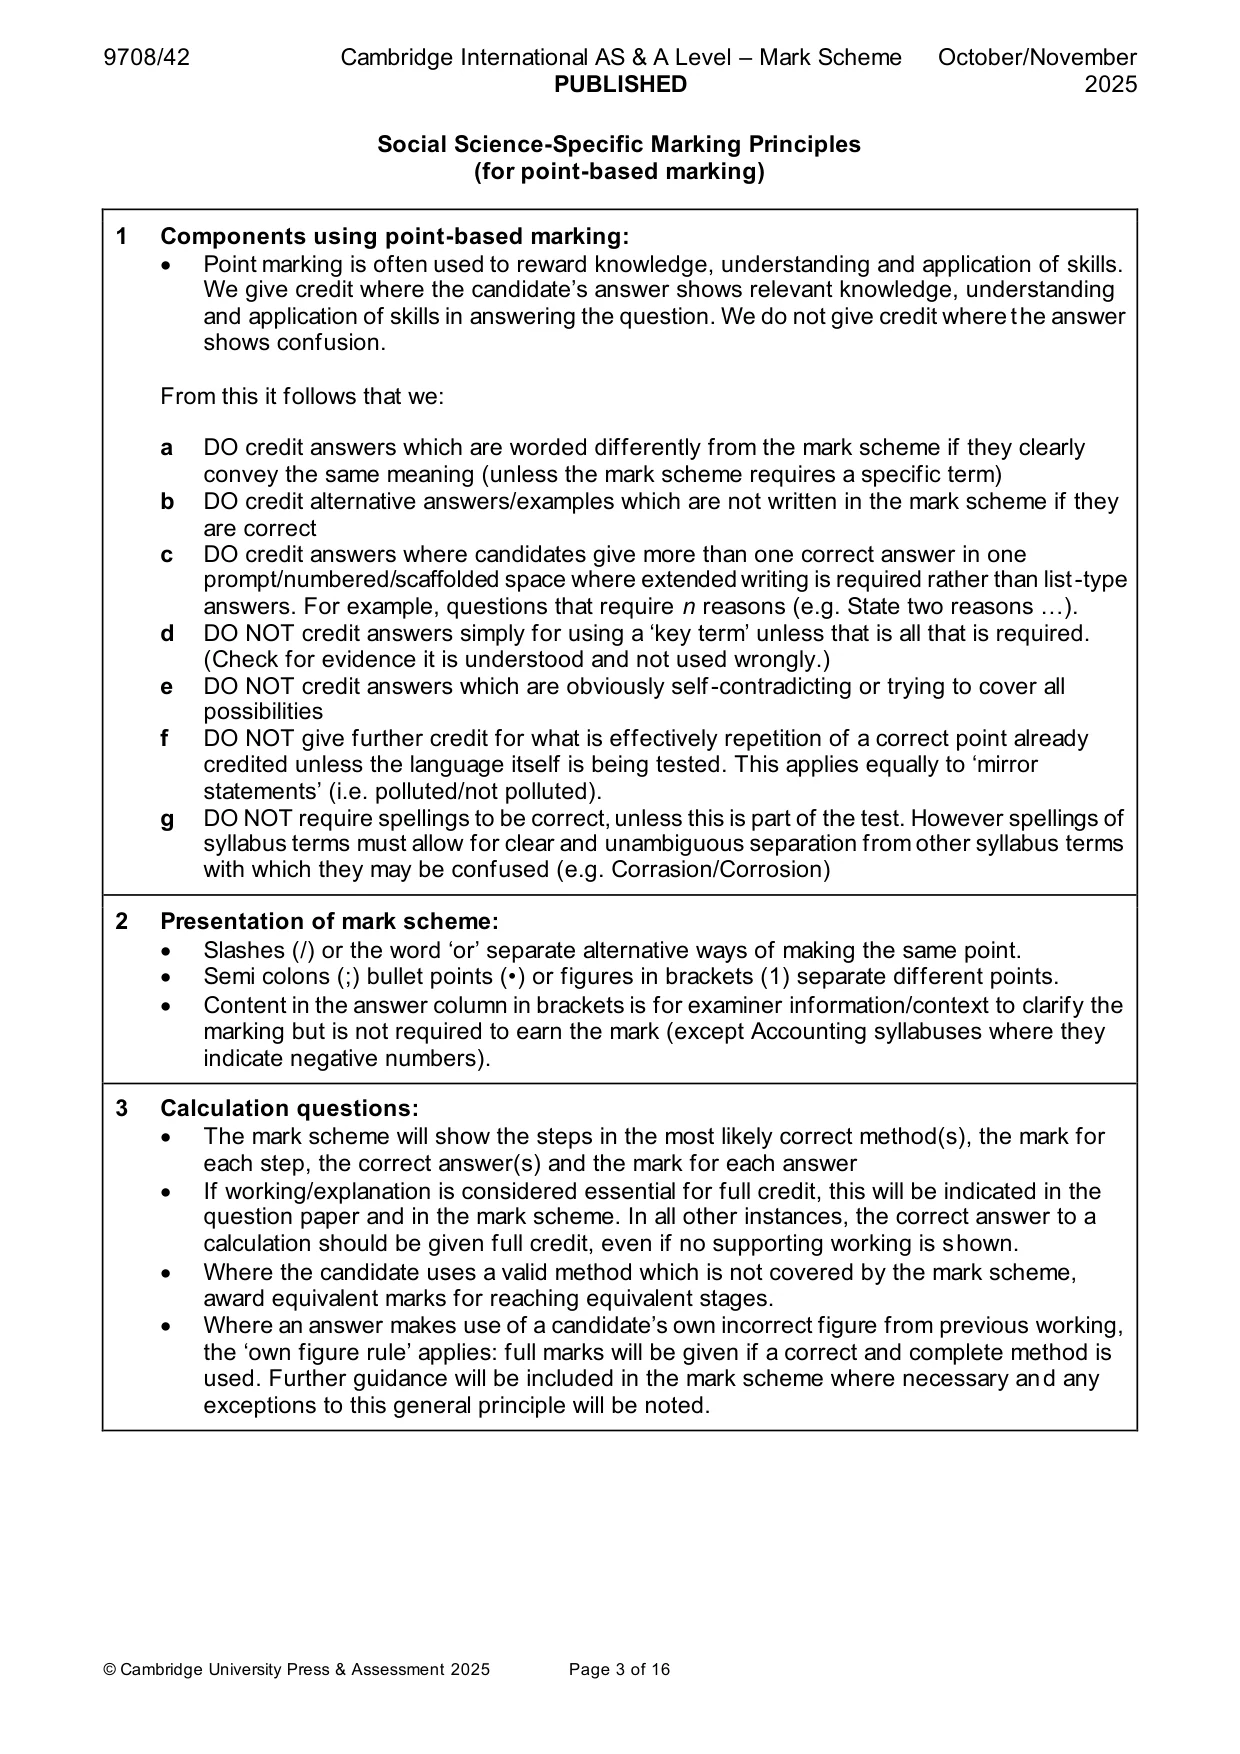
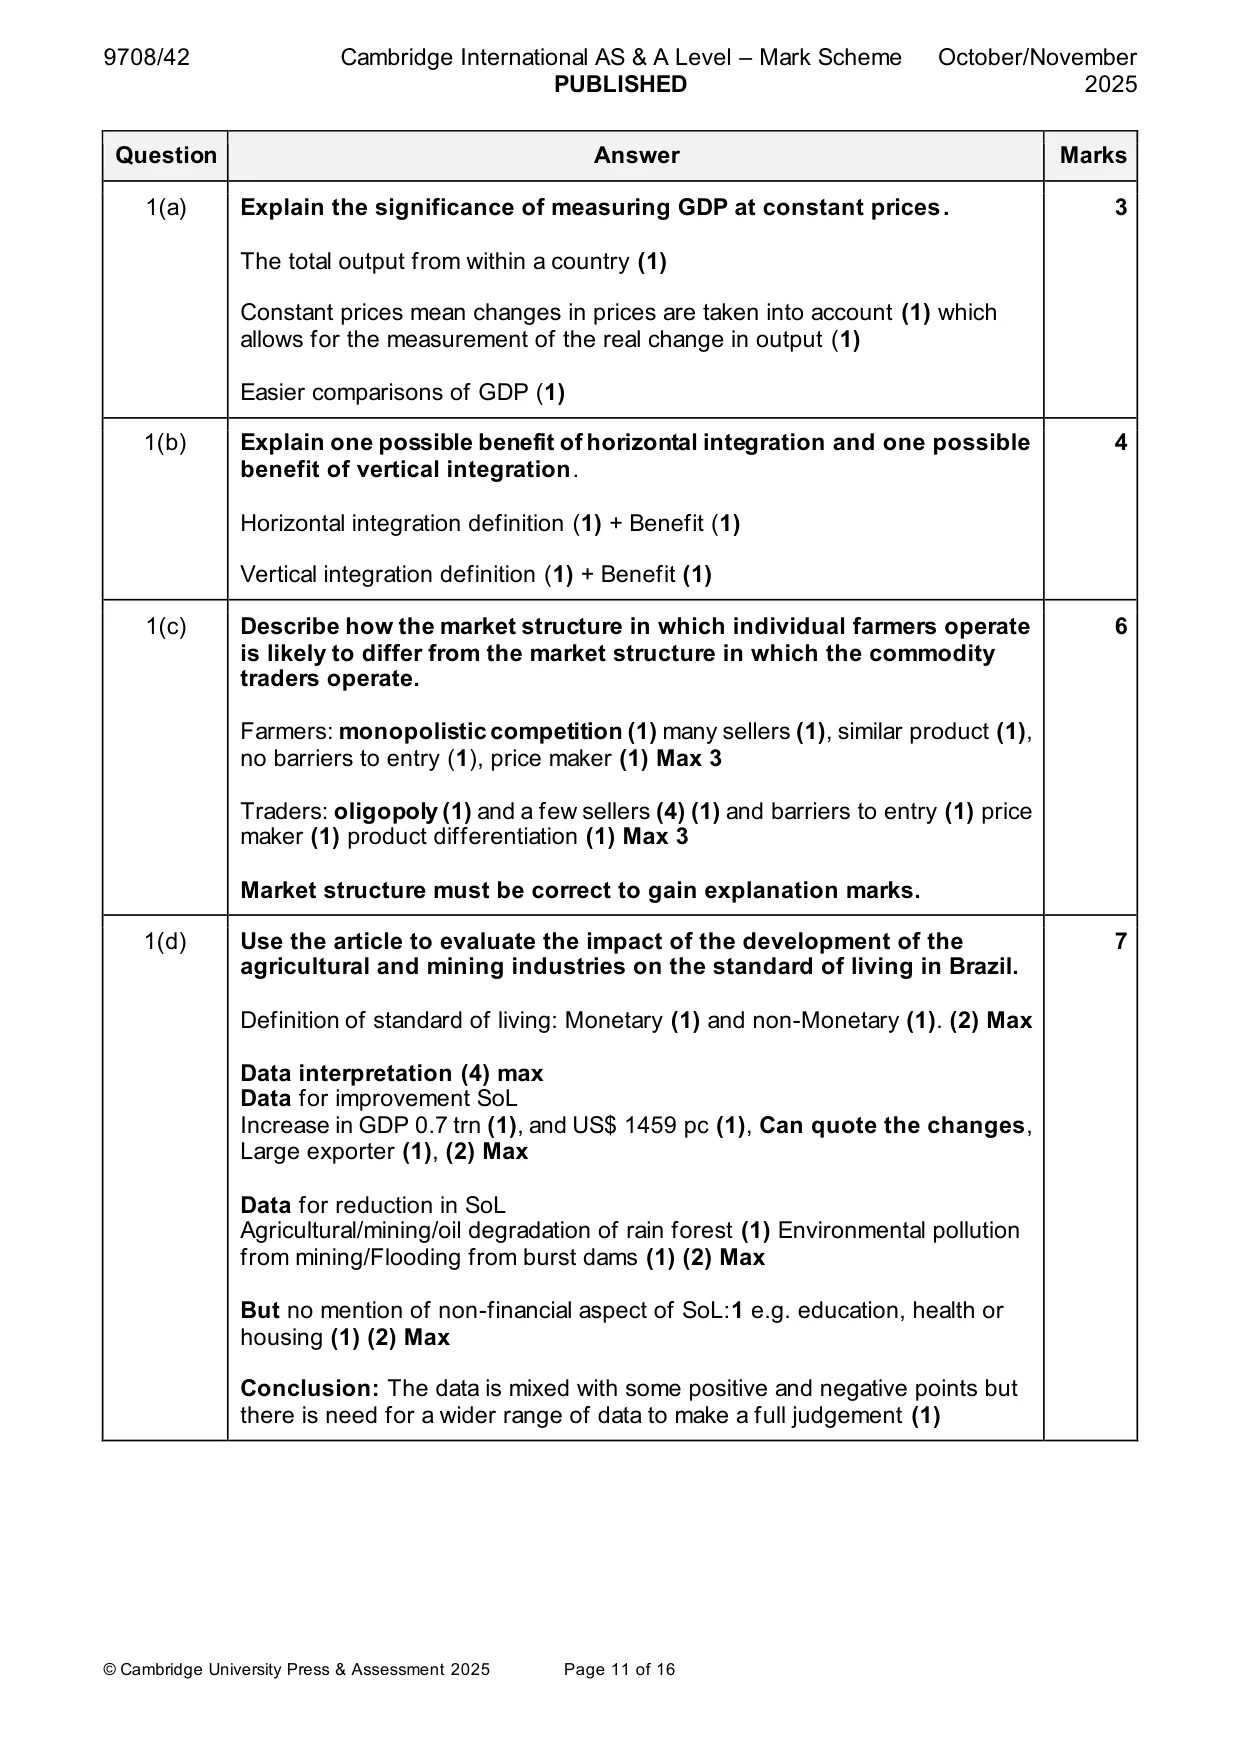
Mark scheme: Question Answer Marks 1(a) Explain the significance of measuring GDP at constant prices. 3 The total output from within a country (1) Constant prices mean changes in prices are taken into account (1) which allows for the measurement of the real change in output (1) Easier comparisons of GDP (1) 1(b) Explain one possible benefit of horizontal integration and one possible 4 benefit of vertical integration. Horizontal integration definition (1) + Benefit (1) Vertical integration definition (1) + Benefit (1) 1(c) Describe how the market structure in which individual farmers operate 6 is likely to differ from the market structure in which the commodity traders operate. Farmers: monopolistic competition (1) many sellers (1), similar product (1), no barriers to entry (1), price maker (1) Max 3 Traders: oligopoly (1) and a few sellers (4) (1) and barriers to entry (1) price maker (1) product differentiation (1) Max 3 Market structure must be correct to gain explanation marks. 1(d) Use the article to evaluate the impact of the development of the 7 agricultural and mining industries on the standard of living in Brazil. Definition of standard of living: Monetary (1) and non-Monetary (1). (2) Max Data interpretation (4) max Data for improvement SoL Increase in GDP 0.7 trn (1), and US$ 1459 pc (1), Can quote the changes, Large exporter (1), (2) Max Data for reduction in SoL Agricultural/mining/oil degradation of rain forest (1) Environmental pollution from mining/Flooding from burst dams (1) (2) Max But no mention of non-financial aspect of SoL:1 e.g. education, health or housing (1) (2) Max Conclusion: The data is mixed with some positive and negative points but there is need for a wider range of data to make a full judgement (1)
More questions on Private costs and benefits, externalities and social costs and benefits
Q2 · Traffic congestion is a cause of allocative inefficiency
2 Traffic congestion is a cause of allocative inefficiency. Evaluate, with the help of diagram(s) two policies that a government may introduce to reduce the problem of allocative inefficiency caused by traffic congestion. [20] OR
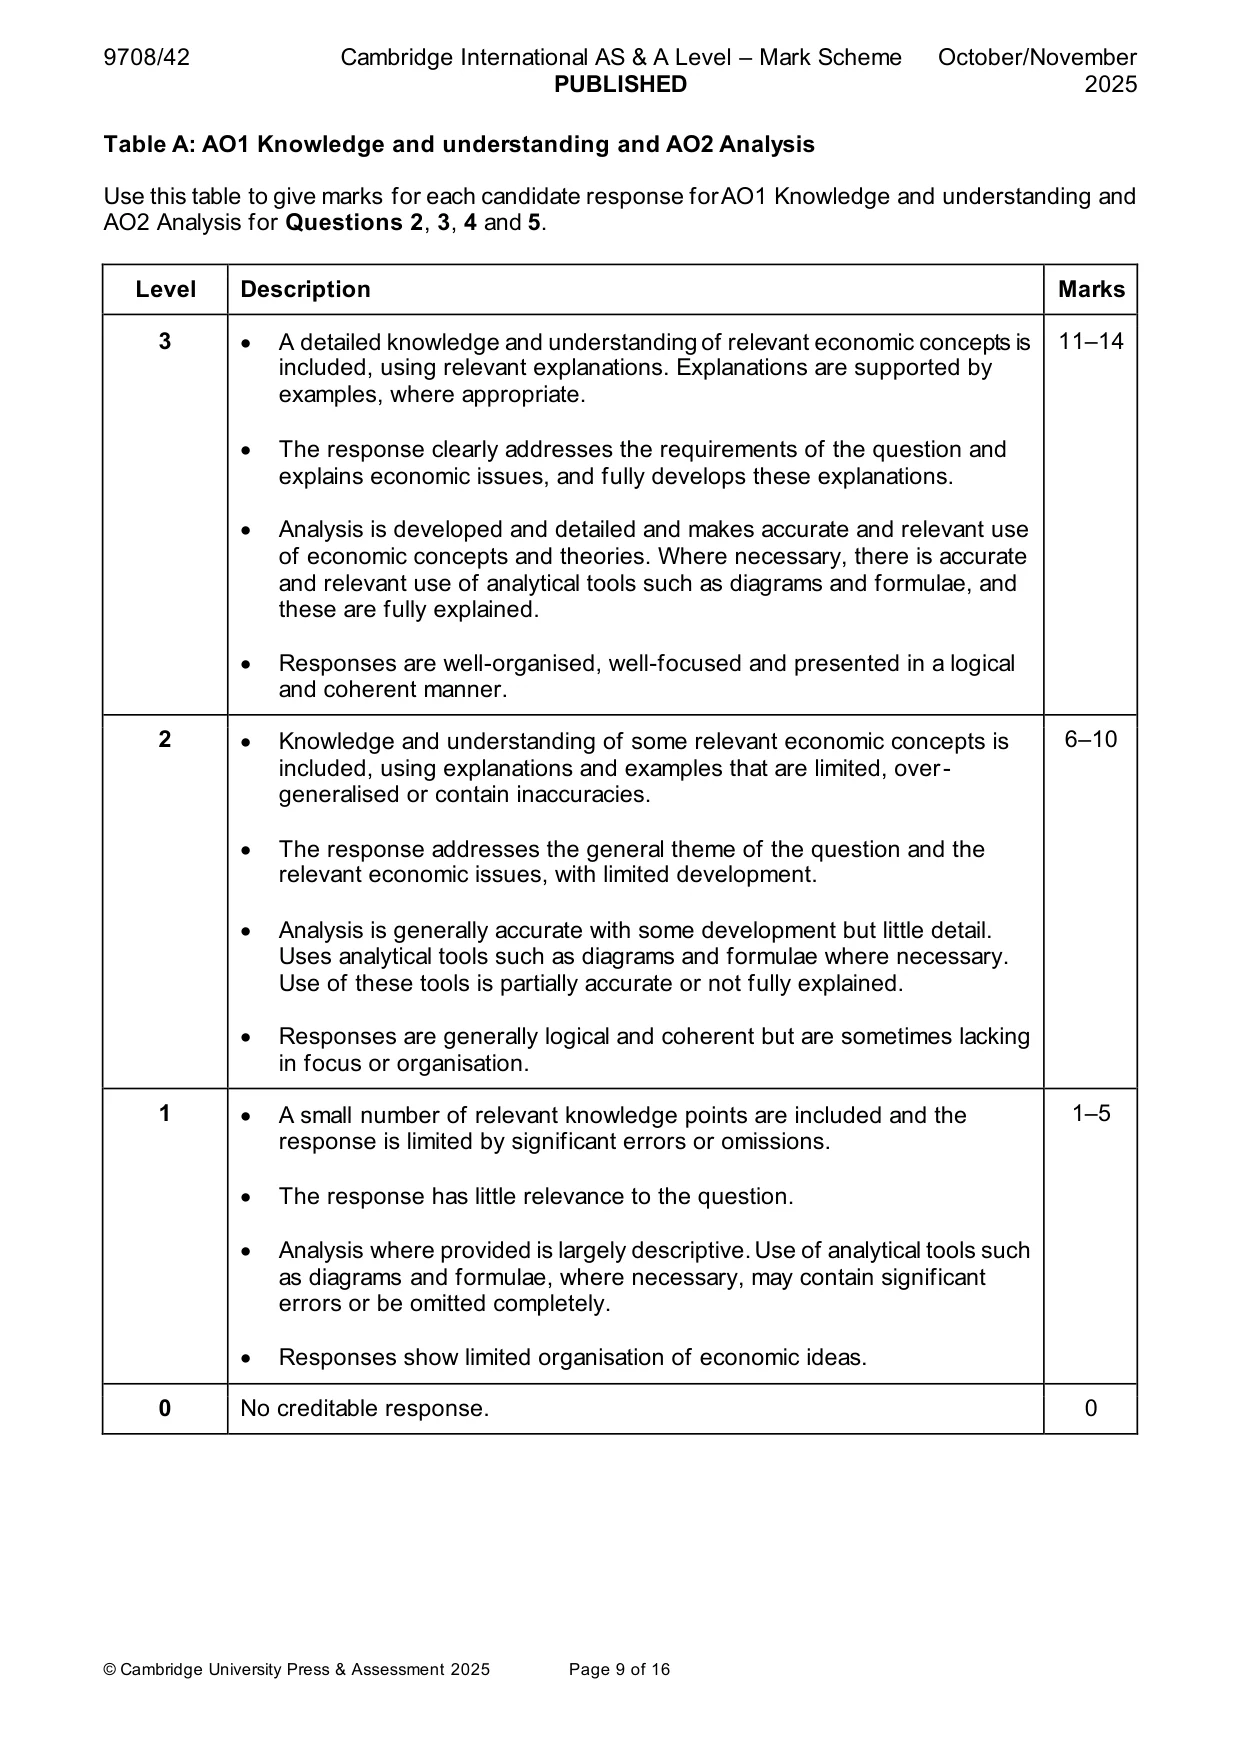
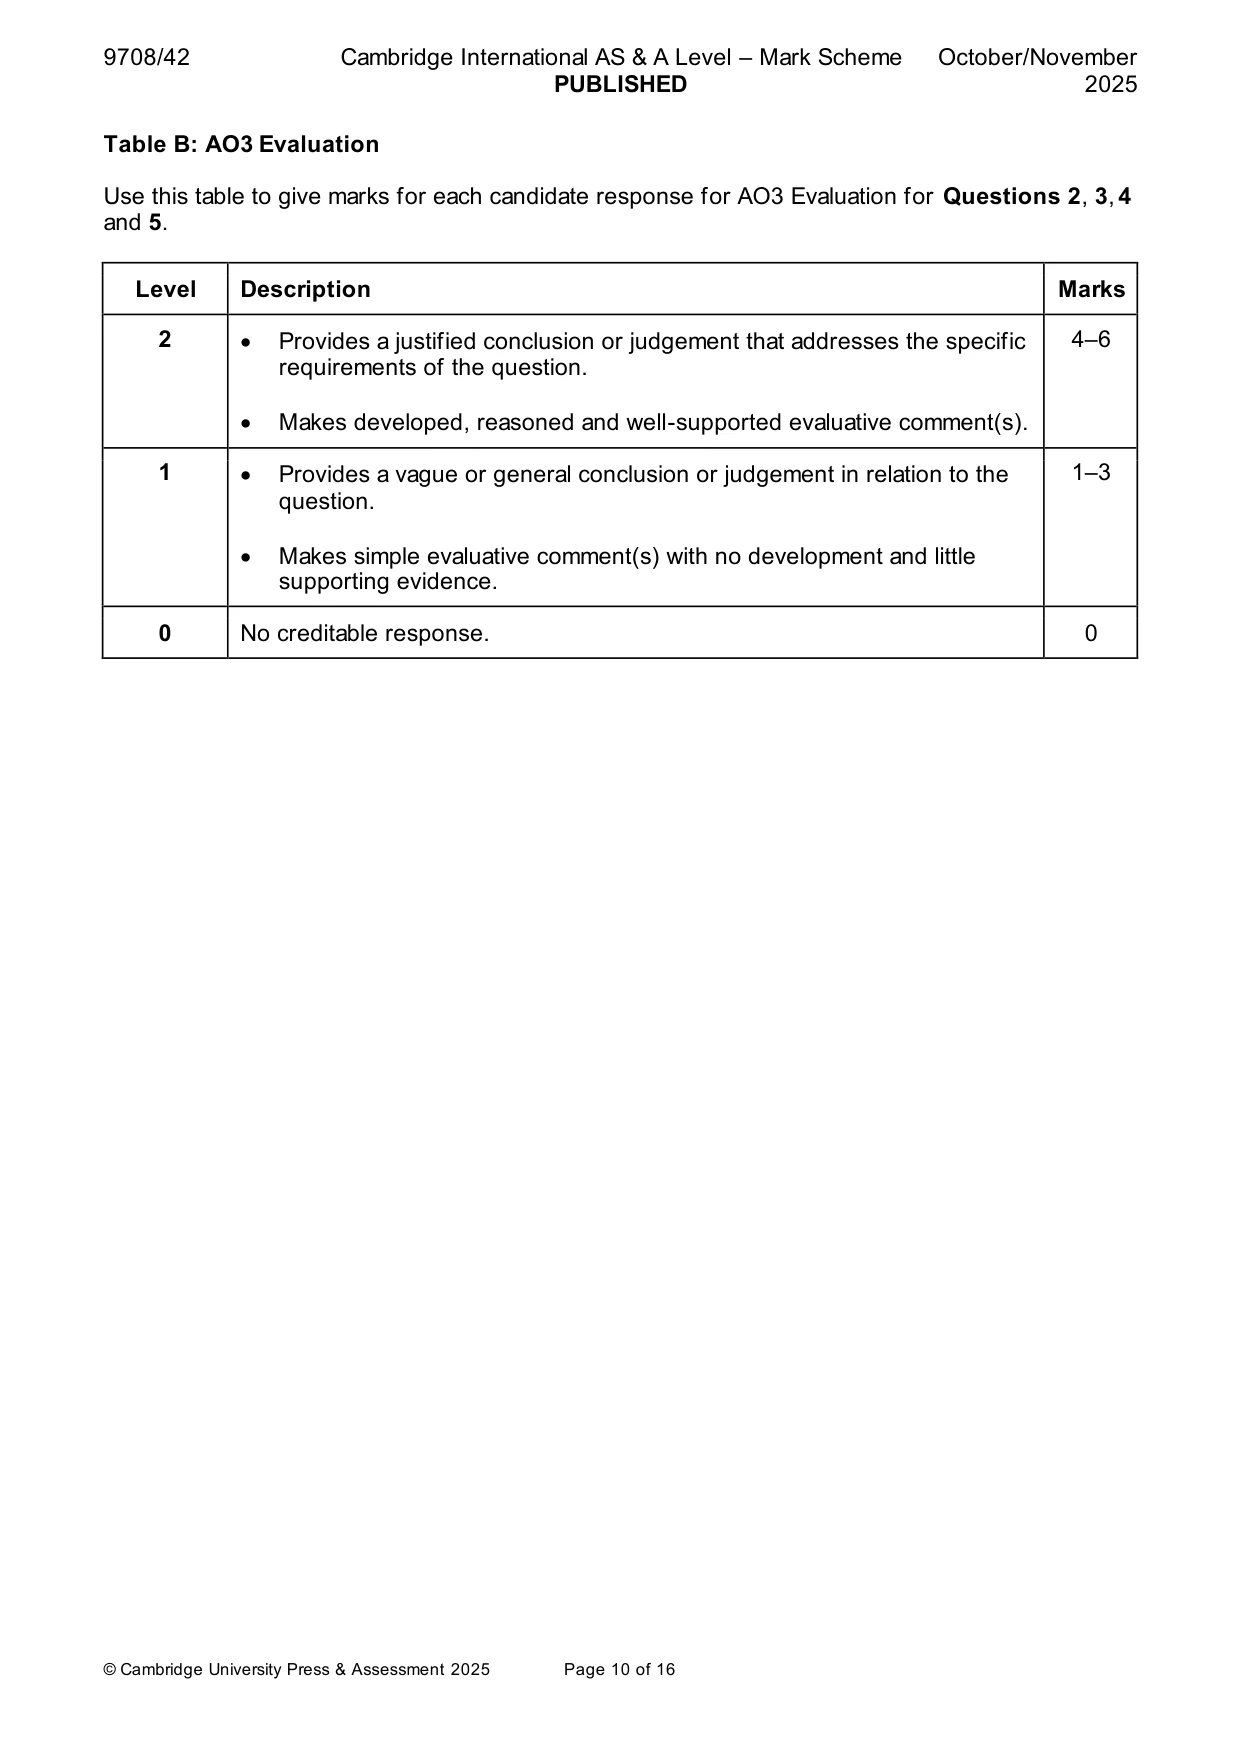
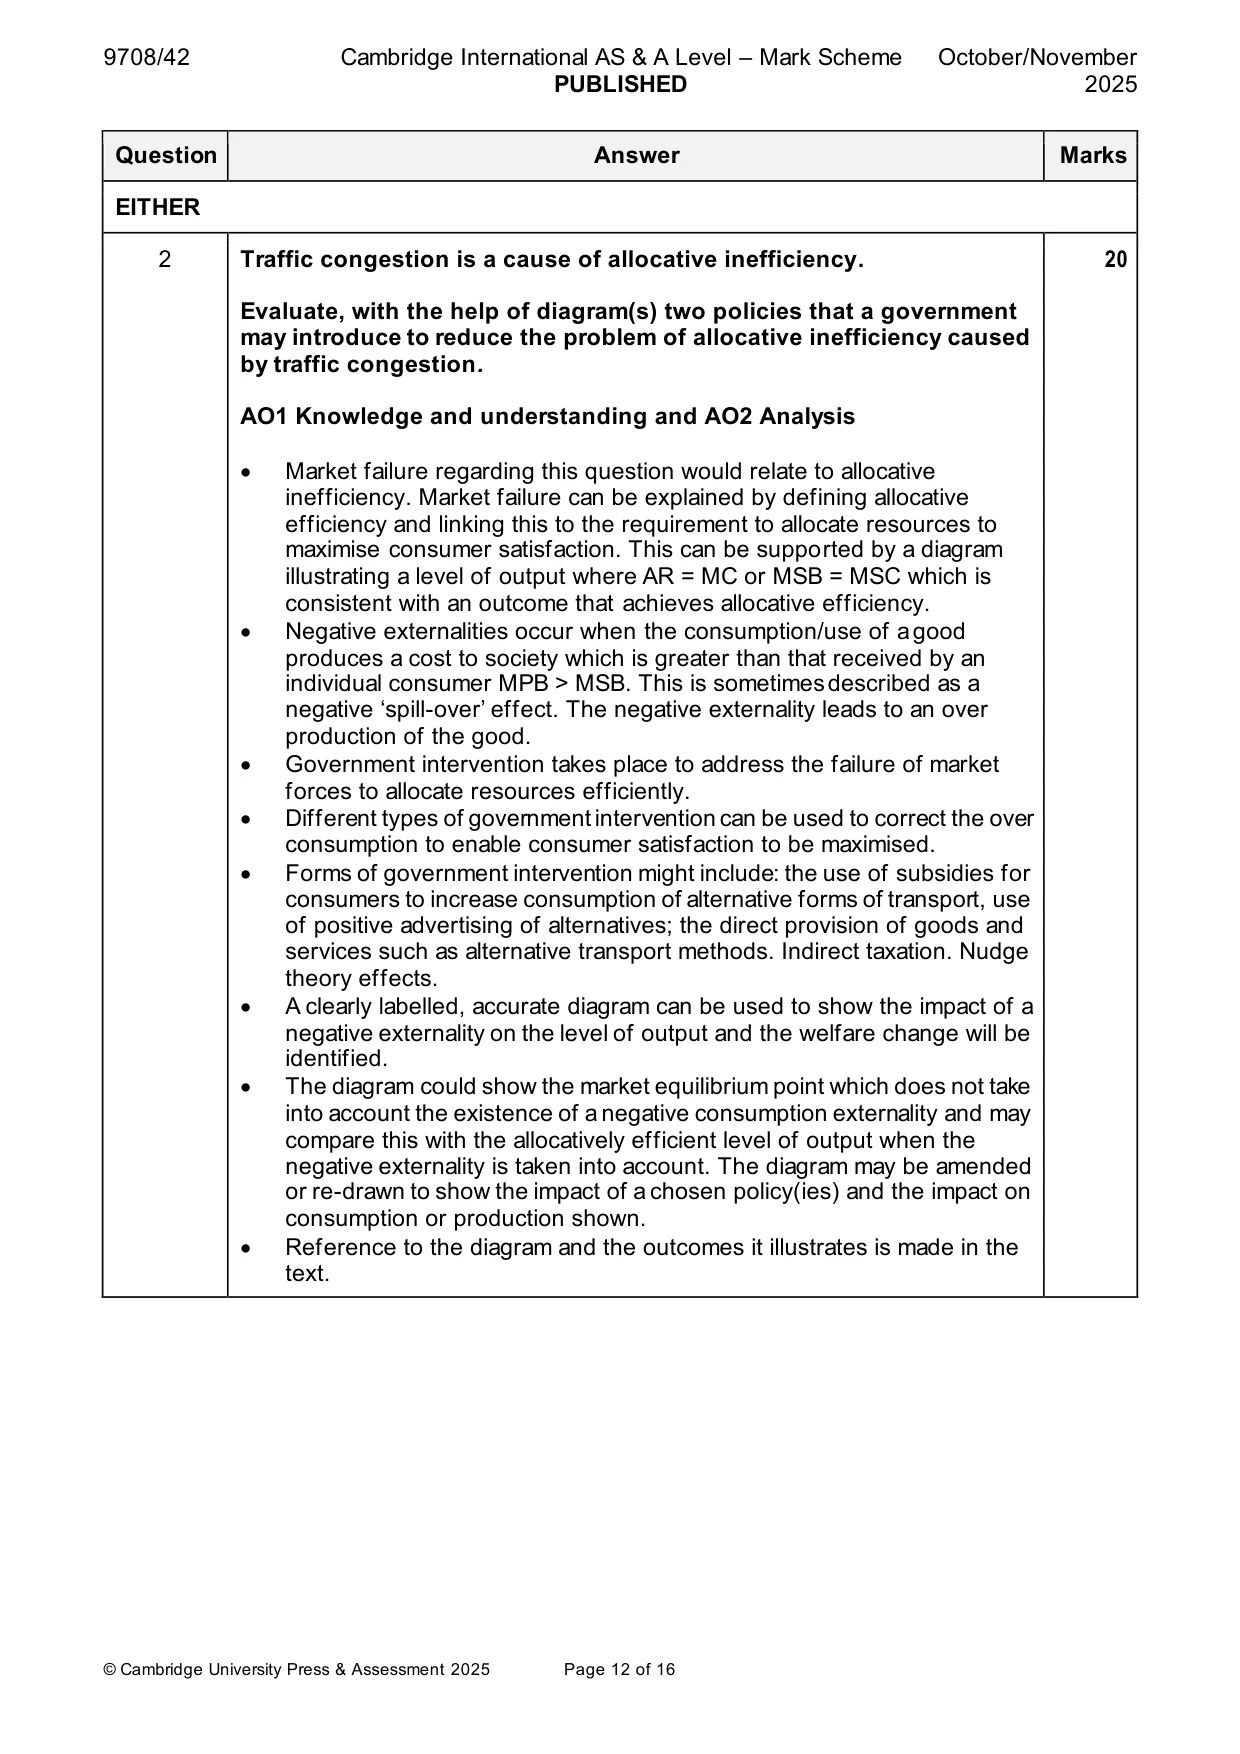
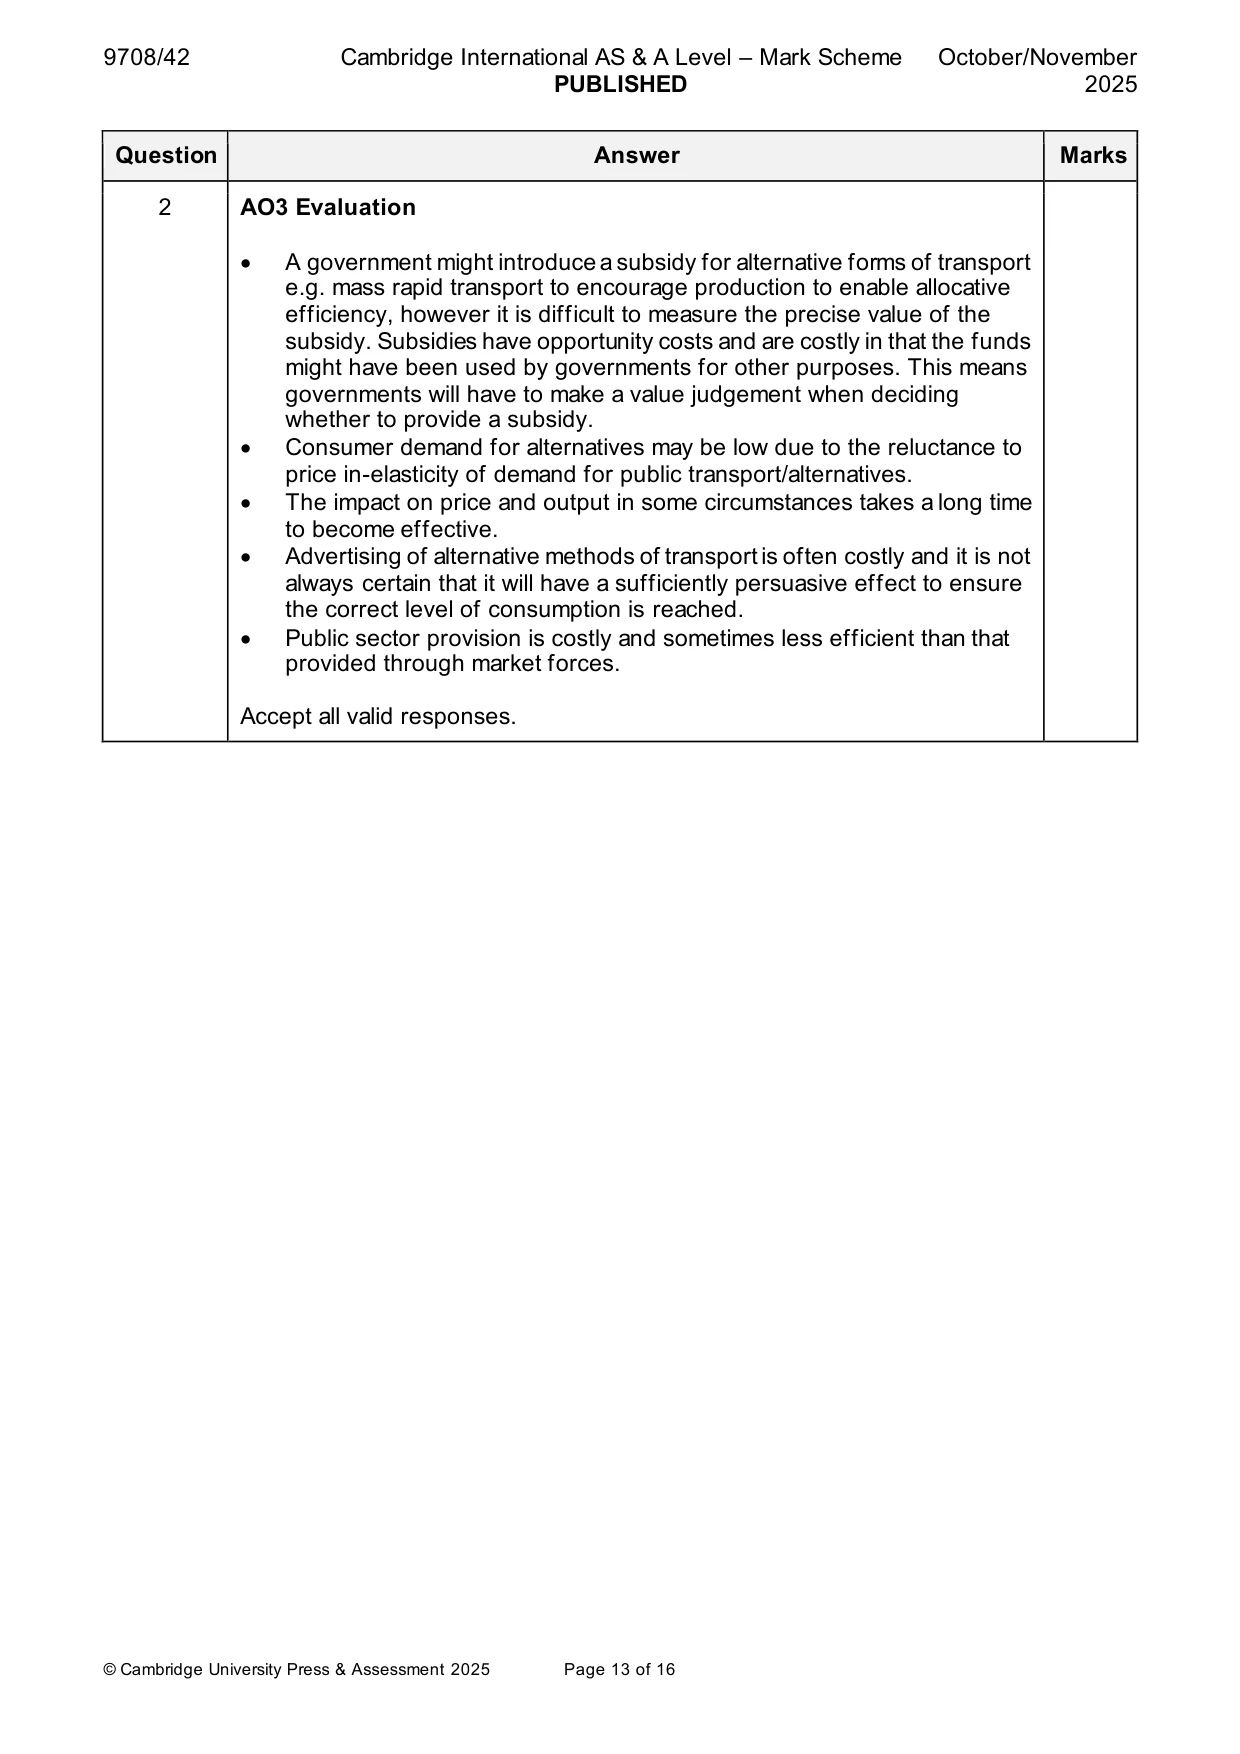
Mark scheme: 2 Traffic congestion is a cause of allocative inefficiency. 20 Evaluate, with the help of diagram(s) two policies that a government may introduce to reduce the problem of allocative inefficiency caused by traffic congestion. AO1 Knowledge and understanding and AO2 Analysis • Market failure regarding this question would relate to allocative inefficiency. Market failure can be explained by defining allocative efficiency and linking this to the requirement to allocate resources to maximise consumer satisfaction. This can be supported by a diagram illustrating a level of output where AR = MC or MSB = MSC which is consistent with an outcome that achieves allocative efficiency. • Negative externalities occur when the consumption/use of a good produces a cost to society which is greater than that received by an individual consumer MPB > MSB. This is sometimes described as a negative ‘spill-over’ effect. The negative externality leads to an over production of the good. • Government intervention takes place to address the failure of market forces to allocate resources efficiently. • Different types of government intervention can be used to correct the over consumption to enable consumer satisfaction to be maximised. • Forms of government intervention might include: the use of subsidies for consumers to increase consumption of alternative forms of transport, use of positive advertising of alternatives; the direct provision of goods and services such as alternative transport methods. Indirect taxation. Nudge theory effects. • A clearly labelled, accurate diagram can be used to show the impact of a negative externality on the level of output and the welfare change will be identified. • The diagram could show the market equilibrium point which does not take into account the existence of a negative consumption externality and may compare this with the allocatively efficient level of output when the negative externality is taken into account. The diagram may be amended or re-drawn to show the impact of a chosen policy(ies) and the impact on consumption or production shown. • Reference to the diagram and the outcomes it illustrates is made in the text. 2 AO3 Evaluation • A government might introduce a subsidy for alternative forms of transport e.g. mass rapid transport to encourage production to enable allocative efficiency, however it is difficult to measure the precise value of the subsidy. Subsidies have opportunity costs and are costly in that the funds might have been used by governments for other purposes. This means governments will have to make a value judgement when deciding whether to provide a subsidy. • Consumer demand for alternatives may be low due to the reluctance to price in-elasticity of demand for public transport/alternatives. • The impact on price and output in some circumstances takes a long time to become effective. • Advertising of alternative methods of transport is often costly and it is not always certain that it will have a sufficiently persuasive effect to ensure the correct level of consumption is reached. • Public sector provision is costly and sometimes less efficient than that provided through market forces. Accept all valid responses.
Q3 · The average wage of chief executives in large companies in a country is over 100 times…
3 The average wage of chief executives in large companies in a country is over 100 times greater than the average wage of their employees. Assess how economic theory can account for this variation in average wages. [20] Section C Answer one question. EITHER
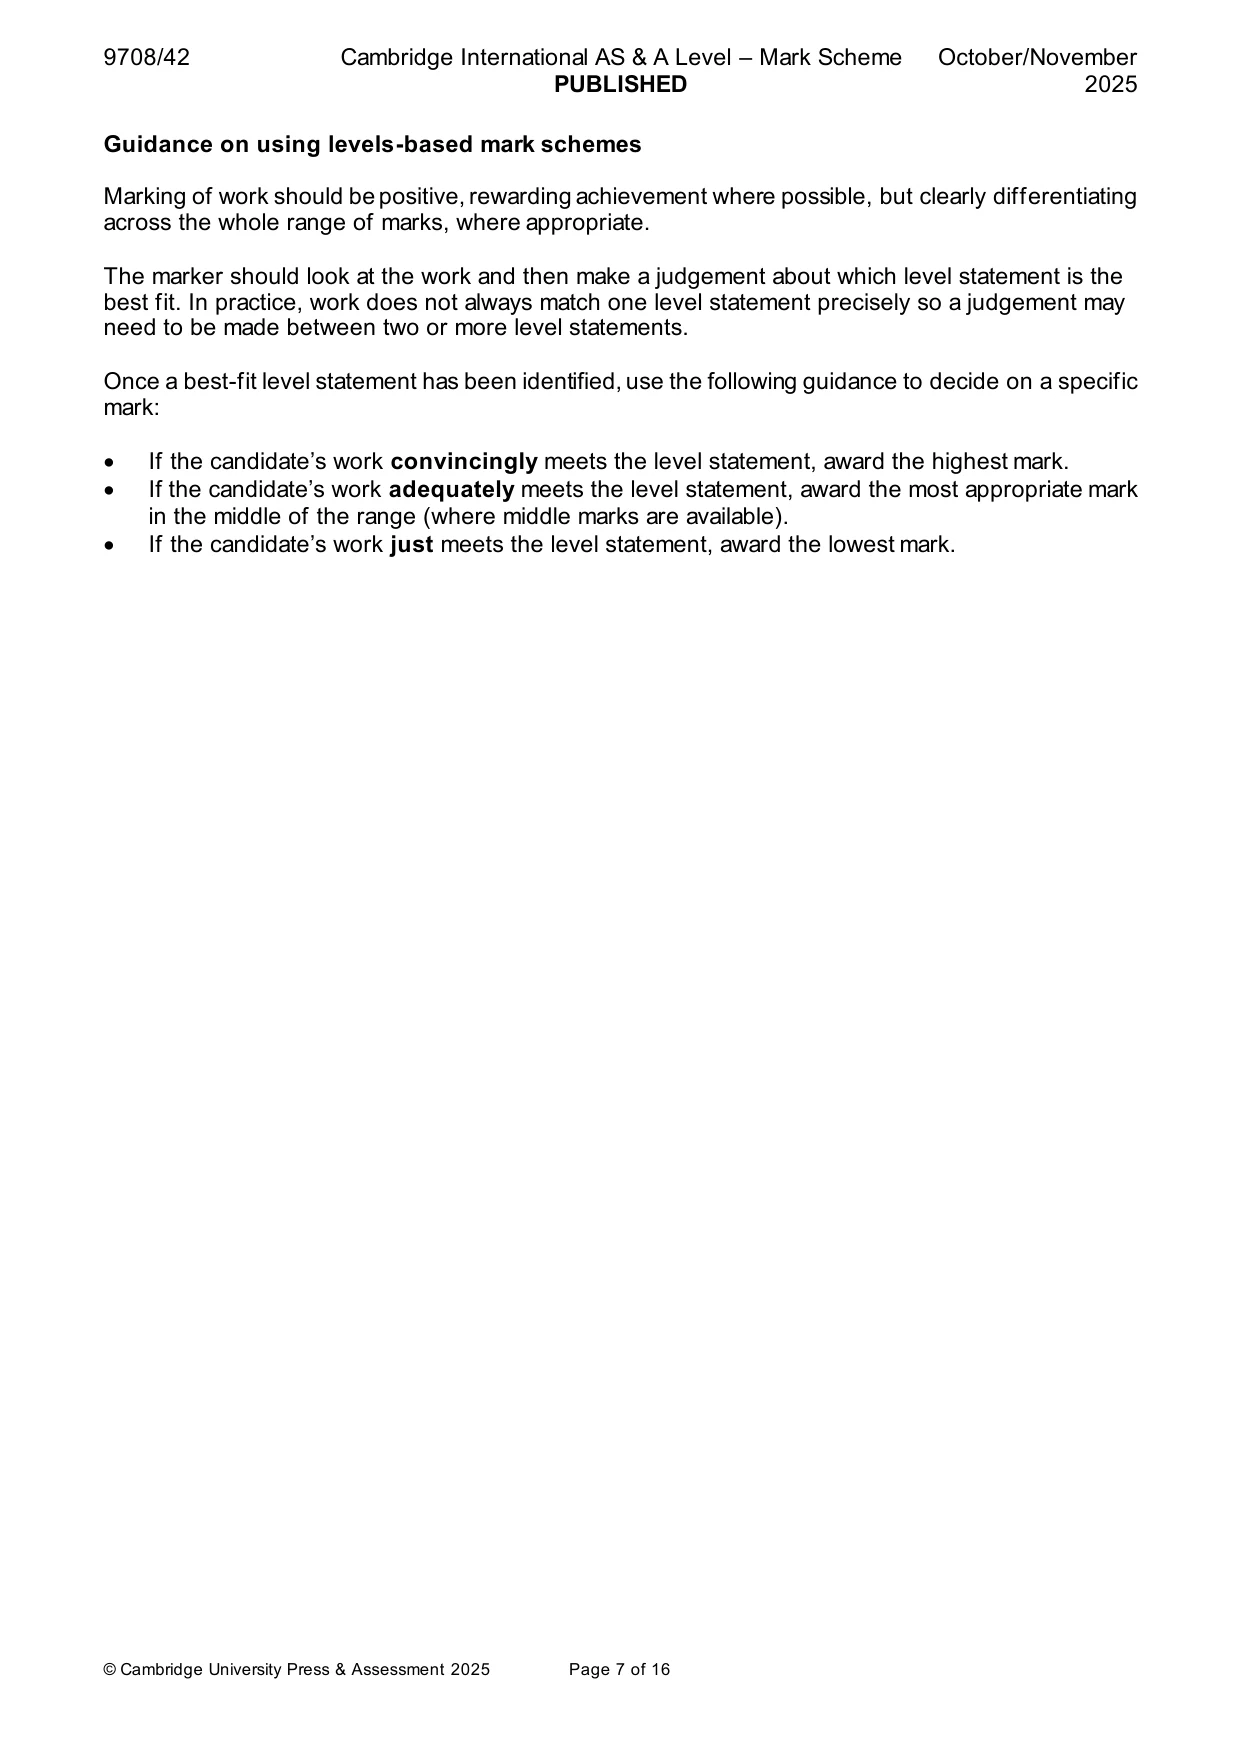
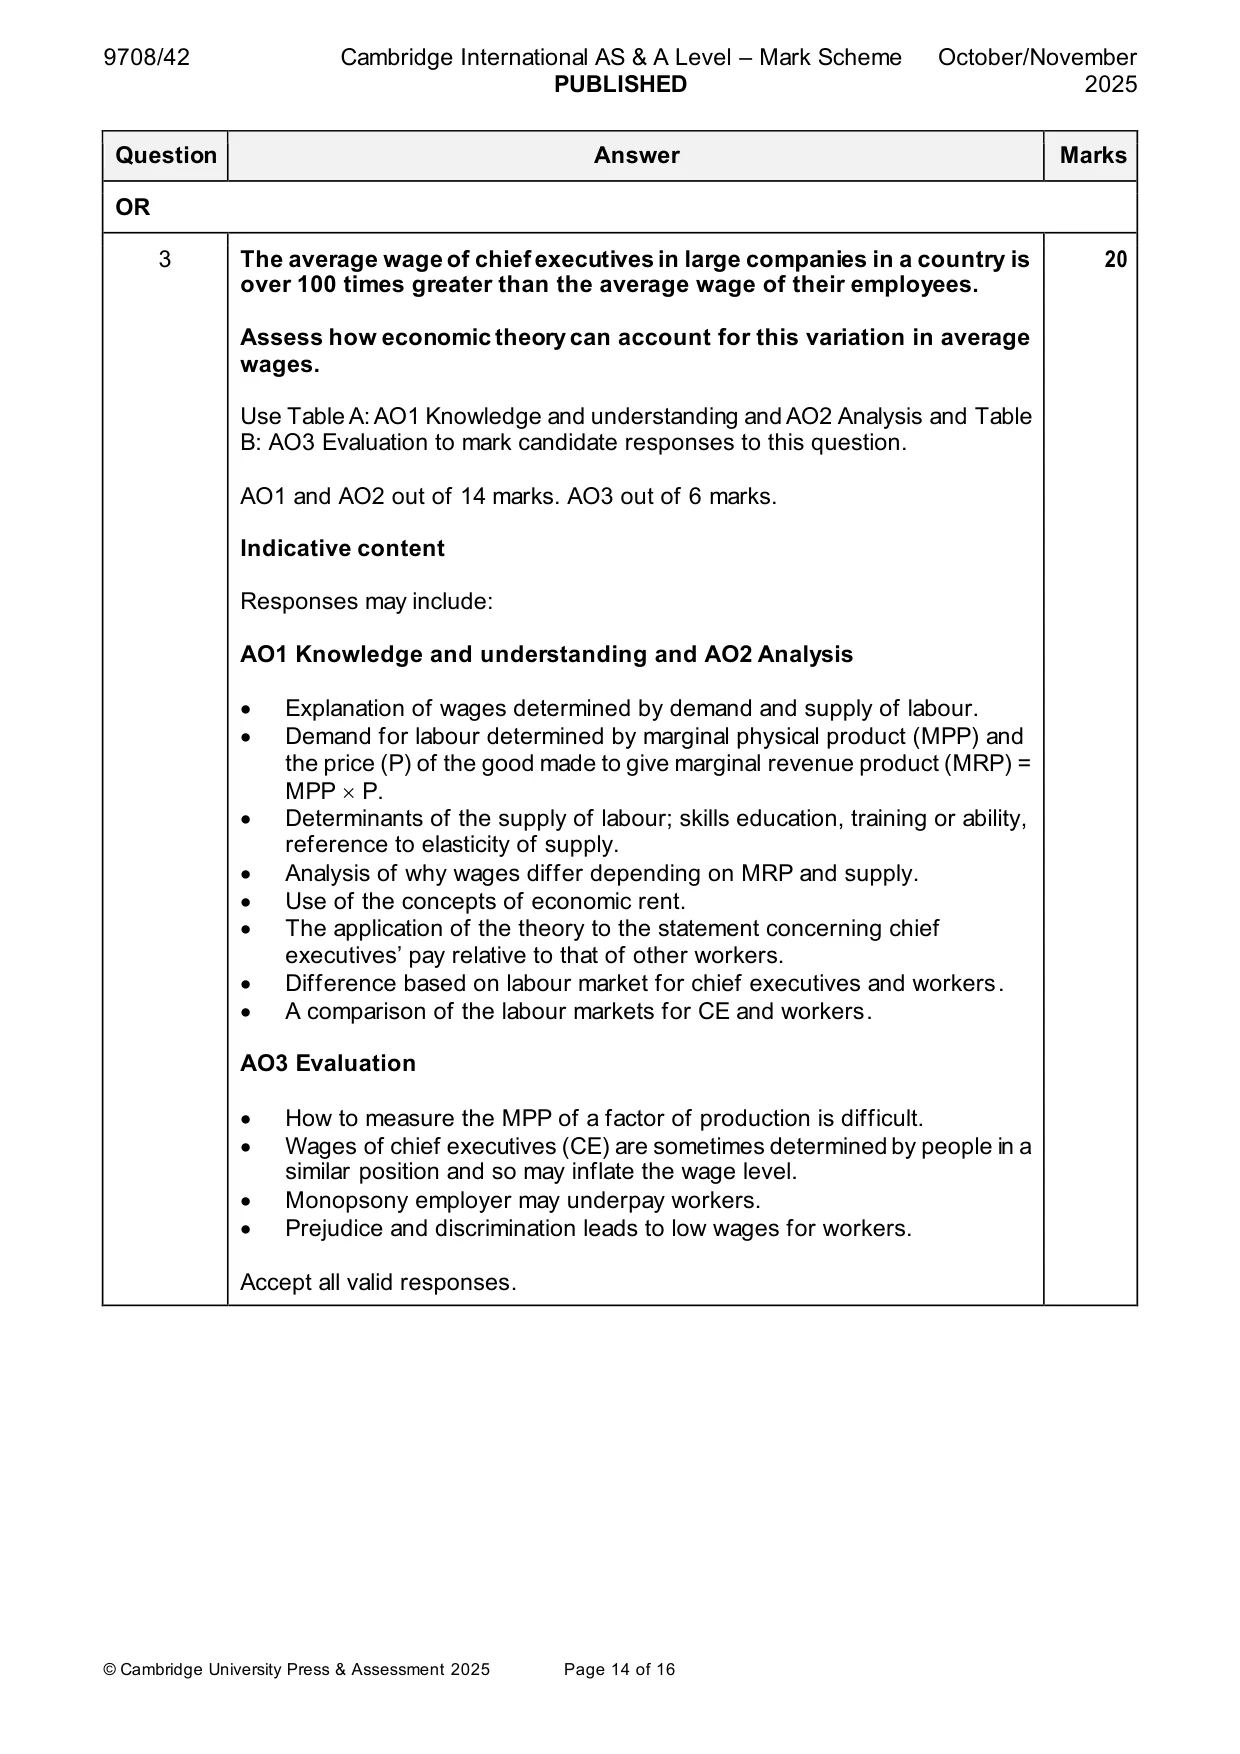
Mark scheme: 3 The average wage of chief executives in large companies in a country is 20 over 100 times greater than the average wage of their employees. Assess how economic theory can account for this variation in average wages. Use Table A: AO1 Knowledge and understanding and AO2 Analysis and Table B: AO3 Evaluation to mark candidate responses to this question. AO1 and AO2 out of 14 marks. AO3 out of 6 marks. Indicative content Responses may include: AO1 Knowledge and understanding and AO2 Analysis • Explanation of wages determined by demand and supply of labour. • Demand for labour determined by marginal physical product (MPP) and the price (P) of the good made to give marginal revenue product (MRP) = MPP P. • Determinants of the supply of labour; skills education, training or ability, reference to elasticity of supply. • Analysis of why wages differ depending on MRP and supply. • Use of the concepts of economic rent. • The application of the theory to the statement concerning chief executives’ pay relative to that of other workers. • Difference based on labour market for chief executives and workers. • A comparison of the labour markets for CE and workers. AO3 Evaluation • How to measure the MPP of a factor of production is difficult. • Wages of chief executives (CE) are sometimes determined by people in a similar position and so may inflate the wage level. • Monopsony employer may underpay workers. • Prejudice and discrimination leads to low wages for workers. Accept all valid responses.
More questions on Labour market forces and government intervention
Q4 · Evaluate the effect of a fall in the exchange rate on the achievement of the…
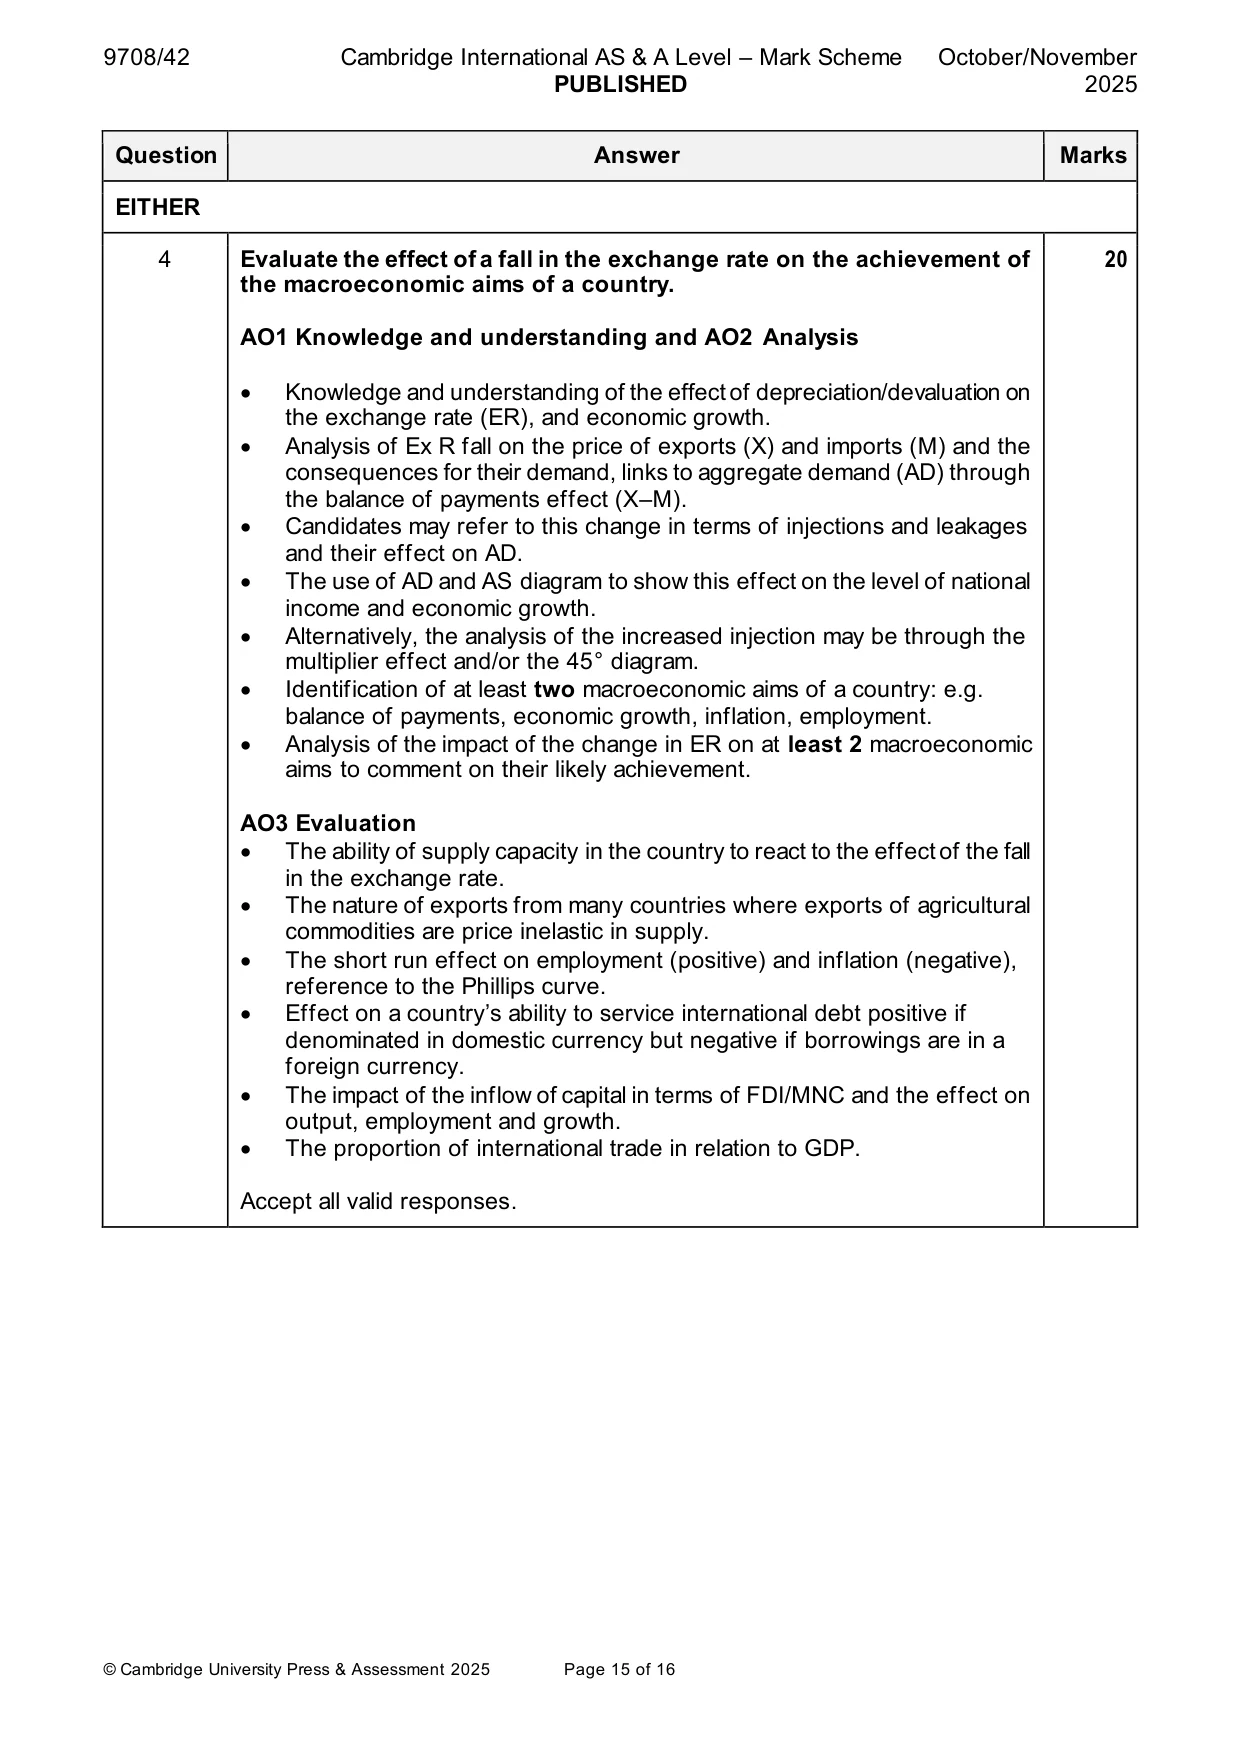
4 Evaluate the effect of a fall in the exchange rate on the achievement of the macroeconomic aims of a country. [20] OR
Mark scheme: 4 Evaluate the effect of a fall in the exchange rate on the achievement of 20 the macroeconomic aims of a country. AO1 Knowledge and understanding and AO2 Analysis • Knowledge and understanding of the effect of depreciation/devaluation on the exchange rate (ER), and economic growth. • Analysis of Ex R fall on the price of exports (X) and imports (M) and the consequences for their demand, links to aggregate demand (AD) through the balance of payments effect (X–M). • Candidates may refer to this change in terms of injections and leakages and their effect on AD. • The use of AD and AS diagram to show this effect on the level of national income and economic growth. • Alternatively, the analysis of the increased injection may be through the multiplier effect and/or the 45° diagram. • Identification of at least two macroeconomic aims of a country: e.g. balance of payments, economic growth, inflation, employment. • Analysis of the impact of the change in ER on at least 2 macroeconomic aims to comment on their likely achievement. AO3 Evaluation • The ability of supply capacity in the country to react to the effect of the fall in the exchange rate. • The nature of exports from many countries where exports of agricultural commodities are price inelastic in supply. • The short run effect on employment (positive) and inflation (negative), reference to the Phillips curve. • Effect on a country’s ability to service international debt positive if denominated in domestic currency but negative if borrowings are in a foreign currency. • The impact of the inflow of capital in terms of FDI/MNC and the effect on output, employment and growth. • The proportion of international trade in relation to GDP. Accept all valid responses.
Q5 · Evaluate whether the presence of multinational companies (MNCs) in low-income countries…
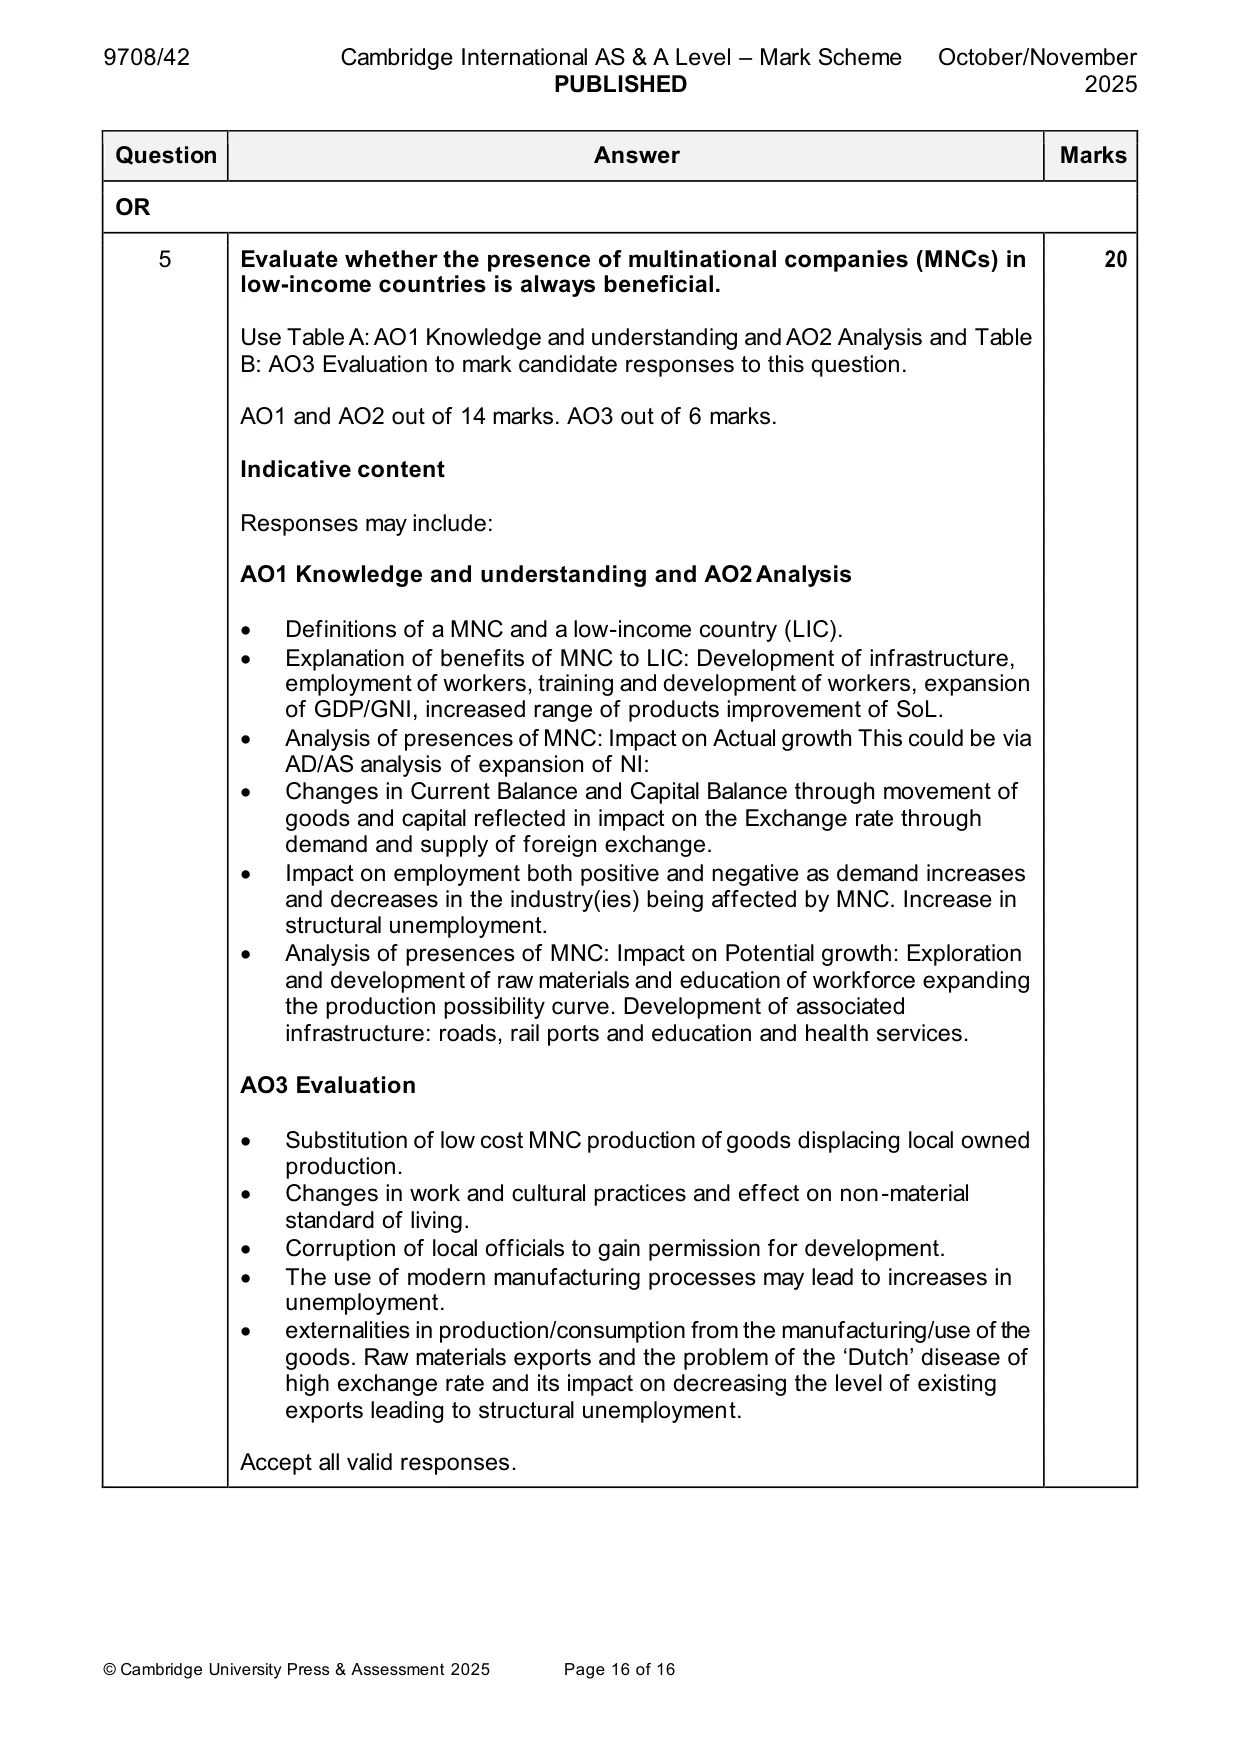
5 Evaluate whether the presence of multinational companies (MNCs) in low-income countries is always beneficial. [20]
Mark scheme: 5 Evaluate whether the presence of multinational companies (MNCs) in 20 low-income countries is always beneficial. Use Table A: AO1 Knowledge and understanding and AO2 Analysis and Table B: AO3 Evaluation to mark candidate responses to this question. AO1 and AO2 out of 14 marks. AO3 out of 6 marks. Indicative content Responses may include: AO1 Knowledge and understanding and AO2 Analysis • Definitions of a MNC and a low-income country (LIC). • Explanation of benefits of MNC to LIC: Development of infrastructure, employment of workers, training and development of workers, expansion of GDP/GNI, increased range of products improvement of SoL. • Analysis of presences of MNC: Impact on Actual growth This could be via AD/AS analysis of expansion of NI: • Changes in Current Balance and Capital Balance through movement of goods and capital reflected in impact on the Exchange rate through demand and supply of foreign exchange. • Impact on employment both positive and negative as demand increases and decreases in the industry(ies) being affected by MNC. Increase in structural unemployment. • Analysis of presences of MNC: Impact on Potential growth: Exploration and development of raw materials and education of workforce expanding the production possibility curve. Development of associated infrastructure: roads, rail ports and education and health services. AO3 Evaluation • Substitution of low cost MNC production of goods displacing local owned production. • Changes in work and cultural practices and effect on non-material standard of living. • Corruption of local officials to gain permission for development. • The use of modern manufacturing processes may lead to increases in unemployment. • externalities in production/consumption from the manufacturing/use of the goods. Raw materials exports and the problem of the ‘Dutch’ disease of high exchange rate and its impact on decreasing the level of existing exports leading to structural unemployment. Accept all valid responses.
What was in this paper
The subtopics covered by these 5 questions, and how many questions each got. Open one in a new tab to see every Cambridge question on it.
What you needed in this session
Cambridge’s own grade thresholds for 2025 Oct/Nov, Paper 4 · Variant 2. A higher threshold means an easier paper — the bar moves with how the cohort did.