Cambridge A Level Economics 9708 — 2024 Oct/Nov Paper 4 · Variant 2
9708/42/O/N/24 · 5 questions · 60 marks · ≈68 min
The question paper and its mark scheme, free to read here and free to download. This is Cambridge’s own paper, exactly as it was sat.
Question paper4 pages


Mark scheme16 pages
Answers below. Sit the paper first if you are practising.












Questions as text
Q1 · Reduced Migration to the United States (US) The factors of production land, labour…
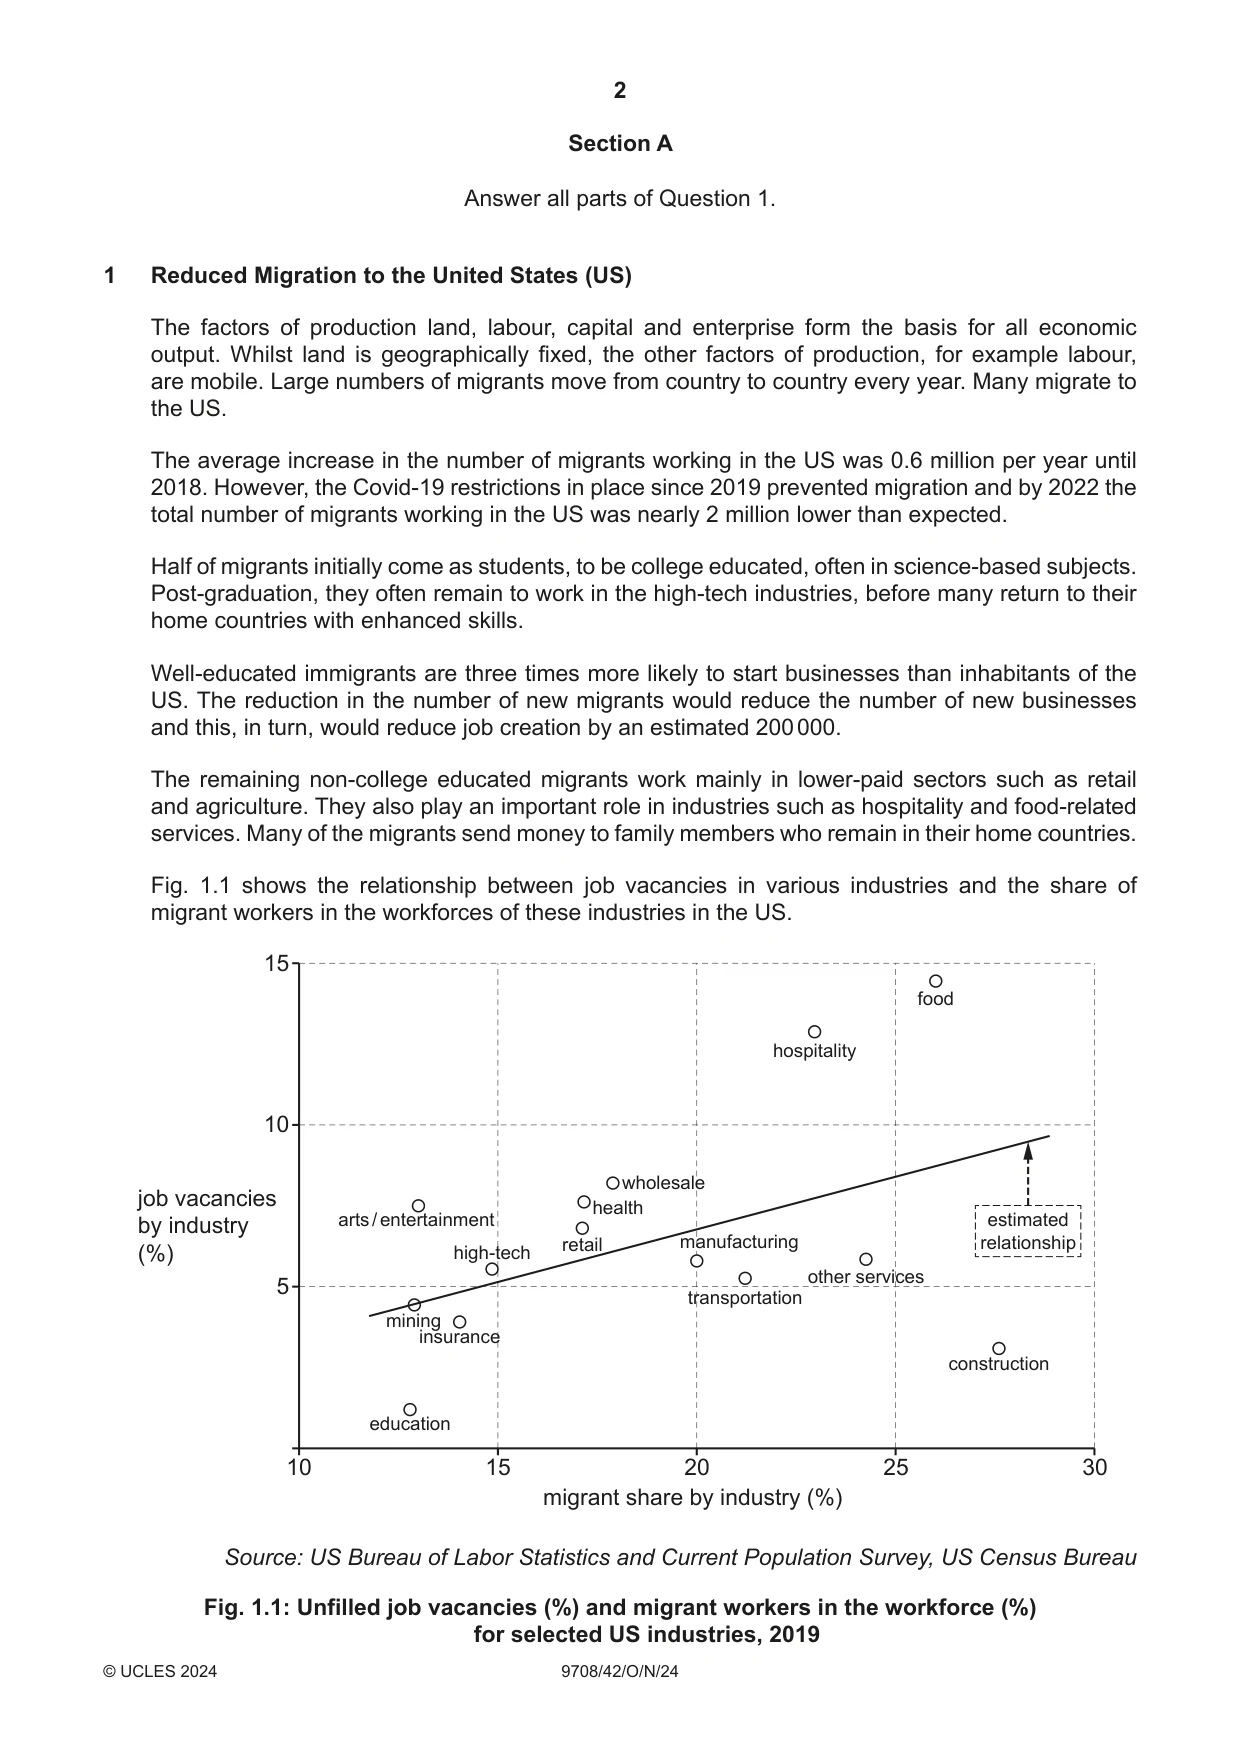
1 Reduced Migration to the United States (US) The factors of production land, labour, capital and enterprise form the basis for all economic output. Whilst land is geographically fixed, the other factors of production, for example labour, are mobile. Large numbers of migrants move from country to country every year. Many migrate to the US. The average increase in the number of migrants working in the US was 0.6 million per year until 2018. However, the Covid-19 restrictions in place since 2019 prevented migration and by 2022 the total number of migrants working in the US was nearly 2 million lower than expected. Half of migrants initially come as students, to be college educated, often in science-based subjects. Post-graduation, they often remain to work in the high-tech industries, before many return to their home countries with enhanced skills. Well-educated immigrants are three times more likely to start businesses than inhabitants of the US. The reduction in the number of new migrants would reduce the number of new businesses and this, in turn, would reduce job creation by an estimated 200 000. The remaining non-college educated migrants work mainly in lower-paid sectors such as retail and agriculture. They also play an important role in industries such as hospitality and food-related services. Many of the migrants send money to family members who remain in their home countries. Fig. 1.1 shows the relationship between job vacancies in various industries and the share of migrant workers in the workforces of these industries in the US. 15 food hospitality 10 wholesale job vacancies health by industry arts / entertainment estimated retail manufacturing relationship (%) high-tech other services 5 transportation mining insurance construction education 10 15 20 25 30 migrant share by industry (%) Source: US Bureau of Labor Statistics and Current Population Survey, US Census Bureau Fig. 1.1: Unfilled job vacancies (%) and migrant workers in the workforce (%) for selected US industries, 2019 The reduction in migrants took place at the same time as more older US workers retired. Mexicans and Central Americans form the largest share of migrants, at over 35% of the total. Average incomes in their home countries are between 10% and 20% of the US average. There is also significant unemployment and under-employment in their home countries. In the US, migrants earn on average 12% less than the average wage for all workers. This varies by ethnic origin: Hispanic workers earn 16% less than the average while white workers earn 15% more than average. Sources: G Peri and R Zaiour, University of California, Davis. The EconoFact Network, Statista.com N Ward and J Batalova, Migration Policy Institute, 14 March 2023 (a) Identify the relationship between the variables shown in Fig. 1.1 and suggest one possible reason for the relationship. [2] (b) With the help of a production possibility curve (PPC) diagram, explain both the likely effect of the prevention of migration to the US from 2019 and the retirement of older US workers on the US’s productive potential. [4] (c) Using the information and labour market theory, analyse why the wages received by migrant workers in the high-tech industries are likely to be higher than the wages received by migrant workers in the hospitality industry. [6] (d) Evaluate the likely impact of a return to the migration levels prior to 2019 on the macroeconomic performance of the US economy. [8]
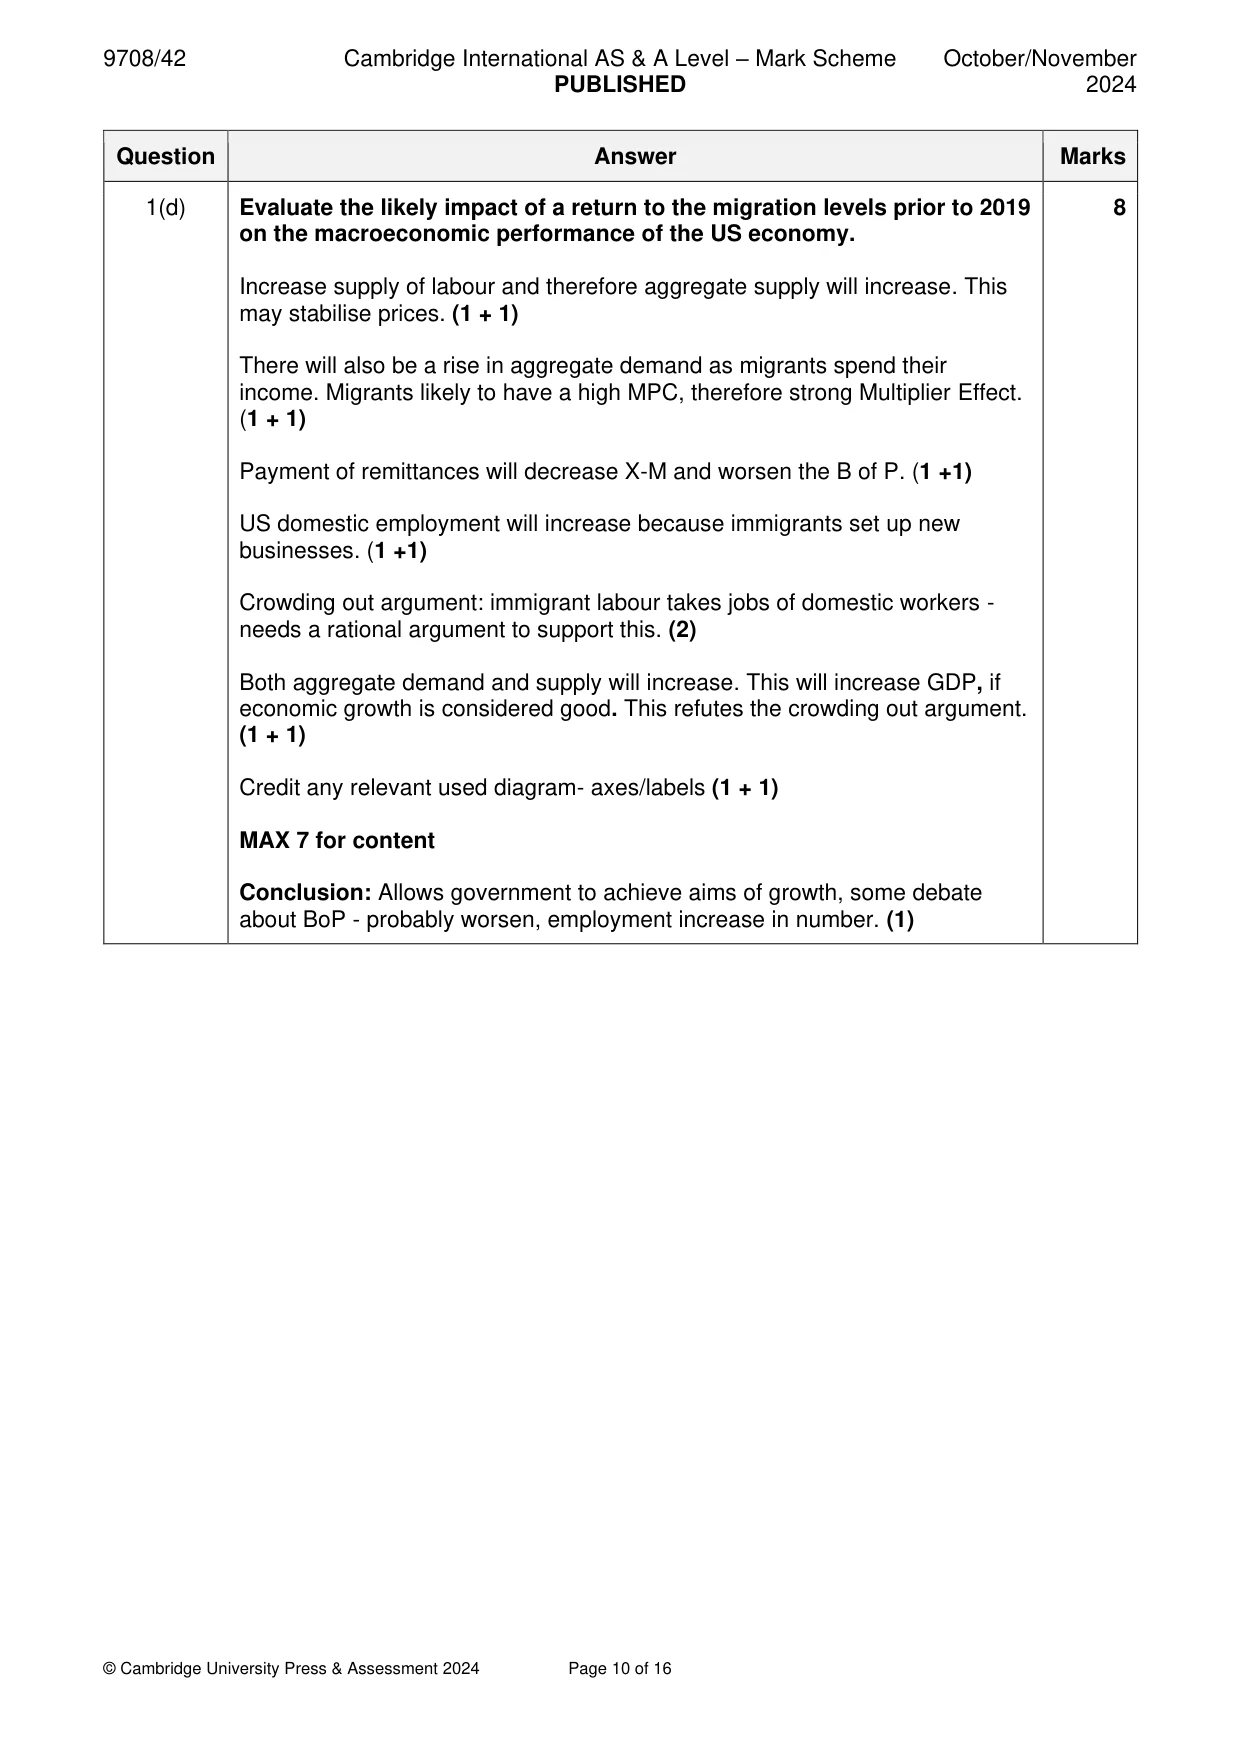
Mark scheme: Question Answer Marks 1(a) Identify the relationship between the variables shown in Fig. 1.1 and 2 suggest one possible reason for the relationship. As the rate of unfilled jobs increases the foreign-born share of employment increases. (1) They are directly proportional. (1) This suggests that the US uses immigrants to fill labour shortages. (1) Immigrants will be drawn to those occupations where there are most vacancies. (1) Some jobs with the high foreign-born share rate and high unfilled job rate may be regarded as ‘starter’ jobs (1) which are taken initially whilst looking for something better. (1) 1(b) With the help of a production possibility curve (PPC) diagram, explain 4 both the likely effect of the prevention of migration to the US from 2019 and the retirement of older US workers on the US’s productive potential. Good Y PPC PPC1 Good X Axes/labels (1) Shift in PPC from PPC to PPC1 (1) The prevention of migration will mean the PPC will not change (1) The retirement of older US workers will shift the PPC to the left (inwards) (1) 1(c) Using the information and labour market theory, analyse why the wages 6 received by migrant workers in the high-tech industries are likely to be higher than the wages received by migrant workers in the hospitality industry. Demand: Theory suggests that the MPP of the educated will be higher than unskilled/less educated. (1) The value of the output of the educated will be greater than the less educated (1) and demand will be higher resulting in higher wages (1). Some college educated become entrepreneurs in high-tech industries and gain the benefits of profits which can be very high. (1) There may be prejudice against less educated workers which is reflected in their pay. (1) Supply: The increase in immigrants has fallen and this may cause the wage gap for the low paid to narrow (1) and for the educated to widen. (1) Other candidates may analyse the problem in terms of elasticity of supply Unskilled, high wage elasticity of supply (1) and Skilled, low elasticity of supply (1) If a diagram is used award axes and all labels (1) relevant S&D (1) Missing data if the immigrants are concentrated in particular areas this could lead to an ‘over-supply’ which will reduce the pay of the less educated. (1) 1(d) Evaluate the likely impact of a return to the migration levels prior to 2019 8 on the macroeconomic performance of the US economy. Increase supply of labour and therefore aggregate supply will increase. This may stabilise prices. (1 + 1) There will also be a rise in aggregate demand as migrants spend their income. Migrants likely to have a high MPC, therefore strong Multiplier Effect. (1 + 1) Payment of remittances will decrease X-M and worsen the B of P. (1 +1) US domestic employment will increase because immigrants set up new businesses. (1 +1) Crowding out argument: immigrant labour takes jobs of domestic workers - needs a rational argument to support this. (2) Both aggregate demand and supply will increase. This will increase GDP, if economic growth is considered good. This refutes the crowding out argument. (1 + 1) Credit any relevant used diagram- axes/labels (1 + 1) MAX 7 for content Conclusion: Allows government to achieve aims of growth, some debate about BoP - probably worsen, employment increase in number. (1)
More questions on Effectiveness of policy options to meet all macroeconomic objectives
Q2 · Evaluate whether marginal utility theory can fully explain the link between the changing…
2 Evaluate whether marginal utility theory can fully explain the link between the changing price of a good and quantity demanded of that good. [20] OR
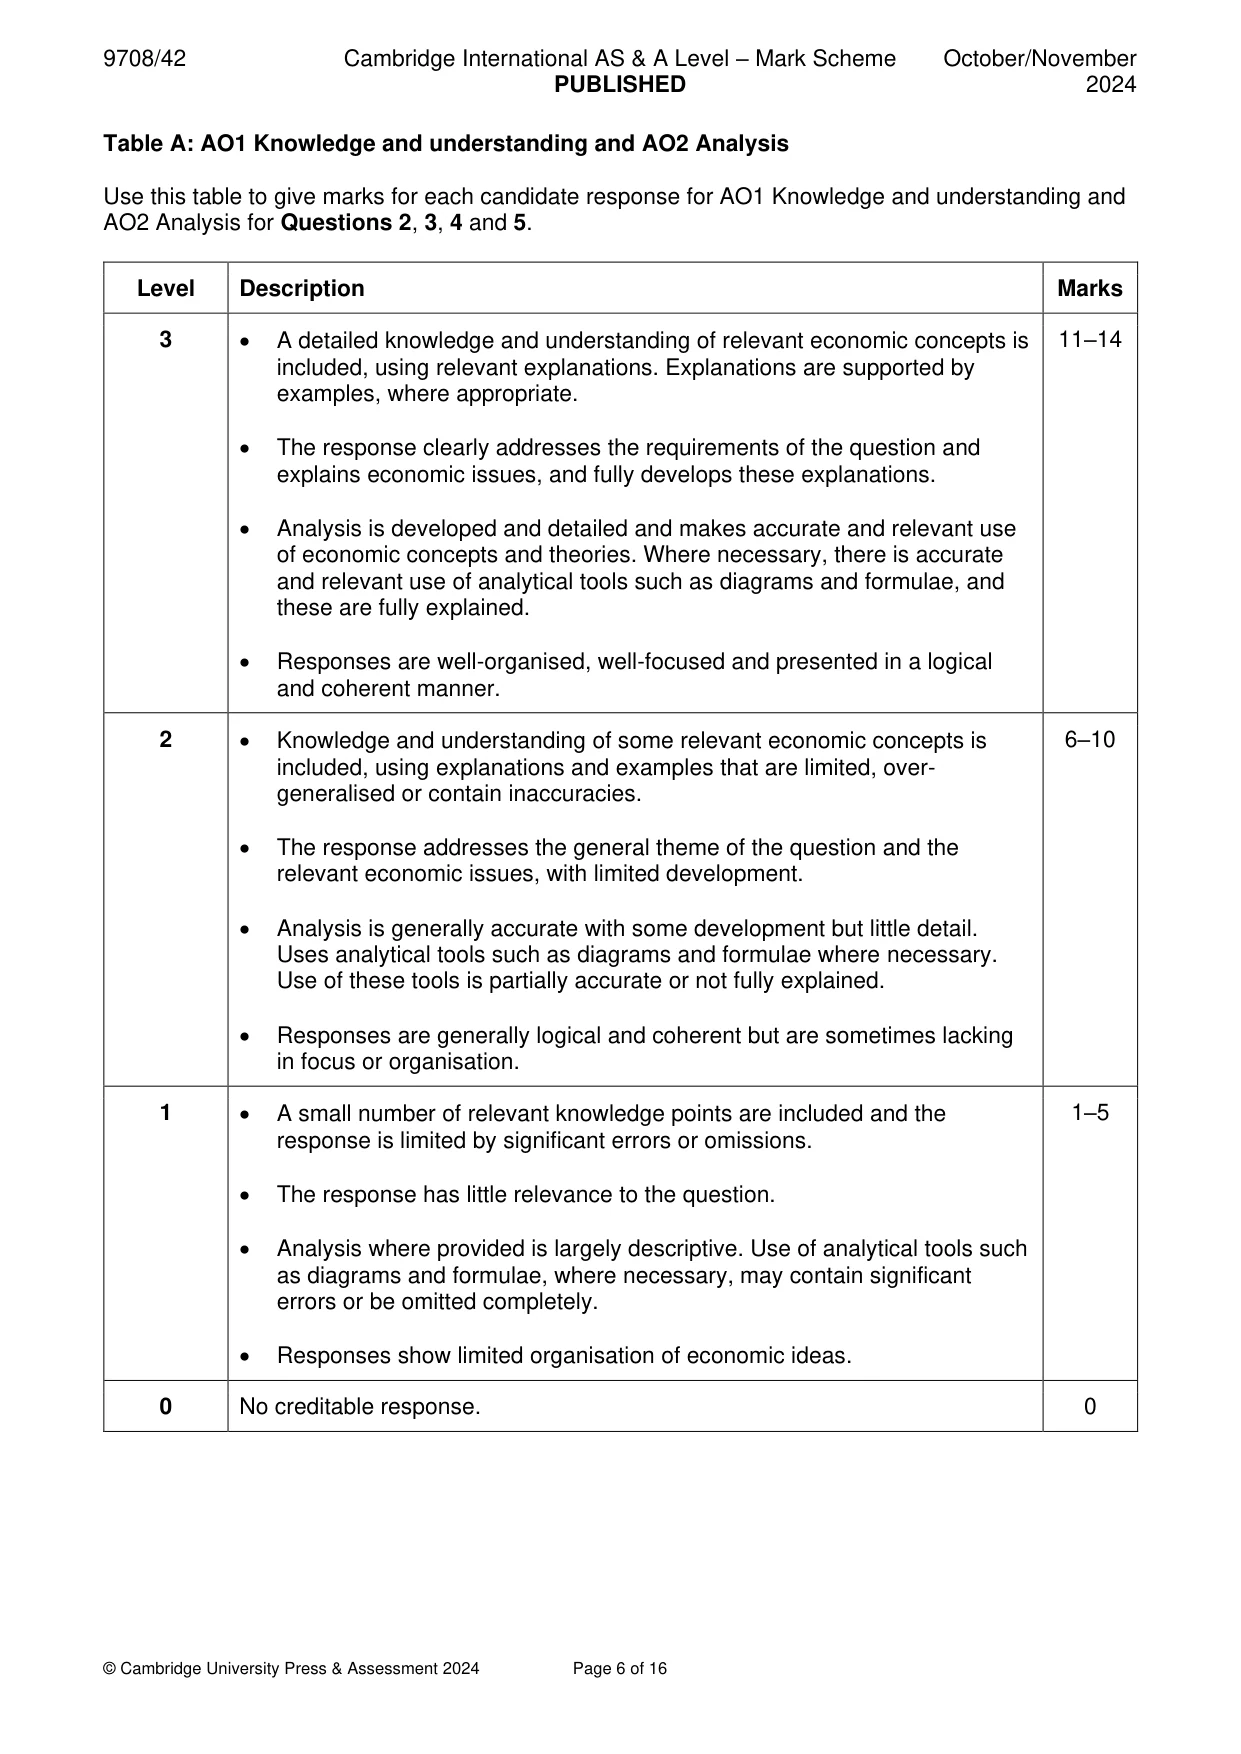
Mark scheme: 2 Evaluate whether marginal utility theory can fully explain the link 20 between the changing price of a good and quantity demanded of that good. Use Table A: AO1 Knowledge and understanding and AO2 Analysis and Table B: AO3 Evaluation to mark candidate responses to this question. AO1 and AO2 out of 14 marks. AO3 out of 6 marks. Indicative content Responses may include: AO1 Knowledge and understanding and AO2 Analysis • Definitions of marginal and total utility. • Explanation of total utility and diminishing marginal utility. • Analysis of the effect of a change in price through the equi-marginal principle and illustration of the effect with a diagram. • Diagram of the falling demand curve v price, which can apply to both normal and inferior (non-Giffen) goods but the theory does not distinguish between them. AO3 Evaluation • Discussion of the validity of the rational consumer. Imperfect information, bounded rationality, impact of advertising. • Unable to distinguish between the income and substitution effects and therefore does not account for Giffen goods. • The difficulty of the ceteris paribus assumption that other things do not change when in practice they do. Each change would require a re- estimation of the demand schedule. • The assumption that money has constant utility. Is the last dollar of someone earning $10 000 the same value as someone earning $100 000. • Difficulty of MU theory accounting for the purchase of a one-off good e.g. a house. Accept all valid responses.
Q3 · Privatisation is often required by the International Monetary Fund (IMF) and the World…
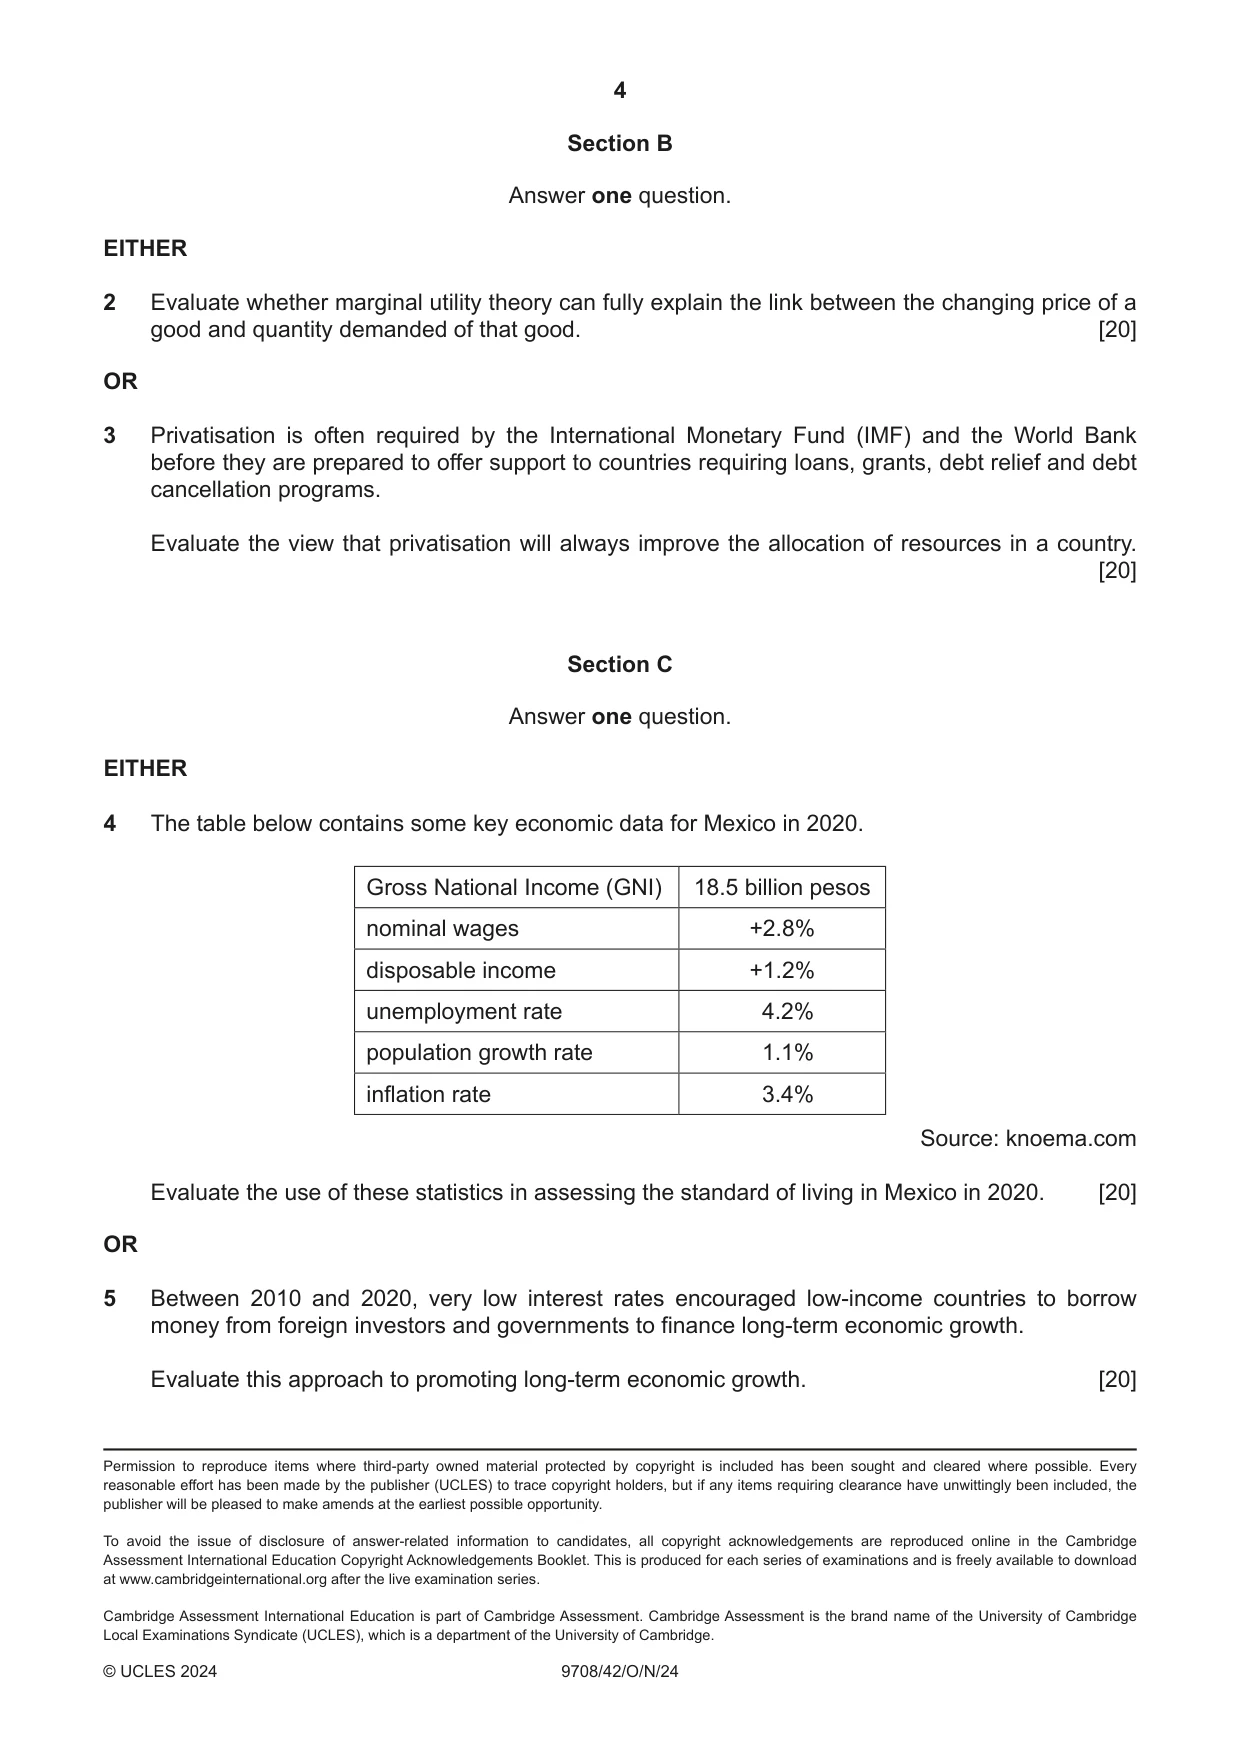
3 Privatisation is often required by the International Monetary Fund (IMF) and the World Bank before they are prepared to offer support to countries requiring loans, grants, debt relief and debt cancellation programs. Evaluate the view that privatisation will always improve the allocation of resources in a country. [20] Section C Answer one question. EITHER
Mark scheme: 3 Privatisation is often required by the International Monetary Fund (IMF) 20 and the World Bank before they are prepared to offer support to countries requiring loans, grants, debt relief and debt cancellation programs. Evaluate the view that privatisation will always improve the allocation of resources in a country. Use Table A: AO1 Knowledge and understanding and AO2 Analysis and Table B: AO3 Evaluation to mark candidate responses to this question. AO1 and AO2 out of 14 marks. AO3 out of 6 marks. Indicative content Responses may include: AO1 Knowledge and understanding and AO2 Analysis • Definition/explanation of privatisation: the selling of state-owned corporations (the meaning of the term can include the provision of services and goods by private firms). • Explanation of productive/allocative efficiency. X-inefficiency. • A model of monopolistic competition/oligopoly/monopoly is used to analyse the effects on efficiency of shifting to privatised economy • Definition/explanation of a market economy. • Development of benefits of privatisation: – Greater competition in the market if an industry is privatised as competing firms. – Greater scrutiny of operation by shareholders should hold the company to account and increase efficiency. – Wider access to funds - not dependent on a government’s wider economic concerns. • Analysis may be in terms of comparing the monopoly model with one which is more competitive e.g. monopolistic competition or oligopoly and drawing the relevant inferences. • Relevant diagrams correctly drawn and labelled with accurate reference to them in the text. • Reduction in the need for the government to finance the activity and the implications for fiscal policy. • A further source of funds for the government that can be used to repay government debt and reduce the burden of interest payments. The funds can be devoted to education/health services improving economic development. • The cost of a loss-making state industry is no longer borne by the general tax-payer. 3 AO3 Evaluation • Evaluation against productive, allocative and/or dynamic efficiency. • Privatisation may lead to the break-up of a natural monopoly e.g. railways/water pipelines. The problem of the ‘final mile delivery’. • A state monopoly may simply be replaced with a private monopoly. Competition may be unrealistic due to high barriers to entry (BTE). • Many privatisations are accompanied by an industry regulator which suggests that the privatisation needs policing. The amount and direction of investment, and the pricing strategy are reviewed to maintain the industry’s efficiency. • Equity the transfer of profitable state-owned assets to private individuals means the contribution they might make to the state funds are lost. • Often there is a loss of employment in the industry and the burden of unemployment pay falls on the government raising the fiscal deficit or requiring more borrowing. • Private firms are only concerned with private costs and benefits, they ignore negative externalities and their consequences. Accept all valid responses.
Q4 · The table below contains some key economic data for Mexico in 2020
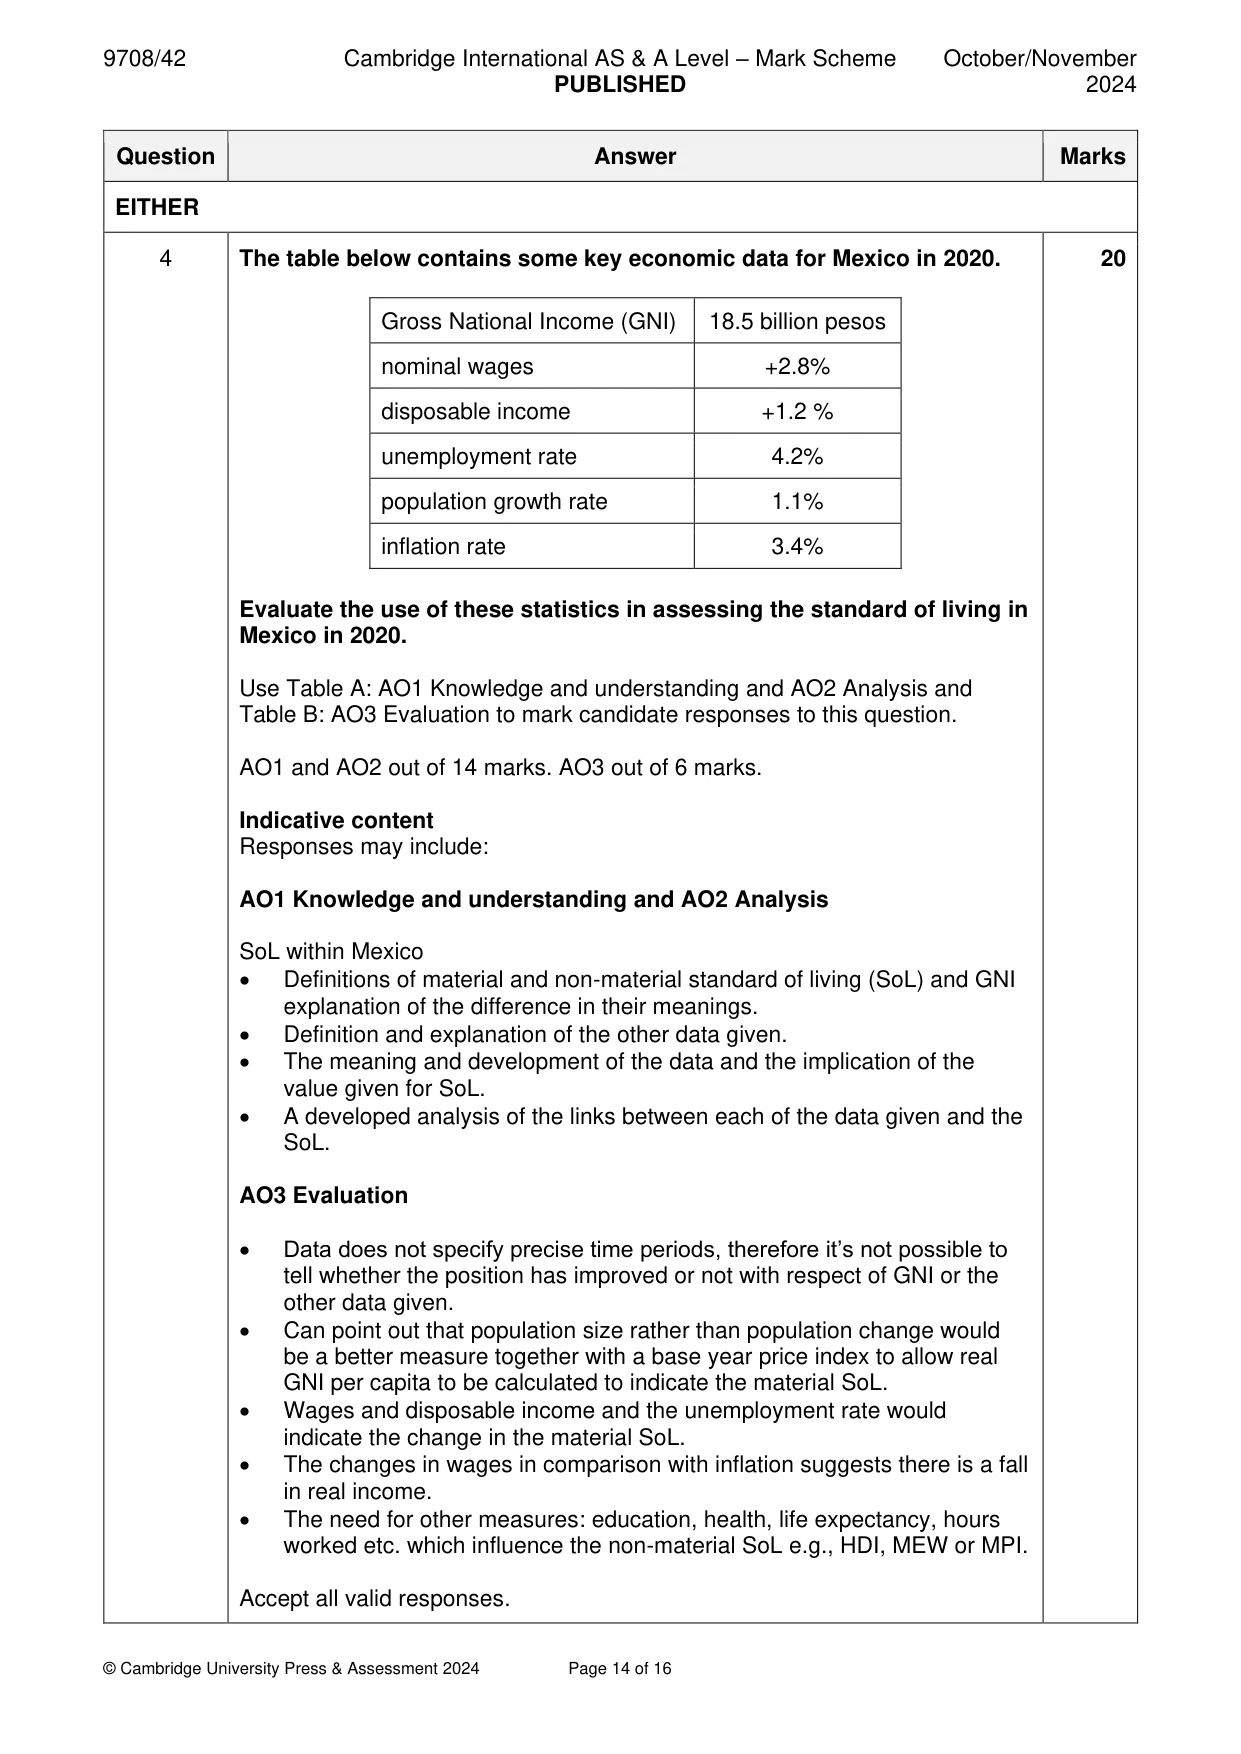
4 The table below contains some key economic data for Mexico in 2020. Gross National Income (GNI) 18.5 billion pesos nominal wages +2.8% disposable income +1.2% unemployment rate 4.2% population growth rate 1.1% inflation rate 3.4% Source: knoema.com Evaluate the use of these statistics in assessing the standard of living in Mexico in 2020. [20] OR
Mark scheme: 4 The table below contains some key economic data for Mexico in 2020. 20 Gross National Income (GNI) 18.5 billion pesos nominal wages +2.8% disposable income +1.2 % unemployment rate 4.2% population growth rate 1.1% inflation rate 3.4% Evaluate the use of these statistics in assessing the standard of living in Mexico in 2020. Use Table A: AO1 Knowledge and understanding and AO2 Analysis and Table B: AO3 Evaluation to mark candidate responses to this question. AO1 and AO2 out of 14 marks. AO3 out of 6 marks. Indicative content Responses may include: AO1 Knowledge and understanding and AO2 Analysis SoL within Mexico • Definitions of material and non-material standard of living (SoL) and GNI explanation of the difference in their meanings. • Definition and explanation of the other data given. • The meaning and development of the data and the implication of the value given for SoL. • A developed analysis of the links between each of the data given and the SoL. AO3 Evaluation • Data does not specify precise time periods, therefore it’s not possible to tell whether the position has improved or not with respect of GNI or the other data given. • Can point out that population size rather than population change would be a better measure together with a base year price index to allow real GNI per capita to be calculated to indicate the material SoL. • Wages and disposable income and the unemployment rate would indicate the change in the material SoL. • The changes in wages in comparison with inflation suggests there is a fall in real income. • The need for other measures: education, health, life expectancy, hours worked etc. which influence the non-material SoL e.g., HDI, MEW or MPI. Accept all valid responses.
Q5 · Between 2010 and 2020, very low interest rates encouraged low-income countries to borrow…
5 Between 2010 and 2020, very low interest rates encouraged low-income countries to borrow money from foreign investors and governments to finance long-term economic growth. Evaluate this approach to promoting long-term economic growth. [20]
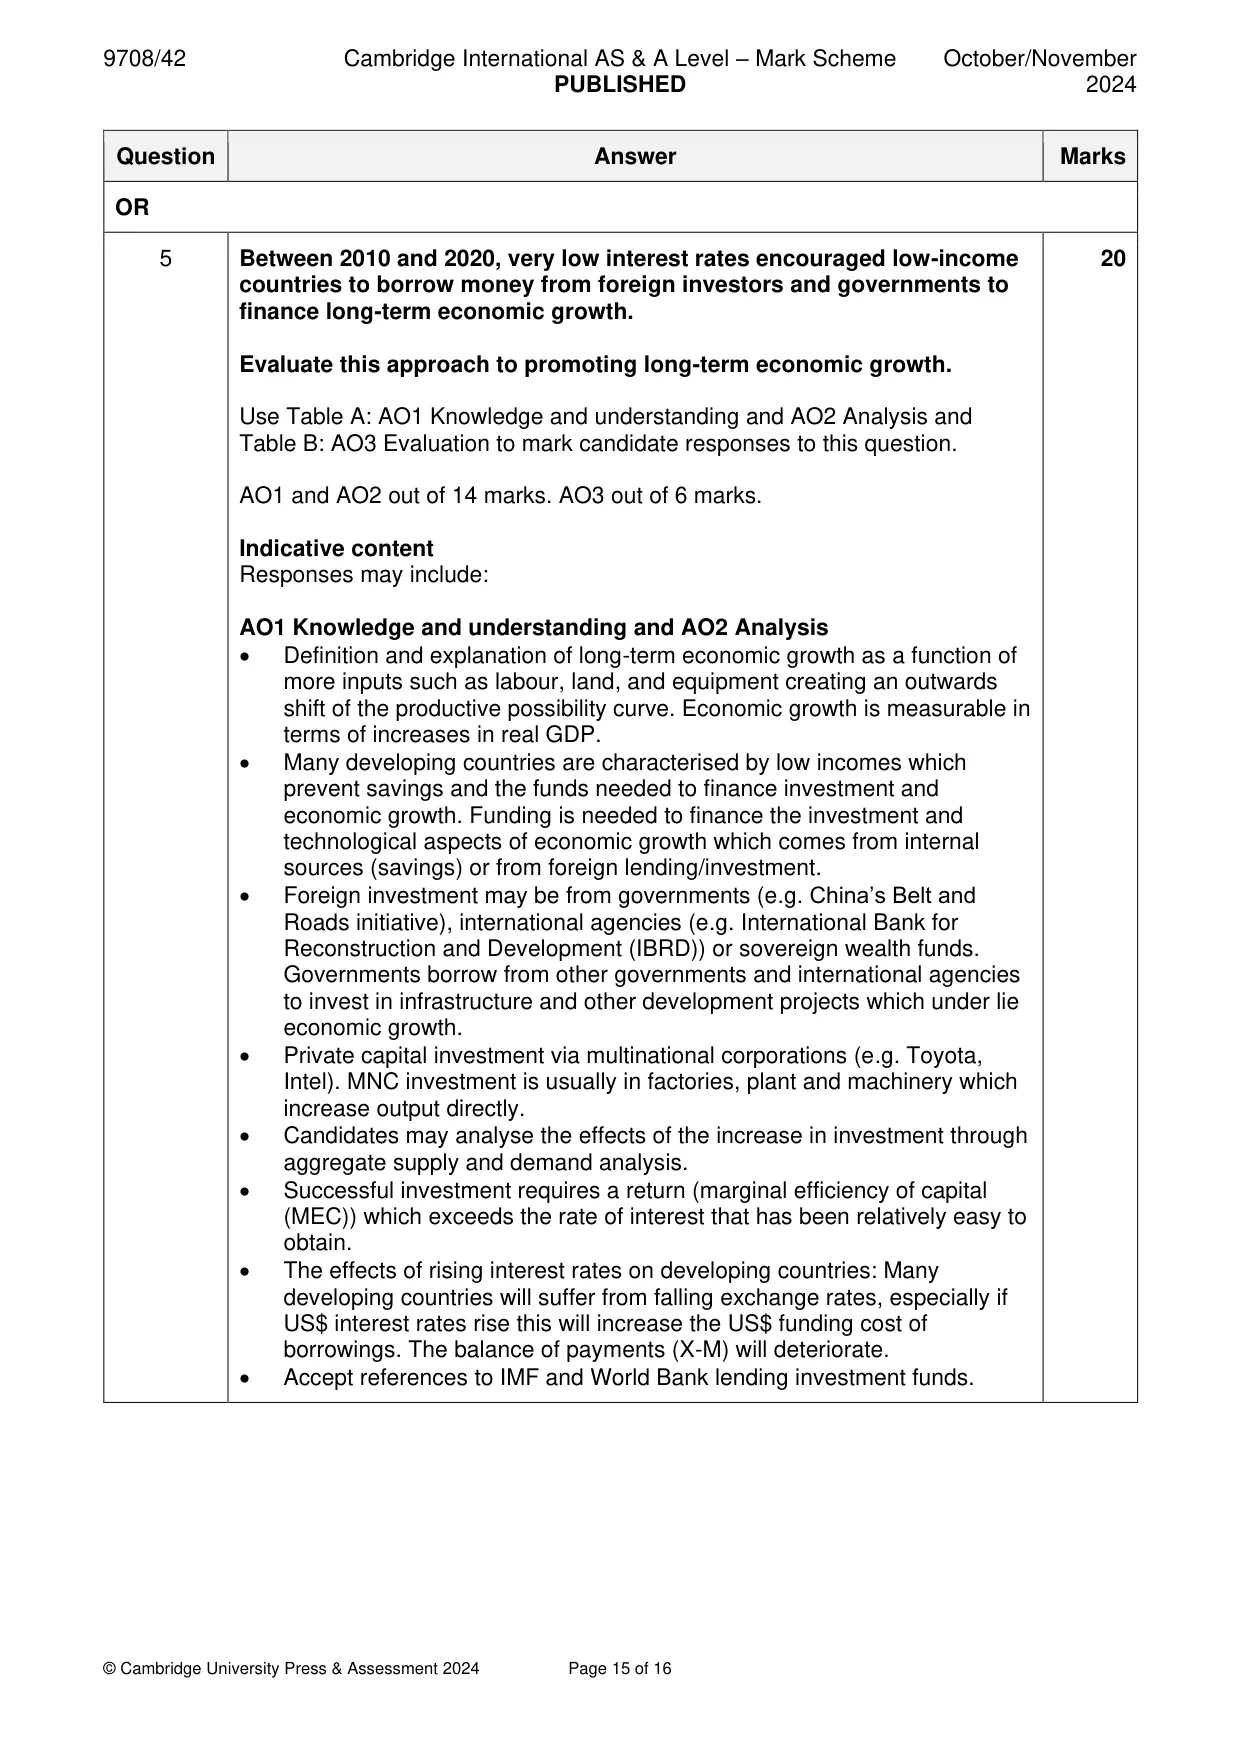
Mark scheme: 5 Between 2010 and 2020, very low interest rates encouraged low-income 20 countries to borrow money from foreign investors and governments to finance long-term economic growth. Evaluate this approach to promoting long-term economic growth. Use Table A: AO1 Knowledge and understanding and AO2 Analysis and Table B: AO3 Evaluation to mark candidate responses to this question. AO1 and AO2 out of 14 marks. AO3 out of 6 marks. Indicative content Responses may include: AO1 Knowledge and understanding and AO2 Analysis • Definition and explanation of long-term economic growth as a function of more inputs such as labour, land, and equipment creating an outwards shift of the productive possibility curve. Economic growth is measurable in terms of increases in real GDP. • Many developing countries are characterised by low incomes which prevent savings and the funds needed to finance investment and economic growth. Funding is needed to finance the investment and technological aspects of economic growth which comes from internal sources (savings) or from foreign lending/investment. • Foreign investment may be from governments (e.g. China’s Belt and Roads initiative), international agencies (e.g. International Bank for Reconstruction and Development (IBRD)) or sovereign wealth funds. Governments borrow from other governments and international agencies to invest in infrastructure and other development projects which under lie economic growth. • Private capital investment via multinational corporations (e.g. Toyota, Intel). MNC investment is usually in factories, plant and machinery which increase output directly. • Candidates may analyse the effects of the increase in investment through aggregate supply and demand analysis. • Successful investment requires a return (marginal efficiency of capital (MEC)) which exceeds the rate of interest that has been relatively easy to obtain. • The effects of rising interest rates on developing countries: Many developing countries will suffer from falling exchange rates, especially if US$ interest rates rise this will increase the US$ funding cost of borrowings. The balance of payments (X-M) will deteriorate. • Accept references to IMF and World Bank lending investment funds. 5 AO3 Evaluation • Impact depends on the proportion of funding which comes from abroad and how much is locally sourced. If domestic funds are not available, then how else will the growth be funded. • The quality of the investment projects and the likelihood of realising a profit will affect the ability to cover the increase in interest rates. In some cases ‘vanity projects’ with little long-term economic benefit are funded (Roads to Nowhere) which enhance the standing of the government amongst its supporters but have no economic benefit. • The short-term effects of the project in terms of raising aggregate demand may be of limited benefit to the borrower if the lender requires much of the construction and materials to be sourced from them. This will have a negative effect on the current account of the balance of payments. • Higher interest rates in high income countries will raise the cost of borrowing by the low-income country. This means the cost of financing projects has risen representing an opportunity cost for borrowing. The balance of payments current account will deteriorate as the higher interest is paid. • Many low-income countries may be affected by a commodity price slump which reduces export earnings and depreciates a floating exchange rate making interest rate and capital repayment more expensive.
What was in this paper
The subtopics covered by these 5 questions, and how many questions each got. Open one in a new tab to see every Cambridge question on it.
What you needed in this session
Cambridge’s own grade thresholds for 2024 Oct/Nov, Paper 4 · Variant 2. A higher threshold means an easier paper — the bar moves with how the cohort did.