Cambridge A Level Economics 9708 — 2024 May/June Paper 4 · Variant 2
9708/42/M/J/24 · 4 questions · 60 marks · ≈68 min
The question paper and its mark scheme, free to read here and free to download. This is Cambridge’s own paper, exactly as it was sat.
Question paper4 pages

Mark scheme15 pages
Answers below. Sit the paper first if you are practising.


Questions as text
Q1 · Developments in the electric vehicle (EV) industry The advantage of the car is that it…
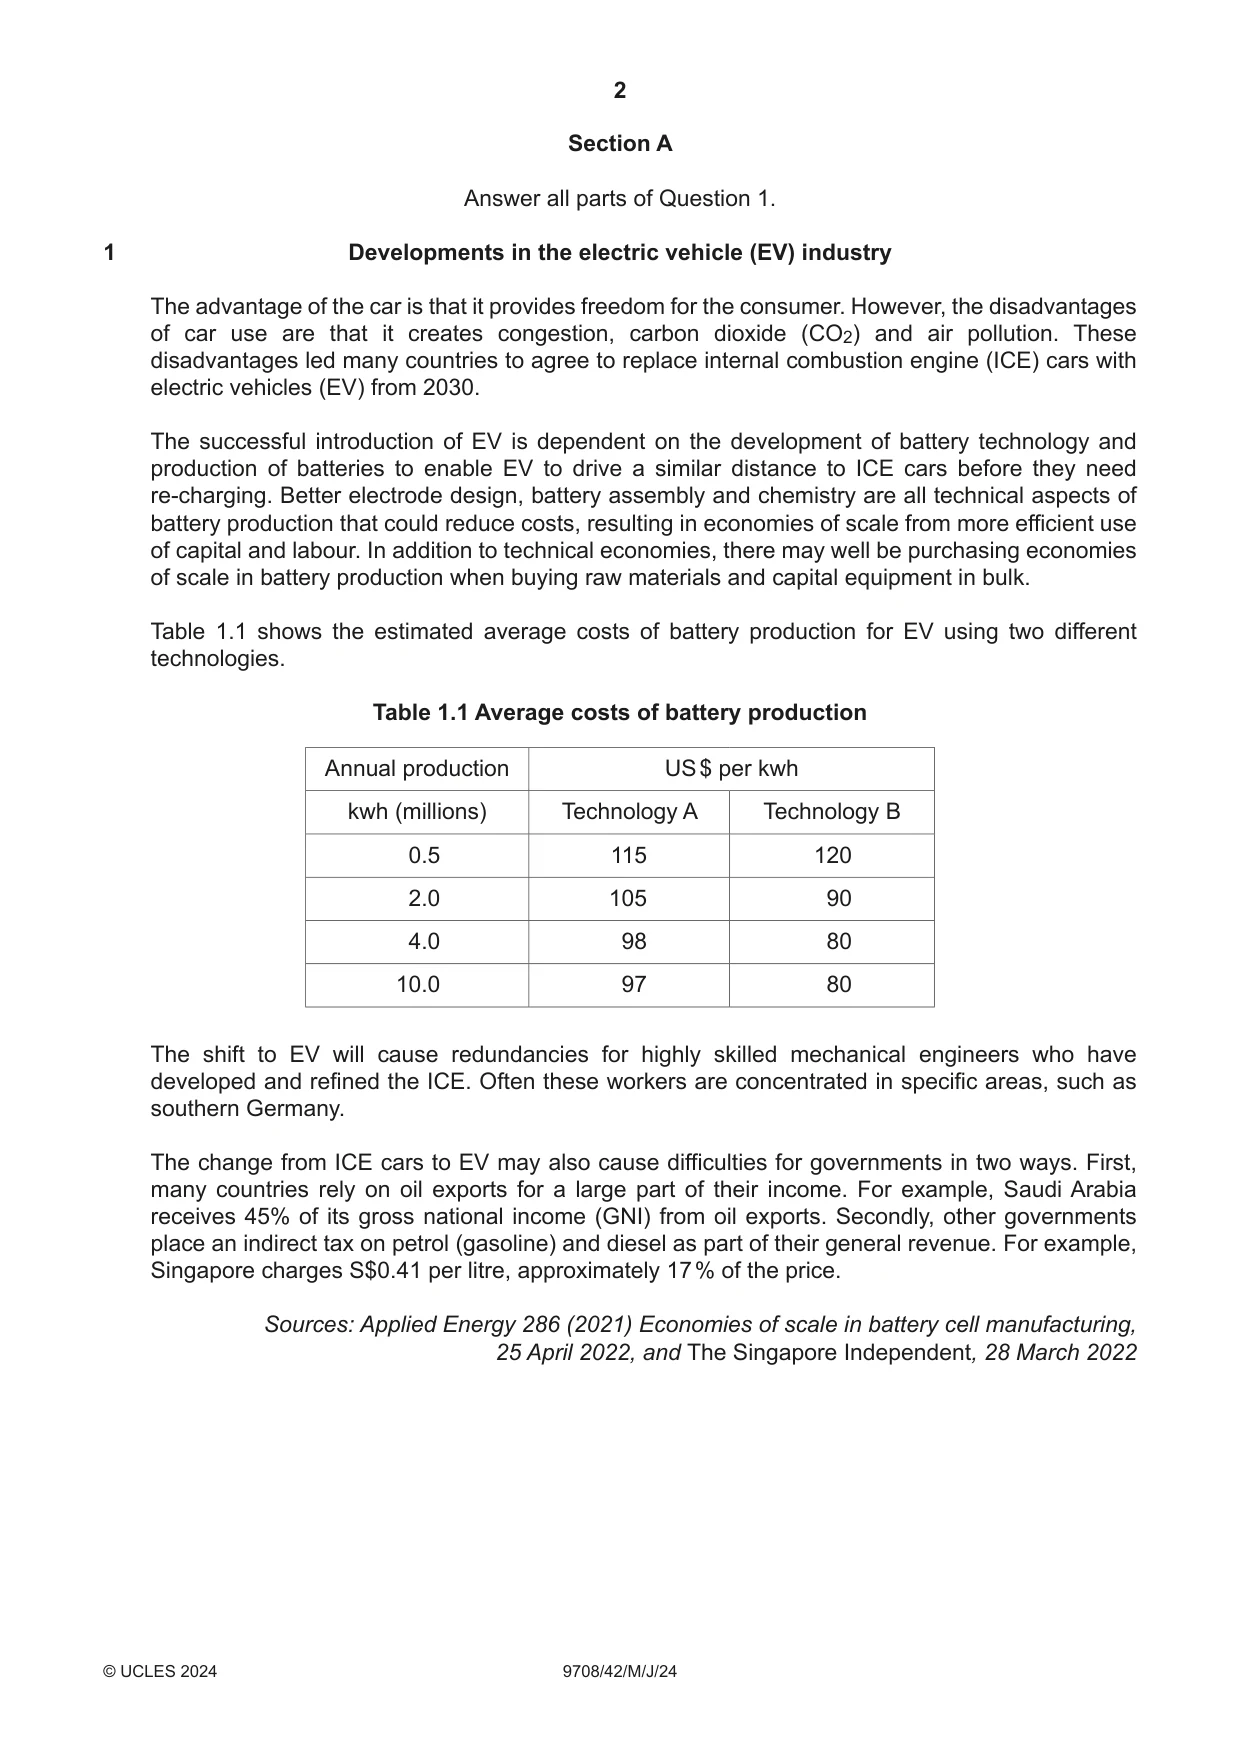
1 Developments in the electric vehicle (EV) industry The advantage of the car is that it provides freedom for the consumer. However, the disadvantages of car use are that it creates congestion, carbon dioxide (CO2) and air pollution. These disadvantages led many countries to agree to replace internal combustion engine (ICE) cars with electric vehicles (EV) from 2030. The successful introduction of EV is dependent on the development of battery technology and production of batteries to enable EV to drive a similar distance to ICE cars before they need re-charging. Better electrode design, battery assembly and chemistry are all technical aspects of battery production that could reduce costs, resulting in economies of scale from more efficient use of capital and labour. In addition to technical economies, there may well be purchasing economies of scale in battery production when buying raw materials and capital equipment in bulk. Table 1.1 shows the estimated average costs of battery production for EV using two different technologies. Table 1.1 Average costs of battery production Annual production US $ per kwh kwh (millions) Technology A Technology B 0.5 115 120 2.0 105 90 4.0 98 80 10.0 97 80 The shift to EV will cause redundancies for highly skilled mechanical engineers who have developed and refined the ICE. Often these workers are concentrated in specific areas, such as southern Germany. The change from ICE cars to EV may also cause difficulties for governments in two ways. First, many countries rely on oil exports for a large part of their income. For example, Saudi Arabia receives 45% of its gross national income (GNI) from oil exports. Secondly, other governments place an indirect tax on petrol (gasoline) and diesel as part of their general revenue. For example, Singapore charges S$0.41 per litre, approximately 17 % of the price. Sources: Applied Energy 286 (2021) Economies of scale in battery cell manufacturing, 25 April 2022, and The Singapore Independent, 28 March 2022 (a) Explain what is meant by internal economies of scale, using an example from the information. [3] (b) Consider what is meant by minimum efficient scale and to what extent the data in Table 1.1 suggest this has been achieved. [3] (c) Analyse, with the aid of a diagram, the likely impact of the change to EV on the labour market for workers producing ICE in southern Germany. [6] (d) Evaluate the likely macroeconomic effects of the switch to EV for both Saudi Arabia and Singapore. [8]
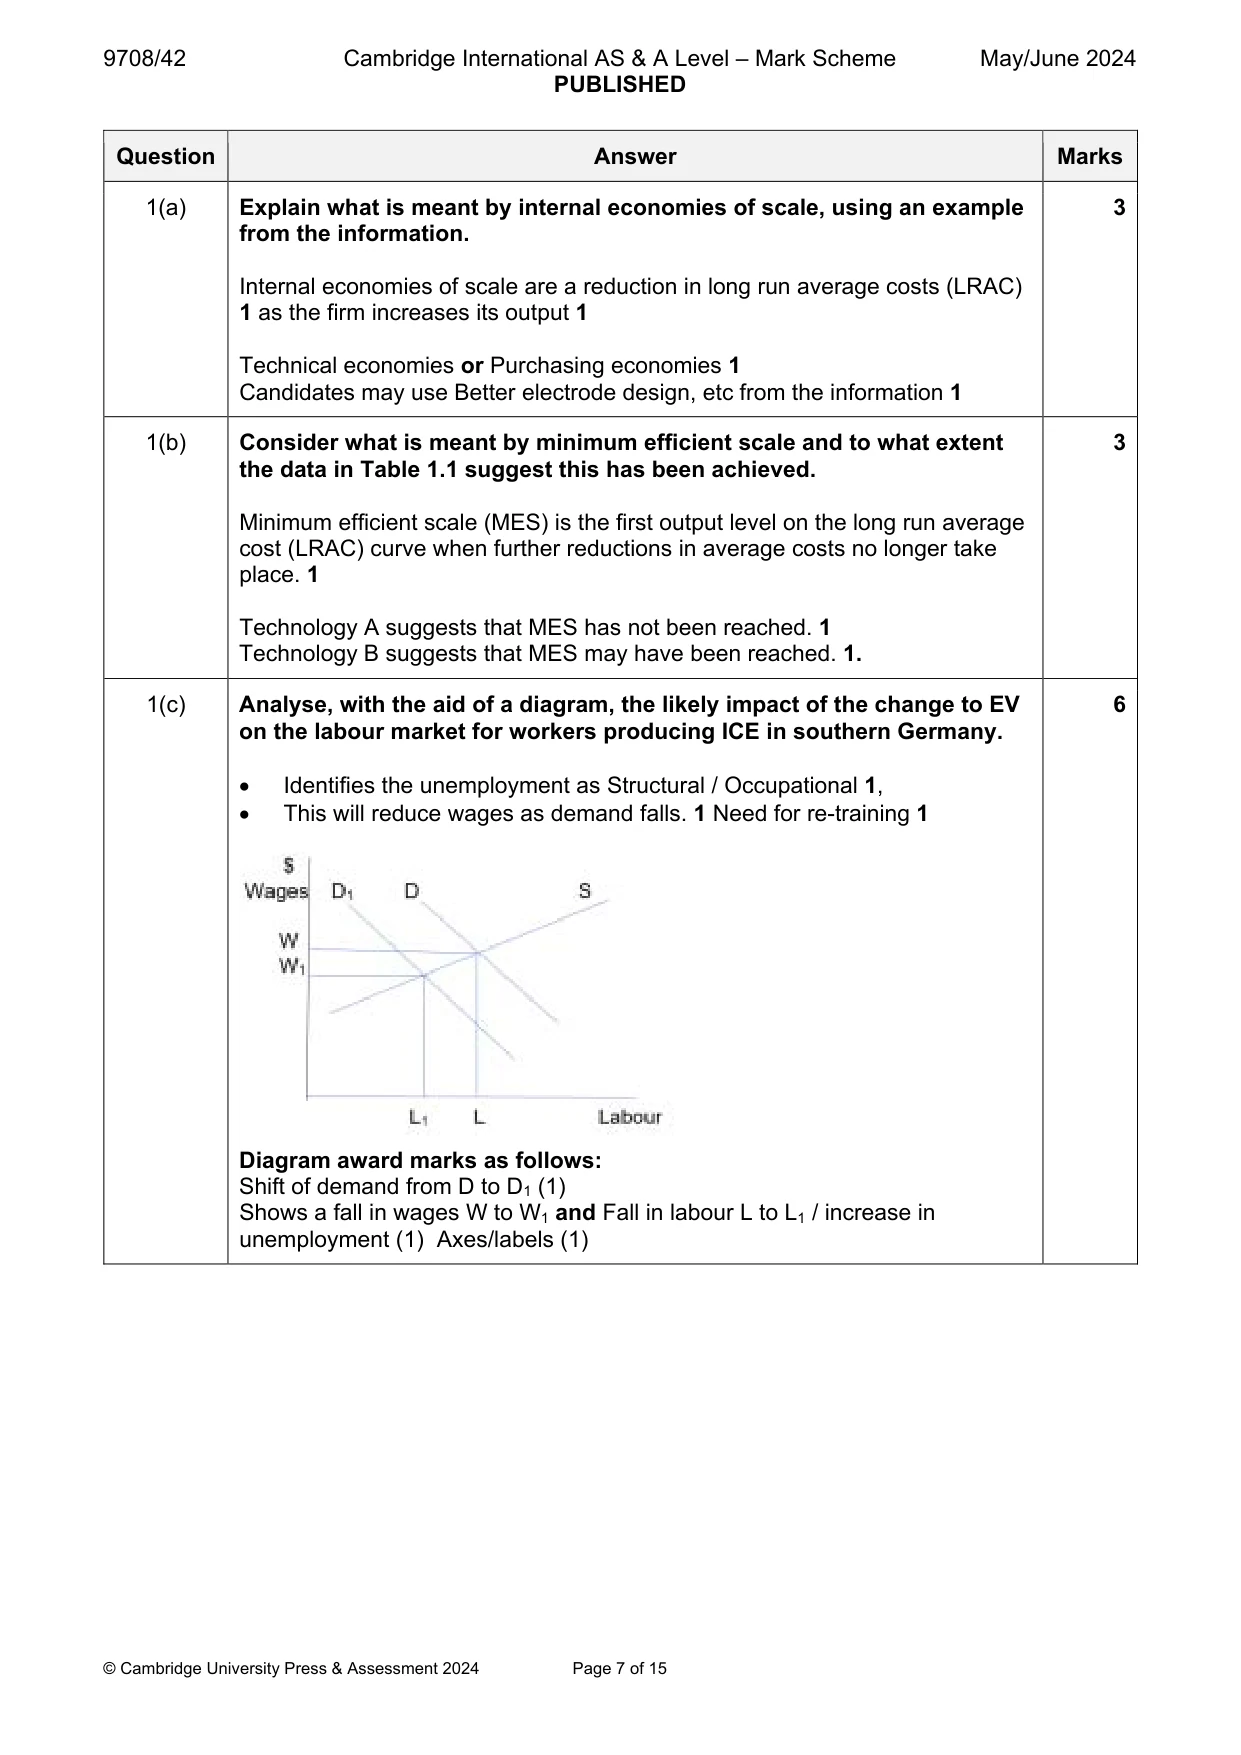
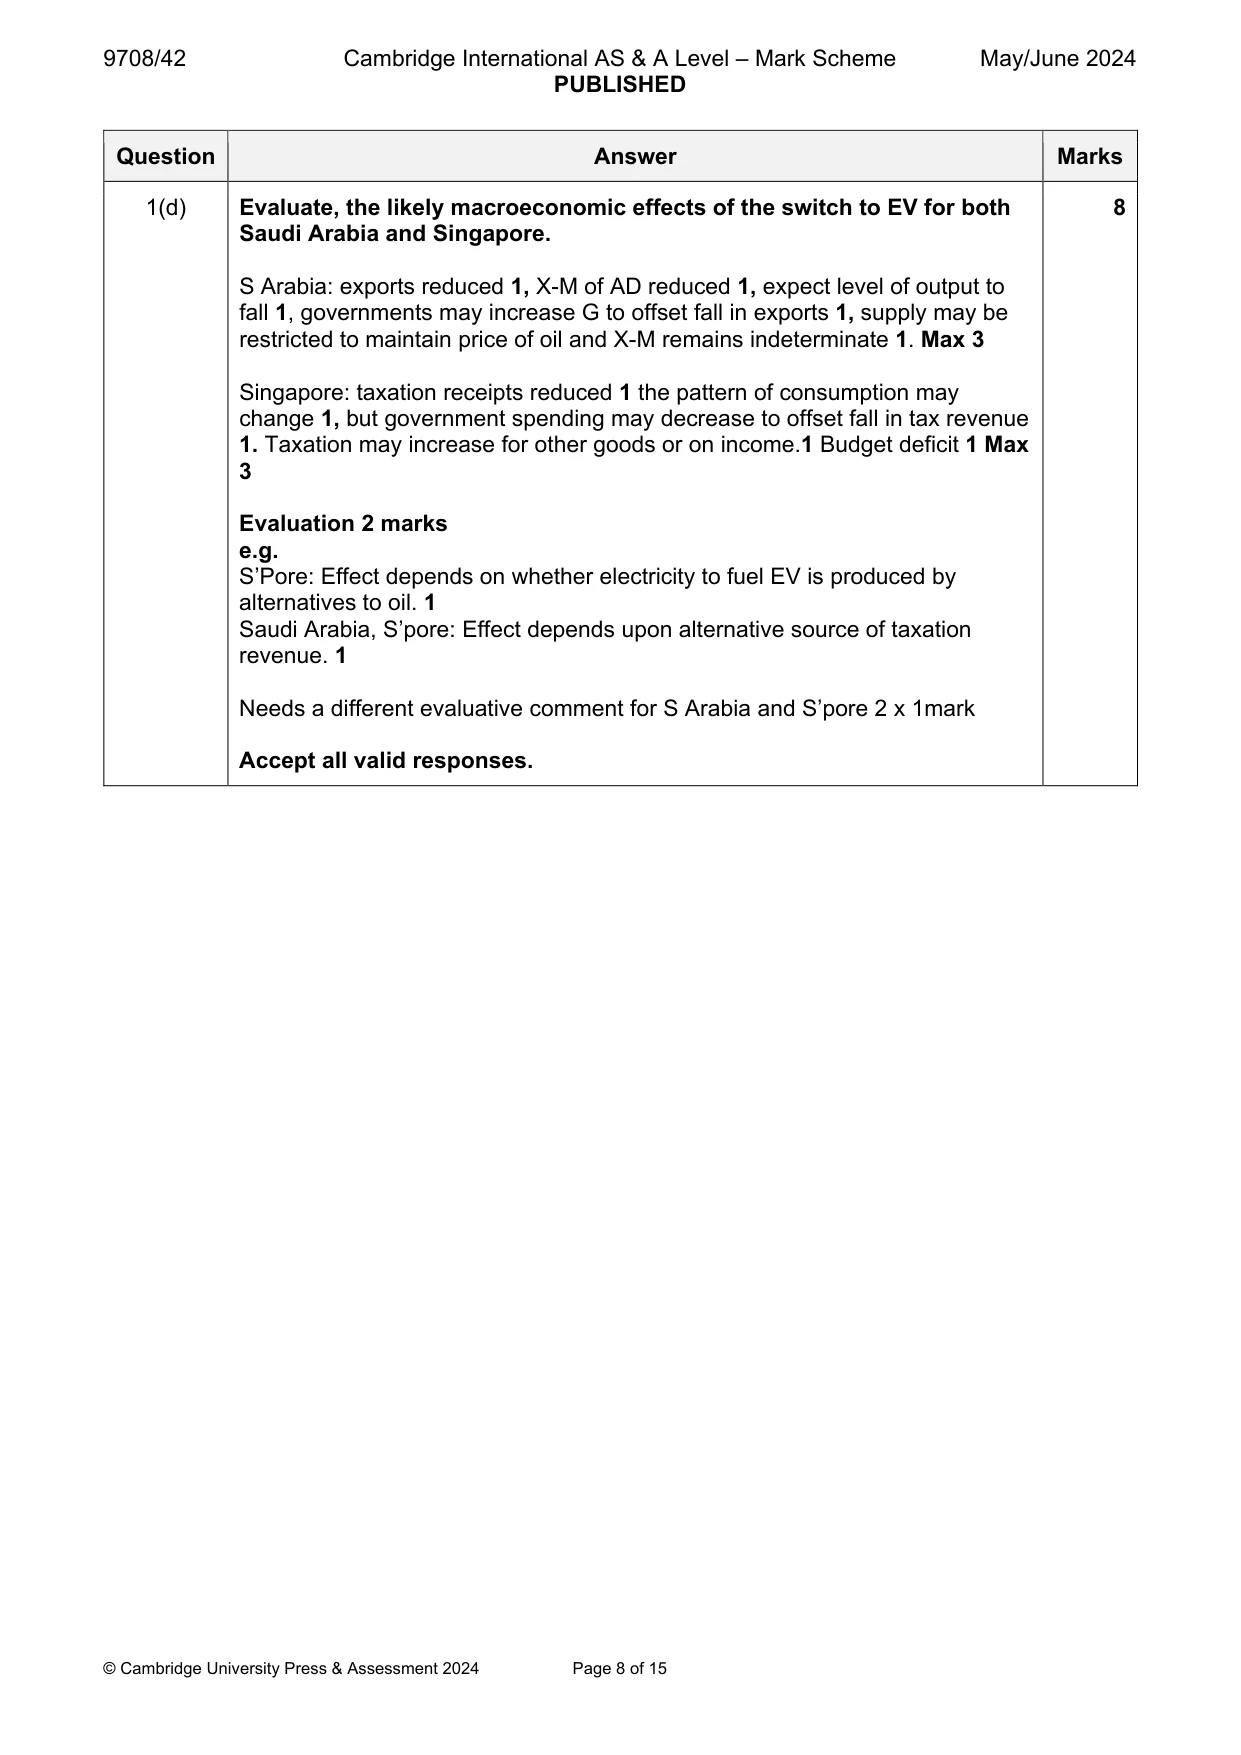
Mark scheme: Question Answer Marks 1(a) Explain what is meant by internal economies of scale, using an example 3 from the information. Internal economies of scale are a reduction in long run average costs (LRAC) 1 as the firm increases its output 1 Technical economies or Purchasing economies 1 Candidates may use Better electrode design, etc from the information 1 1(b) Consider what is meant by minimum efficient scale and to what extent 3 the data in Table 1.1 suggest this has been achieved. Minimum efficient scale (MES) is the first output level on the long run average cost (LRAC) curve when further reductions in average costs no longer take place. 1 Technology A suggests that MES has not been reached. 1 Technology B suggests that MES may have been reached. 1. 1(c) Analyse, with the aid of a diagram, the likely impact of the change to EV 6 on the labour market for workers producing ICE in southern Germany. Identifies the unemployment as Structural / Occupational 1, This will reduce wages as demand falls. 1 Need for re-training 1 Diagram award marks as follows: Shift of demand from D to D1 (1) Shows a fall in wages W to W1 and Fall in labour L to L1 / increase in unemployment (1) Axes/labels (1) 1(d) Evaluate, the likely macroeconomic effects of the switch to EV for both 8 Saudi Arabia and Singapore. S Arabia: exports reduced 1, X-M of AD reduced 1, expect level of output to fall 1, governments may increase G to offset fall in exports 1, supply may be restricted to maintain price of oil and X-M remains indeterminate 1. Max 3 Singapore: taxation receipts reduced 1 the pattern of consumption may change 1, but government spending may decrease to offset fall in tax revenue 1. Taxation may increase for other goods or on income.1 Budget deficit 1 Max 3 Evaluation 2 marks e.g. S’Pore: Effect depends on whether electricity to fuel EV is produced by alternatives to oil. 1 Saudi Arabia, S’pore: Effect depends upon alternative source of taxation revenue. 1 Needs a different evaluative comment for S Arabia and S’pore 2 x 1mark Accept all valid responses.
More questions on Links between macroeconomic problems and their interrelatedness
Q2 · Market failure exists in all economies
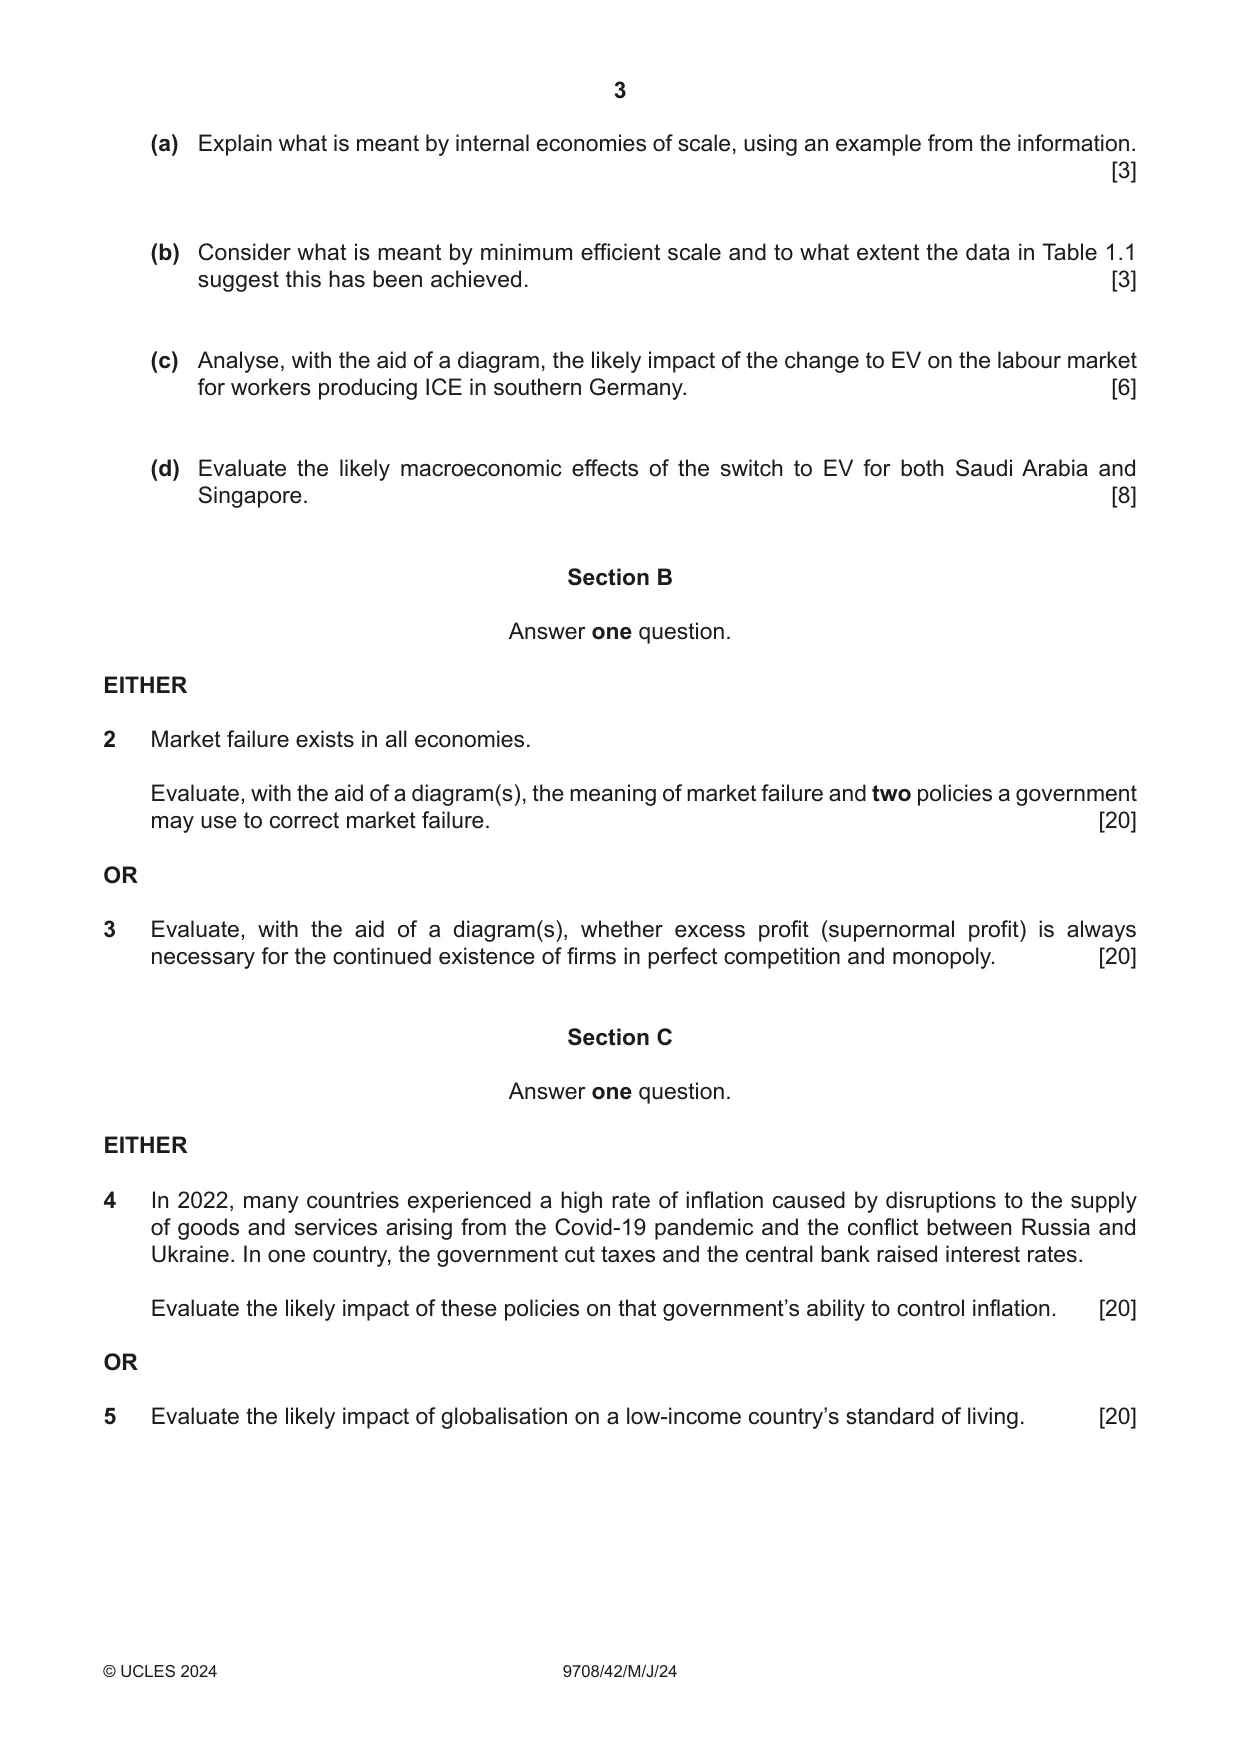
2 Market failure exists in all economies. Evaluate, with the aid of a diagram(s), the meaning of market failure and two policies a government may use to correct market failure. [20] OR
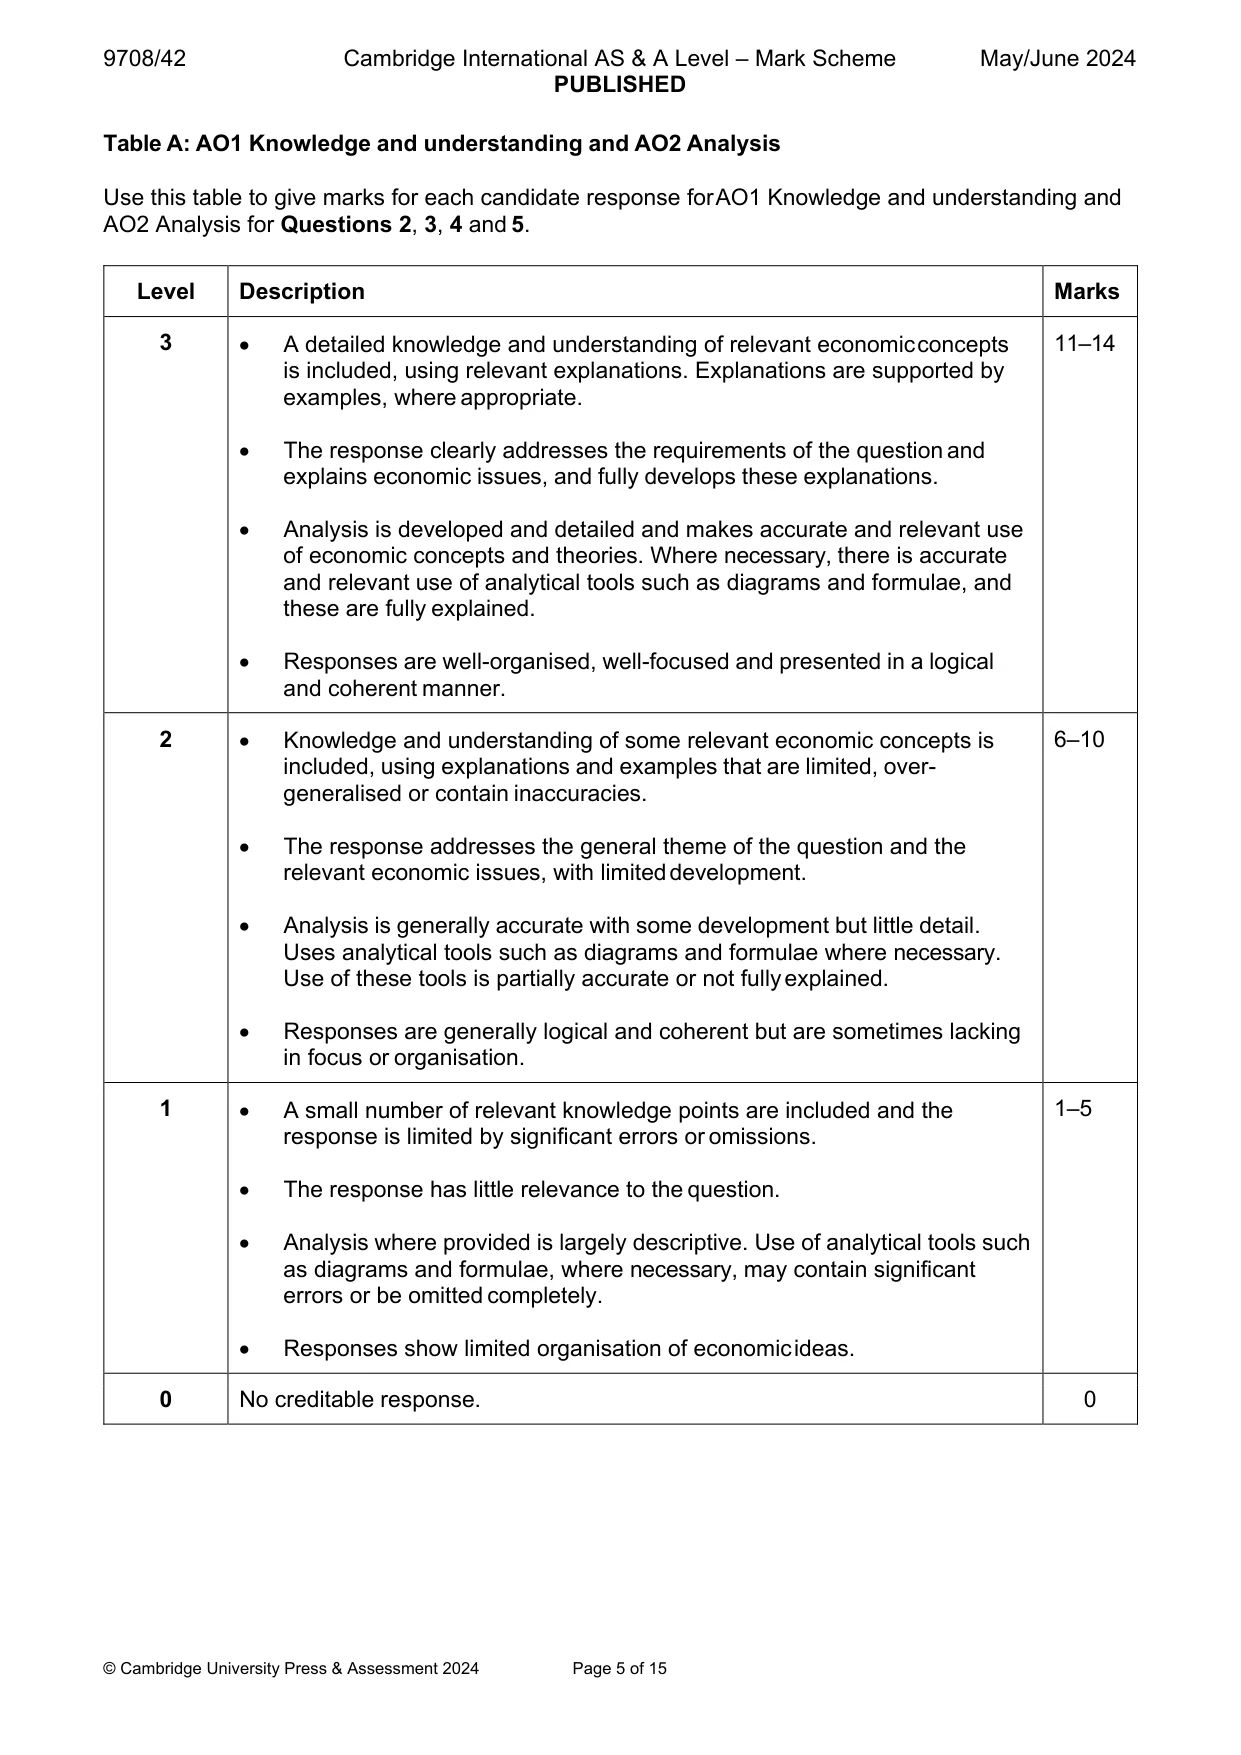
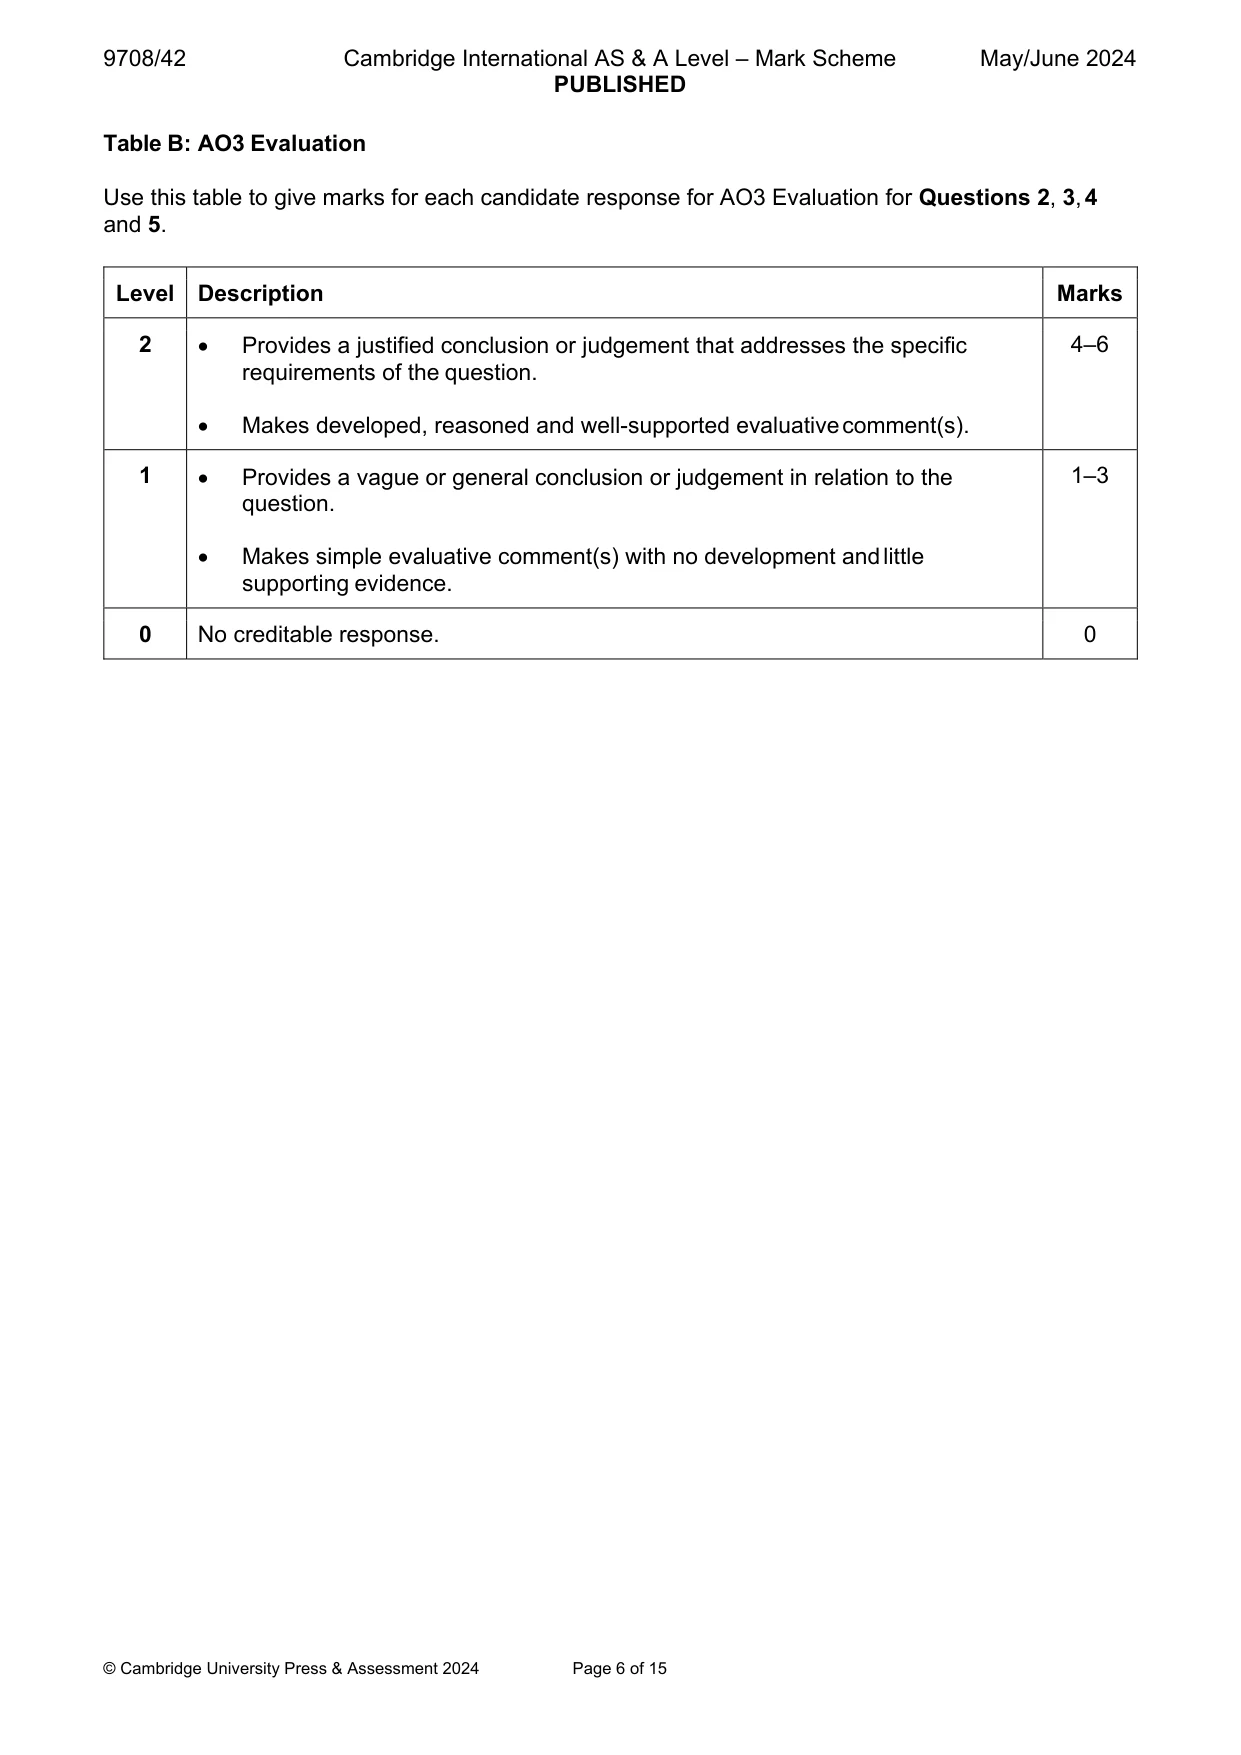
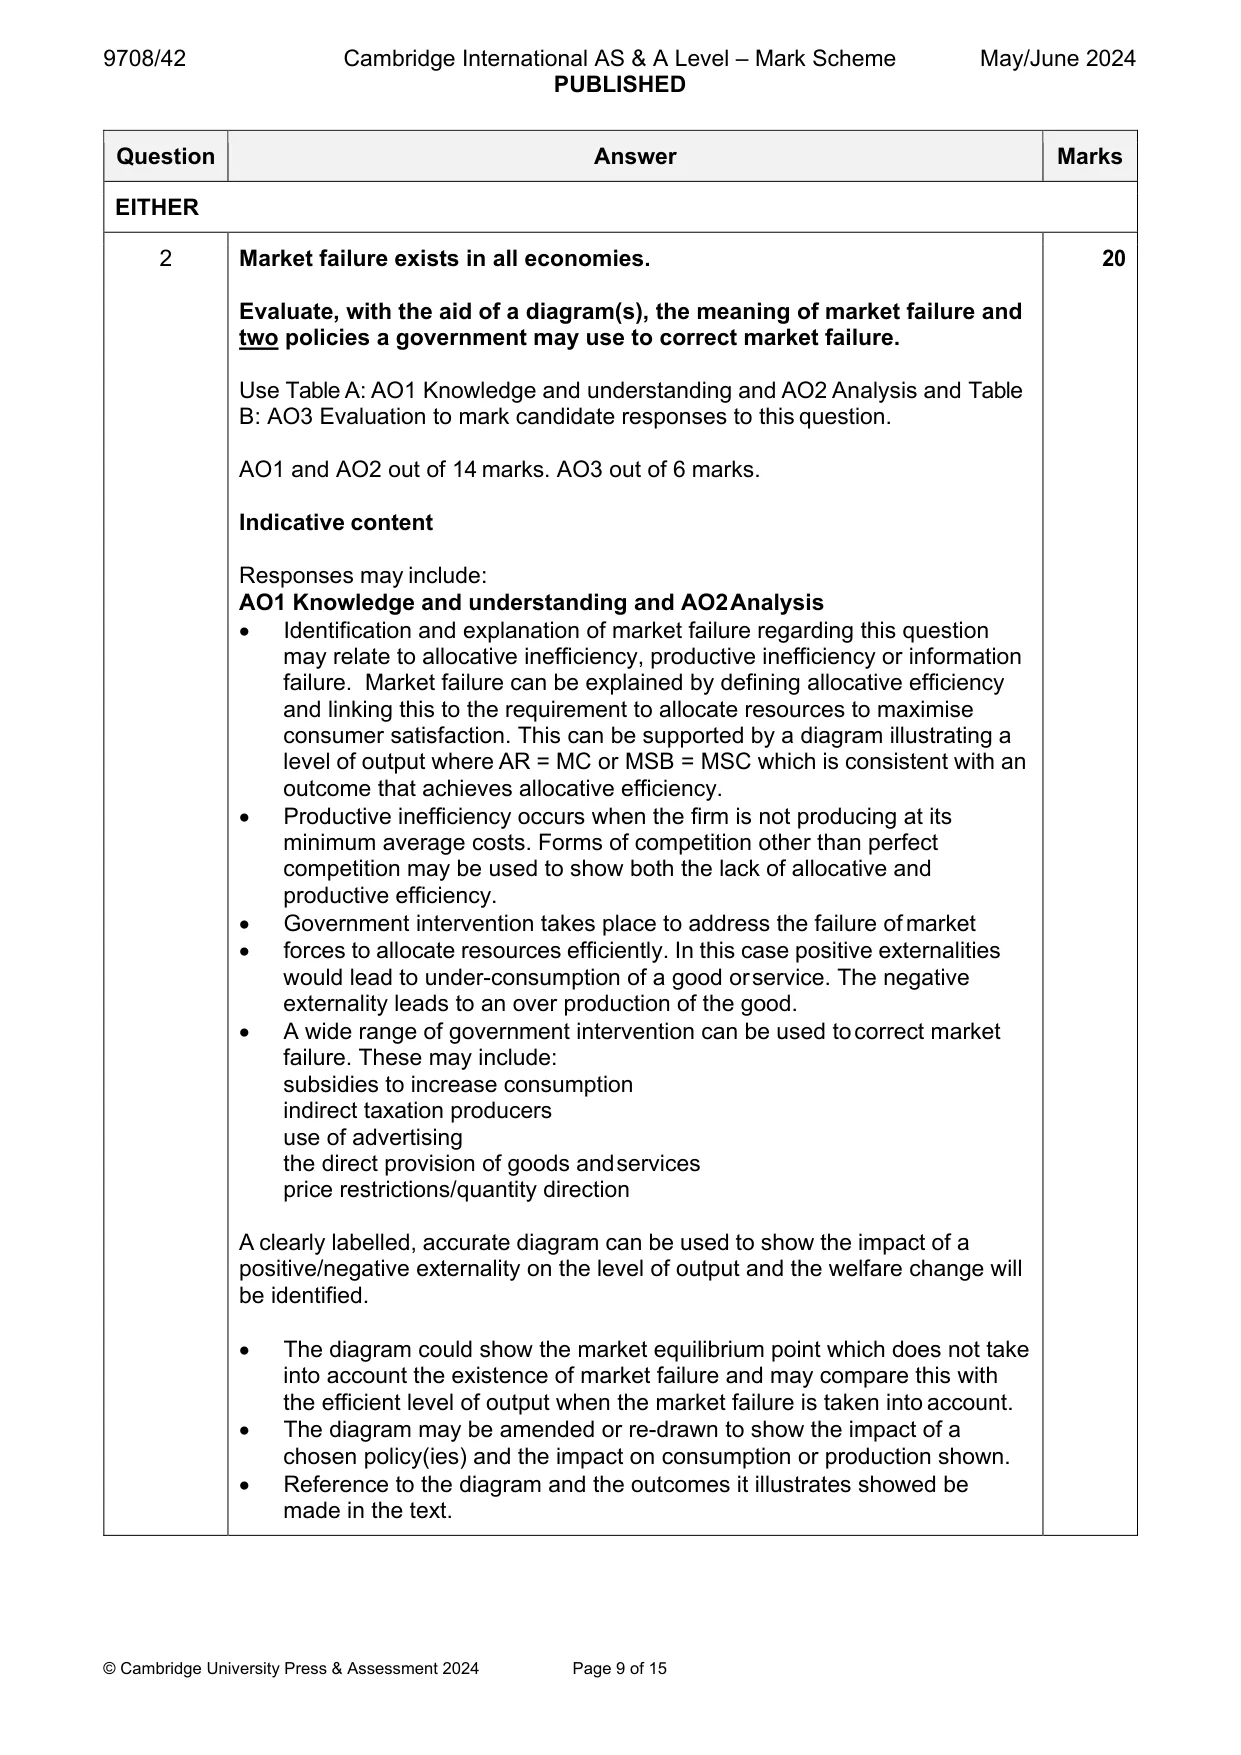
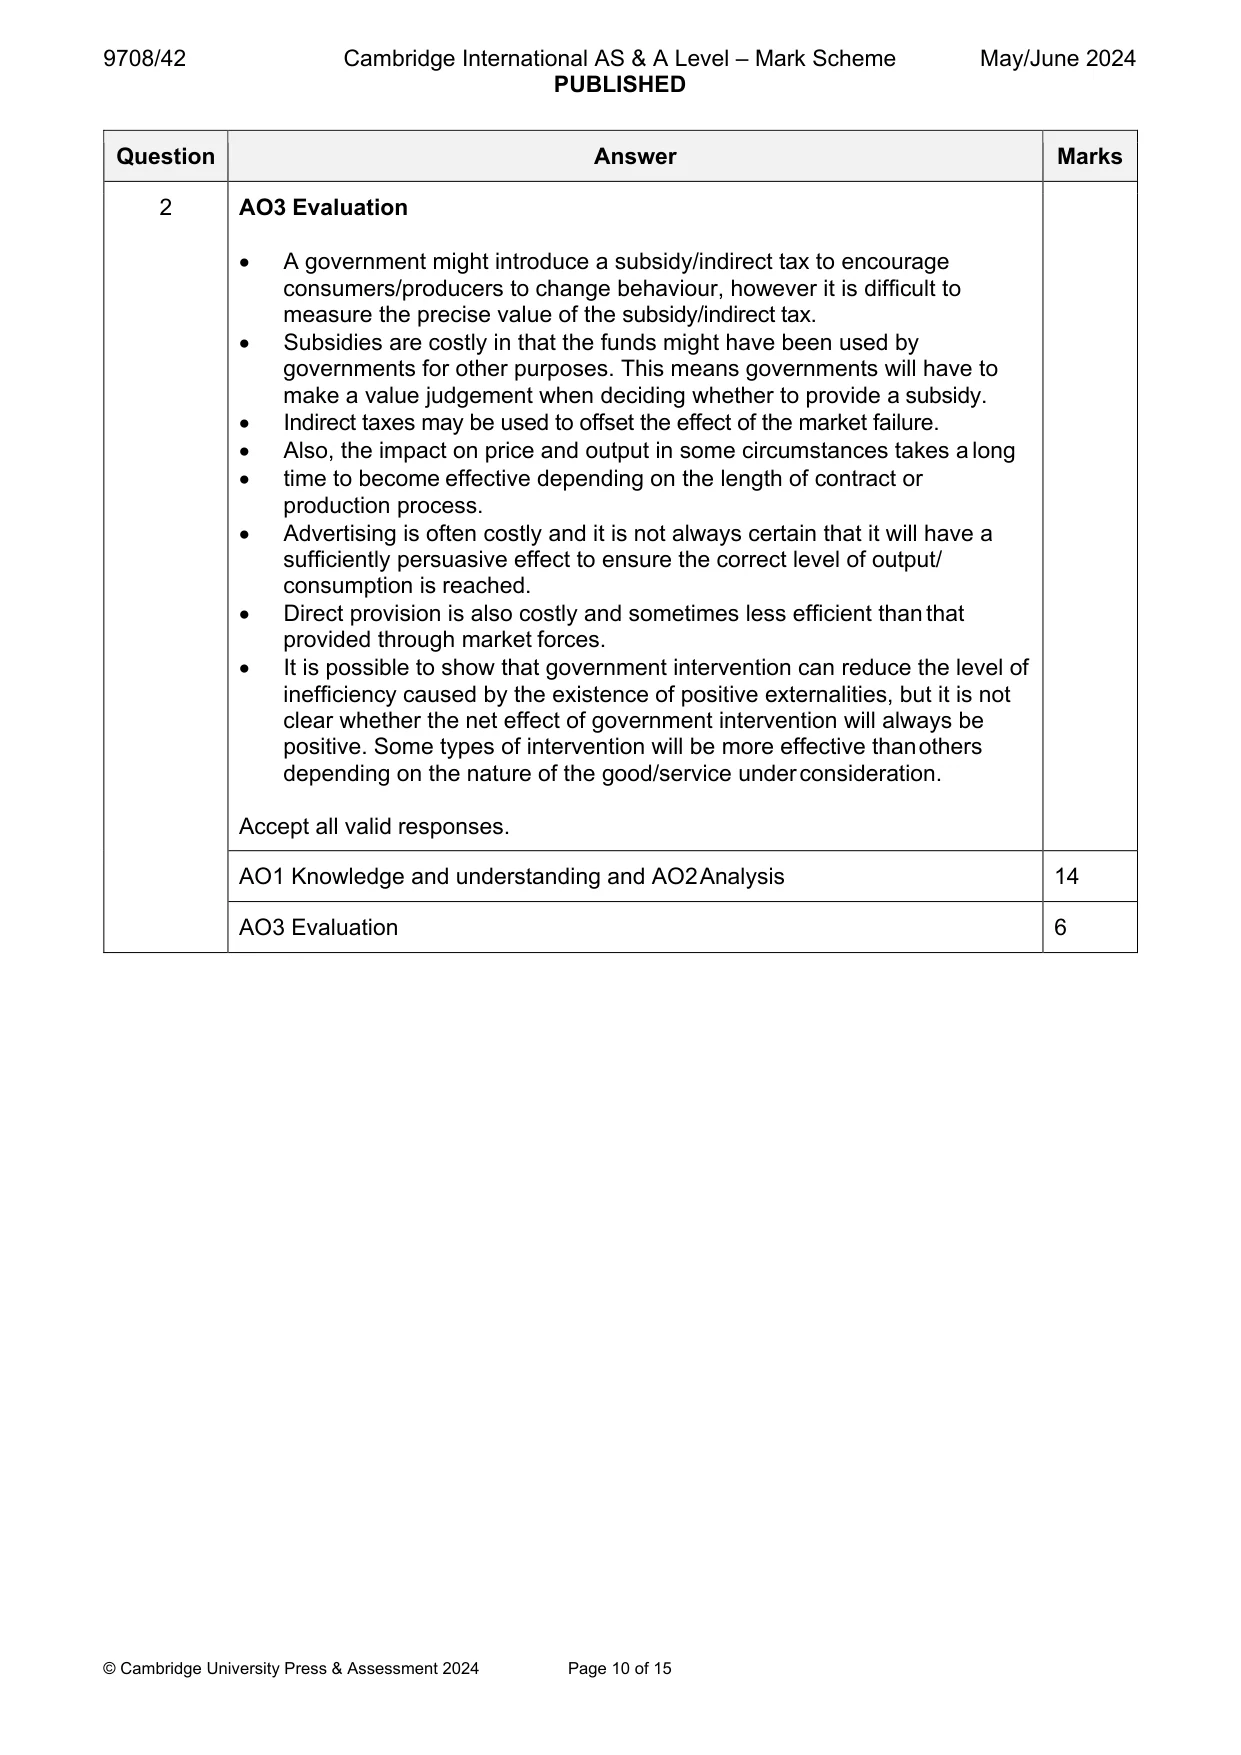
Mark scheme: 2 Market failure exists in all economies. 20 Evaluate, with the aid of a diagram(s), the meaning of market failure and two policies a government may use to correct market failure. Use Table A: AO1 Knowledge and understanding and AO2 Analysis and Table B: AO3 Evaluation to mark candidate responses to this question. AO1 and AO2 out of 14 marks. AO3 out of 6 marks. Indicative content Responses may include: AO1 Knowledge and understanding and AO2 Analysis Identification and explanation of market failure regarding this question may relate to allocative inefficiency, productive inefficiency or information failure. Market failure can be explained by defining allocative efficiency and linking this to the requirement to allocate resources to maximise consumer satisfaction. This can be supported by a diagram illustrating a level of output where AR = MC or MSB = MSC which is consistent with an outcome that achieves allocative efficiency. Productive inefficiency occurs when the firm is not producing at its minimum average costs. Forms of competition other than perfect competition may be used to show both the lack of allocative and productive efficiency. Government intervention takes place to address the failure of market forces to allocate resources efficiently. In this case positive externalities would lead to under-consumption of a good or service. The negative externality leads to an over production of the good. A wide range of government intervention can be used to correct market failure. These may include: subsidies to increase consumption indirect taxation producers use of advertising the direct provision of goods and services price restrictions/quantity direction A clearly labelled, accurate diagram can be used to show the impact of a positive/negative externality on the level of output and the welfare change will be identified. The diagram could show the market equilibrium point which does not take into account the existence of market failure and may compare this with the efficient level of output when the market failure is taken into account. The diagram may be amended or re-drawn to show the impact of a chosen policy(ies) and the impact on consumption or production shown. Reference to the diagram and the outcomes it illustrates showed be made in the text. 2 AO3 Evaluation A government might introduce a subsidy/indirect tax to encourage consumers/producers to change behaviour, however it is difficult to measure the precise value of the subsidy/indirect tax. Subsidies are costly in that the funds might have been used by governments for other purposes. This means governments will have to make a value judgement when deciding whether to provide a subsidy. Indirect taxes may be used to offset the effect of the market failure. Also, the impact on price and output in some circumstances takes a long time to become effective depending on the length of contract or production process. Advertising is often costly and it is not always certain that it will have a sufficiently persuasive effect to ensure the correct level of output/ consumption is reached. Direct provision is also costly and sometimes less efficient than that provided through market forces. It is possible to show that government intervention can reduce the level of inefficiency caused by the existence of positive externalities, but it is not clear whether the net effect of government intervention will always be positive. Some types of intervention will be more effective than others depending on the nature of the good/service under consideration. Accept all valid responses. AO1 Knowledge and understanding and AO2 Analysis 14 AO3 Evaluation 6
Q3 · Evaluate, with the aid of a diagram(s), whether excess profit (supernormal profit) is…
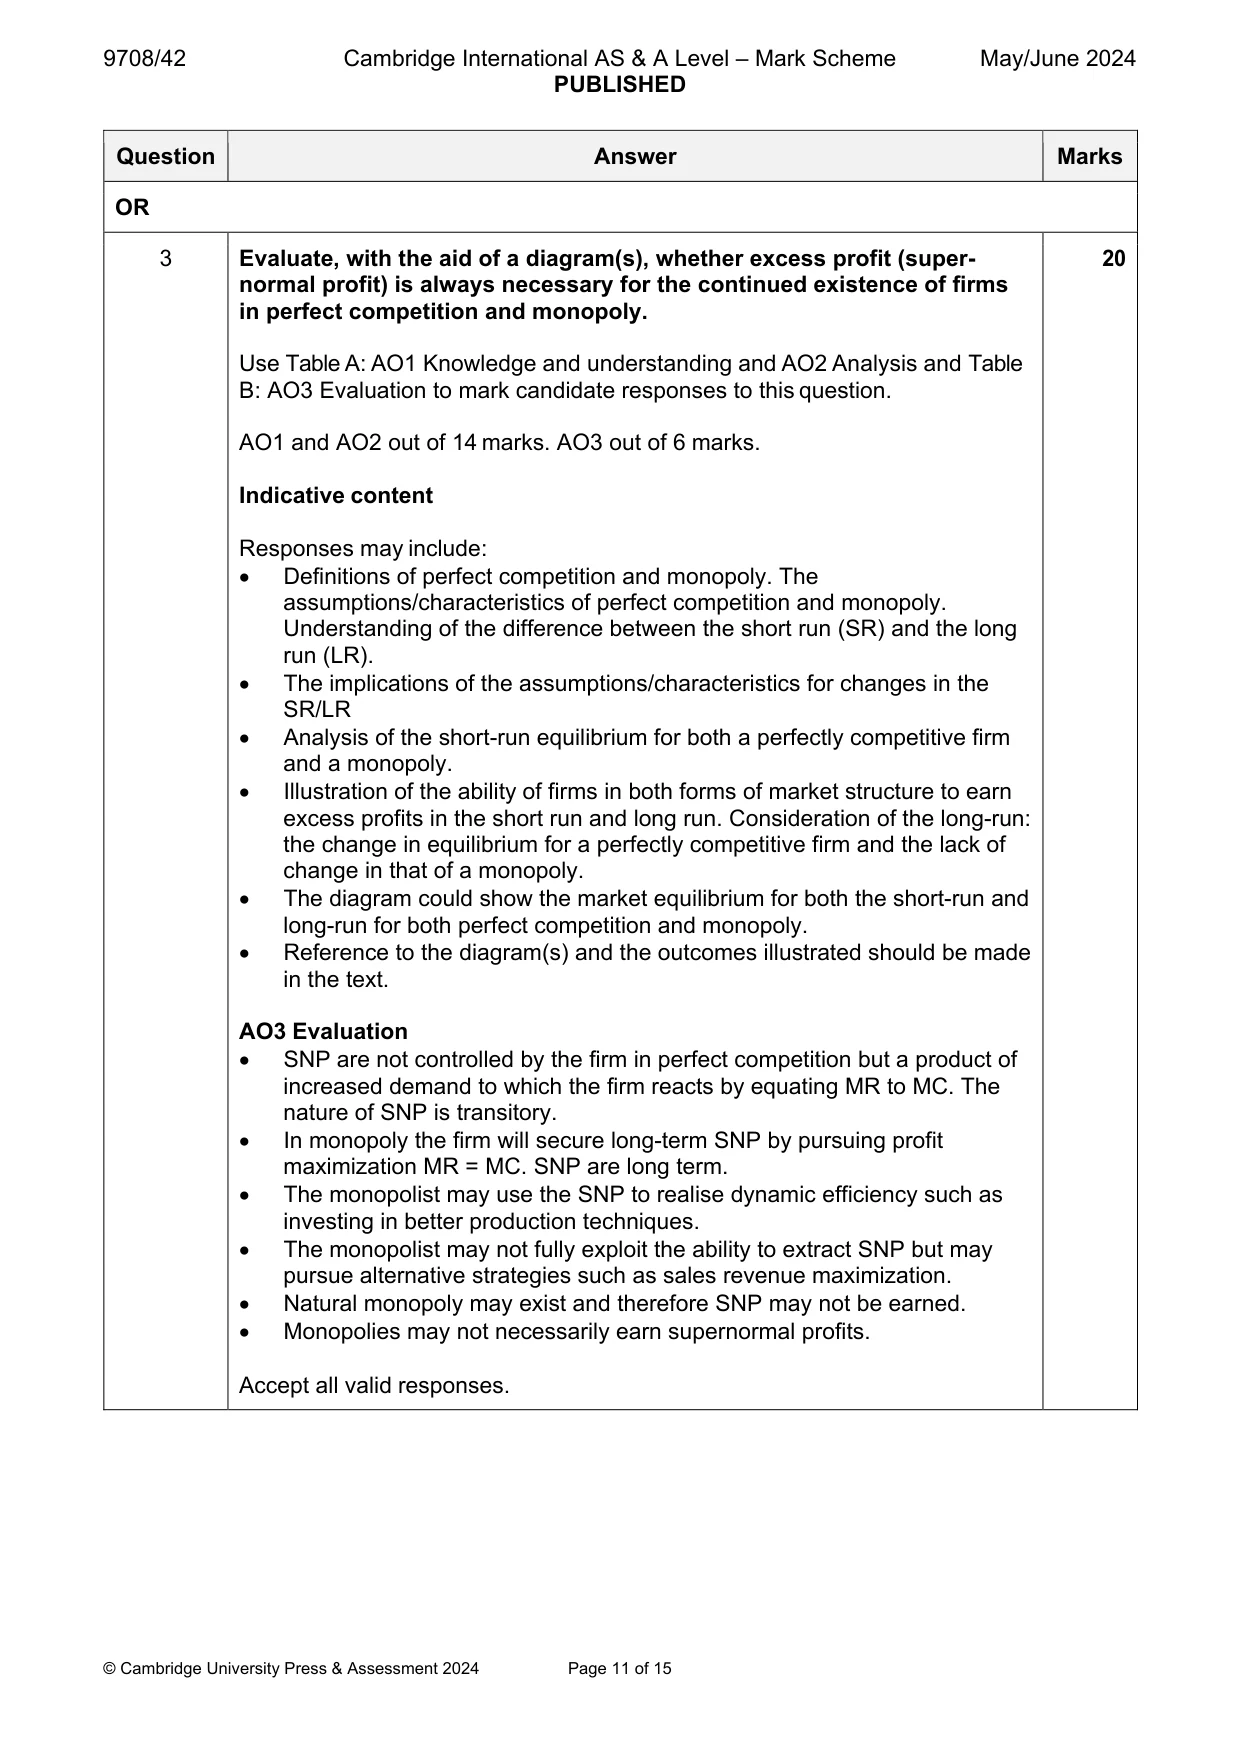
3 Evaluate, with the aid of a diagram(s), whether excess profit (supernormal profit) is always necessary for the continued existence of firms in perfect competition and monopoly. [20] Section C Answer one question. EITHER
Mark scheme: 3 Evaluate, with the aid of a diagram(s), whether excess profit (super- 20 normal profit) is always necessary for the continued existence of firms in perfect competition and monopoly. Use Table A: AO1 Knowledge and understanding and AO2 Analysis and Table B: AO3 Evaluation to mark candidate responses to this question. AO1 and AO2 out of 14 marks. AO3 out of 6 marks. Indicative content Responses may include: Definitions of perfect competition and monopoly. The assumptions/characteristics of perfect competition and monopoly. Understanding of the difference between the short run (SR) and the long run (LR). The implications of the assumptions/characteristics for changes in the SR/LR Analysis of the short-run equilibrium for both a perfectly competitive firm and a monopoly. Illustration of the ability of firms in both forms of market structure to earn excess profits in the short run and long run. Consideration of the long-run: the change in equilibrium for a perfectly competitive firm and the lack of change in that of a monopoly. The diagram could show the market equilibrium for both the short-run and long-run for both perfect competition and monopoly. Reference to the diagram(s) and the outcomes illustrated should be made in the text. AO3 Evaluation SNP are not controlled by the firm in perfect competition but a product of increased demand to which the firm reacts by equating MR to MC. The nature of SNP is transitory. In monopoly the firm will secure long-term SNP by pursuing profit maximization MR = MC. SNP are long term. The monopolist may use the SNP to realise dynamic efficiency such as investing in better production techniques. The monopolist may not fully exploit the ability to extract SNP but may pursue alternative strategies such as sales revenue maximization. Natural monopoly may exist and therefore SNP may not be earned. Monopolies may not necessarily earn supernormal profits. Accept all valid responses.
Q4 · In 2022, many countries experienced a high rate of inflation caused by disruptions to the…
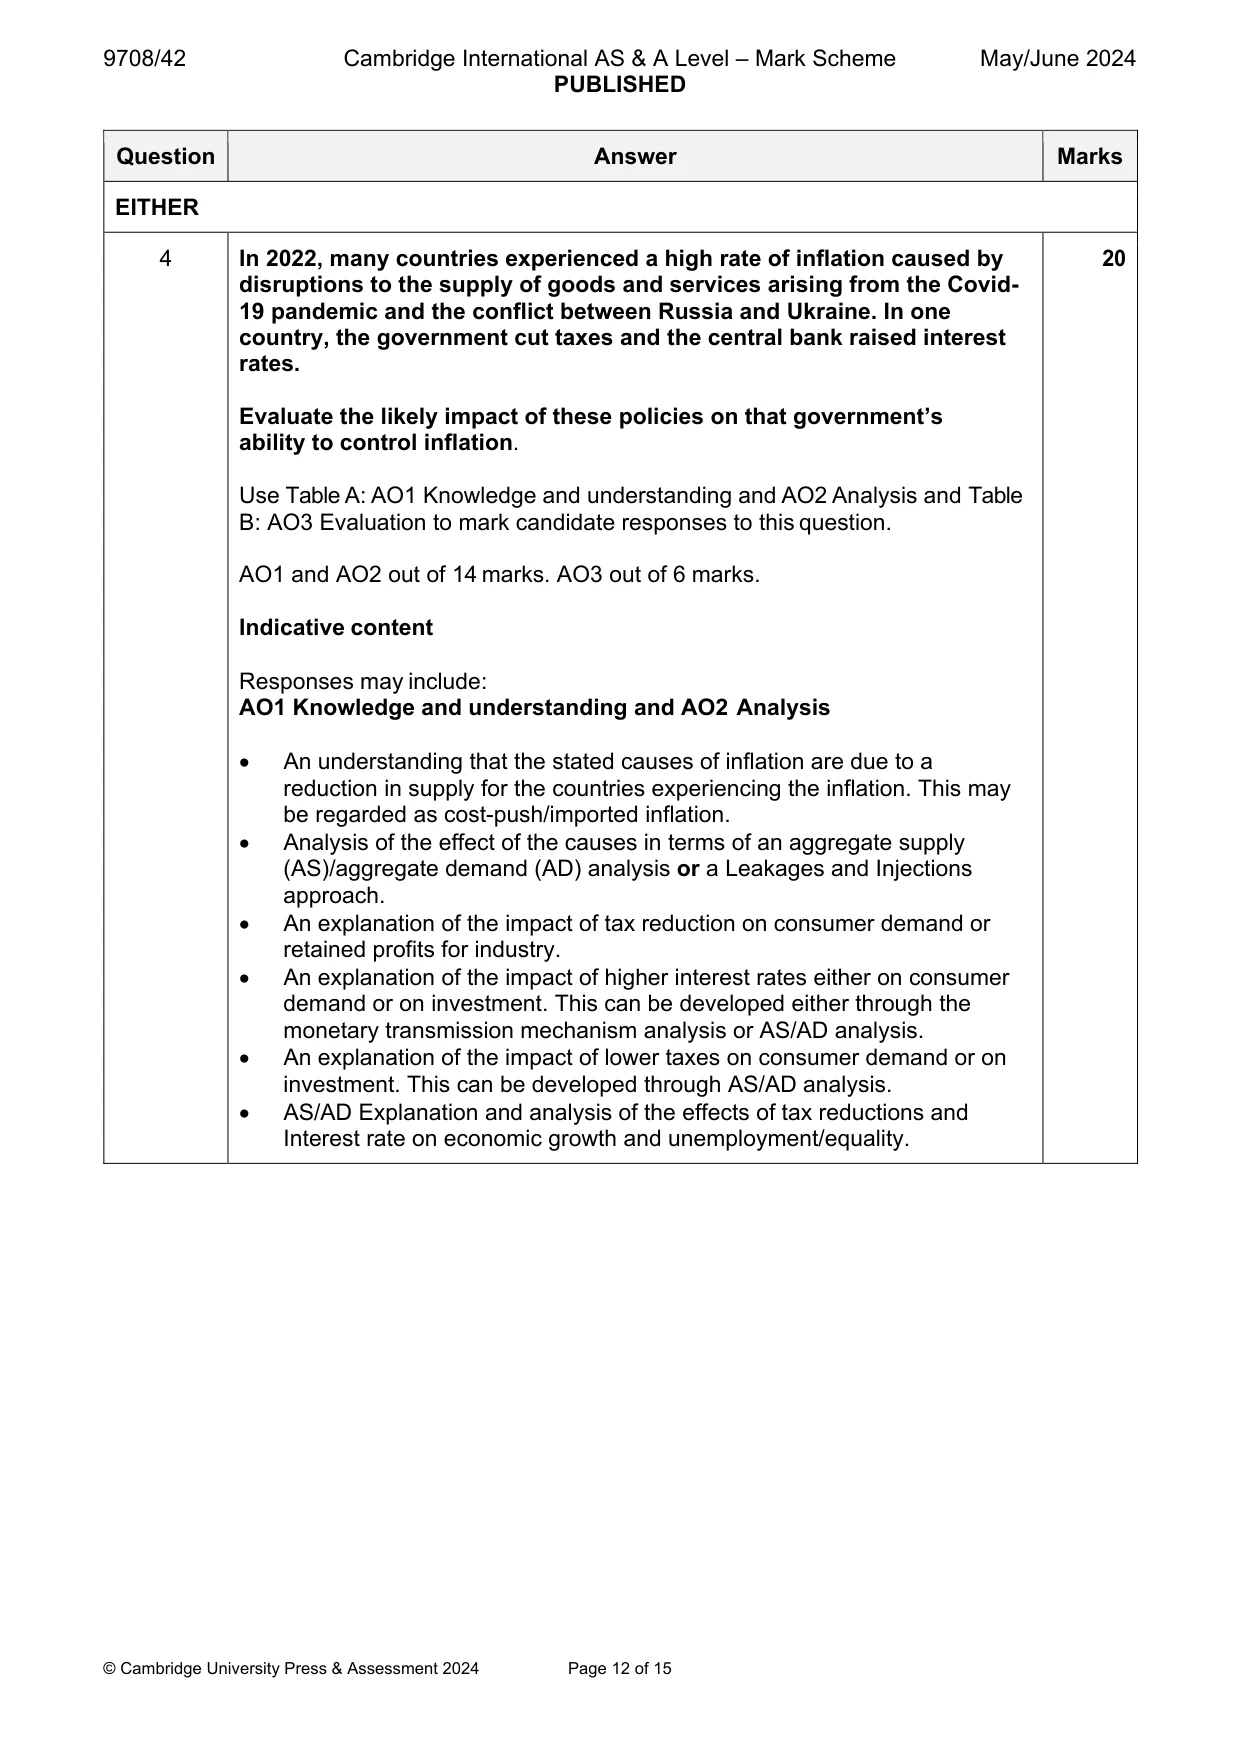
4 In 2022, many countries experienced a high rate of inflation caused by disruptions to the supply of goods and services arising from the Covid-19 pandemic and the conflict between Russia and Ukraine. In one country, the government cut taxes and the central bank raised interest rates. Evaluate the likely impact of these policies on that government’s ability to control inflation. [20] OR
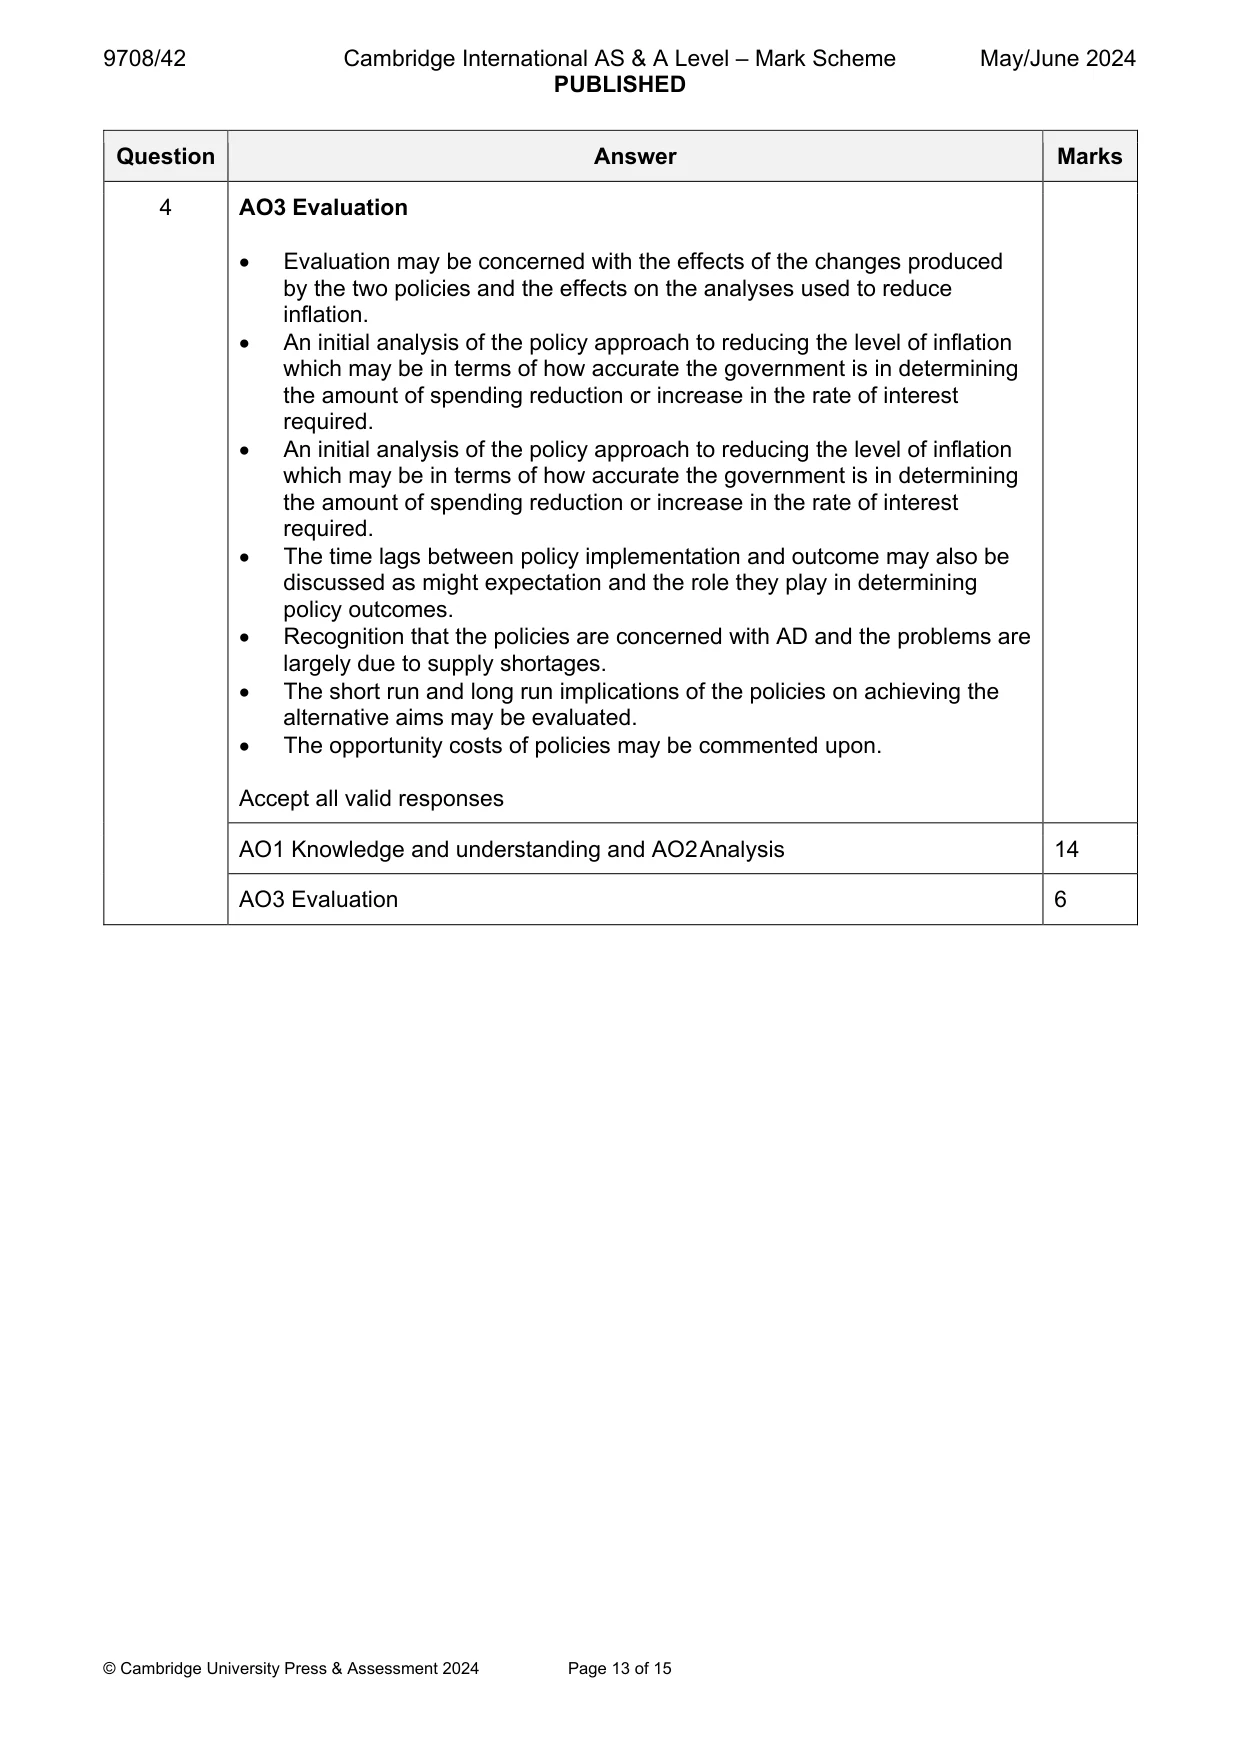
Mark scheme: 4 In 2022, many countries experienced a high rate of inflation caused by 20 disruptions to the supply of goods and services arising from the Covid- 19 pandemic and the conflict between Russia and Ukraine. In one country, the government cut taxes and the central bank raised interest rates. Evaluate the likely impact of these policies on that government’s ability to control inflation. Use Table A: AO1 Knowledge and understanding and AO2 Analysis and Table B: AO3 Evaluation to mark candidate responses to this question. AO1 and AO2 out of 14 marks. AO3 out of 6 marks. Indicative content Responses may include: AO1 Knowledge and understanding and AO2 Analysis An understanding that the stated causes of inflation are due to a reduction in supply for the countries experiencing the inflation. This may be regarded as cost-push/imported inflation. Analysis of the effect of the causes in terms of an aggregate supply (AS)/aggregate demand (AD) analysis or a Leakages and Injections approach. An explanation of the impact of tax reduction on consumer demand or retained profits for industry. An explanation of the impact of higher interest rates either on consumer demand or on investment. This can be developed either through the monetary transmission mechanism analysis or AS/AD analysis. An explanation of the impact of lower taxes on consumer demand or on investment. This can be developed through AS/AD analysis. AS/AD Explanation and analysis of the effects of tax reductions and Interest rate on economic growth and unemployment/equality. 4 AO3 Evaluation Evaluation may be concerned with the effects of the changes produced by the two policies and the effects on the analyses used to reduce inflation. An initial analysis of the policy approach to reducing the level of inflation which may be in terms of how accurate the government is in determining the amount of spending reduction or increase in the rate of interest required. An initial analysis of the policy approach to reducing the level of inflation which may be in terms of how accurate the government is in determining the amount of spending reduction or increase in the rate of interest required. The time lags between policy implementation and outcome may also be discussed as might expectation and the role they play in determining policy outcomes. Recognition that the policies are concerned with AD and the problems are largely due to supply shortages. The short run and long run implications of the policies on achieving the alternative aims may be evaluated. The opportunity costs of policies may be commented upon. Accept all valid responses AO1 Knowledge and understanding and AO2 Analysis 14 AO3 Evaluation 6
More questions on Effectiveness of policy options to meet all macroeconomic objectives
What was in this paper
The subtopics covered by these 4 questions, and how many questions each got. Open one in a new tab to see every Cambridge question on it.
What you needed in this session
Cambridge’s own grade thresholds for 2024 May/June, Paper 4 · Variant 2. A higher threshold means an easier paper — the bar moves with how the cohort did.