Cambridge A Level Economics 9708 — 2025 Feb/March Paper 4 · Variant 2
9708/42/F/M/25 · 5 questions · 60 marks · ≈68 min
The question paper and its mark scheme, free to read here and free to download. This is Cambridge’s own paper, exactly as it was sat.
Question paper4 pages

Mark scheme18 pages
Answers below. Sit the paper first if you are practising.

Questions as text
Q1 · China’s population trend China’s economic miracle has been built on a seemingly endless…
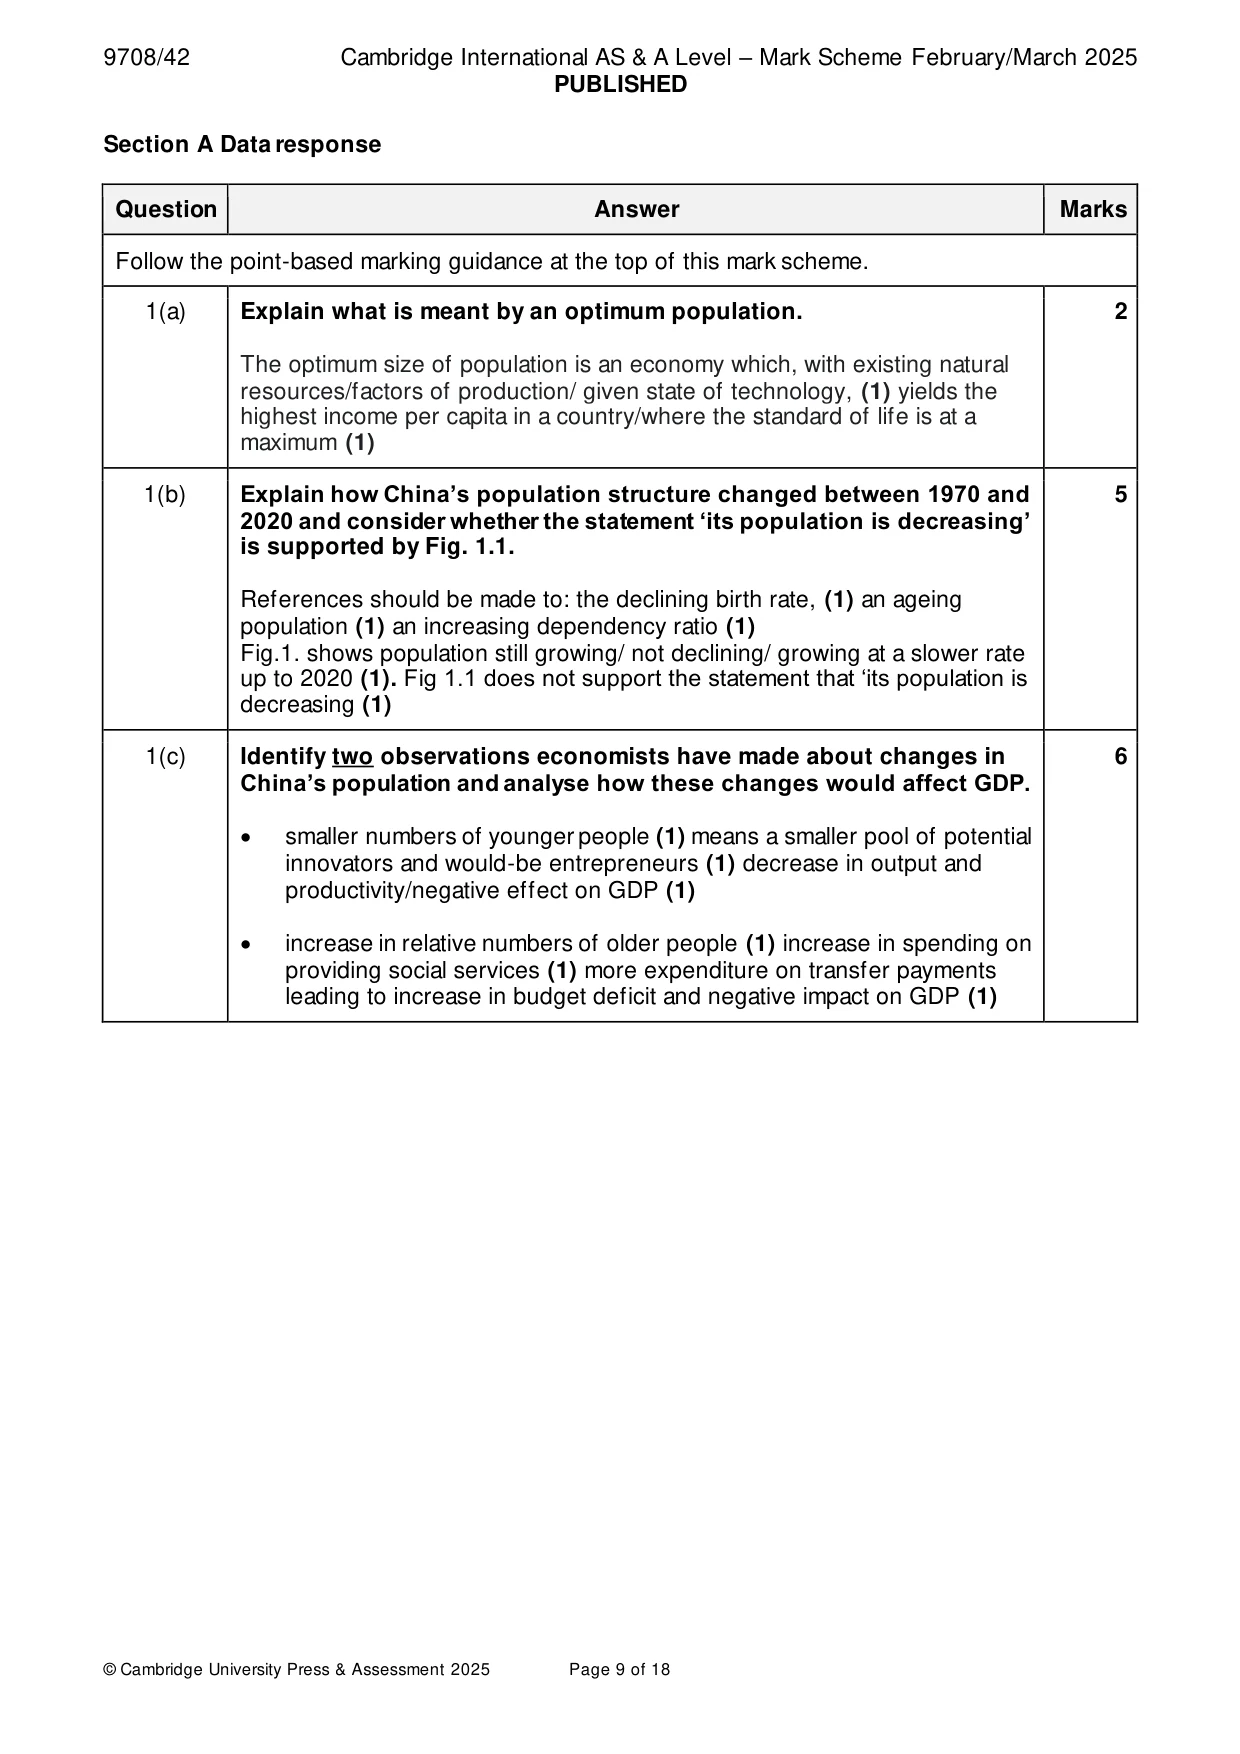
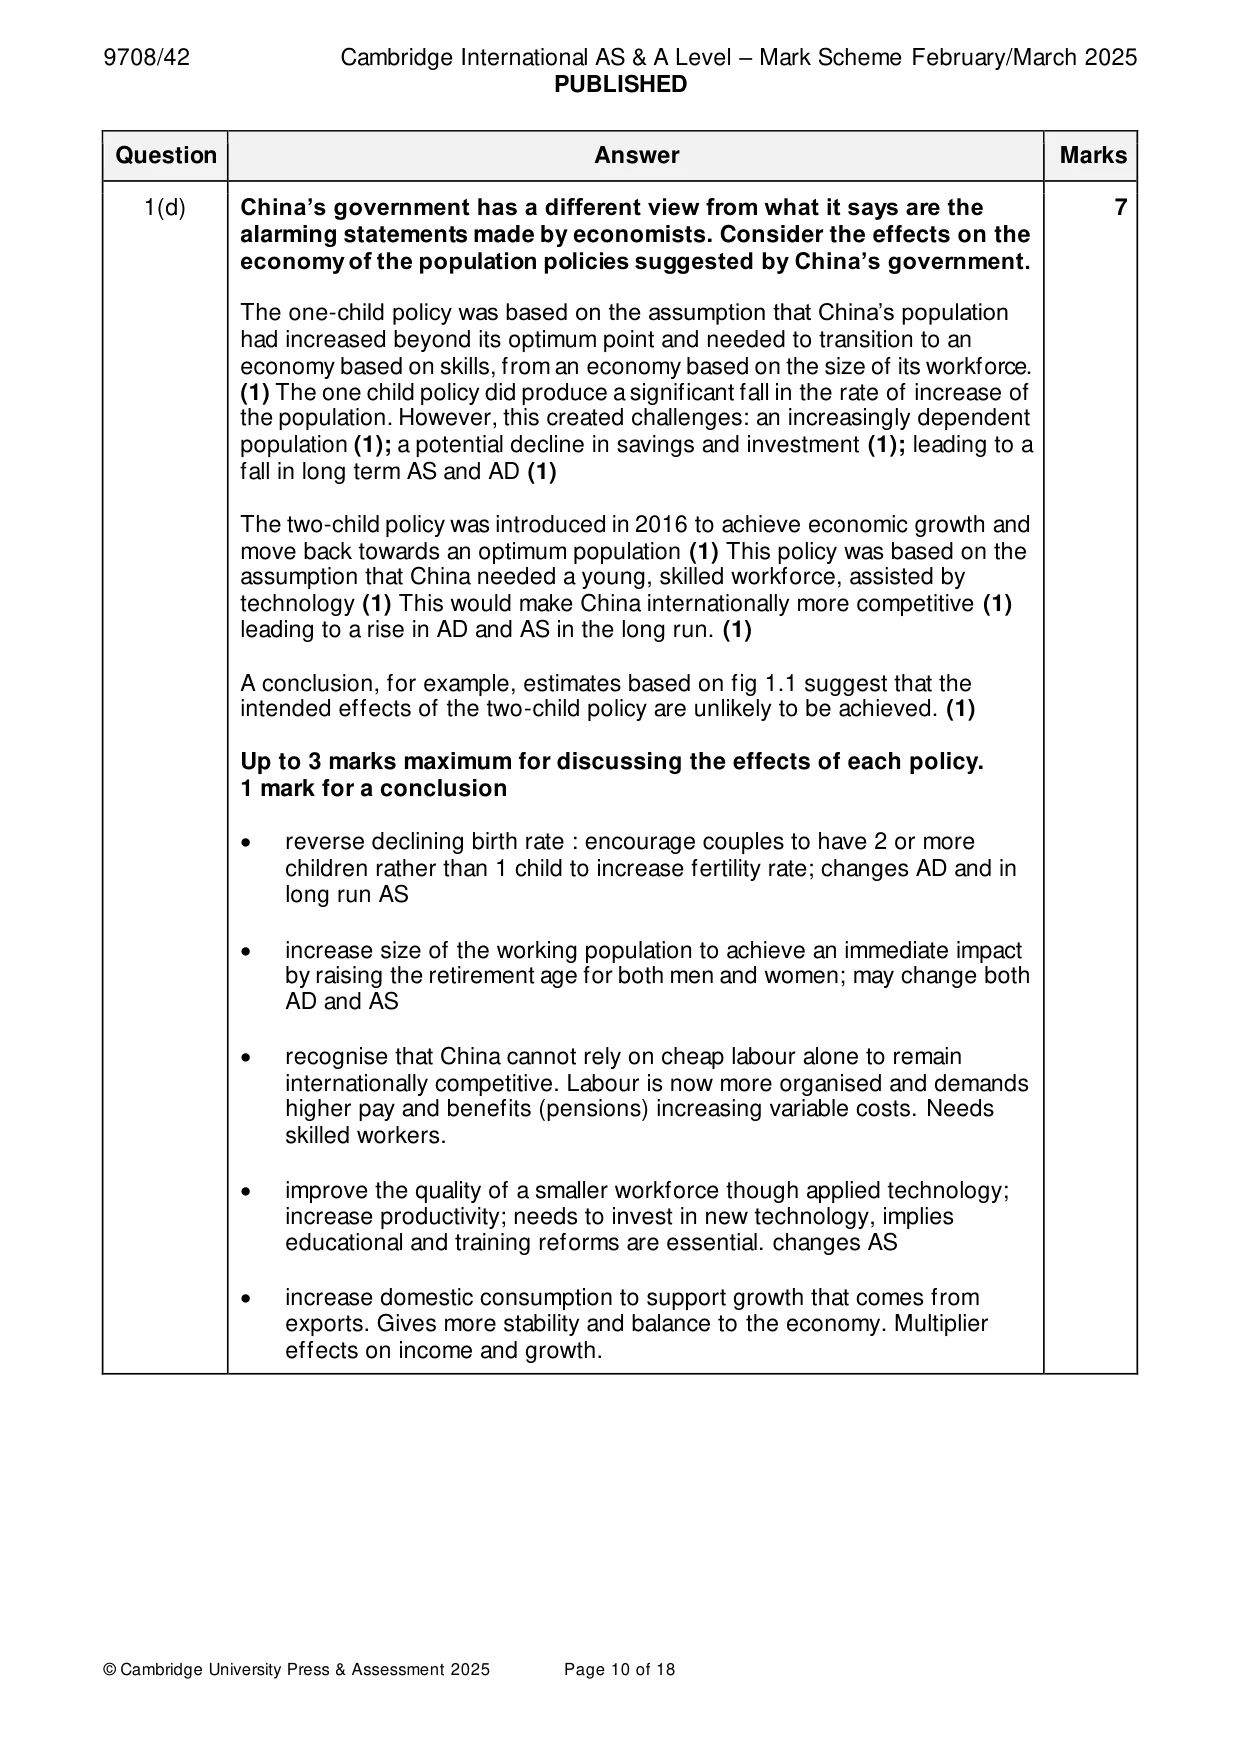
1 China’s population trend China’s economic miracle has been built on a seemingly endless supply of affordable labour from a population of 1.4 billion. Content removed due to copyright restrictions. Fig. 1.1 Annual population change in China, 1970 to 2050 Sources: Didi Tang, The Times, 29 April 2021 and 12 January 2023 US Census International Database, 15 February 2023 (a) Explain what is meant by an optimum population. [2] (b) Explain how China’s population structure changed between 1970 and 2020 and consider whether the statement ‘its population is decreasing’ is supported by Fig. 1.1. [5] (c) Identify two observations economists have made about changes in China’s population and analyse how these changes would affect GDP. [6] (d) China’s government has a different view from what it says are the alarming statements made by economists. Consider the effects on the economy of the population policies suggested by China’s government. [7]
Mark scheme: Question Answer Marks Follow the point-based marking guidance at the top of this mark scheme. 1(a) Explain what is meant by an optimum population. 2 The optimum size of population is an economy which, with existing natural resources/factors of production/ given state of technology, (1) yields the highest income per capita in a country/where the standard of life is at a maximum (1) 1(b) Explain how China’s population structure changed between 1970 and 5 2020 and consider whether the statement ‘its population is decreasing’ is supported by Fig. 1.1. References should be made to: the declining birth rate, (1) an ageing population (1) an increasing dependency ratio (1) Fig.1. shows population still growing/ not declining/ growing at a slower rate up to 2020 (1). Fig 1.1 does not support the statement that ‘its population is decreasing (1) 1(c) Identify two observations economists have made about changes in 6 China’s population and analyse how these changes would affect GDP. • smaller numbers of younger people (1) means a smaller pool of potential innovators and would-be entrepreneurs (1) decrease in output and productivity/negative effect on GDP (1) • increase in relative numbers of older people (1) increase in spending on providing social services (1) more expenditure on transfer payments leading to increase in budget deficit and negative impact on GDP (1) 1(d) China’s government has a different view from what it says are the 7 alarming statements made by economists. Consider the effects on the economy of the population policies suggested by China’s government. The one-child policy was based on the assumption that China’s population had increased beyond its optimum point and needed to transition to an economy based on skills, from an economy based on the size of its workforce. (1) The one child policy did produce a significant fall in the rate of increase of the population. However, this created challenges: an increasingly dependent population (1); a potential decline in savings and investment (1); leading to a fall in long term AS and AD (1) The two-child policy was introduced in 2016 to achieve economic growth and move back towards an optimum population (1) This policy was based on the assumption that China needed a young, skilled workforce, assisted by technology (1) This would make China internationally more competitive (1) leading to a rise in AD and AS in the long run. (1) A conclusion, for example, estimates based on fig 1.1 suggest that the intended effects of the two-child policy are unlikely to be achieved. (1) Up to 3 marks maximum for discussing the effects of each policy. 1 mark for a conclusion • reverse declining birth rate : encourage couples to have 2 or more children rather than 1 child to increase fertility rate; changes AD and in long run AS • increase size of the working population to achieve an immediate impact by raising the retirement age for both men and women; may change both AD and AS • recognise that China cannot rely on cheap labour alone to remain internationally competitive. Labour is now more organised and demands higher pay and benefits (pensions) increasing variable costs. Needs skilled workers. • improve the quality of a smaller workforce though applied technology; increase productivity; needs to invest in new technology, implies educational and training reforms are essential. changes AS • increase domestic consumption to support growth that comes from exports. Gives more stability and balance to the economy. Multiplier effects on income and growth.
More questions on Characteristics of countries at different levels of development
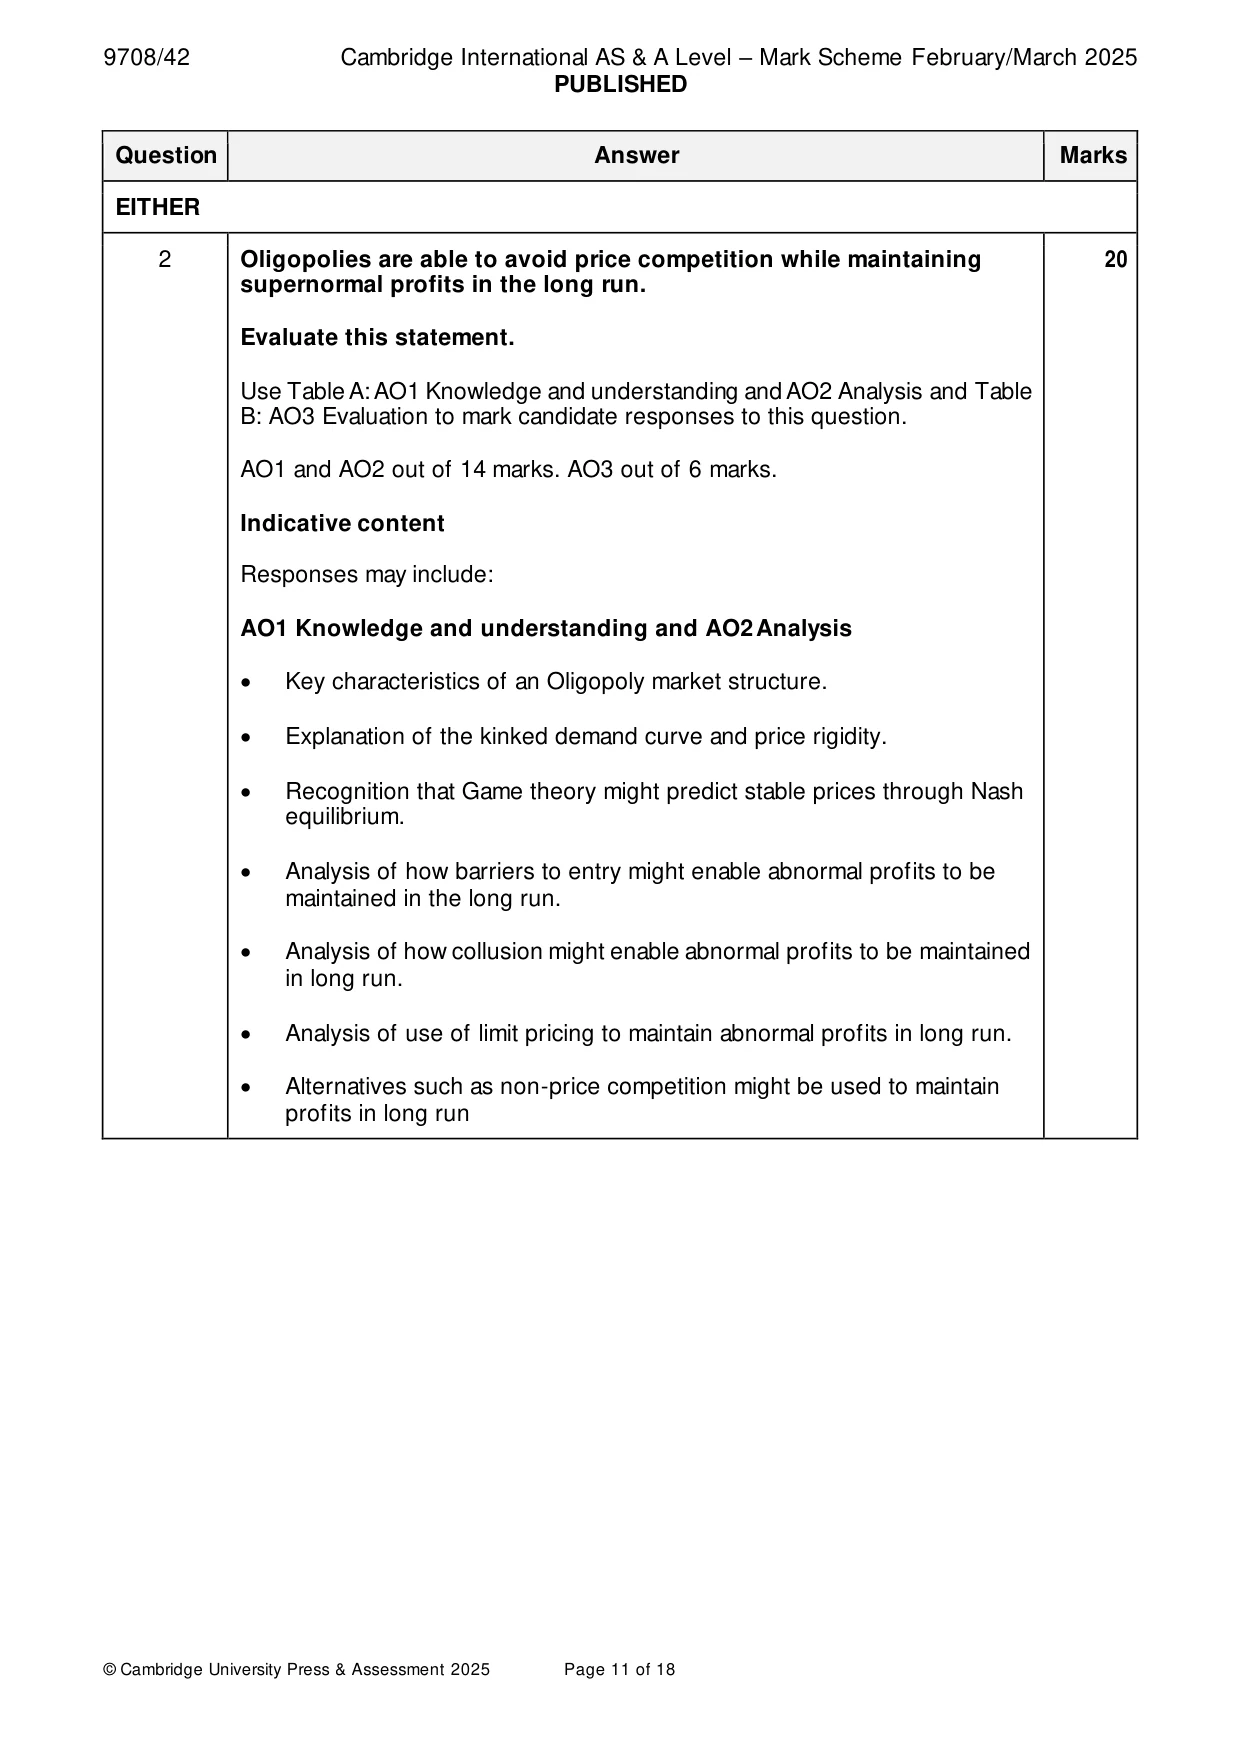
Q2 · Oligopolies are able to avoid price competition while maintaining supernormal profits in…
2 Oligopolies are able to avoid price competition while maintaining supernormal profits in the long run. Evaluate this statement. [20] OR
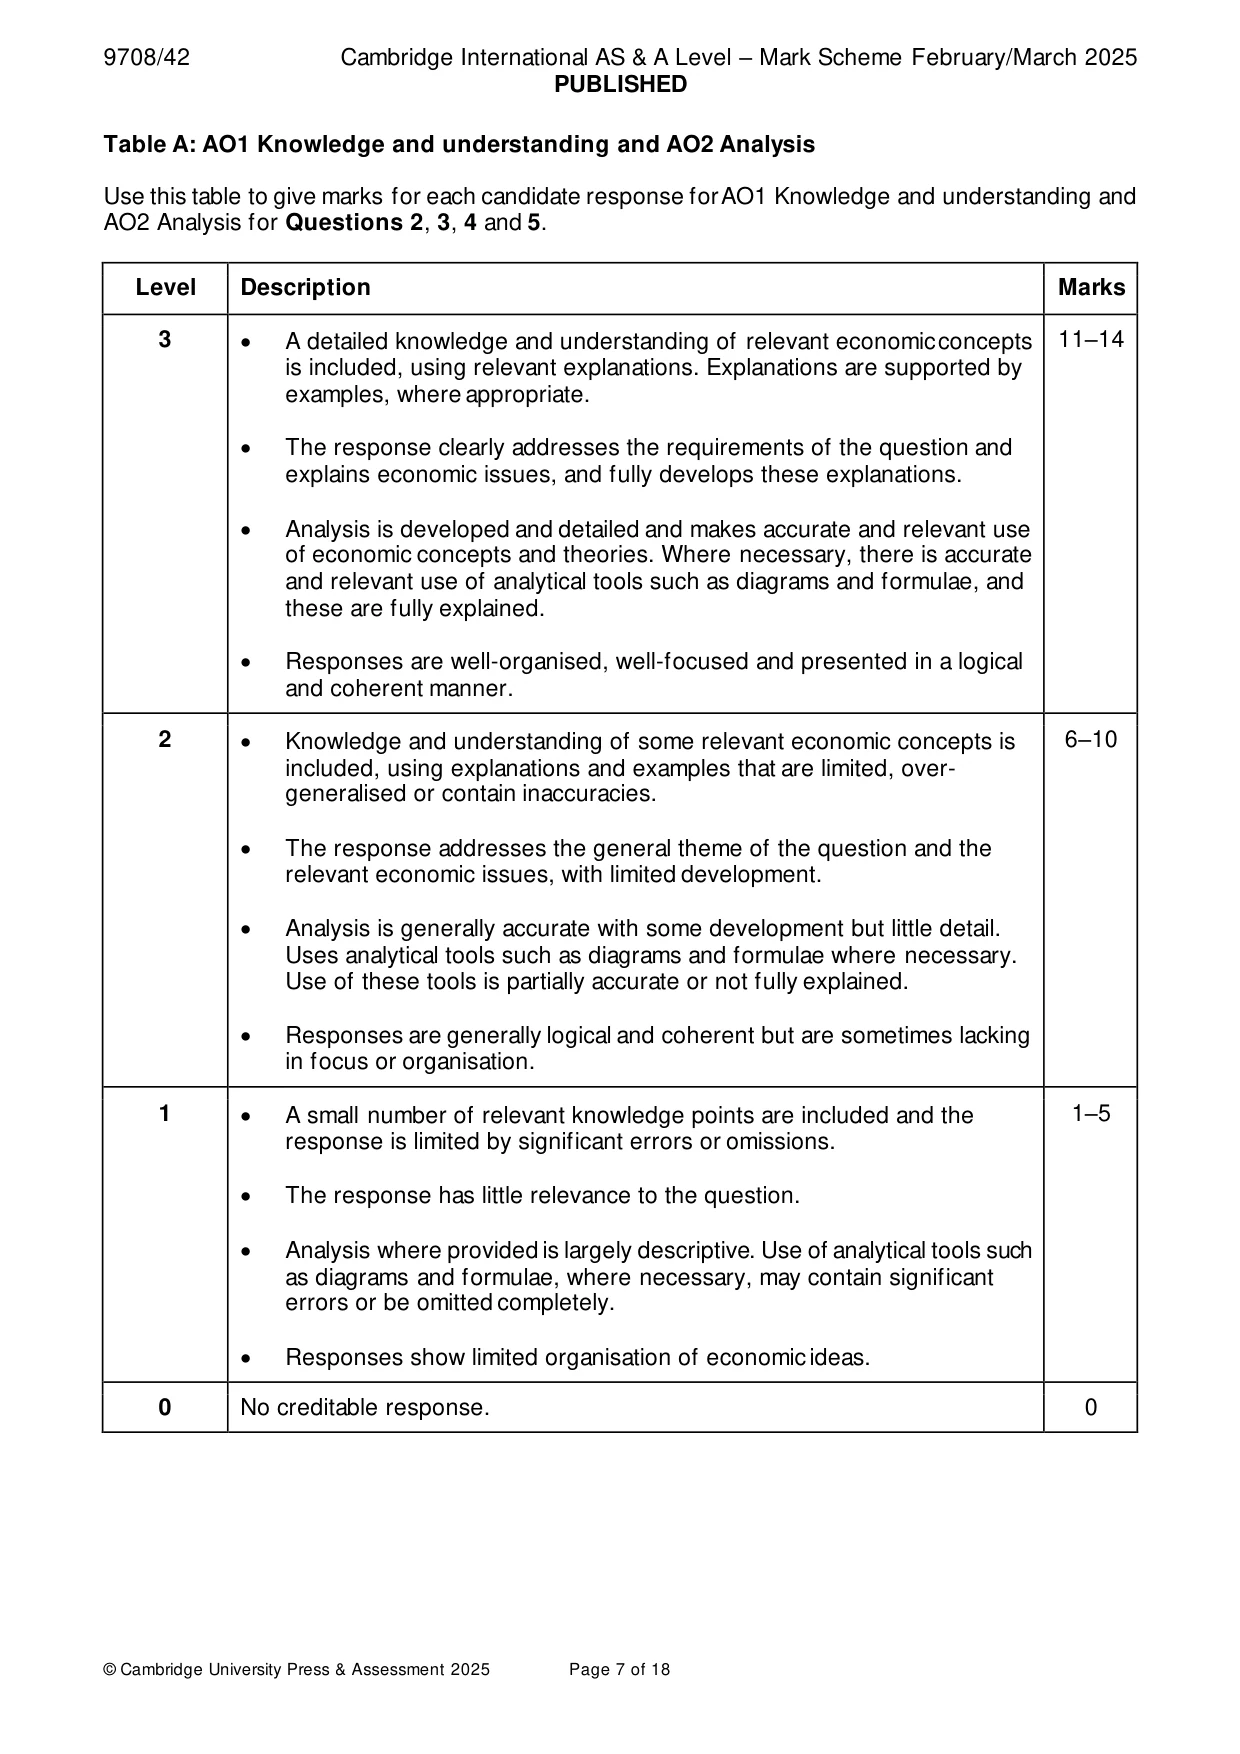
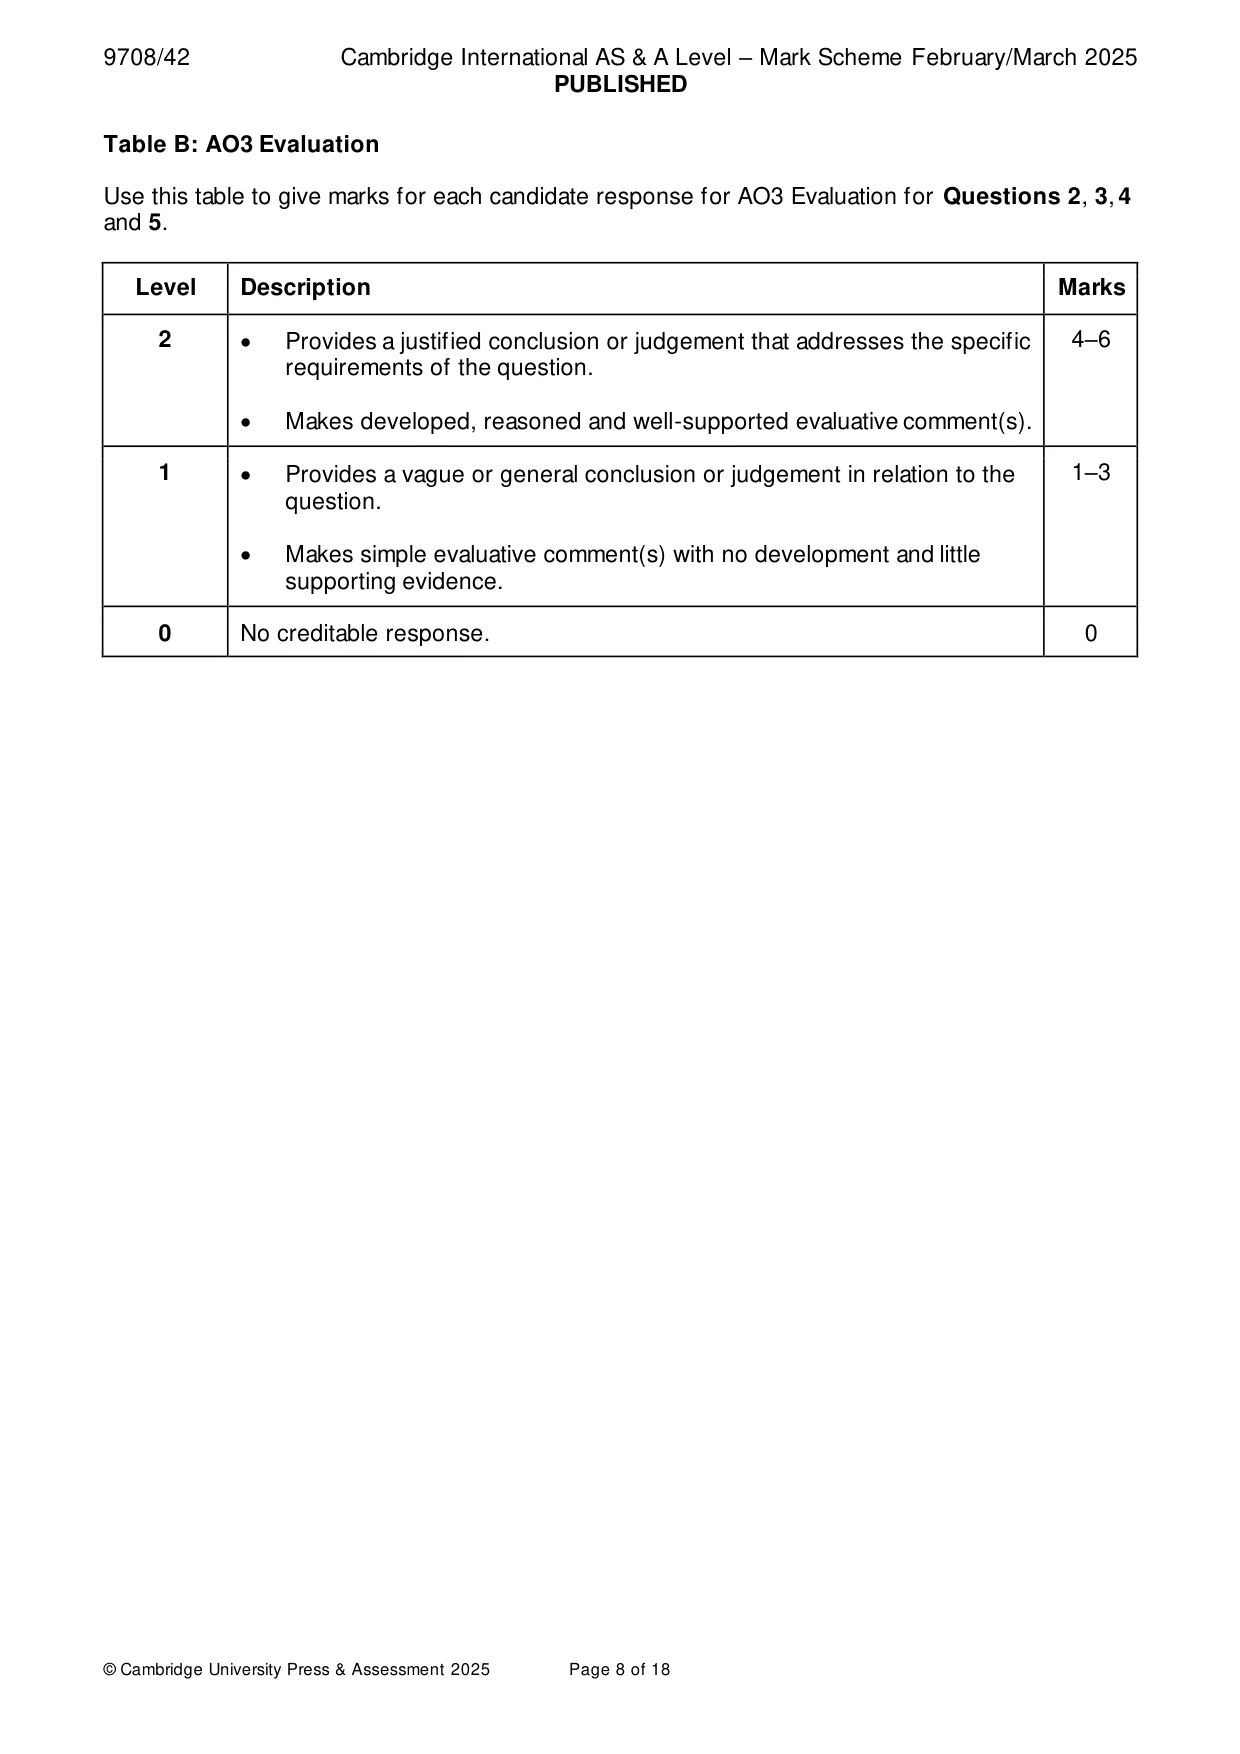
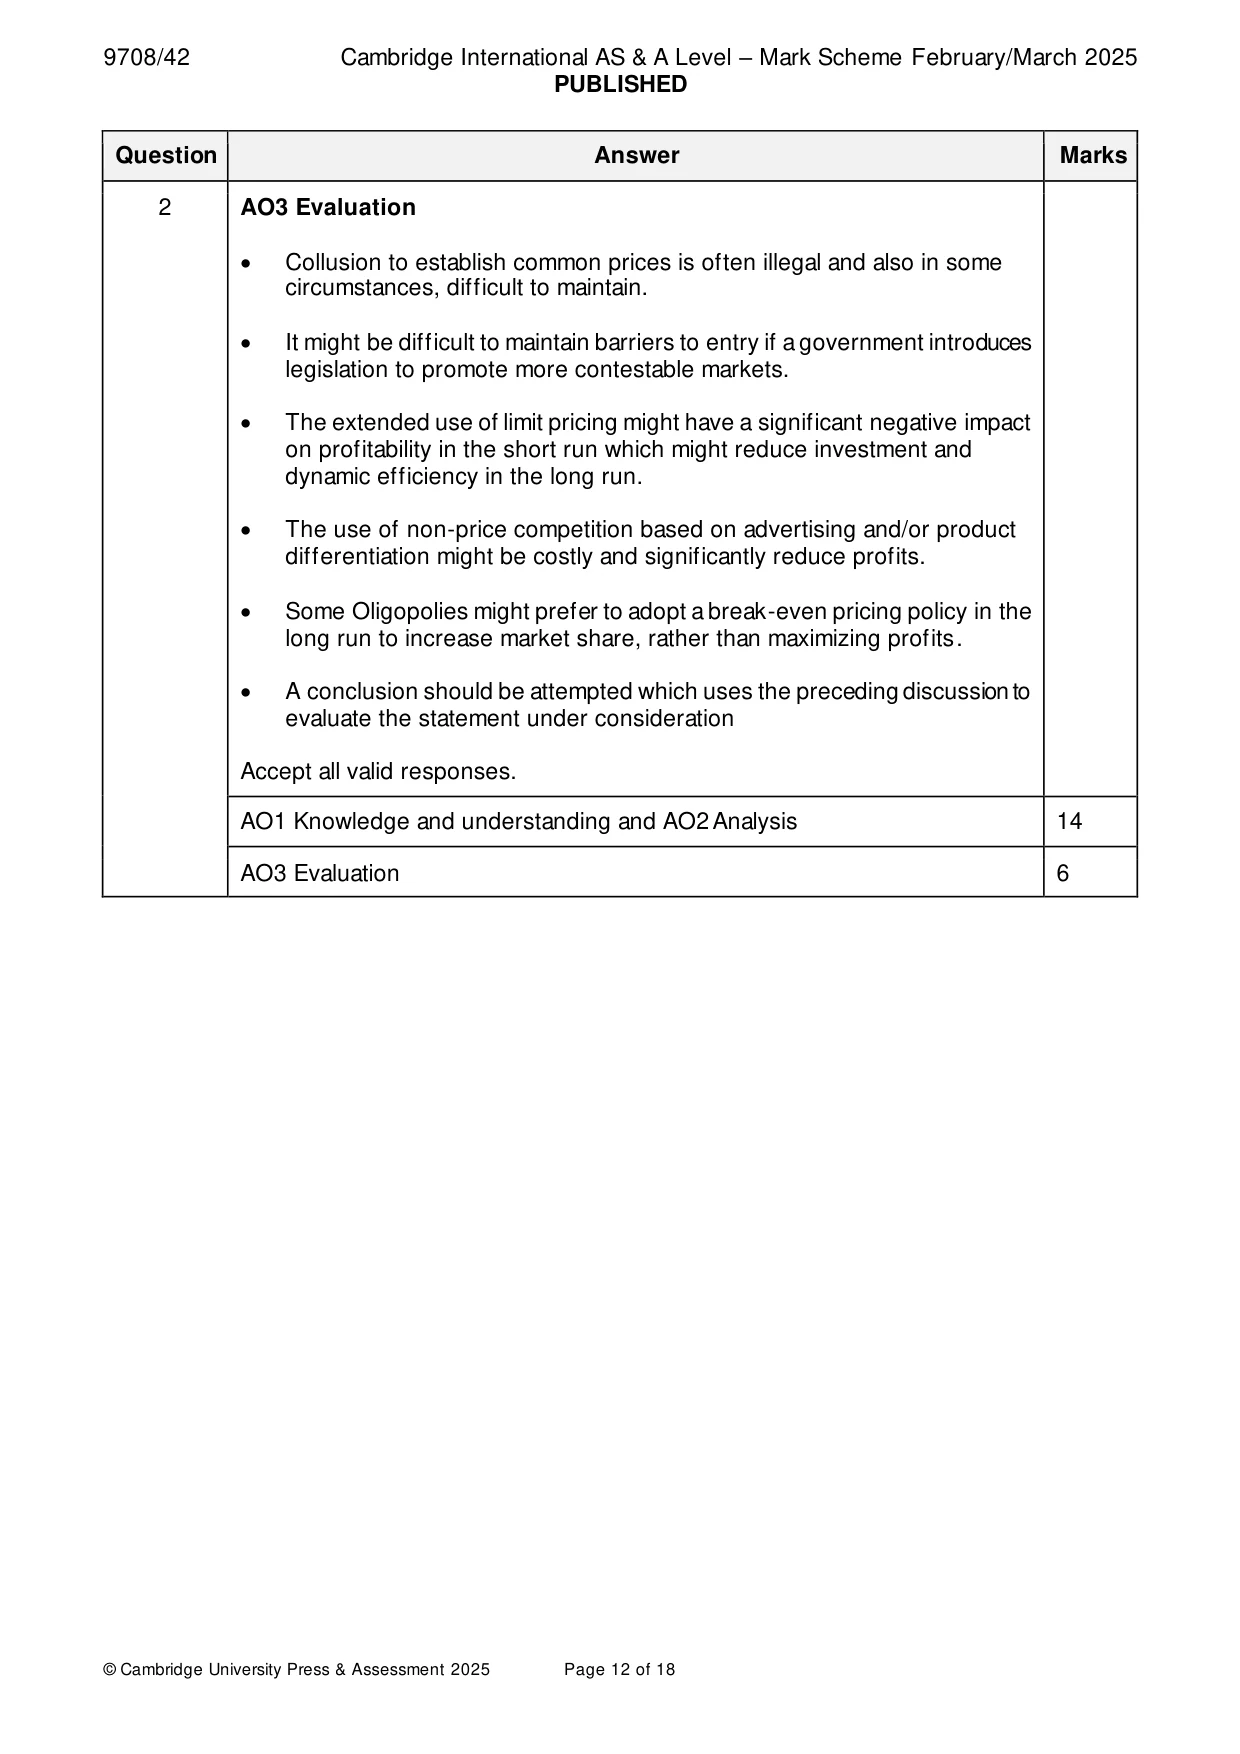
Mark scheme: 2 Oligopolies are able to avoid price competition while maintaining 20 supernormal profits in the long run. Evaluate this statement. Use Table A: AO1 Knowledge and understanding and AO2 Analysis and Table B: AO3 Evaluation to mark candidate responses to this question. AO1 and AO2 out of 14 marks. AO3 out of 6 marks. Indicative content Responses may include: AO1 Knowledge and understanding and AO2 Analysis • Key characteristics of an Oligopoly market structure. • Explanation of the kinked demand curve and price rigidity. • Recognition that Game theory might predict stable prices through Nash equilibrium. • Analysis of how barriers to entry might enable abnormal profits to be maintained in the long run. • Analysis of how collusion might enable abnormal profits to be maintained in long run. • Analysis of use of limit pricing to maintain abnormal profits in long run. • Alternatives such as non-price competition might be used to maintain profits in long run 2 AO3 Evaluation • Collusion to establish common prices is often illegal and also in some circumstances, difficult to maintain. • It might be difficult to maintain barriers to entry if a government introduces legislation to promote more contestable markets. • The extended use of limit pricing might have a significant negative impact on profitability in the short run which might reduce investment and dynamic efficiency in the long run. • The use of non-price competition based on advertising and/or product differentiation might be costly and significantly reduce profits. • Some Oligopolies might prefer to adopt a break-even pricing policy in the long run to increase market share, rather than maximizing profits. • A conclusion should be attempted which uses the preceding discussion to evaluate the statement under consideration Accept all valid responses. AO1 Knowledge and understanding and AO2 Analysis 14 AO3 Evaluation 6
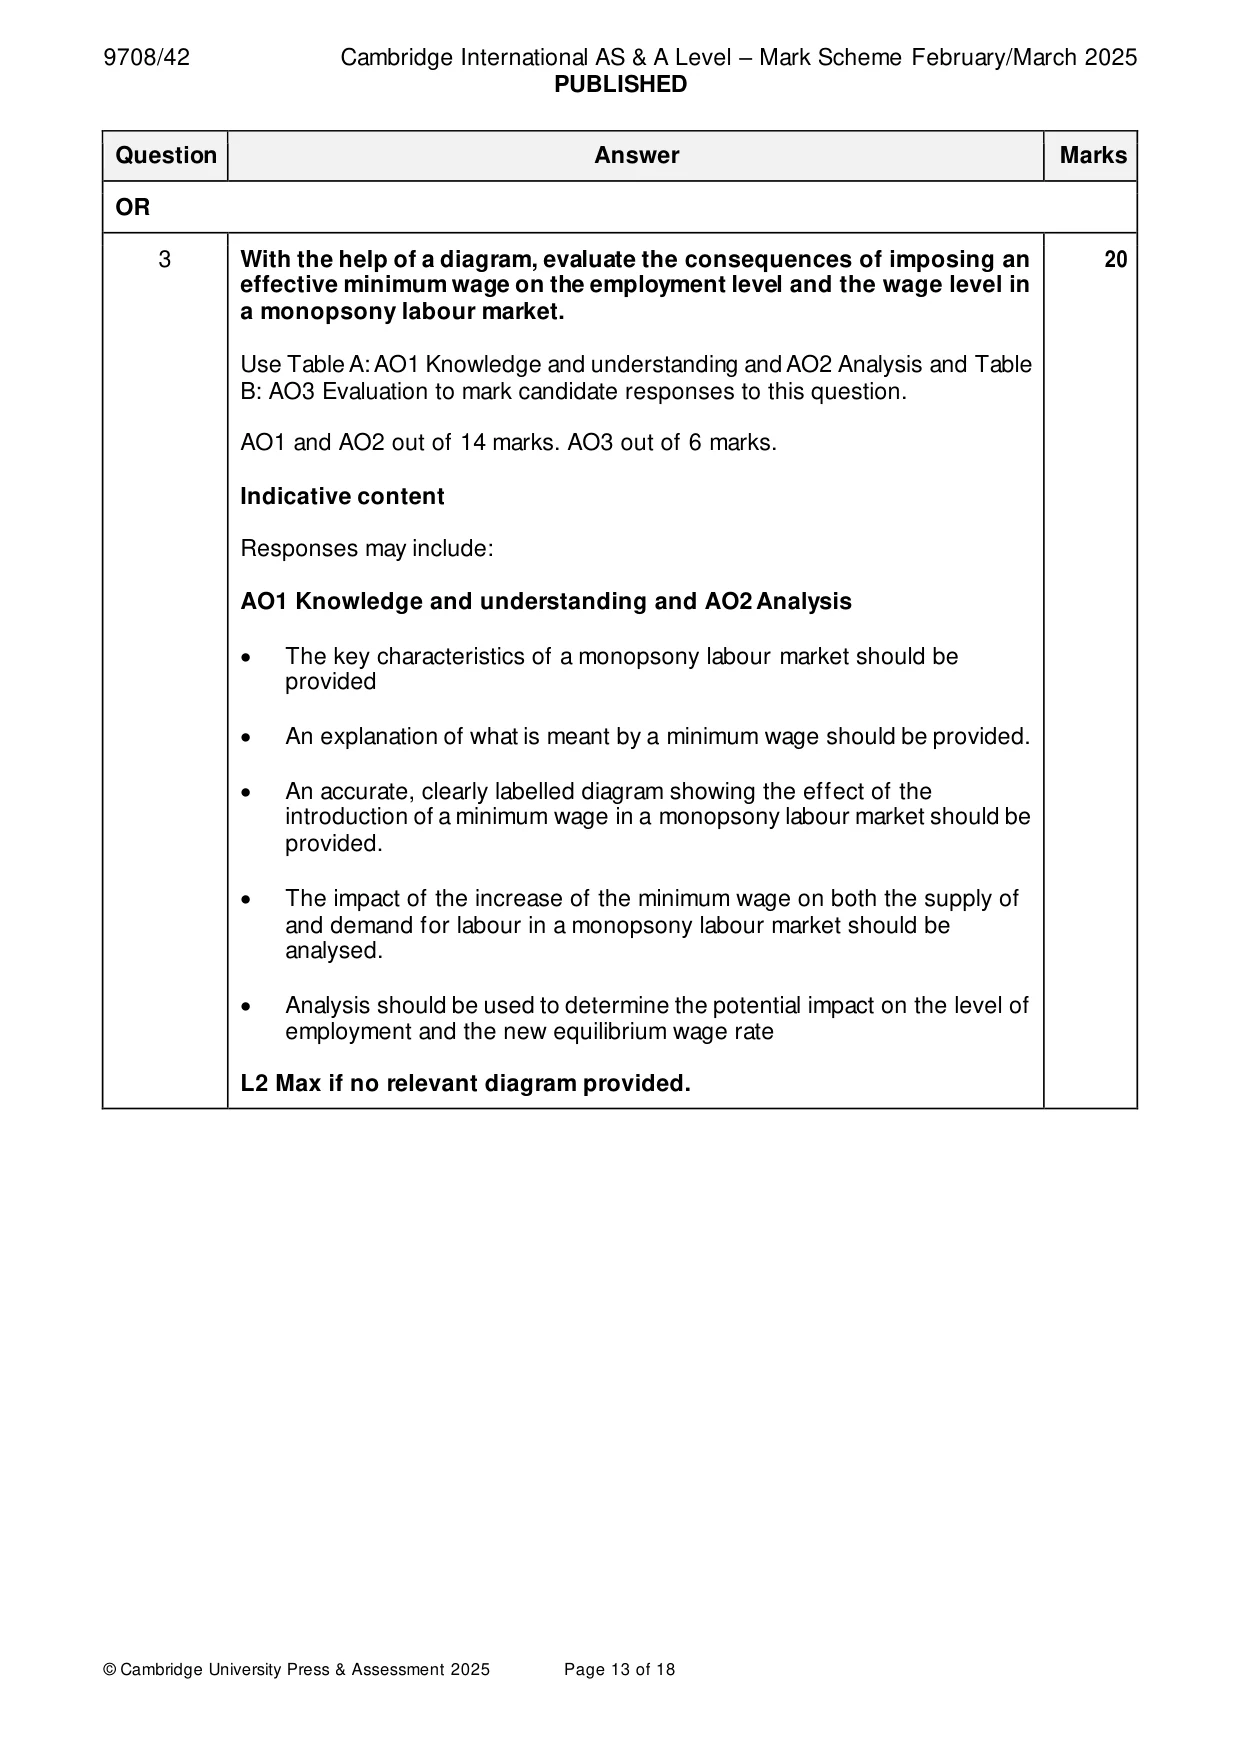
Q3 · With the help of a diagram, evaluate the consequences of imposing an effective minimum…
3 With the help of a diagram, evaluate the consequences of imposing an effective minimum wage on the employment level and the wage level in a monopsony labour market. [20] Section C Answer one question. EITHER
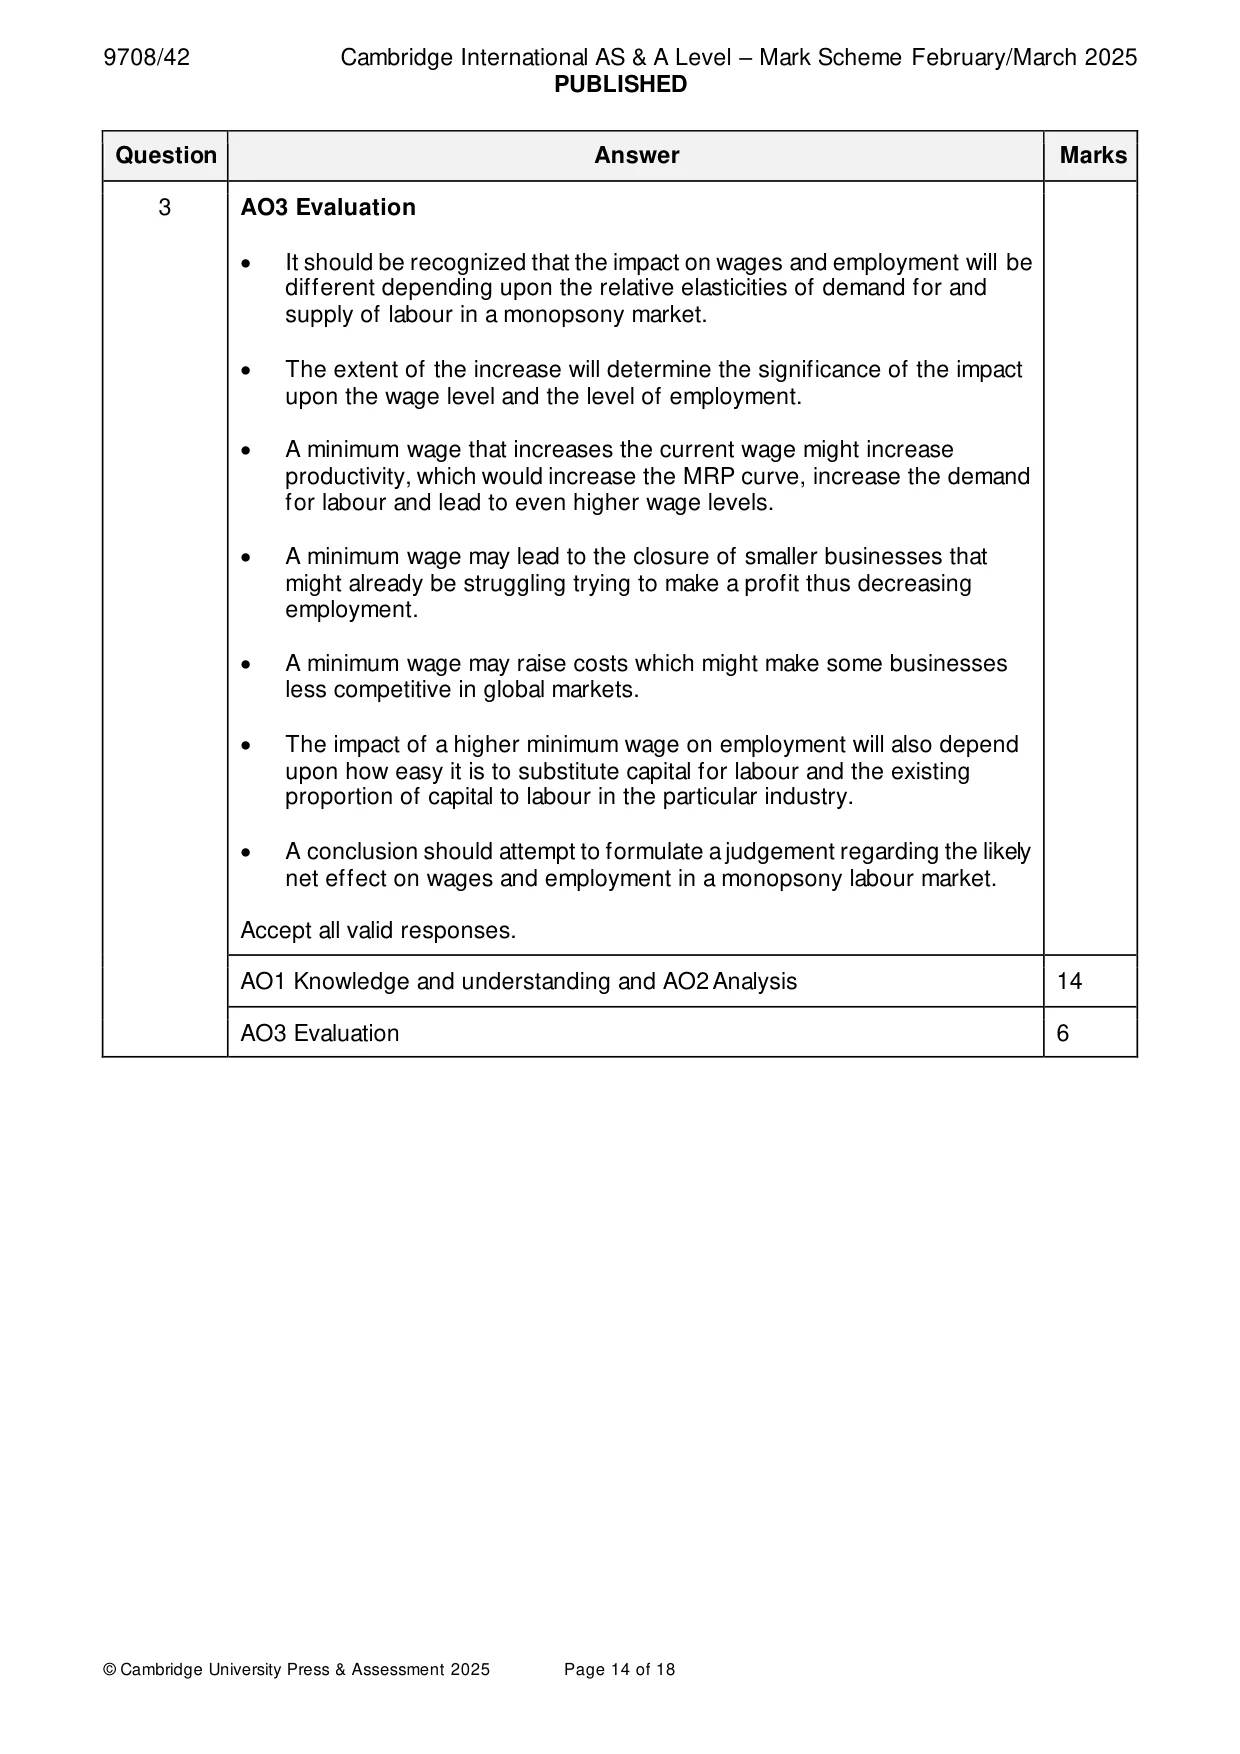
Mark scheme: 3 With the help of a diagram, evaluate the consequences of imposing an 20 effective minimum wage on the employment level and the wage level in a monopsony labour market. Use Table A: AO1 Knowledge and understanding and AO2 Analysis and Table B: AO3 Evaluation to mark candidate responses to this question. AO1 and AO2 out of 14 marks. AO3 out of 6 marks. Indicative content Responses may include: AO1 Knowledge and understanding and AO2 Analysis • The key characteristics of a monopsony labour market should be provided • An explanation of what is meant by a minimum wage should be provided. • An accurate, clearly labelled diagram showing the effect of the introduction of a minimum wage in a monopsony labour market should be provided. • The impact of the increase of the minimum wage on both the supply of and demand for labour in a monopsony labour market should be analysed. • Analysis should be used to determine the potential impact on the level of employment and the new equilibrium wage rate L2 Max if no relevant diagram provided. 3 AO3 Evaluation • It should be recognized that the impact on wages and employment will be different depending upon the relative elasticities of demand for and supply of labour in a monopsony market. • The extent of the increase will determine the significance of the impact upon the wage level and the level of employment. • A minimum wage that increases the current wage might increase productivity, which would increase the MRP curve, increase the demand for labour and lead to even higher wage levels. • A minimum wage may lead to the closure of smaller businesses that might already be struggling trying to make a profit thus decreasing employment. • A minimum wage may raise costs which might make some businesses less competitive in global markets. • The impact of a higher minimum wage on employment will also depend upon how easy it is to substitute capital for labour and the existing proportion of capital to labour in the particular industry. • A conclusion should attempt to formulate a judgement regarding the likely net effect on wages and employment in a monopsony labour market. Accept all valid responses. AO1 Knowledge and understanding and AO2 Analysis 14 AO3 Evaluation 6
More questions on Labour market forces and government intervention
Q4 · With the help of a diagram, assess the effectiveness of government policies that might be…
4 With the help of a diagram, assess the effectiveness of government policies that might be used to reduce demand-pull inflation. [20] OR
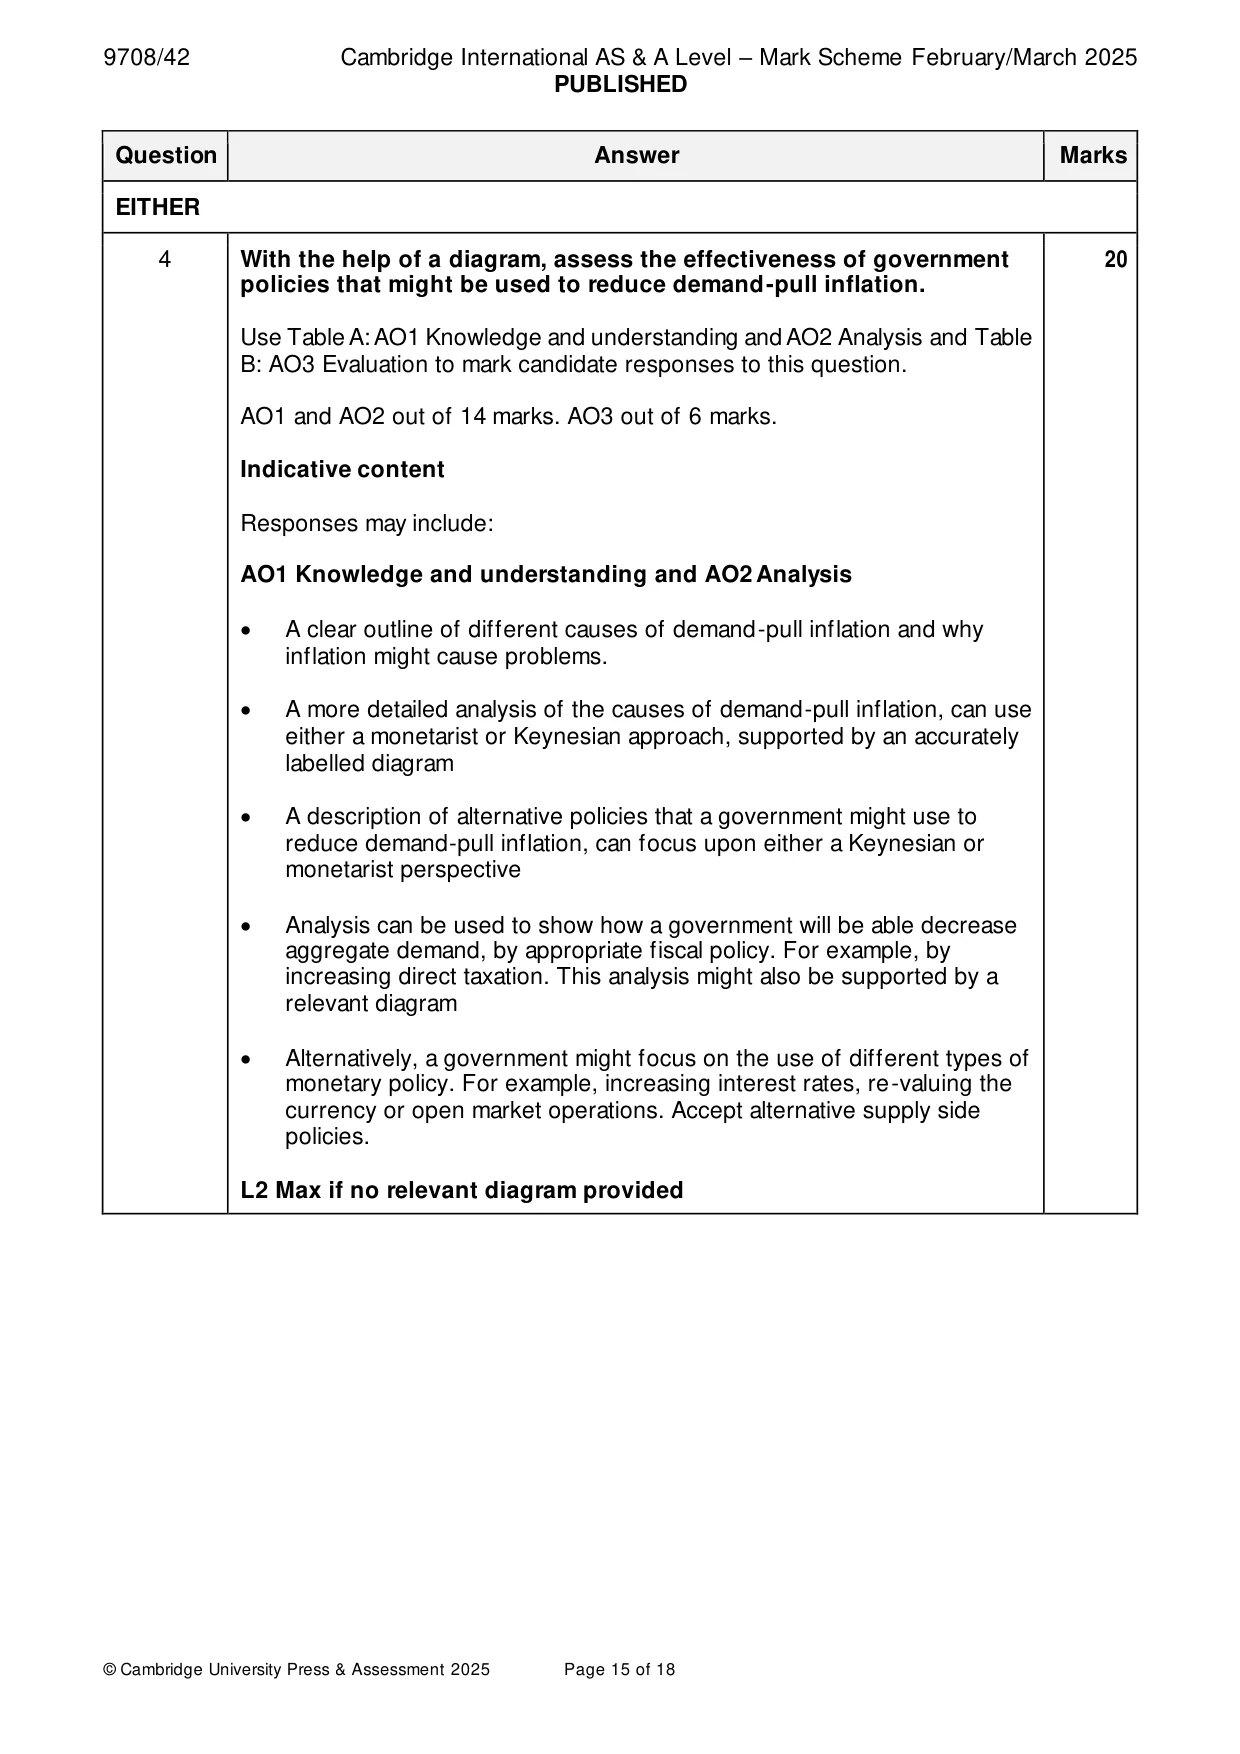
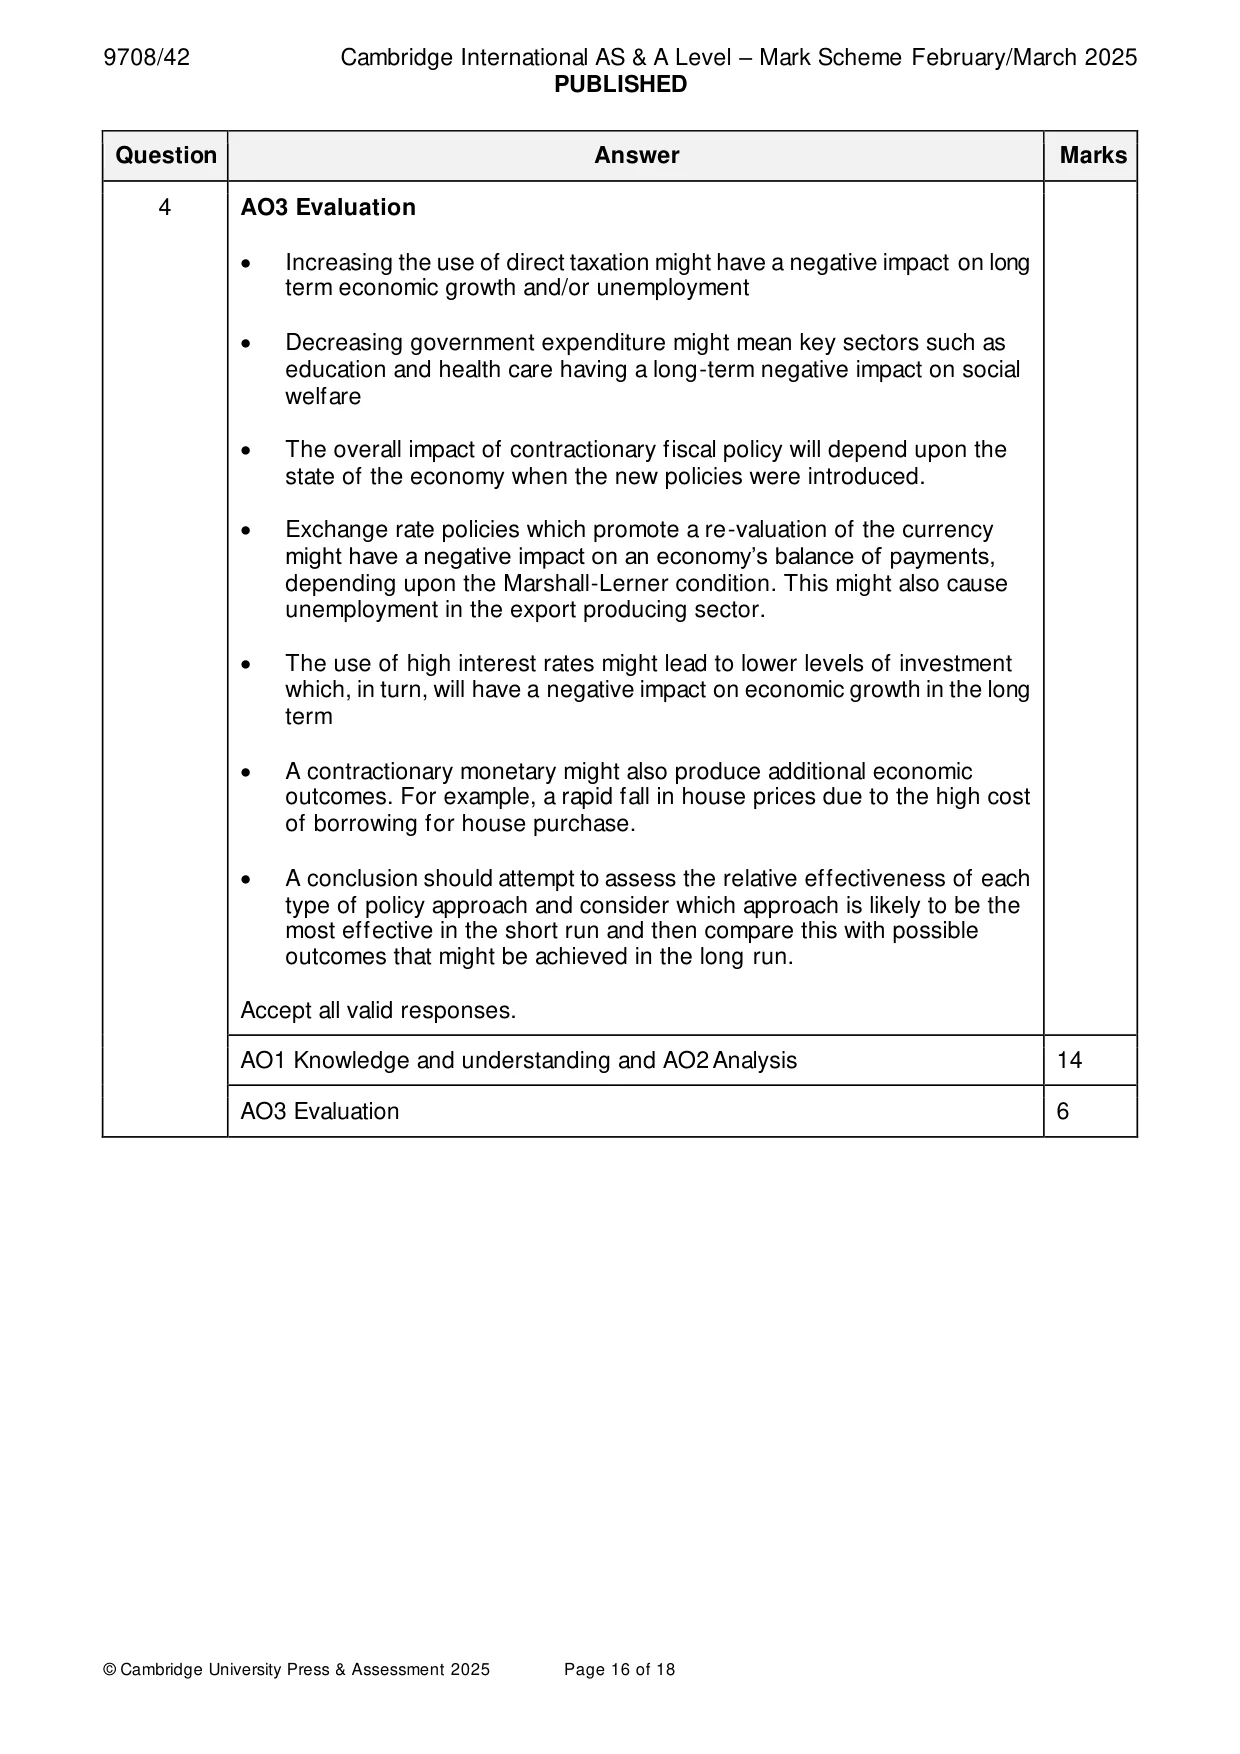
Mark scheme: 4 With the help of a diagram, assess the effectiveness of government 20 policies that might be used to reduce demand-pull inflation. Use Table A: AO1 Knowledge and understanding and AO2 Analysis and Table B: AO3 Evaluation to mark candidate responses to this question. AO1 and AO2 out of 14 marks. AO3 out of 6 marks. Indicative content Responses may include: AO1 Knowledge and understanding and AO2 Analysis • A clear outline of different causes of demand-pull inflation and why inflation might cause problems. • A more detailed analysis of the causes of demand-pull inflation, can use either a monetarist or Keynesian approach, supported by an accurately labelled diagram • A description of alternative policies that a government might use to reduce demand-pull inflation, can focus upon either a Keynesian or monetarist perspective • Analysis can be used to show how a government will be able decrease aggregate demand, by appropriate fiscal policy. For example, by increasing direct taxation. This analysis might also be supported by a relevant diagram • Alternatively, a government might focus on the use of different types of monetary policy. For example, increasing interest rates, re-valuing the currency or open market operations. Accept alternative supply side policies. L2 Max if no relevant diagram provided 4 AO3 Evaluation • Increasing the use of direct taxation might have a negative impact on long term economic growth and/or unemployment • Decreasing government expenditure might mean key sectors such as education and health care having a long-term negative impact on social welfare • The overall impact of contractionary fiscal policy will depend upon the state of the economy when the new policies were introduced. • Exchange rate policies which promote a re-valuation of the currency might have a negative impact on an economy’s balance of payments, depending upon the Marshall-Lerner condition. This might also cause unemployment in the export producing sector. • The use of high interest rates might lead to lower levels of investment which, in turn, will have a negative impact on economic growth in the long term • A contractionary monetary might also produce additional economic outcomes. For example, a rapid fall in house prices due to the high cost of borrowing for house purchase. • A conclusion should attempt to assess the relative effectiveness of each type of policy approach and consider which approach is likely to be the most effective in the short run and then compare this with possible outcomes that might be achieved in the long run. Accept all valid responses. AO1 Knowledge and understanding and AO2 Analysis 14 AO3 Evaluation 6
More questions on Effectiveness of policy options to meet all macroeconomic objectives
Q5 · With the help of a diagram, evaluate the effectiveness of the use of…
5 With the help of a diagram, evaluate the effectiveness of the use of expenditure-switching policies to reduce a current account deficit on the balance of payments. [20]
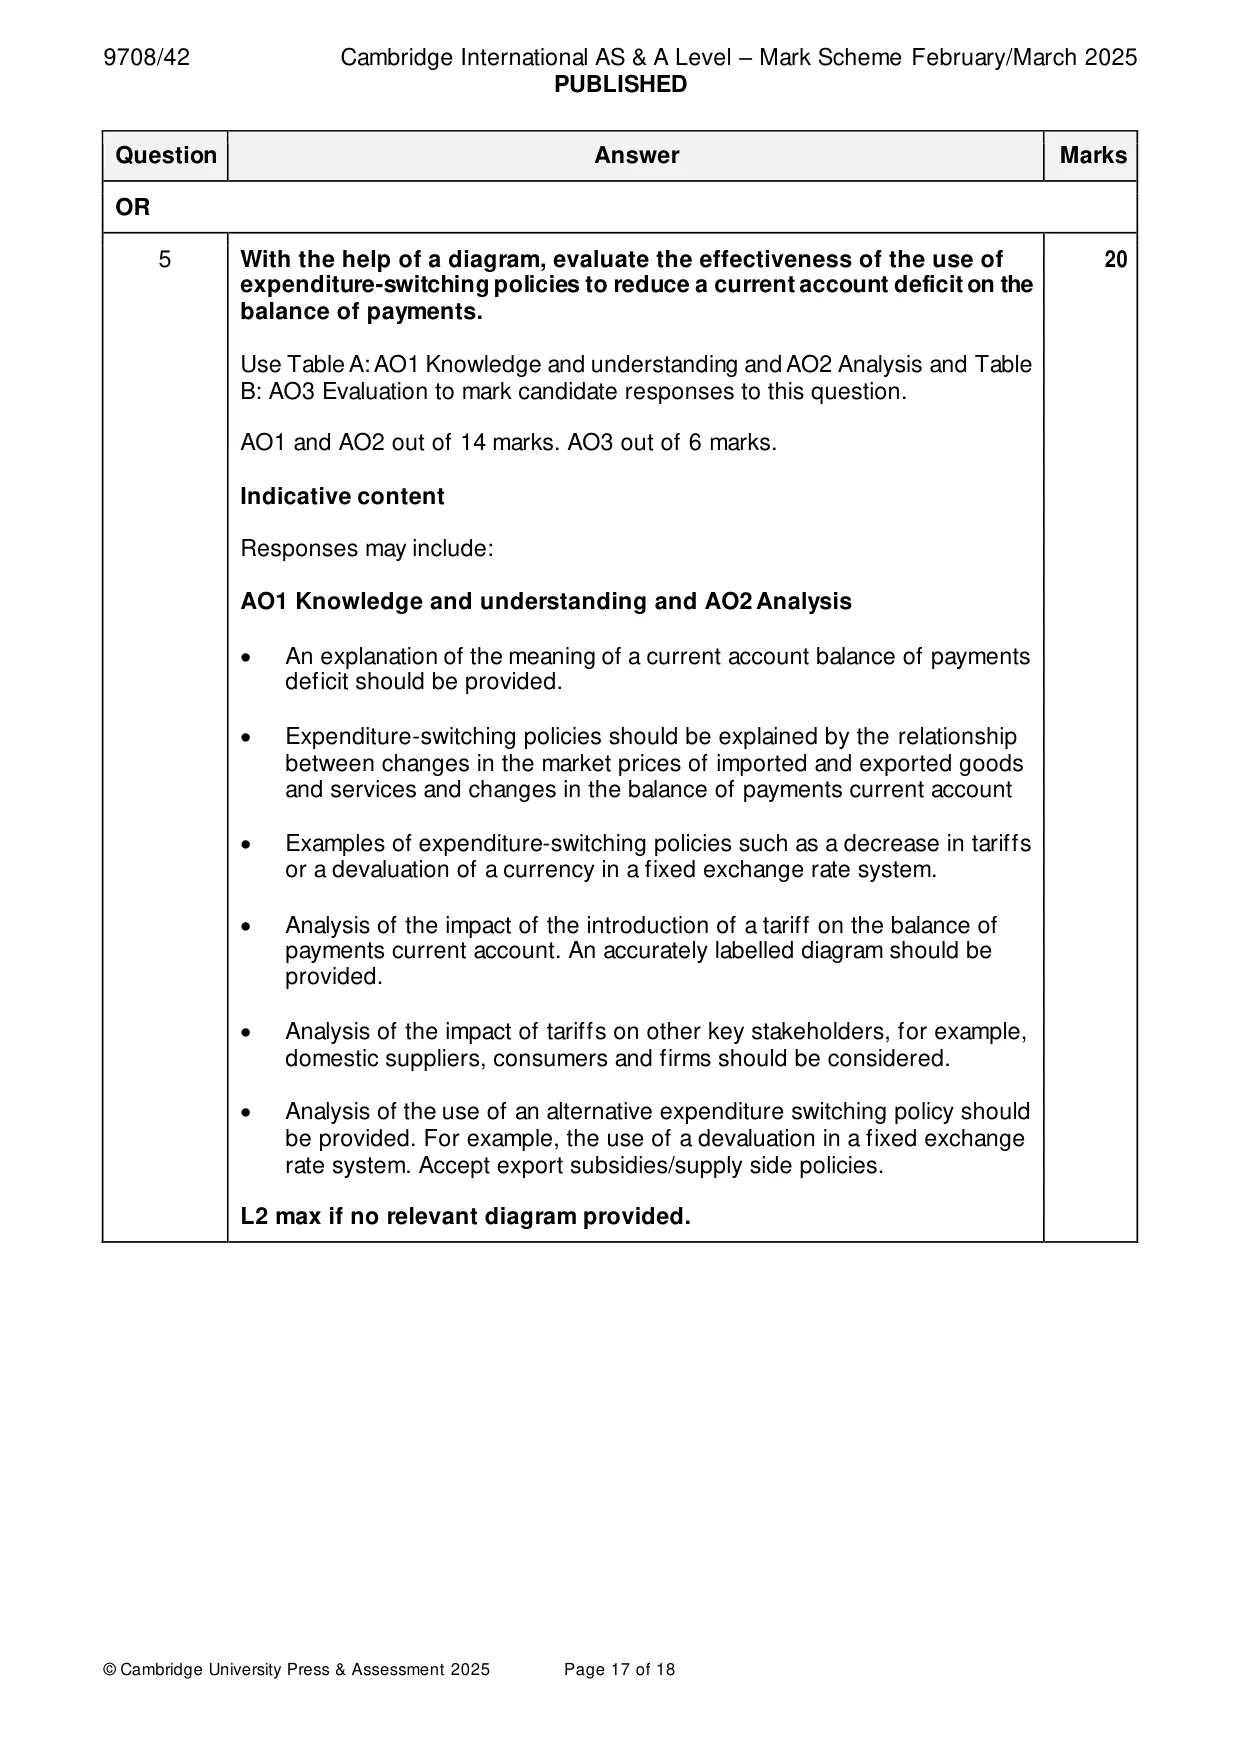
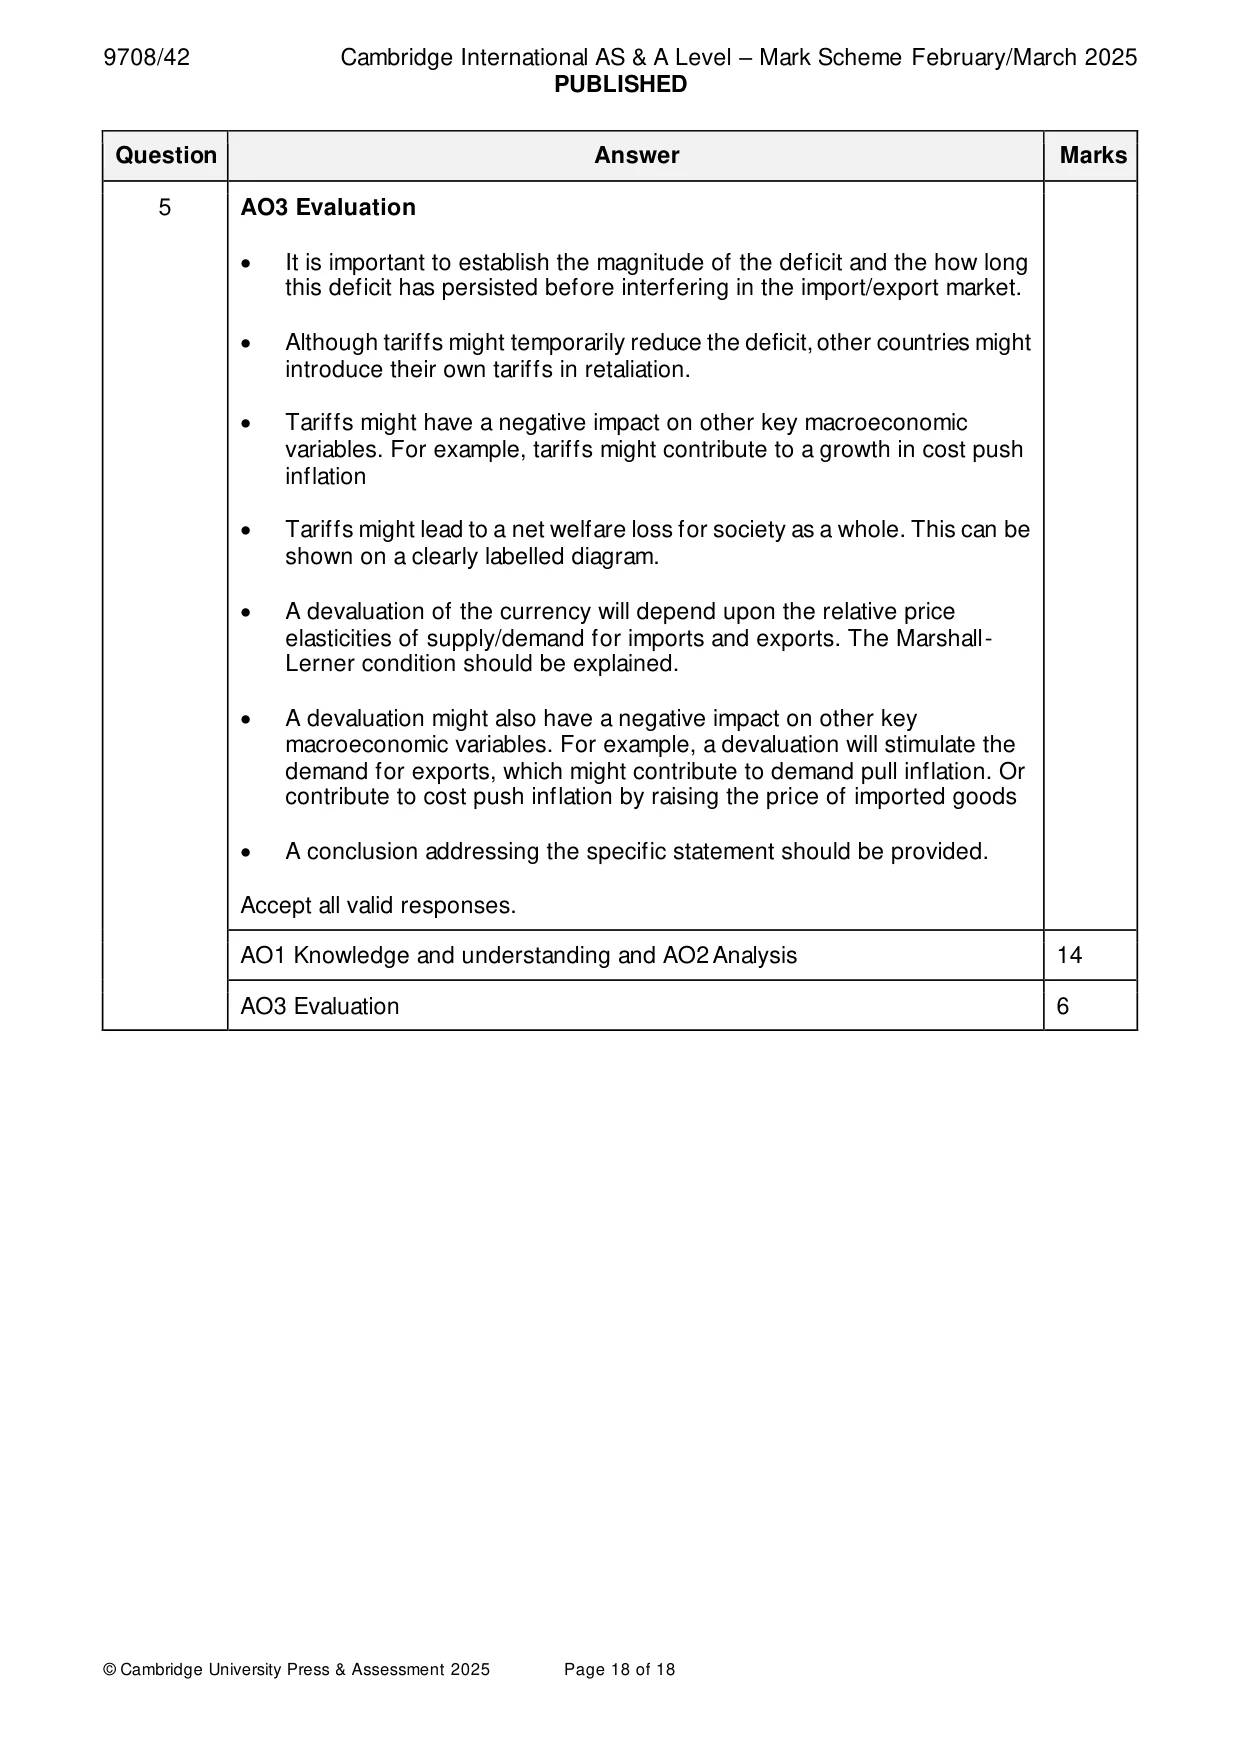
Mark scheme: 5 With the help of a diagram, evaluate the effectiveness of the use of 20 expenditure-switching policies to reduce a current account deficit on the balance of payments. Use Table A: AO1 Knowledge and understanding and AO2 Analysis and Table B: AO3 Evaluation to mark candidate responses to this question. AO1 and AO2 out of 14 marks. AO3 out of 6 marks. Indicative content Responses may include: AO1 Knowledge and understanding and AO2 Analysis • An explanation of the meaning of a current account balance of payments deficit should be provided. • Expenditure-switching policies should be explained by the relationship between changes in the market prices of imported and exported goods and services and changes in the balance of payments current account • Examples of expenditure-switching policies such as a decrease in tariffs or a devaluation of a currency in a fixed exchange rate system. • Analysis of the impact of the introduction of a tariff on the balance of payments current account. An accurately labelled diagram should be provided. • Analysis of the impact of tariffs on other key stakeholders, for example, domestic suppliers, consumers and firms should be considered. • Analysis of the use of an alternative expenditure switching policy should be provided. For example, the use of a devaluation in a fixed exchange rate system. Accept export subsidies/supply side policies. L2 max if no relevant diagram provided. 5 AO3 Evaluation • It is important to establish the magnitude of the deficit and the how long this deficit has persisted before interfering in the import/export market. • Although tariffs might temporarily reduce the deficit, other countries might introduce their own tariffs in retaliation. • Tariffs might have a negative impact on other key macroeconomic variables. For example, tariffs might contribute to a growth in cost push inflation • Tariffs might lead to a net welfare loss for society as a whole. This can be shown on a clearly labelled diagram. • A devaluation of the currency will depend upon the relative price elasticities of supply/demand for imports and exports. The Marshall- Lerner condition should be explained. • A devaluation might also have a negative impact on other key macroeconomic variables. For example, a devaluation will stimulate the demand for exports, which might contribute to demand pull inflation. Or contribute to cost push inflation by raising the price of imported goods • A conclusion addressing the specific statement should be provided. Accept all valid responses. AO1 Knowledge and understanding and AO2 Analysis 14 AO3 Evaluation 6
More questions on Policies to correct imbalances in the current account of the balance of payments
What was in this paper
The subtopics covered by these 5 questions, and how many questions each got. Open one in a new tab to see every Cambridge question on it.
What you needed in this session
Cambridge’s own grade thresholds for 2025 Feb/March, Paper 4 · Variant 2. A higher threshold means an easier paper — the bar moves with how the cohort did.