Cambridge A Level Economics 9708 — 2025 Oct/Nov Paper 4 · Variant 3
9708/43/O/N/25 · 5 questions · 60 marks · ≈68 min
The question paper and its mark scheme, free to read here and free to download. This is Cambridge’s own paper, exactly as it was sat.
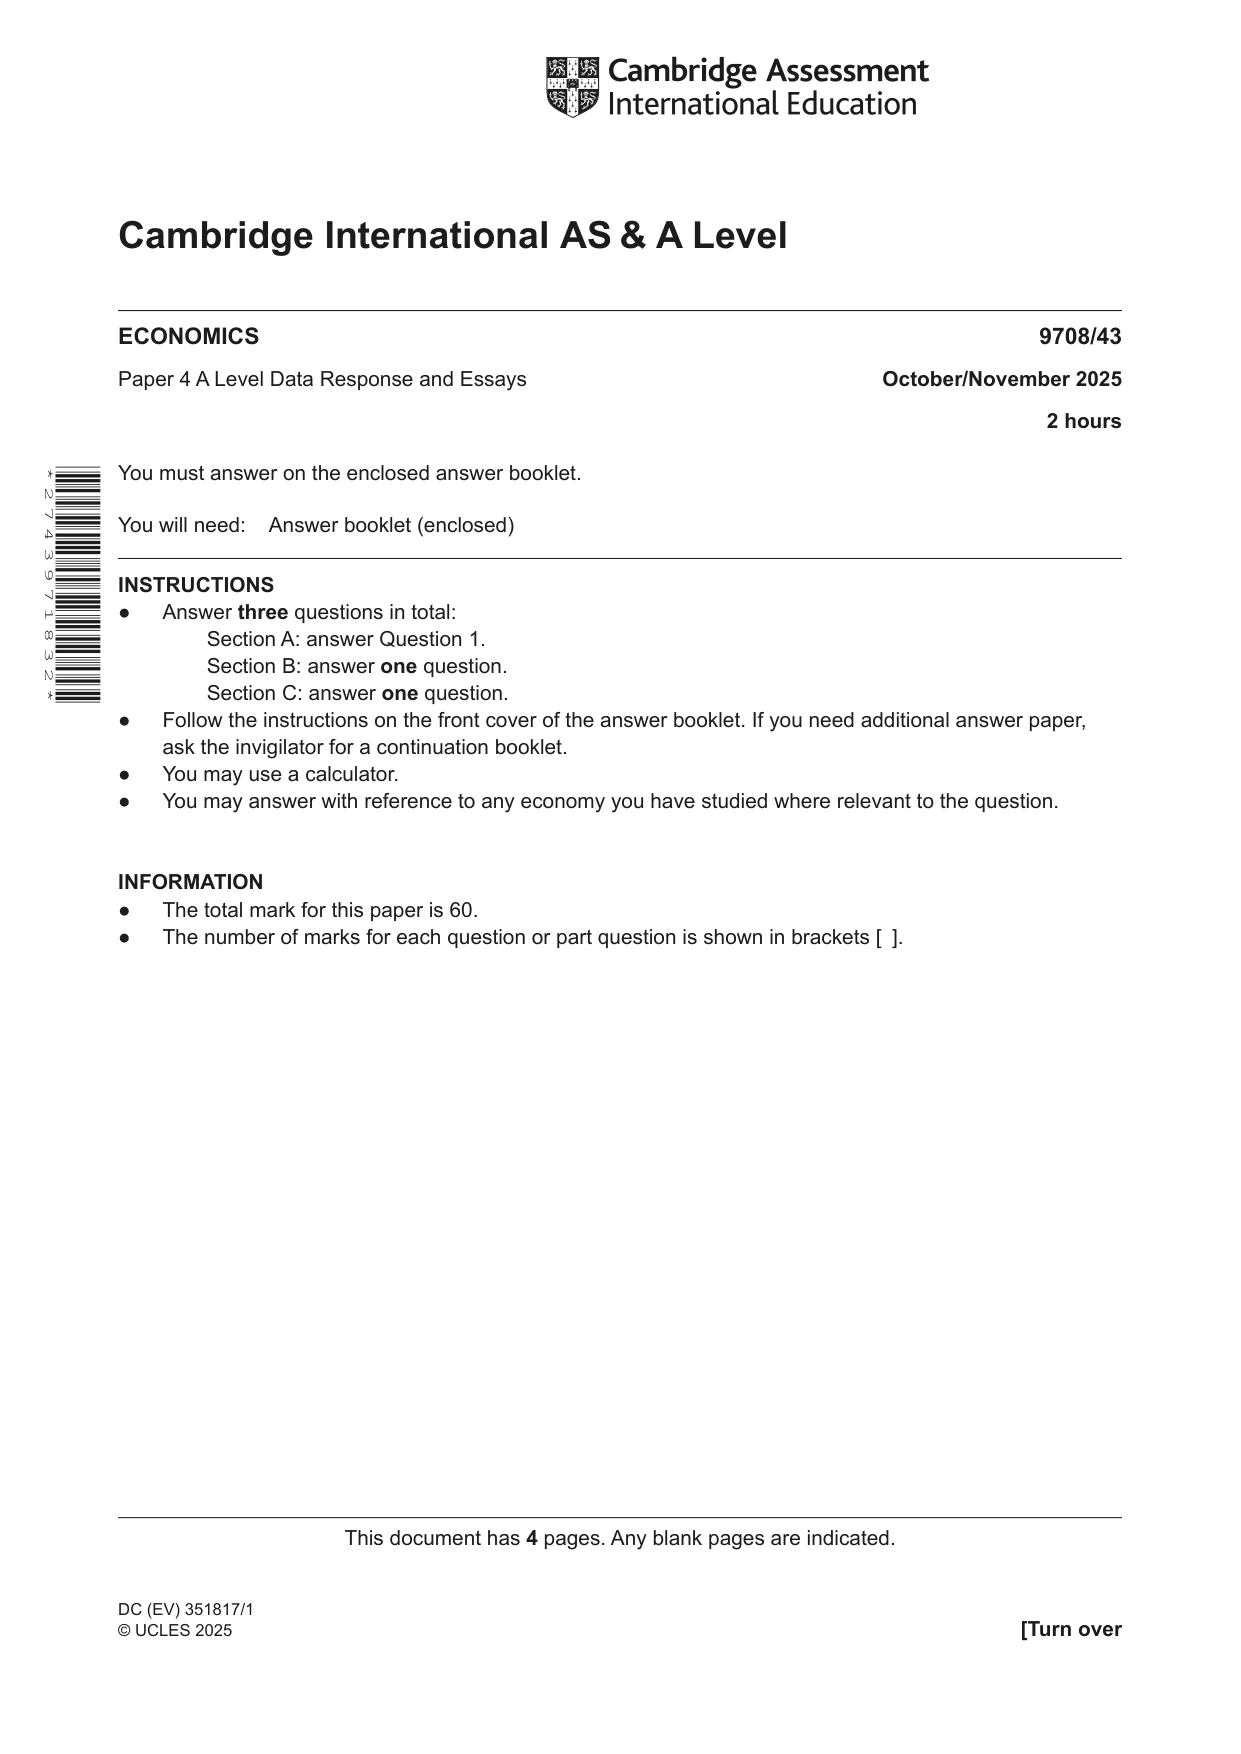
Question paper4 pages
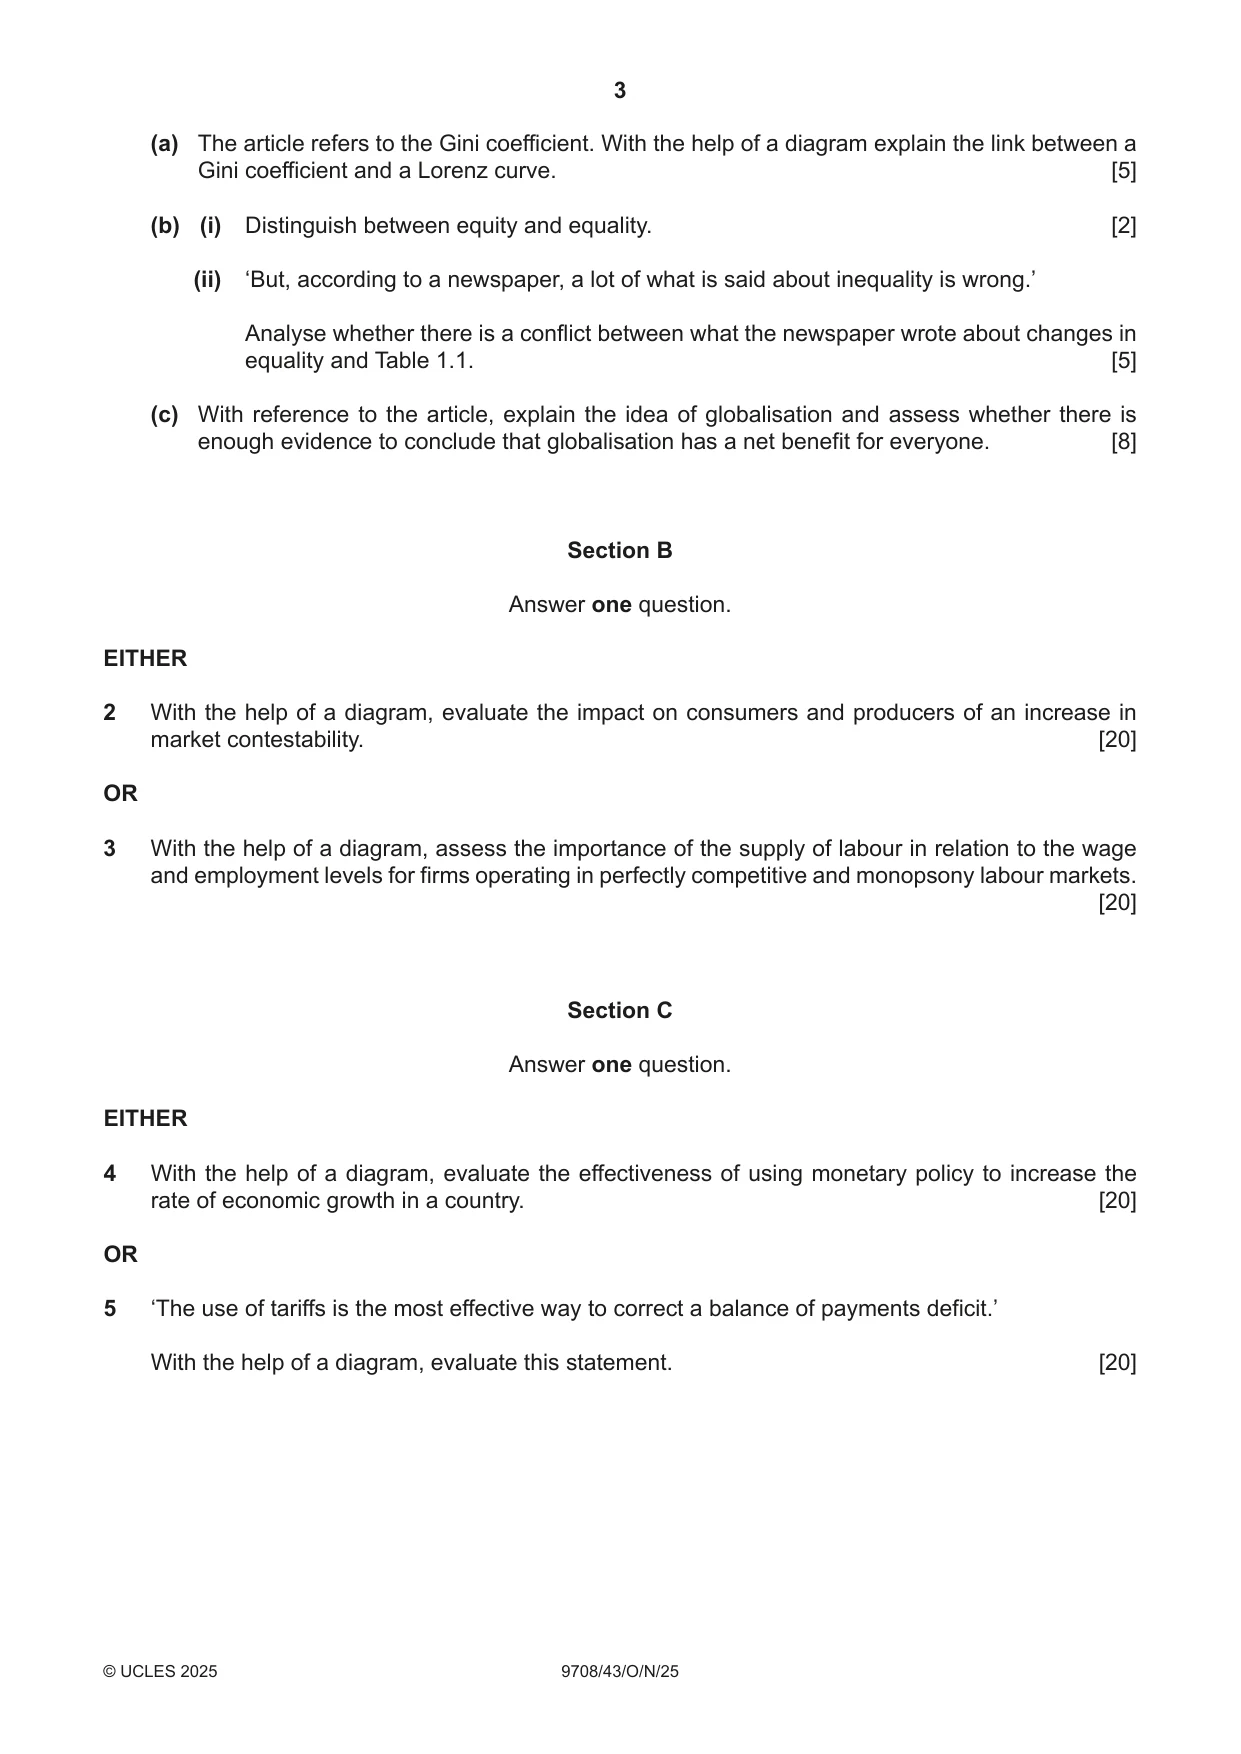

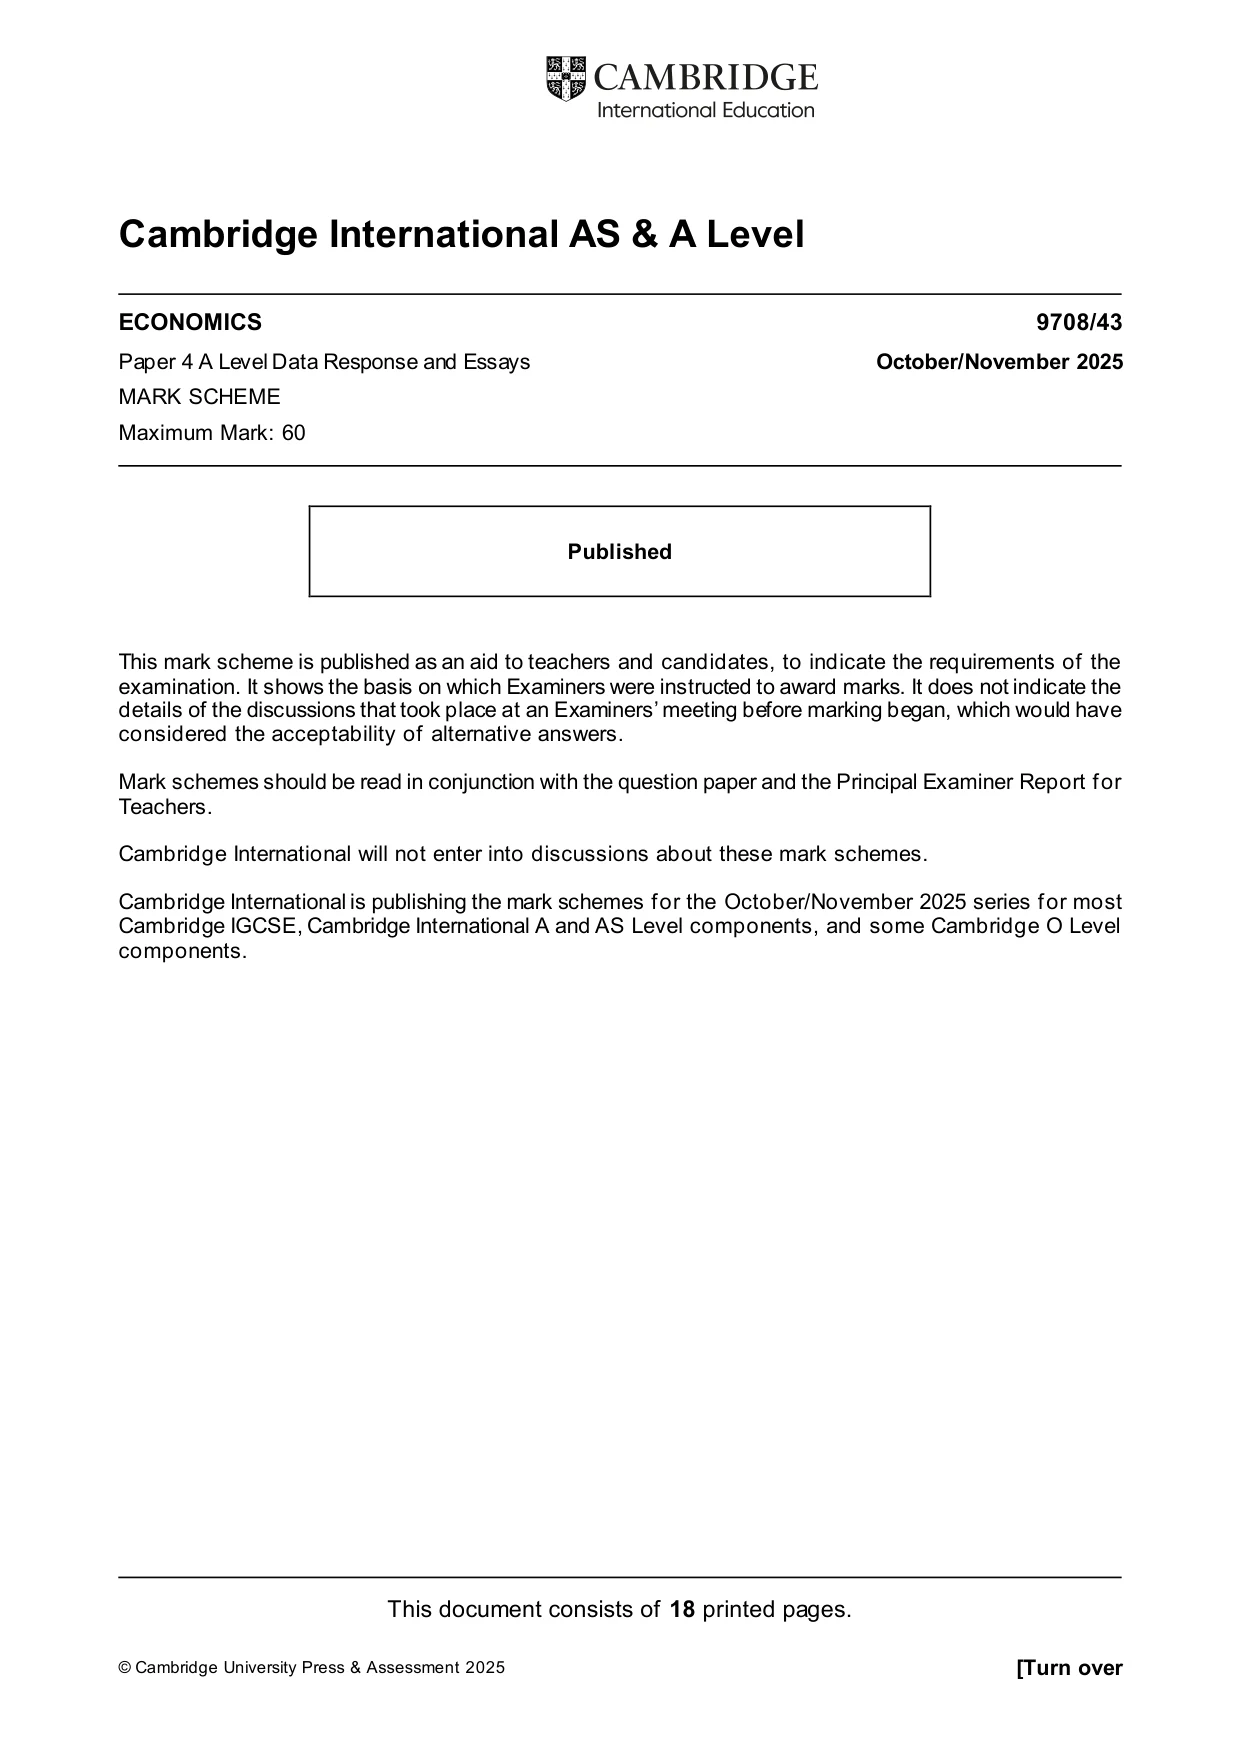
Mark scheme18 pages
Answers below. Sit the paper first if you are practising.
Questions as text
Q1 · Inequality and globalisation A government commission published a report saying that…
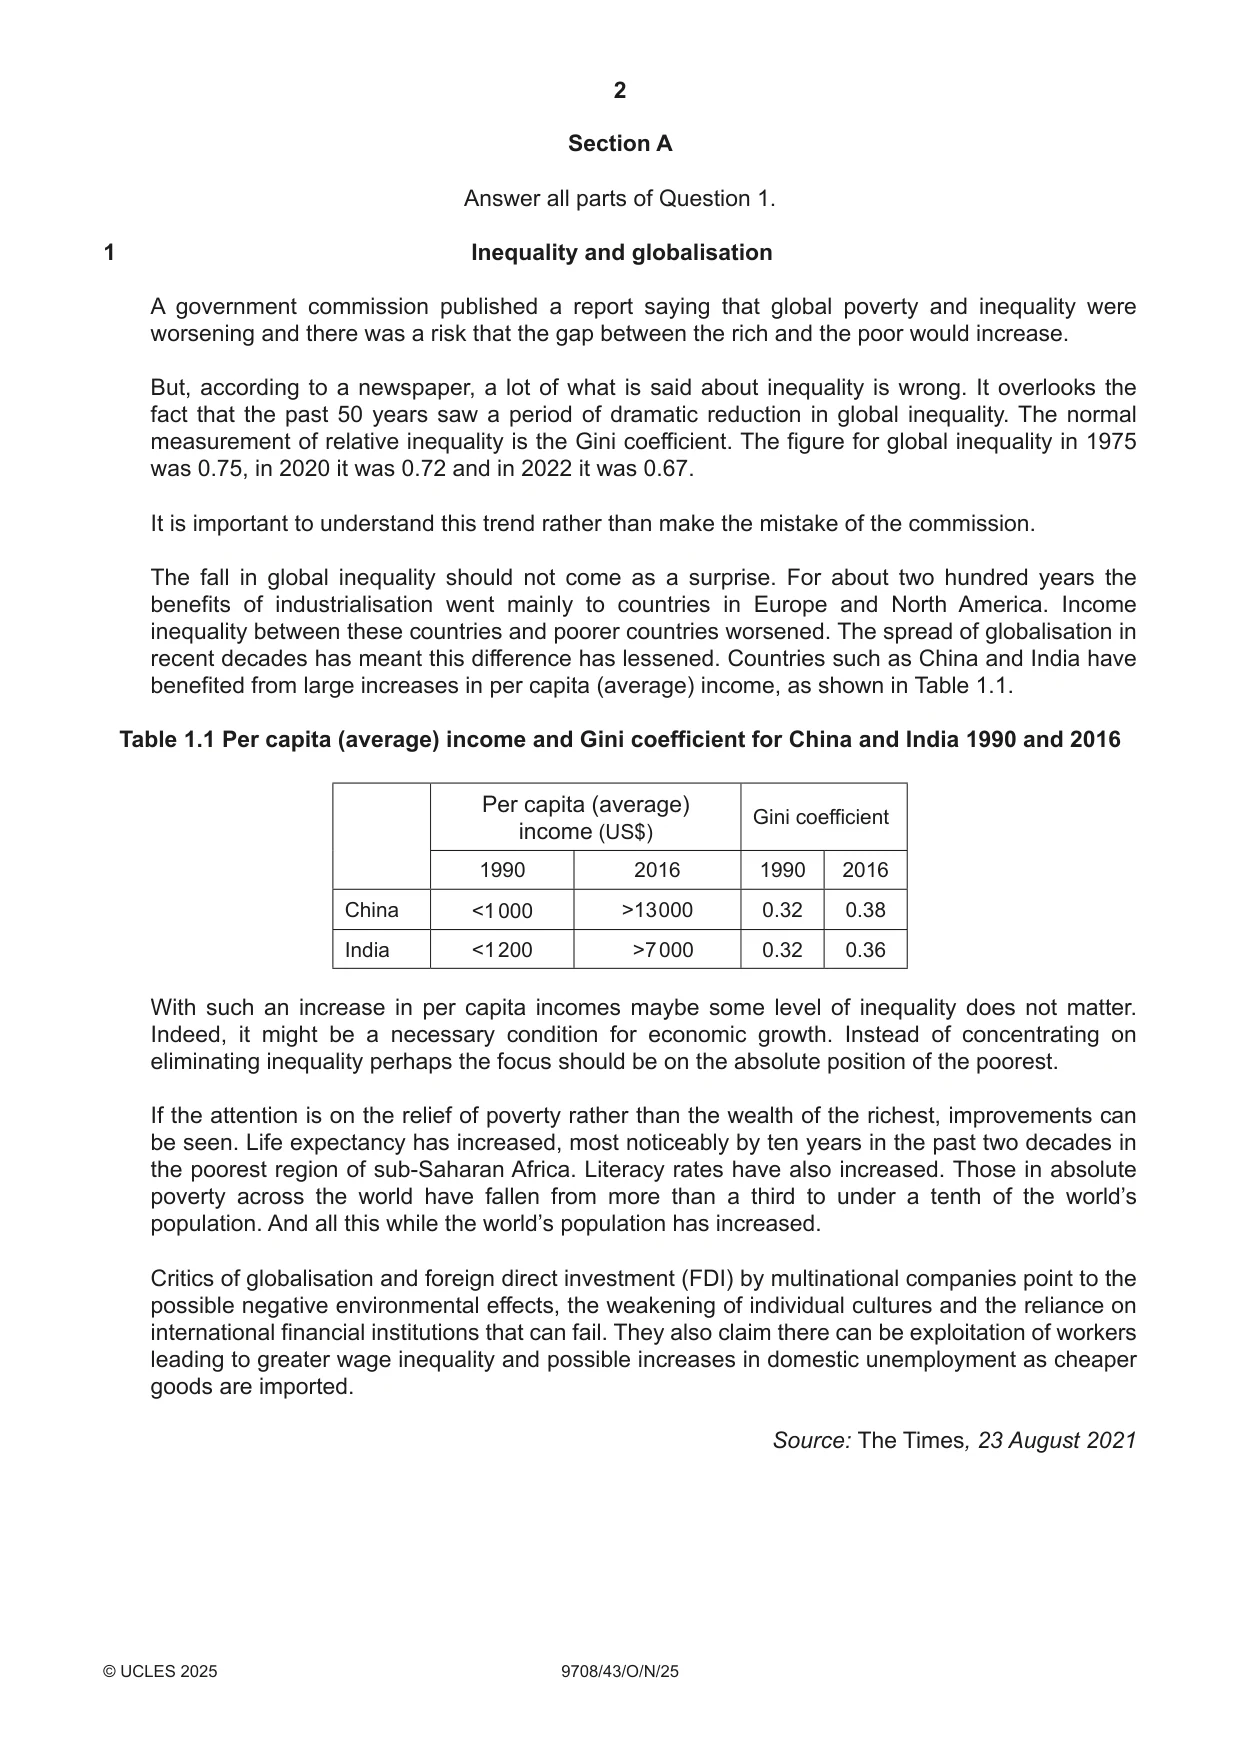
1 Inequality and globalisation A government commission published a report saying that global poverty and inequality were worsening and there was a risk that the gap between the rich and the poor would increase. But, according to a newspaper, a lot of what is said about inequality is wrong. It overlooks the fact that the past 50 years saw a period of dramatic reduction in global inequality. The normal measurement of relative inequality is the Gini coefficient. The figure for global inequality in 1975 was 0.75, in 2020 it was 0.72 and in 2022 it was 0.67. It is important to understand this trend rather than make the mistake of the commission. The fall in global inequality should not come as a surprise. For about two hundred years the benefits of industrialisation went mainly to countries in Europe and North America. Income inequality between these countries and poorer countries worsened. The spread of globalisation in recent decades has meant this difference has lessened. Countries such as China and India have benefited from large increases in per capita (average) income, as shown in Table 1.1. Table 1.1 Per capita (average) income and Gini coefficient for China and India 1990 and 2016 Per capita (average) Gini coefficient income (US$) 1990 2016 1990 2016 China <1 000 >13 000 0.32 0.38 India <1 200 >7 000 0.32 0.36 With such an increase in per capita incomes maybe some level of inequality does not matter. Indeed, it might be a necessary condition for economic growth. Instead of concentrating on eliminating inequality perhaps the focus should be on the absolute position of the poorest. If the attention is on the relief of poverty rather than the wealth of the richest, improvements can be seen. Life expectancy has increased, most noticeably by ten years in the past two decades in the poorest region of sub-Saharan Africa. Literacy rates have also increased. Those in absolute poverty across the world have fallen from more than a third to under a tenth of the world’s population. And all this while the world’s population has increased. Critics of globalisation and foreign direct investment (FDI) by multinational companies point to the possible negative environmental effects, the weakening of individual cultures and the reliance on international financial institutions that can fail. They also claim there can be exploitation of workers leading to greater wage inequality and possible increases in domestic unemployment as cheaper goods are imported. Source: The Times, 23 August 2021 (a) The article refers to the Gini coefficient. With the help of a diagram explain the link between a Gini coefficient and a Lorenz curve. [5] (b) (i) Distinguish between equity and equality. [2] (ii) ‘But, according to a newspaper, a lot of what is said about inequality is wrong.’ Analyse whether there is a conflict between what the newspaper wrote about changes in equality and Table 1.1. [5] (c) With reference to the article, explain the idea of globalisation and assess whether there is enough evidence to conclude that globalisation has a net benefit for everyone. [8]
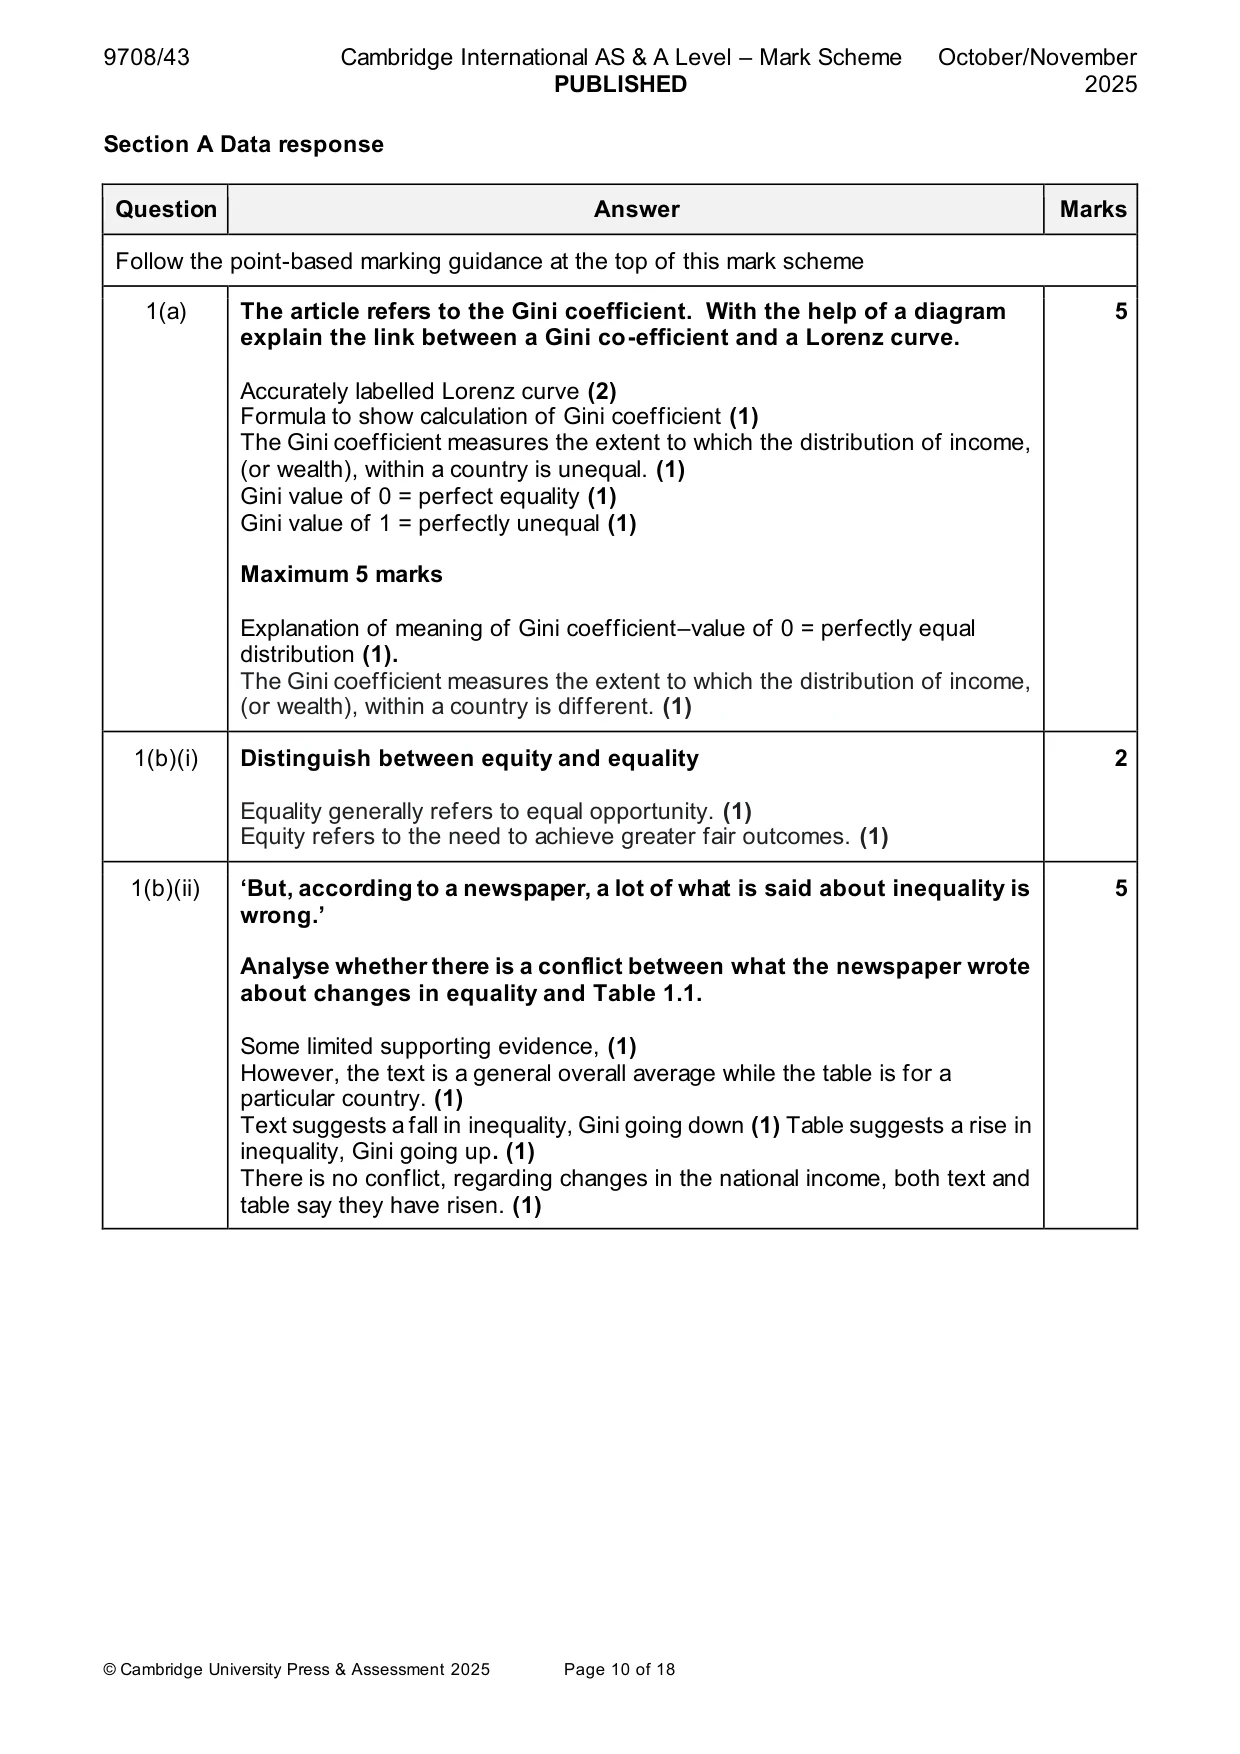
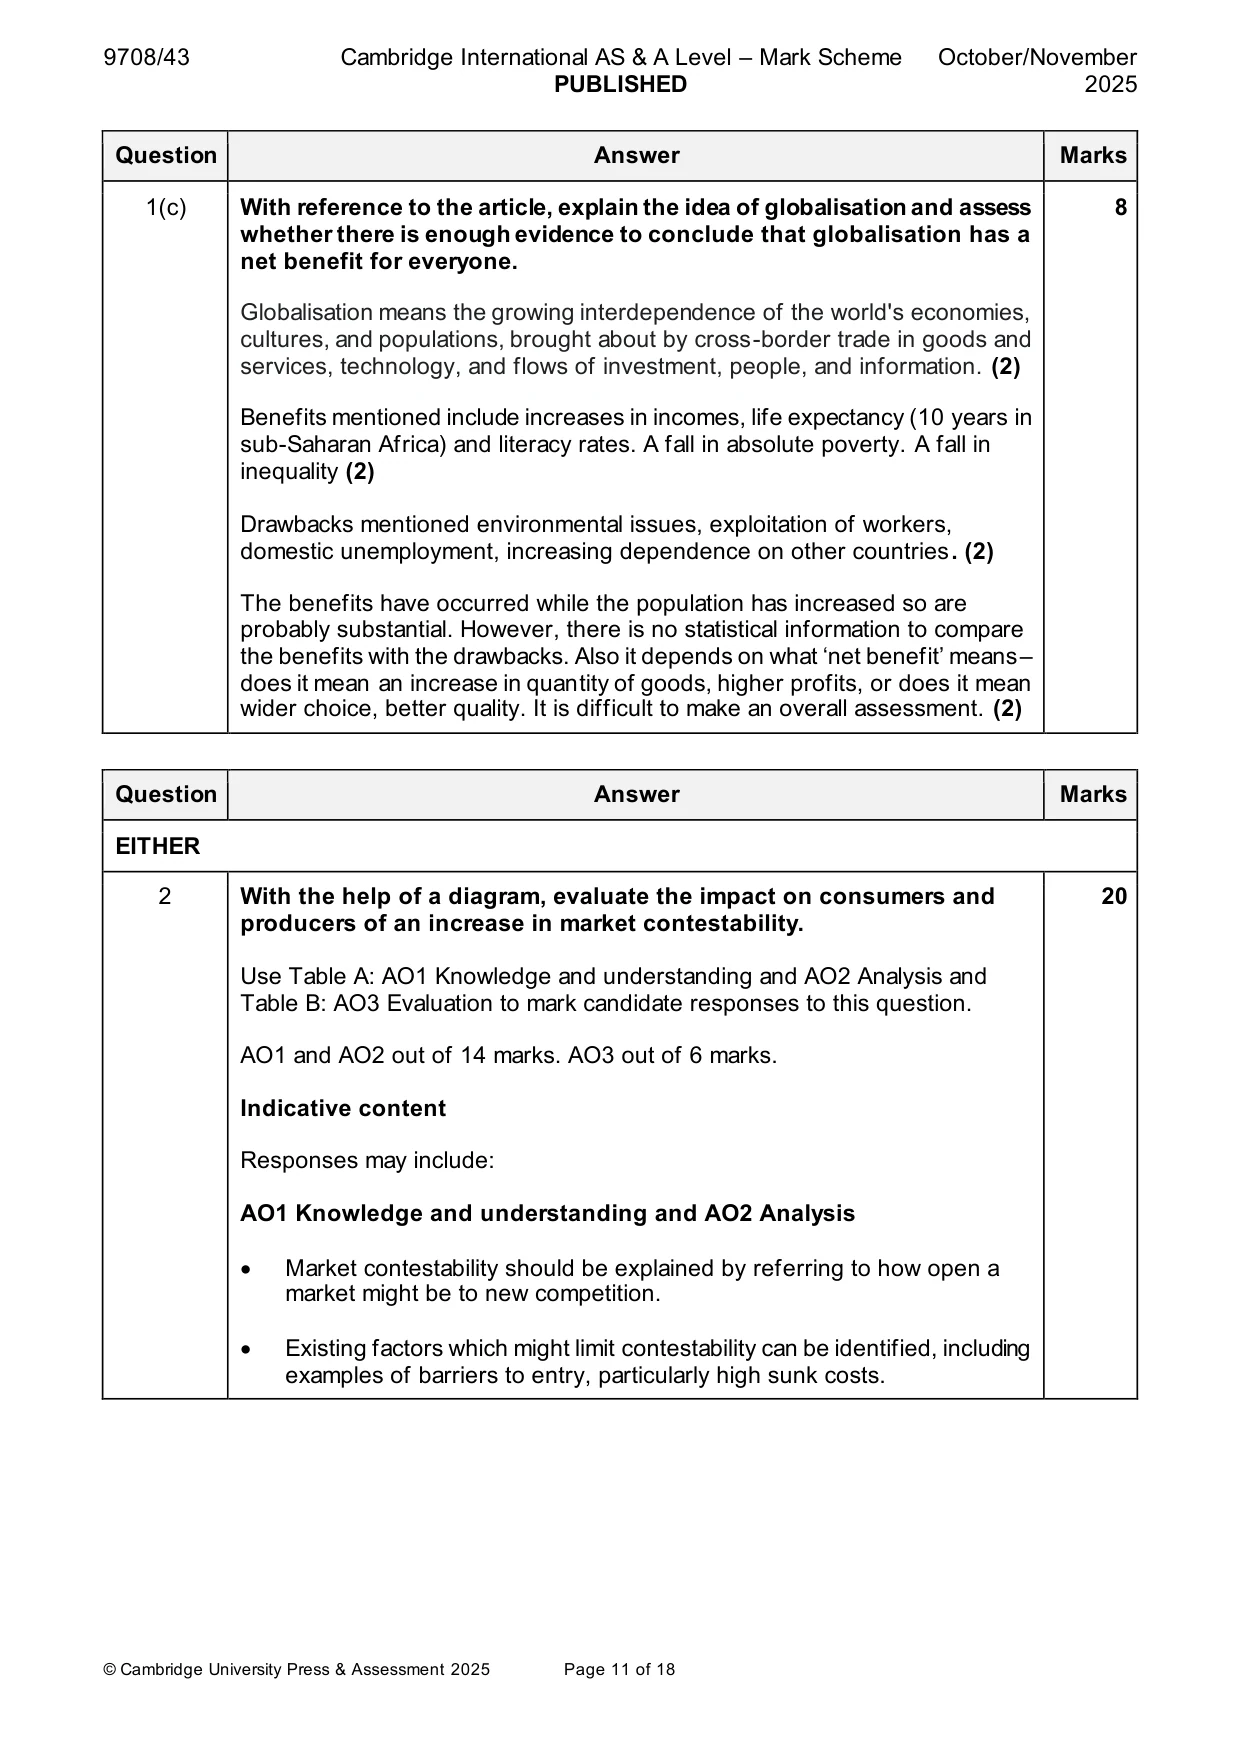
Mark scheme: Question Answer Marks Follow the point-based marking guidance at the top of this mark scheme 1(a) The article refers to the Gini coefficient. With the help of a diagram 5 explain the link between a Gini co-efficient and a Lorenz curve. Accurately labelled Lorenz curve (2) Formula to show calculation of Gini coefficient (1) The Gini coefficient measures the extent to which the distribution of income, (or wealth), within a country is unequal. (1) Gini value of 0 = perfect equality (1) Gini value of 1 = perfectly unequal (1) Maximum 5 marks Explanation of meaning of Gini coefficient–value of 0 = perfectly equal distribution (1). The Gini coefficient measures the extent to which the distribution of income, (or wealth), within a country is different. (1) 1(b)(i) Distinguish between equity and equality 2 Equality generally refers to equal opportunity. (1) Equity refers to the need to achieve greater fair outcomes. (1) 1(b)(ii) ‘But, according to a newspaper, a lot of what is said about inequality is 5 wrong.’ Analyse whether there is a conflict between what the newspaper wrote about changes in equality and Table 1.1. Some limited supporting evidence, (1) However, the text is a general overall average while the table is for a particular country. (1) Text suggests a fall in inequality, Gini going down (1) Table suggests a rise in inequality, Gini going up. (1) There is no conflict, regarding changes in the national income, both text and table say they have risen. (1) 1(c) With reference to the article, explain the idea of globalisation and assess 8 whether there is enough evidence to conclude that globalisation has a net benefit for everyone. Globalisation means the growing interdependence of the world's economies, cultures, and populations, brought about by cross-border trade in goods and services, technology, and flows of investment, people, and information. (2) Benefits mentioned include increases in incomes, life expectancy (10 years in sub-Saharan Africa) and literacy rates. A fall in absolute poverty. A fall in inequality (2) Drawbacks mentioned environmental issues, exploitation of workers, domestic unemployment, increasing dependence on other countries. (2) The benefits have occurred while the population has increased so are probably substantial. However, there is no statistical information to compare the benefits with the drawbacks. Also it depends on what ‘net benefit’ means– does it mean an increase in quantity of goods, higher profits, or does it mean wider choice, better quality. It is difficult to make an overall assessment. (2)
Q2 · With the help of a diagram, evaluate the impact on consumers and producers of an increase…
2 With the help of a diagram, evaluate the impact on consumers and producers of an increase in market contestability. [20] OR
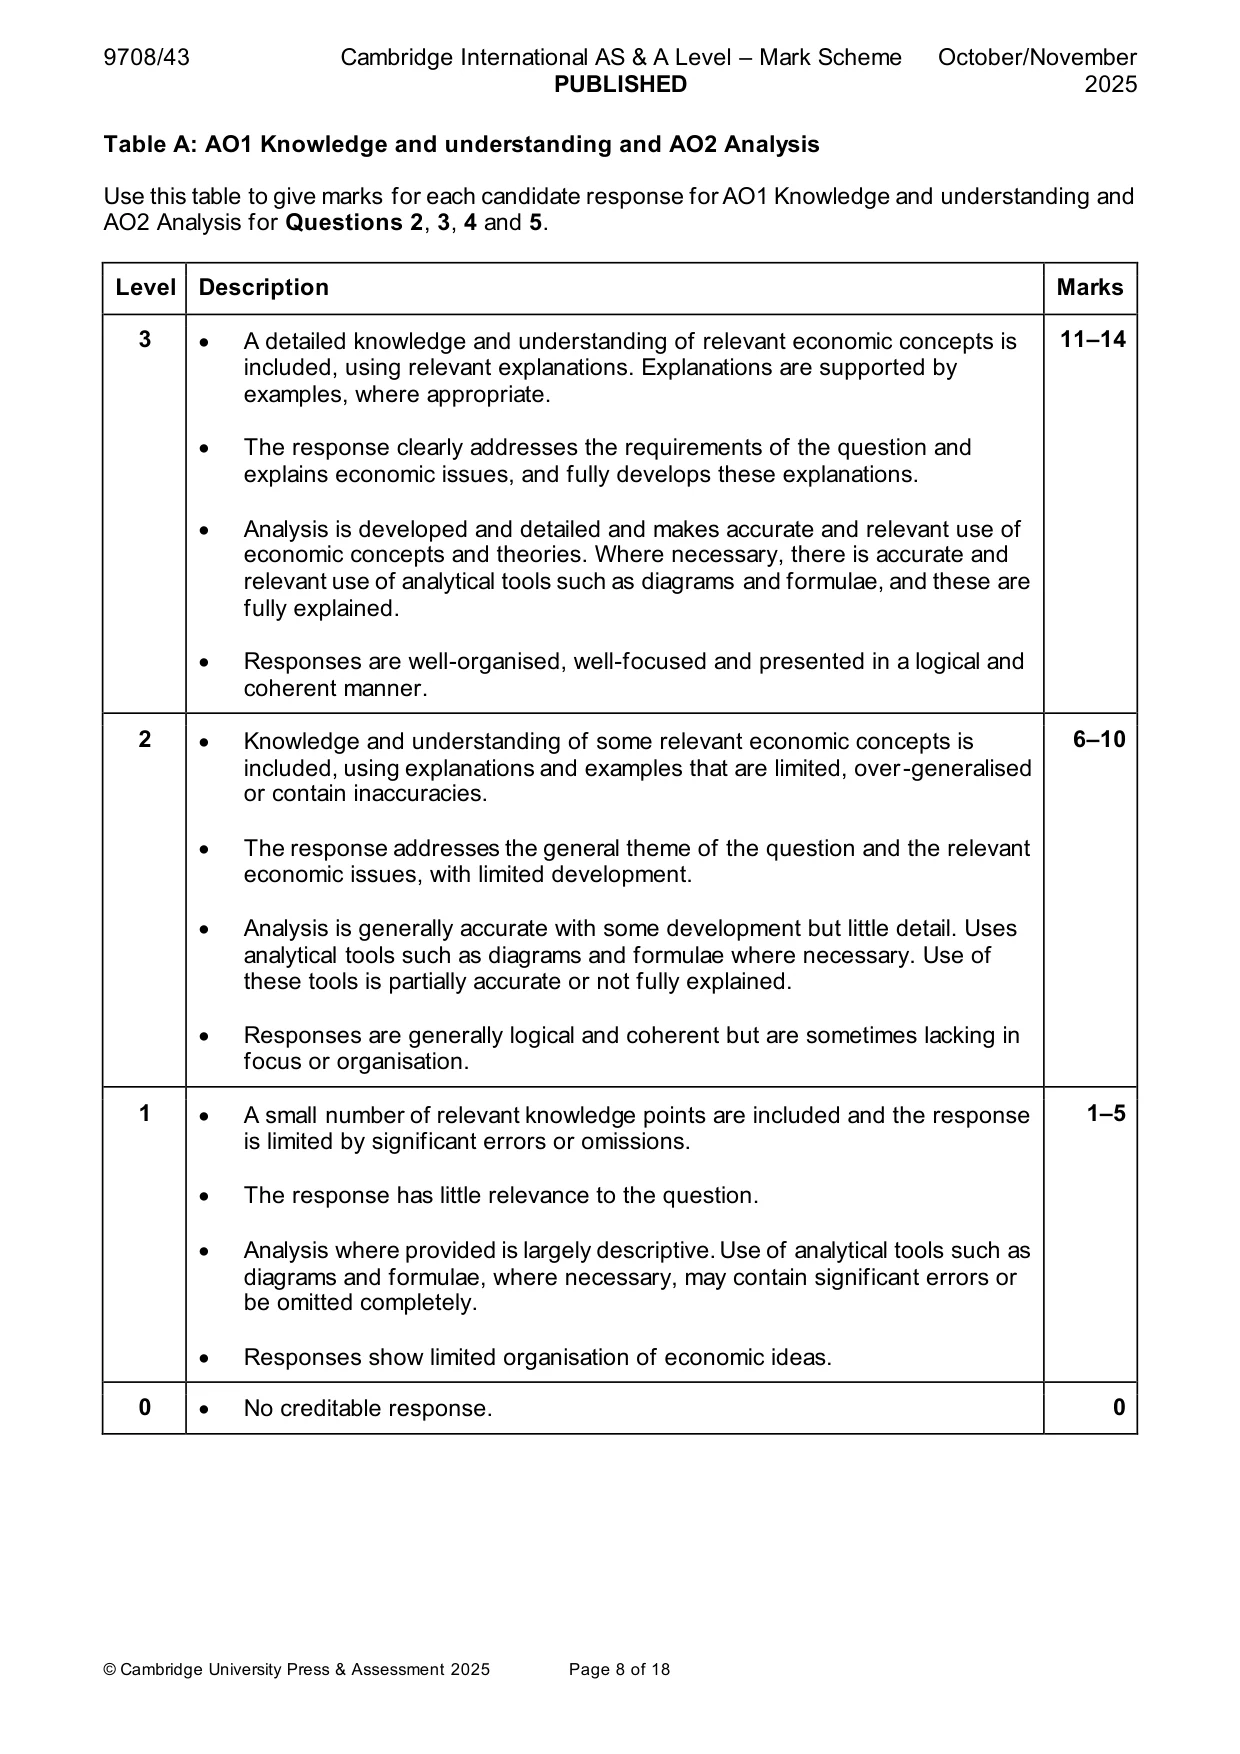
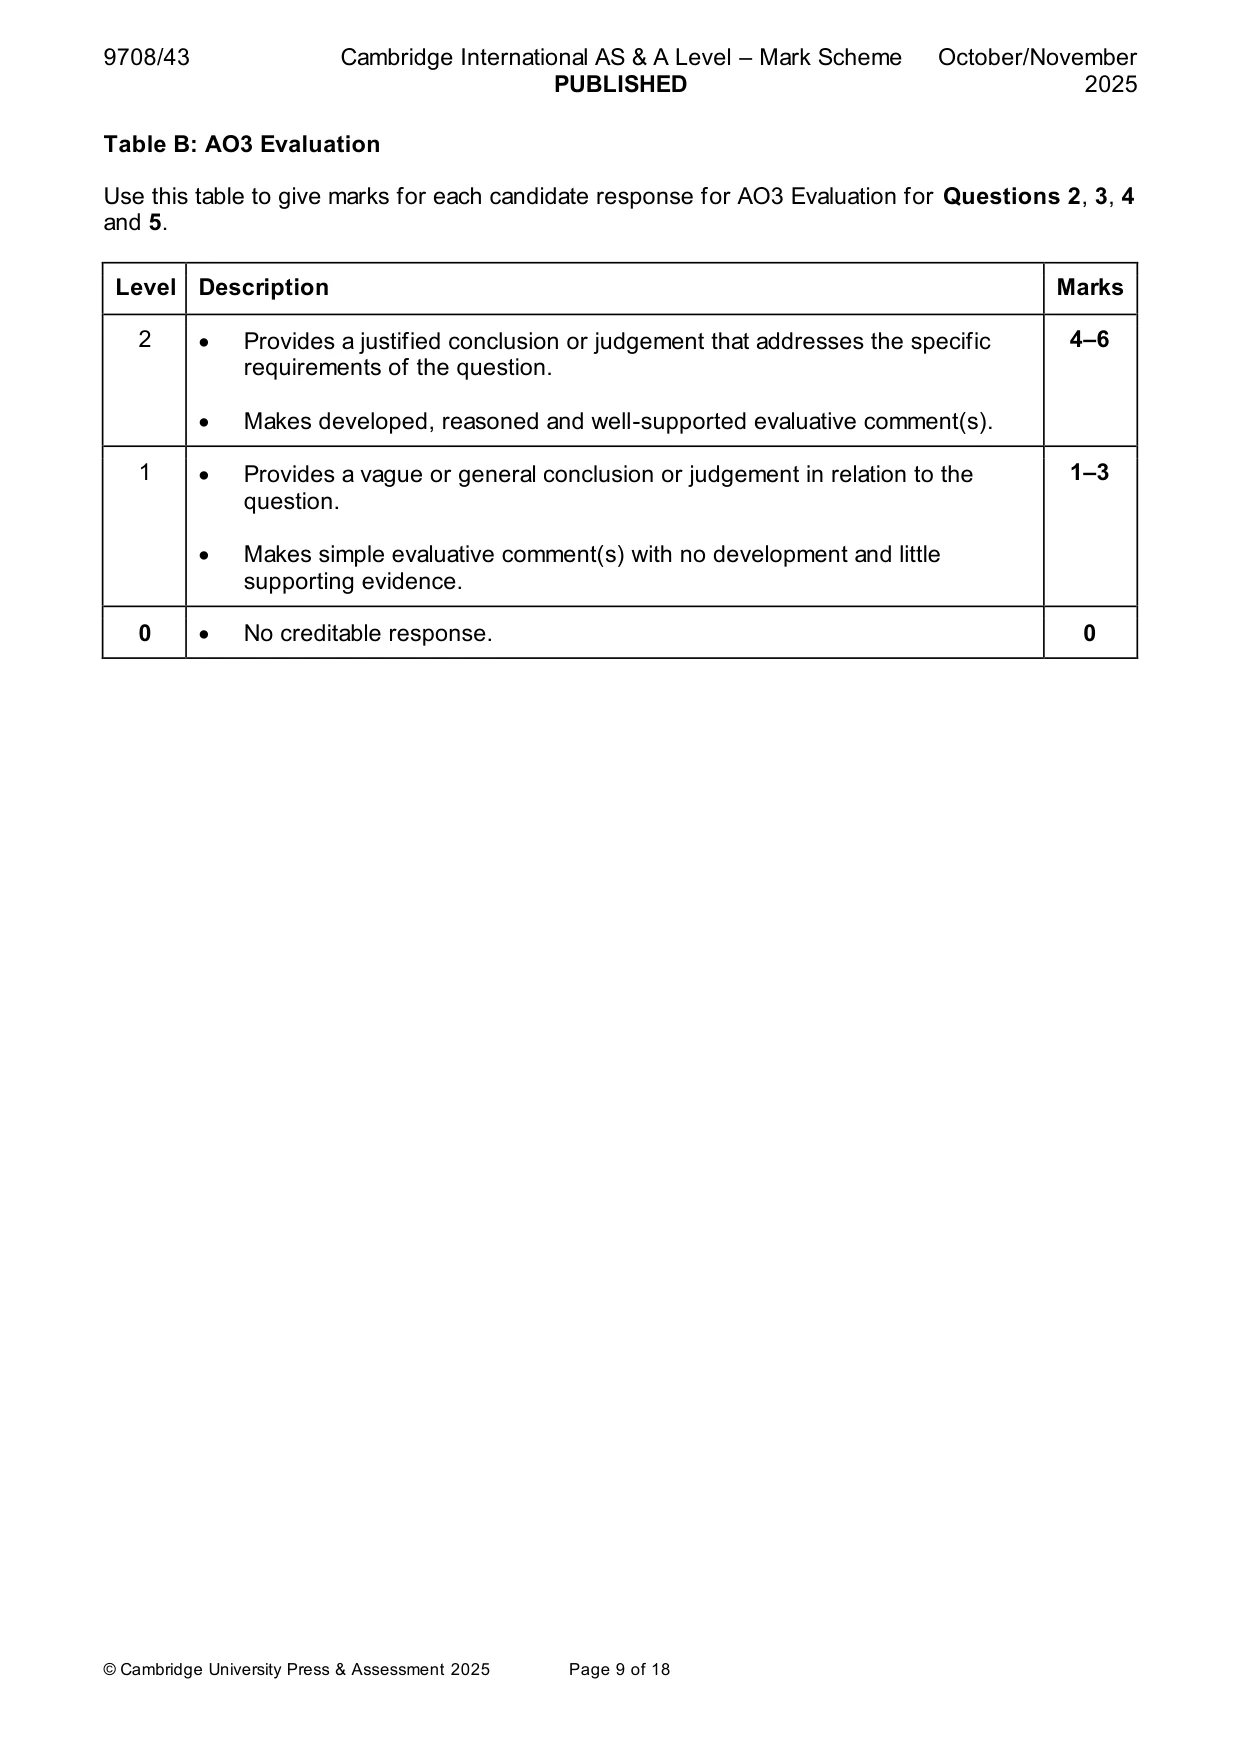
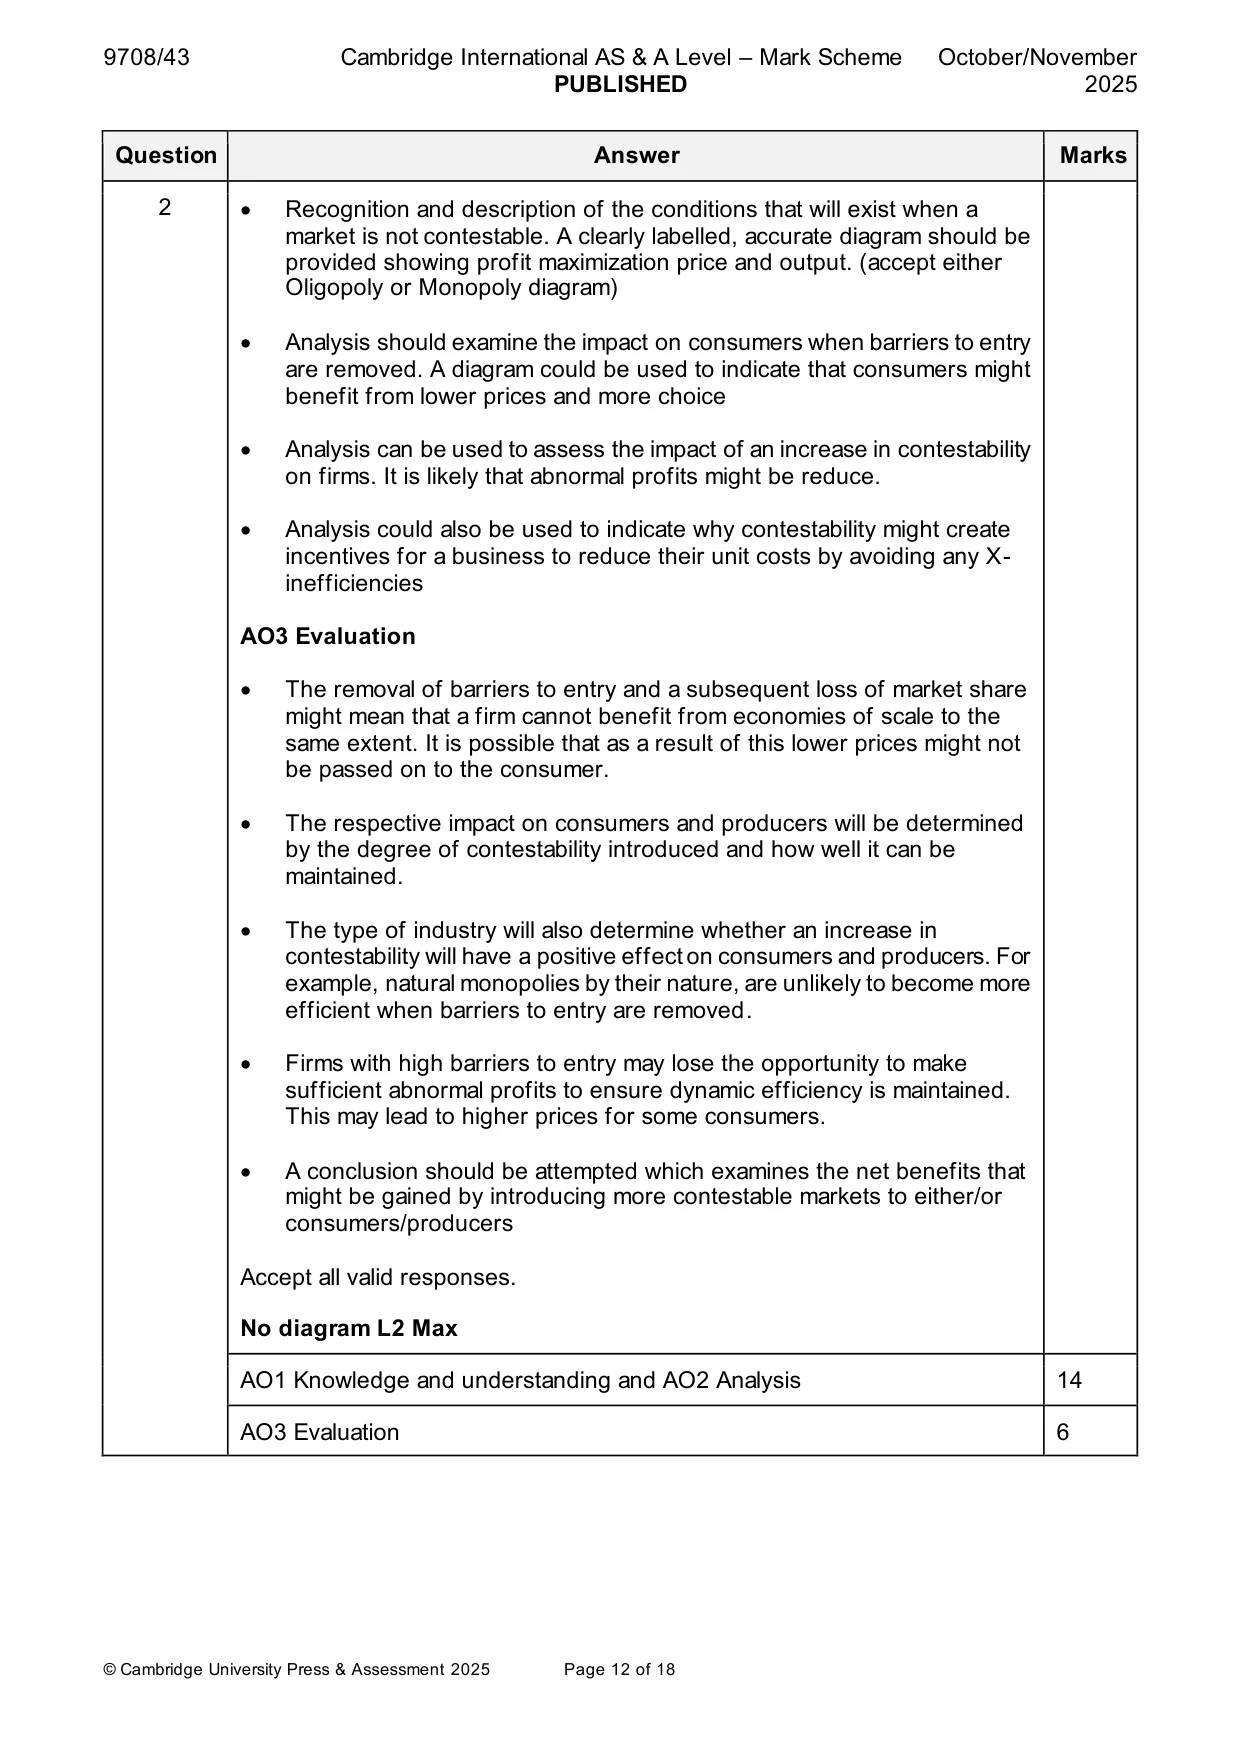
Mark scheme: 2 With the help of a diagram, evaluate the impact on consumers and 20 producers of an increase in market contestability. Use Table A: AO1 Knowledge and understanding and AO2 Analysis and Table B: AO3 Evaluation to mark candidate responses to this question. AO1 and AO2 out of 14 marks. AO3 out of 6 marks. Indicative content Responses may include: AO1 Knowledge and understanding and AO2 Analysis • Market contestability should be explained by referring to how open a market might be to new competition. • Existing factors which might limit contestability can be identified, including examples of barriers to entry, particularly high sunk costs. 2 • Recognition and description of the conditions that will exist when a market is not contestable. A clearly labelled, accurate diagram should be provided showing profit maximization price and output. (accept either Oligopoly or Monopoly diagram) • Analysis should examine the impact on consumers when barriers to entry are removed. A diagram could be used to indicate that consumers might benefit from lower prices and more choice • Analysis can be used to assess the impact of an increase in contestability on firms. It is likely that abnormal profits might be reduce. • Analysis could also be used to indicate why contestability might create incentives for a business to reduce their unit costs by avoiding any X- inefficiencies AO3 Evaluation • The removal of barriers to entry and a subsequent loss of market share might mean that a firm cannot benefit from economies of scale to the same extent. It is possible that as a result of this lower prices might not be passed on to the consumer. • The respective impact on consumers and producers will be determined by the degree of contestability introduced and how well it can be maintained. • The type of industry will also determine whether an increase in contestability will have a positive effect on consumers and producers. For example, natural monopolies by their nature, are unlikely to become more efficient when barriers to entry are removed. • Firms with high barriers to entry may lose the opportunity to make sufficient abnormal profits to ensure dynamic efficiency is maintained. This may lead to higher prices for some consumers. • A conclusion should be attempted which examines the net benefits that might be gained by introducing more contestable markets to either/or consumers/producers Accept all valid responses. No diagram L2 Max AO1 Knowledge and understanding and AO2 Analysis 14 AO3 Evaluation 6
Q3 · With the help of a diagram, assess the importance of the supply of labour in relation to…
3 With the help of a diagram, assess the importance of the supply of labour in relation to the wage and employment levels for firms operating in perfectly competitive and monopsony labour markets. [20] Section C Answer one question. EITHER
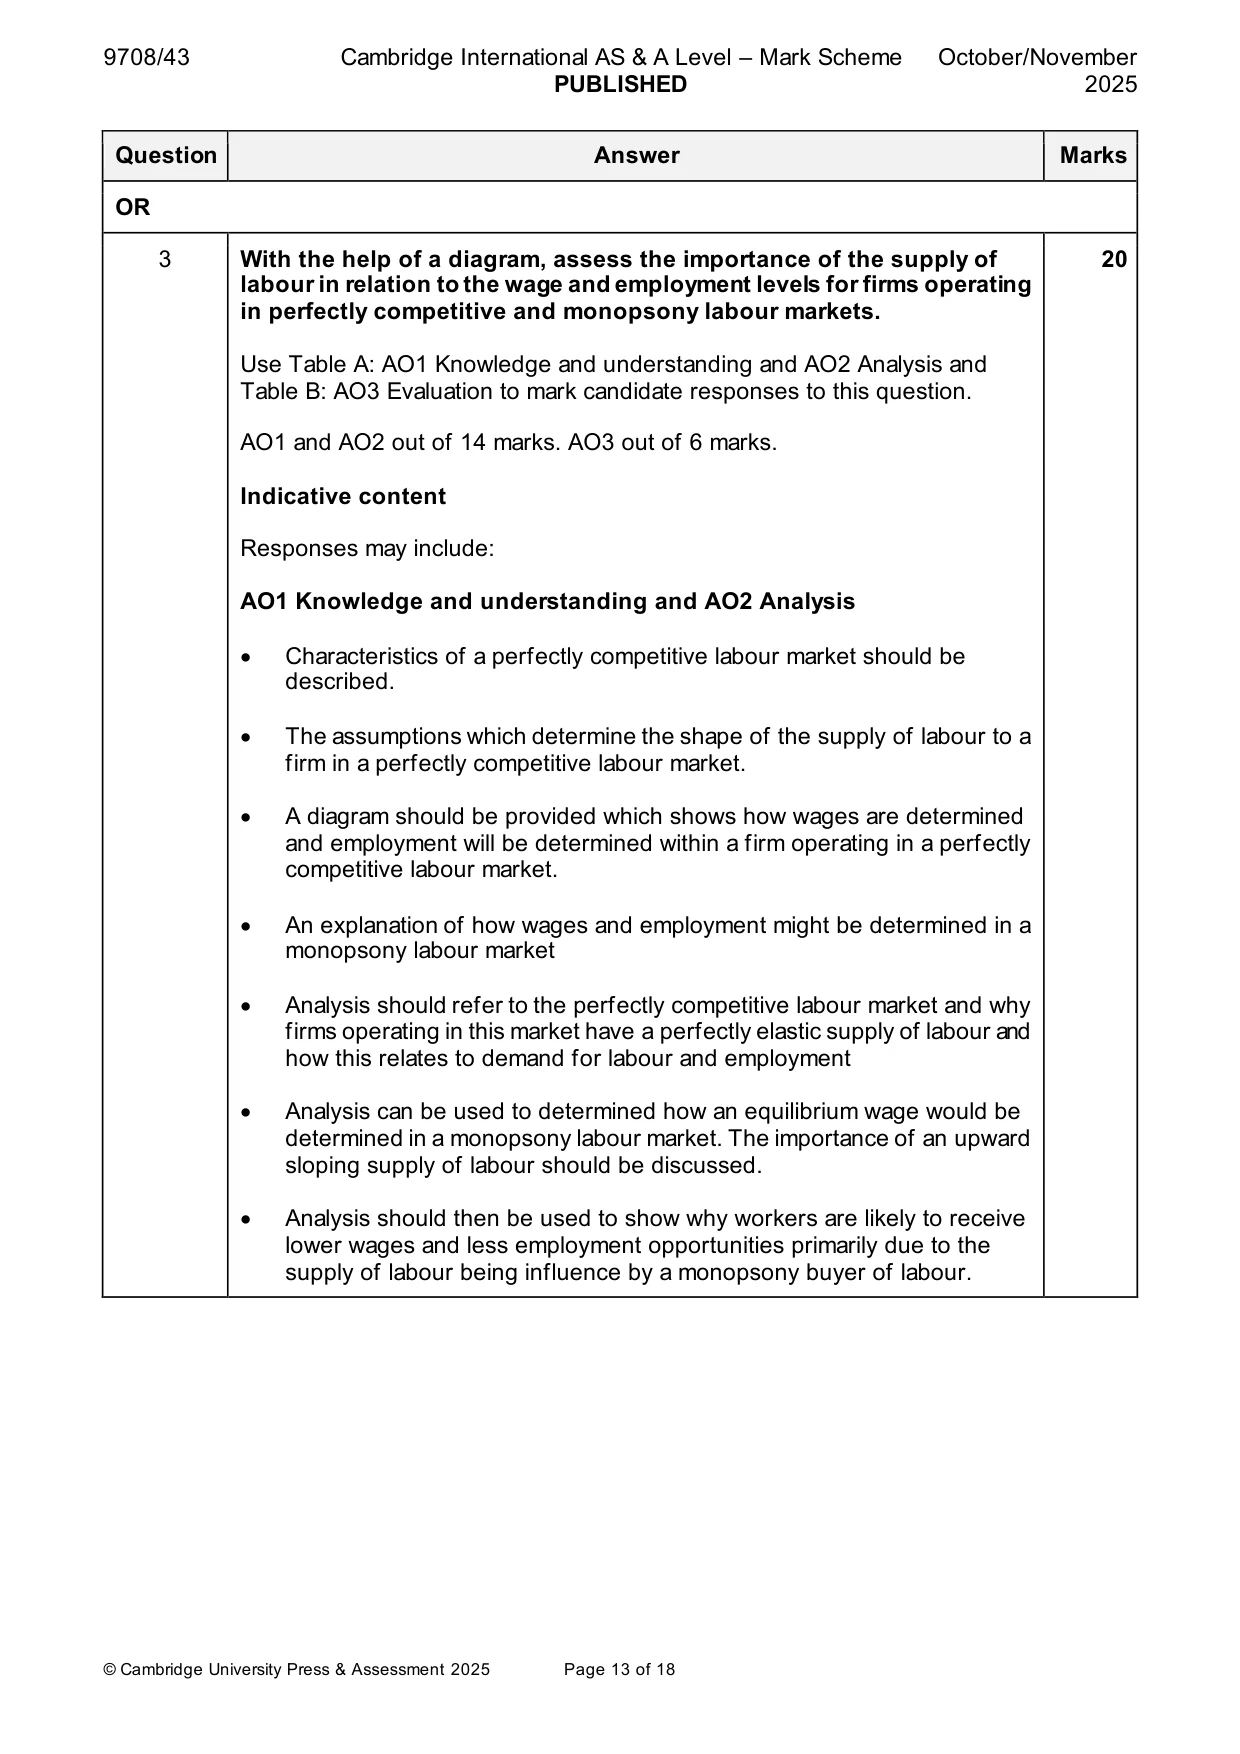
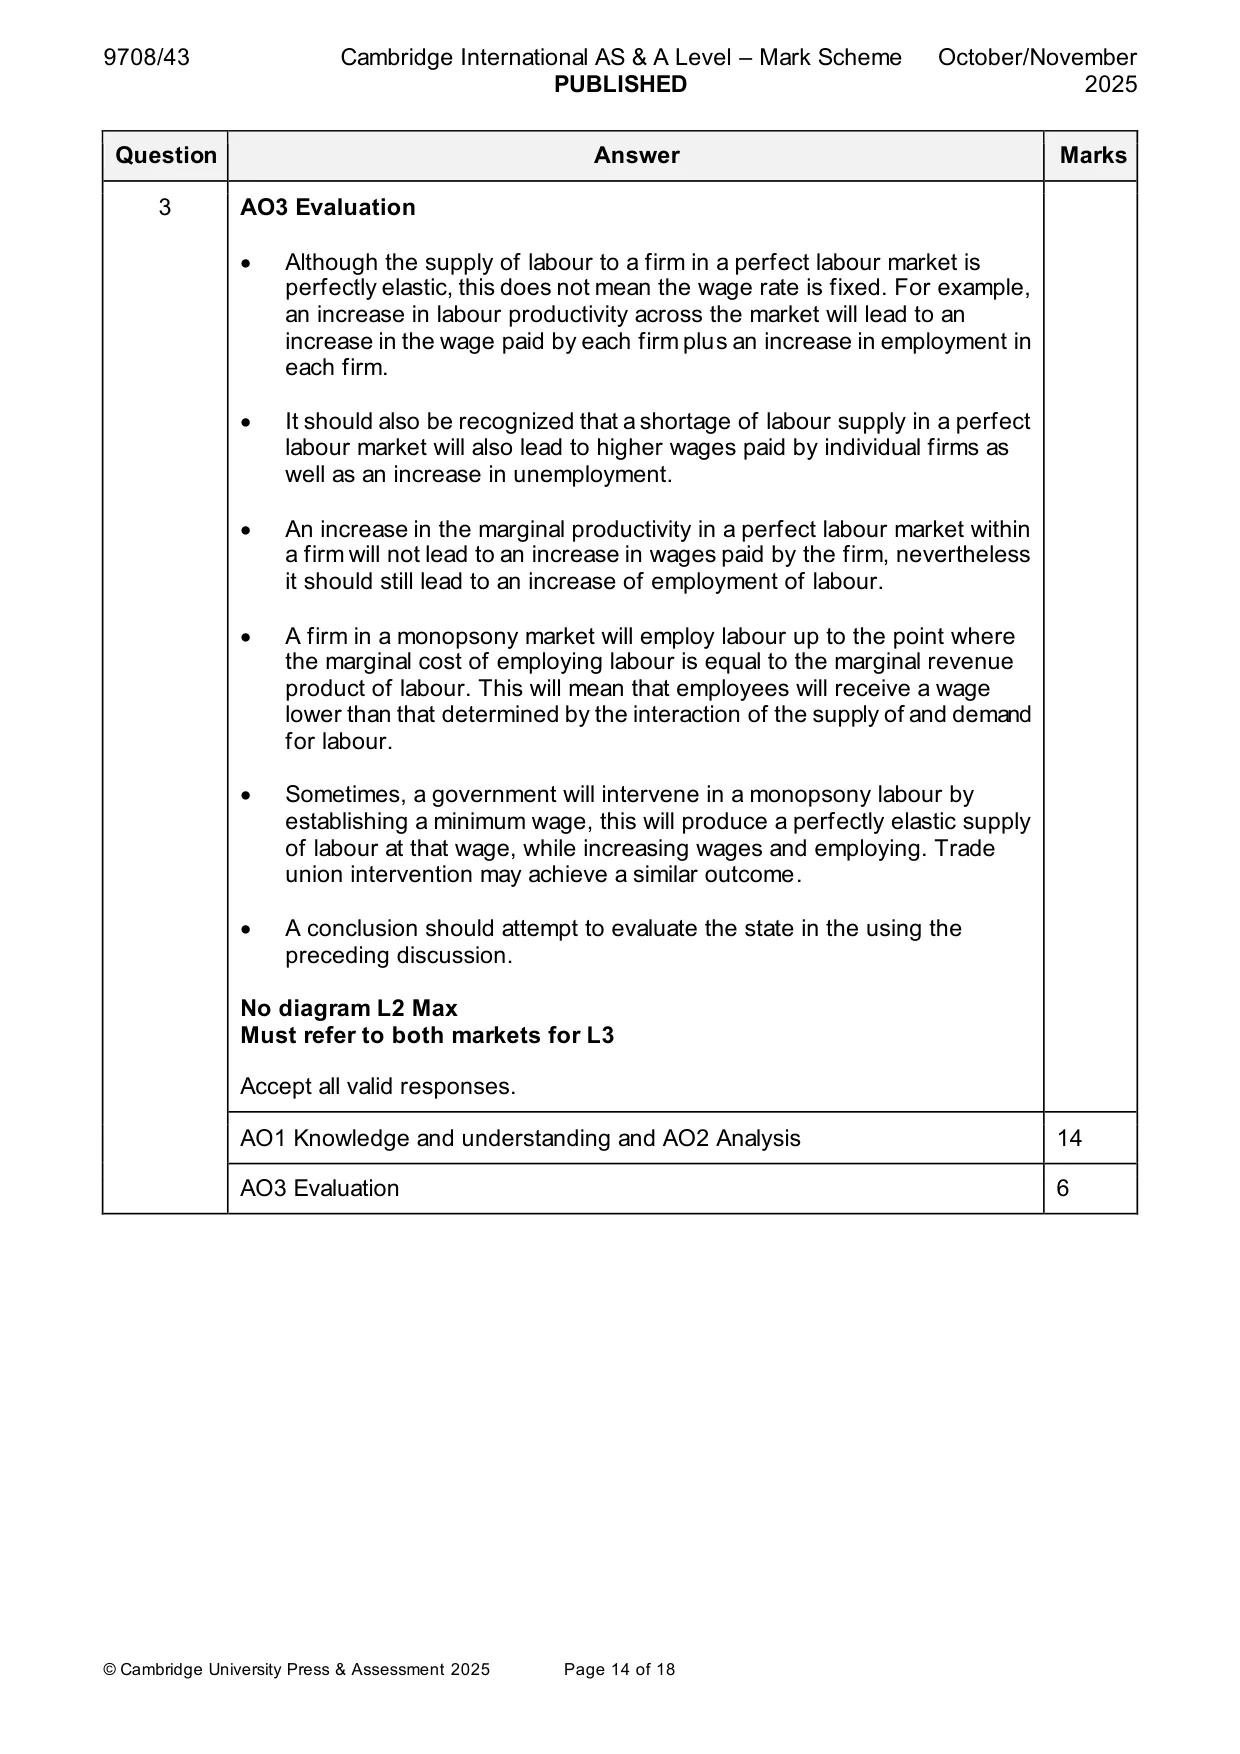
Mark scheme: 3 With the help of a diagram, assess the importance of the supply of 20 labour in relation to the wage and employment levels for firms operating in perfectly competitive and monopsony labour markets. Use Table A: AO1 Knowledge and understanding and AO2 Analysis and Table B: AO3 Evaluation to mark candidate responses to this question. AO1 and AO2 out of 14 marks. AO3 out of 6 marks. Indicative content Responses may include: AO1 Knowledge and understanding and AO2 Analysis • Characteristics of a perfectly competitive labour market should be described. • The assumptions which determine the shape of the supply of labour to a firm in a perfectly competitive labour market. • A diagram should be provided which shows how wages are determined and employment will be determined within a firm operating in a perfectly competitive labour market. • An explanation of how wages and employment might be determined in a monopsony labour market • Analysis should refer to the perfectly competitive labour market and why firms operating in this market have a perfectly elastic supply of labour and how this relates to demand for labour and employment • Analysis can be used to determined how an equilibrium wage would be determined in a monopsony labour market. The importance of an upward sloping supply of labour should be discussed. • Analysis should then be used to show why workers are likely to receive lower wages and less employment opportunities primarily due to the supply of labour being influence by a monopsony buyer of labour. 3 AO3 Evaluation • Although the supply of labour to a firm in a perfect labour market is perfectly elastic, this does not mean the wage rate is fixed. For example, an increase in labour productivity across the market will lead to an increase in the wage paid by each firm plus an increase in employment in each firm. • It should also be recognized that a shortage of labour supply in a perfect labour market will also lead to higher wages paid by individual firms as well as an increase in unemployment. • An increase in the marginal productivity in a perfect labour market within a firm will not lead to an increase in wages paid by the firm, nevertheless it should still lead to an increase of employment of labour. • A firm in a monopsony market will employ labour up to the point where the marginal cost of employing labour is equal to the marginal revenue product of labour. This will mean that employees will receive a wage lower than that determined by the interaction of the supply of and demand for labour. • Sometimes, a government will intervene in a monopsony labour by establishing a minimum wage, this will produce a perfectly elastic supply of labour at that wage, while increasing wages and employing. Trade union intervention may achieve a similar outcome. • A conclusion should attempt to evaluate the state in the using the preceding discussion. No diagram L2 Max Must refer to both markets for L3 Accept all valid responses. AO1 Knowledge and understanding and AO2 Analysis 14 AO3 Evaluation 6
More questions on Labour market forces and government intervention
Q4 · With the help of a diagram, evaluate the effectiveness of using monetary policy to…
4 With the help of a diagram, evaluate the effectiveness of using monetary policy to increase the rate of economic growth in a country. [20] OR
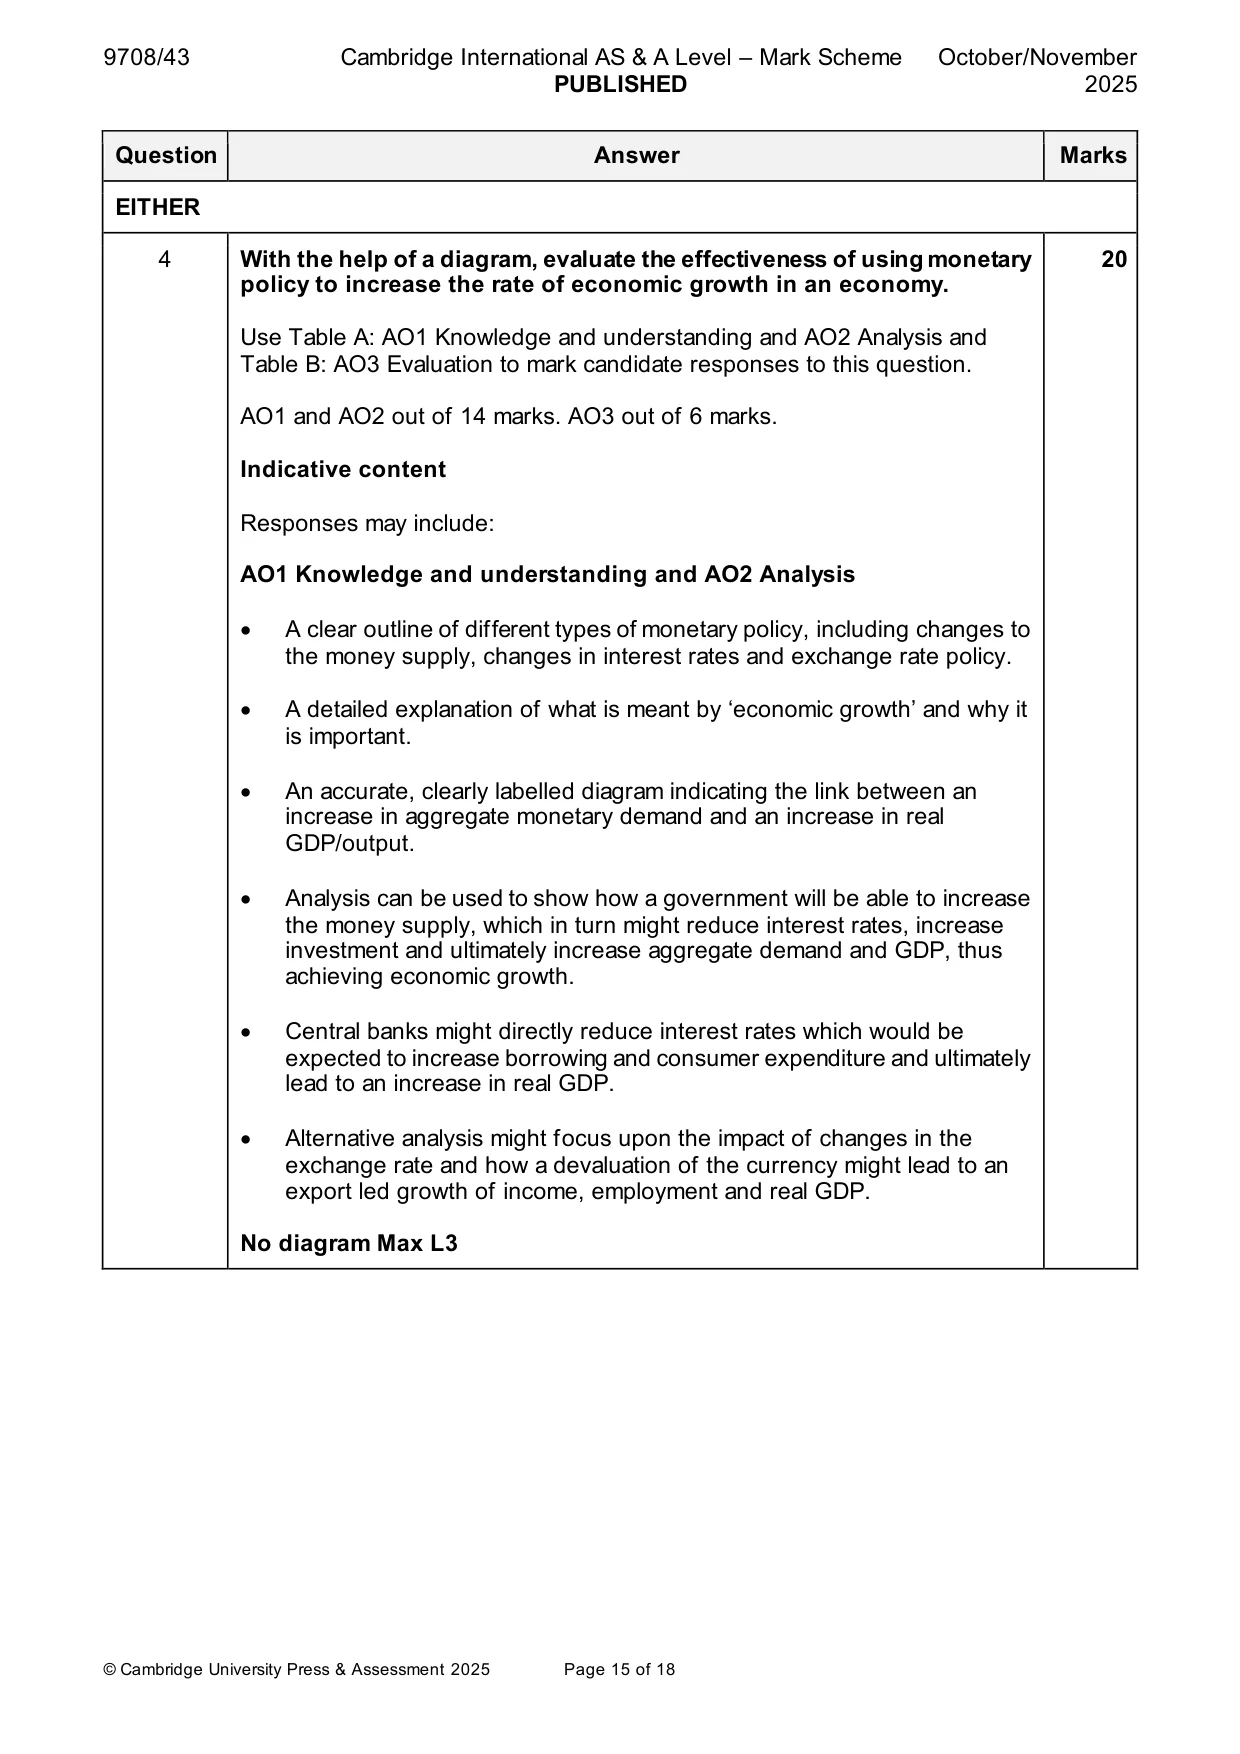
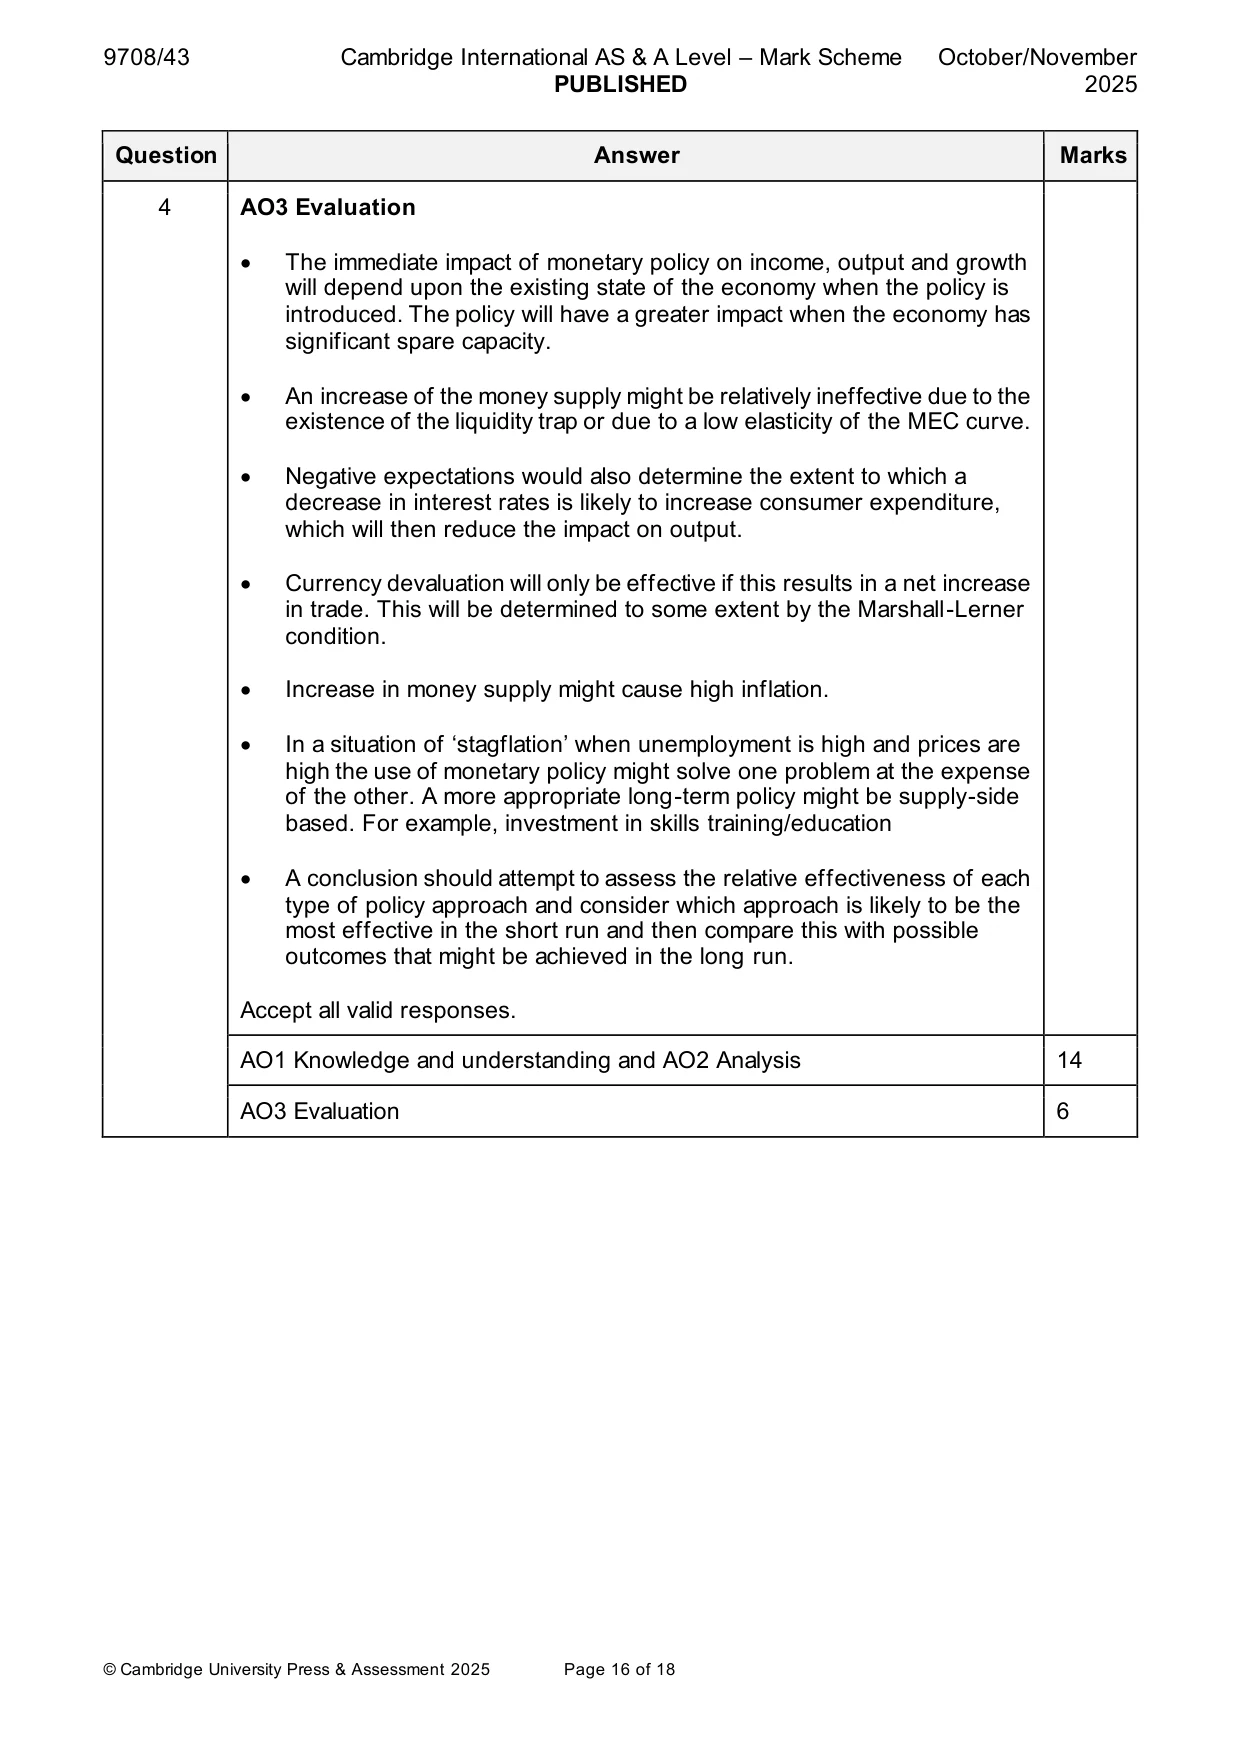
Mark scheme: 4 With the help of a diagram, evaluate the effectiveness of using monetary 20 policy to increase the rate of economic growth in an economy. Use Table A: AO1 Knowledge and understanding and AO2 Analysis and Table B: AO3 Evaluation to mark candidate responses to this question. AO1 and AO2 out of 14 marks. AO3 out of 6 marks. Indicative content Responses may include: AO1 Knowledge and understanding and AO2 Analysis • A clear outline of different types of monetary policy, including changes to the money supply, changes in interest rates and exchange rate policy. • A detailed explanation of what is meant by ‘economic growth’ and why it is important. • An accurate, clearly labelled diagram indicating the link between an increase in aggregate monetary demand and an increase in real GDP/output. • Analysis can be used to show how a government will be able to increase the money supply, which in turn might reduce interest rates, increase investment and ultimately increase aggregate demand and GDP, thus achieving economic growth. • Central banks might directly reduce interest rates which would be expected to increase borrowing and consumer expenditure and ultimately lead to an increase in real GDP. • Alternative analysis might focus upon the impact of changes in the exchange rate and how a devaluation of the currency might lead to an export led growth of income, employment and real GDP. No diagram Max L3 4 AO3 Evaluation • The immediate impact of monetary policy on income, output and growth will depend upon the existing state of the economy when the policy is introduced. The policy will have a greater impact when the economy has significant spare capacity. • An increase of the money supply might be relatively ineffective due to the existence of the liquidity trap or due to a low elasticity of the MEC curve. • Negative expectations would also determine the extent to which a decrease in interest rates is likely to increase consumer expenditure, which will then reduce the impact on output. • Currency devaluation will only be effective if this results in a net increase in trade. This will be determined to some extent by the Marshall-Lerner condition. • Increase in money supply might cause high inflation. • In a situation of ‘stagflation’ when unemployment is high and prices are high the use of monetary policy might solve one problem at the expense of the other. A more appropriate long-term policy might be supply-side based. For example, investment in skills training/education • A conclusion should attempt to assess the relative effectiveness of each type of policy approach and consider which approach is likely to be the most effective in the short run and then compare this with possible outcomes that might be achieved in the long run. Accept all valid responses. AO1 Knowledge and understanding and AO2 Analysis 14 AO3 Evaluation 6
Q5 · ‘The use of tariffs is the most effective way to correct a balance of payments deficit.’…
5 ‘The use of tariffs is the most effective way to correct a balance of payments deficit.’ With the help of a diagram, evaluate this statement. [20]
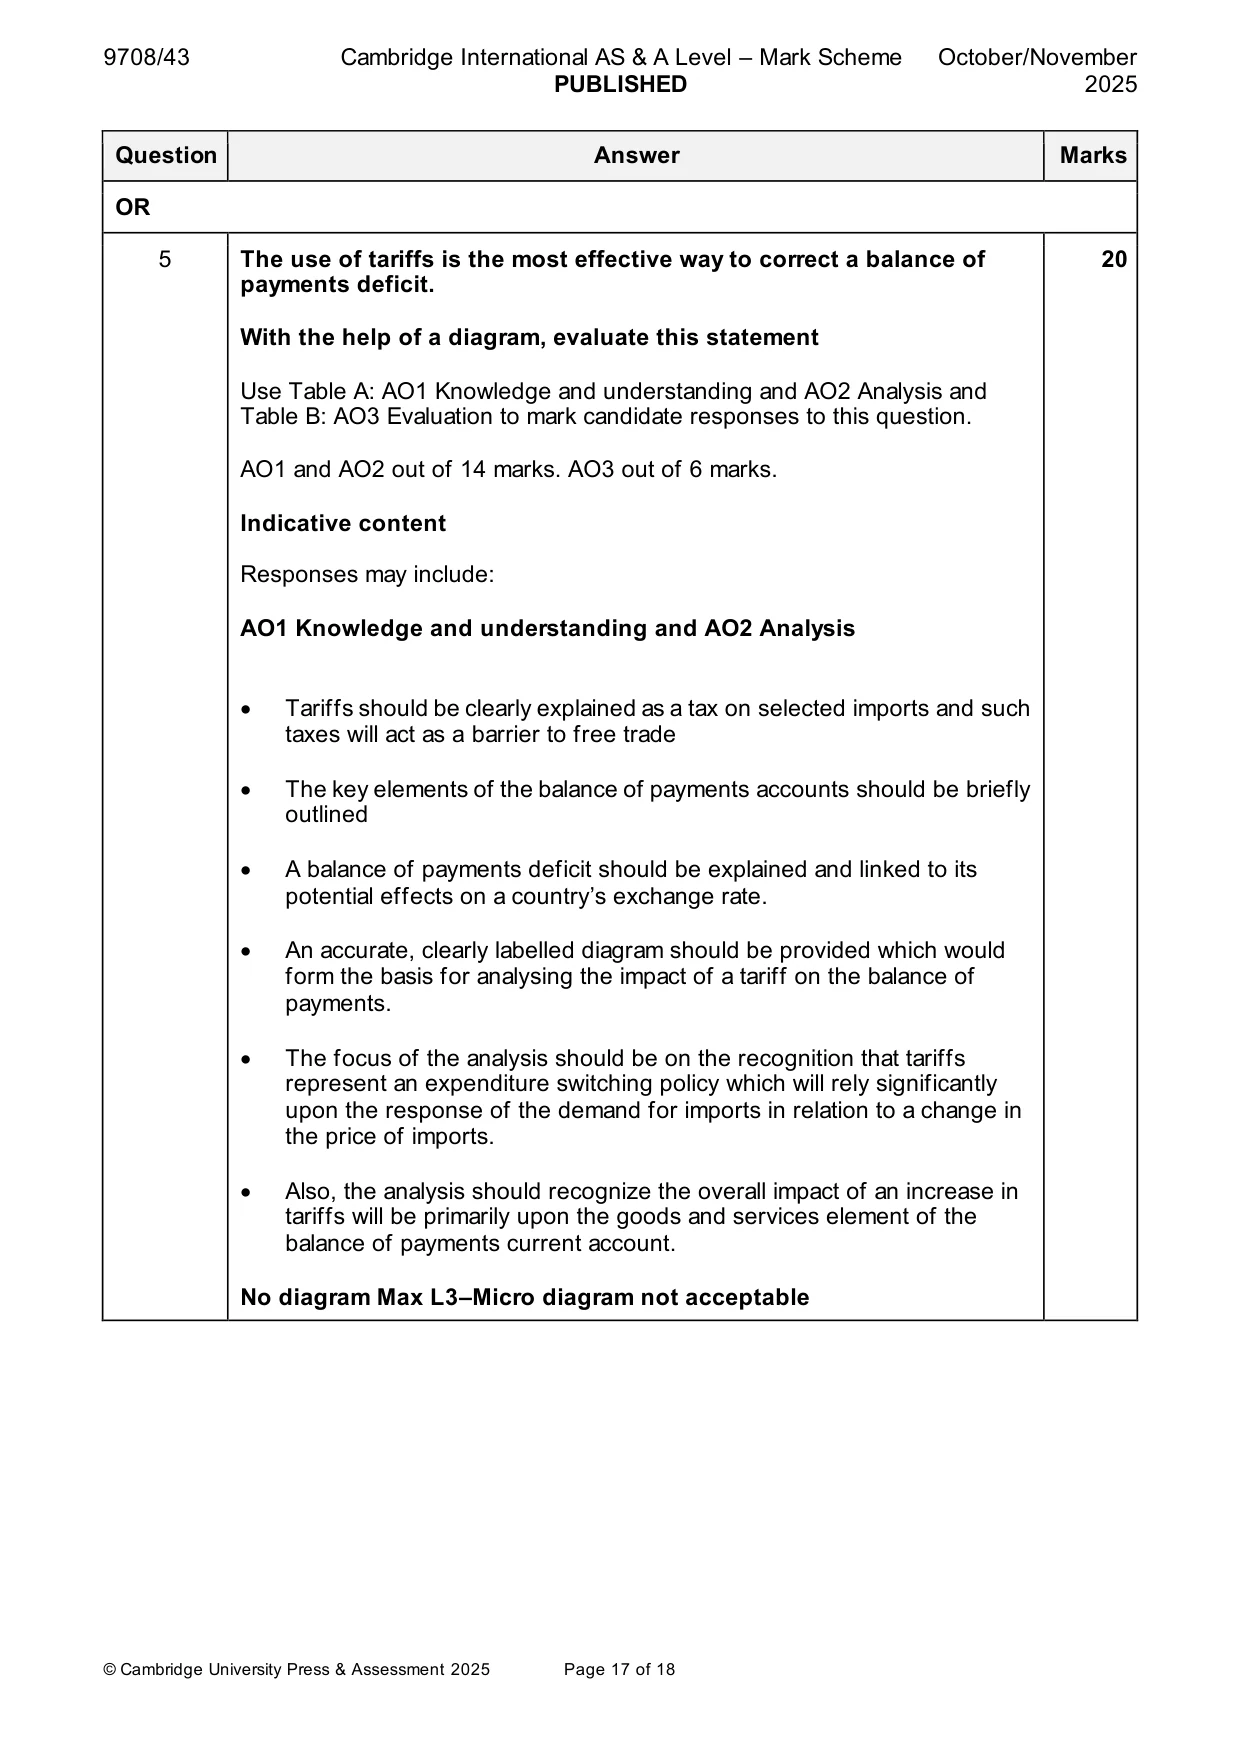
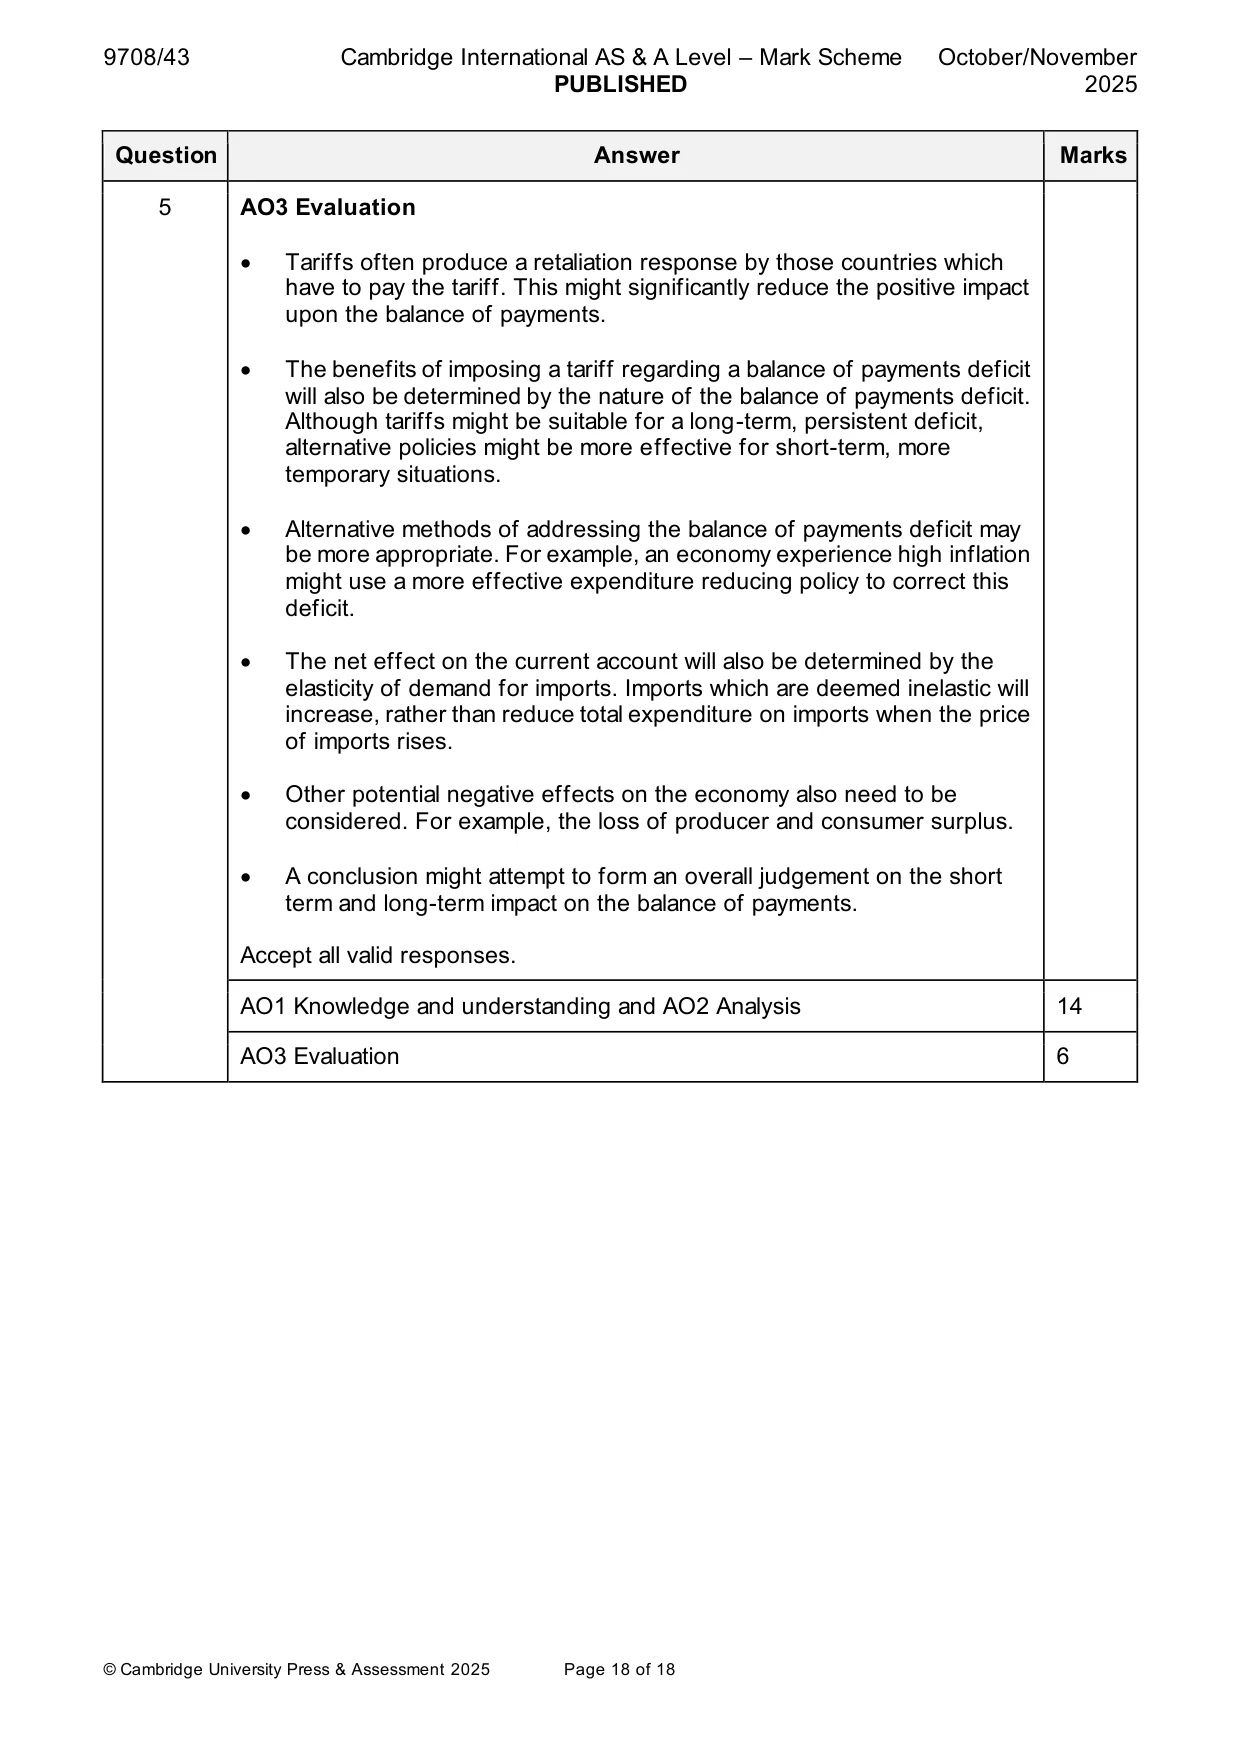
Mark scheme: 5 The use of tariffs is the most effective way to correct a balance of 20 payments deficit. With the help of a diagram, evaluate this statement Use Table A: AO1 Knowledge and understanding and AO2 Analysis and Table B: AO3 Evaluation to mark candidate responses to this question. AO1 and AO2 out of 14 marks. AO3 out of 6 marks. Indicative content Responses may include: AO1 Knowledge and understanding and AO2 Analysis • Tariffs should be clearly explained as a tax on selected imports and such taxes will act as a barrier to free trade • The key elements of the balance of payments accounts should be briefly outlined • A balance of payments deficit should be explained and linked to its potential effects on a country’s exchange rate. • An accurate, clearly labelled diagram should be provided which would form the basis for analysing the impact of a tariff on the balance of payments. • The focus of the analysis should be on the recognition that tariffs represent an expenditure switching policy which will rely significantly upon the response of the demand for imports in relation to a change in the price of imports. • Also, the analysis should recognize the overall impact of an increase in tariffs will be primarily upon the goods and services element of the balance of payments current account. No diagram Max L3–Micro diagram not acceptable 5 AO3 Evaluation • Tariffs often produce a retaliation response by those countries which have to pay the tariff. This might significantly reduce the positive impact upon the balance of payments. • The benefits of imposing a tariff regarding a balance of payments deficit will also be determined by the nature of the balance of payments deficit. Although tariffs might be suitable for a long-term, persistent deficit, alternative policies might be more effective for short-term, more temporary situations. • Alternative methods of addressing the balance of payments deficit may be more appropriate. For example, an economy experience high inflation might use a more effective expenditure reducing policy to correct this deficit. • The net effect on the current account will also be determined by the elasticity of demand for imports. Imports which are deemed inelastic will increase, rather than reduce total expenditure on imports when the price of imports rises. • Other potential negative effects on the economy also need to be considered. For example, the loss of producer and consumer surplus. • A conclusion might attempt to form an overall judgement on the short term and long-term impact on the balance of payments. Accept all valid responses. AO1 Knowledge and understanding and AO2 Analysis 14 AO3 Evaluation 6
More questions on Policies to correct imbalances in the current account of the balance of payments
What was in this paper
The subtopics covered by these 5 questions, and how many questions each got. Open one in a new tab to see every Cambridge question on it.
What you needed in this session
Cambridge’s own grade thresholds for 2025 Oct/Nov, Paper 4 · Variant 3. A higher threshold means an easier paper — the bar moves with how the cohort did.