Cambridge A Level Economics 9708 — 2021 Oct/Nov Paper 2 · Variant 2
9708/22/O/N/21 · 4 questions · 40 marks · ≈45 min
The question paper and its mark scheme, free to read here and free to download. This is Cambridge’s own paper, exactly as it was sat.
Question paper4 pages
Mark scheme15 pages
Answers below. Sit the paper first if you are practising.
Questions as text
Q1 · India no longer the world’s fastest-growing economy Table 1.1: India – components of…
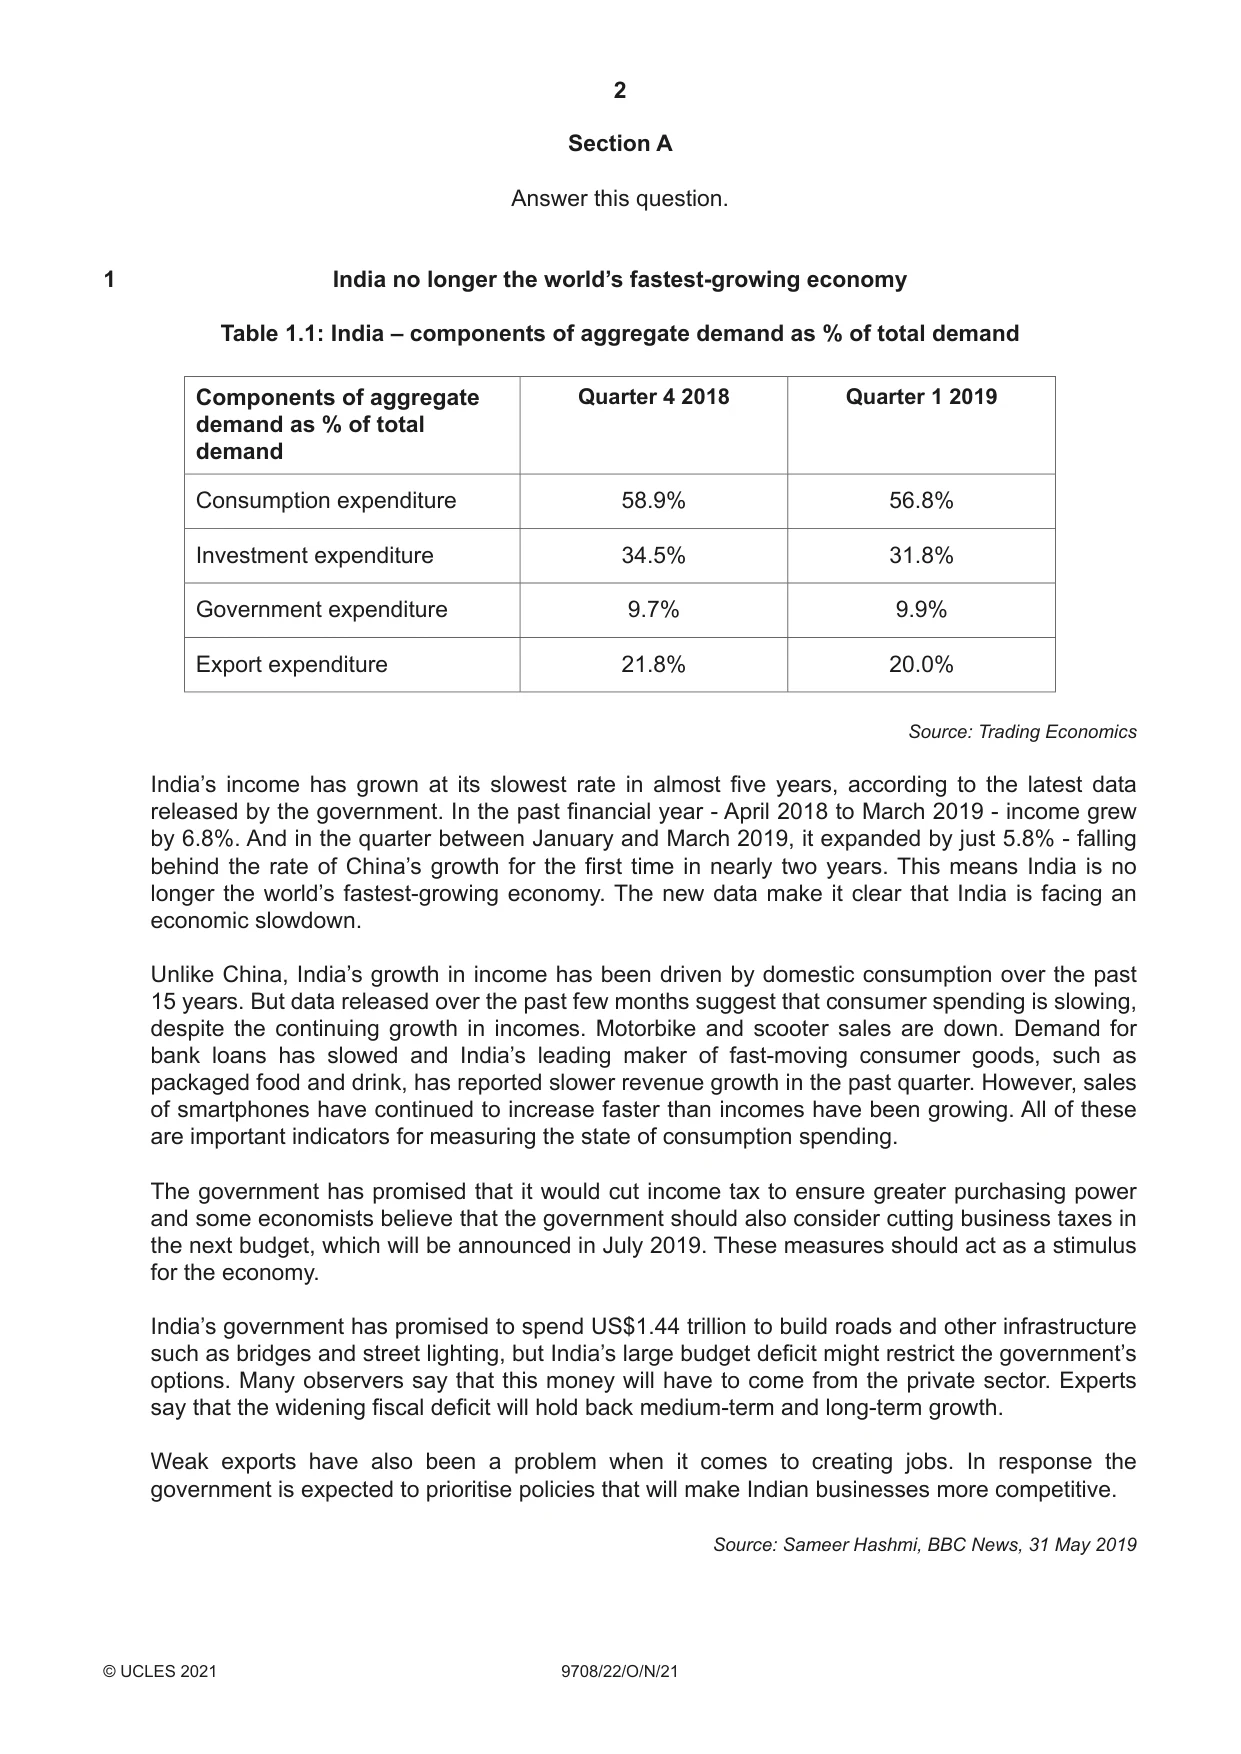
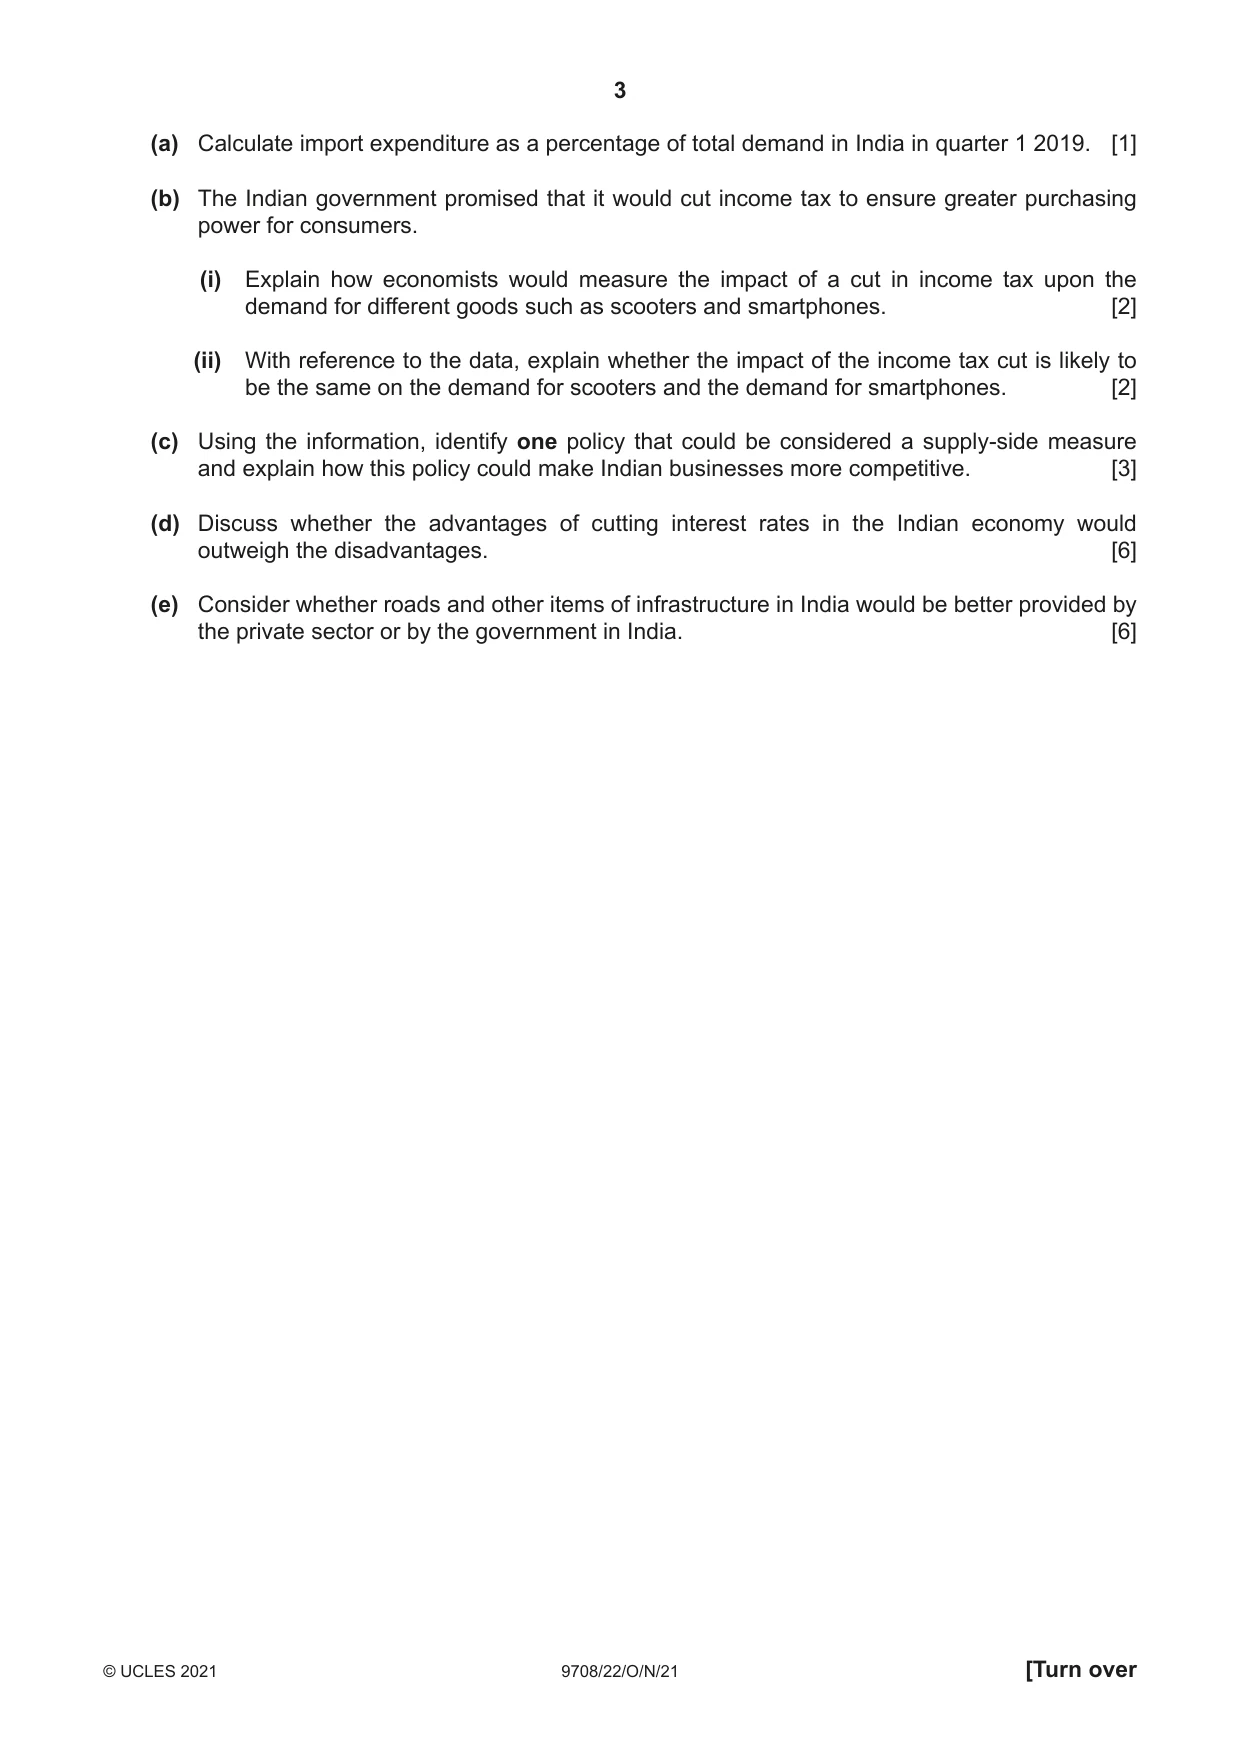
1 India no longer the world’s fastest-growing economy Table 1.1: India – components of aggregate demand as % of total demand Components of aggregate Quarter 4 2018 Quarter 1 2019 demand as % of total demand Consumption expenditure 58.9% 56.8% Investment expenditure 34.5% 31.8% Government expenditure 9.7% 9.9% Export expenditure 21.8% 20.0% Source: Trading Economics India’s income has grown at its slowest rate in almost five years, according to the latest data released by the government. In the past financial year - April 2018 to March 2019 - income grew by 6.8%. And in the quarter between January and March 2019, it expanded by just 5.8% - falling behind the rate of China’s growth for the first time in nearly two years. This means India is no longer the world’s fastest-growing economy. The new data make it clear that India is facing an economic slowdown. Unlike China, India’s growth in income has been driven by domestic consumption over the past 15 years. But data released over the past few months suggest that consumer spending is slowing, despite the continuing growth in incomes. Motorbike and scooter sales are down. Demand for bank loans has slowed and India’s leading maker of fast-moving consumer goods, such as packaged food and drink, has reported slower revenue growth in the past quarter. However, sales of smartphones have continued to increase faster than incomes have been growing. All of these are important indicators for measuring the state of consumption spending. The government has promised that it would cut income tax to ensure greater purchasing power and some economists believe that the government should also consider cutting business taxes in the next budget, which will be announced in July 2019. These measures should act as a stimulus for the economy. India’s government has promised to spend US$1.44 trillion to build roads and other infrastructure such as bridges and street lighting, but India’s large budget deficit might restrict the government’s options. Many observers say that this money will have to come from the private sector. Experts say that the widening fiscal deficit will hold back medium-term and long-term growth. Weak exports have also been a problem when it comes to creating jobs. In response the government is expected to prioritise policies that will make Indian businesses more competitive. Source: Sameer Hashmi, BBC News, 31 May 2019 (a) Calculate import expenditure as a percentage of total demand in India in quarter 1 2019. [1] (b) The Indian government promised that it would cut income tax to ensure greater purchasing power for consumers. (i) Explain how economists would measure the impact of a cut in income tax upon the demand for different goods such as scooters and smartphones. [2] (ii) With reference to the data, explain whether the impact of the income tax cut is likely to be the same on the demand for scooters and the demand for smartphones. [2] (c) Using the information, identify one policy that could be considered a supply-side measure and explain how this policy could make Indian businesses more competitive. [3] (d) Discuss whether the advantages of cutting interest rates in the Indian economy would outweigh the disadvantages. [6] (e) Consider whether roads and other items of infrastructure in India would be better provided by the private sector or by the government in India. [6]
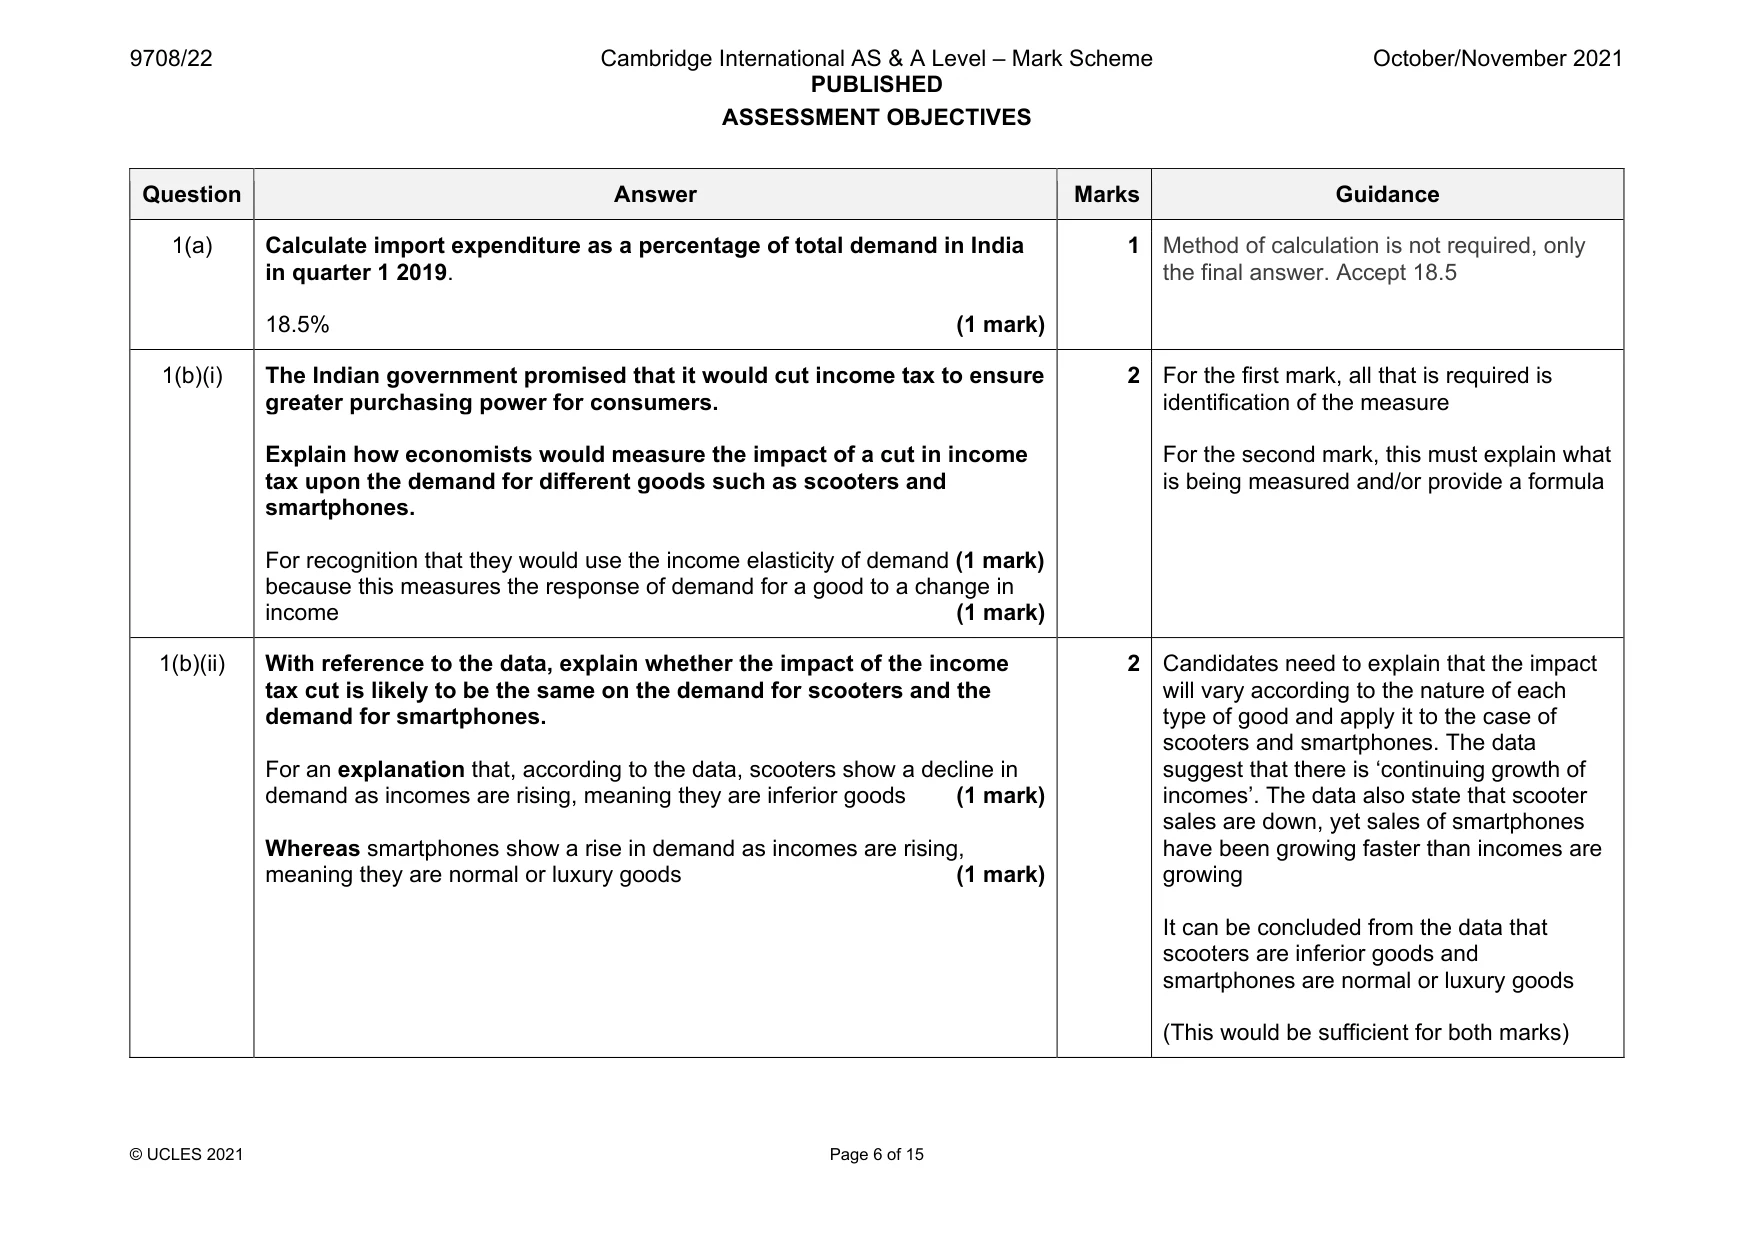
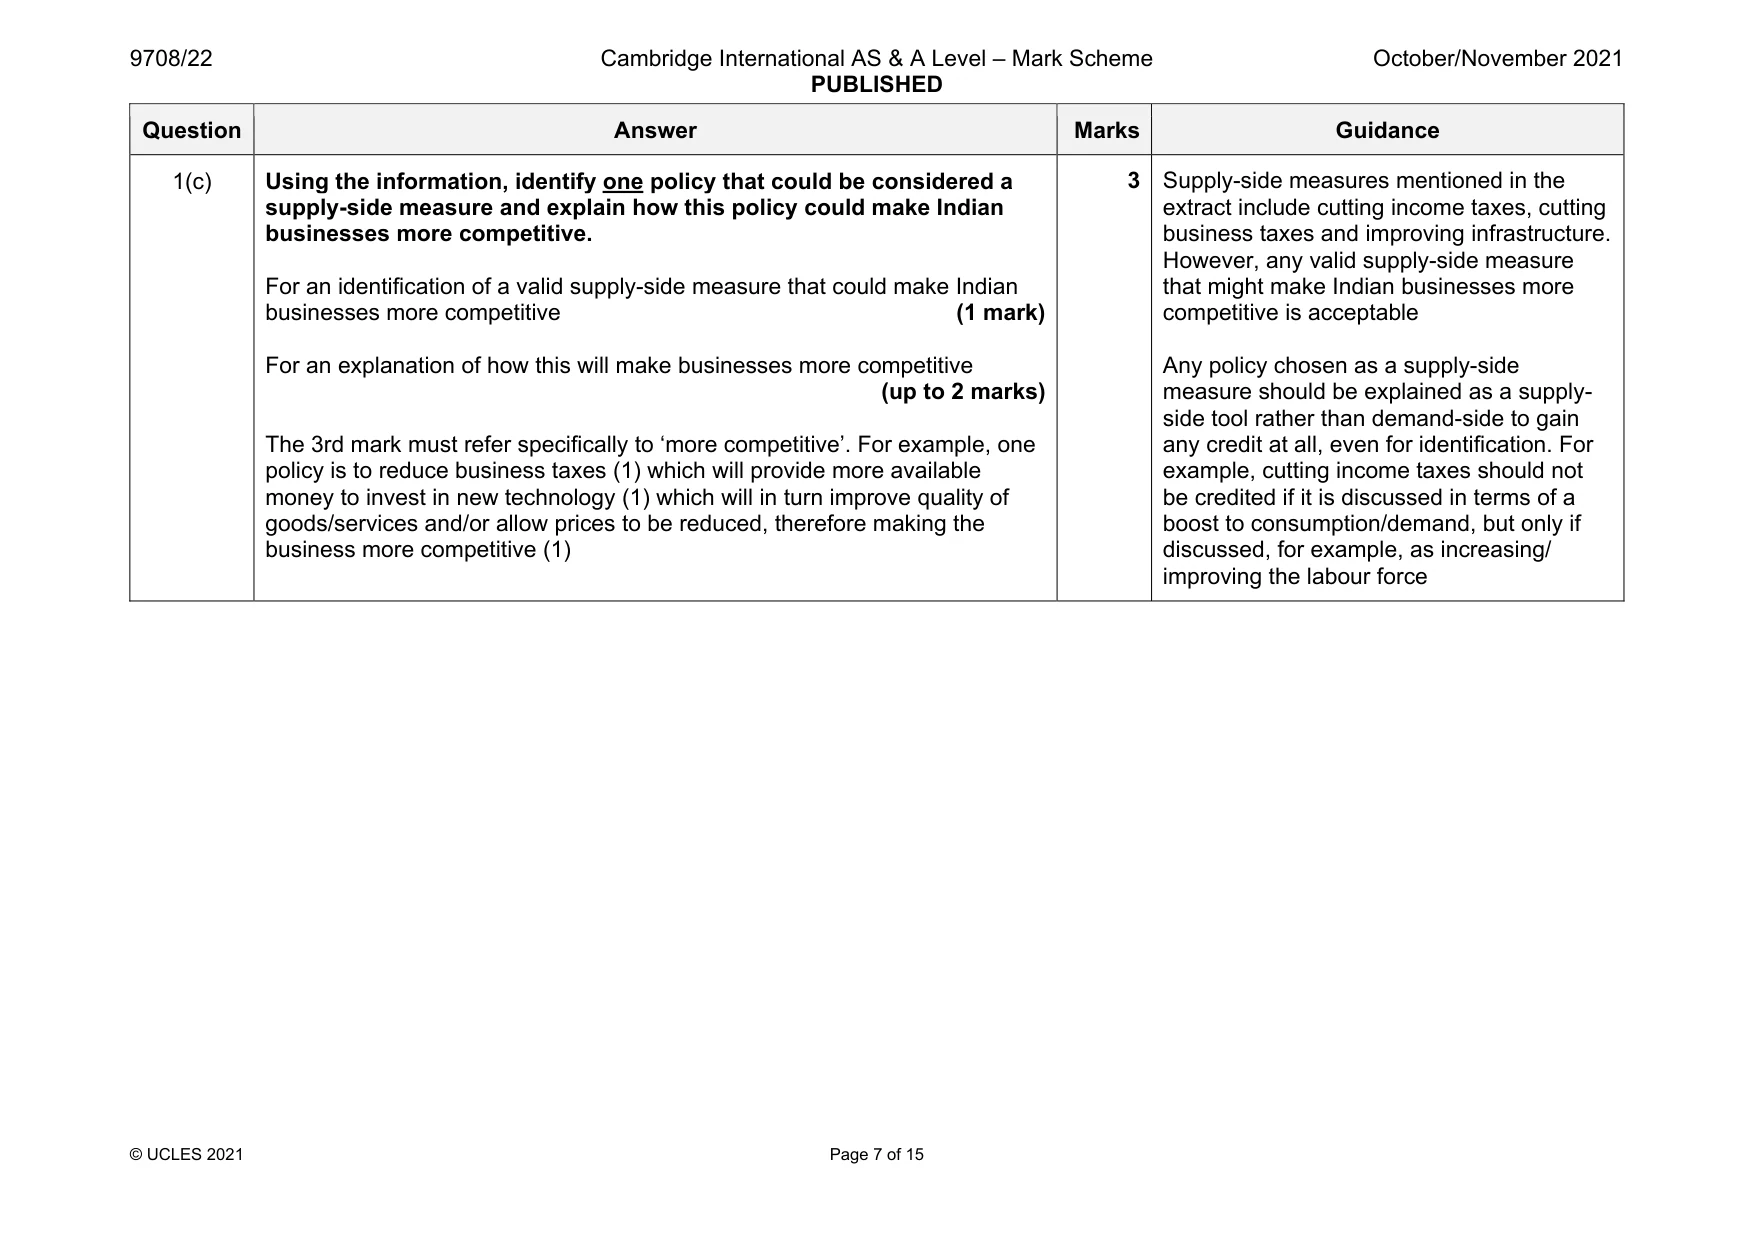
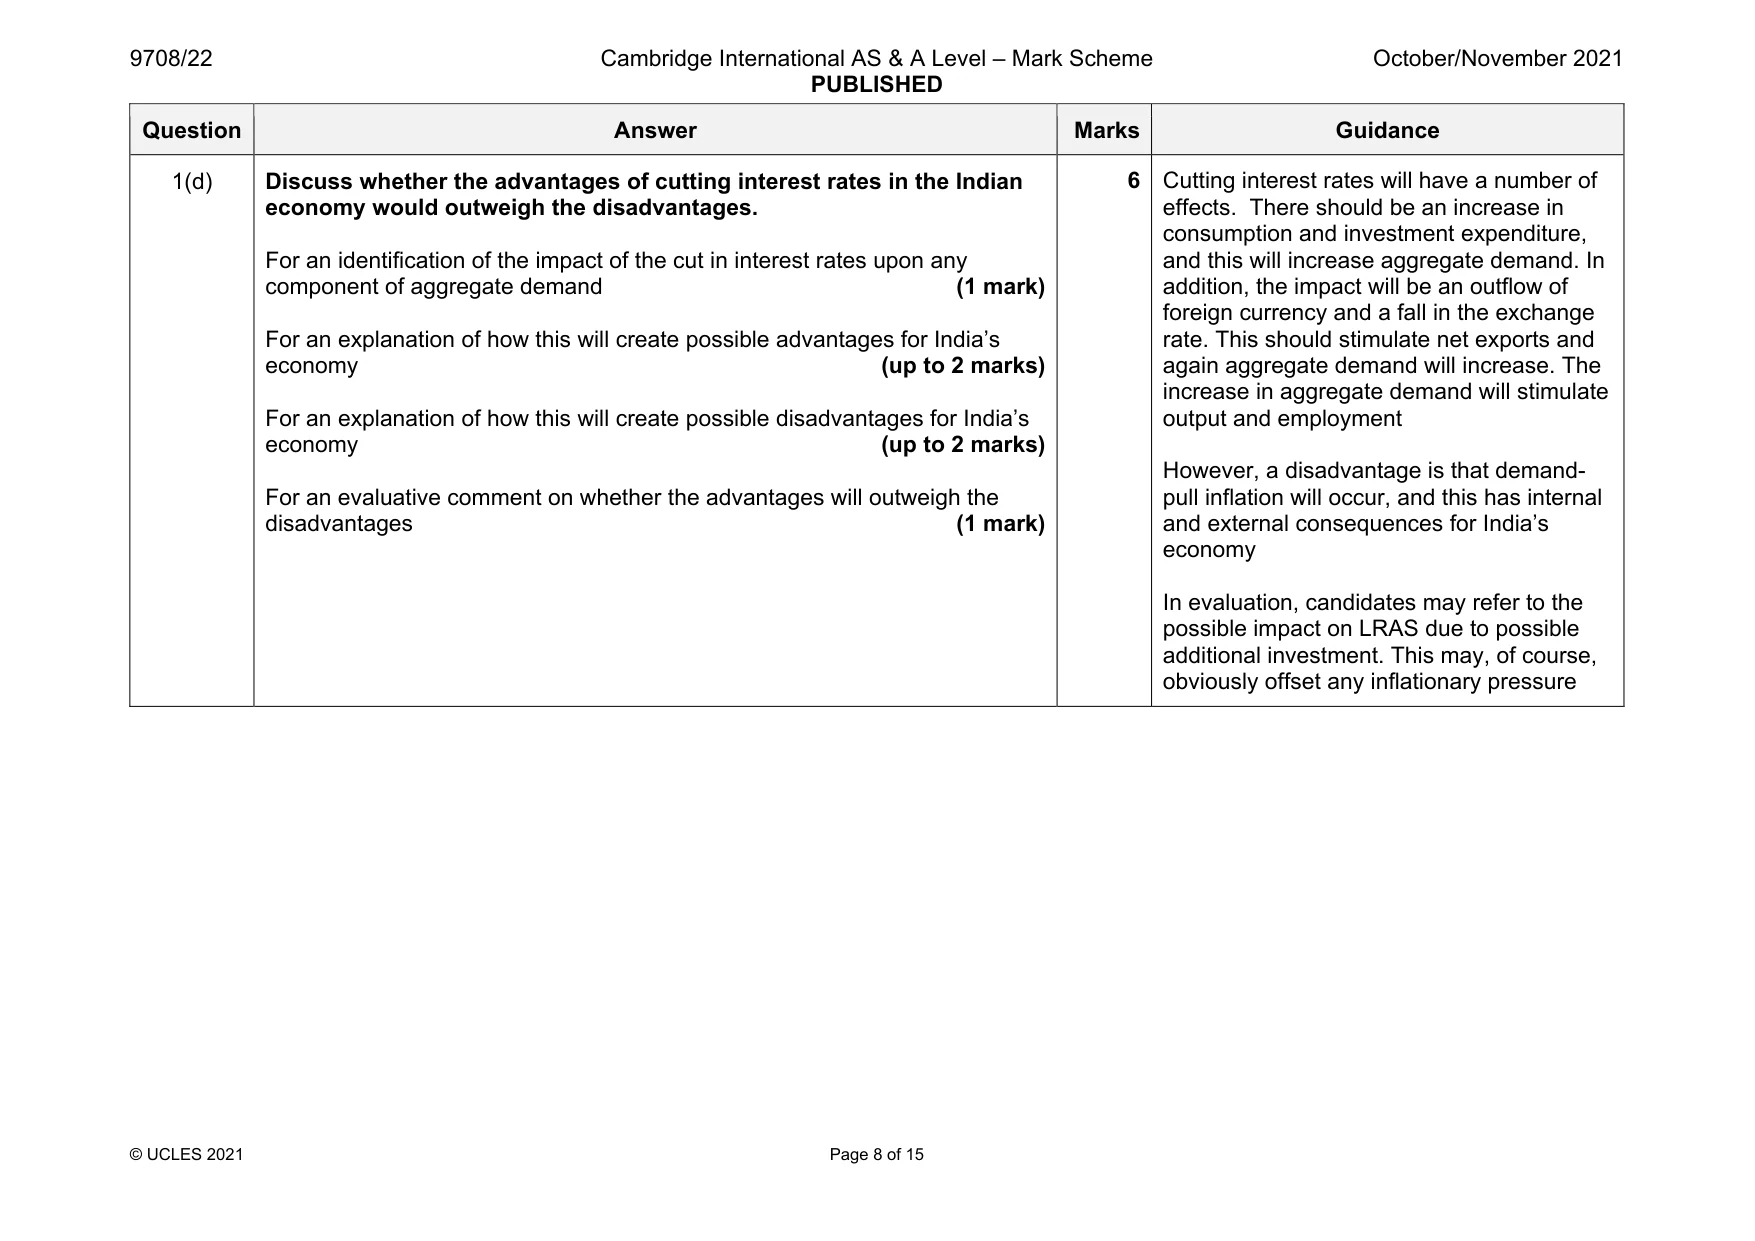
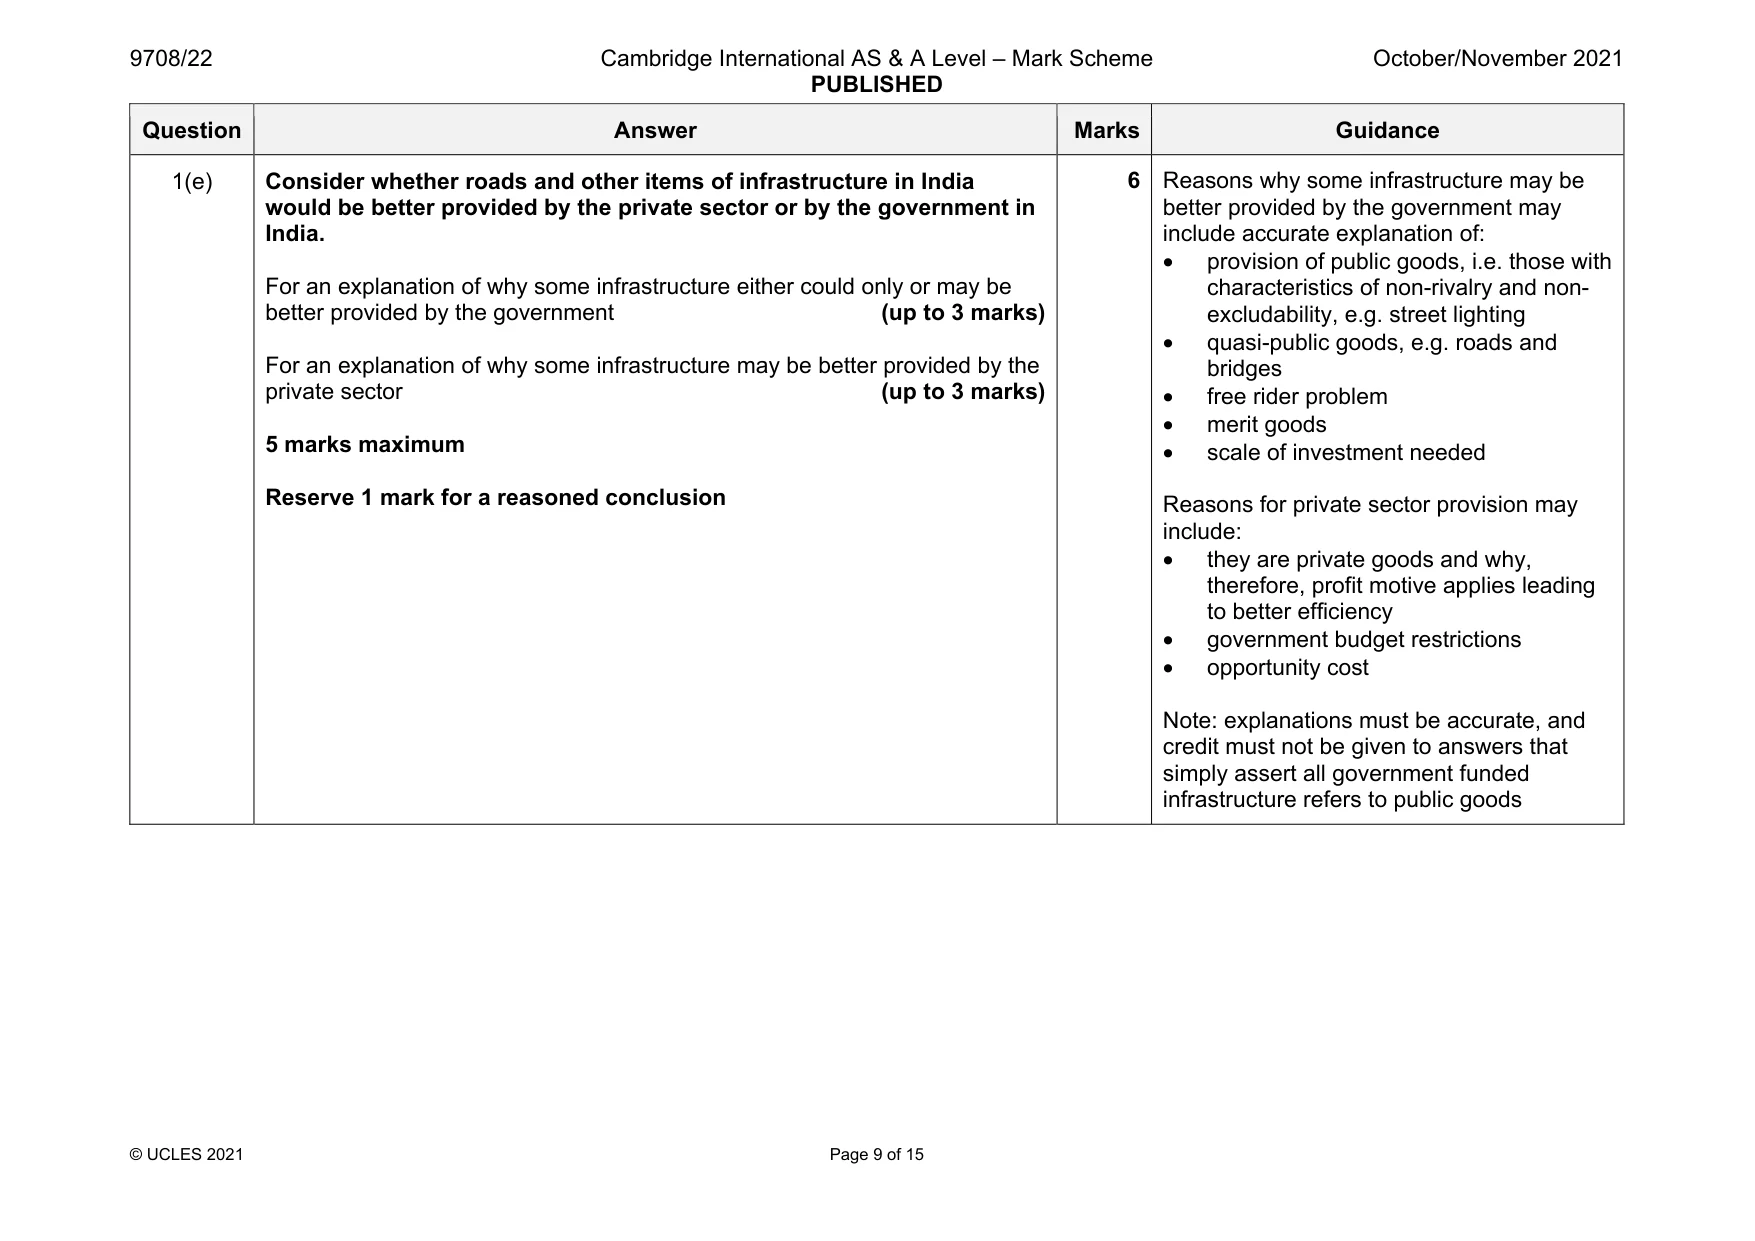
Mark scheme: 1(a) Calculate import expenditure as a percentage of total demand in India in quarter 1 2019. 18.5% (1 mark) the final answer. Accept 18.5 1(b)(i) The Indian government promised that it would cut income tax to ensure greater purchasing power for consumers. Explain how economists would measure the impact of a cut in income tax upon the demand for different goods such as scooters and smartphones. For recognition that they would use the income elasticity of demand (1 mark) because this measures the response of demand for a good to a change in income (1 mark) 2 For the first mark, all that is required is identification of the measure For the second mark, this must explain what is being measured and/or provide a formula 1(b)(ii) With reference to the data, explain whether the impact of the income tax cut is likely to be the same on the demand for scooters and the demand for smartphones. For an explanation that, according to the data, scooters show a decline in demand as incomes are rising, meaning they are inferior goods (1 mark) Whereas smartphones show a rise in demand as incomes are rising, meaning they are normal or luxury goods (1 mark) 2 Candidates need to explain that the impact will vary according to the nature of each type of good and apply it to the case of scooters and smartphones. The data suggest that there is ‘continuing growth of incomes’. The data also state that scooter sales are down, yet sales of smartphones have been growing faster than incomes are growing It can be concluded from the data that scooters are inferior goods and smartphones are normal or luxury goods (This would be sufficient for both marks) Question Answer Marks Guidance 1(c) Using the information, identify one policy that could be considered a supply-side measure and explain how this policy could make Indian businesses more competitive. For an identification of a valid supply-side measure that could make Indian businesses more competitive (1 mark) For an explanation of how this will make businesses more competitive (up to 2 marks) The 3rd mark must refer specifically to ‘more competitive’. For example, one policy is to reduce business taxes (1) which will provide more available money to invest in new technology (1) which will in turn improve quality of goods/services and/or allow prices to be reduced, therefore making the business more competitive (1) 3 Supply-side measures mentioned in the extract include cutting income taxes, cutting business taxes and improving infrastructure. However, any valid supply-side measure that might make Indian businesses more competitive is acceptable Any policy chosen as a supply-side measure should be explained as a supply- side tool rather than demand-side to gain any credit at all, even for identification. For example, cutting income taxes should not be credited if it is discussed in terms of a boost to consumption/demand, but only if discussed, for example, as increasing/ improving the labour force Question Answer Marks Guidance 1(d) Discuss whether the advantages of cutting interest rates in the Indian economy would outweigh the disadvantages. For an identification of the impact of the cut in interest rates upon any component of aggregate demand (1 mark) For an explanation of how this will create possible advantages for India’s economy (up to 2 marks) For an explanation of how this will create possible disadvantages for India’s economy (up to 2 marks) For an evaluative comment on whether the advantages will outweigh the disadvantages (1 mark) 6 Cutting interest rates will have a number of effects. There should be an increase in consumption and investment expenditure, and this will increase aggregate demand. In addition, the impact will be an outflow of foreign currency and a fall in the exchange rate. This should stimulate net exports and again aggregate demand will increase. The increase in aggregate demand will stimulate output and employment However, a disadvantage is that demand- pull inflation will occur, and this has internal and external consequences for India’s economy In evaluation, candidates may refer to the possible impact on LRAS due to possible additional investment. This may, of course, obviously offset any inflationary pressure Question Answer Marks Guidance 1(e) Consider whether roads and other items of infrastructure in India would be better provided by the private sector or by the government in India. For an explanation of why some infrastructure either could only or may be better provided by the government (up to 3 marks) For an explanation of why some infrastructure may be better provided by the private sector (up to 3 marks) 5 marks maximum Reserve 1 mark for a reasoned conclusion 6 Reasons why some infrastructure may be better provided by the government may include accurate explanation of: • provision of public goods, i.e. those with characteristics of non-rivalry and non- excludability, e.g. street lighting • quasi-public goods, e.g. roads and bridges • free rider problem • merit goods • scale of investment needed Reasons for private sector provision may include: • they are private goods and why, therefore, profit motive applies leading to better efficiency • government budget restrictions • opportunity cost Note: explanations must be accurate, and credit must not be given to answers that simply assert all government funded infrastructure refers to public goods
More questions on Price elasticity, income elasticity and cross elasticity of demand
Q2 · Use a diagram(s) to explain how a production possibility curve can be used to show…
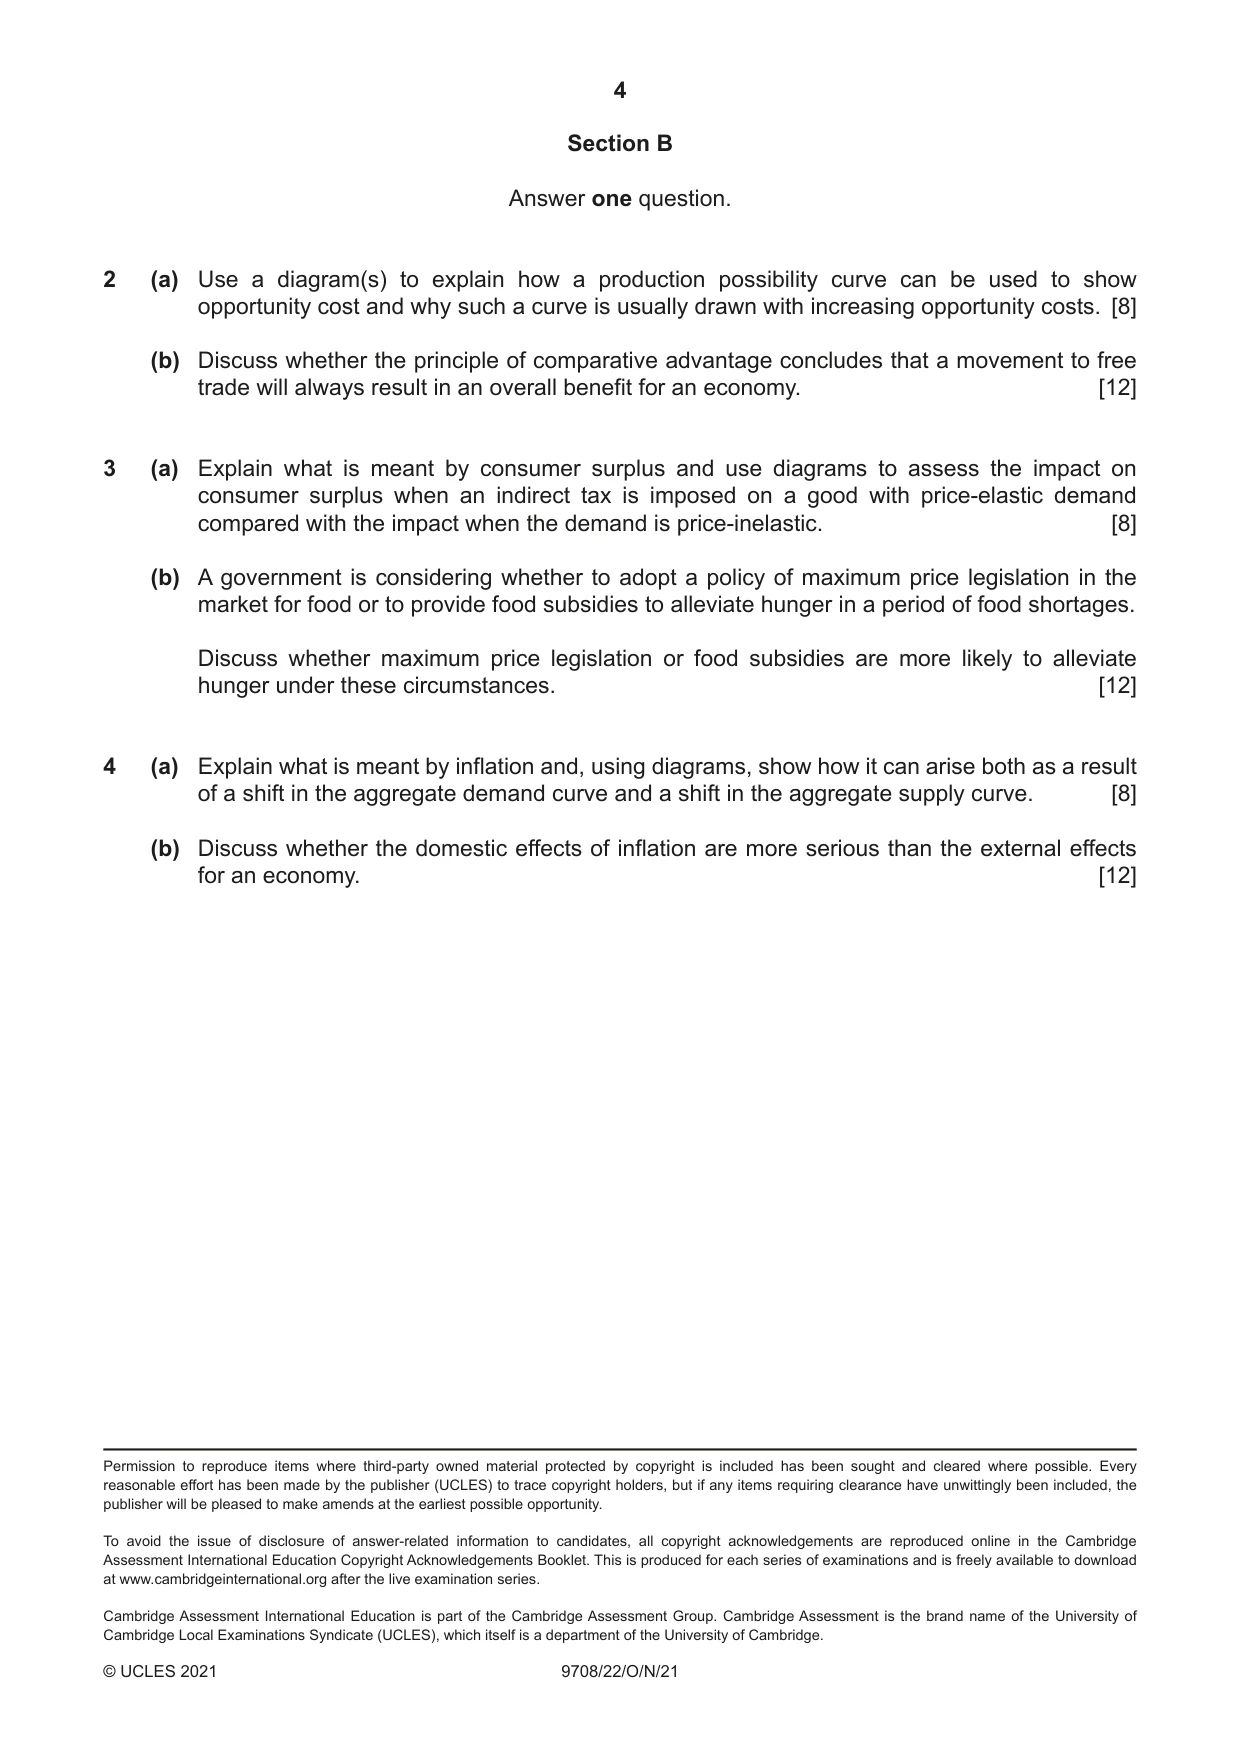
2 (a) Use a diagram(s) to explain how a production possibility curve can be used to show opportunity cost and why such a curve is usually drawn with increasing opportunity costs. [8] (b) Discuss whether the principle of comparative advantage concludes that a movement to free trade will always result in an overall benefit for an economy. [12]
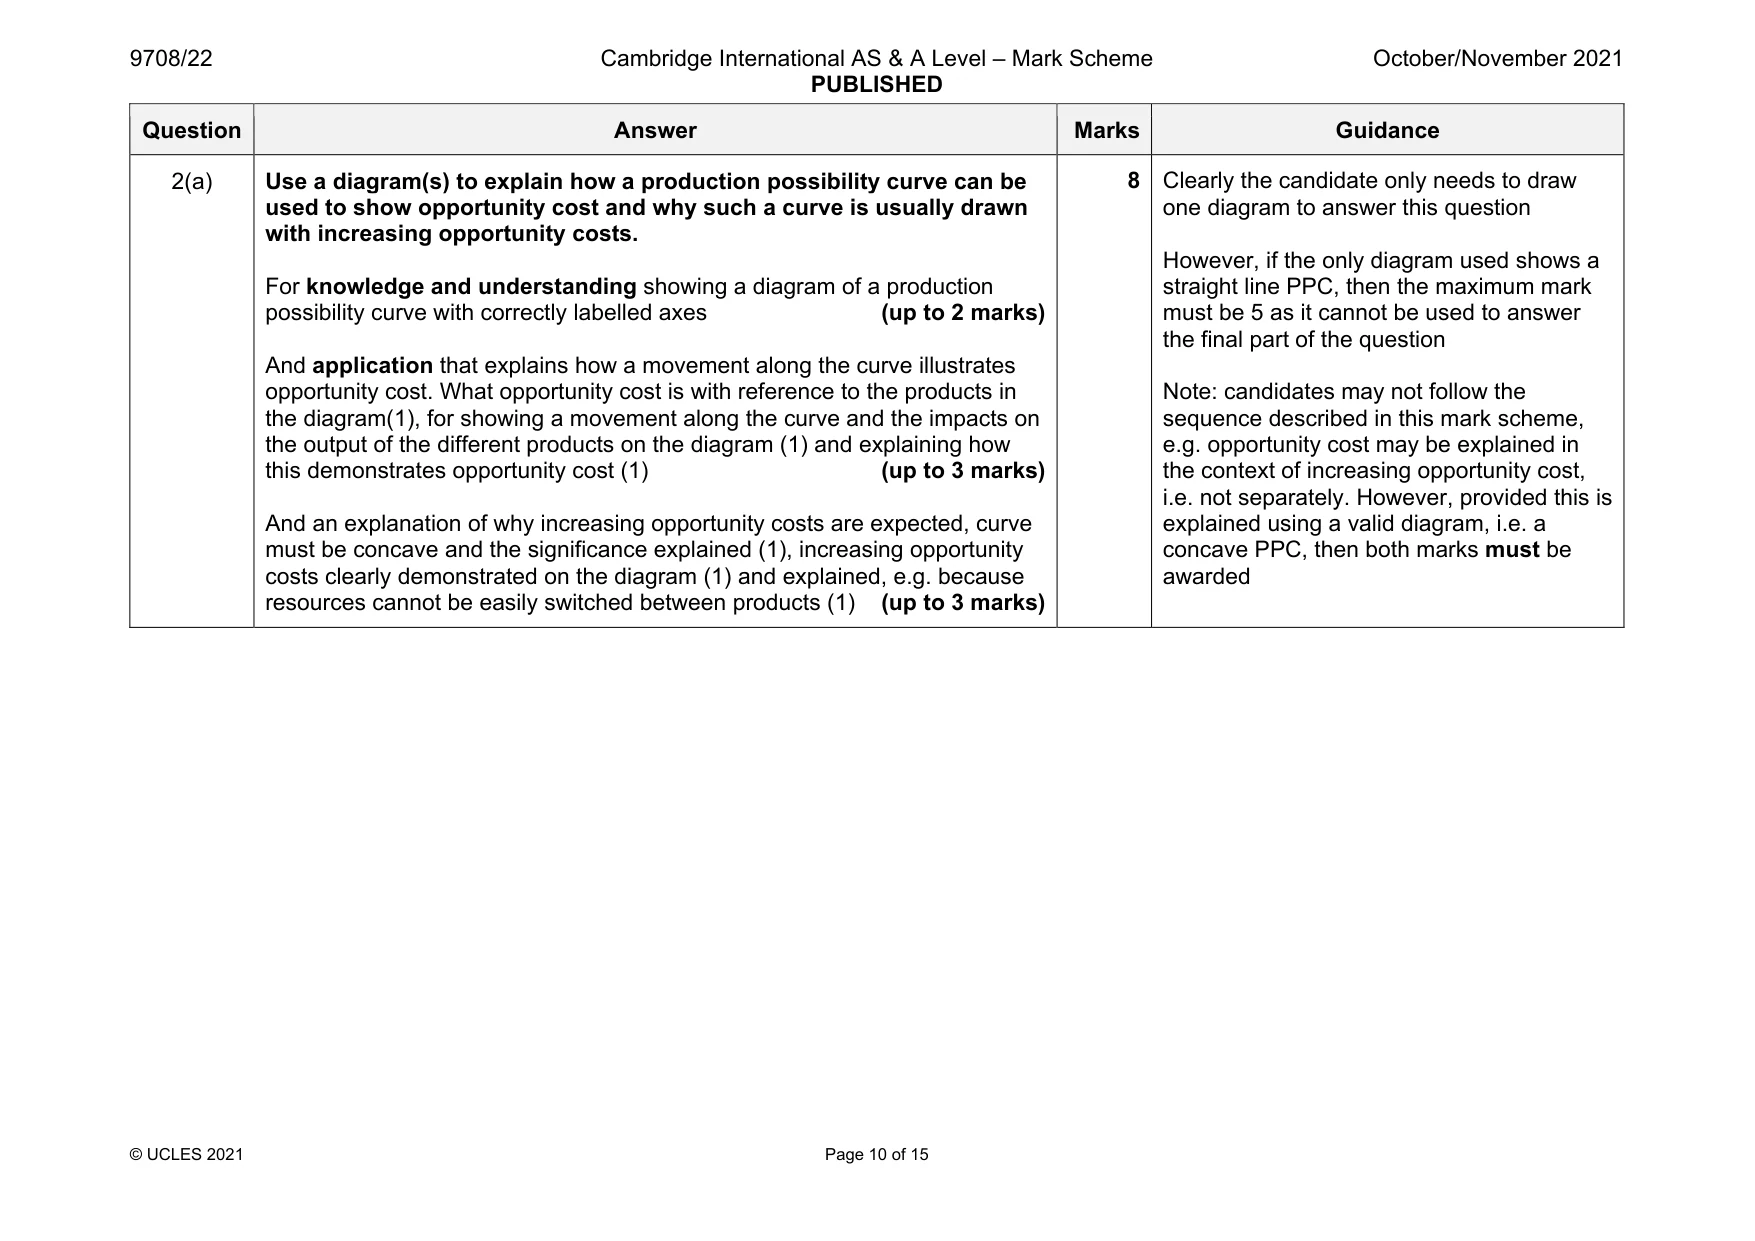
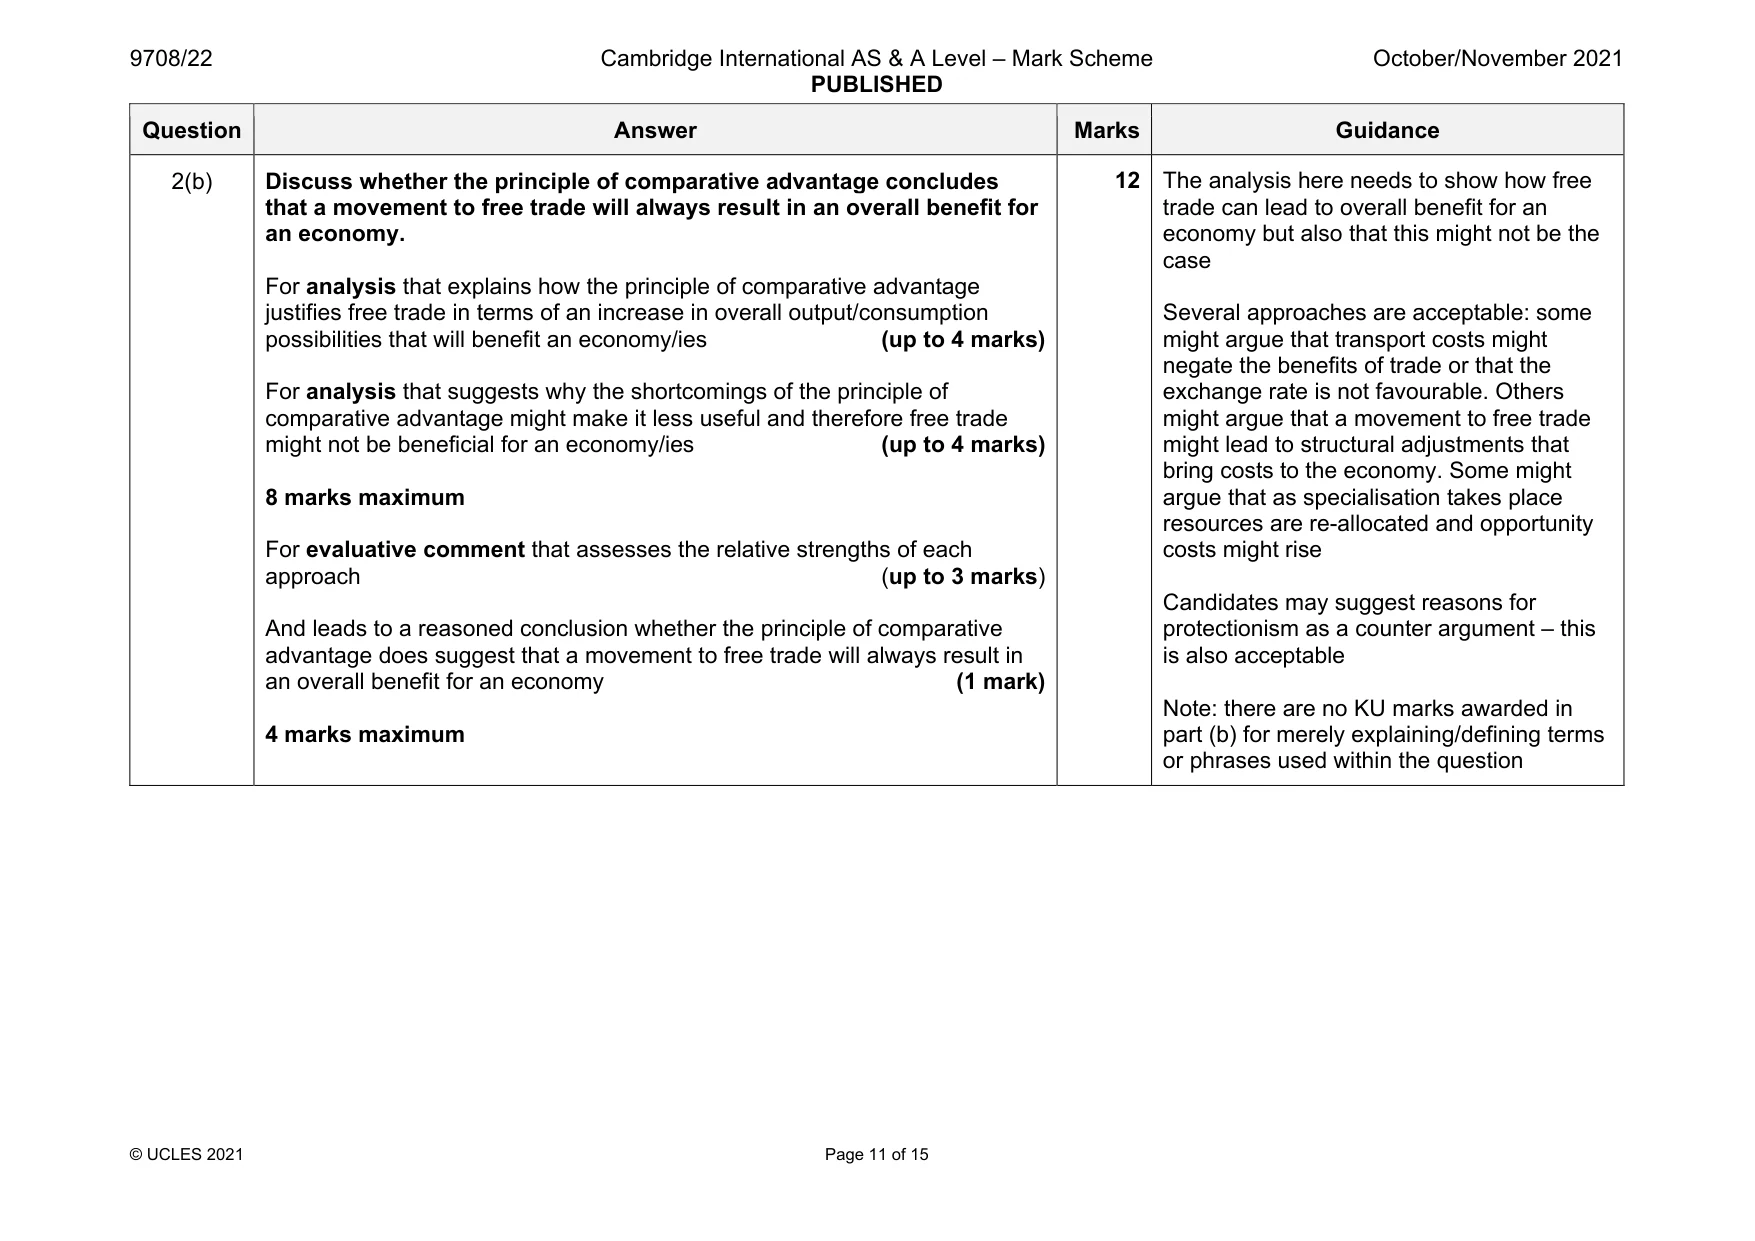
Mark scheme: 2(a) Use a diagram(s) to explain how a production possibility curve can be used to show opportunity cost and why such a curve is usually drawn with increasing opportunity costs. For knowledge and understanding showing a diagram of a production possibility curve with correctly labelled axes (up to 2 marks) And application that explains how a movement along the curve illustrates opportunity cost. What opportunity cost is with reference to the products in the diagram(1), for showing a movement along the curve and the impacts on the output of the different products on the diagram (1) and explaining how this demonstrates opportunity cost (1) (up to 3 marks) And an explanation of why increasing opportunity costs are expected, curve must be concave and the significance explained (1), increasing opportunity costs clearly demonstrated on the diagram (1) and explained, e.g. because resources cannot be easily switched between products (1) (up to 3 marks) one diagram to answer this question However, if the only diagram used shows a straight line PPC, then the maximum mark must be 5 as it cannot be used to answer the final part of the question Note: candidates may not follow the sequence described in this mark scheme, e.g. opportunity cost may be explained in the context of increasing opportunity cost, i.e. not separately. However, provided this is explained using a valid diagram, i.e. a concave PPC, then both marks must be awarded Question Answer Marks Guidance 2(b) Discuss whether the principle of comparative advantage concludes that a movement to free trade will always result in an overall benefit for an economy. For analysis that explains how the principle of comparative advantage justifies free trade in terms of an increase in overall output/consumption possibilities that will benefit an economy/ies (up to 4 marks) For analysis that suggests why the shortcomings of the principle of comparative advantage might make it less useful and therefore free trade might not be beneficial for an economy/ies (up to 4 marks) 8 marks maximum For evaluative comment that assesses the relative strengths of each approach (up to 3 marks) And leads to a reasoned conclusion whether the principle of comparative advantage does suggest that a movement to free trade will always result in an overall benefit for an economy (1 mark) 4 marks maximum 12 The analysis here needs to show how free trade can lead to overall benefit for an economy but also that this might not be the case Several approaches are acceptable: some might argue that transport costs might negate the benefits of trade or that the exchange rate is not favourable. Others might argue that a movement to free trade might lead to structural adjustments that bring costs to the economy. Some might argue that as specialisation takes place resources are re-allocated and opportunity costs might rise Candidates may suggest reasons for protectionism as a counter argument – this is also acceptable Note: there are no KU marks awarded in part (b) for merely explaining/defining terms or phrases used within the question
Q3 · Explain what is meant by consumer surplus and use diagrams to assess the impact on…
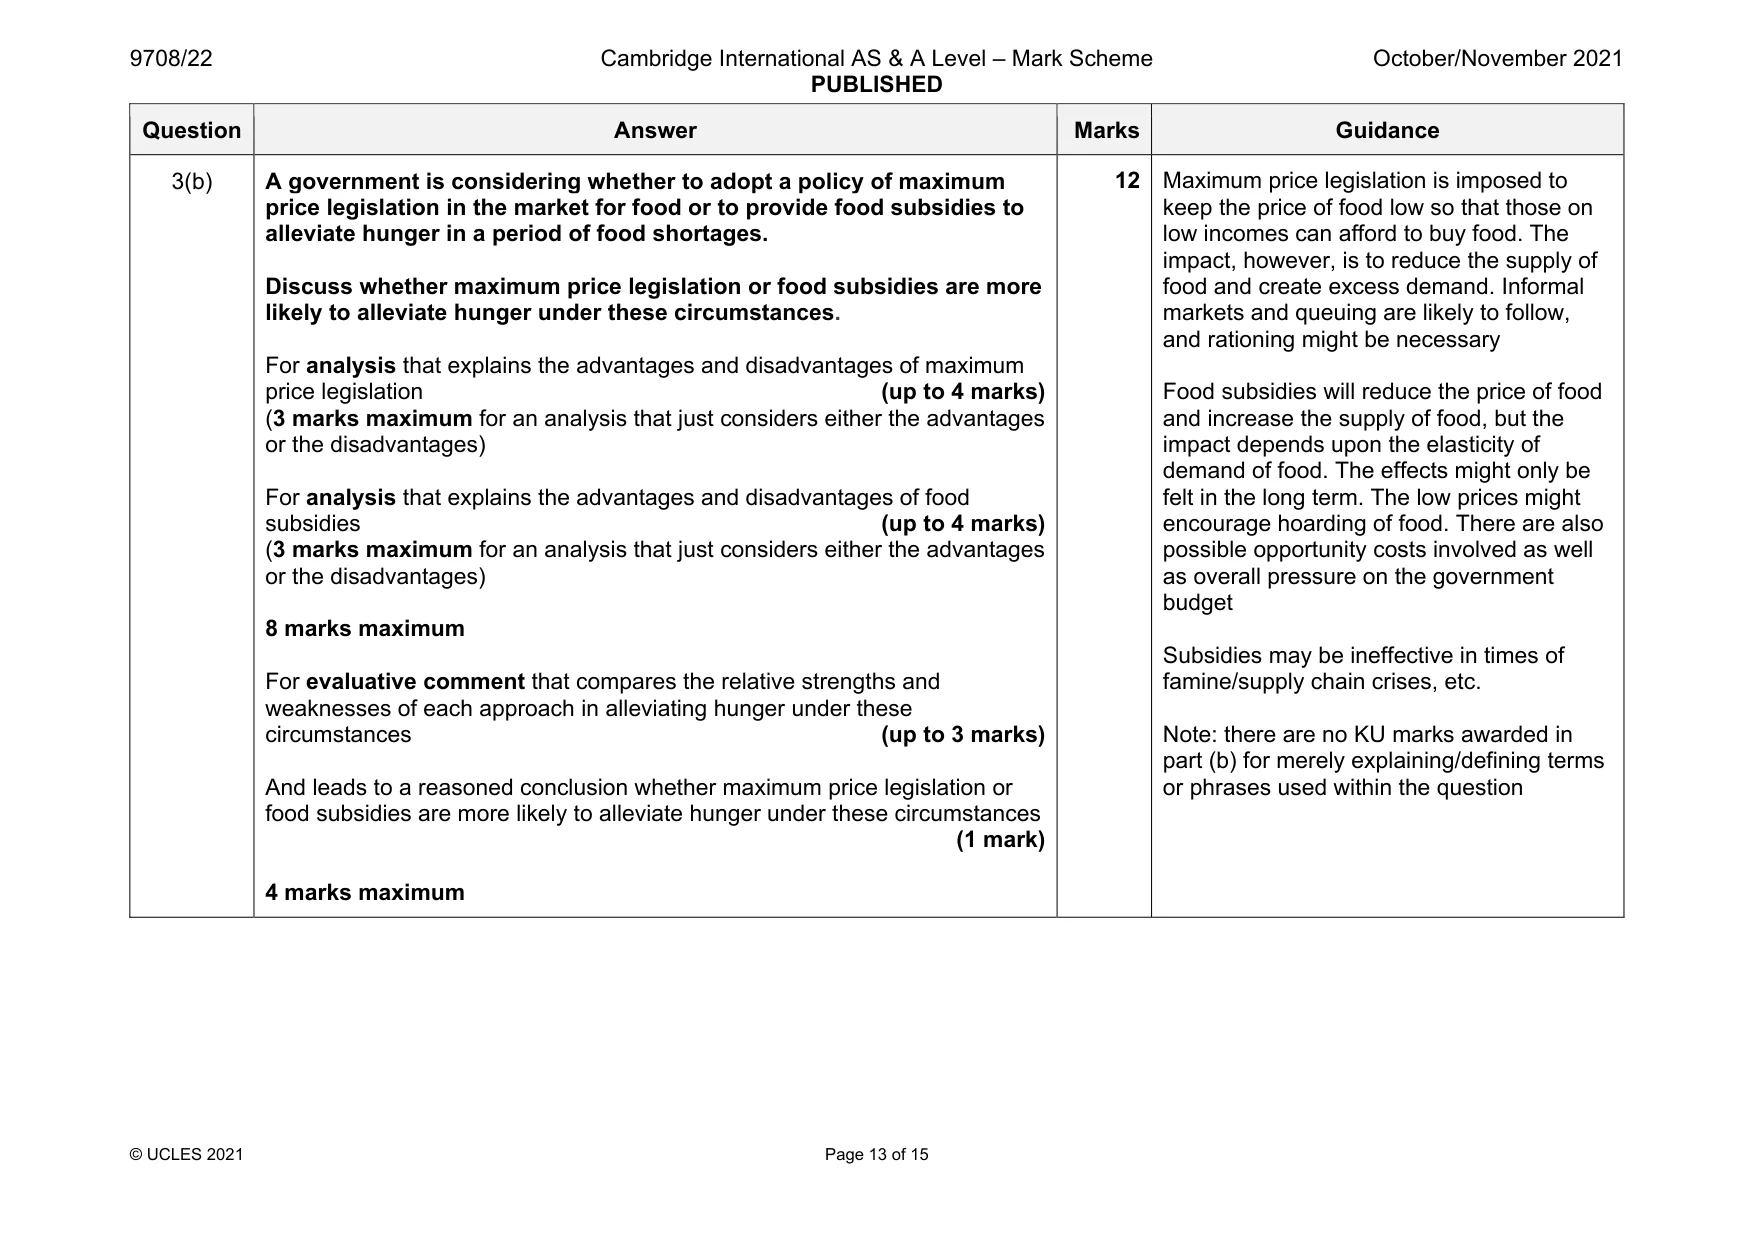
3 (a) Explain what is meant by consumer surplus and use diagrams to assess the impact on consumer surplus when an indirect tax is imposed on a good with price-elastic demand compared with the impact when the demand is price-inelastic. [8] (b) A government is considering whether to adopt a policy of maximum price legislation in the market for food or to provide food subsidies to alleviate hunger in a period of food shortages. Discuss whether maximum price legislation or food subsidies are more likely to alleviate hunger under these circumstances. [12]
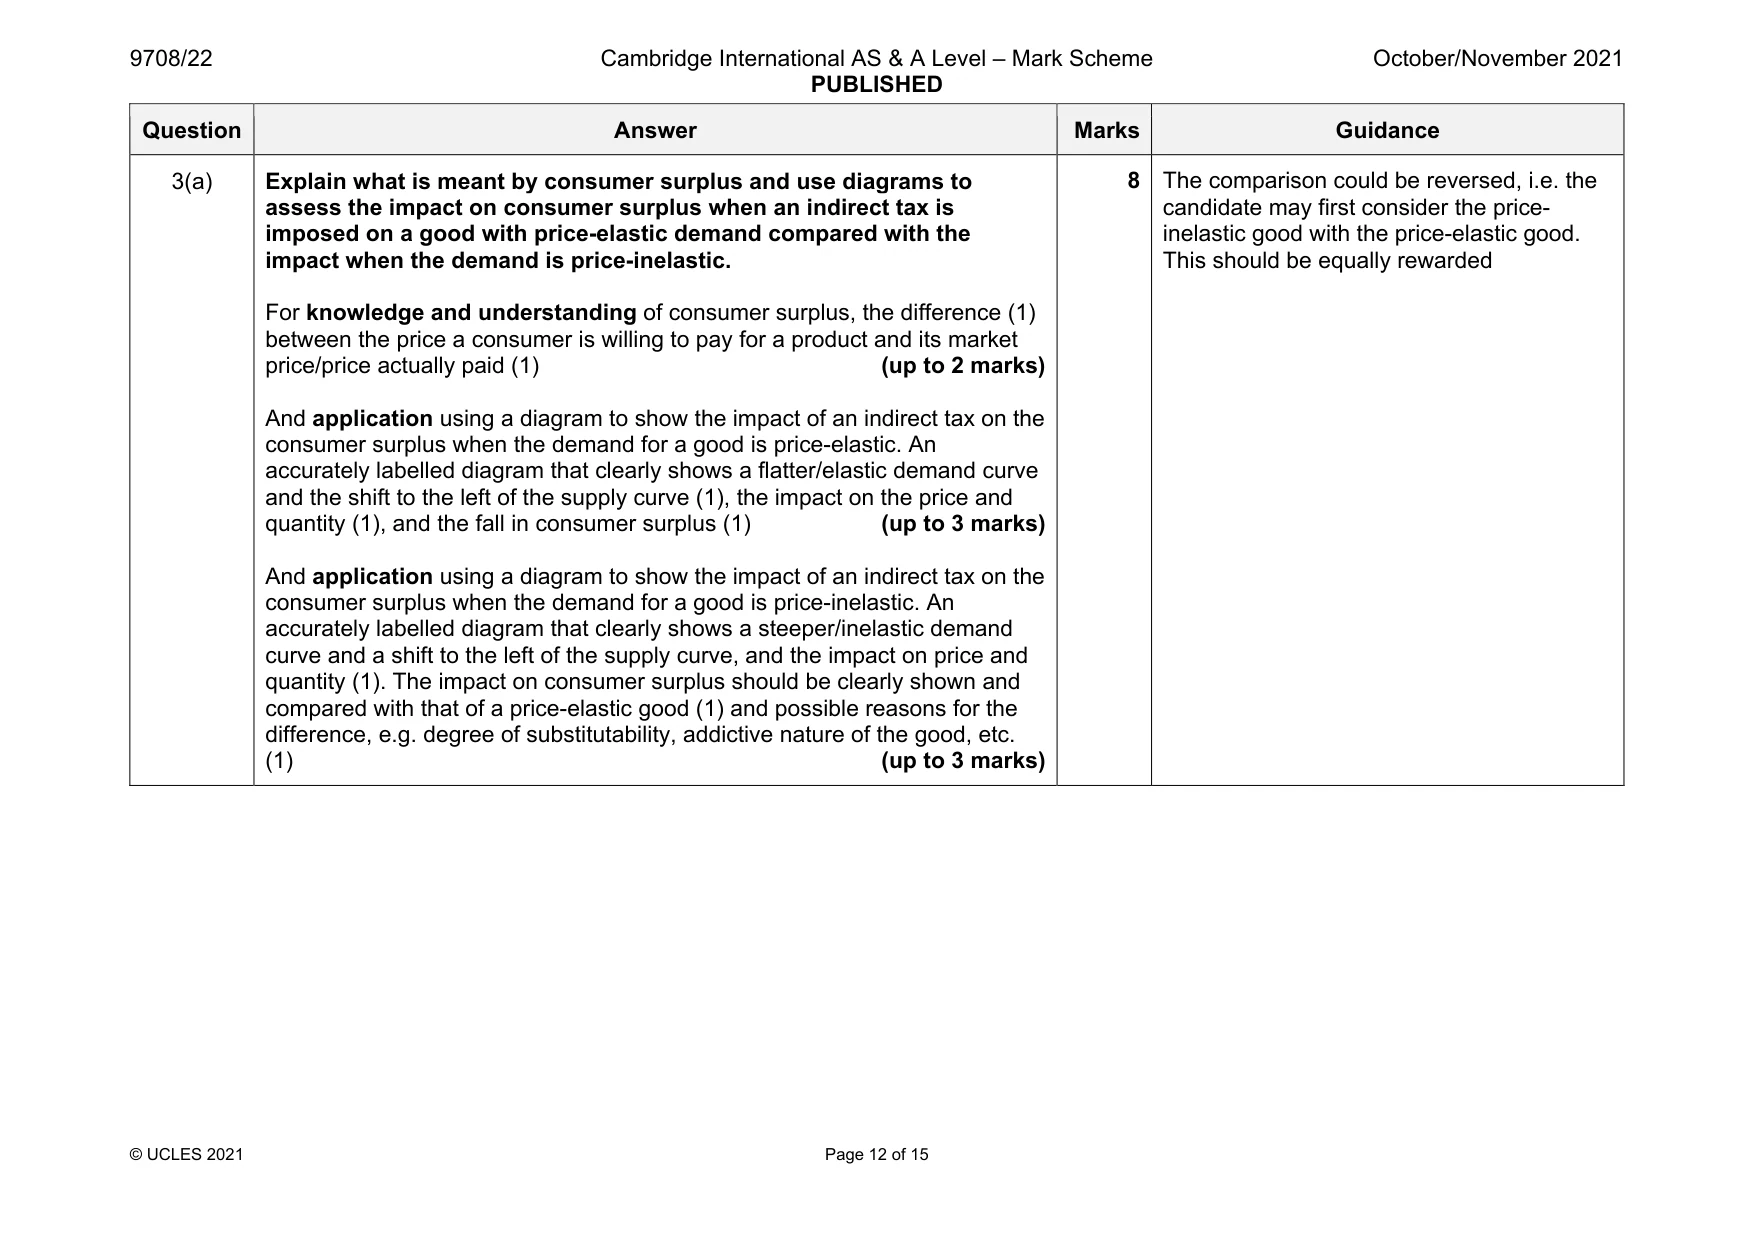
Mark scheme: 3(a) Explain what is meant by consumer surplus and use diagrams to assess the impact on consumer surplus when an indirect tax is imposed on a good with price-elastic demand compared with the impact when the demand is price-inelastic. For knowledge and understanding of consumer surplus, the difference (1) between the price a consumer is willing to pay for a product and its market price/price actually paid (1) (up to 2 marks) And application using a diagram to show the impact of an indirect tax on the consumer surplus when the demand for a good is price-elastic. An accurately labelled diagram that clearly shows a flatter/elastic demand curve and the shift to the left of the supply curve (1), the impact on the price and quantity (1), and the fall in consumer surplus (1) (up to 3 marks) And application using a diagram to show the impact of an indirect tax on the consumer surplus when the demand for a good is price-inelastic. An accurately labelled diagram that clearly shows a steeper/inelastic demand curve and a shift to the left of the supply curve, and the impact on price and quantity (1). The impact on consumer surplus should be clearly shown and compared with that of a price-elastic good (1) and possible reasons for the difference, e.g. degree of substitutability, addictive nature of the good, etc. (1) (up to 3 marks) candidate may first consider the price- inelastic good with the price-elastic good. This should be equally rewarded Question Answer Marks Guidance 3(b) A government is considering whether to adopt a policy of maximum price legislation in the market for food or to provide food subsidies to alleviate hunger in a period of food shortages. Discuss whether maximum price legislation or food subsidies are more likely to alleviate hunger under these circumstances. For analysis that explains the advantages and disadvantages of maximum price legislation (up to 4 marks) (3 marks maximum for an analysis that just considers either the advantages or the disadvantages) For analysis that explains the advantages and disadvantages of food subsidies (up to 4 marks) (3 marks maximum for an analysis that just considers either the advantages or the disadvantages) 8 marks maximum For evaluative comment that compares the relative strengths and weaknesses of each approach in alleviating hunger under these circumstances (up to 3 marks) And leads to a reasoned conclusion whether maximum price legislation or food subsidies are more likely to alleviate hunger under these circumstances (1 mark) 4 marks maximum 12 Maximum price legislation is imposed to keep the price of food low so that those on low incomes can afford to buy food. The impact, however, is to reduce the supply of food and create excess demand. Informal markets and queuing are likely to follow, and rationing might be necessary Food subsidies will reduce the price of food and increase the supply of food, but the impact depends upon the elasticity of demand of food. The effects might only be felt in the long term. The low prices might encourage hoarding of food. There are also possible opportunity costs involved as well as overall pressure on the government budget Subsidies may be ineffective in times of famine/supply chain crises, etc. Note: there are no KU marks awarded in part (b) for merely explaining/defining terms or phrases used within the question
More questions on Methods and effects of government intervention in markets
Q4 · Explain what is meant by inflation and, using diagrams, show how it can arise both as a…
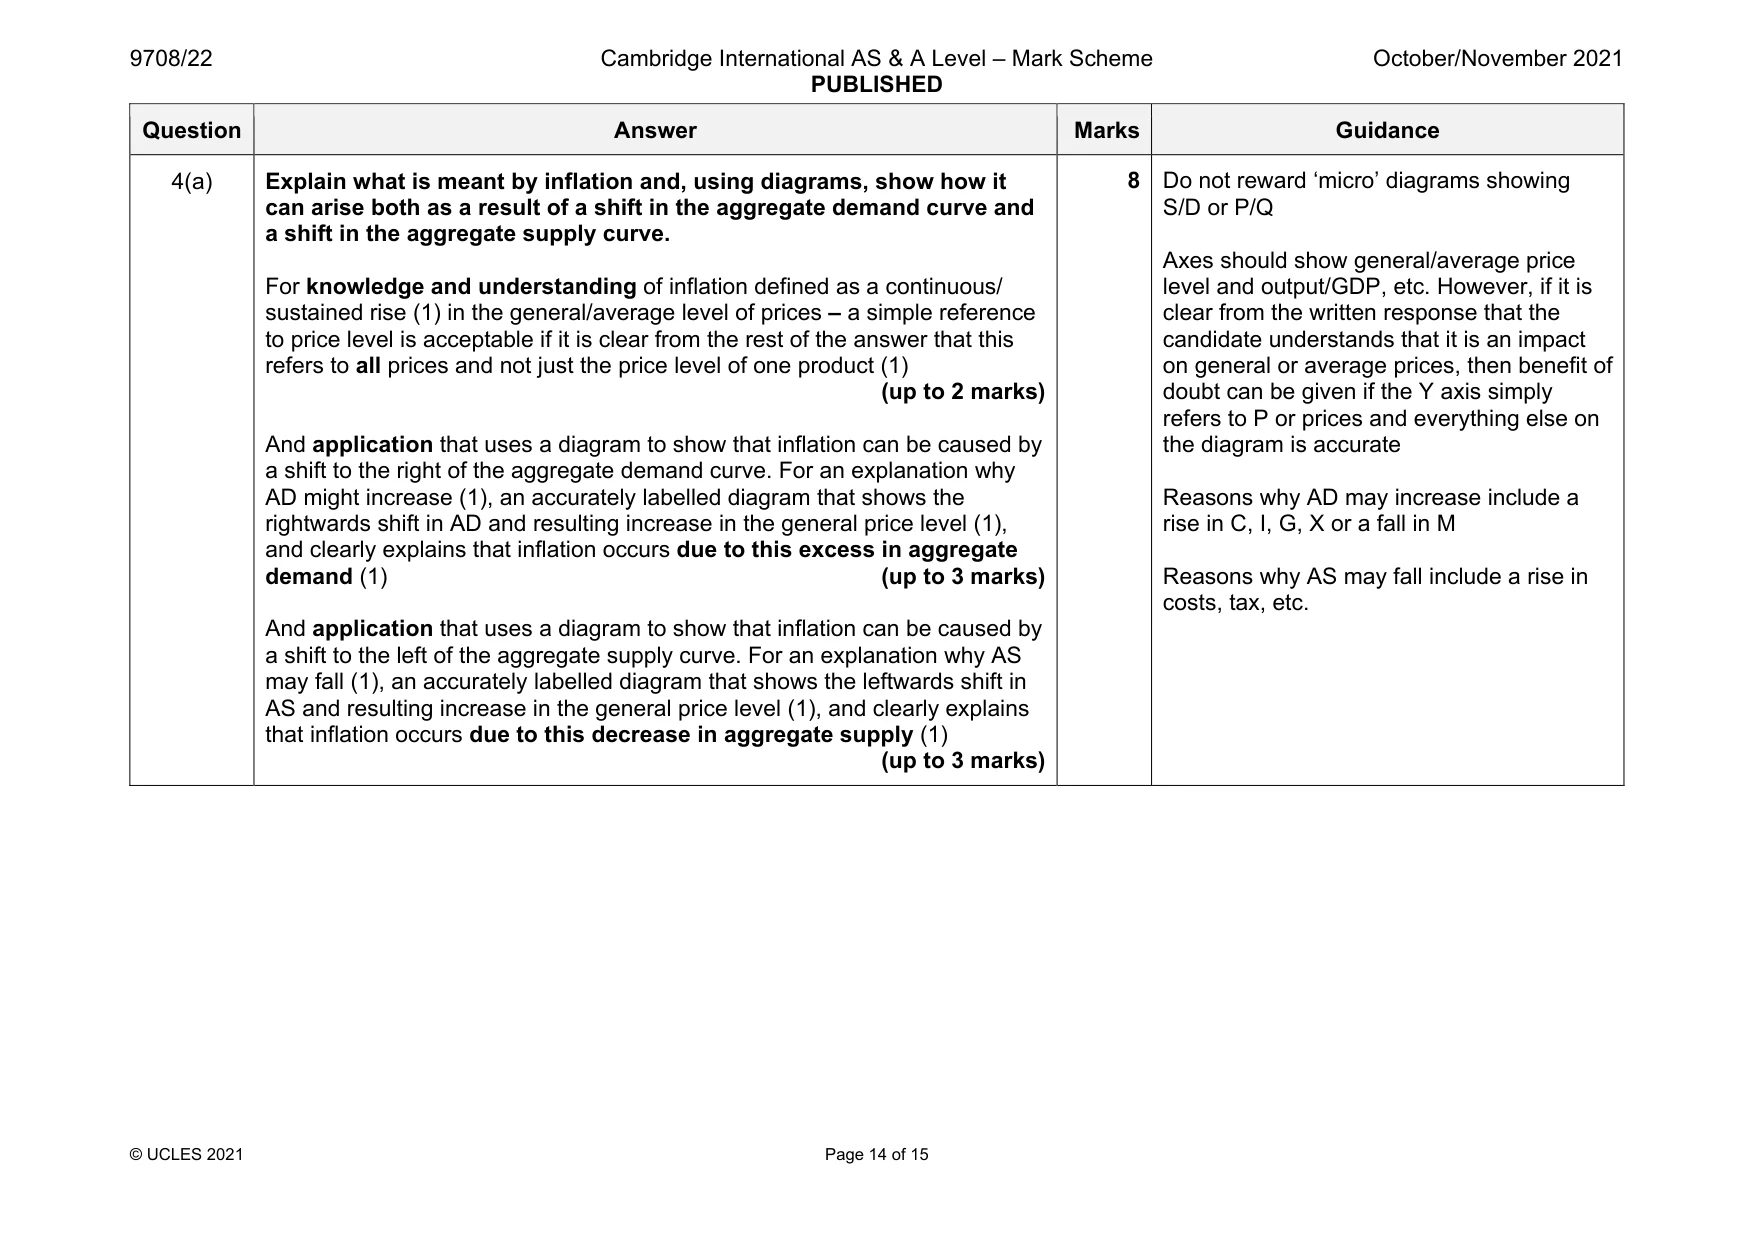
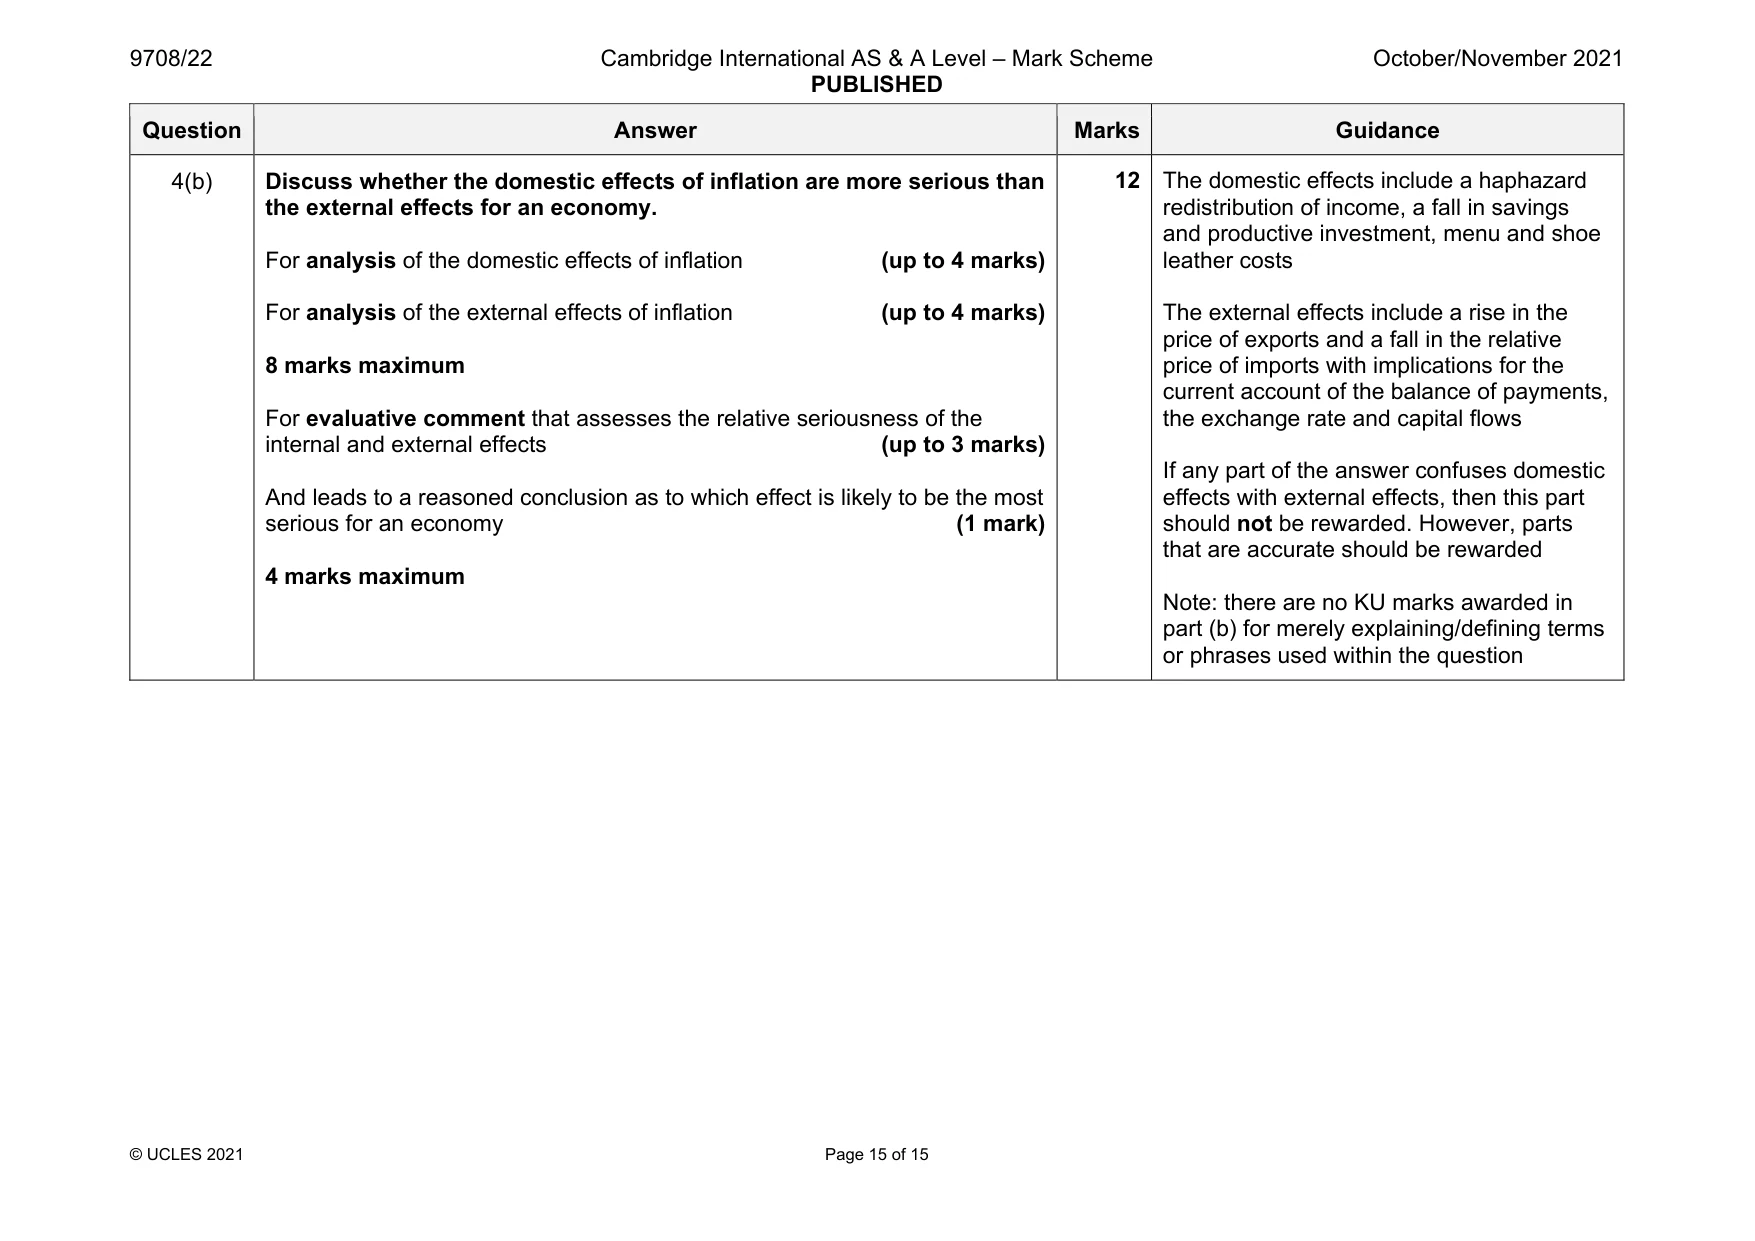
4 (a) Explain what is meant by inflation and, using diagrams, show how it can arise both as a result of a shift in the aggregate demand curve and a shift in the aggregate supply curve. [8] (b) Discuss whether the domestic effects of inflation are more serious than the external effects for an economy. [12]
Mark scheme: 4(a) Explain what is meant by inflation and, using diagrams, show how it can arise both as a result of a shift in the aggregate demand curve and a shift in the aggregate supply curve. For knowledge and understanding of inflation defined as a continuous/ sustained rise (1) in the general/average level of prices – a simple reference to price level is acceptable if it is clear from the rest of the answer that this refers to all prices and not just the price level of one product (1) (up to 2 marks) And application that uses a diagram to show that inflation can be caused by a shift to the right of the aggregate demand curve. For an explanation why AD might increase (1), an accurately labelled diagram that shows the rightwards shift in AD and resulting increase in the general price level (1), and clearly explains that inflation occurs due to this excess in aggregate demand (1) (up to 3 marks) And application that uses a diagram to show that inflation can be caused by a shift to the left of the aggregate supply curve. For an explanation why AS may fall (1), an accurately labelled diagram that shows the leftwards shift in AS and resulting increase in the general price level (1), and clearly explains that inflation occurs due to this decrease in aggregate supply (1) (up to 3 marks) S/D or P/Q Axes should show general/average price level and output/GDP, etc. However, if it is clear from the written response that the candidate understands that it is an impact on general or average prices, then benefit of doubt can be given if the Y axis simply refers to P or prices and everything else on the diagram is accurate Reasons why AD may increase include a rise in C, I, G, X or a fall in M Reasons why AS may fall include a rise in costs, tax, etc. Question Answer Marks Guidance 4(b) Discuss whether the domestic effects of inflation are more serious than the external effects for an economy. For analysis of the domestic effects of inflation (up to 4 marks) For analysis of the external effects of inflation (up to 4 marks) 8 marks maximum For evaluative comment that assesses the relative seriousness of the internal and external effects (up to 3 marks) And leads to a reasoned conclusion as to which effect is likely to be the most serious for an economy (1 mark) 4 marks maximum 12 The domestic effects include a haphazard redistribution of income, a fall in savings and productive investment, menu and shoe leather costs The external effects include a rise in the price of exports and a fall in the relative price of imports with implications for the current account of the balance of payments, the exchange rate and capital flows If any part of the answer confuses domestic effects with external effects, then this part should not be rewarded. However, parts that are accurate should be rewarded Note: there are no KU marks awarded in part (b) for merely explaining/defining terms or phrases used within the question
More questions on Links between macroeconomic problems and their interrelatedness
What was in this paper
The subtopics covered by these 4 questions, and how many questions each got. Open one in a new tab to see every Cambridge question on it.
What you needed in this session
Cambridge’s own grade thresholds for 2021 Oct/Nov, Paper 2 · Variant 2. A higher threshold means an easier paper — the bar moves with how the cohort did.