Cambridge A Level Economics 9708 — 2020 Oct/Nov Paper 4 · Variant 2
9708/42/O/N/20 · 7 questions · 70 marks · ≈79 min
The question paper and its mark scheme, free to read here and free to download. This is Cambridge’s own paper, exactly as it was sat.
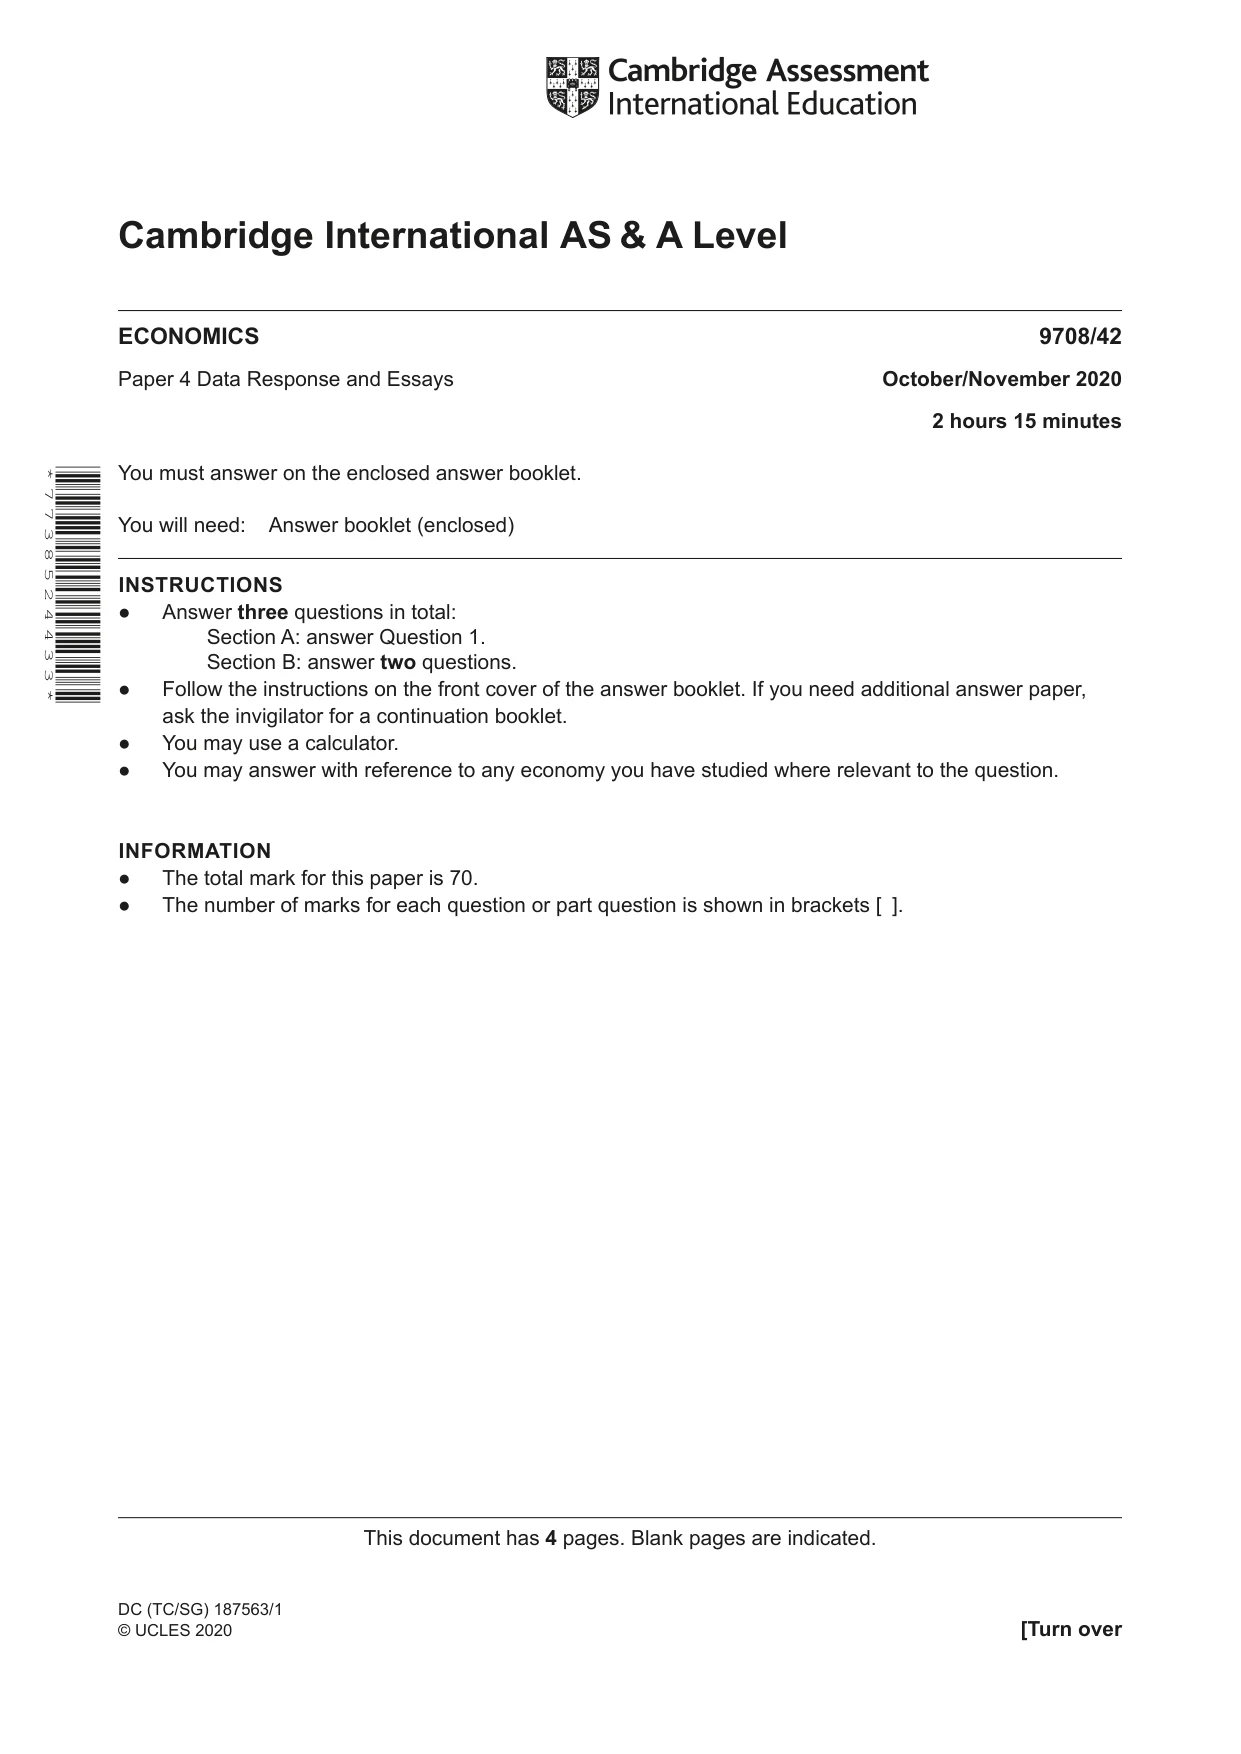
Question paper4 pages


Mark scheme9 pages
Answers below. Sit the paper first if you are practising.


Questions as text
Q1 · The economy of Uruguay Uruguay, a country of 3.5 million people, had a gross domestic…
1 The economy of Uruguay Uruguay, a country of 3.5 million people, had a gross domestic product (GDP) per capita of US$20 000 in 2017 and was ranked at 63rd in the world. Content removed due to copyright restrictions. Content removed due to copyright restrictions. (a) (i) Identify two economic policies the Uruguayan government has introduced that should increase economic growth. [2] (ii) Explain how these policies should increase Uruguay’s economic growth. [4] (b) The information states that in Uruguay there is a national minimum wage. Using a diagram, discuss the likely effects of the introduction of a national minimum wage on labour markets. [6] (c) Using Figs. 1.1 to 1.4, comment on the macroeconomic performance of Uruguay. [8]
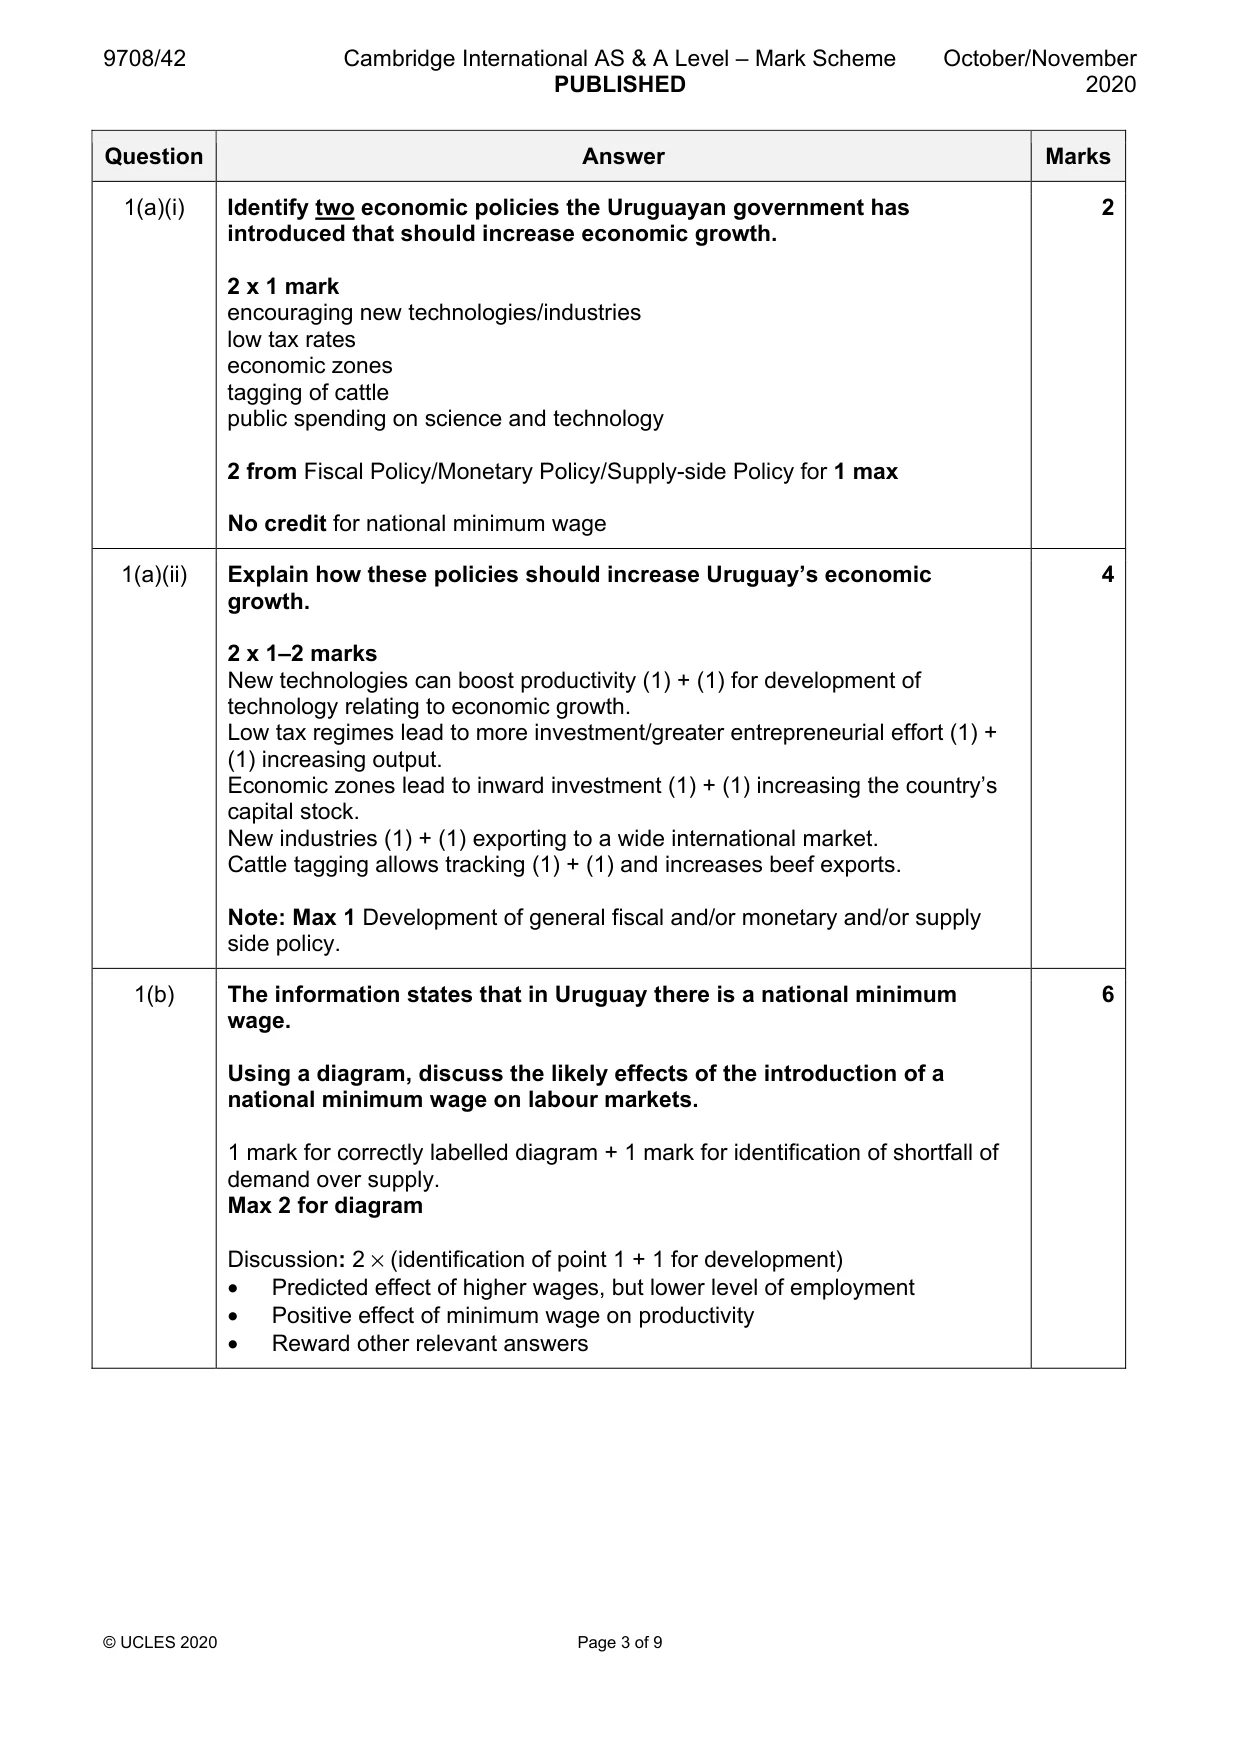
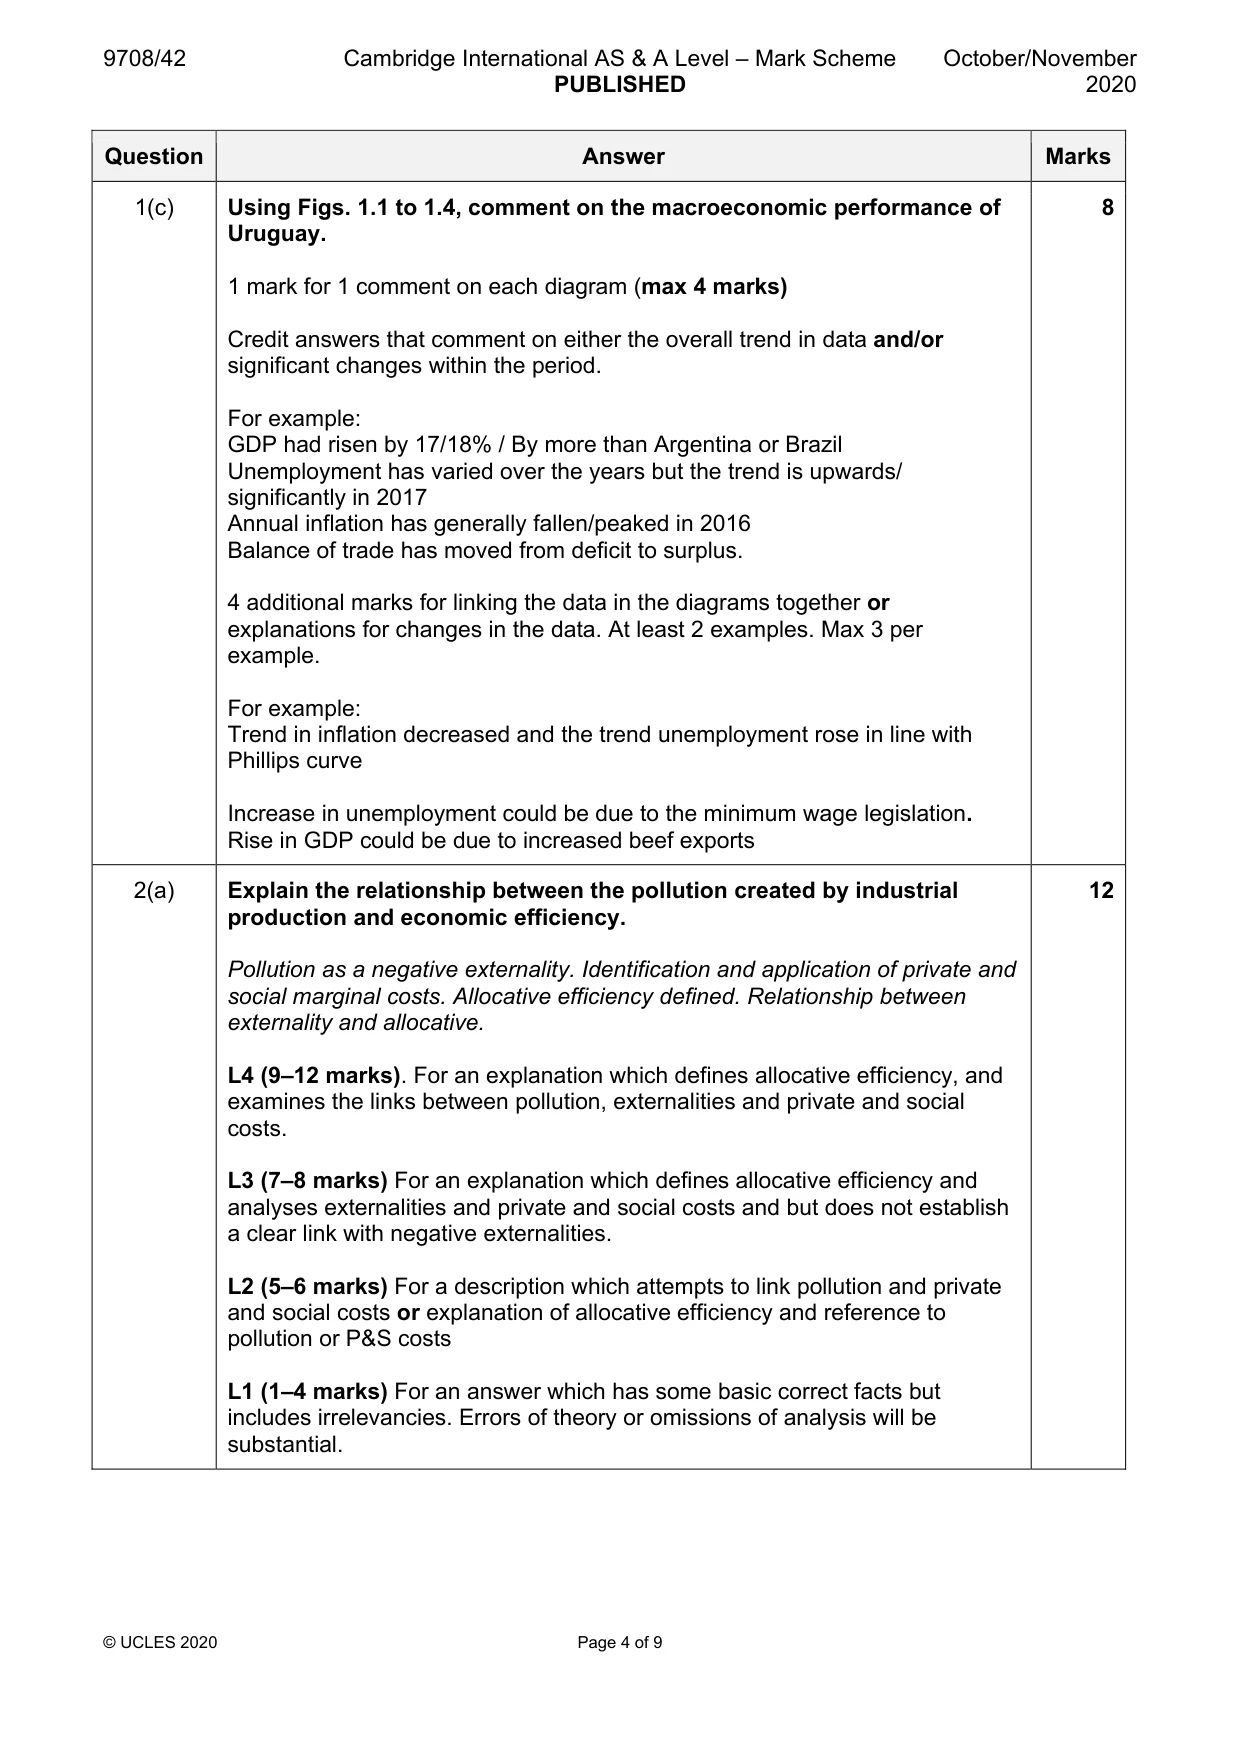
Mark scheme: Question Answer Marks 1(a)(i) Identify two economic policies the Uruguayan government has 2 introduced that should increase economic growth. 2 x 1 mark encouraging new technologies/industries low tax rates economic zones tagging of cattle public spending on science and technology 2 from Fiscal Policy/Monetary Policy/Supply-side Policy for 1 max No credit for national minimum wage 1(a)(ii) Explain how these policies should increase Uruguay’s economic 4 growth. 2 x 1–2 marks New technologies can boost productivity (1) + (1) for development of technology relating to economic growth. Low tax regimes lead to more investment/greater entrepreneurial effort (1) + (1) increasing output. Economic zones lead to inward investment (1) + (1) increasing the country’s capital stock. New industries (1) + (1) exporting to a wide international market. Cattle tagging allows tracking (1) + (1) and increases beef exports. Note: Max 1 Development of general fiscal and/or monetary and/or supply side policy. 1(b) The information states that in Uruguay there is a national minimum 6 wage. Using a diagram, discuss the likely effects of the introduction of a national minimum wage on labour markets. 1 mark for correctly labelled diagram + 1 mark for identification of shortfall of demand over supply. Max 2 for diagram Discussion: 2 × (identification of point 1 + 1 for development) • Predicted effect of higher wages, but lower level of employment • Positive effect of minimum wage on productivity • Reward other relevant answers 1(c) Using Figs. 1.1 to 1.4, comment on the macroeconomic performance of 8 Uruguay. 1 mark for 1 comment on each diagram (max 4 marks) Credit answers that comment on either the overall trend in data and/or significant changes within the period. For example: GDP had risen by 17/18% / By more than Argentina or Brazil Unemployment has varied over the years but the trend is upwards/ significantly in 2017 Annual inflation has generally fallen/peaked in 2016 Balance of trade has moved from deficit to surplus. 4 additional marks for linking the data in the diagrams together or explanations for changes in the data. At least 2 examples. Max 3 per example. For example: Trend in inflation decreased and the trend unemployment rose in line with Phillips curve Increase in unemployment could be due to the minimum wage legislation. Rise in GDP could be due to increased beef exports
More questions on Government macroeconomic policy objectives
Q2 · Explain the relationship between the pollution created by industrial production and…
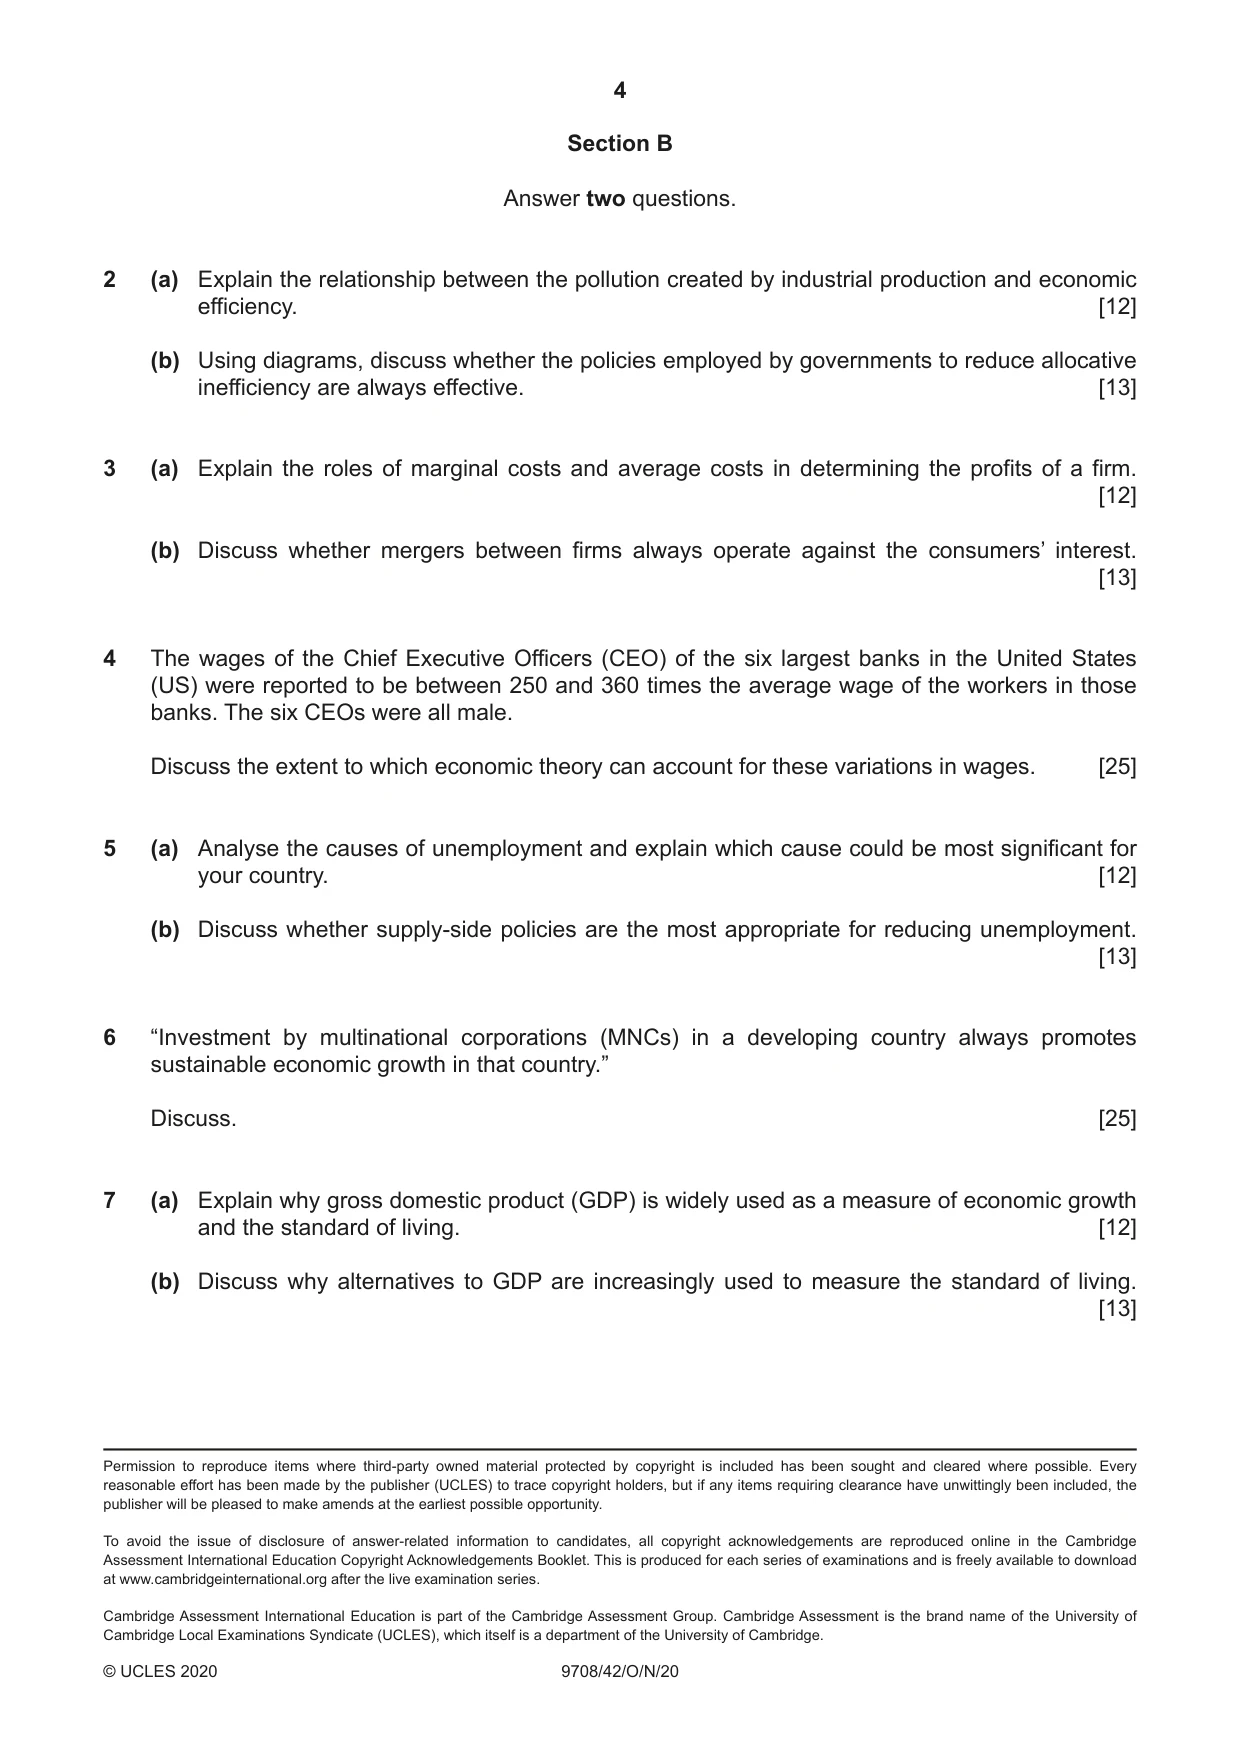
2 (a) Explain the relationship between the pollution created by industrial production and economic efficiency. [12] (b) Using diagrams, discuss whether the policies employed by governments to reduce allocative inefficiency are always effective. [13]
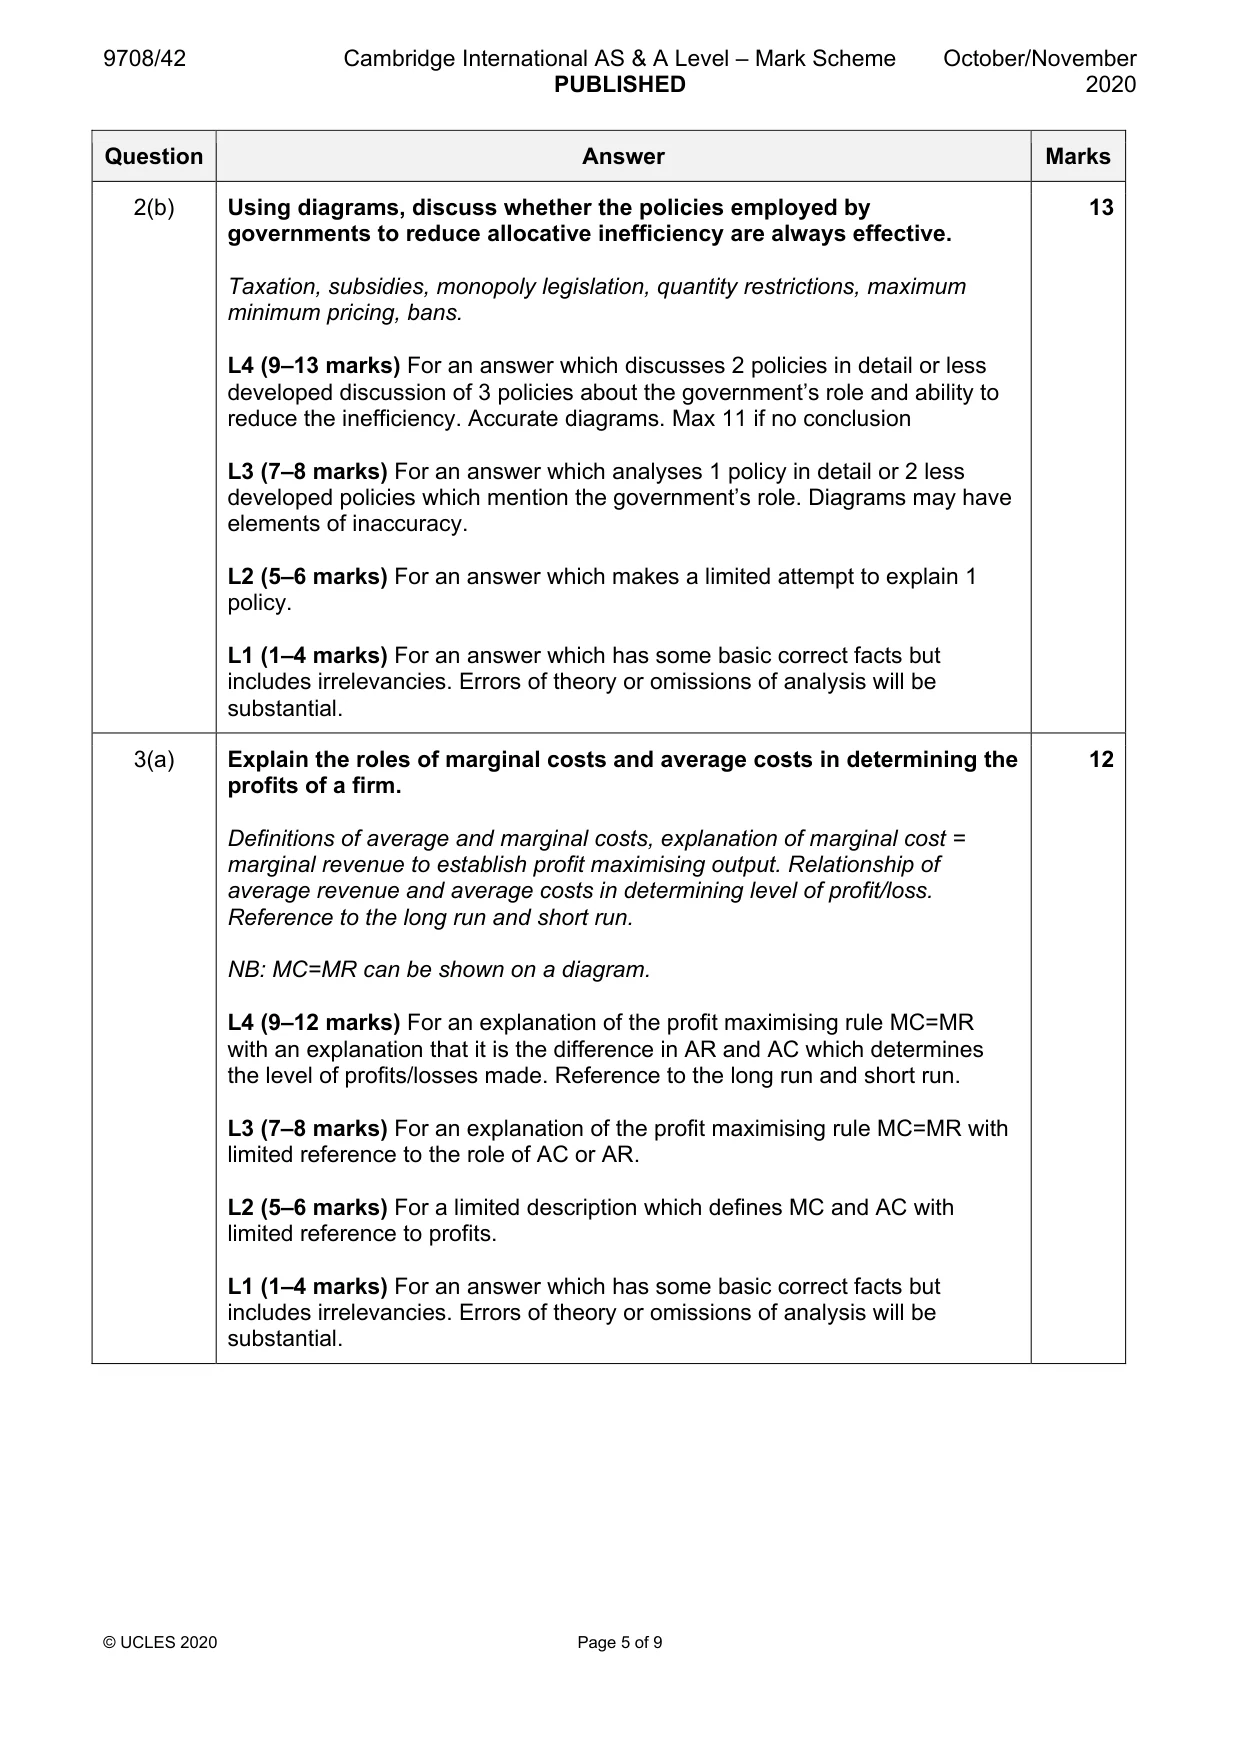
Mark scheme: 2(a) Explain the relationship between the pollution created by industrial 12 production and economic efficiency. Pollution as a negative externality. Identification and application of private and social marginal costs. Allocative efficiency defined. Relationship between externality and allocative. L4 (9–12 marks). For an explanation which defines allocative efficiency, and examines the links between pollution, externalities and private and social costs. L3 (7–8 marks) For an explanation which defines allocative efficiency and analyses externalities and private and social costs and but does not establish a clear link with negative externalities. L2 (5–6 marks) For a description which attempts to link pollution and private and social costs or explanation of allocative efficiency and reference to pollution or P&S costs L1 (1–4 marks) For an answer which has some basic correct facts but includes irrelevancies. Errors of theory or omissions of analysis will be substantial. 2(b) Using diagrams, discuss whether the policies employed by 13 governments to reduce allocative inefficiency are always effective. Taxation, subsidies, monopoly legislation, quantity restrictions, maximum minimum pricing, bans. L4 (9–13 marks) For an answer which discusses 2 policies in detail or less developed discussion of 3 policies about the government’s role and ability to reduce the inefficiency. Accurate diagrams. Max 11 if no conclusion L3 (7–8 marks) For an answer which analyses 1 policy in detail or 2 less developed policies which mention the government’s role. Diagrams may have elements of inaccuracy. L2 (5–6 marks) For an answer which makes a limited attempt to explain 1 policy. L1 (1–4 marks) For an answer which has some basic correct facts but includes irrelevancies. Errors of theory or omissions of analysis will be substantial.
Q3 · Explain the roles of marginal costs and average costs in determining the profits of a firm
3 (a) Explain the roles of marginal costs and average costs in determining the profits of a firm. [12] (b) Discuss whether mergers between firms always operate against the consumers’ interest. [13]
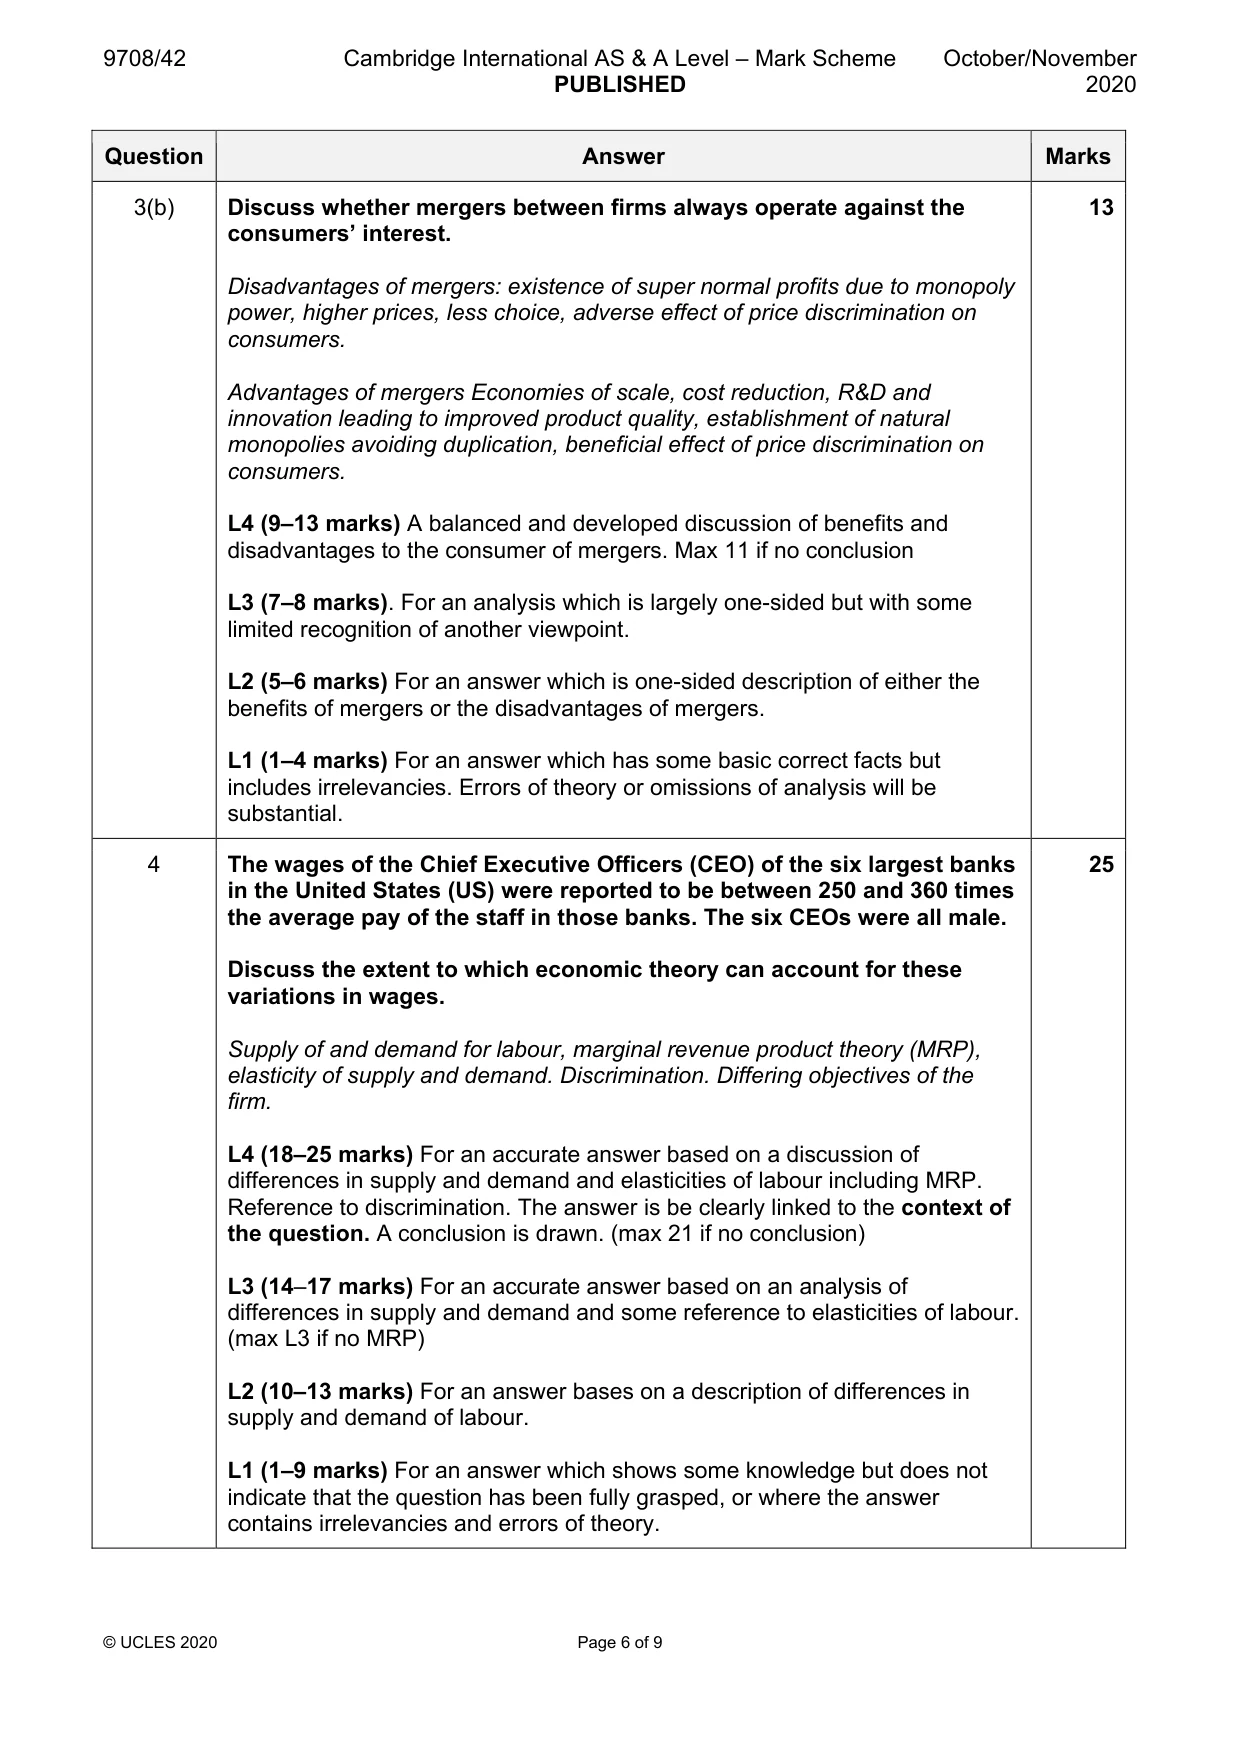
Mark scheme: 3(a) Explain the roles of marginal costs and average costs in determining the 12 profits of a firm. Definitions of average and marginal costs, explanation of marginal cost = marginal revenue to establish profit maximising output. Relationship of average revenue and average costs in determining level of profit/loss. Reference to the long run and short run. NB: MC=MR can be shown on a diagram. L4 (9–12 marks) For an explanation of the profit maximising rule MC=MR with an explanation that it is the difference in AR and AC which determines the level of profits/losses made. Reference to the long run and short run. L3 (7–8 marks) For an explanation of the profit maximising rule MC=MR with limited reference to the role of AC or AR. L2 (5–6 marks) For a limited description which defines MC and AC with limited reference to profits. L1 (1–4 marks) For an answer which has some basic correct facts but includes irrelevancies. Errors of theory or omissions of analysis will be substantial. 3(b) Discuss whether mergers between firms always operate against the 13 consumers’ interest. Disadvantages of mergers: existence of super normal profits due to monopoly power, higher prices, less choice, adverse effect of price discrimination on consumers. Advantages of mergers Economies of scale, cost reduction, R&D and innovation leading to improved product quality, establishment of natural monopolies avoiding duplication, beneficial effect of price discrimination on consumers. L4 (9–13 marks) A balanced and developed discussion of benefits and disadvantages to the consumer of mergers. Max 11 if no conclusion L3 (7–8 marks). For an analysis which is largely one-sided but with some limited recognition of another viewpoint. L2 (5–6 marks) For an answer which is one-sided description of either the benefits of mergers or the disadvantages of mergers. L1 (1–4 marks) For an answer which has some basic correct facts but includes irrelevancies. Errors of theory or omissions of analysis will be substantial.
Q4 · The wages of the Chief Executive Officers (CEO) of the six largest banks in the United…
4 The wages of the Chief Executive Officers (CEO) of the six largest banks in the United States (US) were reported to be between 250 and 360 times the average wage of the workers in those banks. The six CEOs were all male. Discuss the extent to which economic theory can account for these variations in wages. [25]
Mark scheme: 4 The wages of the Chief Executive Officers (CEO) of the six largest banks 25 in the United States (US) were reported to be between 250 and 360 times the average pay of the staff in those banks. The six CEOs were all male. Discuss the extent to which economic theory can account for these variations in wages. Supply of and demand for labour, marginal revenue product theory (MRP), elasticity of supply and demand. Discrimination. Differing objectives of the firm. L4 (18–25 marks) For an accurate answer based on a discussion of differences in supply and demand and elasticities of labour including MRP. Reference to discrimination. The answer is be clearly linked to the context of the question. A conclusion is drawn. (max 21 if no conclusion) L3 (14–17 marks) For an accurate answer based on an analysis of differences in supply and demand and some reference to elasticities of labour. (max L3 if no MRP) L2 (10–13 marks) For an answer bases on a description of differences in supply and demand of labour. L1 (1–9 marks) For an answer which shows some knowledge but does not indicate that the question has been fully grasped, or where the answer contains irrelevancies and errors of theory.
More questions on Labour market forces and government intervention
Q5 · Analyse the causes of unemployment and explain which cause could be most significant for…
5 (a) Analyse the causes of unemployment and explain which cause could be most significant for your country. [12] (b) Discuss whether supply-side policies are the most appropriate for reducing unemployment. [13]
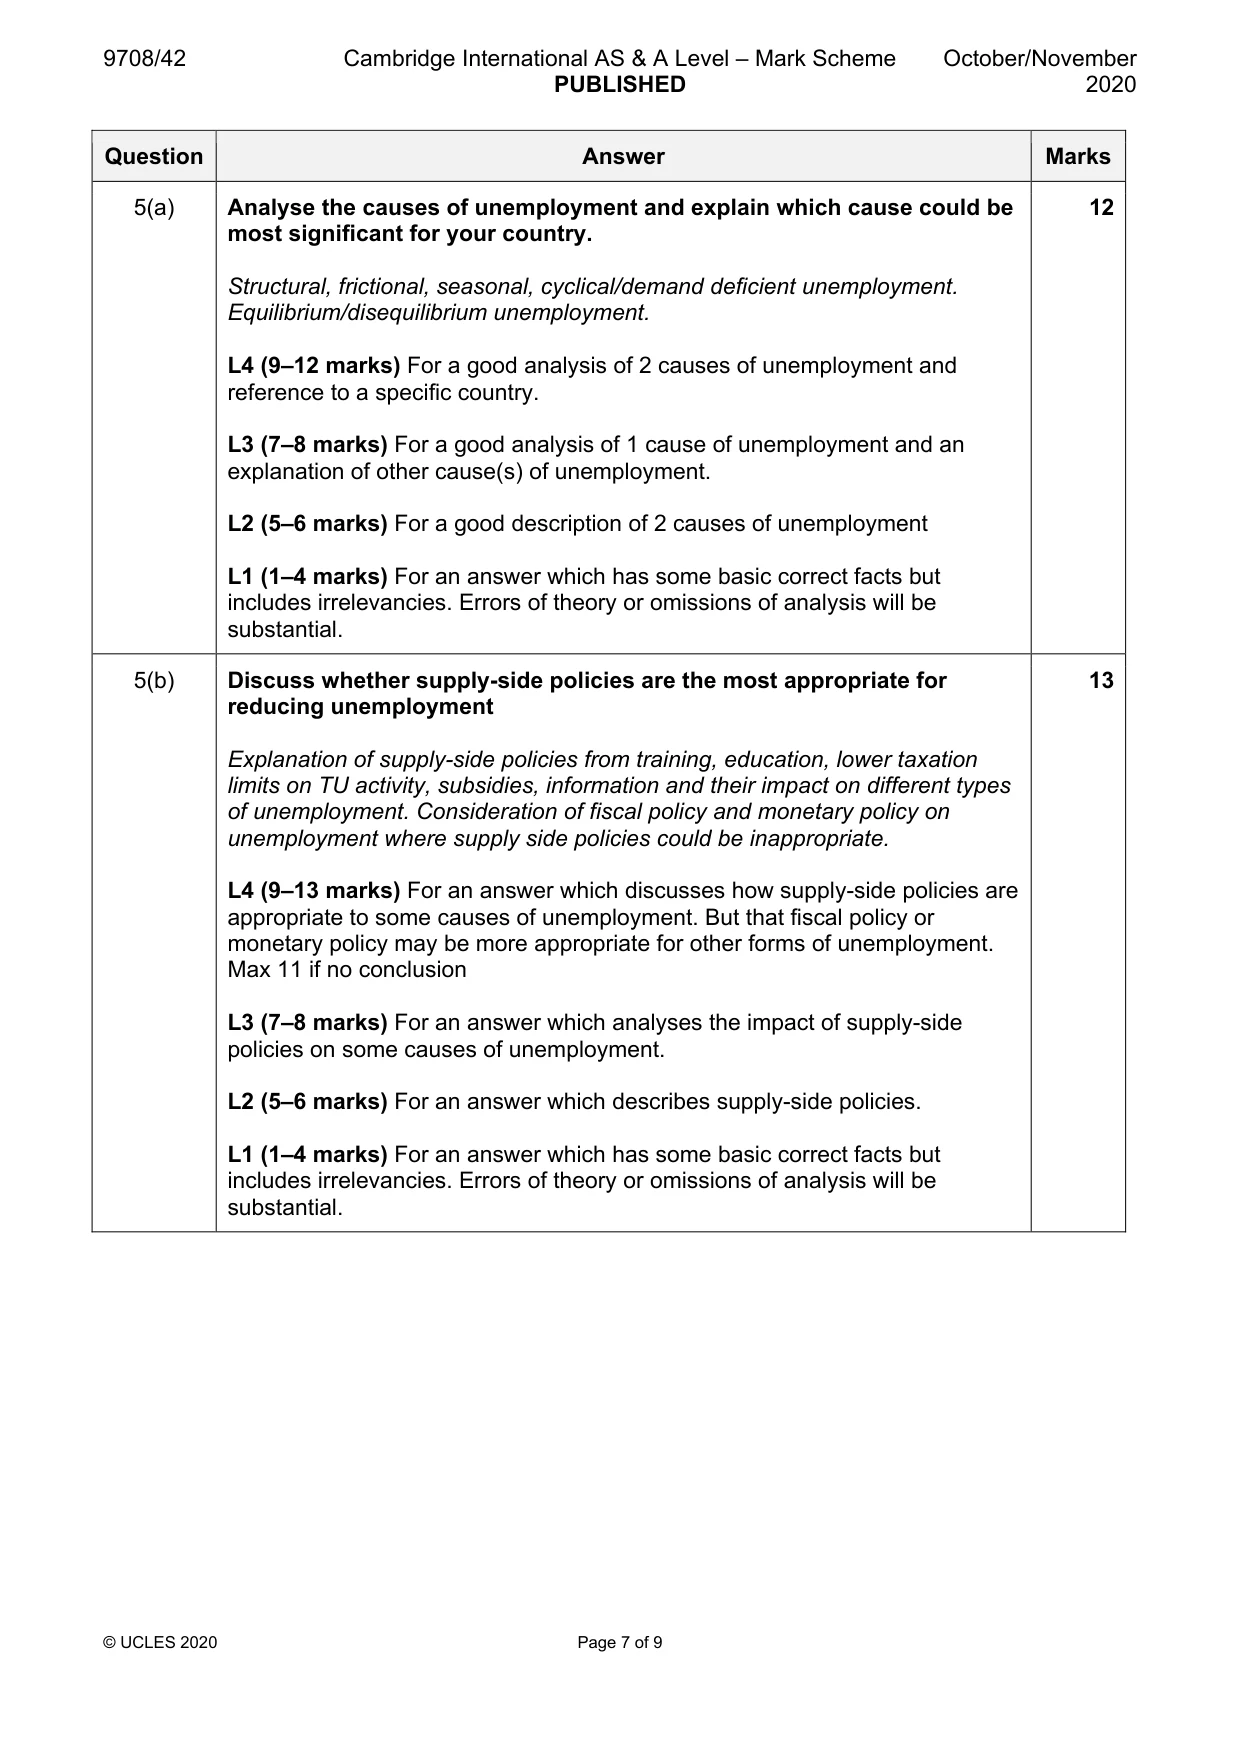
Mark scheme: 5(a) Analyse the causes of unemployment and explain which cause could be 12 most significant for your country. Structural, frictional, seasonal, cyclical/demand deficient unemployment. Equilibrium/disequilibrium unemployment. L4 (9–12 marks) For a good analysis of 2 causes of unemployment and reference to a specific country. L3 (7–8 marks) For a good analysis of 1 cause of unemployment and an explanation of other cause(s) of unemployment. L2 (5–6 marks) For a good description of 2 causes of unemployment L1 (1–4 marks) For an answer which has some basic correct facts but includes irrelevancies. Errors of theory or omissions of analysis will be substantial. 5(b) Discuss whether supply-side policies are the most appropriate for 13 reducing unemployment Explanation of supply-side policies from training, education, lower taxation limits on TU activity, subsidies, information and their impact on different types of unemployment. Consideration of fiscal policy and monetary policy on unemployment where supply side policies could be inappropriate. L4 (9–13 marks) For an answer which discusses how supply-side policies are appropriate to some causes of unemployment. But that fiscal policy or monetary policy may be more appropriate for other forms of unemployment. Max 11 if no conclusion L3 (7–8 marks) For an answer which analyses the impact of supply-side policies on some causes of unemployment. L2 (5–6 marks) For an answer which describes supply-side policies. L1 (1–4 marks) For an answer which has some basic correct facts but includes irrelevancies. Errors of theory or omissions of analysis will be substantial.
Q6 · “Investment by multinational corporations (MNCs) in a developing country always promotes…
6 “Investment by multinational corporations (MNCs) in a developing country always promotes sustainable economic growth in that country.” Discuss. [25]
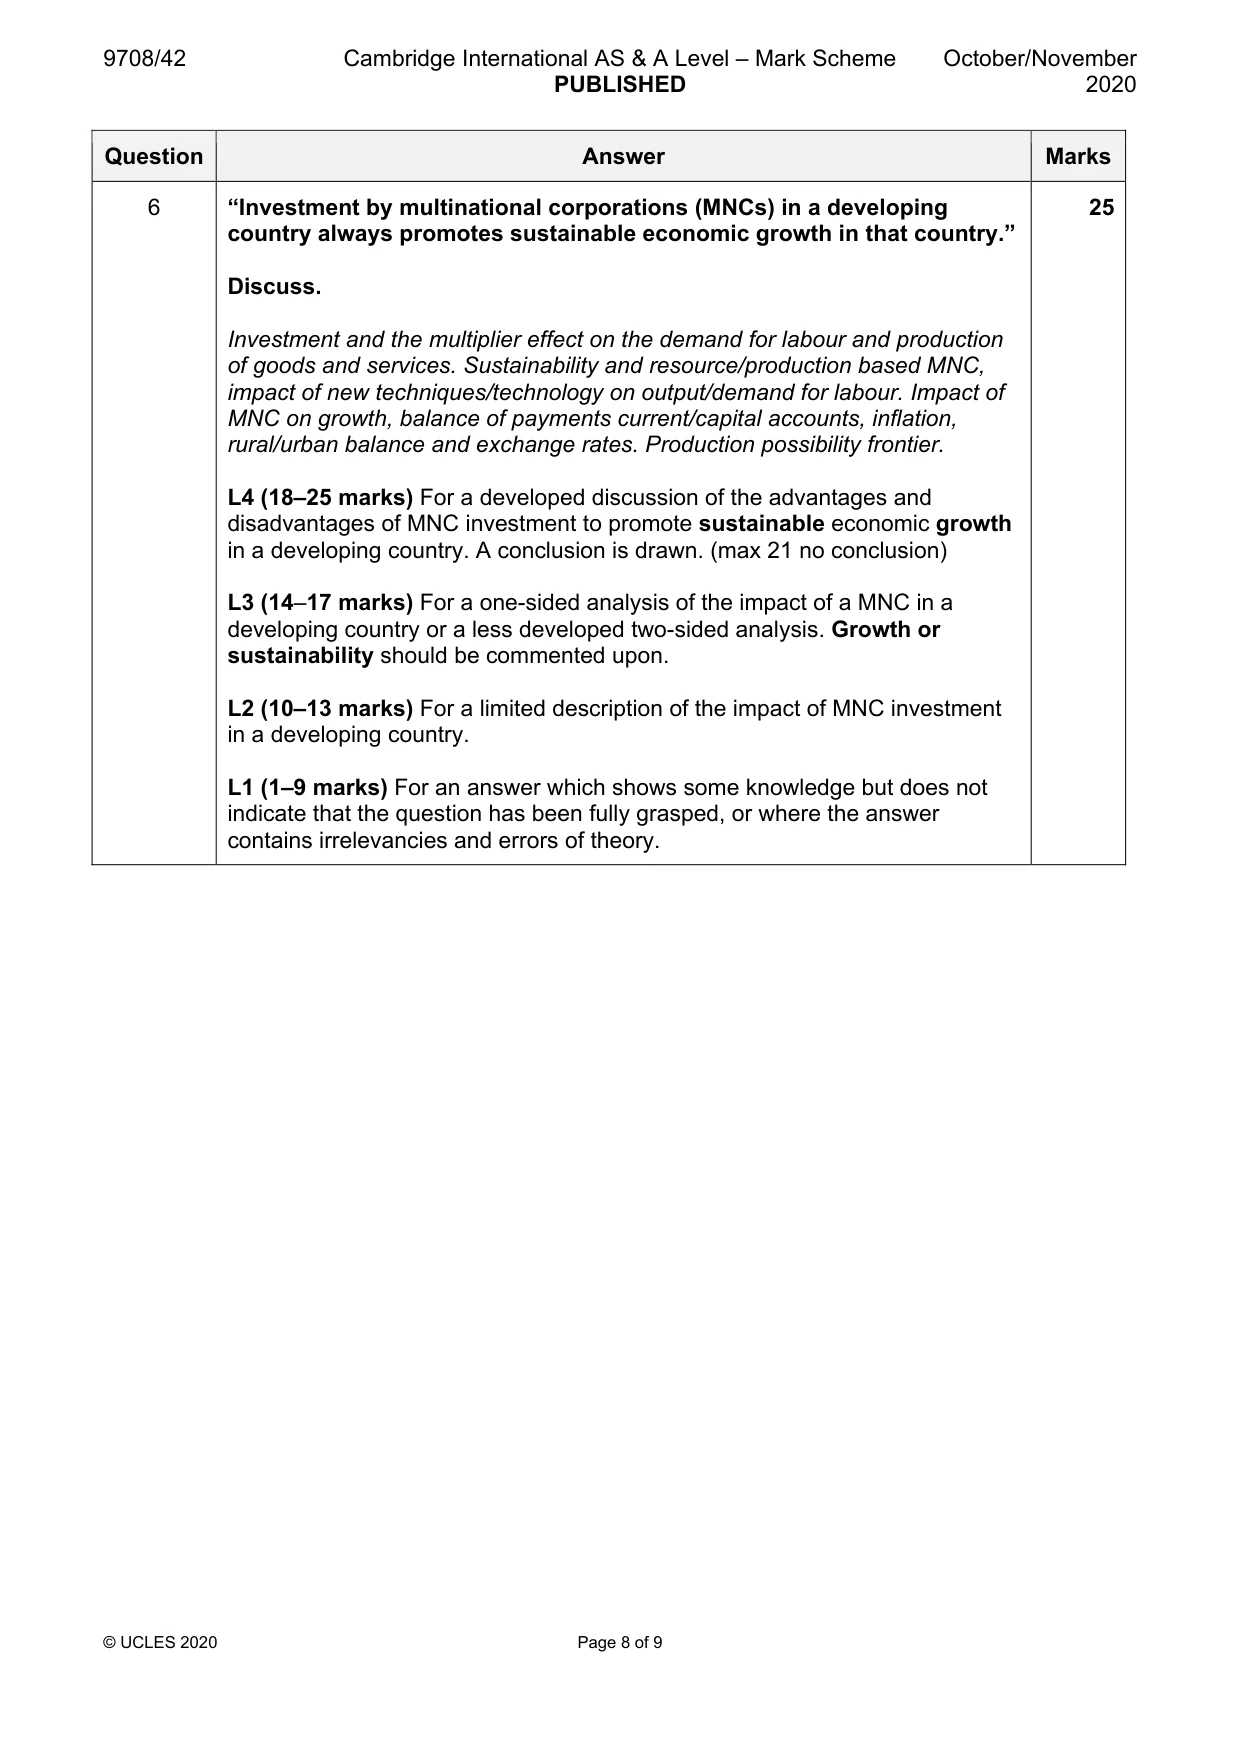
Mark scheme: 6 “Investment by multinational corporations (MNCs) in a developing 25 country always promotes sustainable economic growth in that country.” Discuss. Investment and the multiplier effect on the demand for labour and production of goods and services. Sustainability and resource/production based MNC, impact of new techniques/technology on output/demand for labour. Impact of MNC on growth, balance of payments current/capital accounts, inflation, rural/urban balance and exchange rates. Production possibility frontier. L4 (18–25 marks) For a developed discussion of the advantages and disadvantages of MNC investment to promote sustainable economic growth in a developing country. A conclusion is drawn. (max 21 no conclusion) L3 (14–17 marks) For a one-sided analysis of the impact of a MNC in a developing country or a less developed two-sided analysis. Growth or sustainability should be commented upon. L2 (10–13 marks) For a limited description of the impact of MNC investment in a developing country. L1 (1–9 marks) For an answer which shows some knowledge but does not indicate that the question has been fully grasped, or where the answer contains irrelevancies and errors of theory.
Q7 · Explain why gross domestic product (GDP) is widely used as a measure of economic growth…
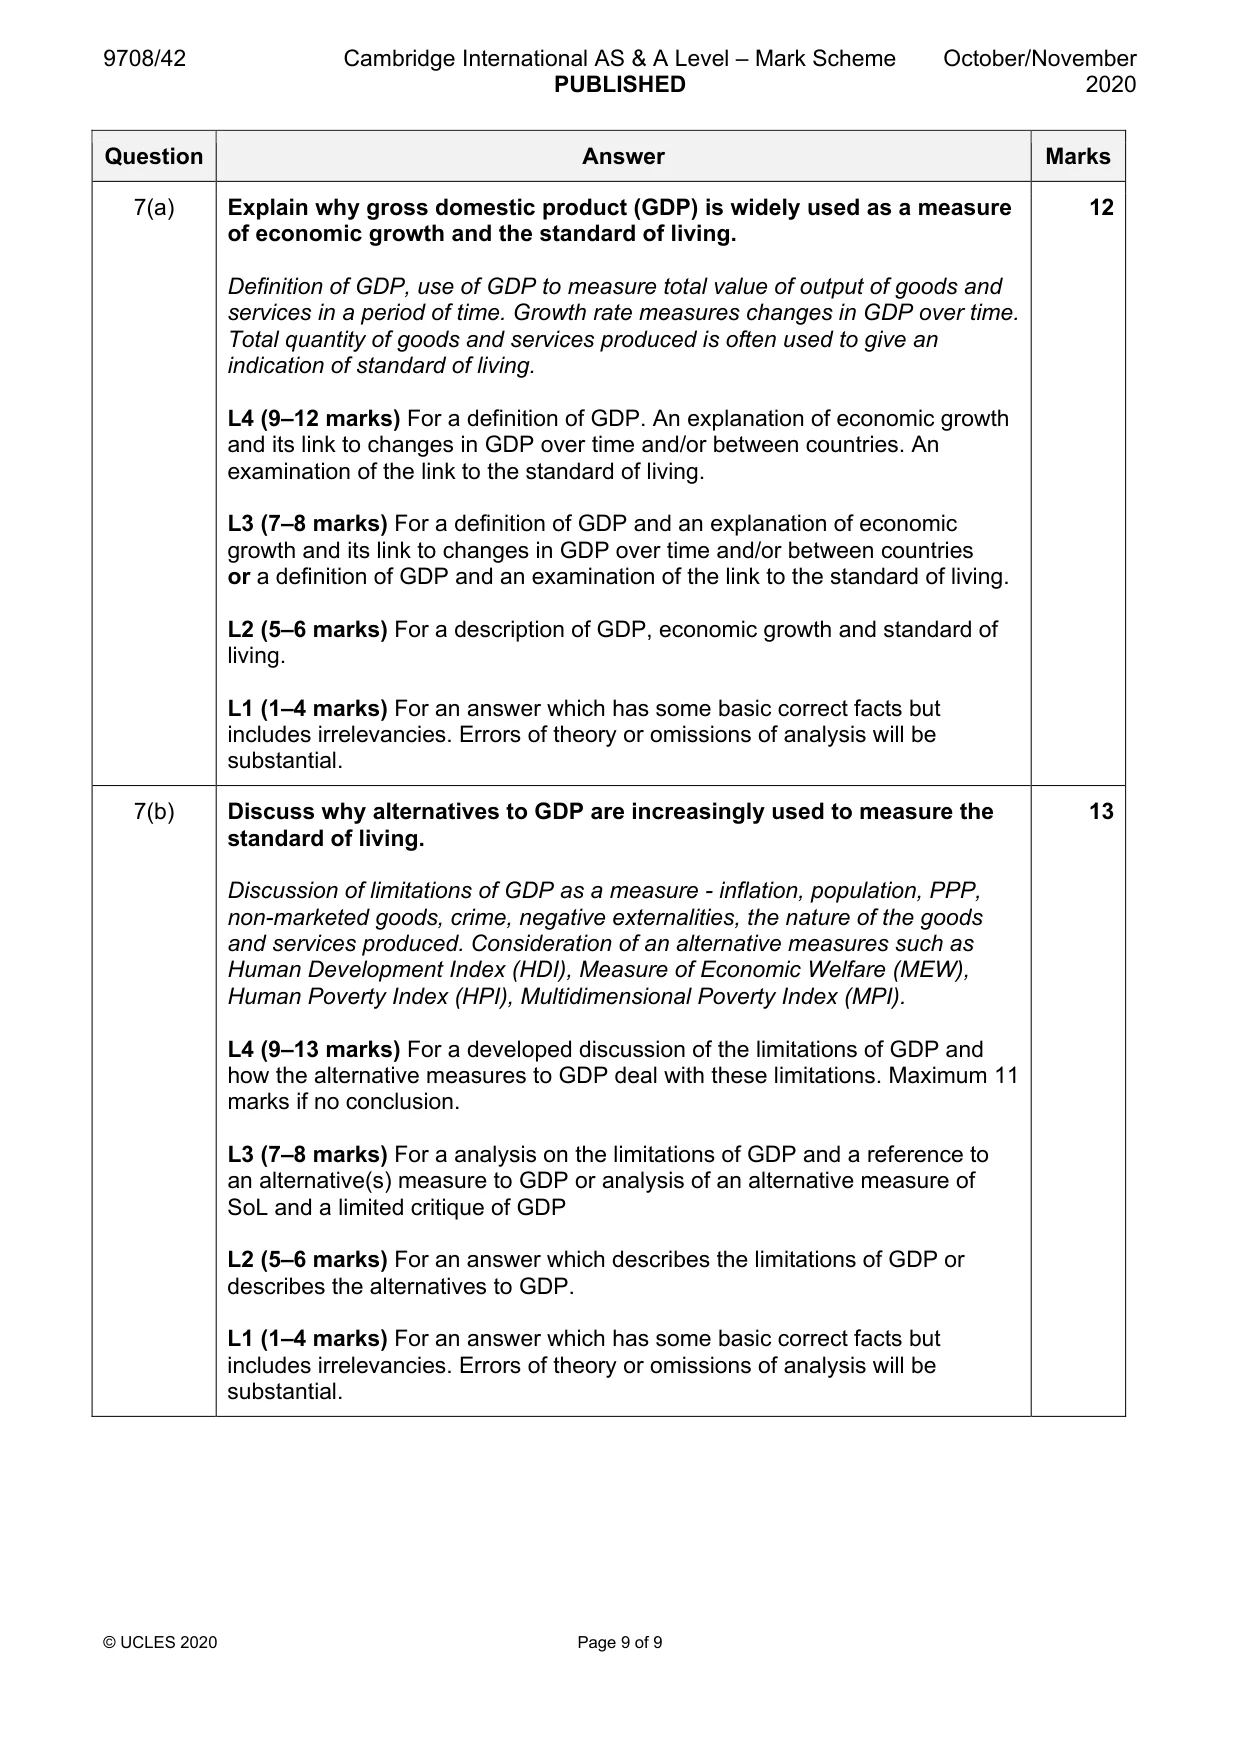
7 (a) Explain why gross domestic product (GDP) is widely used as a measure of economic growth and the standard of living. [12] (b) Discuss why alternatives to GDP are increasingly used to measure the standard of living. [13]
Mark scheme: 7(a) Explain why gross domestic product (GDP) is widely used as a measure 12 of economic growth and the standard of living. Definition of GDP, use of GDP to measure total value of output of goods and services in a period of time. Growth rate measures changes in GDP over time. Total quantity of goods and services produced is often used to give an indication of standard of living. L4 (9–12 marks) For a definition of GDP. An explanation of economic growth and its link to changes in GDP over time and/or between countries. An examination of the link to the standard of living. L3 (7–8 marks) For a definition of GDP and an explanation of economic growth and its link to changes in GDP over time and/or between countries or a definition of GDP and an examination of the link to the standard of living. L2 (5–6 marks) For a description of GDP, economic growth and standard of living. L1 (1–4 marks) For an answer which has some basic correct facts but includes irrelevancies. Errors of theory or omissions of analysis will be substantial. 7(b) Discuss why alternatives to GDP are increasingly used to measure the 13 standard of living. Discussion of limitations of GDP as a measure - inflation, population, PPP, non-marketed goods, crime, negative externalities, the nature of the goods and services produced. Consideration of an alternative measures such as Human Development Index (HDI), Measure of Economic Welfare (MEW), Human Poverty Index (HPI), Multidimensional Poverty Index (MPI). L4 (9–13 marks) For a developed discussion of the limitations of GDP and how the alternative measures to GDP deal with these limitations. Maximum 11 marks if no conclusion. L3 (7–8 marks) For a analysis on the limitations of GDP and a reference to an alternative(s) measure to GDP or analysis of an alternative measure of SoL and a limited critique of GDP L2 (5–6 marks) For an answer which describes the limitations of GDP or describes the alternatives to GDP. L1 (1–4 marks) For an answer which has some basic correct facts but includes irrelevancies. Errors of theory or omissions of analysis will be substantial.
What was in this paper
The subtopics covered by these 7 questions, and how many questions each got. Open one in a new tab to see every Cambridge question on it.
What you needed in this session
Cambridge’s own grade thresholds for 2020 Oct/Nov, Paper 4 · Variant 2. A higher threshold means an easier paper — the bar moves with how the cohort did.