Cambridge A Level Economics 9708 — 2020 Oct/Nov Paper 4 · Variant 3
9708/43/O/N/20 · 7 questions · 70 marks · ≈79 min
The question paper and its mark scheme, free to read here and free to download. This is Cambridge’s own paper, exactly as it was sat.
Question paper4 pages

Mark scheme10 pages
Answers below. Sit the paper first if you are practising.







Questions as text
Q1 · Economic links between developed and developing economies In the developing world the…
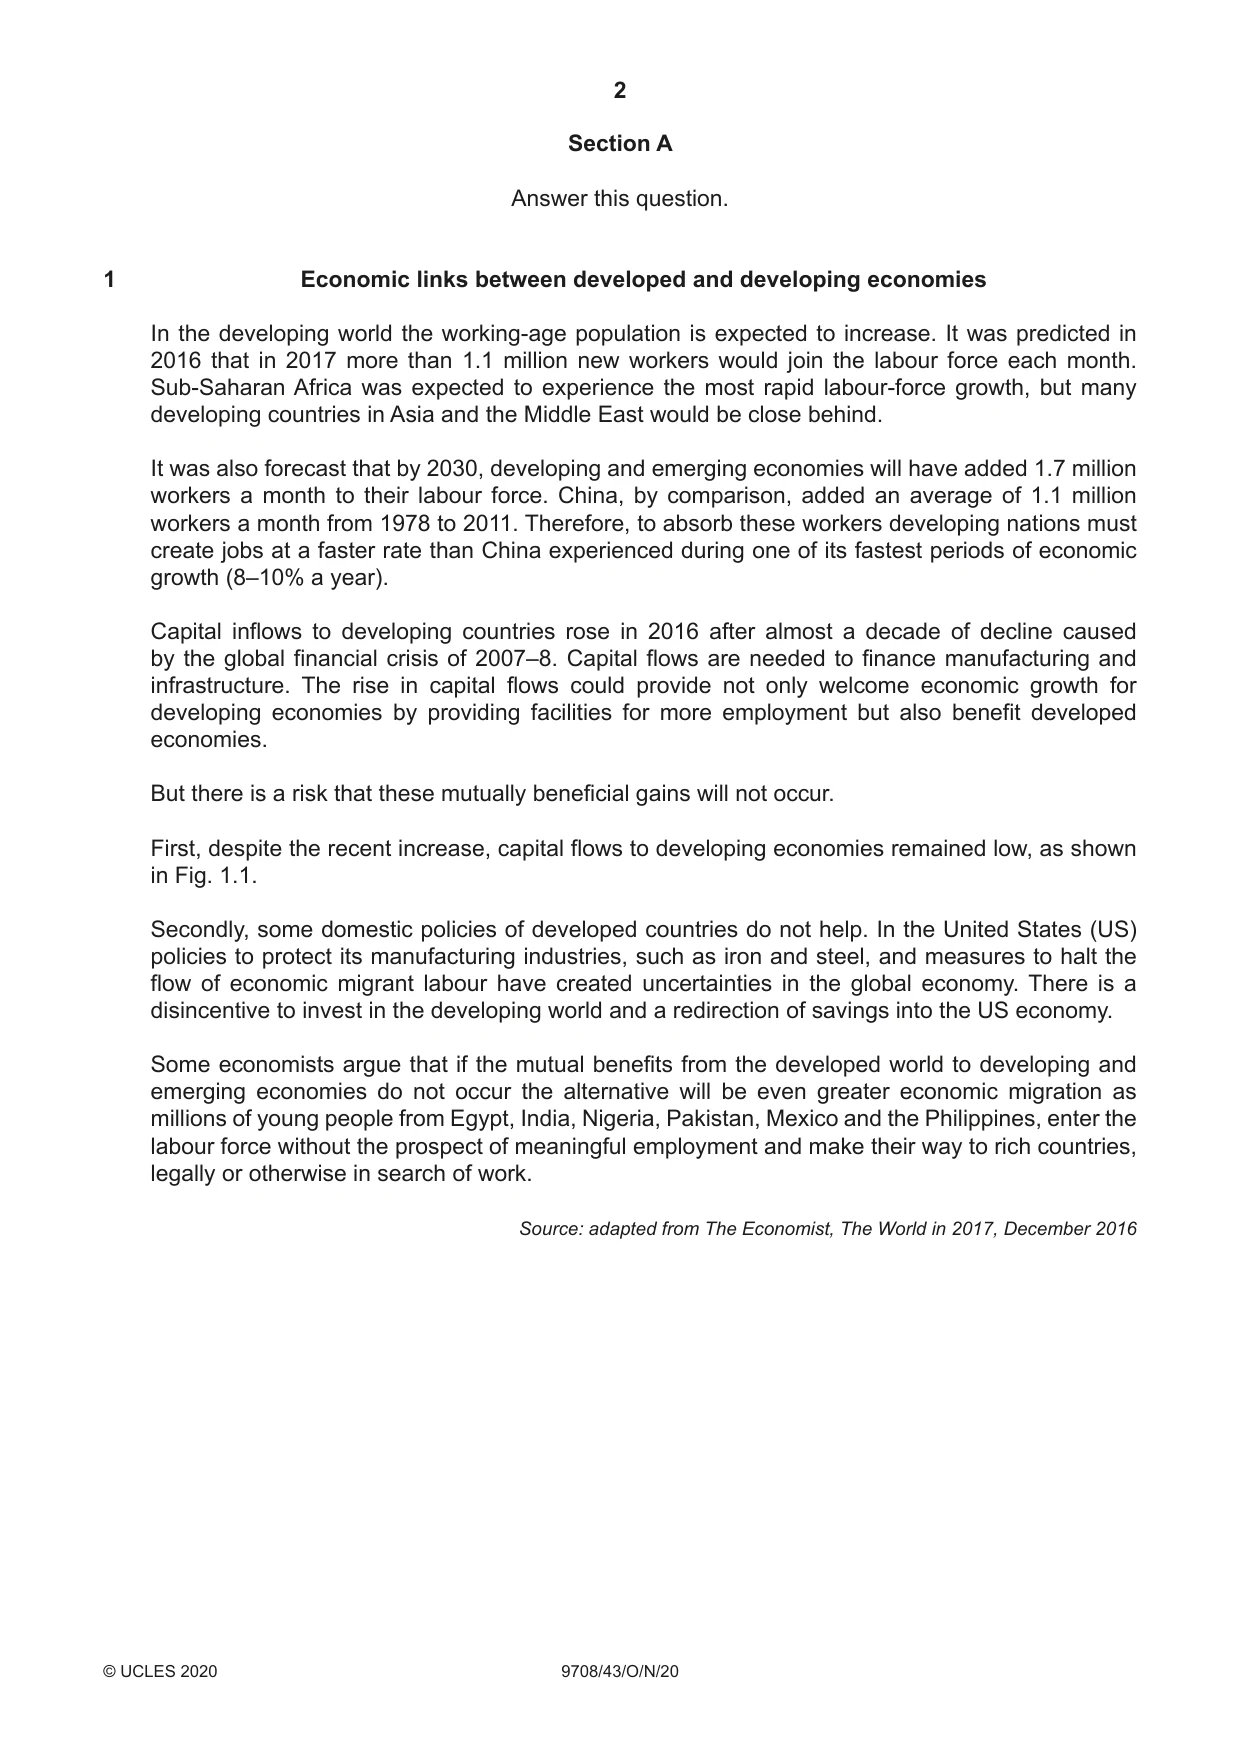
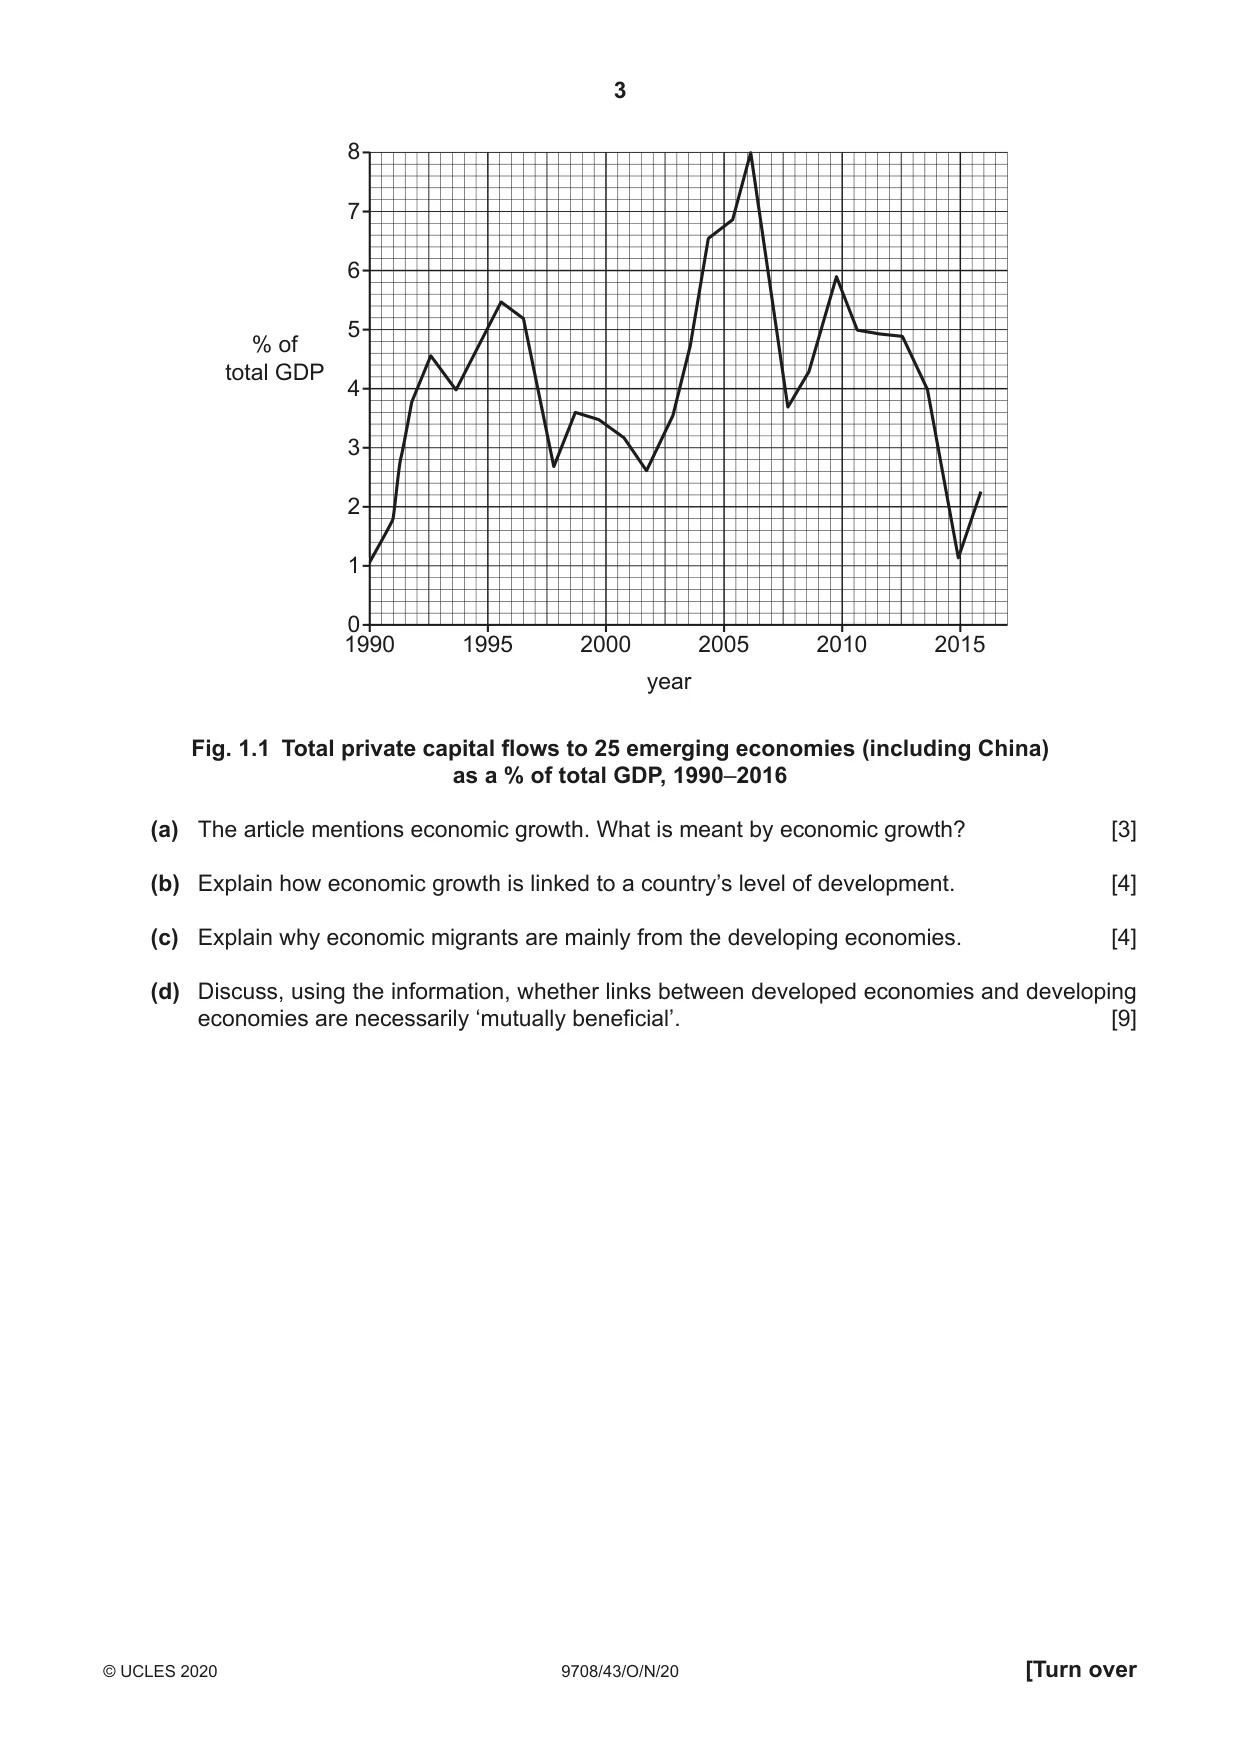
1 Economic links between developed and developing economies In the developing world the working-age population is expected to increase. It was predicted in 2016 that in 2017 more than 1.1 million new workers would join the labour force each month. Sub-Saharan Africa was expected to experience the most rapid labour-force growth, but many developing countries in Asia and the Middle East would be close behind. It was also forecast that by 2030, developing and emerging economies will have added 1.7 million workers a month to their labour force. China, by comparison, added an average of 1.1 million workers a month from 1978 to 2011. Therefore, to absorb these workers developing nations must create jobs at a faster rate than China experienced during one of its fastest periods of economic growth (8–10% a year). Capital inflows to developing countries rose in 2016 after almost a decade of decline caused by the global financial crisis of 2007–8. Capital flows are needed to finance manufacturing and infrastructure. The rise in capital flows could provide not only welcome economic growth for developing economies by providing facilities for more employment but also benefit developed economies. But there is a risk that these mutually beneficial gains will not occur. First, despite the recent increase, capital flows to developing economies remained low, as shown in Fig. 1.1. Secondly, some domestic policies of developed countries do not help. In the United States (US) policies to protect its manufacturing industries, such as iron and steel, and measures to halt the flow of economic migrant labour have created uncertainties in the global economy. There is a disincentive to invest in the developing world and a redirection of savings into the US economy. Some economists argue that if the mutual benefits from the developed world to developing and emerging economies do not occur the alternative will be even greater economic migration as millions of young people from Egypt, India, Nigeria, Pakistan, Mexico and the Philippines, enter the labour force without the prospect of meaningful employment and make their way to rich countries, legally or otherwise in search of work. Source: adapted from The Economist, The World in 2017, December 2016 8 7 6 5 % of total GDP 4 3 2 1 0 1990 1995 2000 2005 2010 2015 year Fig. 1.1 Total private capital flows to 25 emerging economies (including China) as a % of total GDP, 1990–2016 (a) The article mentions economic growth. What is meant by economic growth? [3] (b) Explain how economic growth is linked to a country’s level of development. [4] (c) Explain why economic migrants are mainly from the developing economies. [4] (d) Discuss, using the information, whether links between developed economies and developing economies are necessarily ‘mutually beneficial’. [9]
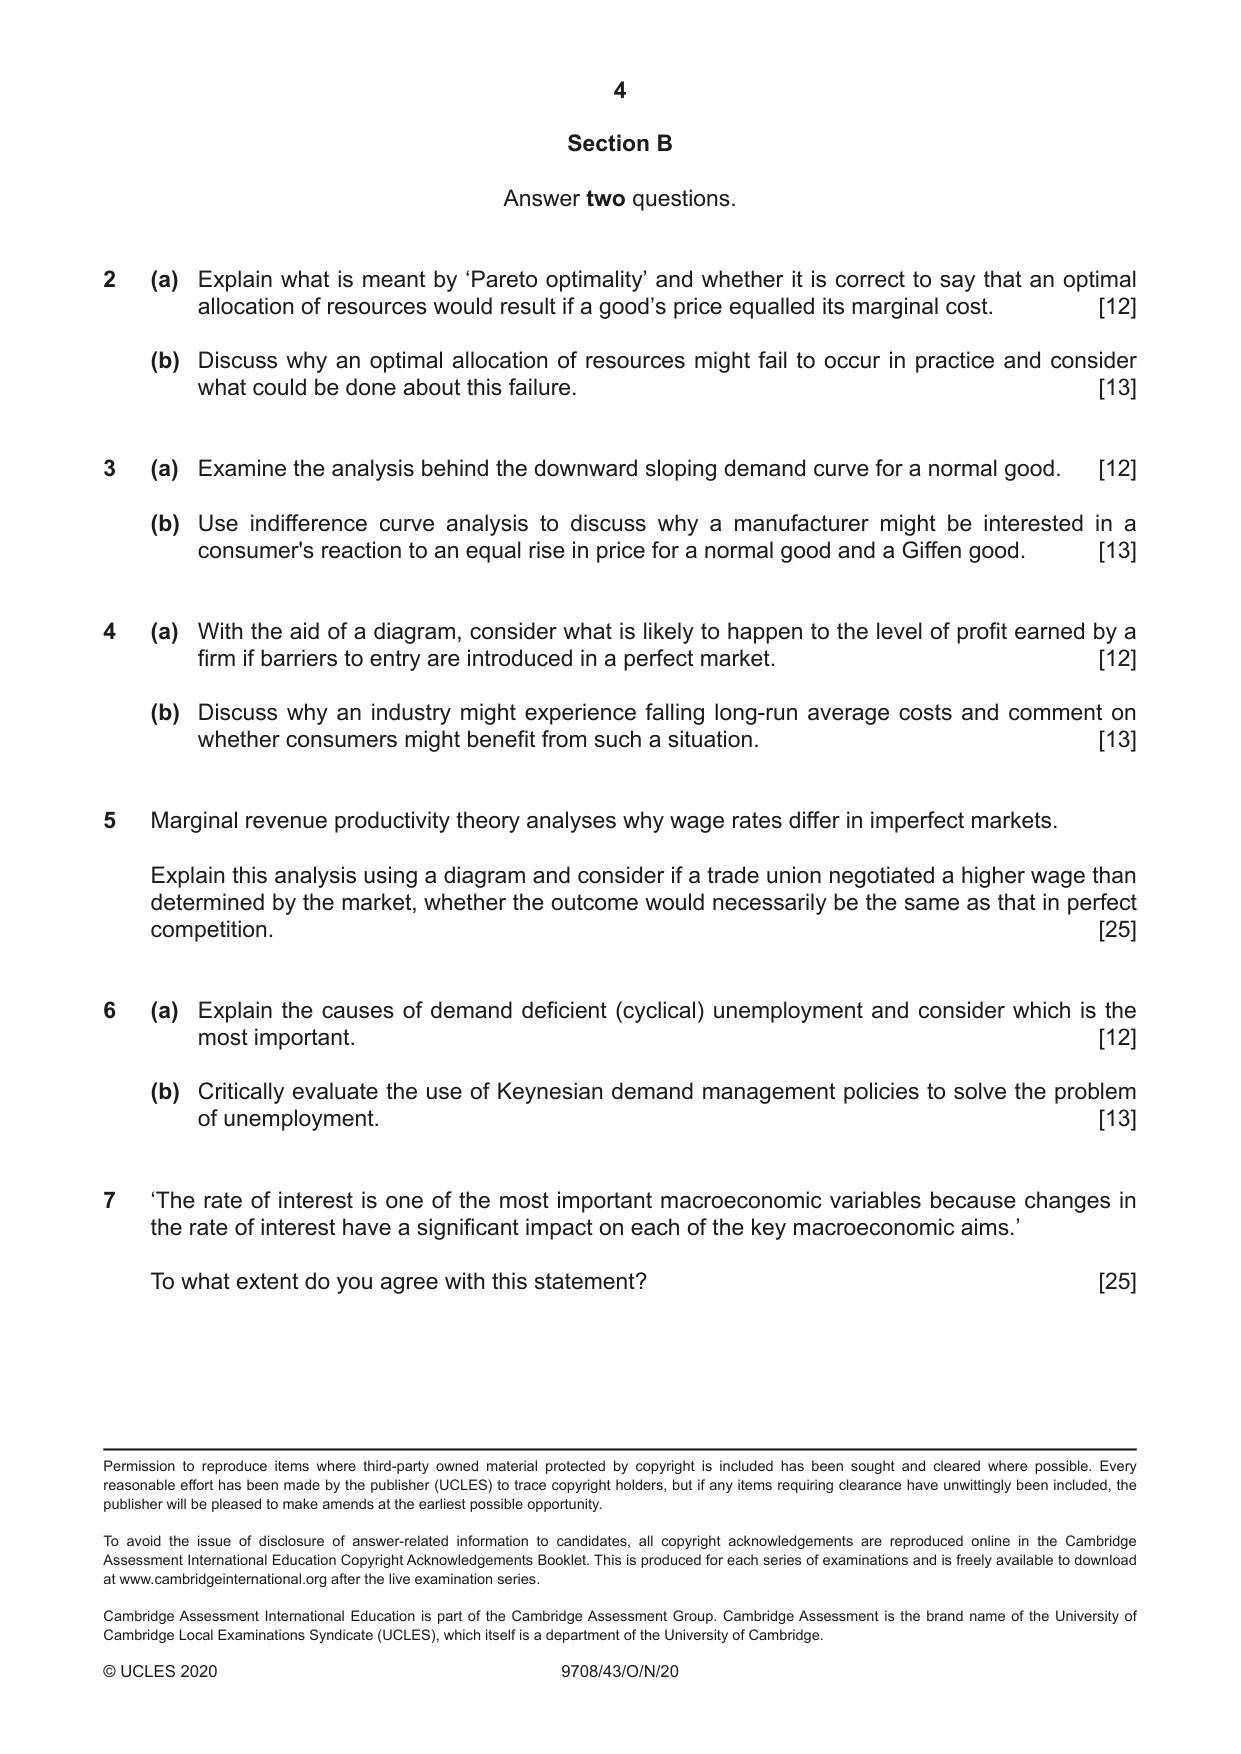
Mark scheme: Question Answer Marks 1(a) The article mentions economic growth. What is meant by economic 3 growth? An increase in the amount of goods and services (or real GDP) produced over a period of time. 1(b) Explain how economic growth is linked to a country’s level of 4 development. Economic growth leads to increased output, employment, income, resource use, improved standard of living 1(c) Explain why economic migrants are mainly from the developing 4 economies. Rapid rise in labour force – developing economies population skewed towards younger work force. Job creation in developing economies cannot keep pace with growth in work force. (compare estimated growth with that of China 1978–2011). Situation in developing countries not helped by low investment by developed economies hence economic migration to developed countries 1(d) Discuss, using the information, whether links between developed 9 economies and developing economies are necessarily ‘mutually beneficial’. For: Capital investment out of savings from the developed world used for infrastructure and manufacturing creating jobs in the developing world. This reduces the need for economic migration. Developed world receives dividends and profits increasing GDP. Overall effect is an increase in economic growth (multiplier) in both sets of economies. Against: – Free trade (loss of comparative advantage) and migration are under attack because developed economies, like the USA, have protectionist policies as well as policies to halt inflows of migrant labour. – Capital investment flows only about 2% of GDP of emerging economies which was the level in the 1980s. Flows reached maximum of 8% of GDP in 2005 but fell rapidly after world financial crisis in 2007–8. – This low level limits economic growth and job creation. Forecast is that developing economies situation in this respect will worsen by 2030. – Effect will be that economic migrants will place ever greater pressure on world economy in seeking jobs. Hence migration (legal and illegal) trends will increase. – Income inequalities between developed and developing economies will widen.
More questions on Relationship between countries at different levels of development
Q2 · Explain what is meant by ʻPareto optimalityʼ and whether it is correct to say that an…
2 (a) Explain what is meant by ʻPareto optimalityʼ and whether it is correct to say that an optimal allocation of resources would result if a goodʼs price equalled its marginal cost. [12] (b) Discuss why an optimal allocation of resources might fail to occur in practice and consider what could be done about this failure. [13]
Mark scheme: 2(a) Explain what is meant by ʻPareto optimalityʼ and whether it is correct to say that an optimal allocation of resources would result if a good’s price equalled its marginal cost. Optimal allocation involves Pareto allocative efficiency (cannot make someone better off without somebody being worse off) P = mc gives allocative efficiency but it should be MSC. L4 (9–12 marks) for explaining Pareto criteria and a clear explanation of p=mc, consideration of externalities – both positive and negative. L3 (7–8 marks) for explaining Pareto criteria and for a less developed explanation, with either positive or negative externalities. L2 (5–6 marks) for an idea of Pareto criteria but a poor explanation of p = mc with no externalities L1 (1–4 marks) for an answer that has some basic correct facts but includes irrelevancies and errors of theory. 2(b) Discuss why an optimal allocation of resources might fail to occur in 13 practice and consider what could be done about this failure. Discussion of reasons for market failure, public goods, market control in some market structures, externalities, and imperfect information. Government intervention by taxation, subsidies, regulation, persuasion, ownership. L4 (9–13 marks) for an analysis and developed evaluation of 4 issues. (any combination of reasons for failure and types of intervention) or an analysis of more than four issues with briefer comment and evaluation. L3 (7–8 marks) For an analysis and comment of 3 issues or an analysis of more than three issues with briefer comment and evaluation. L2 (5–6 marks) for an analysis and evaluation of two issues or an analysis of more than two issues with very brief comment and evaluation. L1 (1–4 marks) for an answer that has some basic correct facts but includes irrelevancies and errors of theory.
Q3 · Examine the analysis behind the downward sloping demand curve for a normal good
3 (a) Examine the analysis behind the downward sloping demand curve for a normal good. [12] (b) Use indifference curve analysis to discuss why a manufacturer might be interested in a consumer's reaction to an equal rise in price for a normal good and a Giffen good. [13]
Mark scheme: 3(a) Examine the analysis behind the downward sloping demand curve for 12 a normal good. Explanation of consumer equilibrium, its link to price changes and the construction of the demand curve. Either marginal utility or indifference curves may be used. Both determine the maximum satisfaction for a consumer. One relates the equilibrium directly to a point on the demand curve, the other does not. L4 (9–12 marks) for a sound explanation of the analysis and a clear comment on how a demand curve is formed as price changes affect equilibrium. A clear understanding of the principles involved. L3 (7–8 marks) for an accurate reference to the question but with a more limited development probably without a good explanation of the construction of a demand curve. The answer will probably just refer to one point on the demand curve and not deal with price changes. L2 (5–6 marks) for a briefer explanation of the analysis and equilibrium position but with no clear link to the demand curve. L1 (1–4 marks) for an answer that has some basic correct facts but includes irrelevancies and errors of theory. 3(b) Use indifference curve analysis to discuss why a manufacturer might 13 be interested in a consumer's reaction to an equal rise in price for a normal good and a Giffen good. Discussion of effect on demand of a rise in price for normal, inferior, Giffen goods and for goods with different elasticities. The manufacturer would be interested in the effect on revenue of any change in price and the effect would depend on the type of good. L4 (9–13 marks) for a clear analysis of price, income, substitution and an evaluation of different goods and link to revenue. Diagrams should be accurate. L3 (7–8 marks) for a less precise analysis with minor errors in the diagrams and with a less competent link to revenue. L2 (5–6 marks) for an answer that confuses income and substitution or does not comment on the revenue aspect. L1 (1–4 marks) for an answer that has some basic correct facts but includes irrelevancies and errors of theory.
Q4 · With the aid of a diagram, consider what is likely to happen to the level of profit…
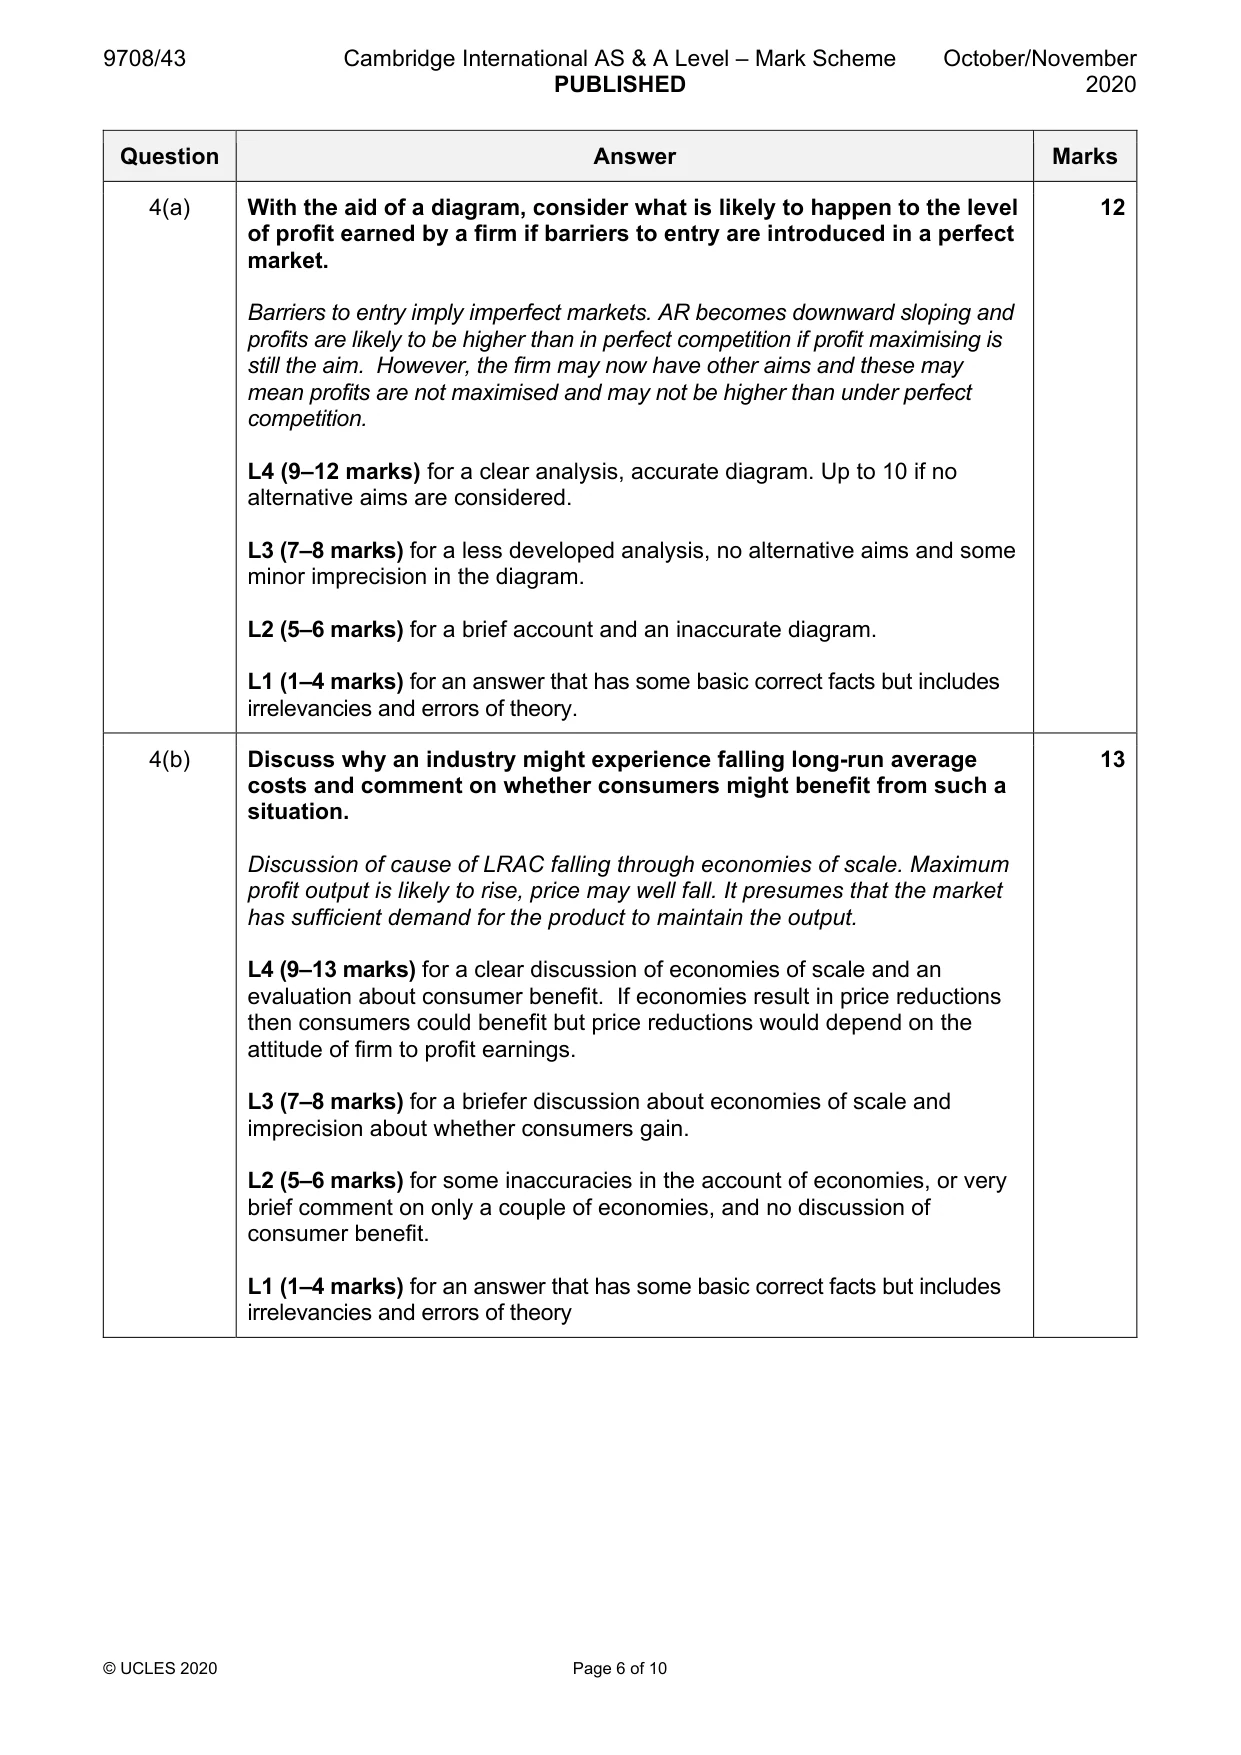
4 (a) With the aid of a diagram, consider what is likely to happen to the level of profit earned by a firm if barriers to entry are introduced in a perfect market. [12] (b) Discuss why an industry might experience falling long-run average costs and comment on whether consumers might benefit from such a situation. [13]
Mark scheme: 4(a) With the aid of a diagram, consider what is likely to happen to the level 12 of profit earned by a firm if barriers to entry are introduced in a perfect market. Barriers to entry imply imperfect markets. AR becomes downward sloping and profits are likely to be higher than in perfect competition if profit maximising is still the aim. However, the firm may now have other aims and these may mean profits are not maximised and may not be higher than under perfect competition. L4 (9–12 marks) for a clear analysis, accurate diagram. Up to 10 if no alternative aims are considered. L3 (7–8 marks) for a less developed analysis, no alternative aims and some minor imprecision in the diagram. L2 (5–6 marks) for a brief account and an inaccurate diagram. L1 (1–4 marks) for an answer that has some basic correct facts but includes irrelevancies and errors of theory. 4(b) Discuss why an industry might experience falling long-run average 13 costs and comment on whether consumers might benefit from such a situation. Discussion of cause of LRAC falling through economies of scale. Maximum profit output is likely to rise, price may well fall. It presumes that the market has sufficient demand for the product to maintain the output. L4 (9–13 marks) for a clear discussion of economies of scale and an evaluation about consumer benefit. If economies result in price reductions then consumers could benefit but price reductions would depend on the attitude of firm to profit earnings. L3 (7–8 marks) for a briefer discussion about economies of scale and imprecision about whether consumers gain. L2 (5–6 marks) for some inaccuracies in the account of economies, or very brief comment on only a couple of economies, and no discussion of consumer benefit. L1 (1–4 marks) for an answer that has some basic correct facts but includes irrelevancies and errors of theory
More questions on Types of cost, revenue and profit, short-run and long-run production
Q5 · Marginal revenue productivity theory analyses why wage rates differ in imperfect markets
5 Marginal revenue productivity theory analyses why wage rates differ in imperfect markets. Explain this analysis using a diagram and consider if a trade union negotiated a higher wage than determined by the market, whether the outcome would necessarily be the same as that in perfect competition. [25]
Mark scheme: 5 Marginal revenue productivity theory analyses why wage rates differ in 25 imperfect markets. Explain this analysis using a diagram and consider if a trade union negotiated a higher wage than determined by the market, whether the outcome would necessarily be the same as that in perfect competition. Analysis of wage determination using MRP. Diagram is necessary. Wage rates differ depending on position of MRP and costs. Wage will be lower than under perfect competition. TUs may increase wages, the result on employment could be the same as under perfect competition but profits would still be higher. It is likely that employment would not be the same as under perfect competition – it could be higher (but wages would be lower than under perfect competition). Or employment could be lower (but wages would be higher than under perfect competition). L4 (18–25 marks) for clear analysis and comment on why there are differentials. Clear evaluation on different outcomes depending on where the union negotiates the wage level. Accurate diagrams. L3 (14–17 marks) for a weaker analysis and poor comment on wage differentials. Less developed attempt to consider alternative outcomes depending on where the wage is negotiated. Probably only one outcome will be presented. Minor errors in the diagrams. L2 (10–13 marks) for a poor analysis and no comment on wage differentials. The comparison with perfect competition will also be very weak. Very poor and imprecise diagrams. L1 (1–9 marks) for an answer that shows some knowledge but does not indicate that the question has been fully grasped or where the answer is mostly irrelevant.
More questions on Labour market forces and government intervention
Q6 · Explain the causes of demand deficient (cyclical) unemployment and consider which is the…
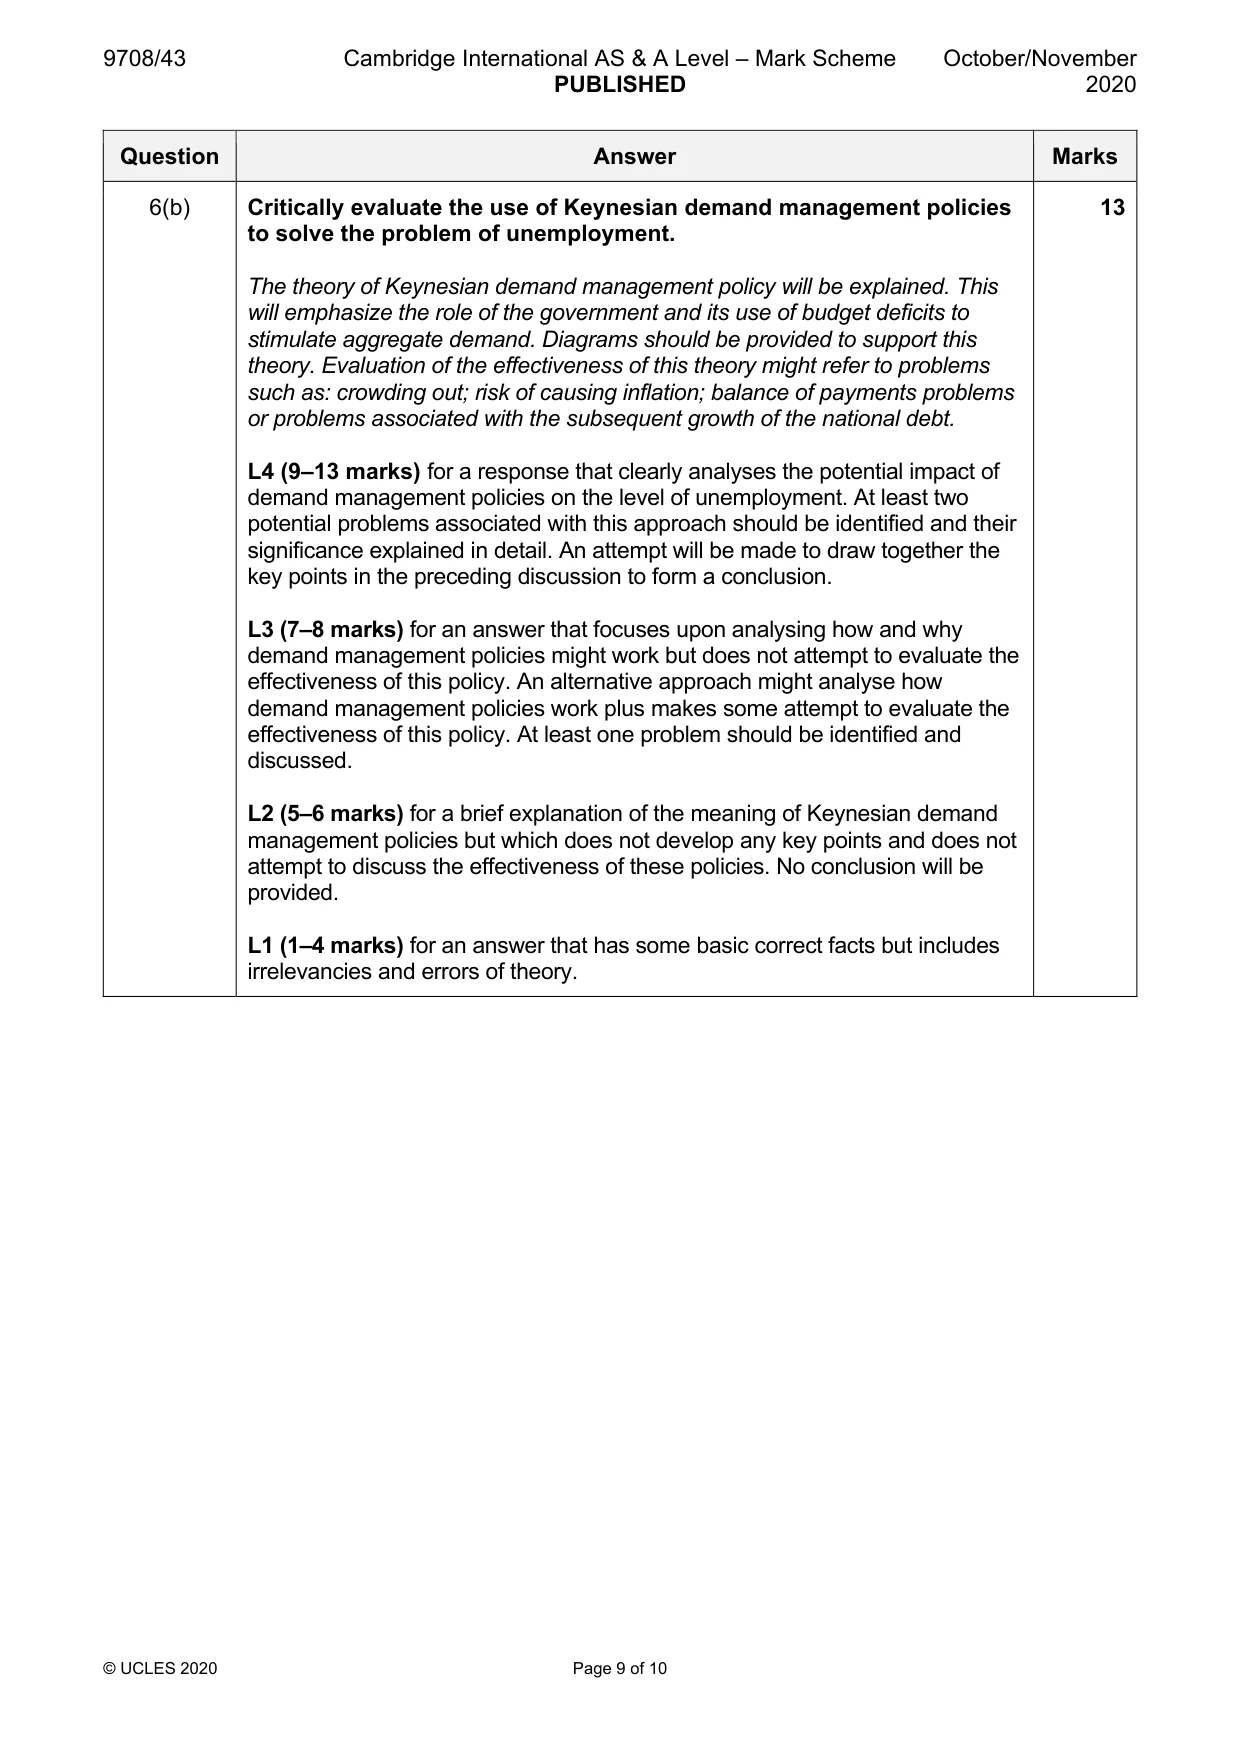
6 (a) Explain the causes of demand deficient (cyclical) unemployment and consider which is the most important. [12] (b) Critically evaluate the use of Keynesian demand management policies to solve the problem of unemployment. [13]
Mark scheme: 6(a) Explain the causes of demand deficient (cyclical) unemployment and 12 consider which is the most important. A definition of demand deficient unemployment and an explanation of the causes of demand deficient unemployment. Supporting diagrams should be provided. Each cause should be discussed in relation to its overall importance. For example, if this type of unemployment is caused by a fall in the level of exports, this will have potentially negative effects on the exchange rate which will have additional impact on other key macroeconomic performance indicators. The same approach could be applied to any of the other factors which might influence the level of aggregate demand. L4 (9–12 marks) for a sound explanation of at least two causes of demand deficient unemployment and attempt to discuss the relative importance of these factors in relation to their overall impact on unemployment. A clear attempt should be made to draw a conclusion based on the preceding argument. L3 (7–8 marks) for a detailed explanation of one cause of demand deficient unemployment and an attempt to discuss its relative importance with a reasoned conclusion or a detailed analysis of the main causes of demand deficient unemployment but which does not address the second part of the question. L2 (5–6 marks) for a descriptive approach that does not analyse the causes of demand deficient unemployment and which does not address the second part of the question. No conclusion will be provided. L1 (1–4 marks) for an answer that has some basic correct facts but includes irrelevancies and errors of theory. 6(b) Critically evaluate the use of Keynesian demand management policies 13 to solve the problem of unemployment. The theory of Keynesian demand management policy will be explained. This will emphasize the role of the government and its use of budget deficits to stimulate aggregate demand. Diagrams should be provided to support this theory. Evaluation of the effectiveness of this theory might refer to problems such as: crowding out; risk of causing inflation; balance of payments problems or problems associated with the subsequent growth of the national debt. L4 (9–13 marks) for a response that clearly analyses the potential impact of demand management policies on the level of unemployment. At least two potential problems associated with this approach should be identified and their significance explained in detail. An attempt will be made to draw together the key points in the preceding discussion to form a conclusion. L3 (7–8 marks) for an answer that focuses upon analysing how and why demand management policies might work but does not attempt to evaluate the effectiveness of this policy. An alternative approach might analyse how demand management policies work plus makes some attempt to evaluate the effectiveness of this policy. At least one problem should be identified and discussed. L2 (5–6 marks) for a brief explanation of the meaning of Keynesian demand management policies but which does not develop any key points and does not attempt to discuss the effectiveness of these policies. No conclusion will be provided. L1 (1–4 marks) for an answer that has some basic correct facts but includes irrelevancies and errors of theory.
More questions on Effectiveness of policy options to meet all macroeconomic objectives
Q7 · ‘The rate of interest is one of the most important macroeconomic variables because…
7 ‘The rate of interest is one of the most important macroeconomic variables because changes in the rate of interest have a significant impact on each of the key macroeconomic aims.’ To what extent do you agree with this statement? [25]
Mark scheme: 7 ‘The rate of interest is one of the most important macroeconomic 25 variables because changes in the rate of interest have a significant impact on each of the key macroeconomic aims.’ To what extent do you agree with this statement? A brief introduction should explain the meaning of the rate of interest. The links between changes in interest rates and changes in employment, economic growth, inflation and the balance of payments should then be considered. For example, discussion might relate to the impact of a fall in interest rates on the exchange rate and how this change might subsequently affect imports and exports and ultimately the balance of payments. Either increases or decrease in interest rates can be discussed but it is important to establish the links between changes in interest rates and some key macroeconomic indicators. An attempt should also be made to consider the importance of these changes compared to the effect of changes in other variables, for example government expenditure/taxation. L4 (18–25 marks) for a detailed discussion of the impact of changes in interest rates on at least three macroeconomic goals. The extent of the impact should be considered in each case. Some attempt should then be made to decide, based upon the previous analysis, how important these changes might be. A conclusion will consider the potential impact of changes in other variables on the macro economy and to compare the relative importance of these changes in relation to the impact of interest rate changes. L3 (14–17 marks) for an answer that focuses upon analysing the impact of interest rate changes on at least two key macroeconomic indicators. Also some attempt to discuss the effectiveness of these changes should be made. An attempt to decide whether the rate of interest is one of the main macroeconomic variables will be made but the comparison with changes in alternative variables will not be fully developed. L2 (10–13 marks) for a more limited but acceptable attempt to establish the importance of changes in interest rates on the macro economy but does not provide any detailed analysis of the links between these changes and their final impact on the economy. No attempt to discuss the relative importance of interest rate changes will be made. L1 (1–9 marks) For an answer that shows some knowledge but does not indicate that the question has been fully grasped or where the answer is mostly irrelevant.
What was in this paper
The subtopics covered by these 7 questions, and how many questions each got. Open one in a new tab to see every Cambridge question on it.
1Government policies to achieve efficient resource allocation and correct market failure1Indifference curves and budget lines1Labour market forces and government intervention1Monetary policy1Relationship between countries at different levels of development1Types of cost, revenue and profit, short-run and long-run production1What you needed in this session
Cambridge’s own grade thresholds for 2020 Oct/Nov, Paper 4 · Variant 3. A higher threshold means an easier paper — the bar moves with how the cohort did.