Cambridge A Level Economics 9708 — 2020 Oct/Nov Paper 2 · Variant 3
9708/23/O/N/20 · 4 questions · 40 marks · ≈45 min
The question paper and its mark scheme, free to read here and free to download. This is Cambridge’s own paper, exactly as it was sat.
Question paper4 pages
Mark scheme11 pages
Answers below. Sit the paper first if you are practising.
Questions as text
Q1 · Malaysia’s persistent trade surplus Malaysia has the third highest income per head in…
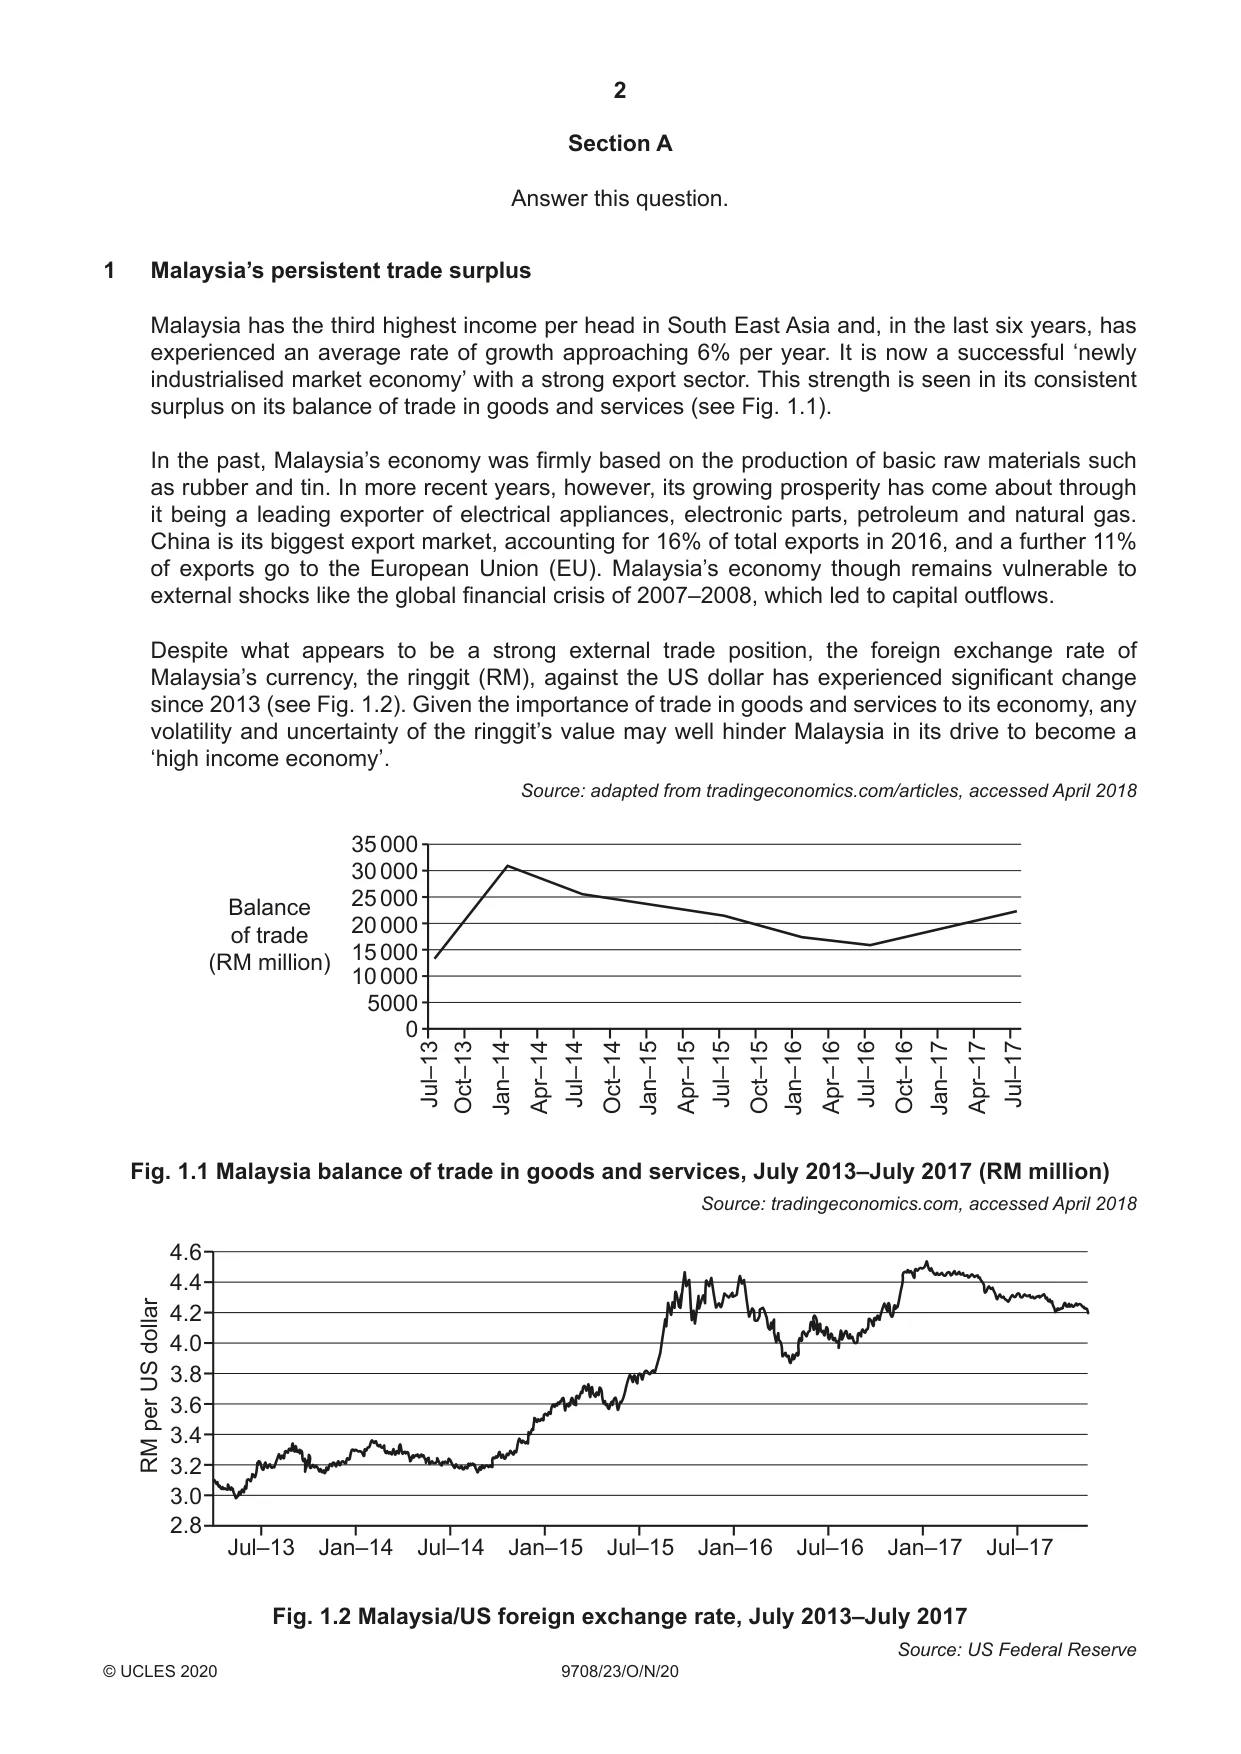
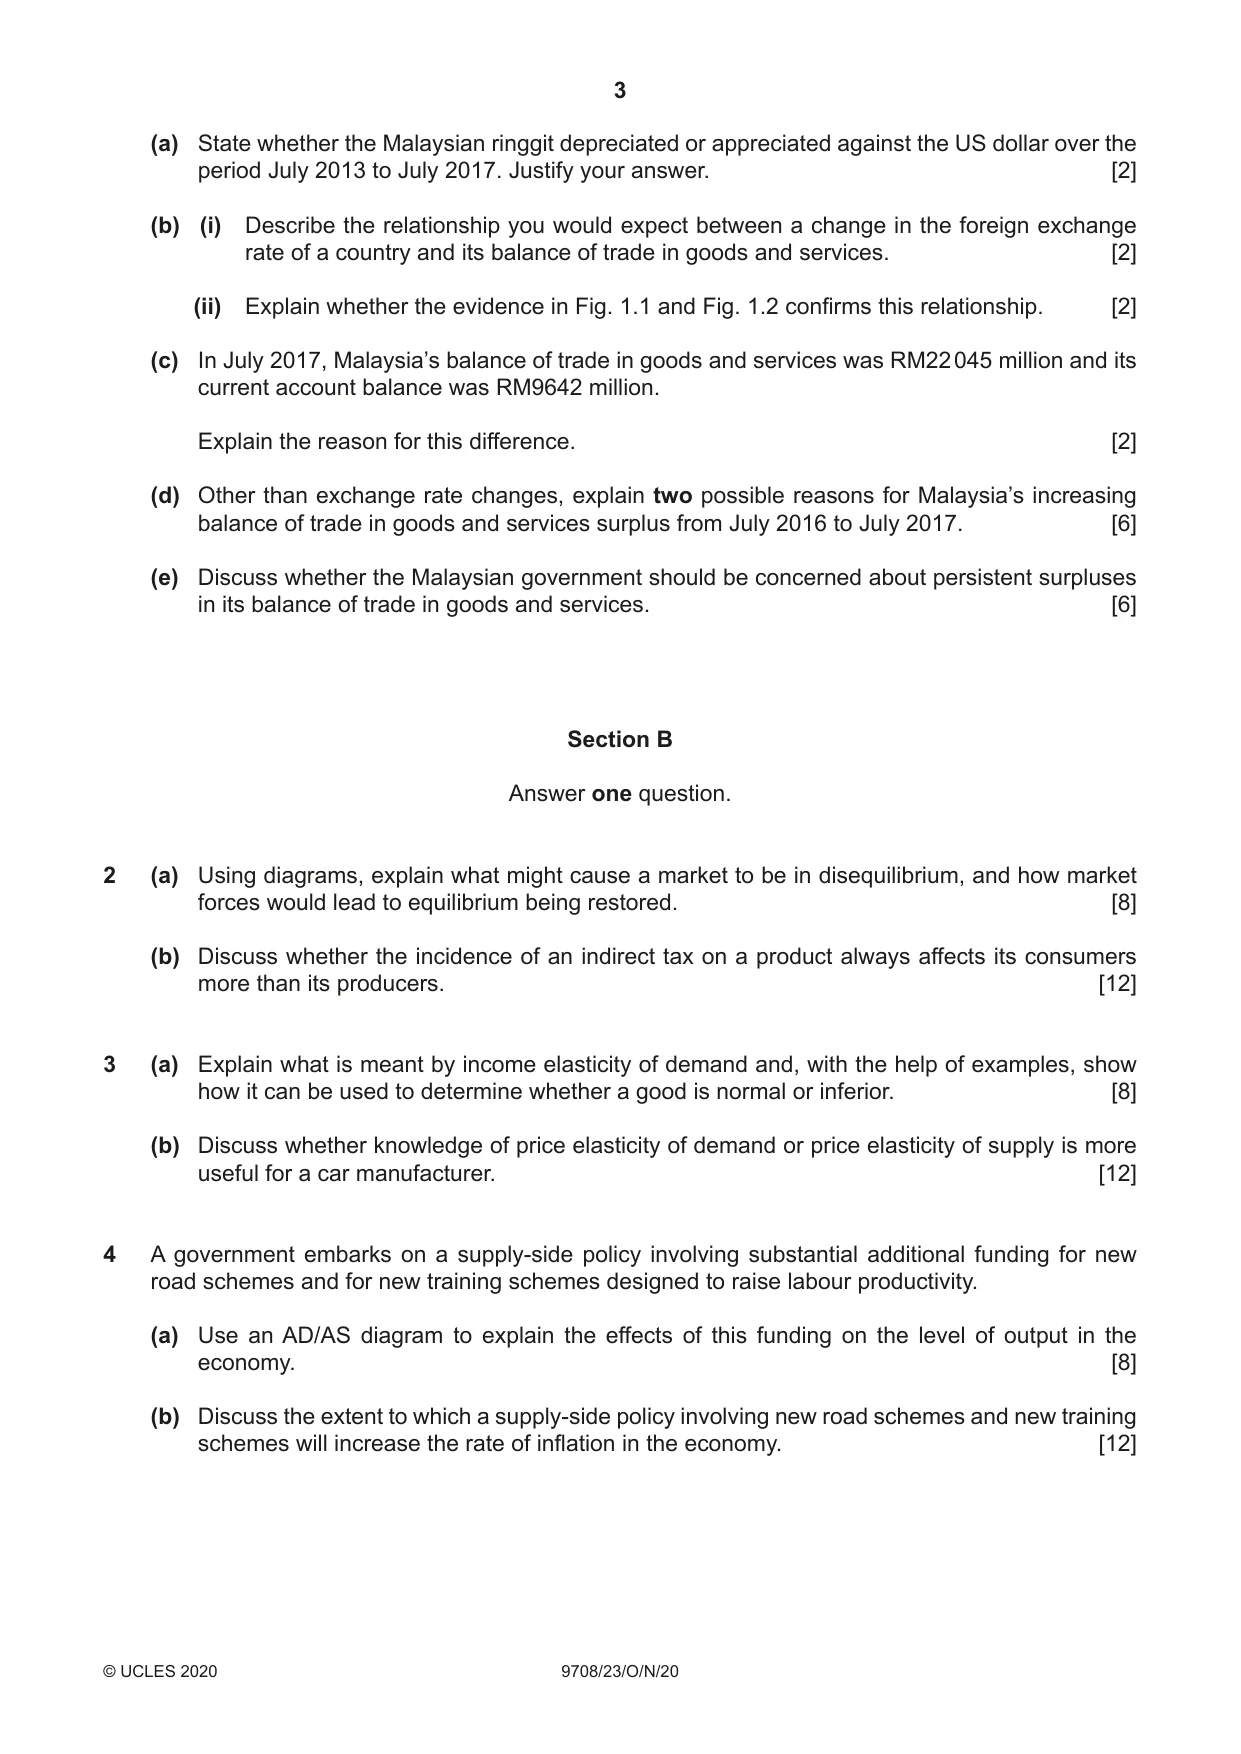
1 Malaysia’s persistent trade surplus Malaysia has the third highest income per head in South East Asia and, in the last six years, has experienced an average rate of growth approaching 6% per year. It is now a successful ‘newly industrialised market economy’ with a strong export sector. This strength is seen in its consistent surplus on its balance of trade in goods and services (see Fig. 1.1). In the past, Malaysia’s economy was firmly based on the production of basic raw materials such as rubber and tin. In more recent years, however, its growing prosperity has come about through it being a leading exporter of electrical appliances, electronic parts, petroleum and natural gas. China is its biggest export market, accounting for 16% of total exports in 2016, and a further 11% of exports go to the European Union (EU). Malaysia’s economy though remains vulnerable to external shocks like the global financial crisis of 2007–2008, which led to capital outflows. Despite what appears to be a strong external trade position, the foreign exchange rate of Malaysia’s currency, the ringgit (RM), against the US dollar has experienced significant change since 2013 (see Fig. 1.2). Given the importance of trade in goods and services to its economy, any volatility and uncertainty of the ringgit’s value may well hinder Malaysia in its drive to become a ‘high income economy’. Source: adapted from tradingeconomics.com/articles, accessed April 2018 35 000 30 000 25 000 Balance 20 000 of trade 15 000 (RM million) 10 000 5000 0 Jul–13 Oct–13 Jan–14 Apr–14 Jul–14 Oct–14 Jan–15 Apr–15 Jul–15 Oct–15 Jan–16 Apr–16 Jul–16 Oct–16 Jan–17 Apr–17 Jul–17 Fig. 1.1 Malaysia balance of trade in goods and services, July 2013–July 2017 (RM million) Source: tradingeconomics.com, accessed April 2018 4.6 4.4 dollar 4.24.0 US 3.8 3.6 per 3.4 RM 3.2 3.0 2.8 Jul–13 Jan–14 Jul–14 Jan–15 Jul–15 Jan–16 Jul–16 Jan–17 Jul–17 Fig. 1.2 Malaysia/US foreign exchange rate, July 2013–July 2017 Source: US Federal Reserve (a) State whether the Malaysian ringgit depreciated or appreciated against the US dollar over the period July 2013 to July 2017. Justify your answer. [2] (b) (i) Describe the relationship you would expect between a change in the foreign exchange rate of a country and its balance of trade in goods and services. [2] (ii) Explain whether the evidence in Fig. 1.1 and Fig. 1.2 confirms this relationship. [2] (c) In July 2017, Malaysia’s balance of trade in goods and services was RM22 045 million and its current account balance was RM9642 million. Explain the reason for this difference. [2] (d) Other than exchange rate changes, explain two possible reasons for Malaysia’s increasing balance of trade in goods and services surplus from July 2016 to July 2017. [6] (e) Discuss whether the Malaysian government should be concerned about persistent surpluses in its balance of trade in goods and services. [6]
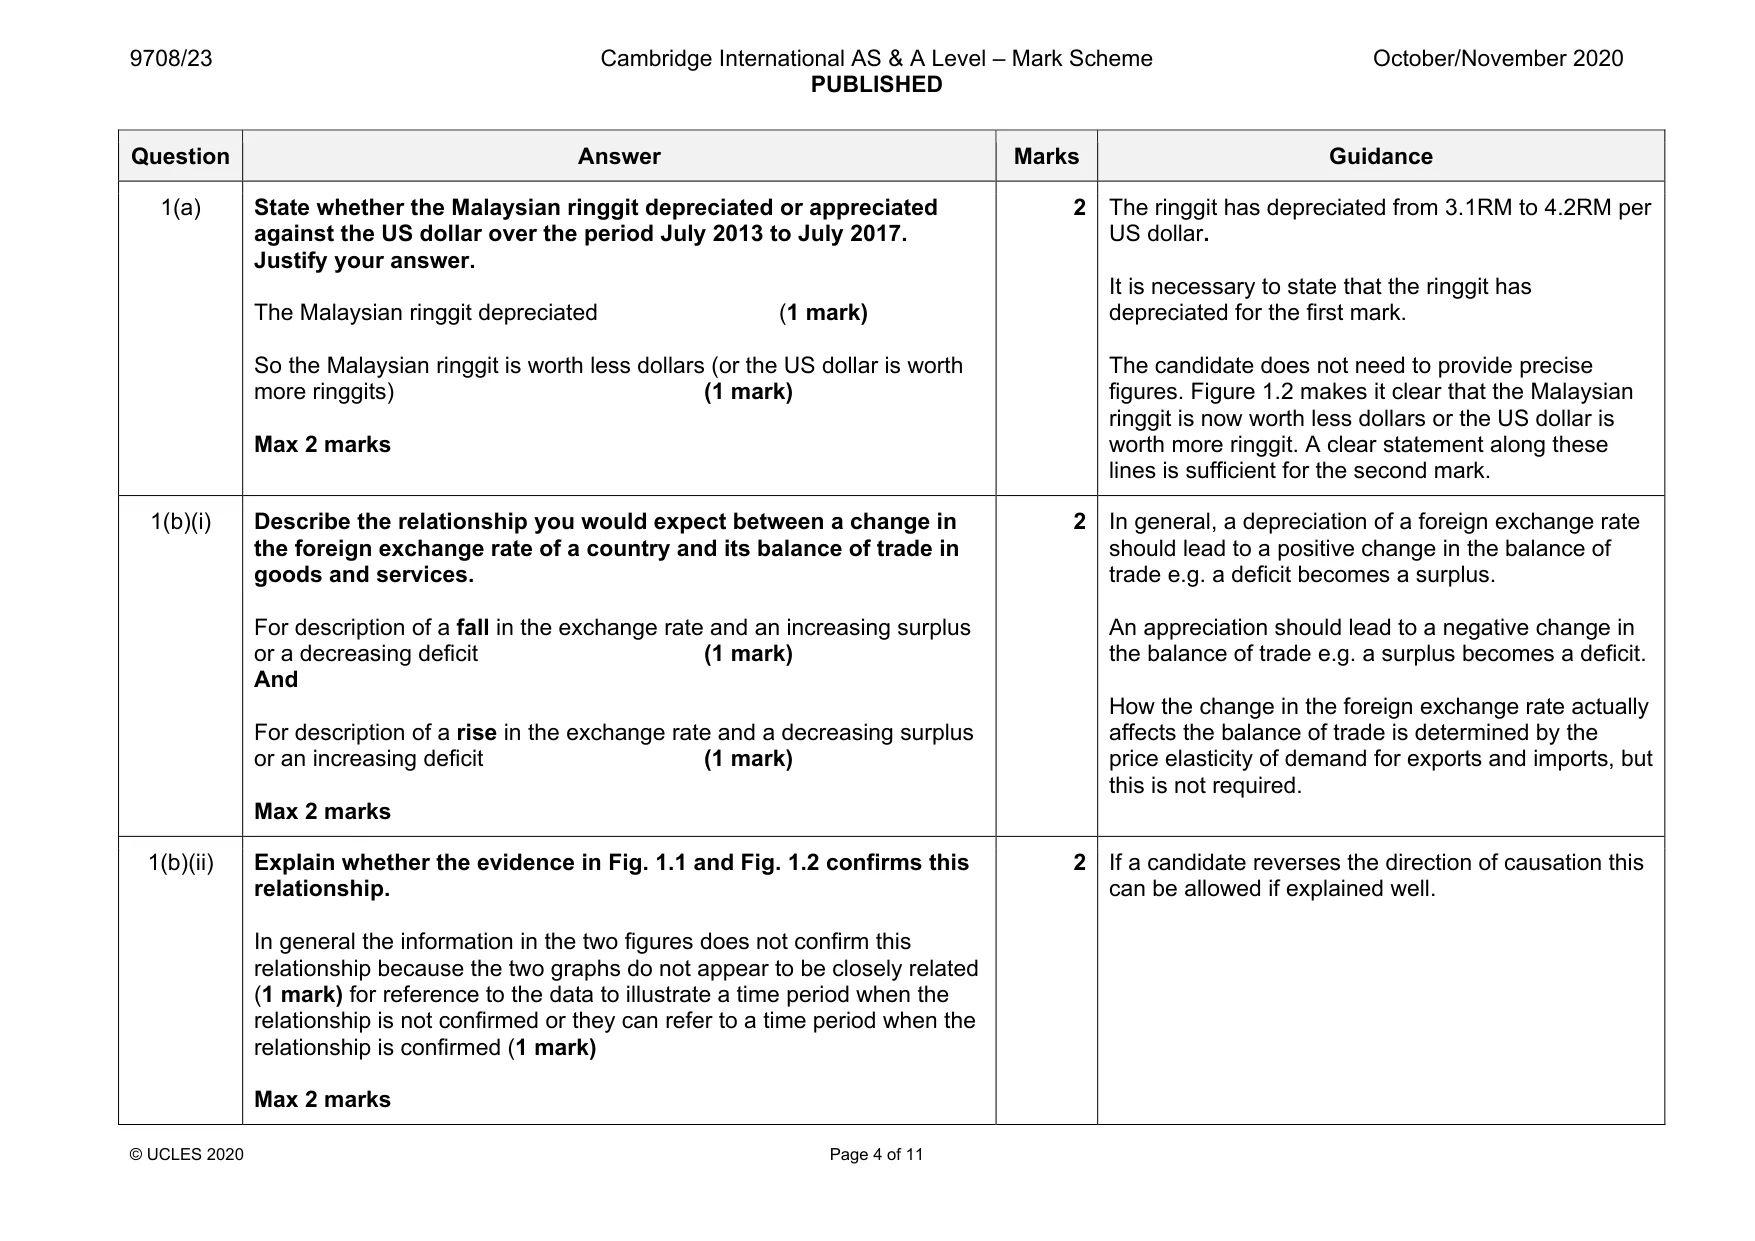
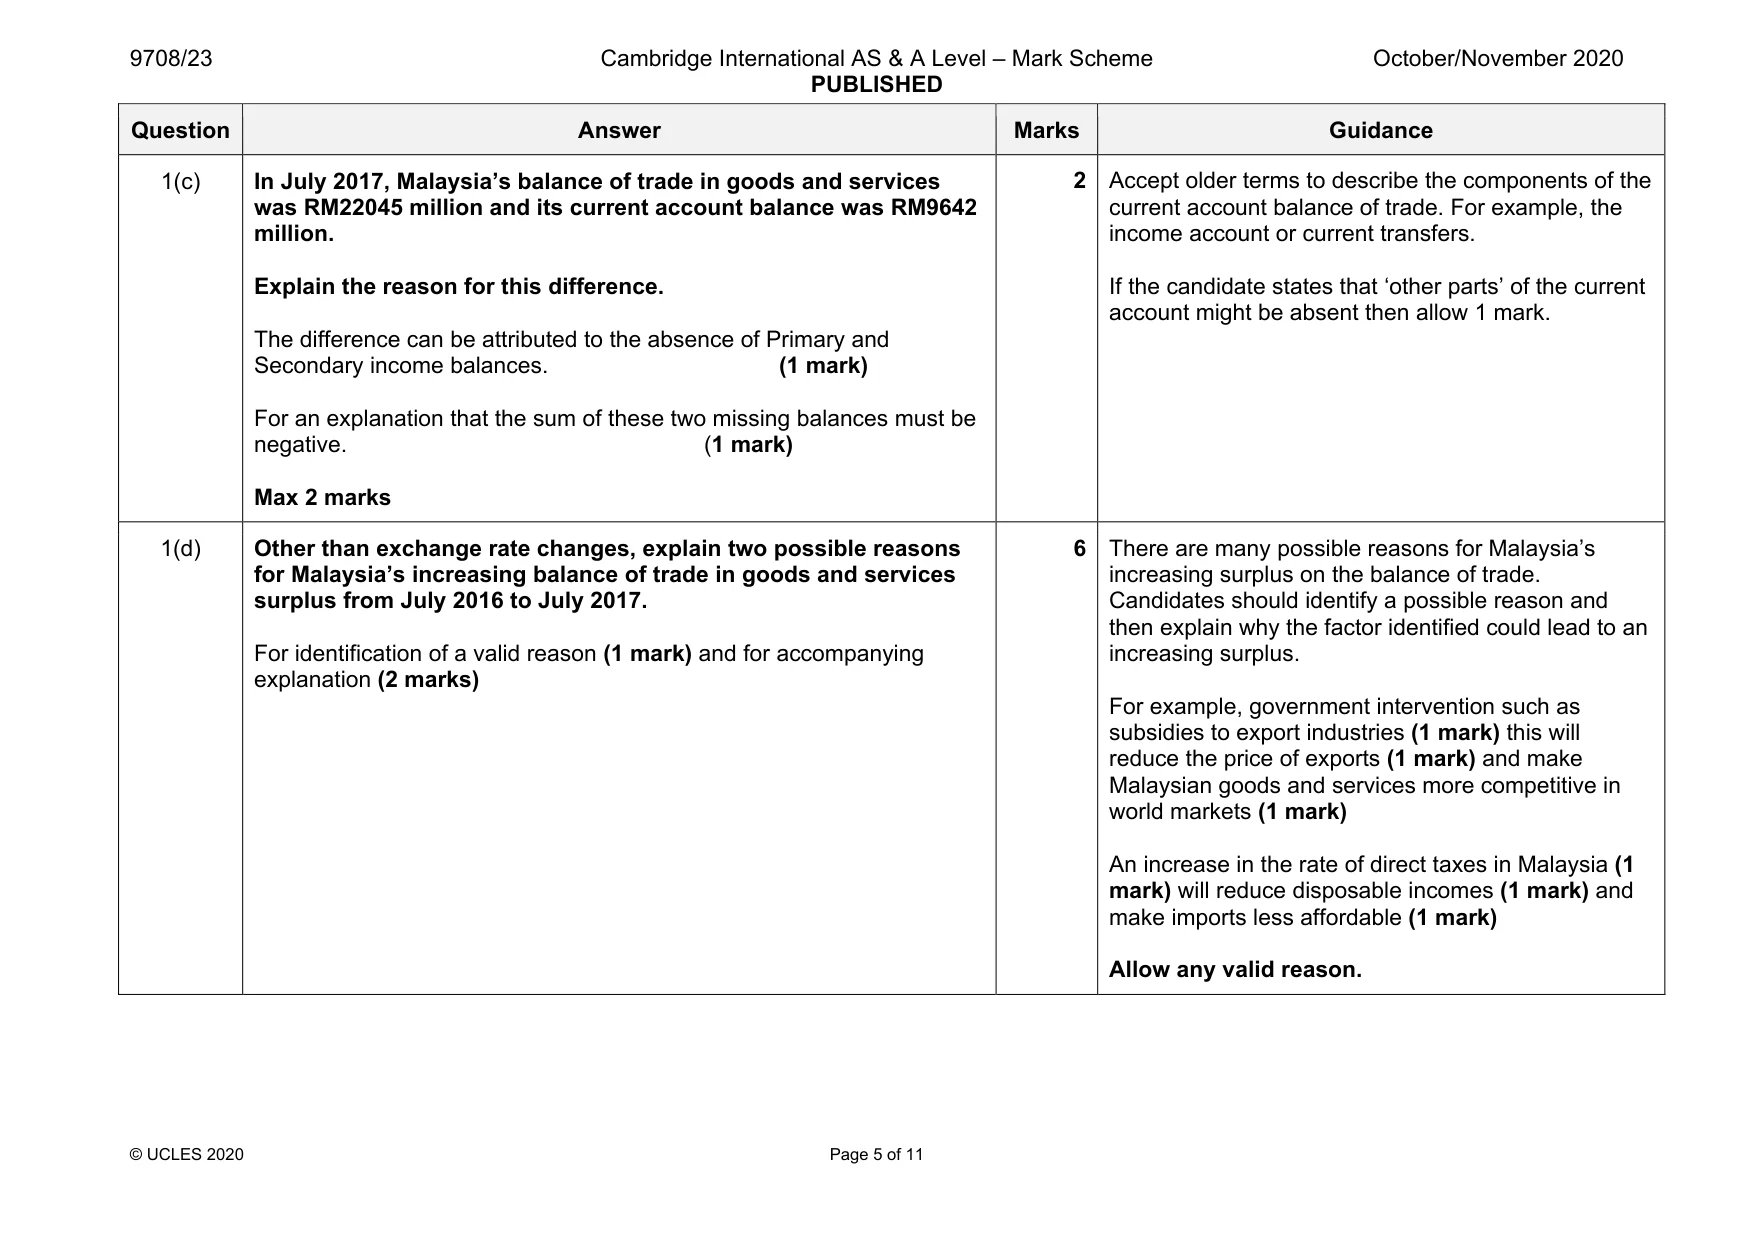
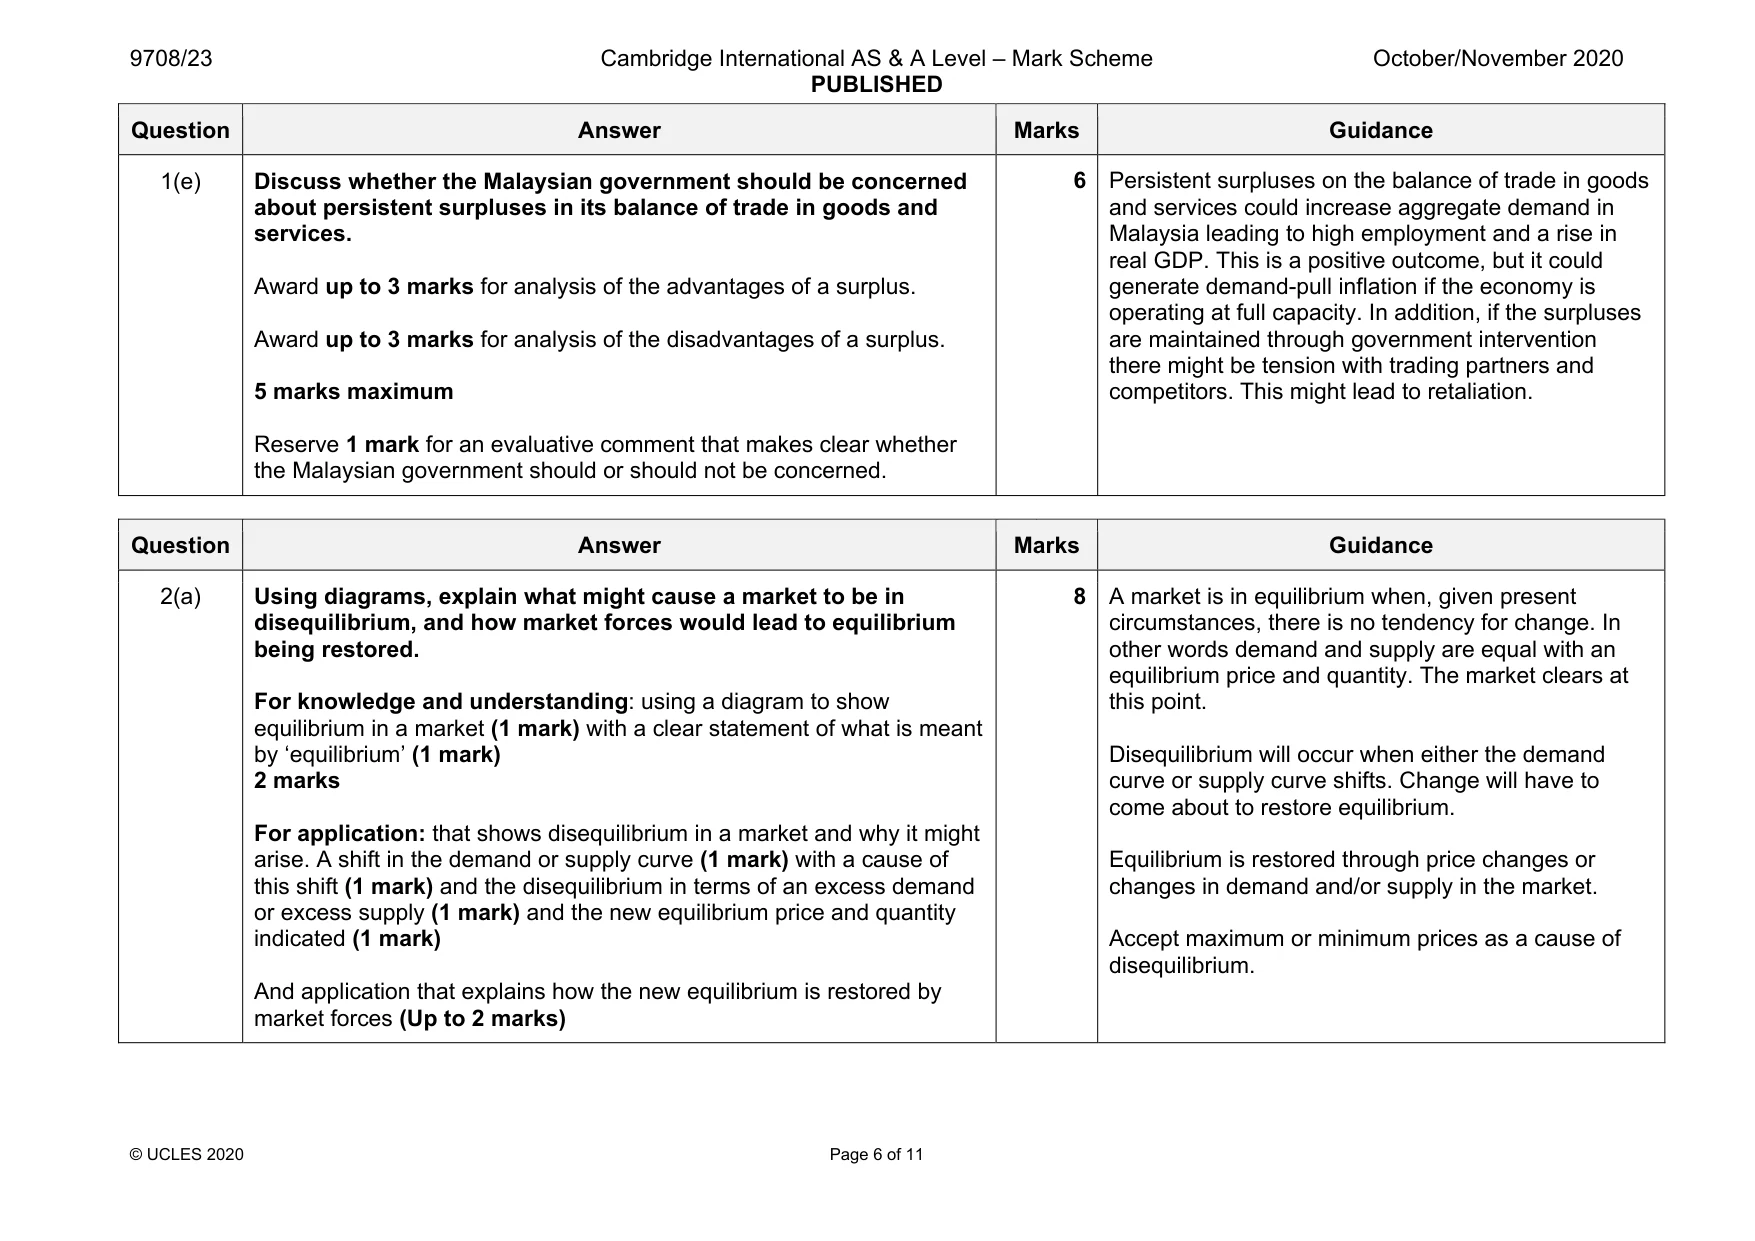
Mark scheme: 1(a) State whether the Malaysian ringgit depreciated or appreciated against the US dollar over the period July 2013 to July 2017. Justify your answer. The Malaysian ringgit depreciated (1 mark) So the Malaysian ringgit is worth less dollars (or the US dollar is worth more ringgits) (1 mark) Max 2 marks US dollar. It is necessary to state that the ringgit has depreciated for the first mark. The candidate does not need to provide precise figures. Figure 1.2 makes it clear that the Malaysian ringgit is now worth less dollars or the US dollar is worth more ringgit. A clear statement along these lines is sufficient for the second mark. 1(b)(i) Describe the relationship you would expect between a change in the foreign exchange rate of a country and its balance of trade in goods and services. For description of a fall in the exchange rate and an increasing surplus or a decreasing deficit (1 mark) And For description of a rise in the exchange rate and a decreasing surplus or an increasing deficit (1 mark) Max 2 marks 2 In general, a depreciation of a foreign exchange rate should lead to a positive change in the balance of trade e.g. a deficit becomes a surplus. An appreciation should lead to a negative change in the balance of trade e.g. a surplus becomes a deficit. How the change in the foreign exchange rate actually affects the balance of trade is determined by the price elasticity of demand for exports and imports, but this is not required. 1(b)(ii) Explain whether the evidence in Fig. 1.1 and Fig. 1.2 confirms this relationship. In general the information in the two figures does not confirm this relationship because the two graphs do not appear to be closely related (1 mark) for reference to the data to illustrate a time period when the relationship is not confirmed or they can refer to a time period when the relationship is confirmed (1 mark) Max 2 marks 2 If a candidate reverses the direction of causation this can be allowed if explained well. Question Answer Marks Guidance 1(c) In July 2017, Malaysia’s balance of trade in goods and services was RM22045 million and its current account balance was RM9642 million. Explain the reason for this difference. The difference can be attributed to the absence of Primary and Secondary income balances. (1 mark) For an explanation that the sum of these two missing balances must be negative. (1 mark) Max 2 marks 2 Accept older terms to describe the components of the current account balance of trade. For example, the income account or current transfers. If the candidate states that ‘other parts’ of the current account might be absent then allow 1 mark. 1(d) Other than exchange rate changes, explain two possible reasons for Malaysia’s increasing balance of trade in goods and services surplus from July 2016 to July 2017. For identification of a valid reason (1 mark) and for accompanying explanation (2 marks) 6 There are many possible reasons for Malaysia’s increasing surplus on the balance of trade. Candidates should identify a possible reason and then explain why the factor identified could lead to an increasing surplus. For example, government intervention such as subsidies to export industries (1 mark) this will reduce the price of exports (1 mark) and make Malaysian goods and services more competitive in world markets (1 mark) An increase in the rate of direct taxes in Malaysia (1 mark) will reduce disposable incomes (1 mark) and make imports less affordable (1 mark) Allow any valid reason. Question Answer Marks Guidance 1(e) Discuss whether the Malaysian government should be concerned about persistent surpluses in its balance of trade in goods and services. Award up to 3 marks for analysis of the advantages of a surplus. Award up to 3 marks for analysis of the disadvantages of a surplus. 5 marks maximum Reserve 1 mark for an evaluative comment that makes clear whether the Malaysian government should or should not be concerned. 6 Persistent surpluses on the balance of trade in goods and services could increase aggregate demand in Malaysia leading to high employment and a rise in real GDP. This is a positive outcome, but it could generate demand-pull inflation if the economy is operating at full capacity. In addition, if the surpluses are maintained through government intervention there might be tension with trading partners and competitors. This might lead to retaliation.
Q2 · Using diagrams, explain what might cause a market to be in disequilibrium, and how market…
2 (a) Using diagrams, explain what might cause a market to be in disequilibrium, and how market forces would lead to equilibrium being restored. [8] (b) Discuss whether the incidence of an indirect tax on a product always affects its consumers more than its producers. [12]
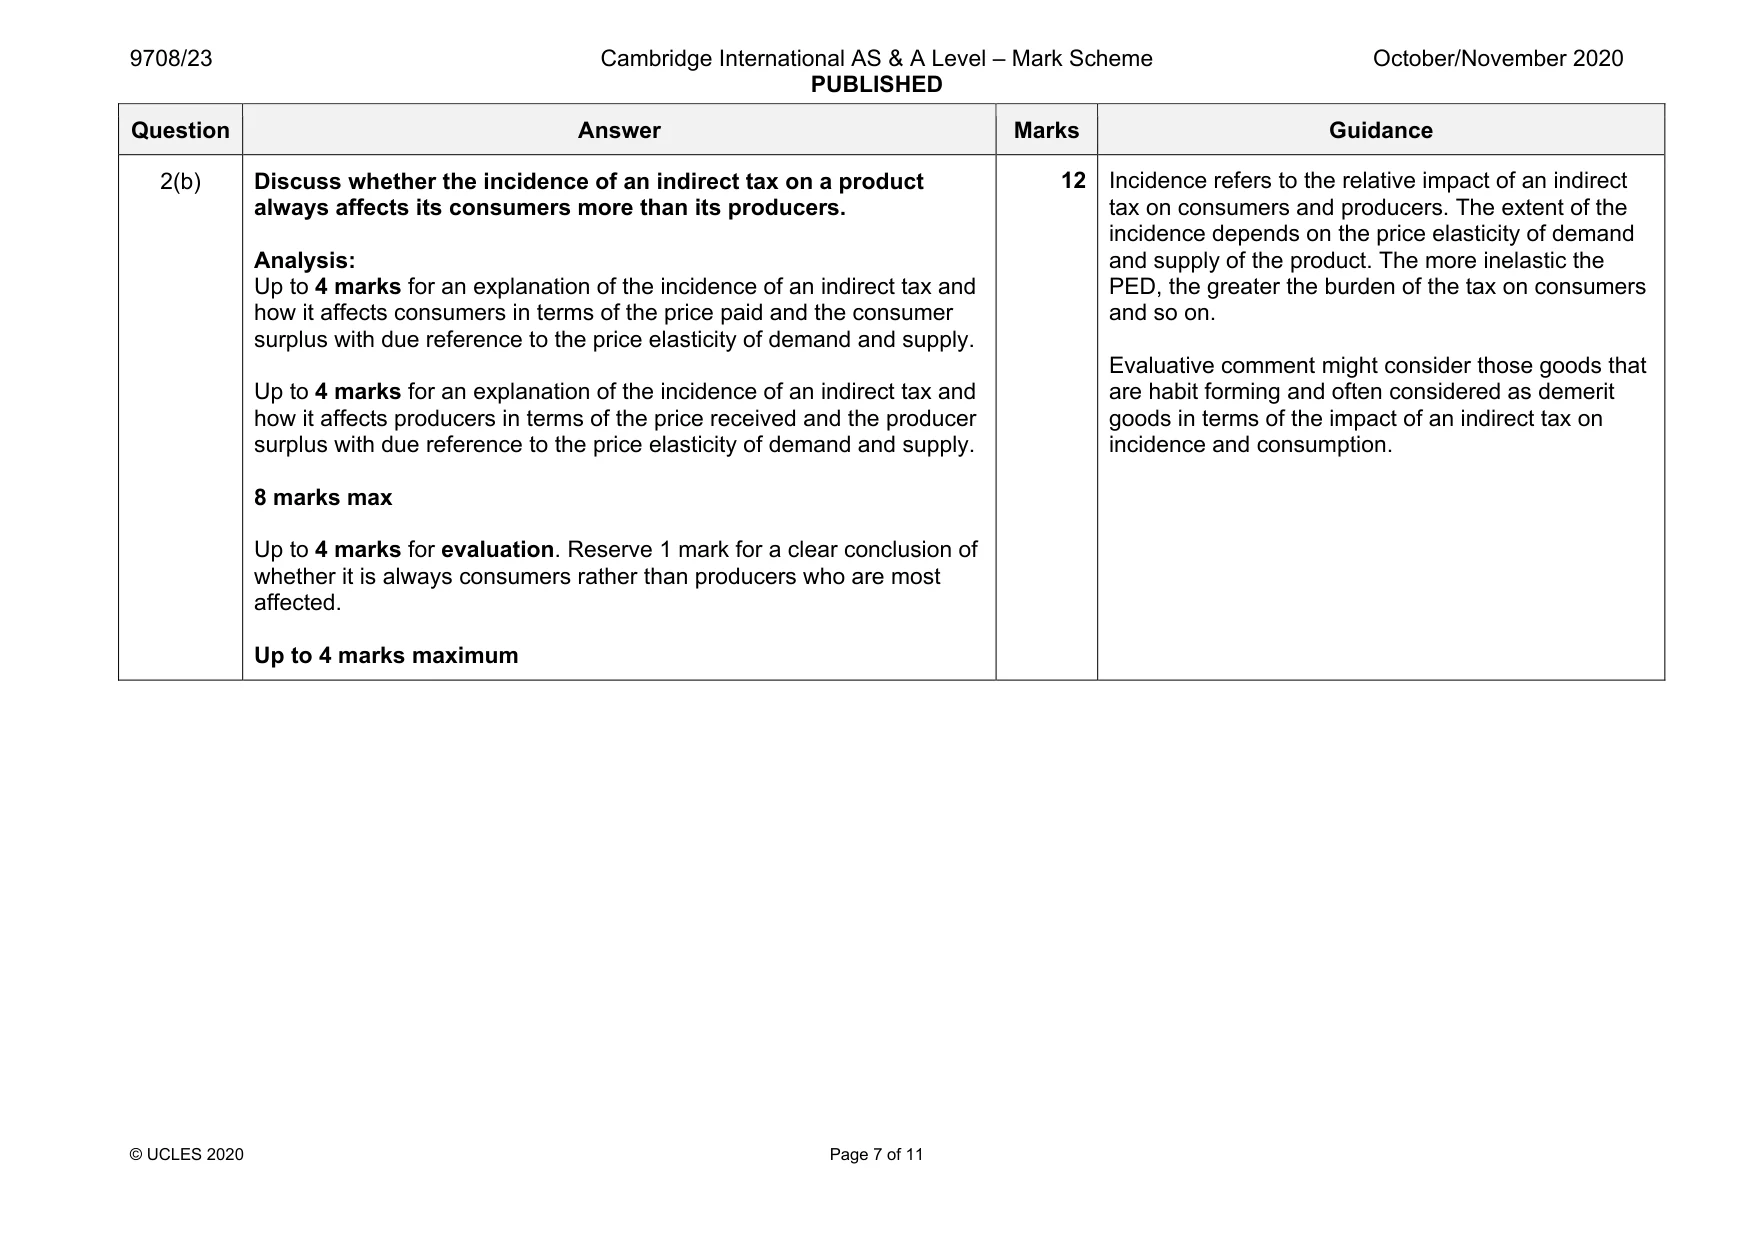
Mark scheme: 2(a) Using diagrams, explain what might cause a market to be in disequilibrium, and how market forces would lead to equilibrium being restored. For knowledge and understanding: using a diagram to show equilibrium in a market (1 mark) with a clear statement of what is meant by ‘equilibrium’ (1 mark) 2 marks For application: that shows disequilibrium in a market and why it might arise. A shift in the demand or supply curve (1 mark) with a cause of this shift (1 mark) and the disequilibrium in terms of an excess demand or excess supply (1 mark) and the new equilibrium price and quantity indicated (1 mark) And application that explains how the new equilibrium is restored by market forces (Up to 2 marks) circumstances, there is no tendency for change. In other words demand and supply are equal with an equilibrium price and quantity. The market clears at this point. Disequilibrium will occur when either the demand curve or supply curve shifts. Change will have to come about to restore equilibrium. Equilibrium is restored through price changes or changes in demand and/or supply in the market. Accept maximum or minimum prices as a cause of disequilibrium. Question Answer Marks Guidance 2(b) Discuss whether the incidence of an indirect tax on a product always affects its consumers more than its producers. Analysis: Up to 4 marks for an explanation of the incidence of an indirect tax and how it affects consumers in terms of the price paid and the consumer surplus with due reference to the price elasticity of demand and supply. Up to 4 marks for an explanation of the incidence of an indirect tax and how it affects producers in terms of the price received and the producer surplus with due reference to the price elasticity of demand and supply. 8 marks max Up to 4 marks for evaluation. Reserve 1 mark for a clear conclusion of whether it is always consumers rather than producers who are most affected. Up to 4 marks maximum 12 Incidence refers to the relative impact of an indirect tax on consumers and producers. The extent of the incidence depends on the price elasticity of demand and supply of the product. The more inelastic the PED, the greater the burden of the tax on consumers and so on. Evaluative comment might consider those goods that are habit forming and often considered as demerit goods in terms of the impact of an indirect tax on incidence and consumption.
More questions on Methods and effects of government intervention in markets
Q3 · Explain what is meant by income elasticity of demand and, with the help of examples, show…
3 (a) Explain what is meant by income elasticity of demand and, with the help of examples, show how it can be used to determine whether a good is normal or inferior. [8] (b) Discuss whether knowledge of price elasticity of demand or price elasticity of supply is more useful for a car manufacturer. [12]
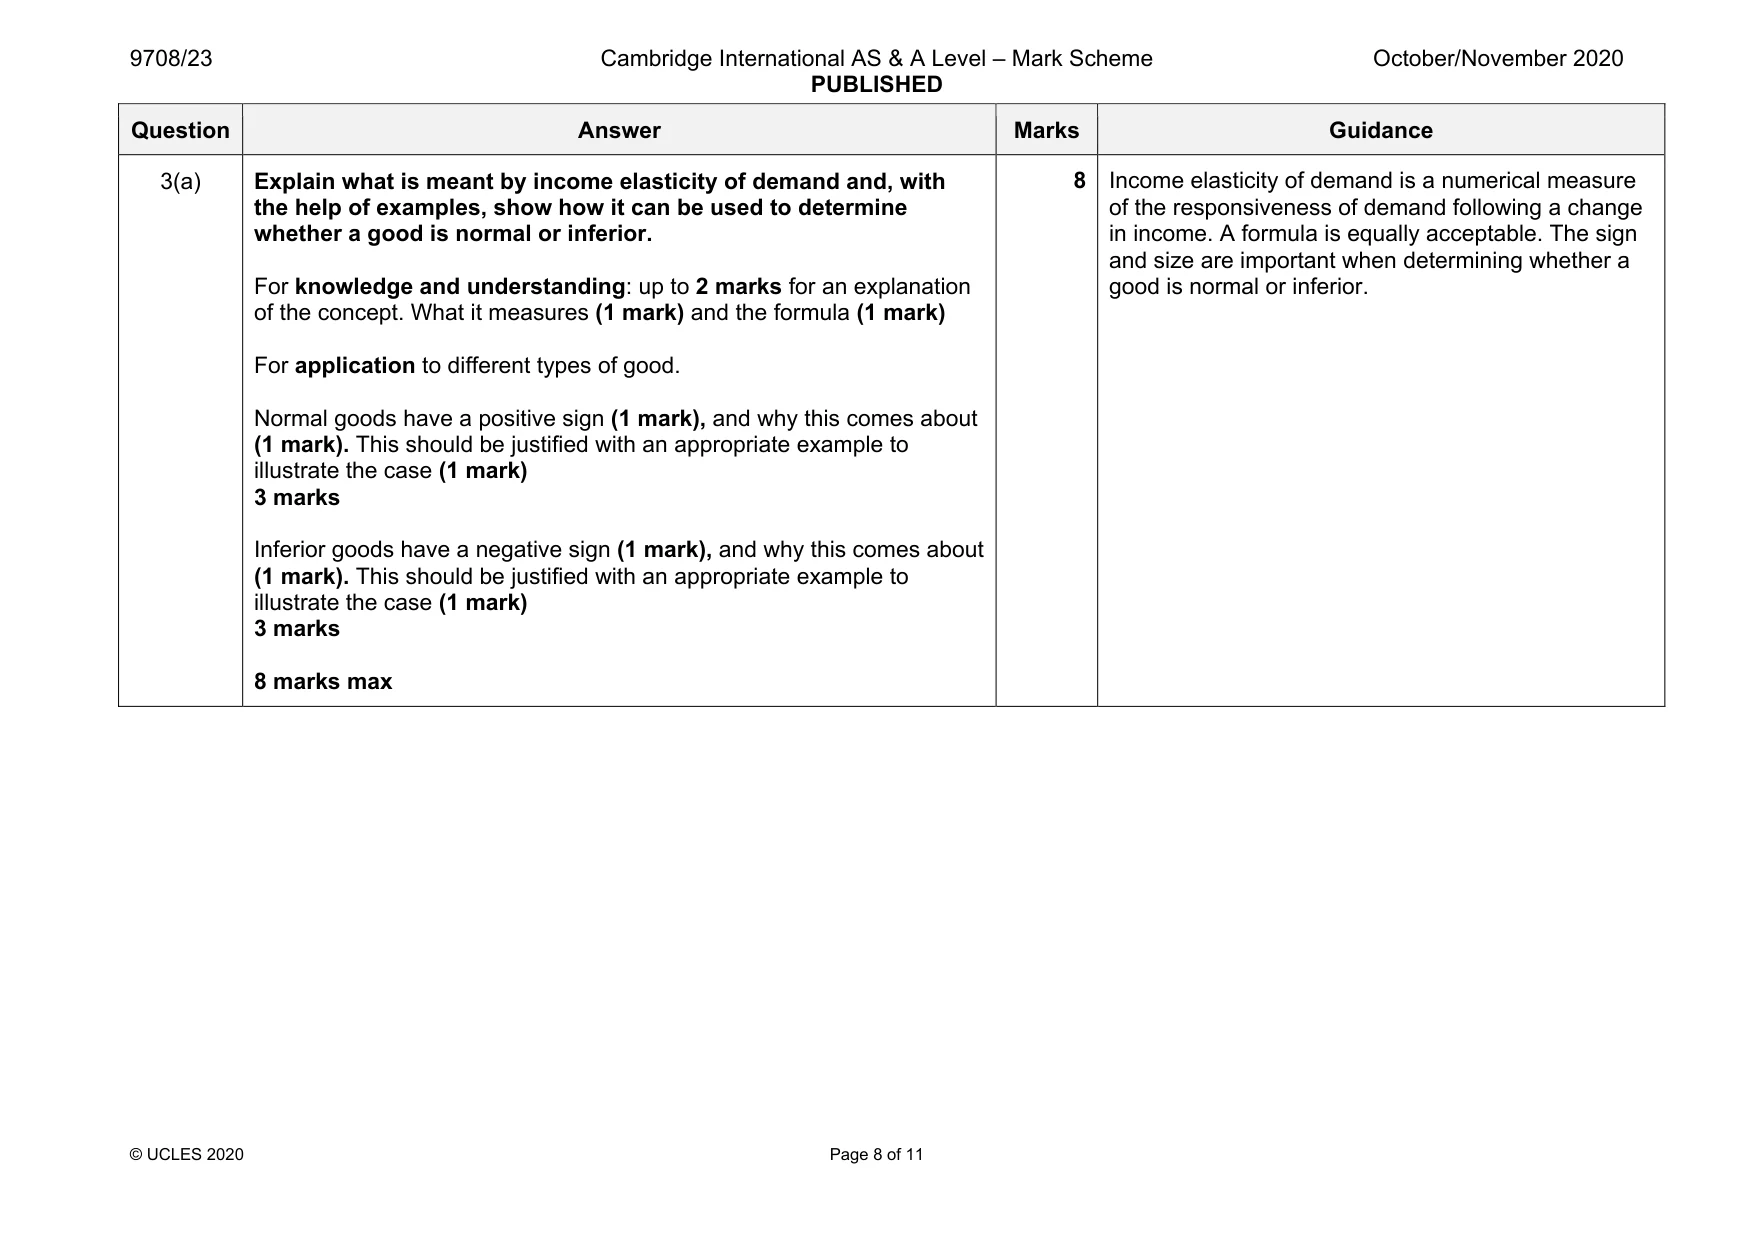
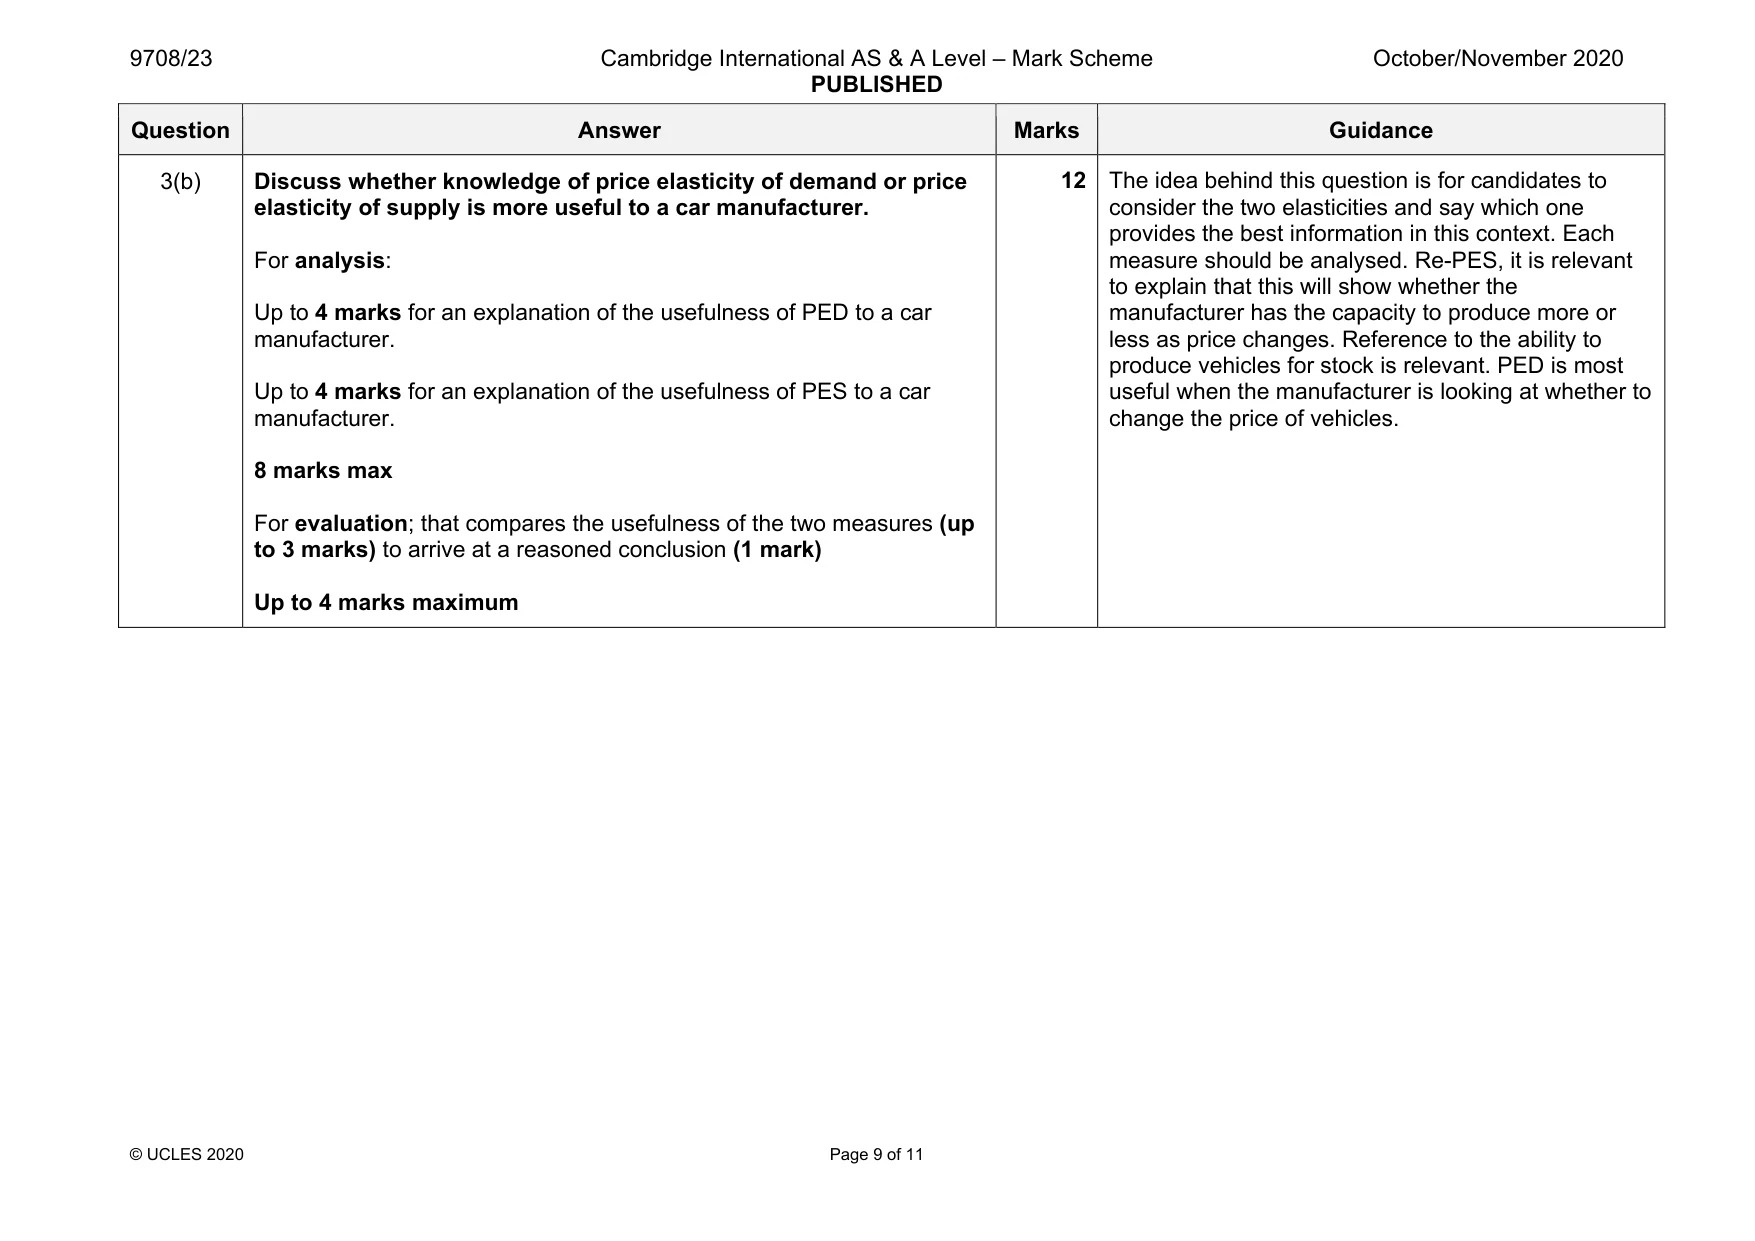
Mark scheme: 3(a) Explain what is meant by income elasticity of demand and, with the help of examples, show how it can be used to determine whether a good is normal or inferior. For knowledge and understanding: up to 2 marks for an explanation of the concept. What it measures (1 mark) and the formula (1 mark) For application to different types of good. Normal goods have a positive sign (1 mark), and why this comes about (1 mark). This should be justified with an appropriate example to illustrate the case (1 mark) 3 marks Inferior goods have a negative sign (1 mark), and why this comes about (1 mark). This should be justified with an appropriate example to illustrate the case (1 mark) 3 marks 8 marks max of the responsiveness of demand following a change in income. A formula is equally acceptable. The sign and size are important when determining whether a good is normal or inferior. Question Answer Marks Guidance 3(b) Discuss whether knowledge of price elasticity of demand or price elasticity of supply is more useful to a car manufacturer. For analysis: Up to 4 marks for an explanation of the usefulness of PED to a car manufacturer. Up to 4 marks for an explanation of the usefulness of PES to a car manufacturer. 8 marks max For evaluation; that compares the usefulness of the two measures (up to 3 marks) to arrive at a reasoned conclusion (1 mark) Up to 4 marks maximum 12 The idea behind this question is for candidates to consider the two elasticities and say which one provides the best information in this context. Each measure should be analysed. Re-PES, it is relevant to explain that this will show whether the manufacturer has the capacity to produce more or less as price changes. Reference to the ability to produce vehicles for stock is relevant. PED is most useful when the manufacturer is looking at whether to change the price of vehicles.
More questions on Price elasticity, income elasticity and cross elasticity of demand
Q4 · A government embarks on a supply-side policy involving substantial additional funding for…
4 A government embarks on a supply-side policy involving substantial additional funding for new road schemes and for new training schemes designed to raise labour productivity. (a) Use an AD/AS diagram to explain the effects of this funding on the level of output in the economy. [8] (b) Discuss the extent to which a supply-side policy involving new road schemes and new training schemes will increase the rate of inflation in the economy. [12]
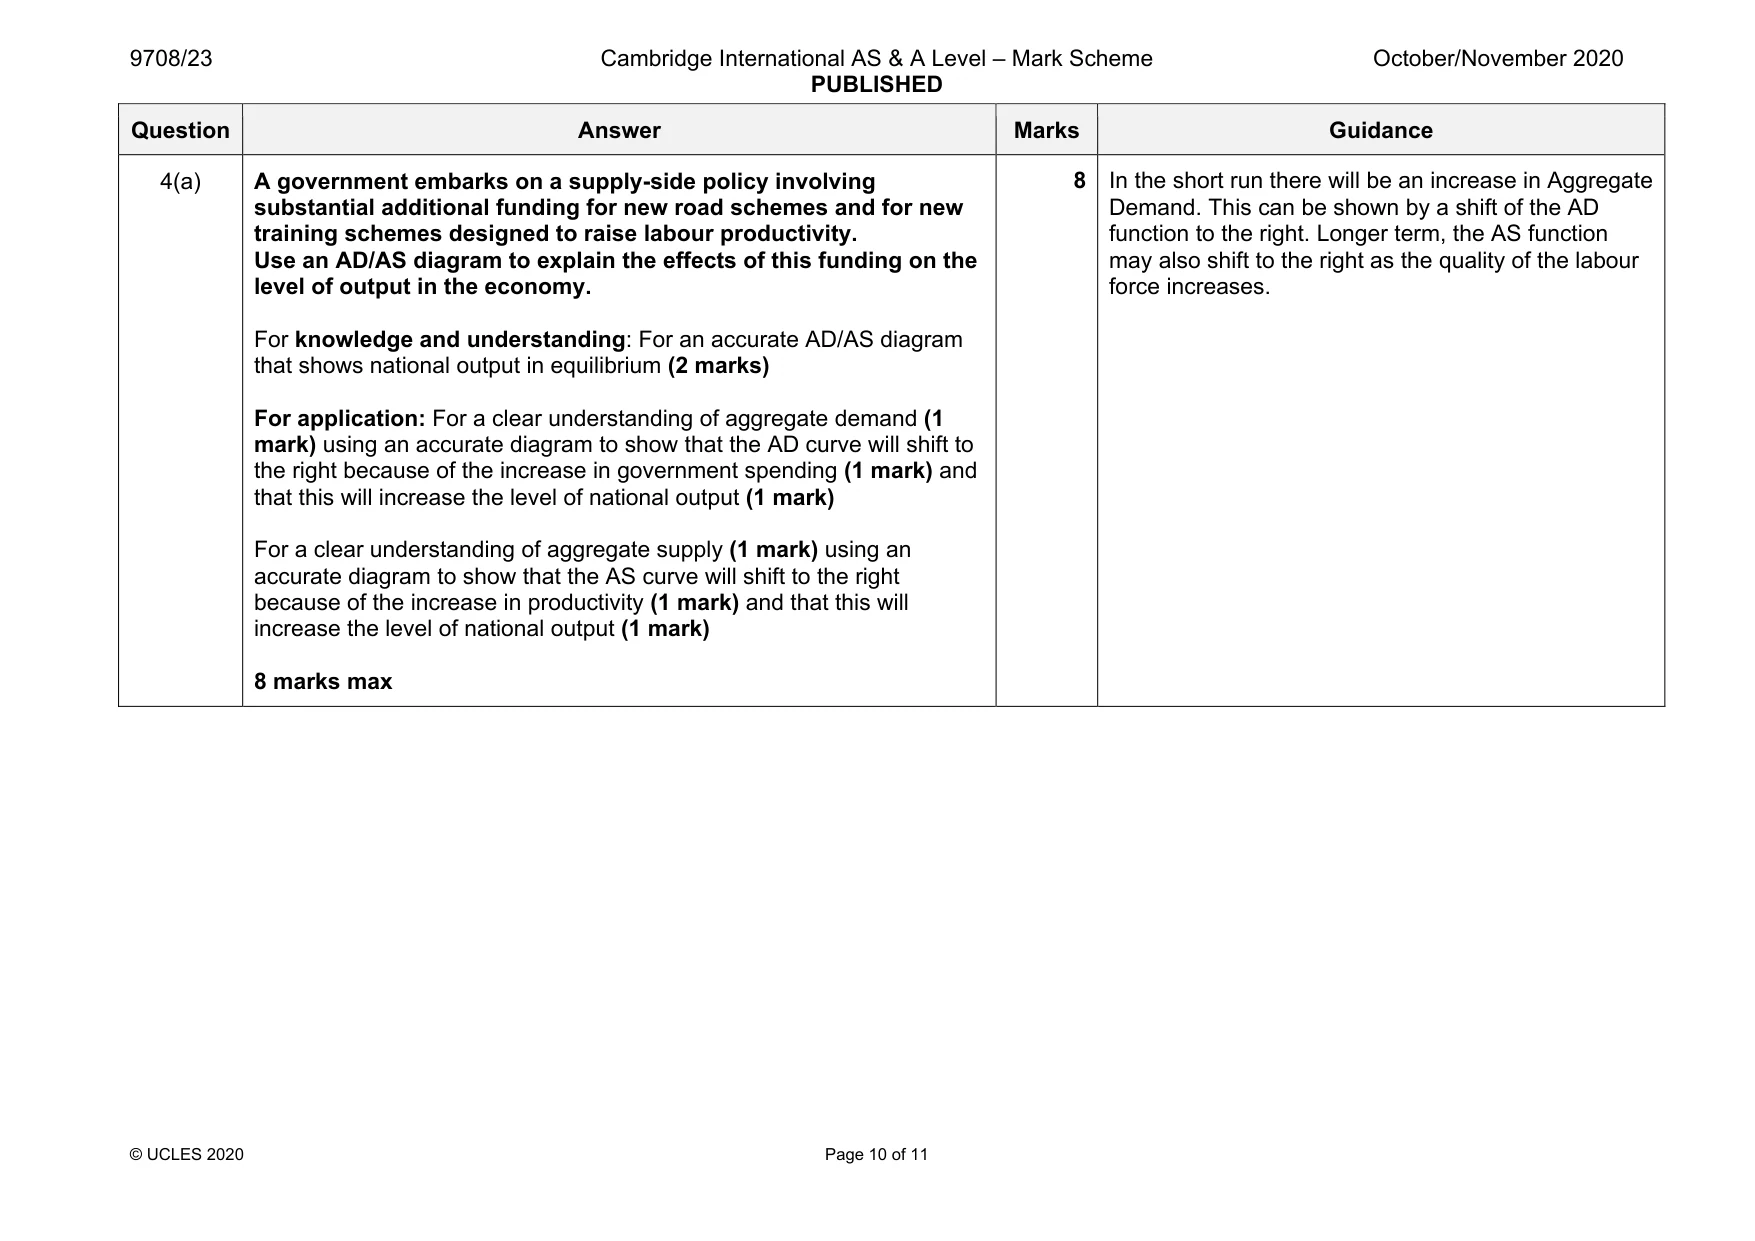
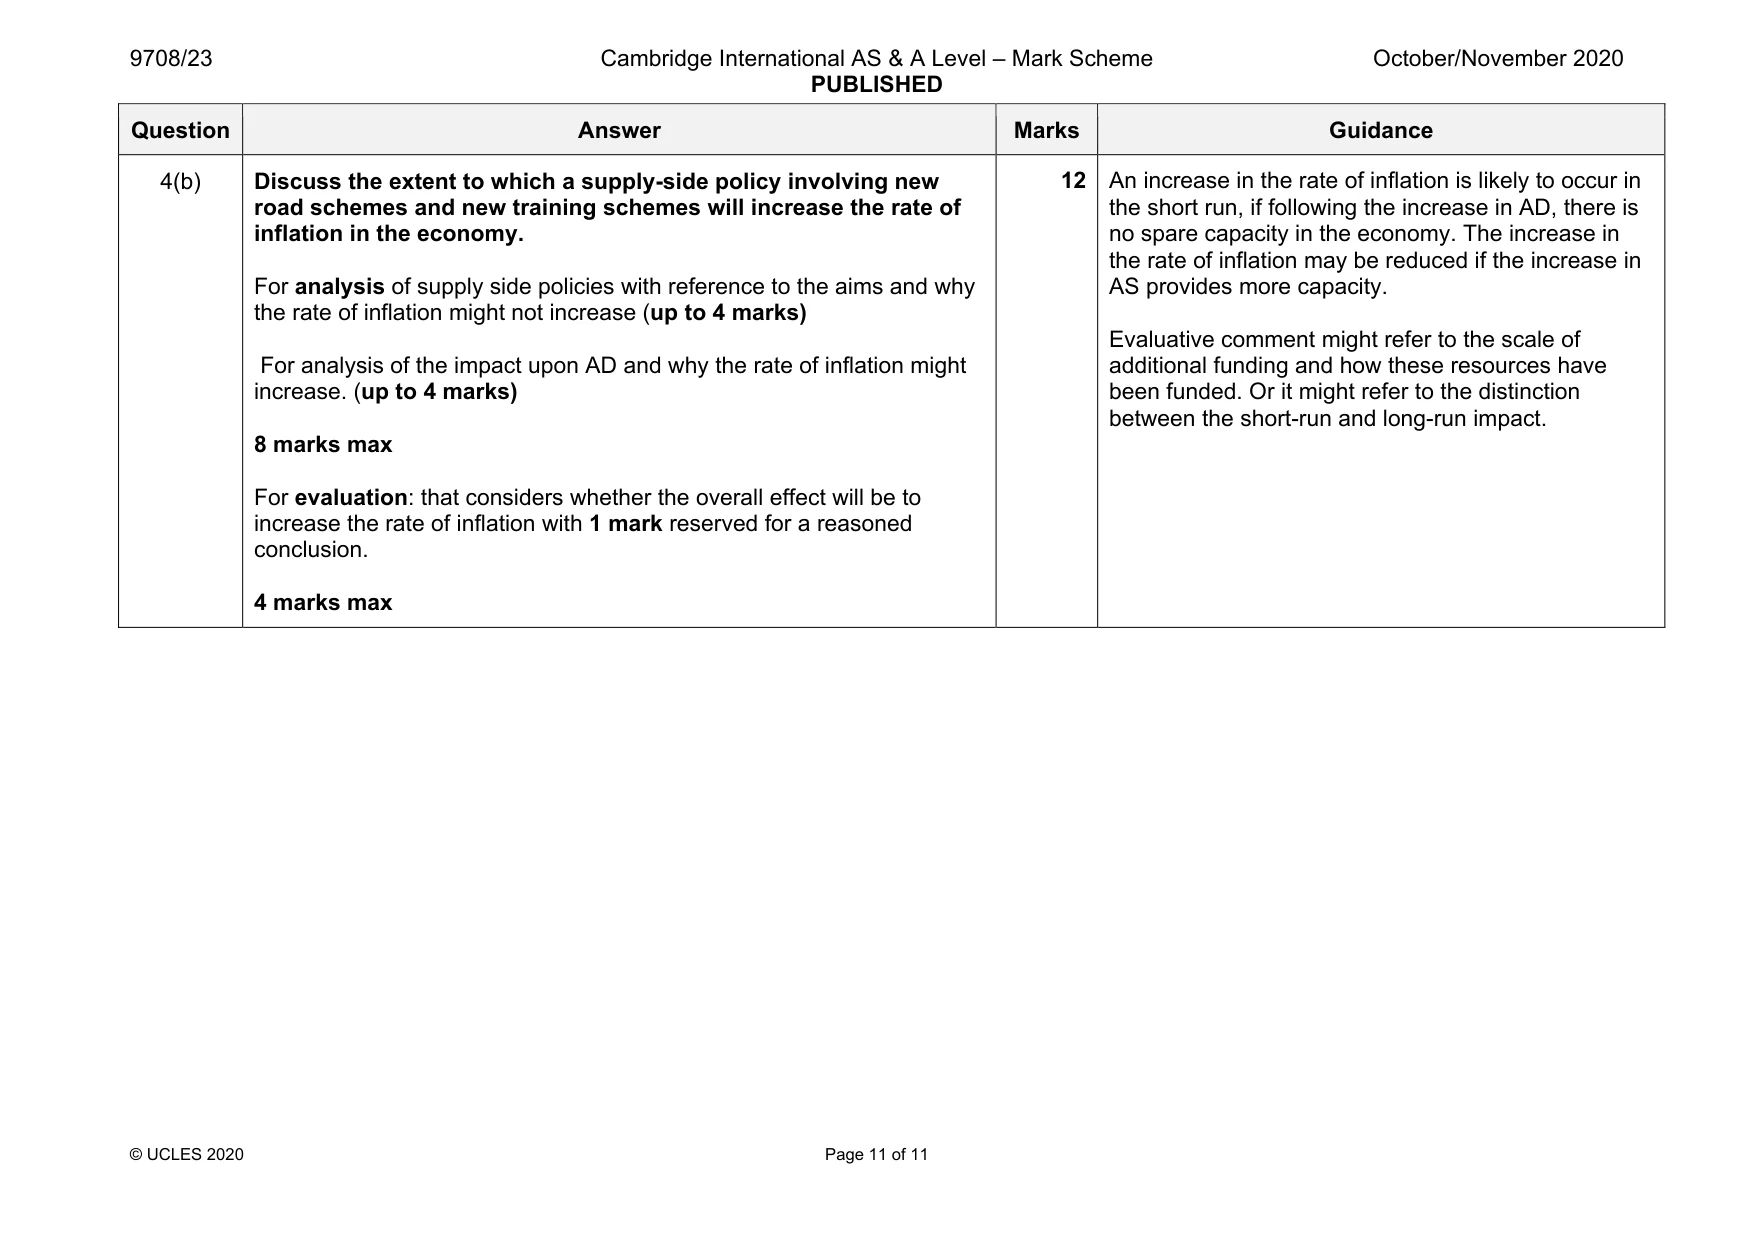
Mark scheme: 4(a) A government embarks on a supply-side policy involving substantial additional funding for new road schemes and for new training schemes designed to raise labour productivity. Use an AD/AS diagram to explain the effects of this funding on the level of output in the economy. For knowledge and understanding: For an accurate AD/AS diagram that shows national output in equilibrium (2 marks) For application: For a clear understanding of aggregate demand (1 mark) using an accurate diagram to show that the AD curve will shift to the right because of the increase in government spending (1 mark) and that this will increase the level of national output (1 mark) For a clear understanding of aggregate supply (1 mark) using an accurate diagram to show that the AS curve will shift to the right because of the increase in productivity (1 mark) and that this will increase the level of national output (1 mark) 8 marks max Demand. This can be shown by a shift of the AD function to the right. Longer term, the AS function may also shift to the right as the quality of the labour force increases. Question Answer Marks Guidance 4(b) Discuss the extent to which a supply-side policy involving new road schemes and new training schemes will increase the rate of inflation in the economy. For analysis of supply side policies with reference to the aims and why the rate of inflation might not increase (up to 4 marks) For analysis of the impact upon AD and why the rate of inflation might increase. (up to 4 marks) 8 marks max For evaluation: that considers whether the overall effect will be to increase the rate of inflation with 1 mark reserved for a reasoned conclusion. 4 marks max 12 An increase in the rate of inflation is likely to occur in the short run, if following the increase in AD, there is no spare capacity in the economy. The increase in the rate of inflation may be reduced if the increase in AS provides more capacity. Evaluative comment might refer to the scale of additional funding and how these resources have been funded. Or it might refer to the distinction between the short-run and long-run impact.
What was in this paper
The subtopics covered by these 4 questions, and how many questions each got. Open one in a new tab to see every Cambridge question on it.
What you needed in this session
Cambridge’s own grade thresholds for 2020 Oct/Nov, Paper 2 · Variant 3. A higher threshold means an easier paper — the bar moves with how the cohort did.