Cambridge A Level Economics 9708 — 2019 Oct/Nov Paper 4 · Variant 2
9708/42/O/N/19 · 7 questions · 70 marks · ≈79 min
The question paper and its mark scheme, free to read here and free to download. This is Cambridge’s own paper, exactly as it was sat.
Question paper4 pages


Mark scheme13 pages
Answers below. Sit the paper first if you are practising.








Questions as text
Q1 · The Economic Outlook for Japan In 2017, the forecast of the Bank of Japan (the country’s…
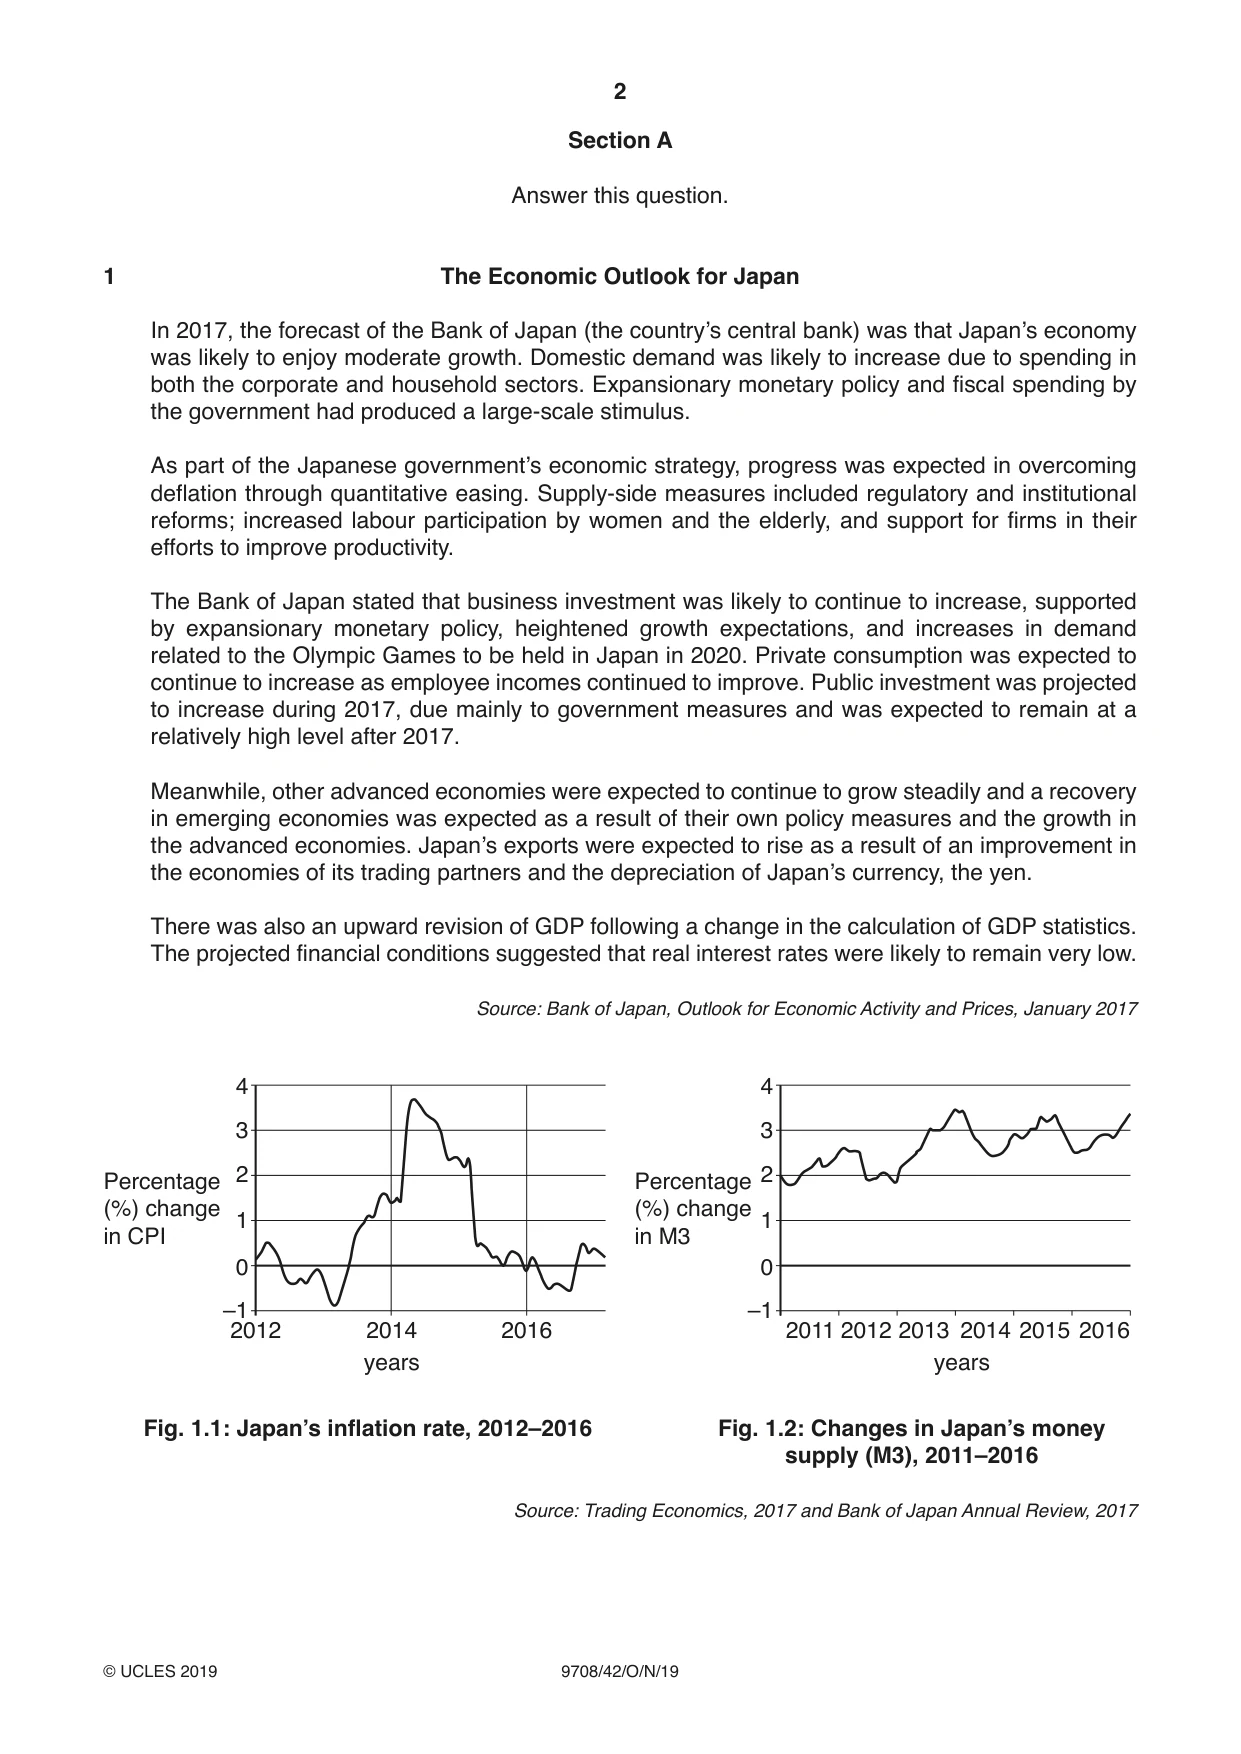
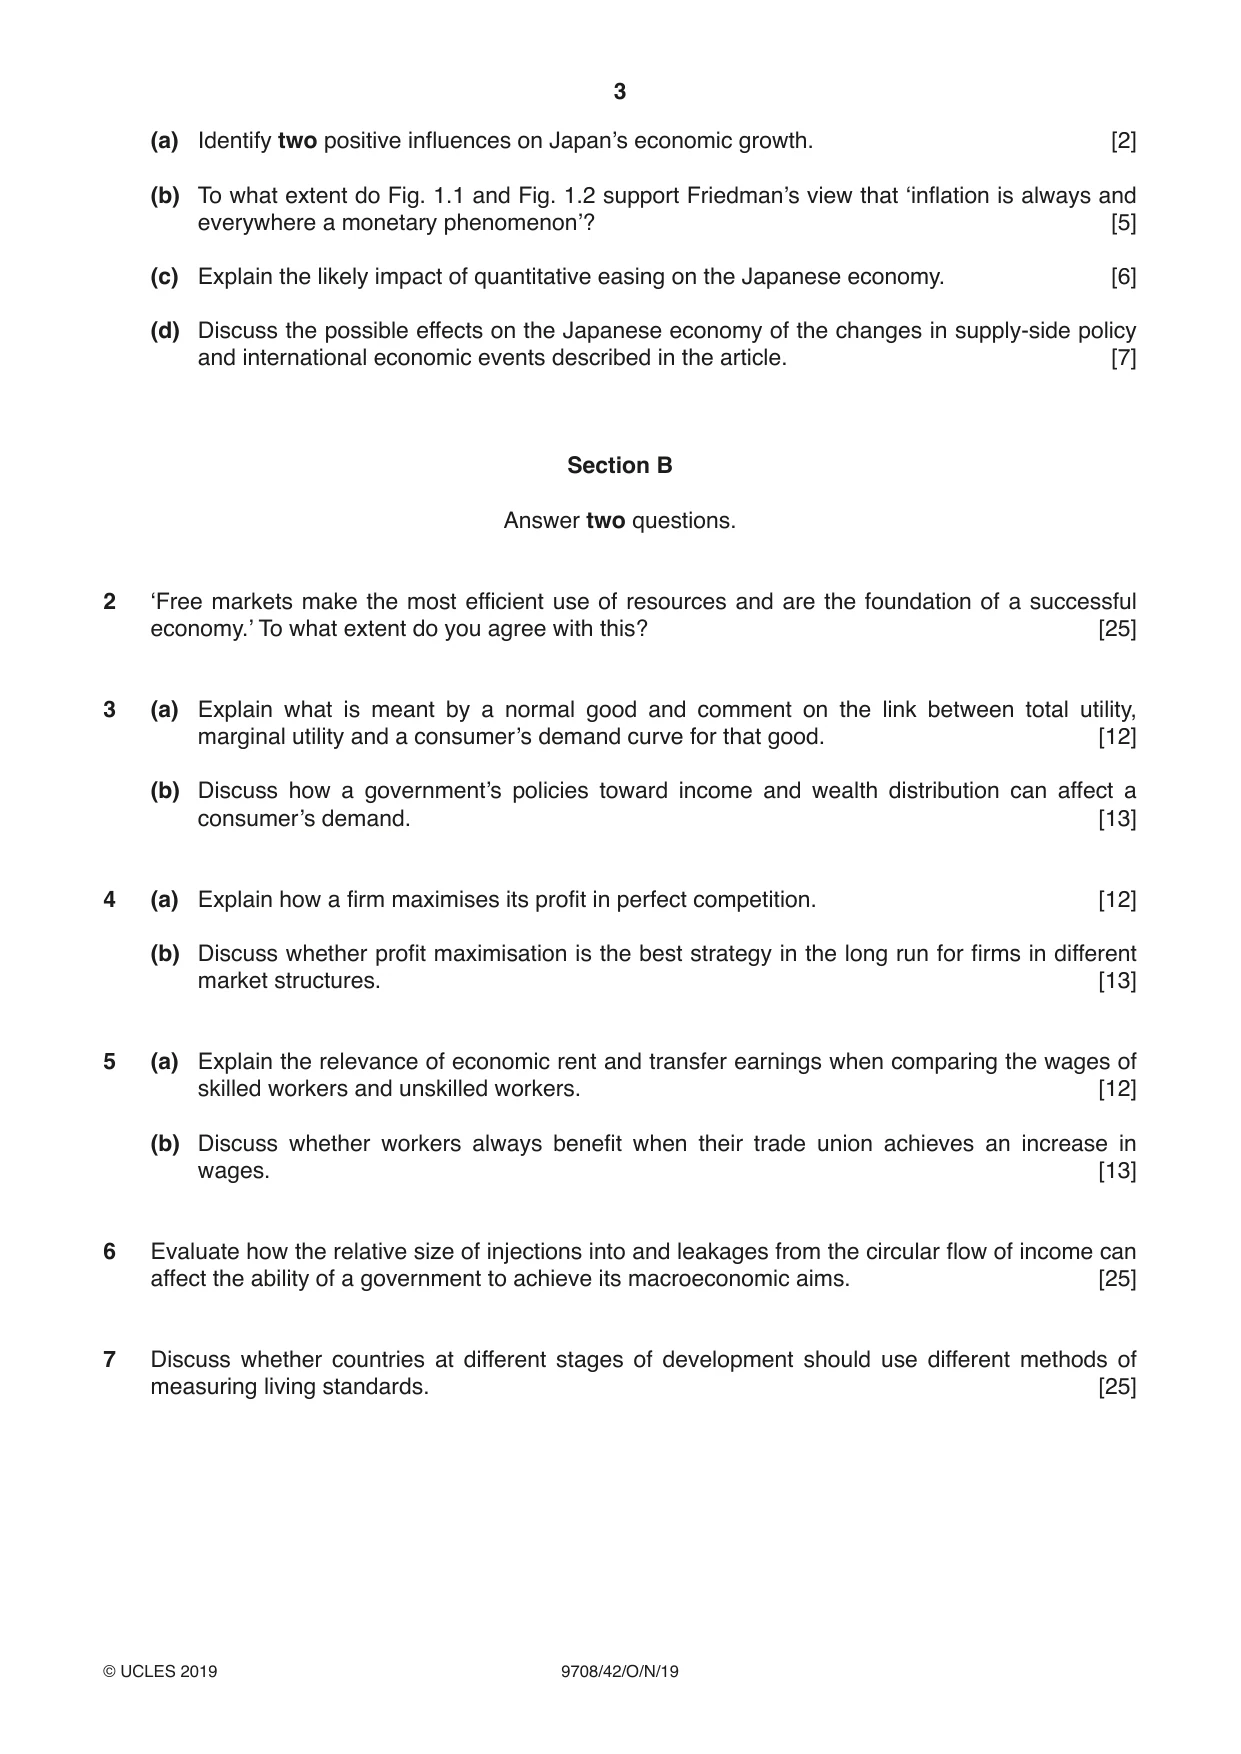
1 The Economic Outlook for Japan In 2017, the forecast of the Bank of Japan (the country’s central bank) was that Japan’s economy was likely to enjoy moderate growth. Domestic demand was likely to increase due to spending in both the corporate and household sectors. Expansionary monetary policy and fiscal spending by the government had produced a large-scale stimulus. As part of the Japanese government’s economic strategy, progress was expected in overcoming deflation through quantitative easing. Supply-side measures included regulatory and institutional reforms; increased labour participation by women and the elderly, and support for firms in their efforts to improve productivity. The Bank of Japan stated that business investment was likely to continue to increase, supported by expansionary monetary policy, heightened growth expectations, and increases in demand related to the Olympic Games to be held in Japan in 2020. Private consumption was expected to continue to increase as employee incomes continued to improve. Public investment was projected to increase during 2017, due mainly to government measures and was expected to remain at a relatively high level after 2017. Meanwhile, other advanced economies were expected to continue to grow steadily and a recovery in emerging economies was expected as a result of their own policy measures and the growth in the advanced economies. Japan’s exports were expected to rise as a result of an improvement in the economies of its trading partners and the depreciation of Japan’s currency, the yen. There was also an upward revision of GDP following a change in the calculation of GDP statistics. The projected financial conditions suggested that real interest rates were likely to remain very low. Source: Bank of Japan, Outlook for Economic Activity and Prices, January 2017 4 4 3 3 Percentage 2 Percentage 2 (%) change (%) change 1 1in CPI in M3 0 0 –1 –1 2012 2014 2016 2011 2012 2013 2014 2015 2016 years years Fig. 1.1: Japan’s inflation rate, 2012–2016 Fig. 1.2: Changes in Japan’s money supply (M3), 2011–2016 Source: Trading Economics, 2017 and Bank of Japan Annual Review, 2017 (a) Identify two positive influences on Japan’s economic growth. [2] (b) To what extent do Fig. 1.1 and Fig. 1.2 support Friedman’s view that ‘inflation is always and everywhere a monetary phenomenon’? [5] (c) Explain the likely impact of quantitative easing on the Japanese economy. [6] (d) Discuss the possible effects on the Japanese economy of the changes in supply-side policy and international economic events described in the article. [7]
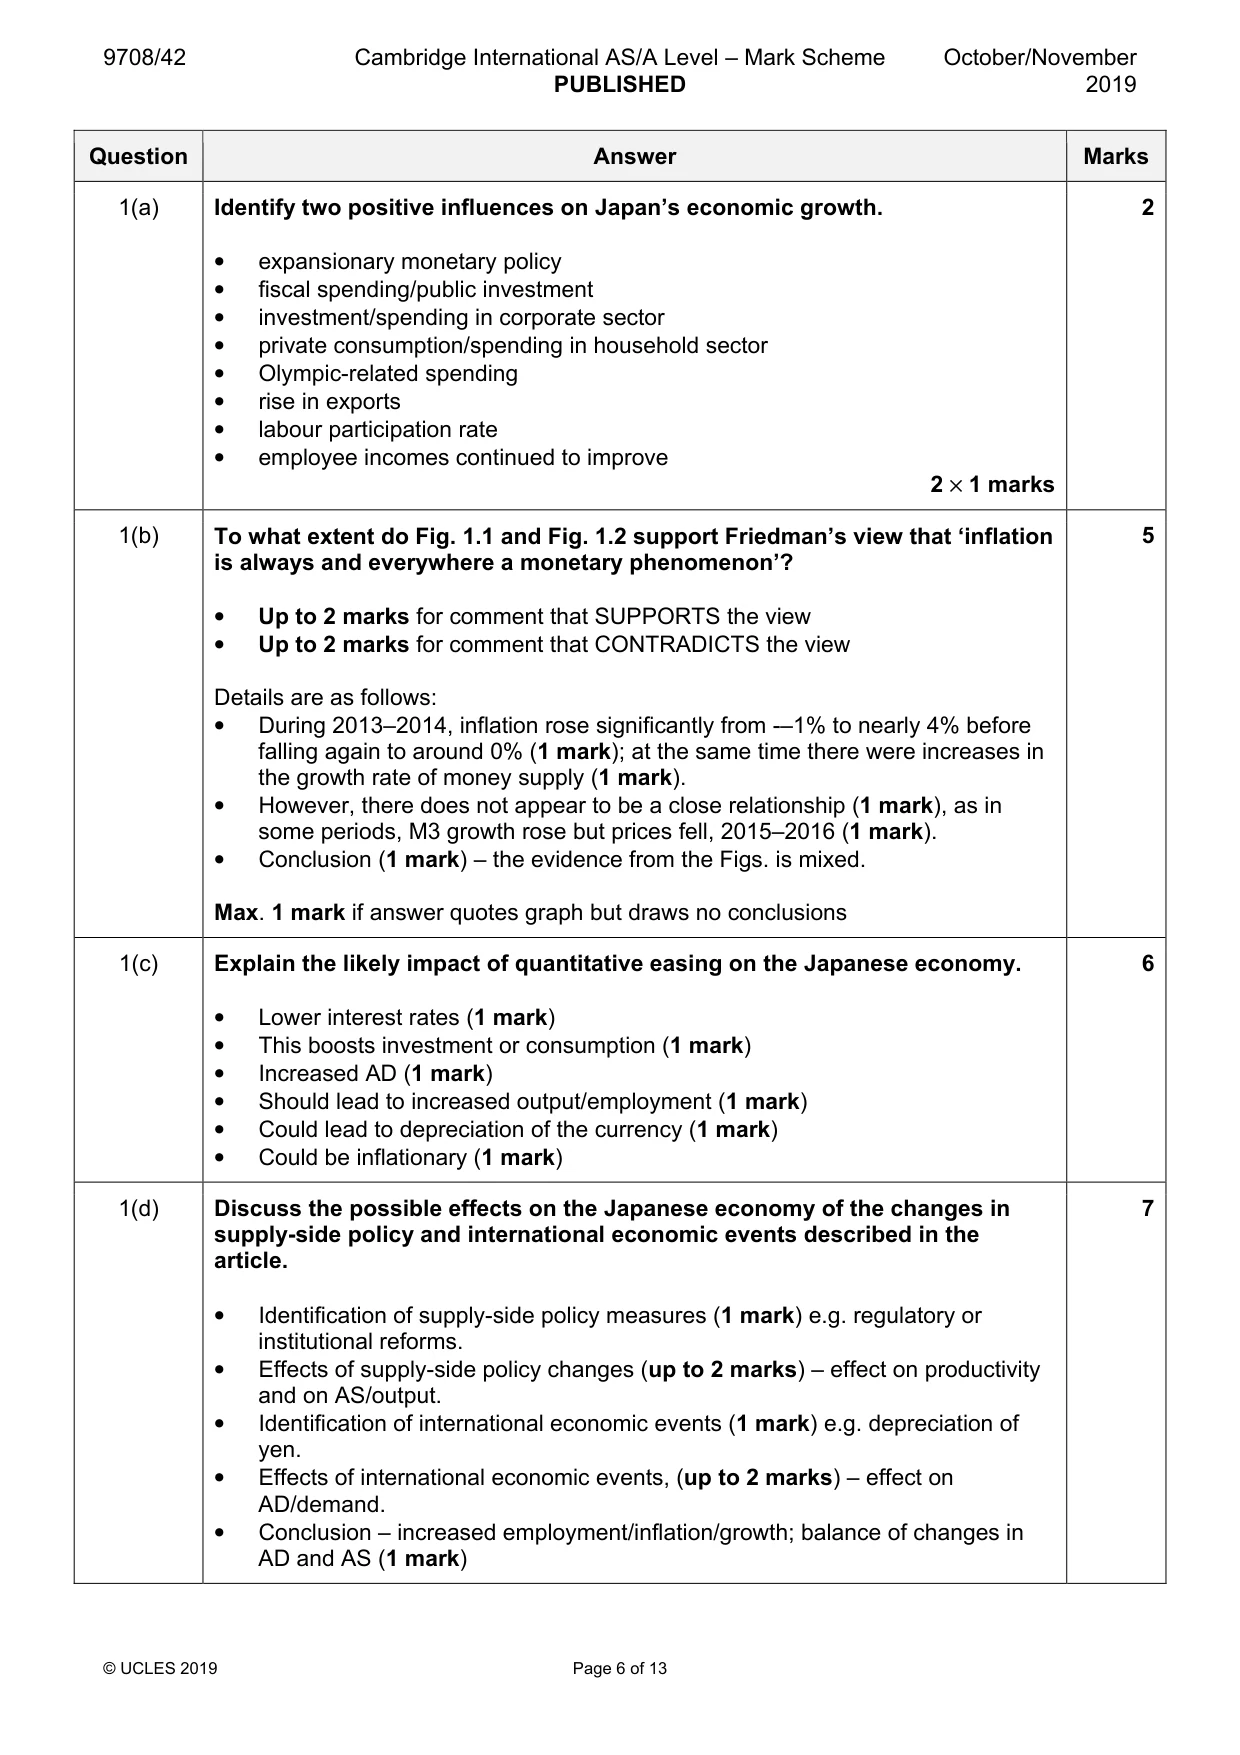
Mark scheme: Question Answer Marks 1(a) Identify two positive influences on Japan’s economic growth. 2 • expansionary monetary policy • fiscal spending/public investment • investment/spending in corporate sector • private consumption/spending in household sector • Olympic-related spending • rise in exports • labour participation rate • employee incomes continued to improve 2 × 1 marks 1(b) To what extent do Fig. 1.1 and Fig. 1.2 support Friedman’s view that ‘inflation 5 is always and everywhere a monetary phenomenon’? • Up to 2 marks for comment that SUPPORTS the view • Up to 2 marks for comment that CONTRADICTS the view Details are as follows: • During 2013–2014, inflation rose significantly from -–1% to nearly 4% before falling again to around 0% (1 mark); at the same time there were increases in the growth rate of money supply (1 mark). • However, there does not appear to be a close relationship (1 mark), as in some periods, M3 growth rose but prices fell, 2015–2016 (1 mark). • Conclusion (1 mark) – the evidence from the Figs. is mixed. Max. 1 mark if answer quotes graph but draws no conclusions 1(c) Explain the likely impact of quantitative easing on the Japanese economy. 6 • Lower interest rates (1 mark) • This boosts investment or consumption (1 mark) • Increased AD (1 mark) • Should lead to increased output/employment (1 mark) • Could lead to depreciation of the currency (1 mark) • Could be inflationary (1 mark) 1(d) Discuss the possible effects on the Japanese economy of the changes in 7 supply-side policy and international economic events described in the article. • Identification of supply-side policy measures (1 mark) e.g. regulatory or institutional reforms. • Effects of supply-side policy changes (up to 2 marks) – effect on productivity and on AS/output. • Identification of international economic events (1 mark) e.g. depreciation of yen. • Effects of international economic events, (up to 2 marks) – effect on AD/demand. • Conclusion – increased employment/inflation/growth; balance of changes in AD and AS (1 mark)
Q2 · ‘Free markets make the most efficient use of resources and are the foundation of a…
2 ‘Free markets make the most efficient use of resources and are the foundation of a successful economy.’ To what extent do you agree with this? [25]
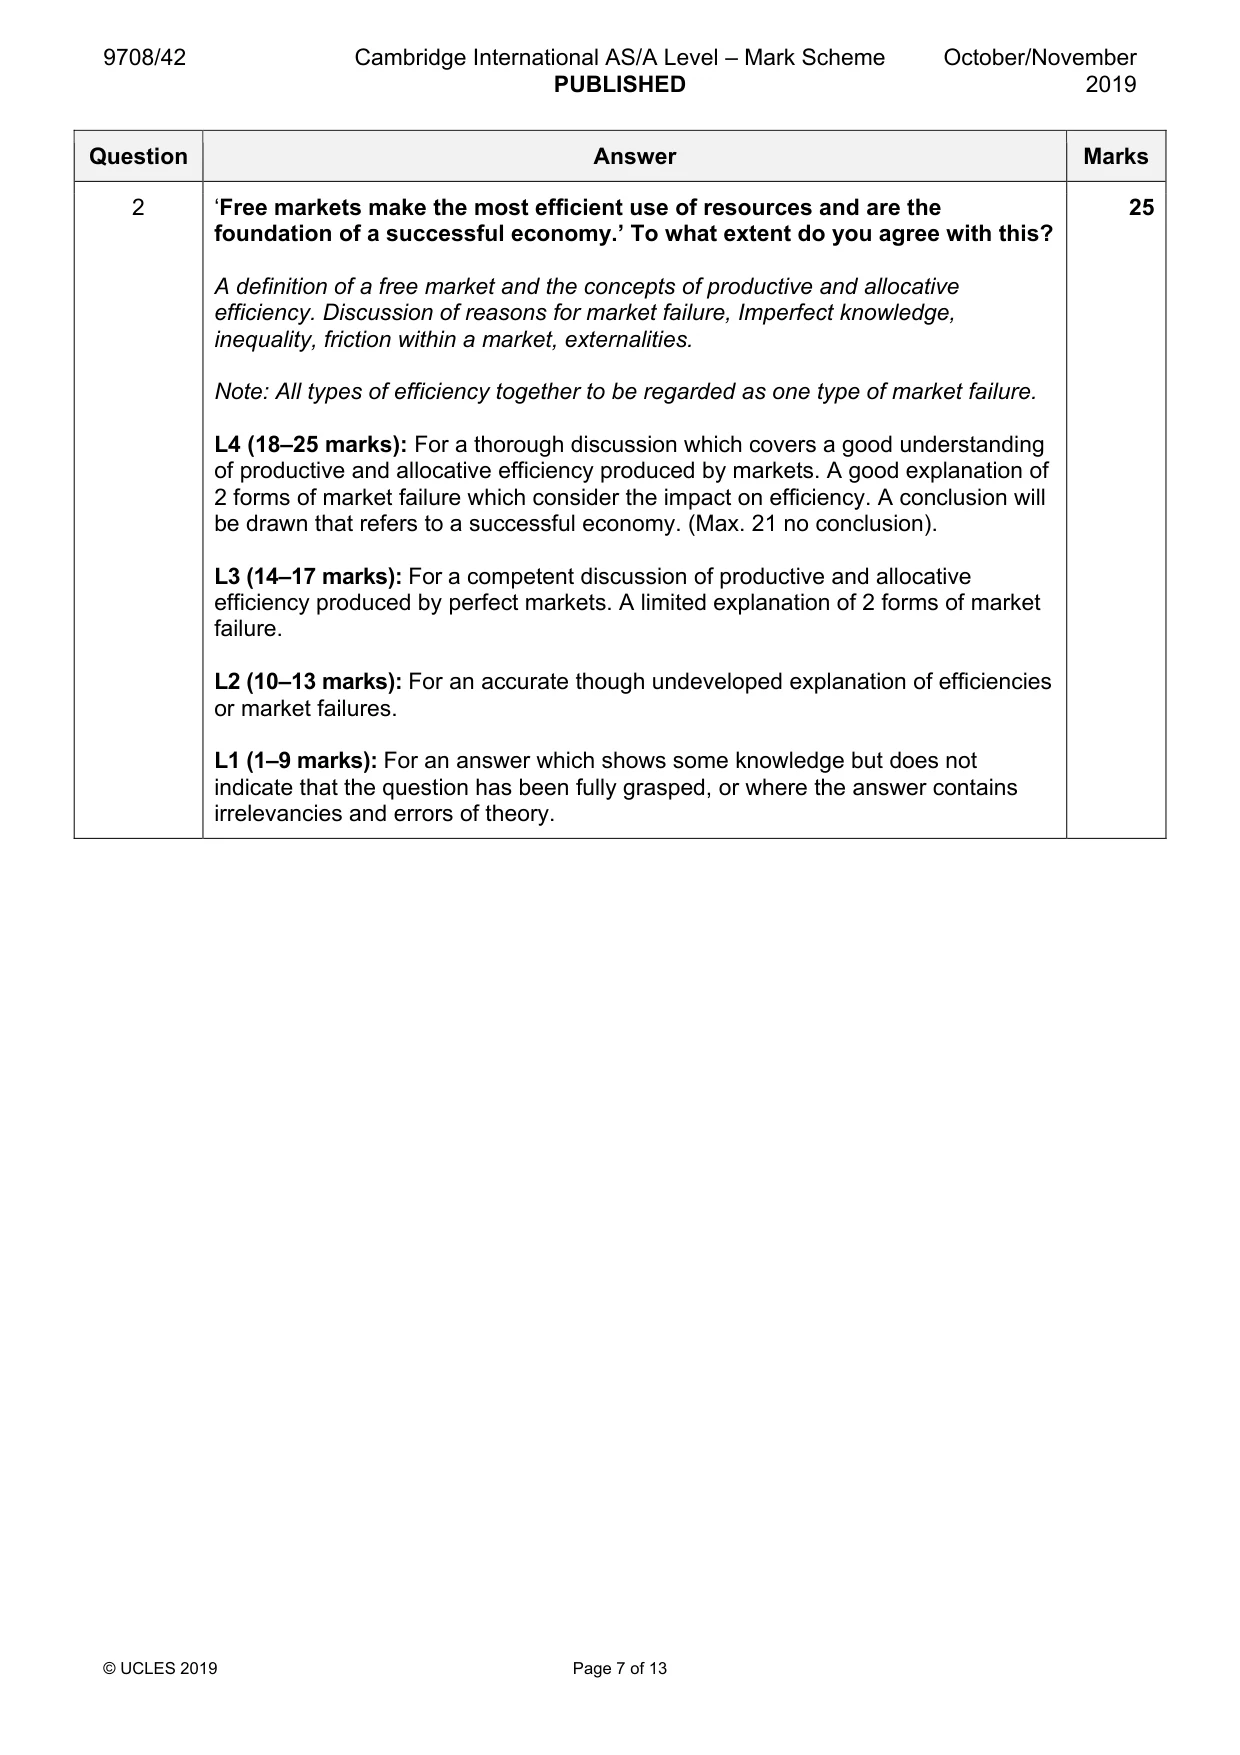
Mark scheme: 2 ‘Free markets make the most efficient use of resources and are the 25 foundation of a successful economy.’ To what extent do you agree with this? A definition of a free market and the concepts of productive and allocative efficiency. Discussion of reasons for market failure, Imperfect knowledge, inequality, friction within a market, externalities. Note: All types of efficiency together to be regarded as one type of market failure. L4 (18–25 marks): For a thorough discussion which covers a good understanding of productive and allocative efficiency produced by markets. A good explanation of 2 forms of market failure which consider the impact on efficiency. A conclusion will be drawn that refers to a successful economy. (Max. 21 no conclusion). L3 (14–17 marks): For a competent discussion of productive and allocative efficiency produced by perfect markets. A limited explanation of 2 forms of market failure. L2 (10–13 marks): For an accurate though undeveloped explanation of efficiencies or market failures. L1 (1–9 marks): For an answer which shows some knowledge but does not indicate that the question has been fully grasped, or where the answer contains irrelevancies and errors of theory.
Q3 · Explain what is meant by a normal good and comment on the link between total utility…
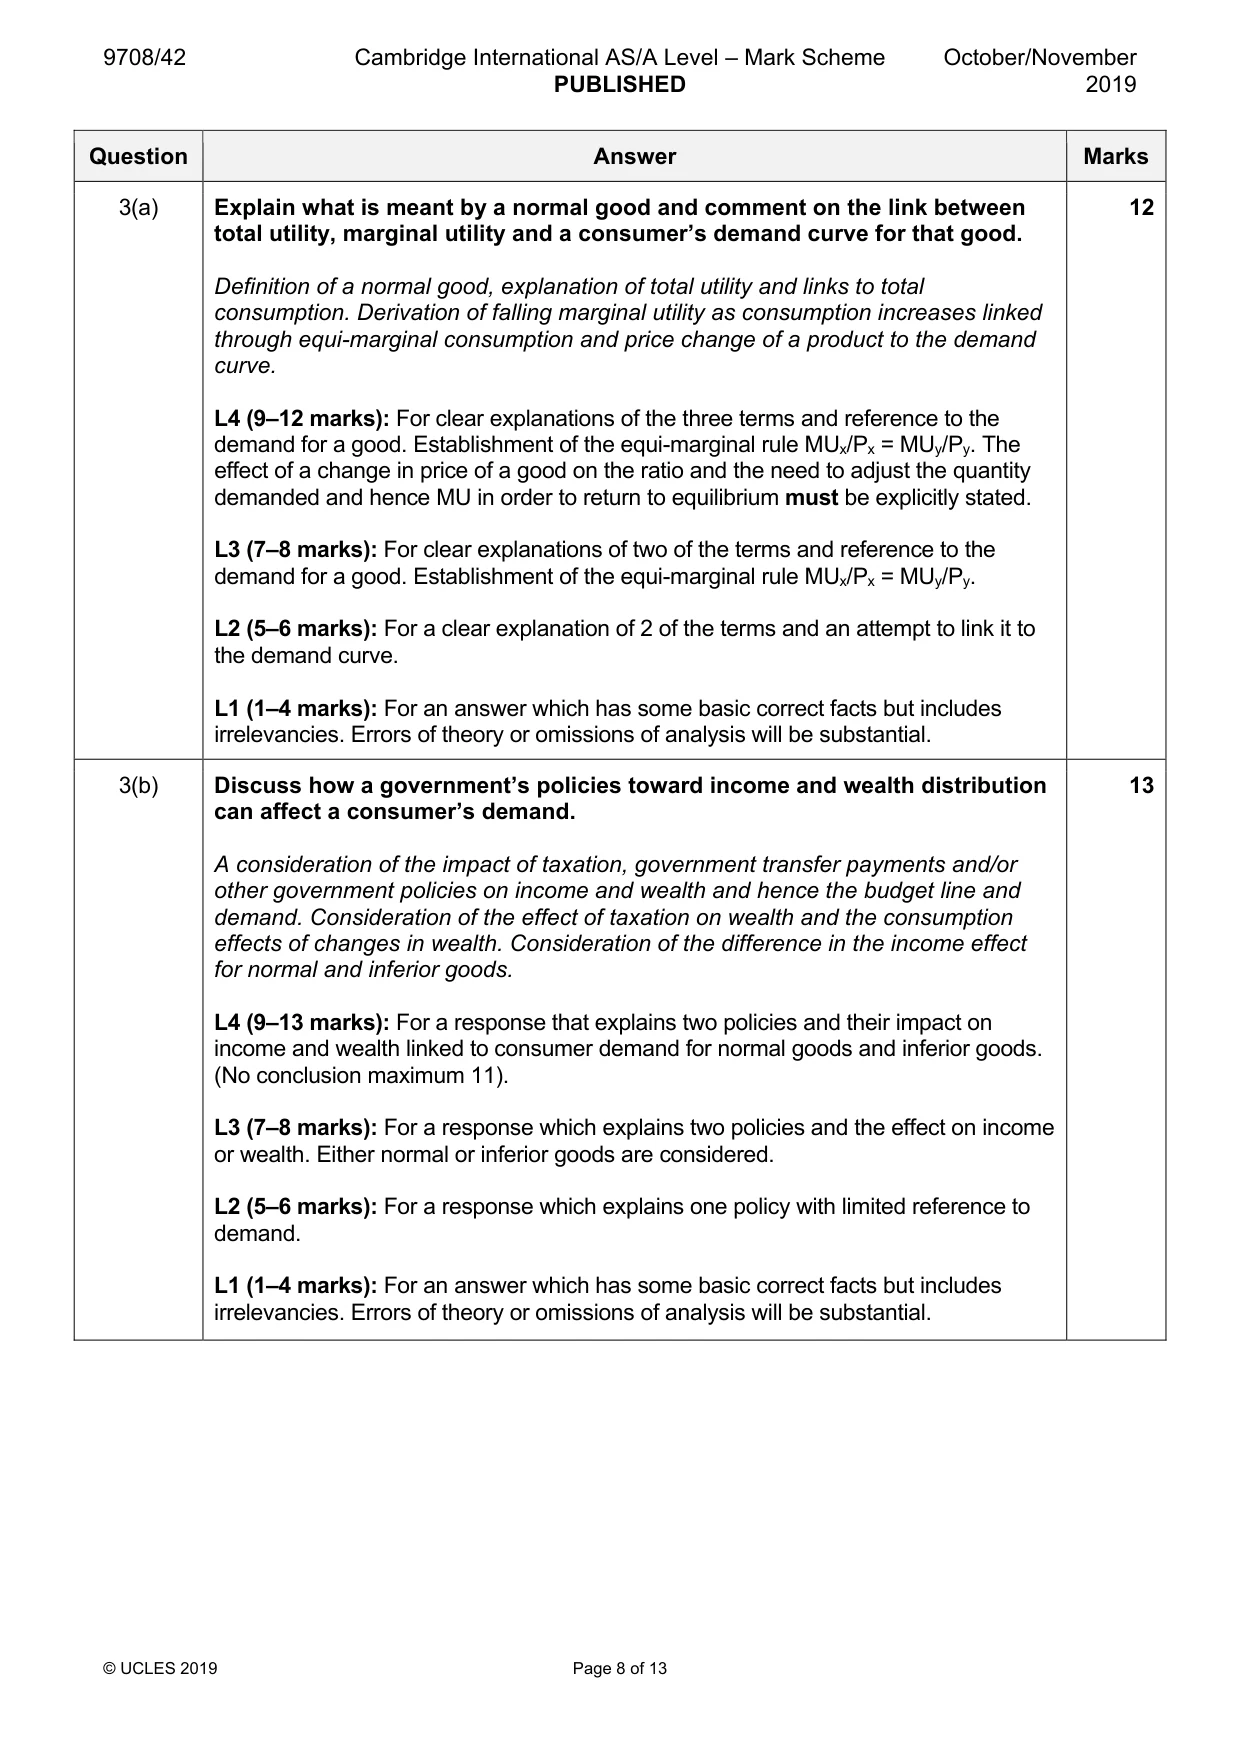
3 (a) Explain what is meant by a normal good and comment on the link between total utility, marginal utility and a consumer’s demand curve for that good. [12] (b) Discuss how a government’s policies toward income and wealth distribution can affect a consumer’s demand. [13]
Mark scheme: 3(a) Explain what is meant by a normal good and comment on the link between 12 total utility, marginal utility and a consumer’s demand curve for that good. Definition of a normal good, explanation of total utility and links to total consumption. Derivation of falling marginal utility as consumption increases linked through equi-marginal consumption and price change of a product to the demand curve. L4 (9–12 marks): For clear explanations of the three terms and reference to the demand for a good. Establishment of the equi-marginal rule MUx/Px = MUy/Py. The effect of a change in price of a good on the ratio and the need to adjust the quantity demanded and hence MU in order to return to equilibrium must be explicitly stated. L3 (7–8 marks): For clear explanations of two of the terms and reference to the demand for a good. Establishment of the equi-marginal rule MUx/Px = MUy/Py. L2 (5–6 marks): For a clear explanation of 2 of the terms and an attempt to link it to the demand curve. L1 (1–4 marks): For an answer which has some basic correct facts but includes irrelevancies. Errors of theory or omissions of analysis will be substantial. 3(b) Discuss how a government’s policies toward income and wealth distribution 13 can affect a consumer’s demand. A consideration of the impact of taxation, government transfer payments and/or other government policies on income and wealth and hence the budget line and demand. Consideration of the effect of taxation on wealth and the consumption effects of changes in wealth. Consideration of the difference in the income effect for normal and inferior goods. L4 (9–13 marks): For a response that explains two policies and their impact on income and wealth linked to consumer demand for normal goods and inferior goods. (No conclusion maximum 11). L3 (7–8 marks): For a response which explains two policies and the effect on income or wealth. Either normal or inferior goods are considered. L2 (5–6 marks): For a response which explains one policy with limited reference to demand. L1 (1–4 marks): For an answer which has some basic correct facts but includes irrelevancies. Errors of theory or omissions of analysis will be substantial.
More questions on Equity and redistribution of income and wealth
Q4 · Explain how a firm maximises its profit in perfect competition
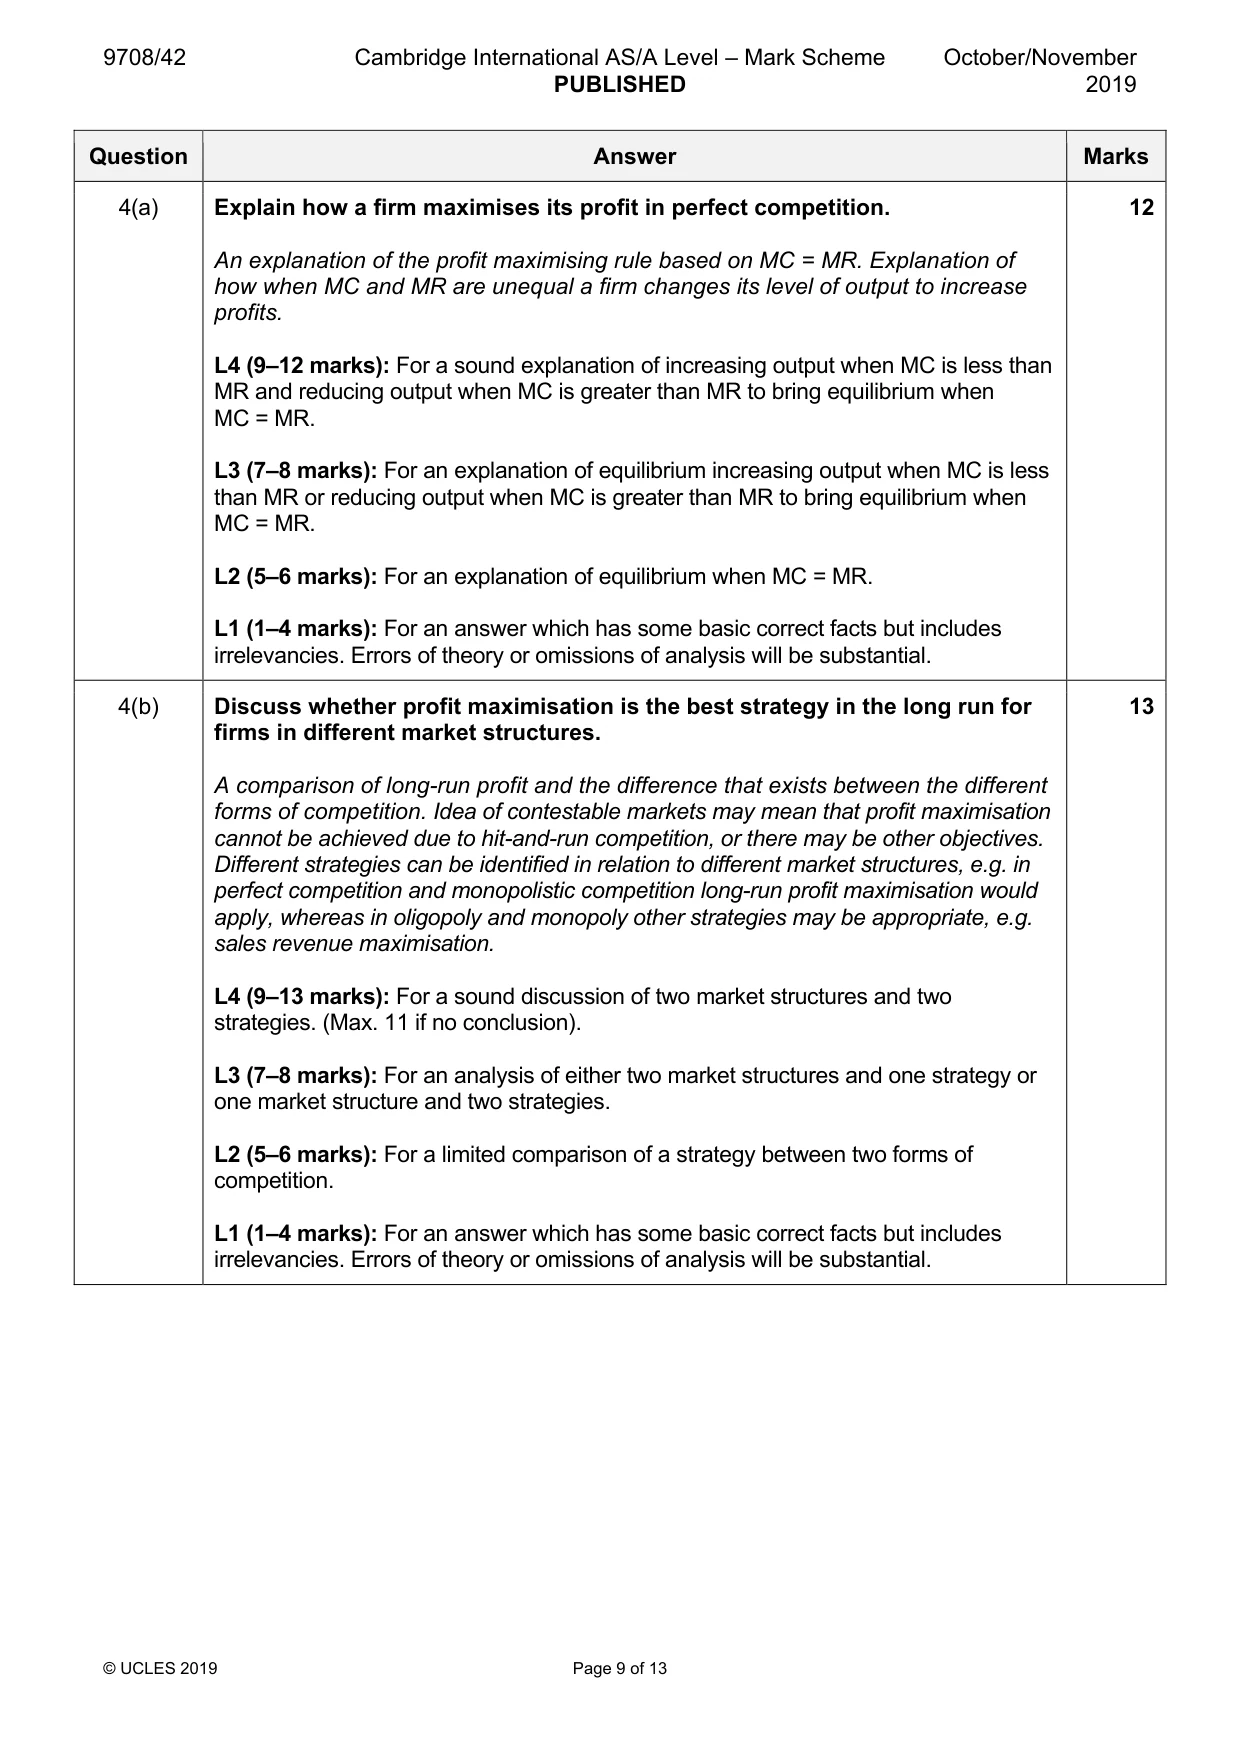
4 (a) Explain how a firm maximises its profit in perfect competition. [12] (b) Discuss whether profit maximisation is the best strategy in the long run for firms in different market structures. [13]
Mark scheme: 4(a) Explain how a firm maximises its profit in perfect competition. 12 An explanation of the profit maximising rule based on MC = MR. Explanation of how when MC and MR are unequal a firm changes its level of output to increase profits. L4 (9–12 marks): For a sound explanation of increasing output when MC is less than MR and reducing output when MC is greater than MR to bring equilibrium when MC = MR. L3 (7–8 marks): For an explanation of equilibrium increasing output when MC is less than MR or reducing output when MC is greater than MR to bring equilibrium when MC = MR. L2 (5–6 marks): For an explanation of equilibrium when MC = MR. L1 (1–4 marks): For an answer which has some basic correct facts but includes irrelevancies. Errors of theory or omissions of analysis will be substantial. 4(b) Discuss whether profit maximisation is the best strategy in the long run for 13 firms in different market structures. A comparison of long-run profit and the difference that exists between the different forms of competition. Idea of contestable markets may mean that profit maximisation cannot be achieved due to hit-and-run competition, or there may be other objectives. Different strategies can be identified in relation to different market structures, e.g. in perfect competition and monopolistic competition long-run profit maximisation would apply, whereas in oligopoly and monopoly other strategies may be appropriate, e.g. sales revenue maximisation. L4 (9–13 marks): For a sound discussion of two market structures and two strategies. (Max. 11 if no conclusion). L3 (7–8 marks): For an analysis of either two market structures and one strategy or one market structure and two strategies. L2 (5–6 marks): For a limited comparison of a strategy between two forms of competition. L1 (1–4 marks): For an answer which has some basic correct facts but includes irrelevancies. Errors of theory or omissions of analysis will be substantial.
More questions on Differing objectives and policies of firms
Q5 · Explain the relevance of economic rent and transfer earnings when comparing the wages of…
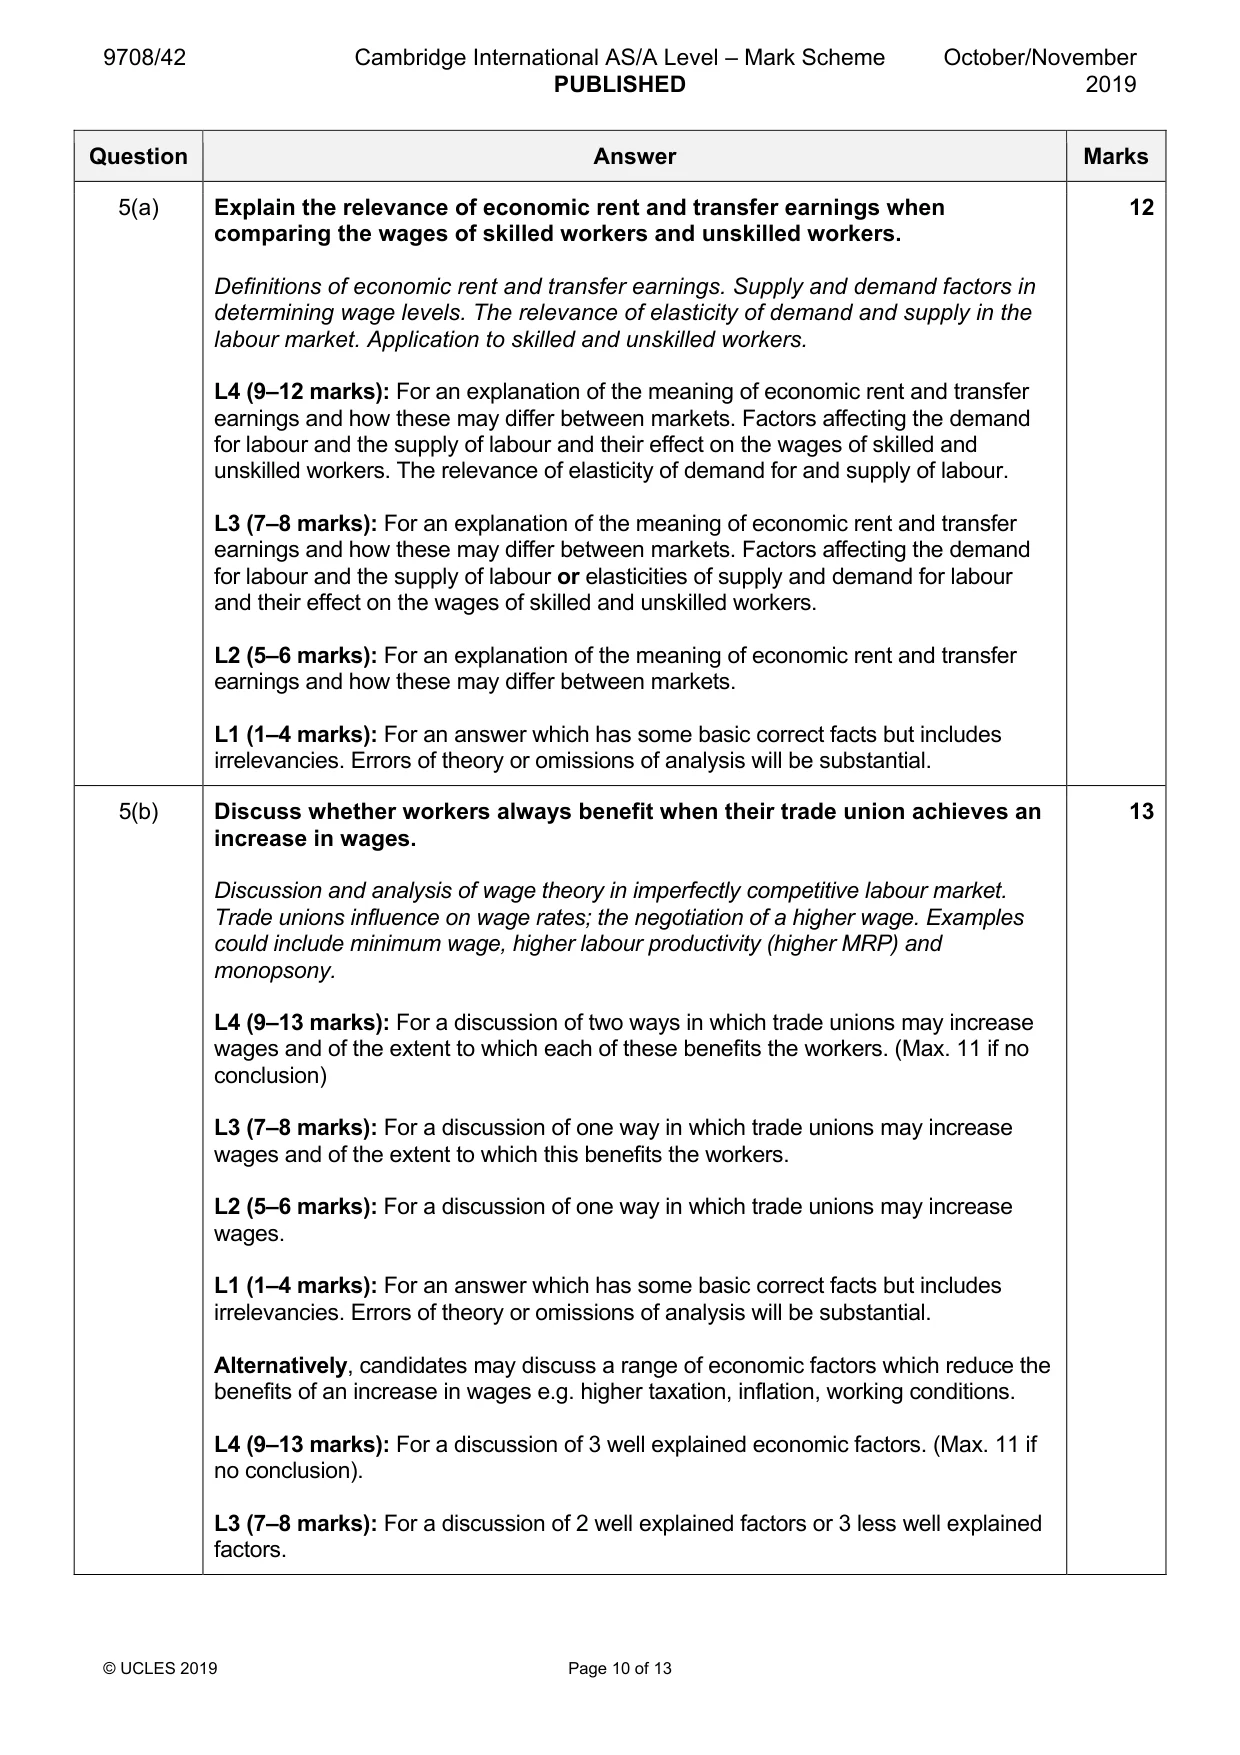
5 (a) Explain the relevance of economic rent and transfer earnings when comparing the wages of skilled workers and unskilled workers. [12] (b) Discuss whether workers always benefit when their trade union achieves an increase in wages. [13]
Mark scheme: 5(a) Explain the relevance of economic rent and transfer earnings when 12 comparing the wages of skilled workers and unskilled workers. Definitions of economic rent and transfer earnings. Supply and demand factors in determining wage levels. The relevance of elasticity of demand and supply in the labour market. Application to skilled and unskilled workers. L4 (9–12 marks): For an explanation of the meaning of economic rent and transfer earnings and how these may differ between markets. Factors affecting the demand for labour and the supply of labour and their effect on the wages of skilled and unskilled workers. The relevance of elasticity of demand for and supply of labour. L3 (7–8 marks): For an explanation of the meaning of economic rent and transfer earnings and how these may differ between markets. Factors affecting the demand for labour and the supply of labour or elasticities of supply and demand for labour and their effect on the wages of skilled and unskilled workers. L2 (5–6 marks): For an explanation of the meaning of economic rent and transfer earnings and how these may differ between markets. L1 (1–4 marks): For an answer which has some basic correct facts but includes irrelevancies. Errors of theory or omissions of analysis will be substantial. 5(b) Discuss whether workers always benefit when their trade union achieves an 13 increase in wages. Discussion and analysis of wage theory in imperfectly competitive labour market. Trade unions influence on wage rates; the negotiation of a higher wage. Examples could include minimum wage, higher labour productivity (higher MRP) and monopsony. L4 (9–13 marks): For a discussion of two ways in which trade unions may increase wages and of the extent to which each of these benefits the workers. (Max. 11 if no conclusion) L3 (7–8 marks): For a discussion of one way in which trade unions may increase wages and of the extent to which this benefits the workers. L2 (5–6 marks): For a discussion of one way in which trade unions may increase wages. L1 (1–4 marks): For an answer which has some basic correct facts but includes irrelevancies. Errors of theory or omissions of analysis will be substantial. Alternatively, candidates may discuss a range of economic factors which reduce the benefits of an increase in wages e.g. higher taxation, inflation, working conditions. L4 (9–13 marks): For a discussion of 3 well explained economic factors. (Max. 11 if no conclusion). L3 (7–8 marks): For a discussion of 2 well explained factors or 3 less well explained factors. 5(b) L2 (5–6 marks): For a discussion of 1 well explained factor or 2 less well explained factors. L1 (1–4 marks): For an answer which has some basic correct facts but includes irrelevancies. Errors of theory or omissions of analysis will be substantial.
More questions on Labour market forces and government intervention
Q6 · Evaluate how the relative size of injections into and leakages from the circular flow of…
6 Evaluate how the relative size of injections into and leakages from the circular flow of income can affect the ability of a government to achieve its macroeconomic aims. [25]
Mark scheme: 6 Evaluate how the relative size of injections into and leakages from the 25 circular flow of income can affect the ability of a government to achieve its macroeconomic aims. Identification of types of injections (J): investment, government spending and exports and withdrawals (W): saving, taxation and imports. Identification of macroeconomic aims. The impact of W and J on output, income and employment in relation to the circular flow of income. Explanation of potential conflicts between aims: inflation/balance of payments/growth/unemployment and effect on them if W>J or W<J. L4 (18–25 marks): For clear definitions of injections and withdrawals and their size and impact on the circular flow of income, the government’s macroeconomic objectives and possible compatibility/conflicts of aims. An evaluation of an imbalance in W/J on 3 macroeconomic objectives. (Max. of 21 if no conclusion). L3 (14 –17 marks): For clear definitions of injections and withdrawals and the government’s macroeconomic objectives, impact on the circular flow of income, reference to compatibility/conflict of aims, explanation of an imbalance in W/J on 2 macroeconomic objectives. L2 (10–13 marks): For a limited description of W/J and 1 macroeconomic objective. L1 (1–9 marks): For an answer which has some basic correct facts but includes irrelevancies. Errors of theory or omissions of analysis will be substantial.
More questions on Introduction to the circular flow of income
Q7 · Discuss whether countries at different stages of development should use different methods…
7 Discuss whether countries at different stages of development should use different methods of measuring living standards. [25]
Mark scheme: 7 Discuss whether countries at different stages of development should use 25 different methods of measuring living standards. Conventional measures of economic well-being e.g. real GDP per head. The advantages and disadvantages of this measure when applied to different economies. The use of alternative measures when applied to different economies e.g. Multidimensional Poverty Index (MPI), (Human Development Index) HDI and MEW. L4 (18–25 marks): For a discussion of the advantages and disadvantages of two methods of measuring living standards in developed and developing economies. A conclusion will be drawn. (Max. 21 if no conclusion). L3 (14–17 marks): For a discussion of the advantages and disadvantages of one method of measuring living standards with some reference to developed or developing economies. L2 (10–13 marks): For an accurate though undeveloped explanation of one method and some limitations. L1 (1–9 marks): For an answer that shows some knowledge but does not indicate that the question has been fully grasped, or where the answer contains irrelevancies and errors of theory.
More questions on Characteristics of countries at different levels of development
What was in this paper
The subtopics covered by these 7 questions, and how many questions each got. Open one in a new tab to see every Cambridge question on it.
What you needed in this session
Cambridge’s own grade thresholds for 2019 Oct/Nov, Paper 4 · Variant 2. A higher threshold means an easier paper — the bar moves with how the cohort did.