Cambridge A Level Economics 9708 — 2019 Oct/Nov Paper 4 · Variant 3
9708/43/O/N/19 · 7 questions · 70 marks · ≈79 min
The question paper and its mark scheme, free to read here and free to download. This is Cambridge’s own paper, exactly as it was sat.
Question paper4 pages


Mark scheme13 pages
Answers below. Sit the paper first if you are practising.






Questions as text
Q1 · Production, living standards and market failure Today, the average person lives better…
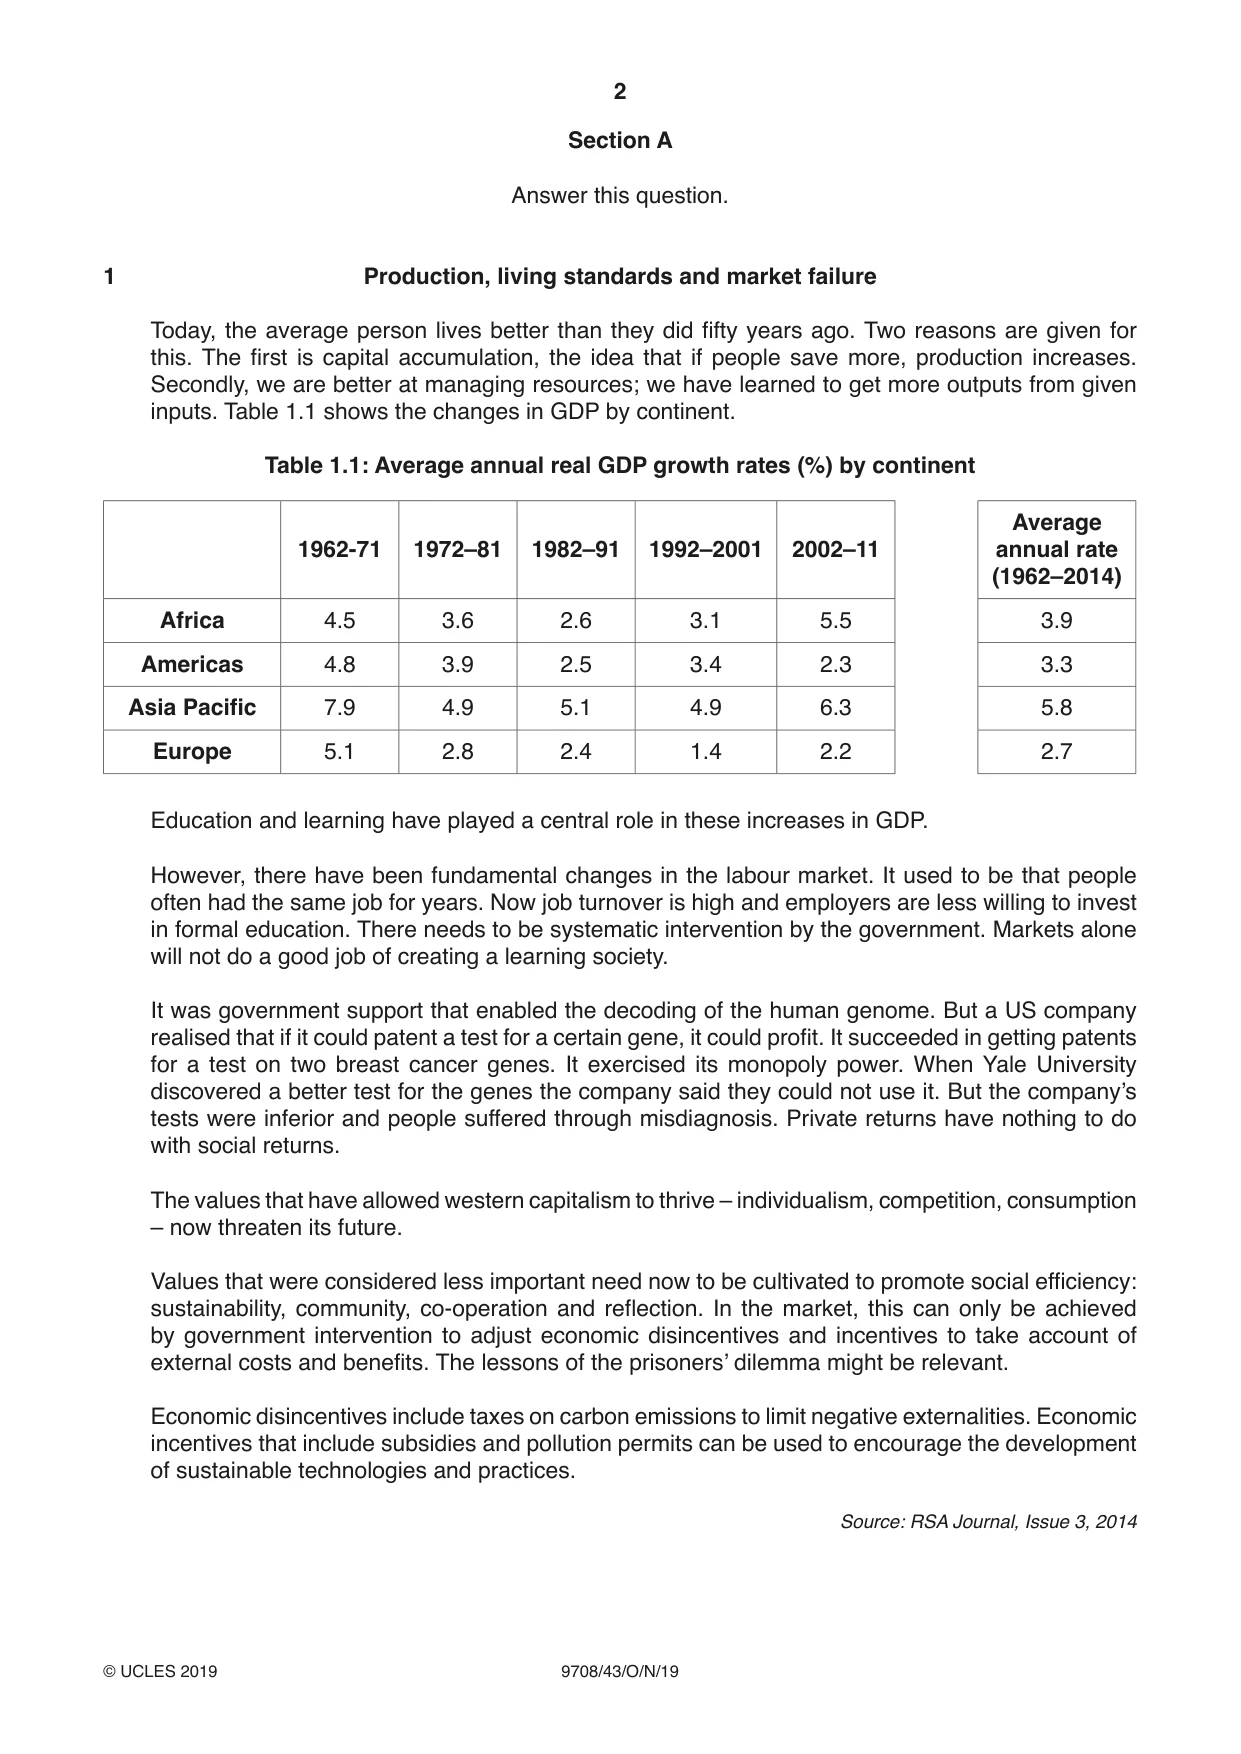
1 Production, living standards and market failure Today, the average person lives better than they did fifty years ago. Two reasons are given for this. The first is capital accumulation, the idea that if people save more, production increases. Secondly, we are better at managing resources; we have learned to get more outputs from given inputs. Table 1.1 shows the changes in GDP by continent. Table 1.1: Average annual real GDP growth rates (%) by continent Average 1962-71 1972–81 1982–91 1992–2001 2002–11 annual rate (1962–2014) Africa 4.5 3.6 2.6 3.1 5.5 3.9 Americas 4.8 3.9 2.5 3.4 2.3 3.3 Asia Pacific 7.9 4.9 5.1 4.9 6.3 5.8 Europe 5.1 2.8 2.4 1.4 2.2 2.7 Education and learning have played a central role in these increases in GDP. However, there have been fundamental changes in the labour market. It used to be that people often had the same job for years. Now job turnover is high and employers are less willing to invest in formal education. There needs to be systematic intervention by the government. Markets alone will not do a good job of creating a learning society. It was government support that enabled the decoding of the human genome. But a US company realised that if it could patent a test for a certain gene, it could profit. It succeeded in getting patents for a test on two breast cancer genes. It exercised its monopoly power. When Yale University discovered a better test for the genes the company said they could not use it. But the company’s tests were inferior and people suffered through misdiagnosis. Private returns have nothing to do with social returns. The values that have allowed western capitalism to thrive – individualism, competition, consumption – now threaten its future. Values that were considered less important need now to be cultivated to promote social efficiency: sustainability, community, co-operation and reflection. In the market, this can only be achieved by government intervention to adjust economic disincentives and incentives to take account of external costs and benefits. The lessons of the prisoners’ dilemma might be relevant. Economic disincentives include taxes on carbon emissions to limit negative externalities. Economic incentives that include subsidies and pollution permits can be used to encourage the development of sustainable technologies and practices. Source: RSA Journal, Issue 3, 2014 (a) The article says that an increase in saving would increase production. Would an economist necessarily agree with this statement? [5] (b) Explain what is meant by market failure and consider whether there are examples of market failure in the article. [5] (c) Suggest why the article says that the lessons of the prisoners’ dilemma might be relevant. [4] (d) Discuss, with the help of the information, whether the article is correct in asserting that the ‘average person lives better than they did fifty years ago’. [6]
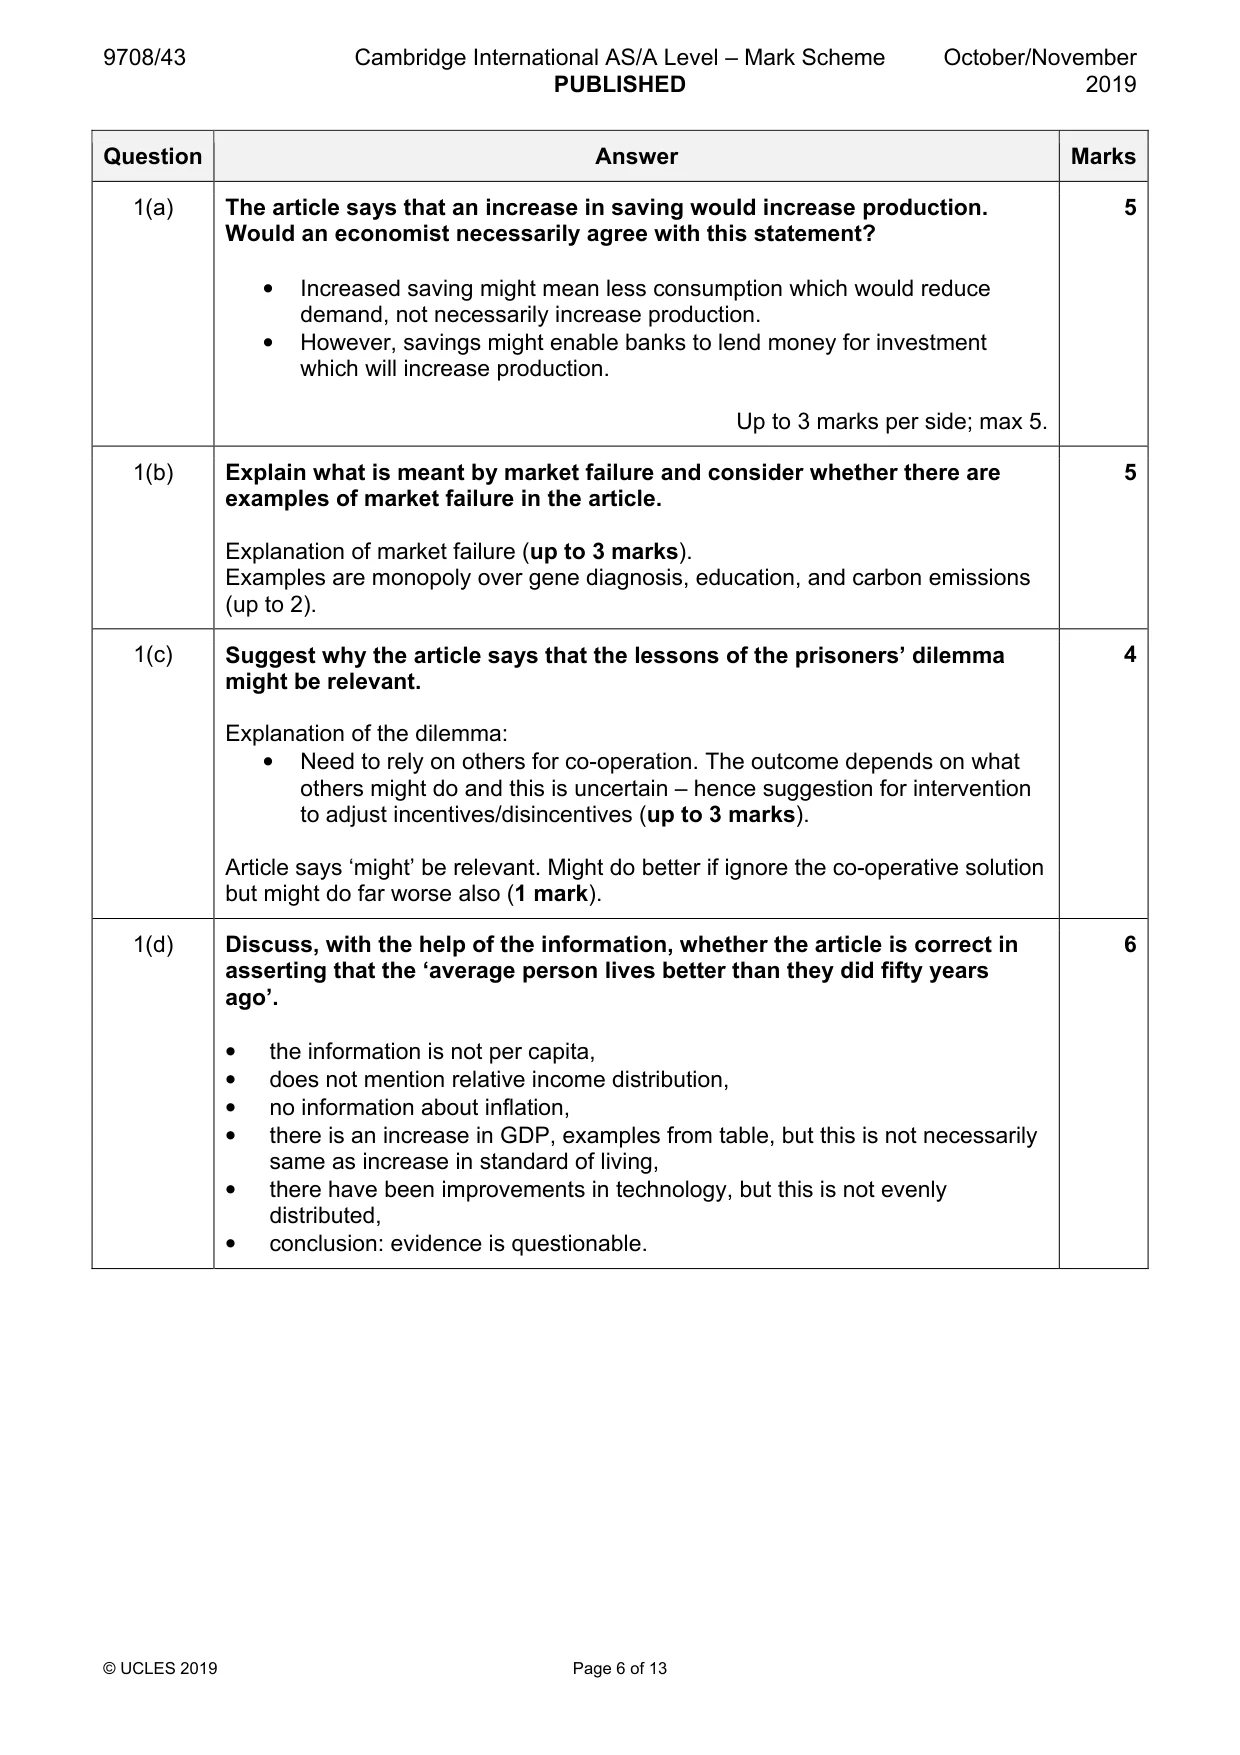
Mark scheme: Question Answer Marks 1(a) The article says that an increase in saving would increase production. 5 Would an economist necessarily agree with this statement? • Increased saving might mean less consumption which would reduce demand, not necessarily increase production. • However, savings might enable banks to lend money for investment which will increase production. Up to 3 marks per side; max 5. 1(b) Explain what is meant by market failure and consider whether there are 5 examples of market failure in the article. Explanation of market failure (up to 3 marks). Examples are monopoly over gene diagnosis, education, and carbon emissions (up to 2). 1(c) Suggest why the article says that the lessons of the prisoners’ dilemma 4 might be relevant. Explanation of the dilemma: • Need to rely on others for co-operation. The outcome depends on what others might do and this is uncertain – hence suggestion for intervention to adjust incentives/disincentives (up to 3 marks). Article says ‘might’ be relevant. Might do better if ignore the co-operative solution but might do far worse also (1 mark). 1(d) Discuss, with the help of the information, whether the article is correct in 6 asserting that the ‘average person lives better than they did fifty years ago’. • the information is not per capita, • does not mention relative income distribution, • no information about inflation, • there is an increase in GDP, examples from table, but this is not necessarily same as increase in standard of living, • there have been improvements in technology, but this is not evenly distributed, • conclusion: evidence is questionable.
Q2 · Explain the meaning of and whether there is a link (i) between Pareto optimality and…
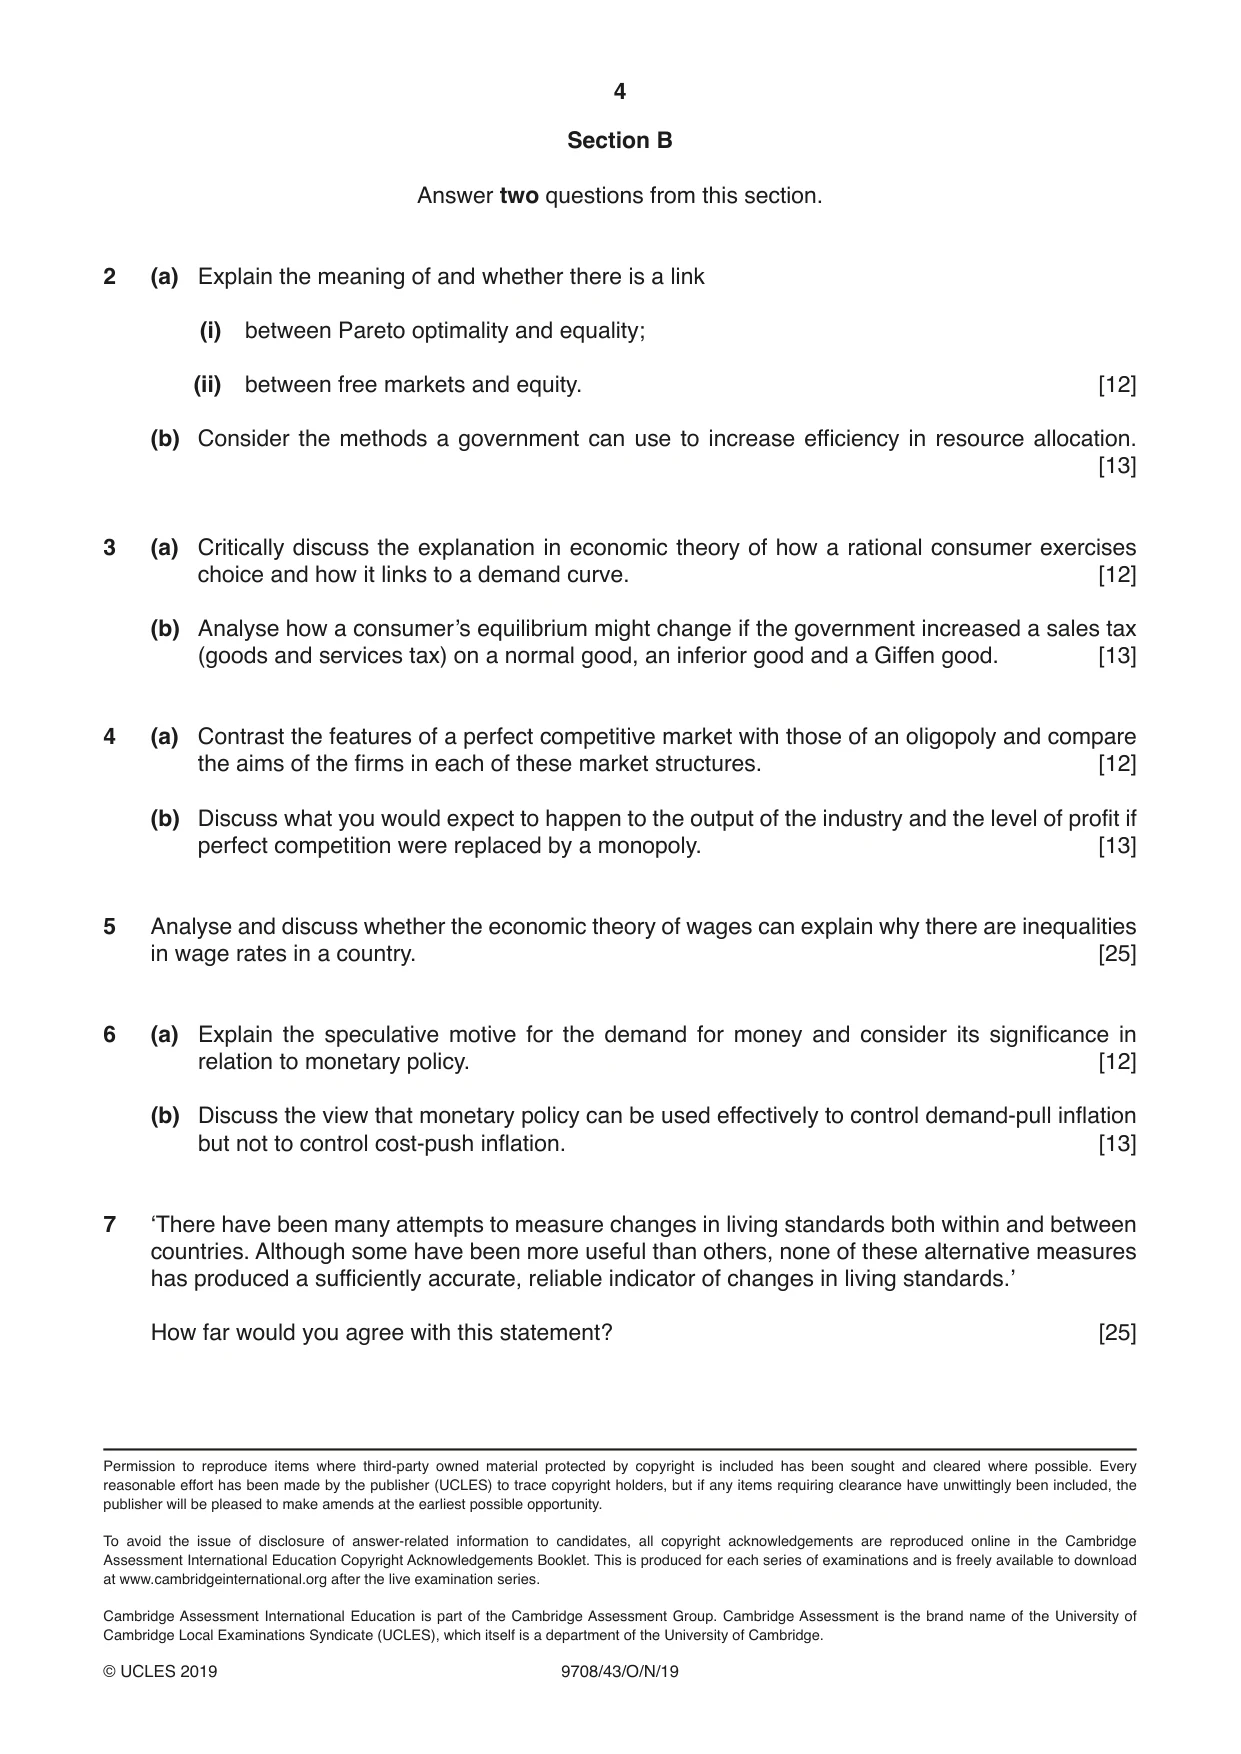
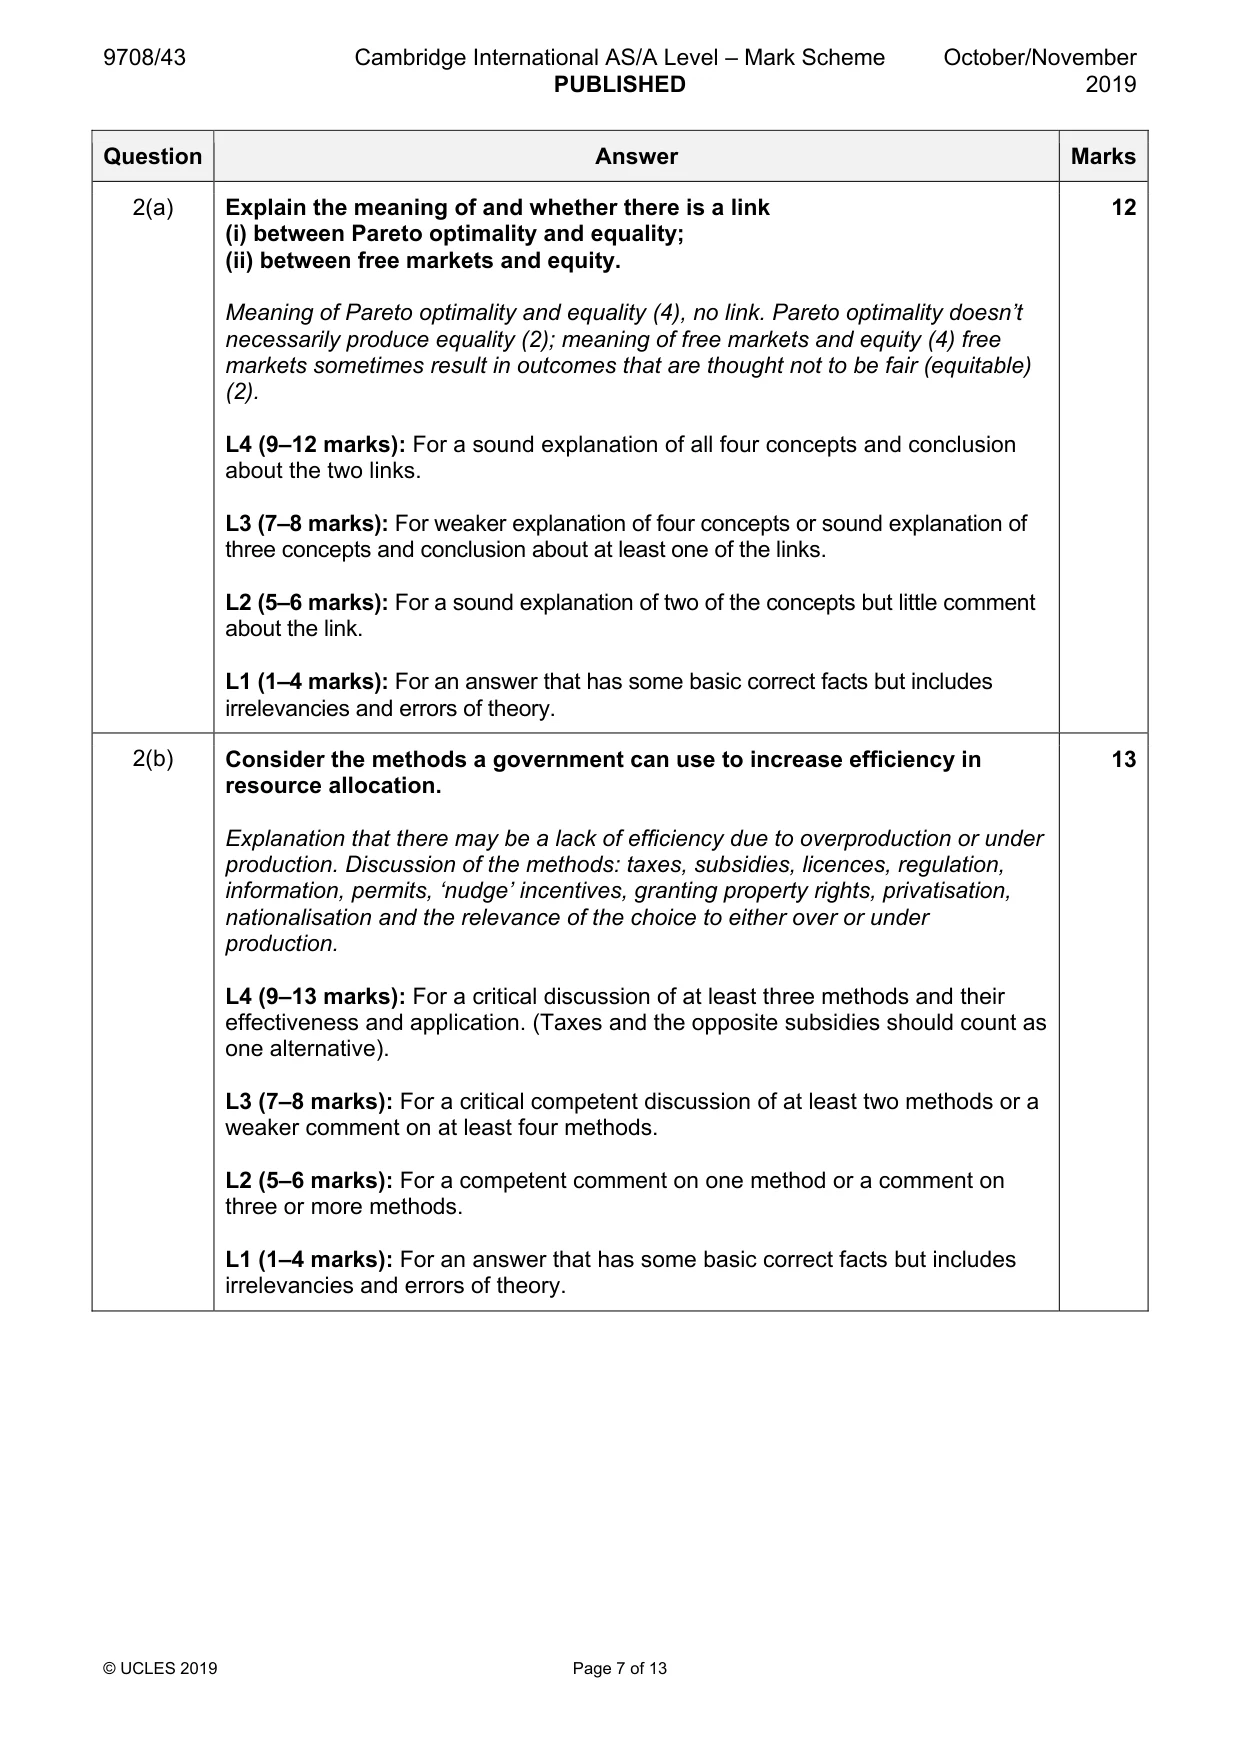
2 (a) Explain the meaning of and whether there is a link (i) between Pareto optimality and equality; (ii) between free markets and equity. [12] (b) Consider the methods a government can use to increase efficiency in resource allocation. [13]
Mark scheme: 2(a) Explain the meaning of and whether there is a link 12 (i) between Pareto optimality and equality; (ii) between free markets and equity. Meaning of Pareto optimality and equality (4), no link. Pareto optimality doesn’t necessarily produce equality (2); meaning of free markets and equity (4) free markets sometimes result in outcomes that are thought not to be fair (equitable) (2). L4 (9–12 marks): For a sound explanation of all four concepts and conclusion about the two links. L3 (7–8 marks): For weaker explanation of four concepts or sound explanation of three concepts and conclusion about at least one of the links. L2 (5–6 marks): For a sound explanation of two of the concepts but little comment about the link. L1 (1–4 marks): For an answer that has some basic correct facts but includes irrelevancies and errors of theory. 2(b) Consider the methods a government can use to increase efficiency in 13 resource allocation. Explanation that there may be a lack of efficiency due to overproduction or under production. Discussion of the methods: taxes, subsidies, licences, regulation, information, permits, ‘nudge’ incentives, granting property rights, privatisation, nationalisation and the relevance of the choice to either over or under production. L4 (9–13 marks): For a critical discussion of at least three methods and their effectiveness and application. (Taxes and the opposite subsidies should count as one alternative). L3 (7–8 marks): For a critical competent discussion of at least two methods or a weaker comment on at least four methods. L2 (5–6 marks): For a competent comment on one method or a comment on three or more methods. L1 (1–4 marks): For an answer that has some basic correct facts but includes irrelevancies and errors of theory.
Q3 · Critically discuss the explanation in economic theory of how a rational consumer…
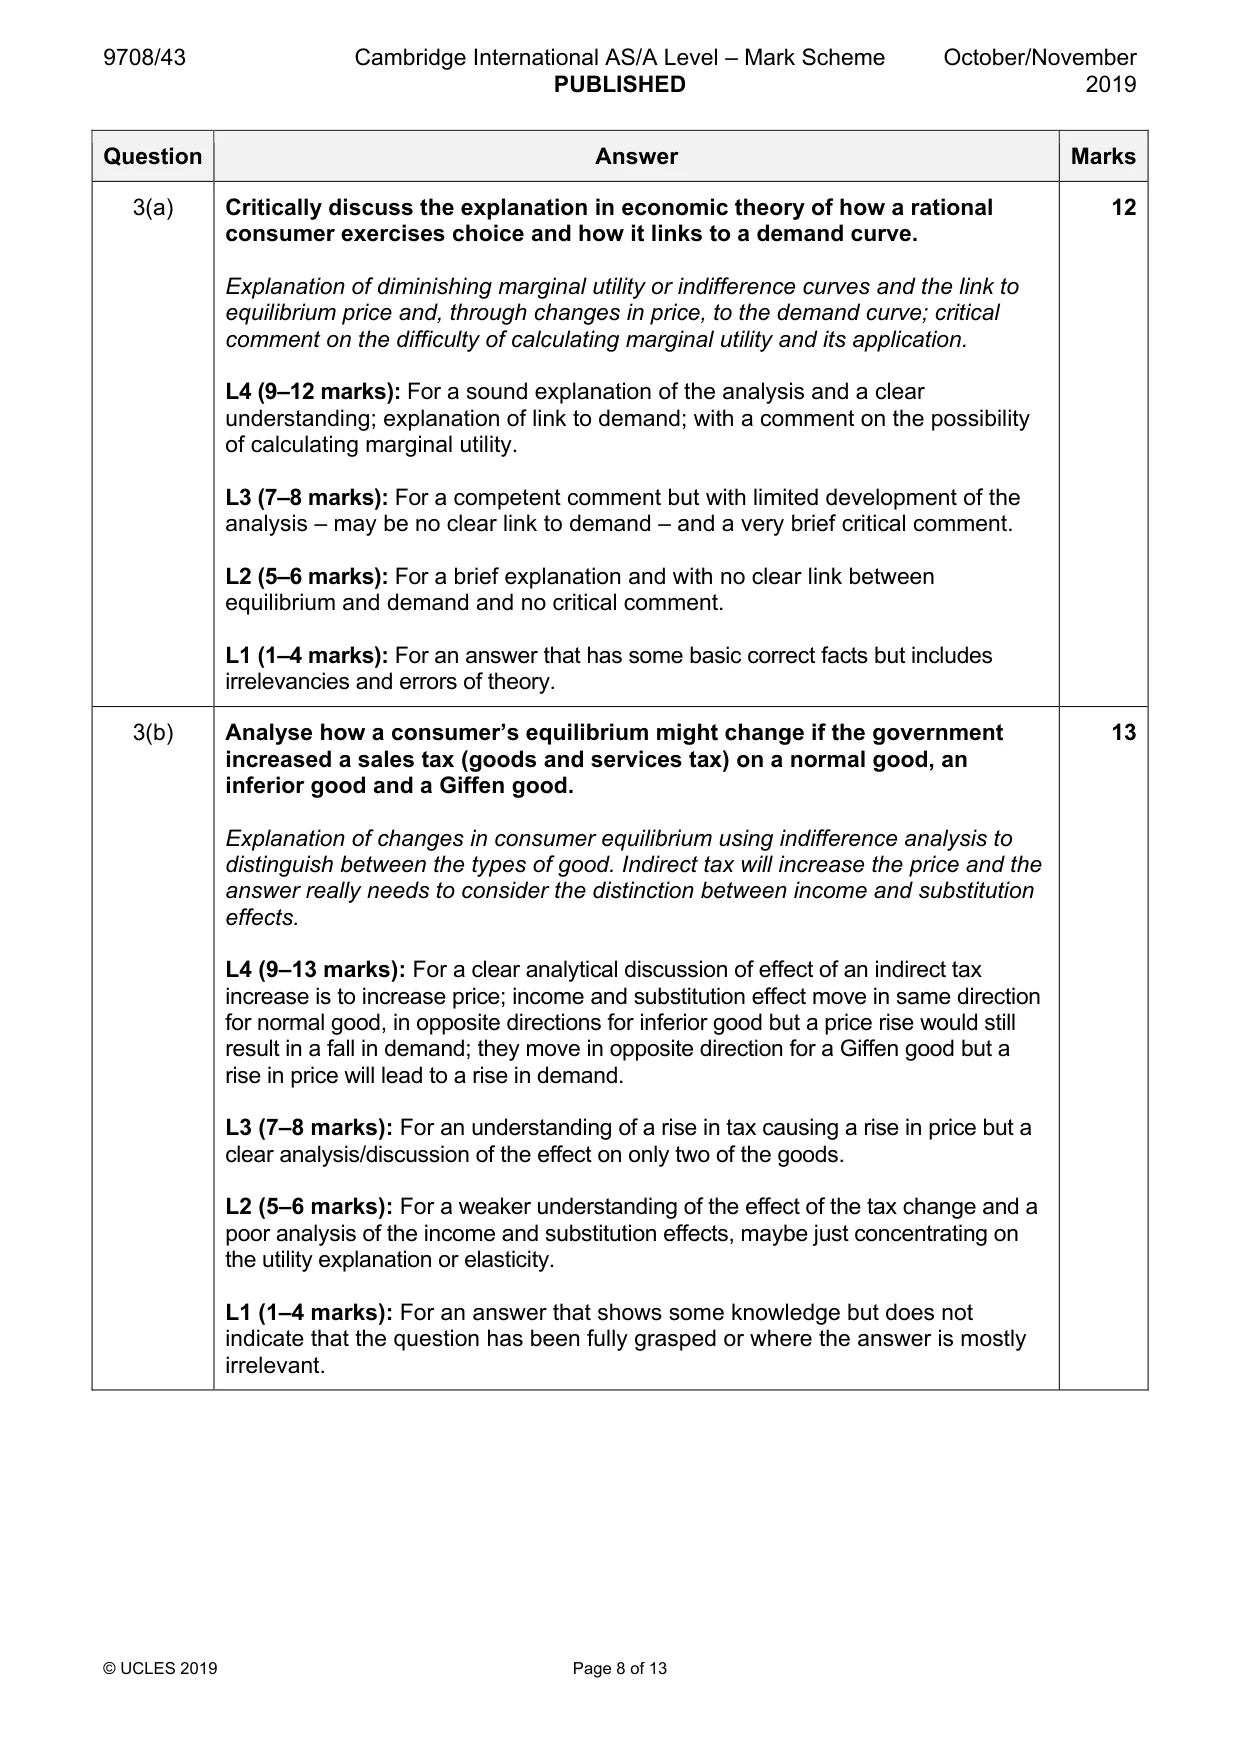
3 (a) Critically discuss the explanation in economic theory of how a rational consumer exercises choice and how it links to a demand curve. [12] (b) Analyse how a consumer’s equilibrium might change if the government increased a sales tax (goods and services tax) on a normal good, an inferior good and a Giffen good. [13]
Mark scheme: 3(a) Critically discuss the explanation in economic theory of how a rational 12 consumer exercises choice and how it links to a demand curve. Explanation of diminishing marginal utility or indifference curves and the link to equilibrium price and, through changes in price, to the demand curve; critical comment on the difficulty of calculating marginal utility and its application. L4 (9–12 marks): For a sound explanation of the analysis and a clear understanding; explanation of link to demand; with a comment on the possibility of calculating marginal utility. L3 (7–8 marks): For a competent comment but with limited development of the analysis – may be no clear link to demand – and a very brief critical comment. L2 (5–6 marks): For a brief explanation and with no clear link between equilibrium and demand and no critical comment. L1 (1–4 marks): For an answer that has some basic correct facts but includes irrelevancies and errors of theory. 3(b) Analyse how a consumer’s equilibrium might change if the government 13 increased a sales tax (goods and services tax) on a normal good, an inferior good and a Giffen good. Explanation of changes in consumer equilibrium using indifference analysis to distinguish between the types of good. Indirect tax will increase the price and the answer really needs to consider the distinction between income and substitution effects. L4 (9–13 marks): For a clear analytical discussion of effect of an indirect tax increase is to increase price; income and substitution effect move in same direction for normal good, in opposite directions for inferior good but a price rise would still result in a fall in demand; they move in opposite direction for a Giffen good but a rise in price will lead to a rise in demand. L3 (7–8 marks): For an understanding of a rise in tax causing a rise in price but a clear analysis/discussion of the effect on only two of the goods. L2 (5–6 marks): For a weaker understanding of the effect of the tax change and a poor analysis of the income and substitution effects, maybe just concentrating on the utility explanation or elasticity. L1 (1–4 marks): For an answer that shows some knowledge but does not indicate that the question has been fully grasped or where the answer is mostly irrelevant.
Q4 · Contrast the features of a perfect competitive market with those of an oligopoly and…
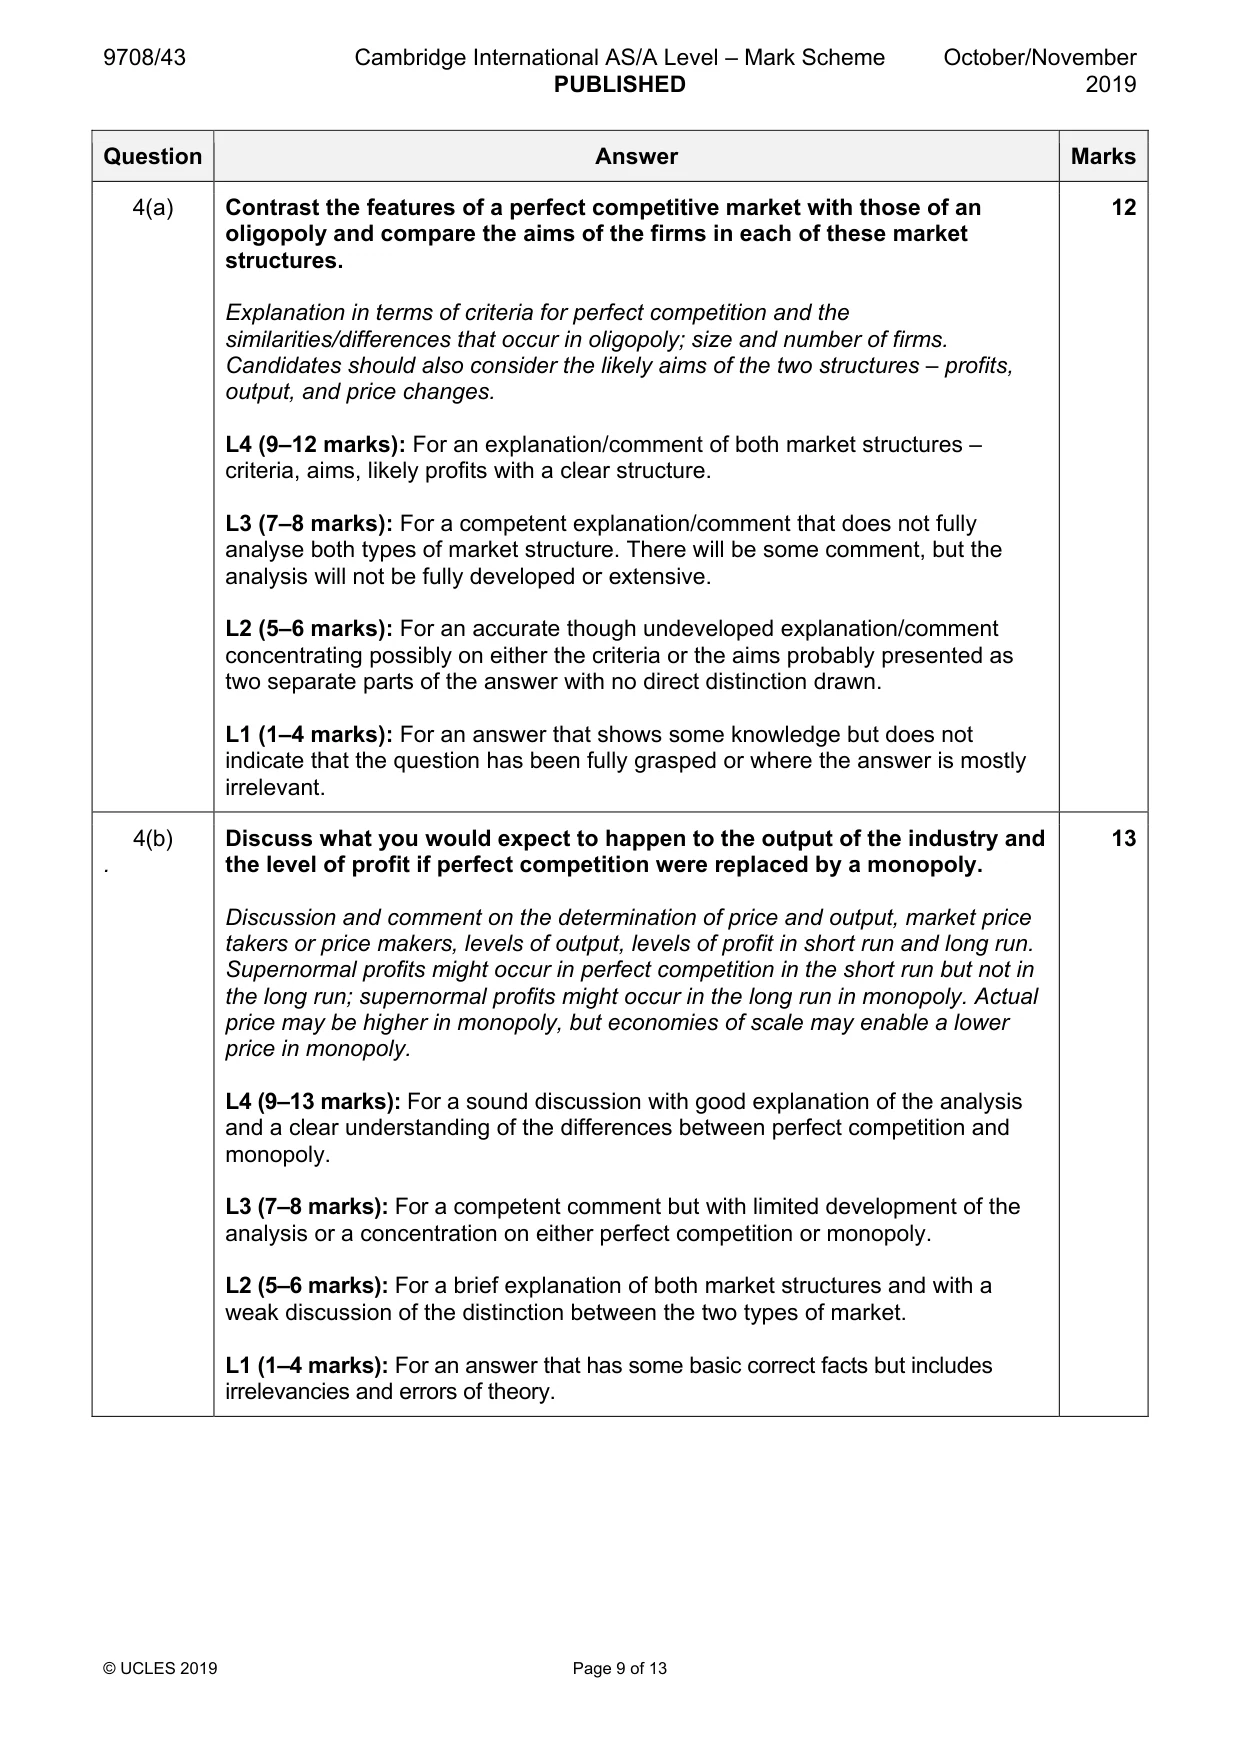
4 (a) Contrast the features of a perfect competitive market with those of an oligopoly and compare the aims of the firms in each of these market structures. [12] (b) Discuss what you would expect to happen to the output of the industry and the level of profit if perfect competition were replaced by a monopoly. [13]
Mark scheme: 4(a) Contrast the features of a perfect competitive market with those of an 12 oligopoly and compare the aims of the firms in each of these market structures. Explanation in terms of criteria for perfect competition and the similarities/differences that occur in oligopoly; size and number of firms. Candidates should also consider the likely aims of the two structures – profits, output, and price changes. L4 (9–12 marks): For an explanation/comment of both market structures – criteria, aims, likely profits with a clear structure. L3 (7–8 marks): For a competent explanation/comment that does not fully analyse both types of market structure. There will be some comment, but the analysis will not be fully developed or extensive. L2 (5–6 marks): For an accurate though undeveloped explanation/comment concentrating possibly on either the criteria or the aims probably presented as two separate parts of the answer with no direct distinction drawn. L1 (1–4 marks): For an answer that shows some knowledge but does not indicate that the question has been fully grasped or where the answer is mostly irrelevant. 4(b) Discuss what you would expect to happen to the output of the industry and 13 . the level of profit if perfect competition were replaced by a monopoly. Discussion and comment on the determination of price and output, market price takers or price makers, levels of output, levels of profit in short run and long run. Supernormal profits might occur in perfect competition in the short run but not in the long run; supernormal profits might occur in the long run in monopoly. Actual price may be higher in monopoly, but economies of scale may enable a lower price in monopoly. L4 (9–13 marks): For a sound discussion with good explanation of the analysis and a clear understanding of the differences between perfect competition and monopoly. L3 (7–8 marks): For a competent comment but with limited development of the analysis or a concentration on either perfect competition or monopoly. L2 (5–6 marks): For a brief explanation of both market structures and with a weak discussion of the distinction between the two types of market. L1 (1–4 marks): For an answer that has some basic correct facts but includes irrelevancies and errors of theory.
Q5 · Analyse and discuss whether the economic theory of wages can explain why there are…
5 Analyse and discuss whether the economic theory of wages can explain why there are inequalities in wage rates in a country. [25]
Mark scheme: 5 Analyse and discuss whether the economic theory of wages can explain 25 why there are inequalities in wage rates in a country. Discussion of determinants of wages. Candidates should explain the theoretical analysis and discuss the reason for higher wages and inequality in wage rates. These inequalities could occur not only in different occupations but within the same occupation. The discussion should include reference to how the theoretical analysis accommodates the market forces of supply and demand but can be moderated by the influence of trade unions and government policy with possible influences on inequalities in wage rates. L4 (18–25 marks): For a thorough analysis of theoretical wage determination with a clear discussion of the role of trade unions and their likely significance over other factors. L3 (14–17 marks): For a competent explanation but with limited discussion of trade unions and their significance. L2 (10–13 marks): For a correct but undeveloped theoretical analysis with very bald comment about the role of trade unions. L1 (1–9 marks): For an answer that has some basic correct facts but includes irrelevancies and errors of theory.
More questions on Labour market forces and government intervention
Q6 · Explain the speculative motive for the demand for money and consider its significance in…
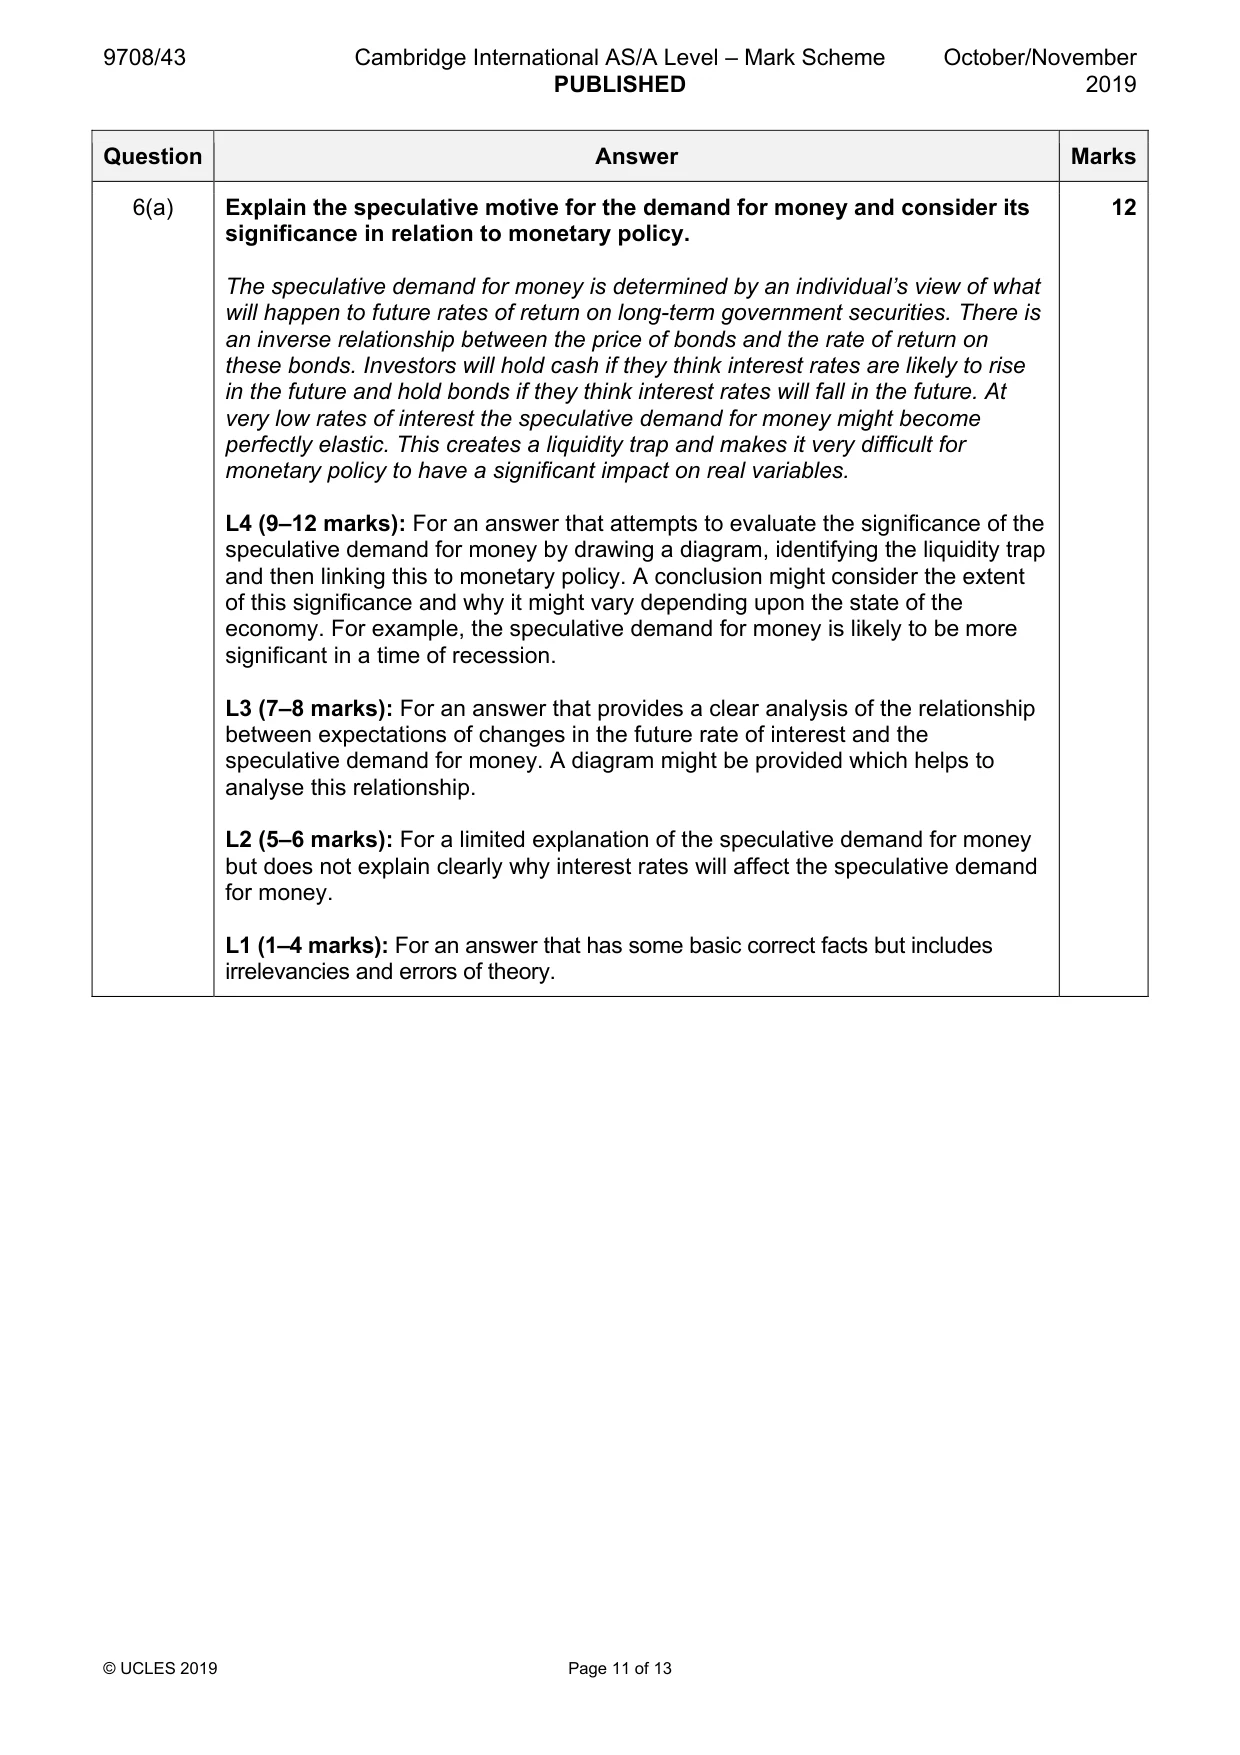
6 (a) Explain the speculative motive for the demand for money and consider its significance in relation to monetary policy. [12] (b) Discuss the view that monetary policy can be used effectively to control demand-pull inflation but not to control cost-push inflation. [13]
Mark scheme: 6(a) Explain the speculative motive for the demand for money and consider its 12 significance in relation to monetary policy. The speculative demand for money is determined by an individual’s view of what will happen to future rates of return on long-term government securities. There is an inverse relationship between the price of bonds and the rate of return on these bonds. Investors will hold cash if they think interest rates are likely to rise in the future and hold bonds if they think interest rates will fall in the future. At very low rates of interest the speculative demand for money might become perfectly elastic. This creates a liquidity trap and makes it very difficult for monetary policy to have a significant impact on real variables. L4 (9–12 marks): For an answer that attempts to evaluate the significance of the speculative demand for money by drawing a diagram, identifying the liquidity trap and then linking this to monetary policy. A conclusion might consider the extent of this significance and why it might vary depending upon the state of the economy. For example, the speculative demand for money is likely to be more significant in a time of recession. L3 (7–8 marks): For an answer that provides a clear analysis of the relationship between expectations of changes in the future rate of interest and the speculative demand for money. A diagram might be provided which helps to analyse this relationship. L2 (5–6 marks): For a limited explanation of the speculative demand for money but does not explain clearly why interest rates will affect the speculative demand for money. L1 (1–4 marks): For an answer that has some basic correct facts but includes irrelevancies and errors of theory. 6(b) Discuss the view that monetary policy can be used effectively to control 13 demand-pull inflation but not to control cost-push inflation. Monetary policy might use changes in the money supply, changes in interest rates and changes in exchange rates. Changes in all three of these variables might have an impact on demand-pull inflation. For example, a decrease in interest rates might stimulate consumption spending or cause a fall in exchange rates which should increase aggregate monetary demand. Alternatively, a fall in exchange rates would increase the price of imported raw materials which could cause cost-push inflation. Diagrams could be used to illustrate these effects. L4 (9–13 marks): For an answer which attempts to address the view contained in the question. Responses should focus upon evaluating the extent of monetary policy on demand-pull inflation and whether/why monetary policy can cause cost- push inflation. A conclusion should be provided which makes a judgement regarding the view under consideration and this should be based on preceding evidence. L3 (7–8 marks): For an answer which analyses the effects of different monetary policy options which have different impacts on aggregate demand and costs, and why these changes can cause inflation. Supporting diagrams might be used to illustrate these effects. L2 (5–6 marks): For an answer which identifies different types of monetary policy and which describes some of the causes of demand-pull and cost-push inflation. L1 (1–4 marks): For an answer that has some basic correct facts but includes irrelevancies and errors of theory.
More questions on Effectiveness of policy options to meet all macroeconomic objectives
Q7 · ‘There have been many attempts to measure changes in living standards both within and…
7 ‘There have been many attempts to measure changes in living standards both within and between countries. Although some have been more useful than others, none of these alternative measures has produced a sufficiently accurate, reliable indicator of changes in living standards.’ How far would you agree with this statement? [25]
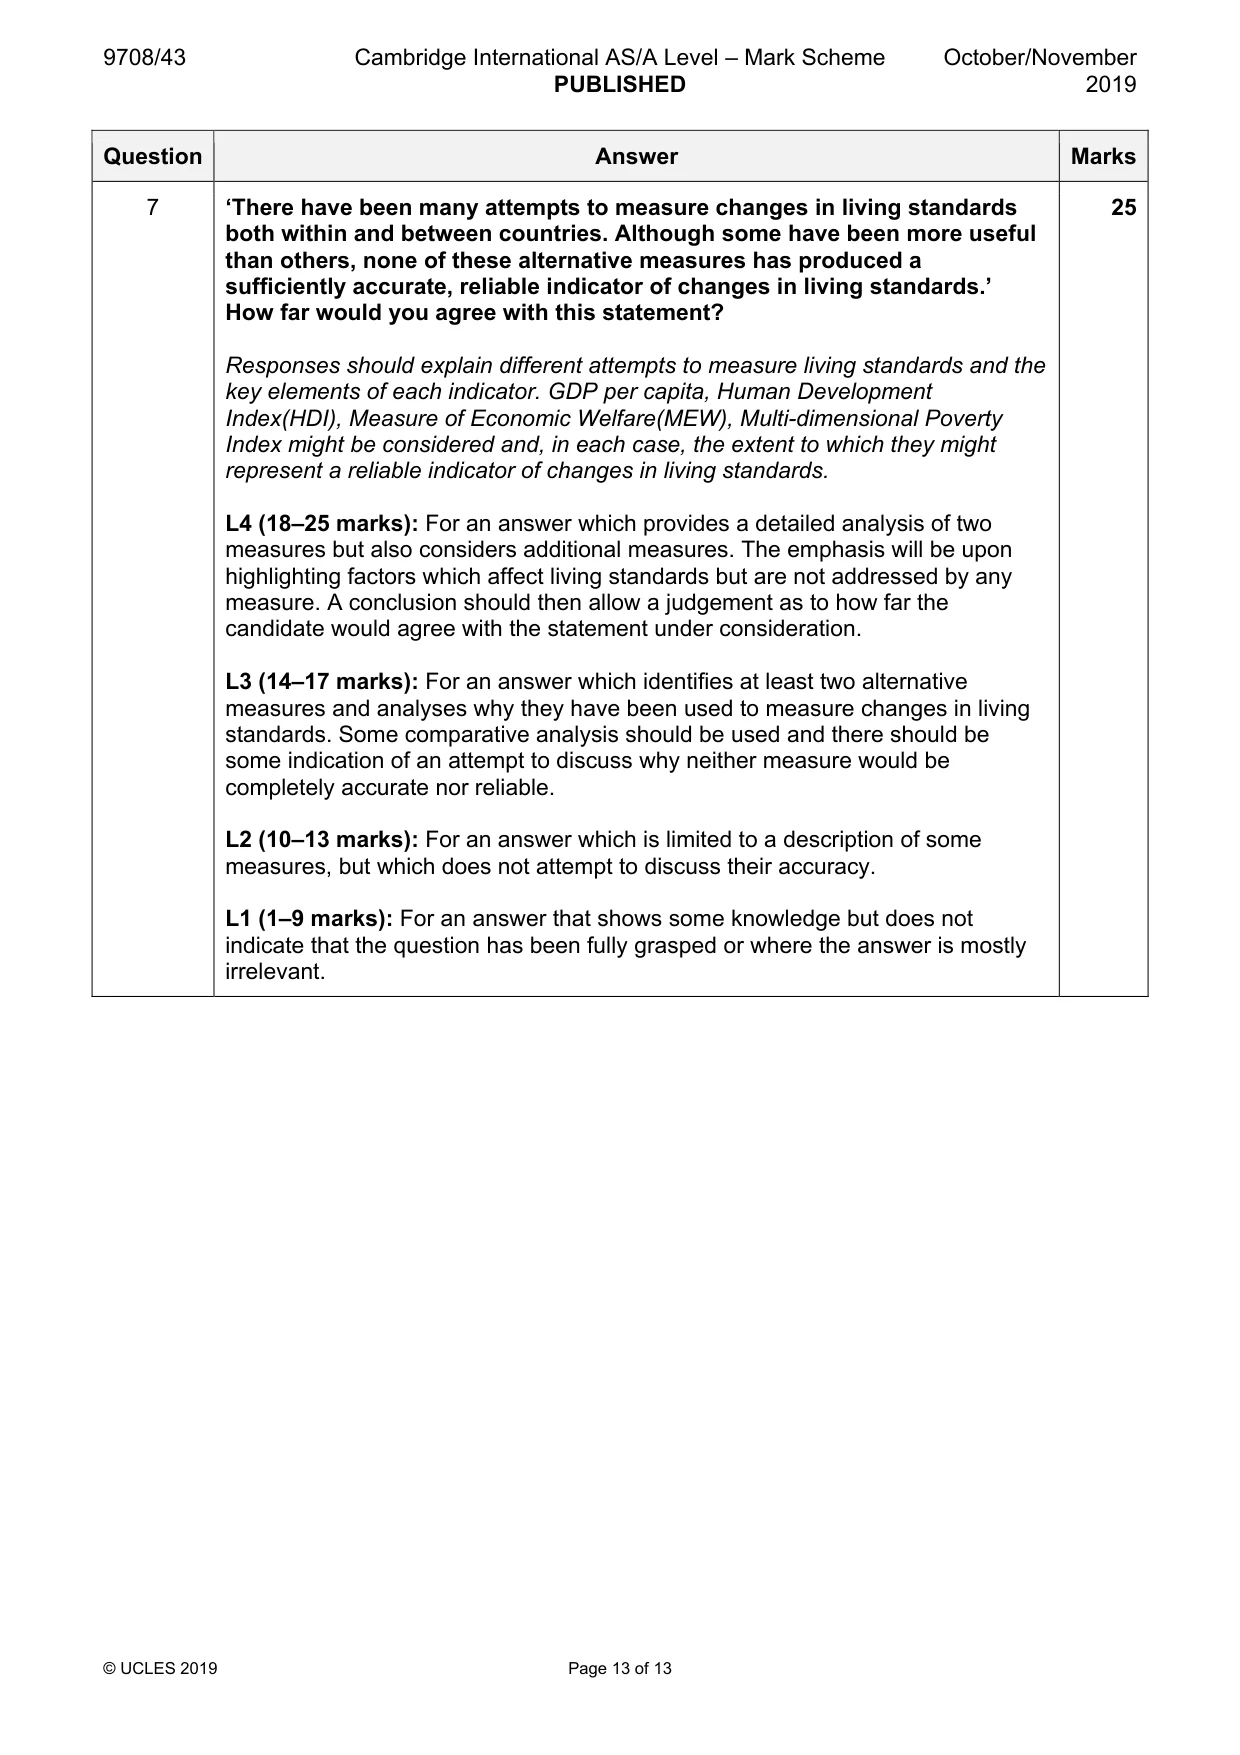
Mark scheme: 7 ‘There have been many attempts to measure changes in living standards 25 both within and between countries. Although some have been more useful than others, none of these alternative measures has produced a sufficiently accurate, reliable indicator of changes in living standards.’ How far would you agree with this statement? Responses should explain different attempts to measure living standards and the key elements of each indicator. GDP per capita, Human Development Index(HDI), Measure of Economic Welfare(MEW), Multi-dimensional Poverty Index might be considered and, in each case, the extent to which they might represent a reliable indicator of changes in living standards. L4 (18–25 marks): For an answer which provides a detailed analysis of two measures but also considers additional measures. The emphasis will be upon highlighting factors which affect living standards but are not addressed by any measure. A conclusion should then allow a judgement as to how far the candidate would agree with the statement under consideration. L3 (14–17 marks): For an answer which identifies at least two alternative measures and analyses why they have been used to measure changes in living standards. Some comparative analysis should be used and there should be some indication of an attempt to discuss why neither measure would be completely accurate nor reliable. L2 (10–13 marks): For an answer which is limited to a description of some measures, but which does not attempt to discuss their accuracy. L1 (1–9 marks): For an answer that shows some knowledge but does not indicate that the question has been fully grasped or where the answer is mostly irrelevant.
What was in this paper
The subtopics covered by these 7 questions, and how many questions each got. Open one in a new tab to see every Cambridge question on it.
1Economic development1Economic growth1Effectiveness of policy options to meet all macroeconomic objectives1Government policies to achieve efficient resource allocation and correct market failure1Indifference curves and budget lines1Labour market forces and government intervention1What you needed in this session
Cambridge’s own grade thresholds for 2019 Oct/Nov, Paper 4 · Variant 3. A higher threshold means an easier paper — the bar moves with how the cohort did.