Cambridge A Level Biology 9700 — 2025 Oct/Nov Paper 4 · Variant 2
9700/42/O/N/25 · 10 questions · 100 marks · 120 min
The question paper and its mark scheme, free to read here and free to download. This is Cambridge’s own paper, exactly as it was sat.
Question paper28 pages


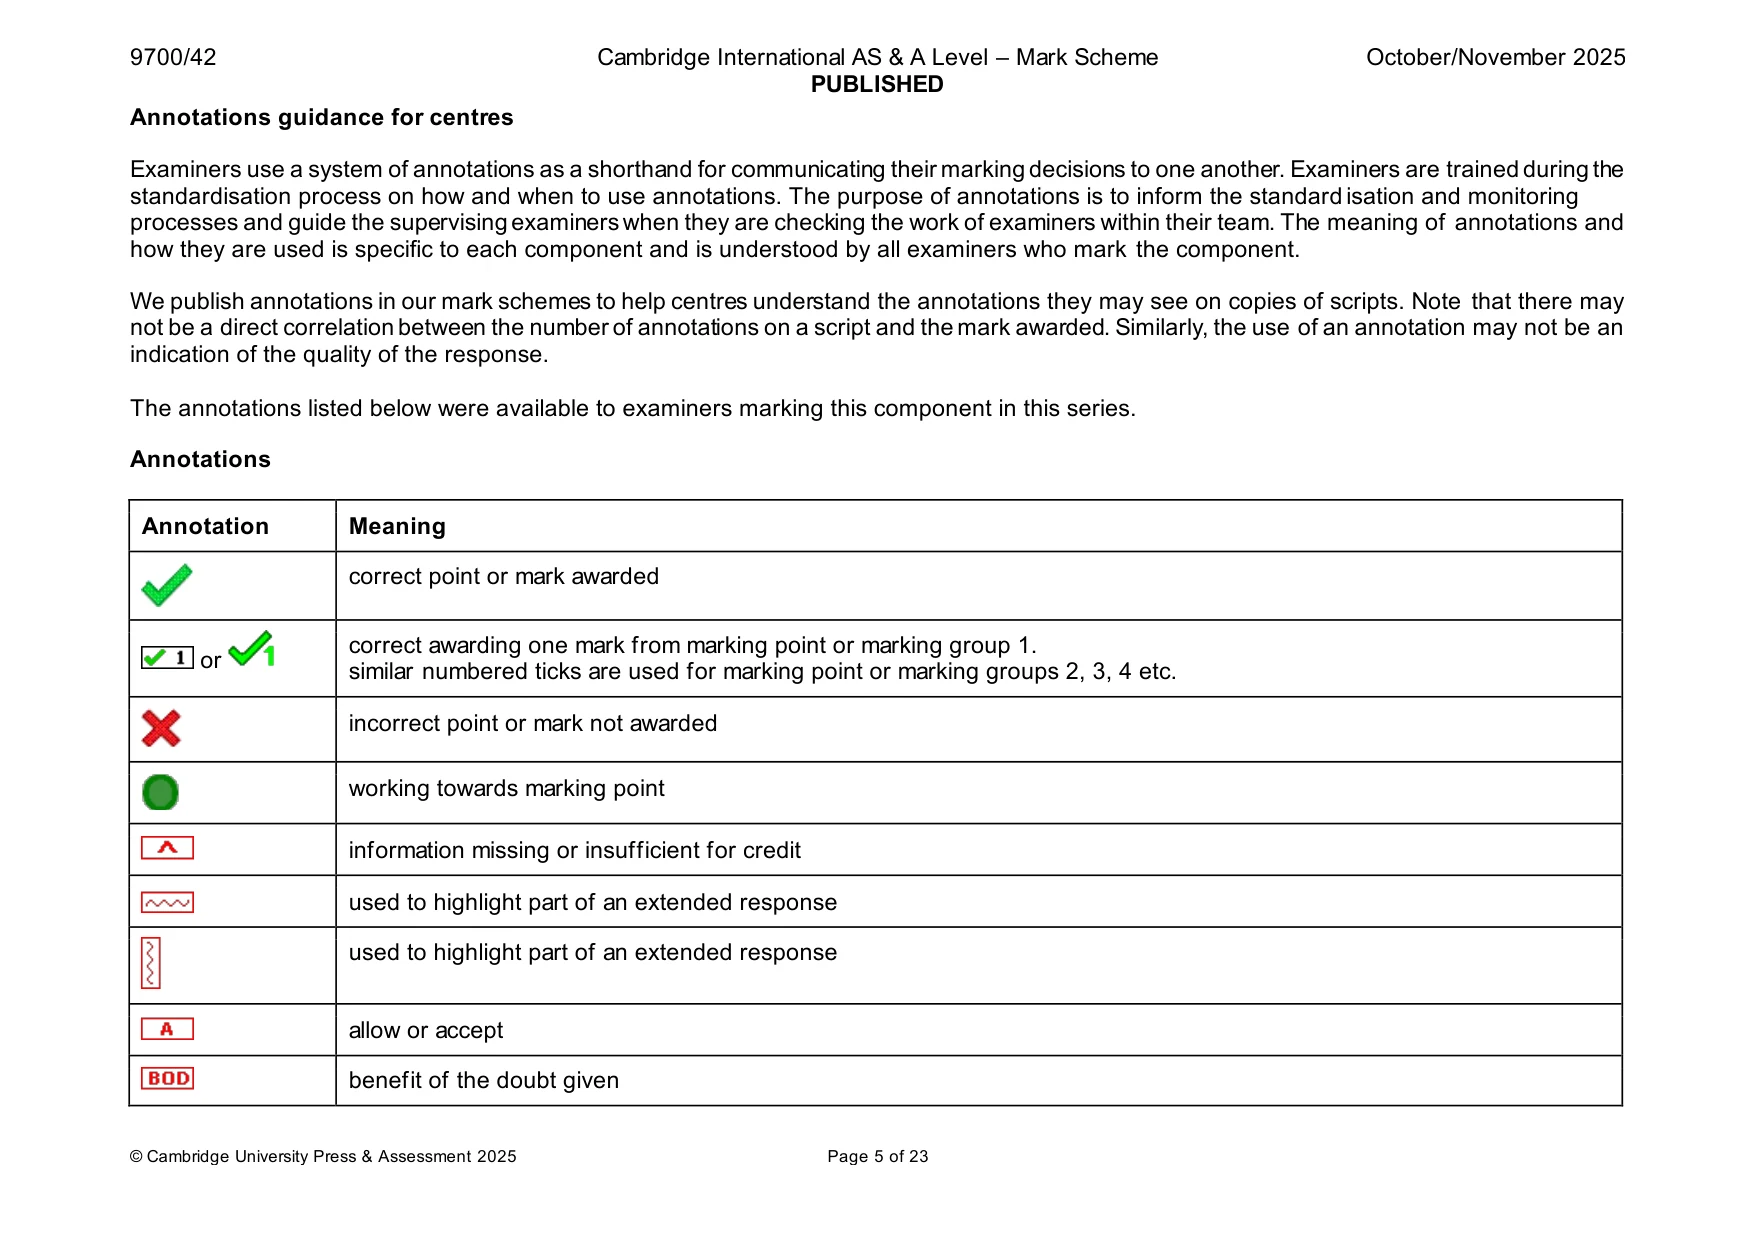
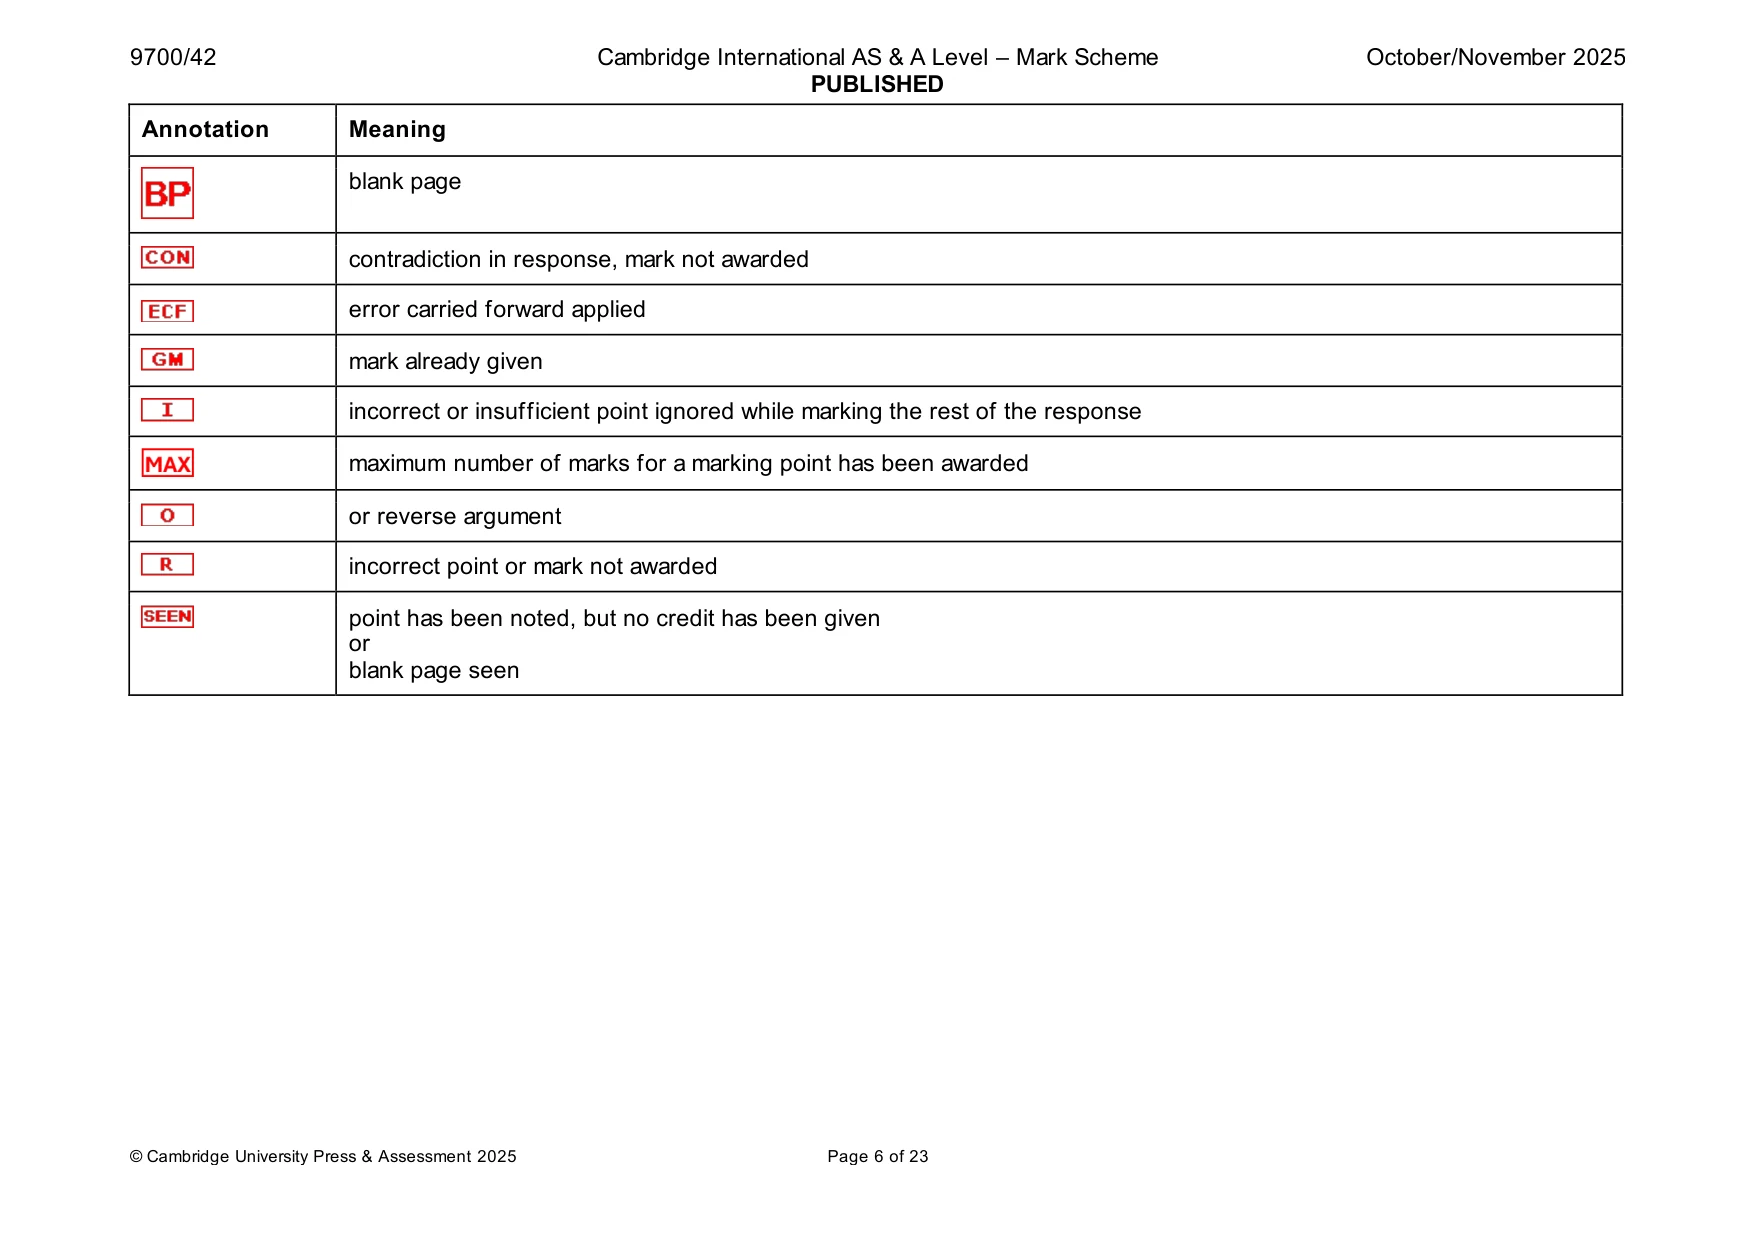
Mark scheme23 pages
Answers below. Sit the paper first if you are practising.
Questions as text
Q1 · Rice, Oryza sativa, is a crop plant that has adapted to grow in flooded fields
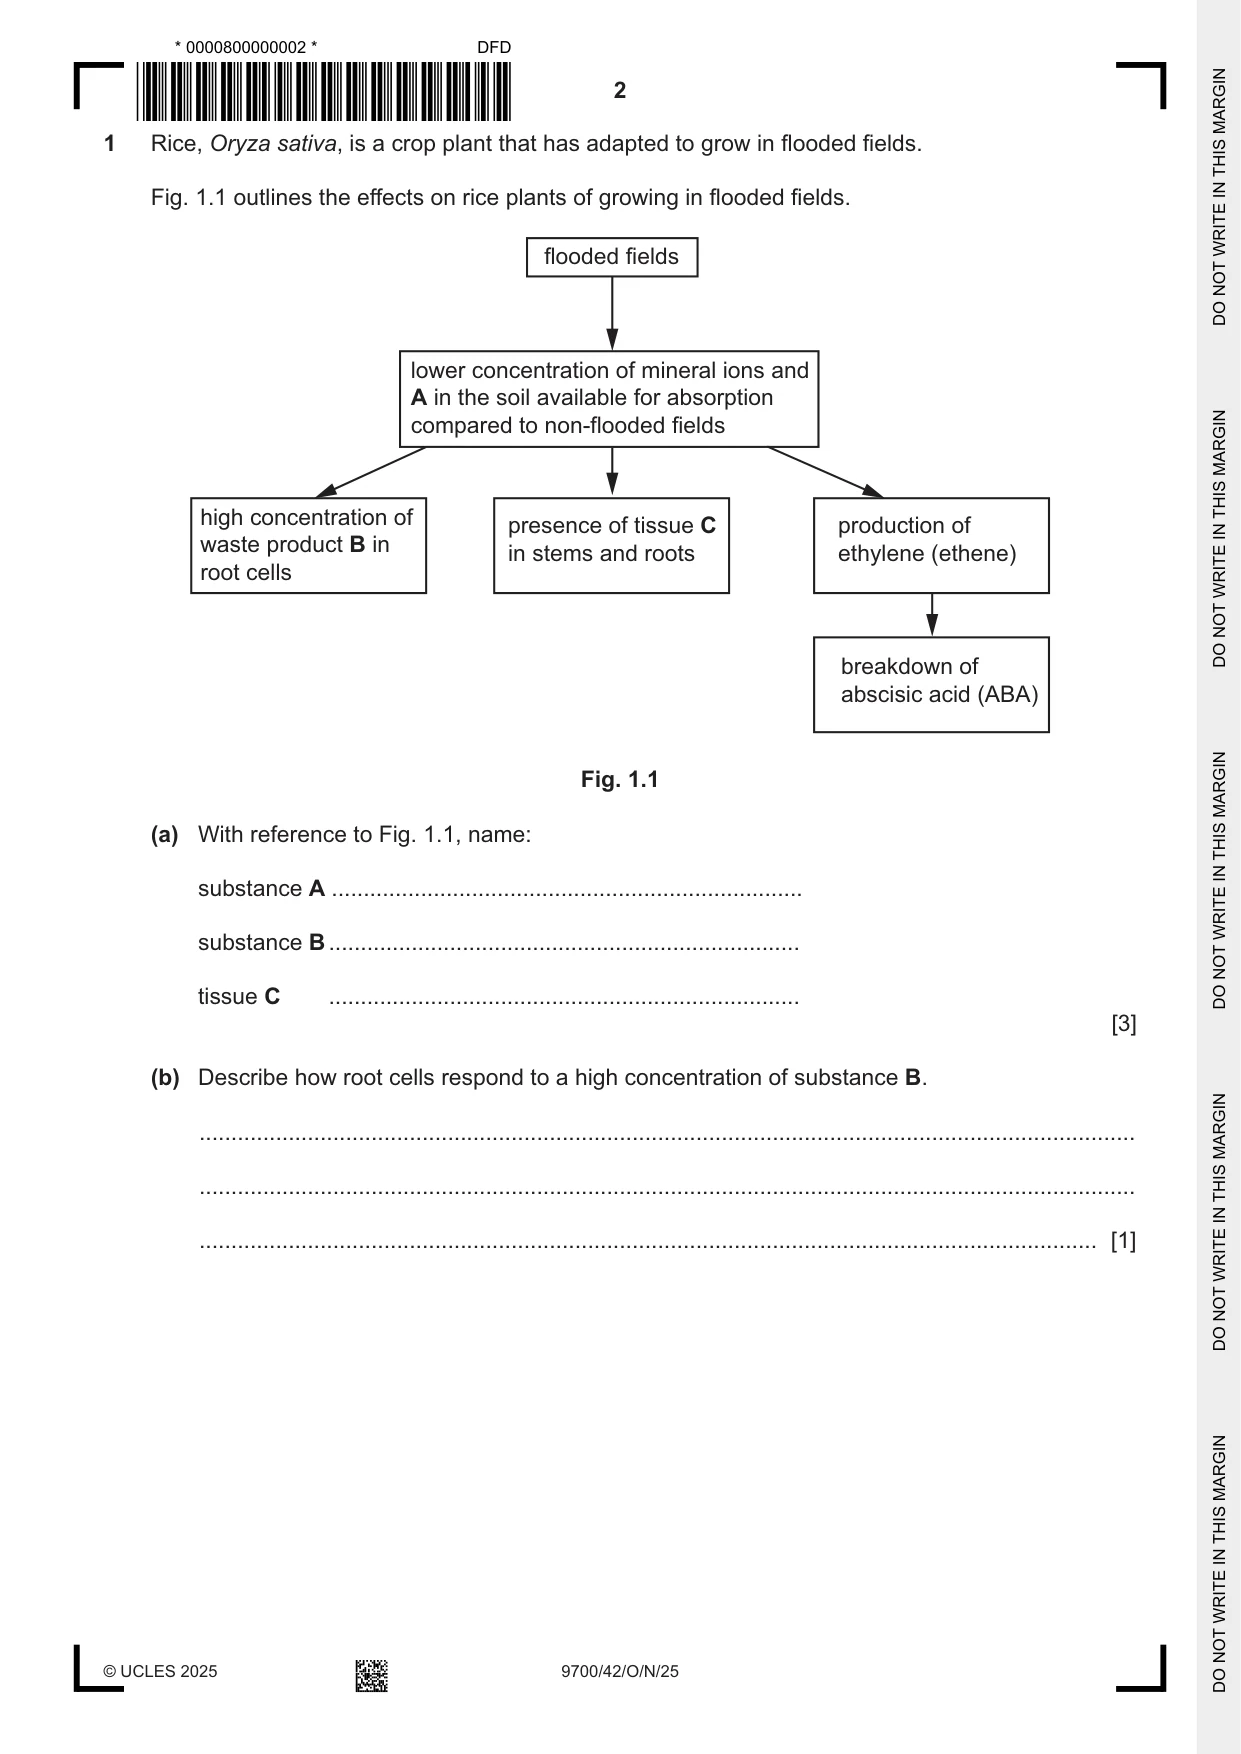
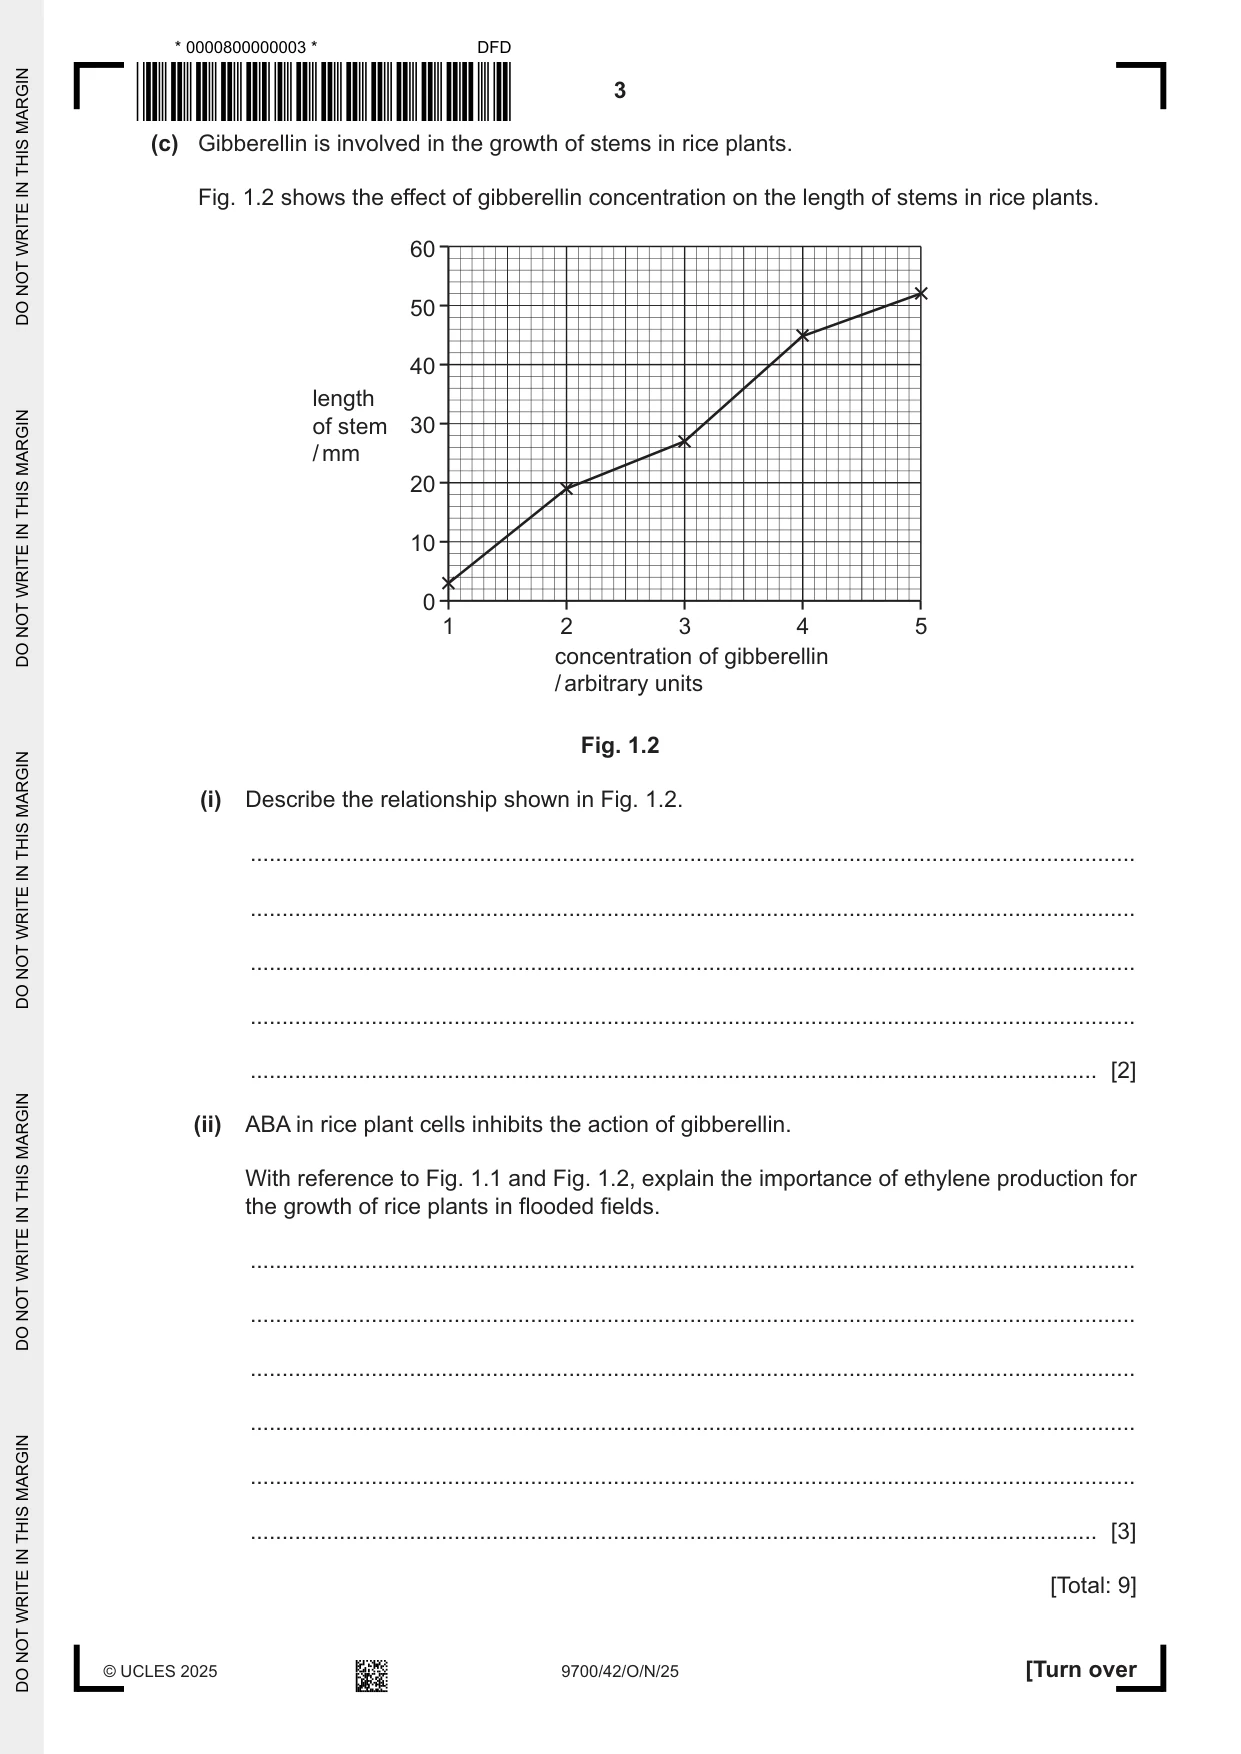
1 Rice, Oryza sativa, is a crop plant that has adapted to grow in flooded fields. Fig. 1.1 outlines the effects on rice plants of growing in flooded fields. flooded fields lower concentration of mineral ions and A in the soil available for absorption compared to non-flooded fields high concentration of presence of tissue C production of waste product B in in stems and roots ethylene (ethene) root cells breakdown of abscisic acid (ABA) Fig. 1.1 (a) With reference to Fig. 1.1, name: substance A .......................................................................... substance B .......................................................................... tissue C .......................................................................... [3] (b) Describe how root cells respond to a high concentration of substance B. ................................................................................................................................................... ................................................................................................................................................... ............................................................................................................................................. [1] (c) Gibberellin is involved in the growth of stems in rice plants. Fig. 1.2 shows the effect of gibberellin concentration on the length of stems in rice plants. 60 50 40 length of stem 30 / mm 20 10 0 1 2 3 4 5 concentration of gibberellin / arbitrary units Fig. 1.2 (i) Describe the relationship shown in Fig. 1.2. ........................................................................................................................................... ........................................................................................................................................... ........................................................................................................................................... ........................................................................................................................................... ..................................................................................................................................... [2] (ii) ABA in rice plant cells inhibits the action of gibberellin. With reference to Fig. 1.1 and Fig. 1.2, explain the importance of ethylene production for the growth of rice plants in flooded fields. ........................................................................................................................................... ........................................................................................................................................... ........................................................................................................................................... ........................................................................................................................................... ........................................................................................................................................... ..................................................................................................................................... [3] [Total: 9]
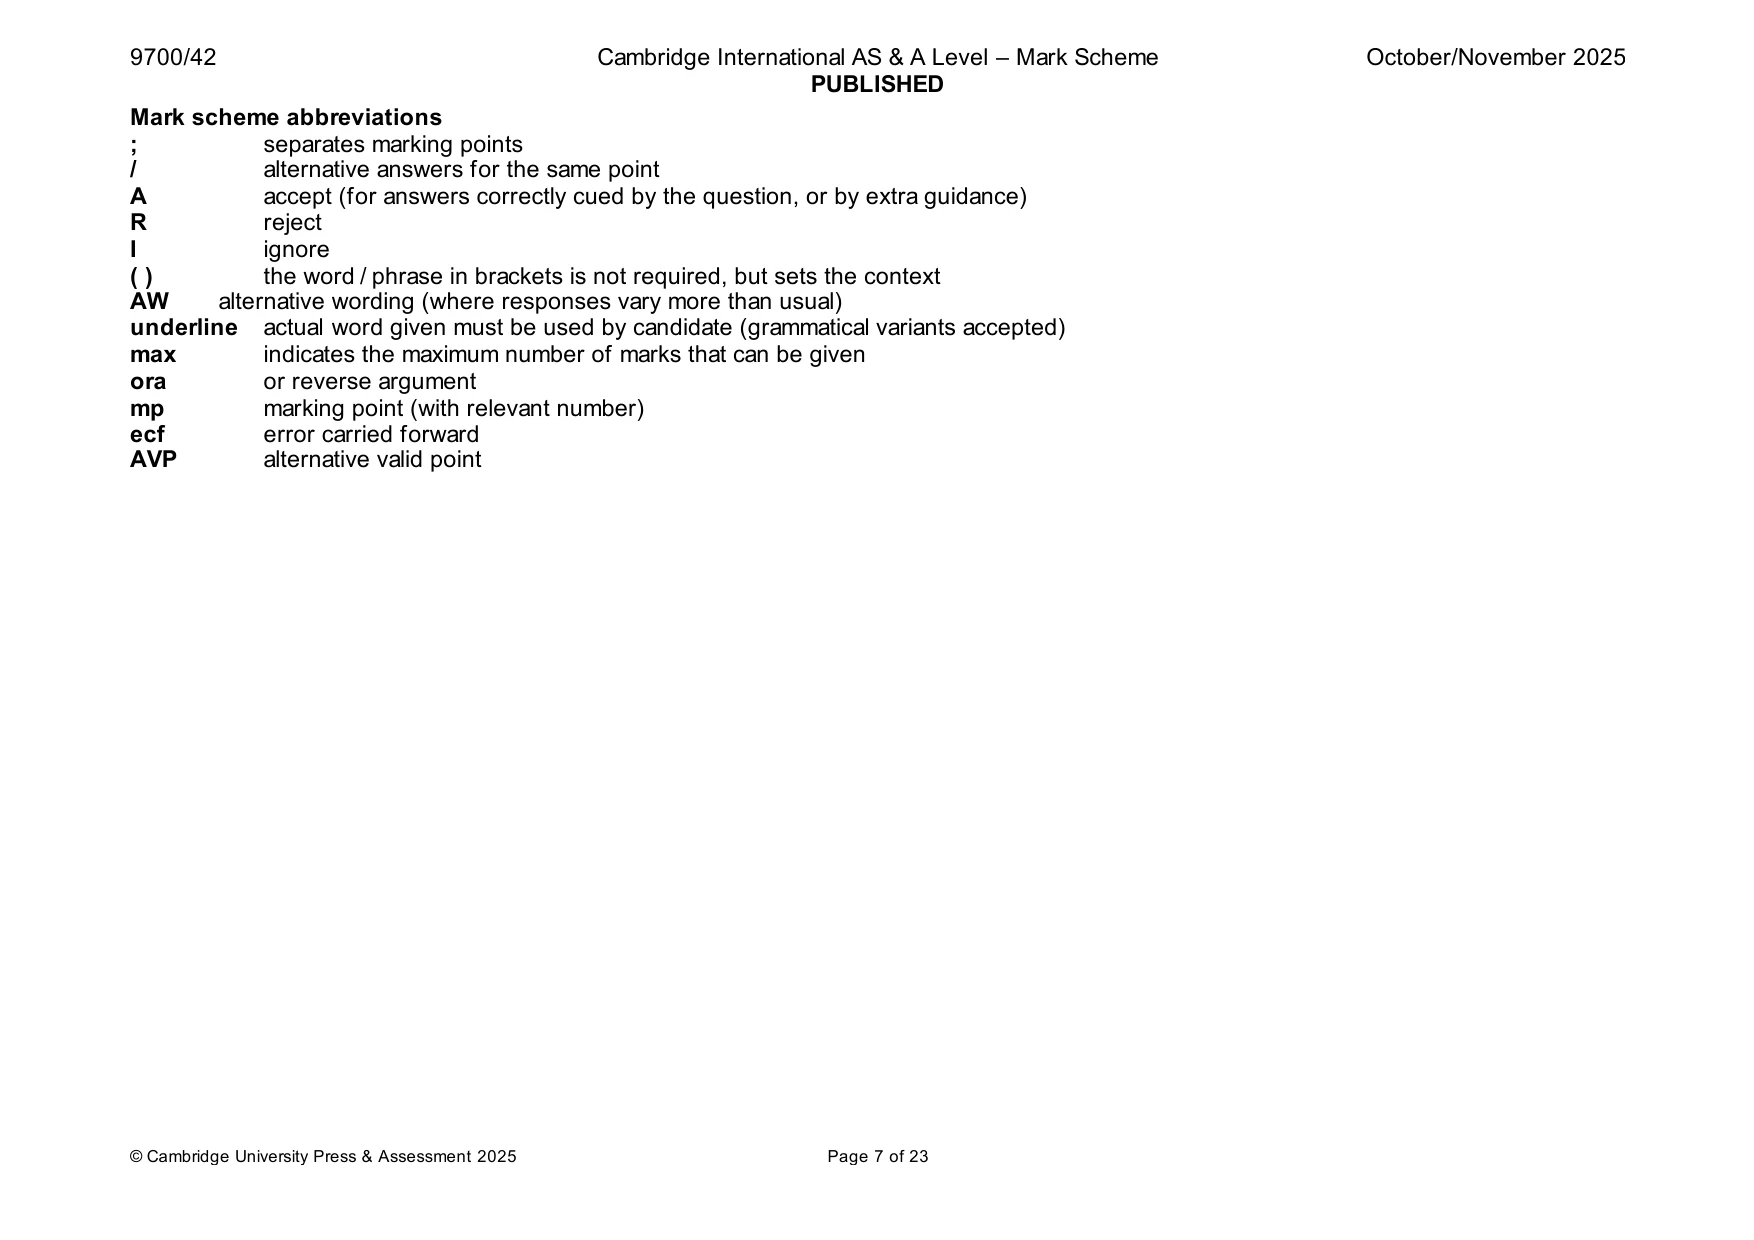
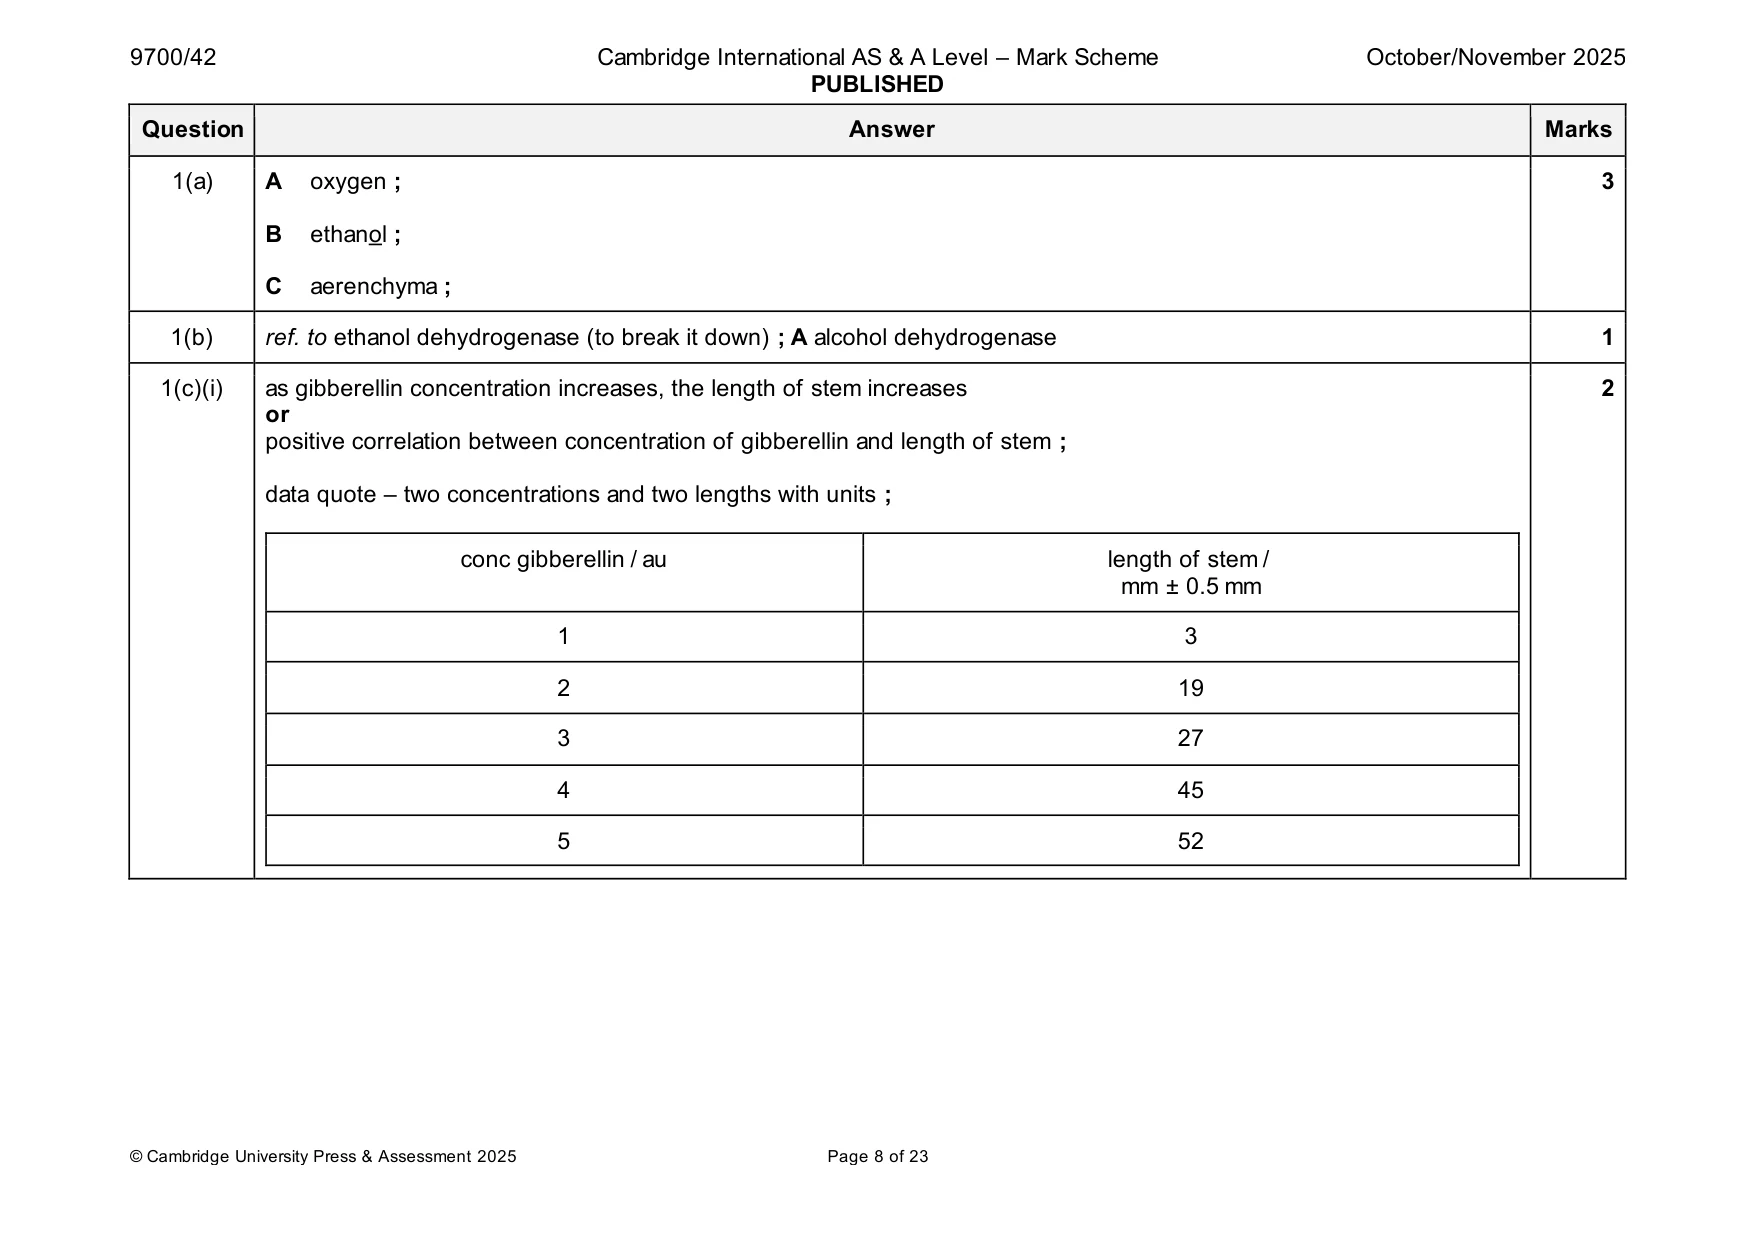
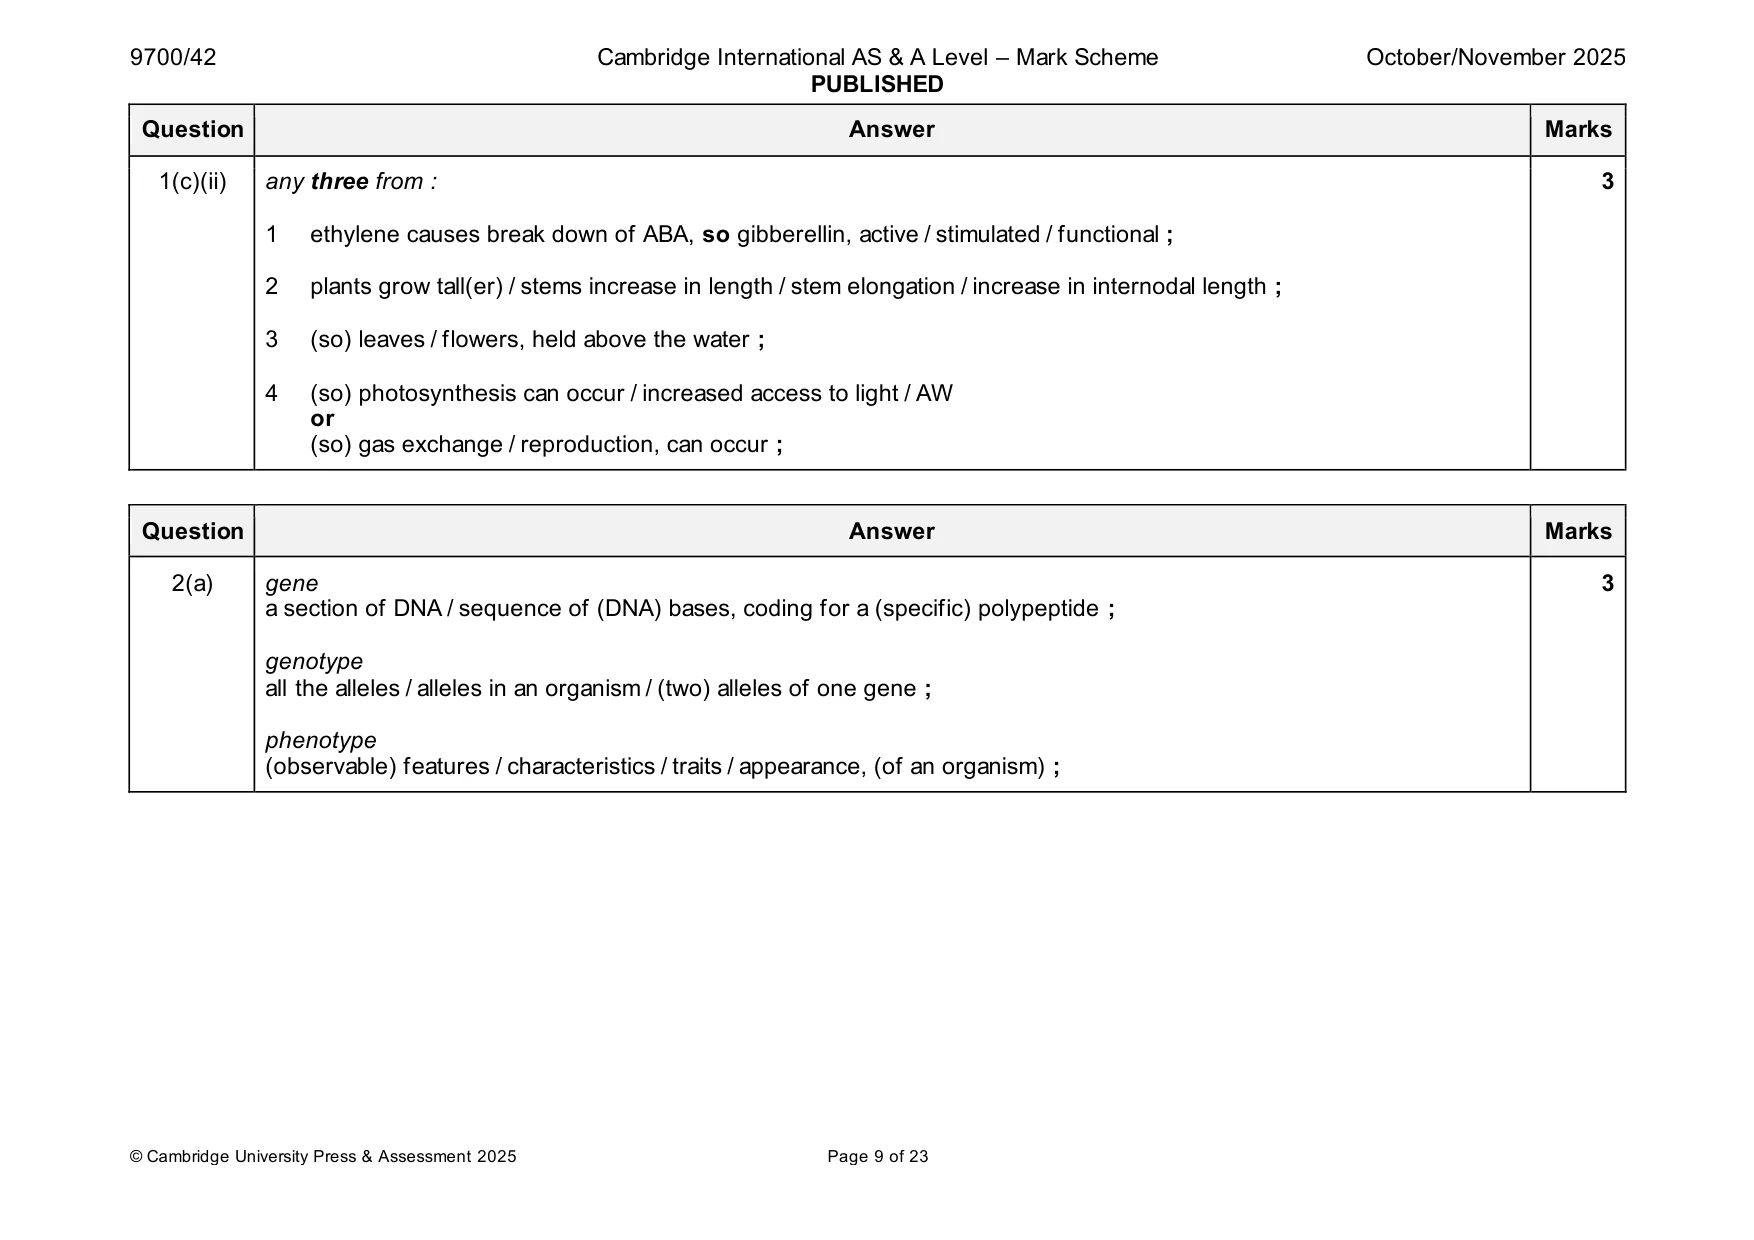
Mark scheme: Question Answer Marks 1(a) A oxygen ; 3 B ethanol ; C aerenchyma ; 1(b) ref. to ethanol dehydrogenase (to break it down) ; A alcohol dehydrogenase 1 1(c)(i) as gibberellin concentration increases, the length of stem increases 2 or positive correlation between concentration of gibberellin and length of stem ; data quote – two concentrations and two lengths with units ; conc gibberellin / au length of stem / mm ± 0.5 mm 1 3 2 19 3 27 4 45 5 52 1(c)(ii) any three from : 3 1 ethylene causes break down of ABA, so gibberellin, active / stimulated / functional ; 2 plants grow tall(er) / stems increase in length / stem elongation / increase in internodal length ; 3 (so) leaves / flowers, held above the water ; 4 (so) photosynthesis can occur / increased access to light / AW or (so) gas exchange / reproduction, can occur ;
Q2 · Explain the terms gene, genotype and phenotype
2 (a) Explain the terms gene, genotype and phenotype. gene .......................................................................................................................................... ................................................................................................................................................... genotype ................................................................................................................................... ................................................................................................................................................... phenotype ................................................................................................................................. ................................................................................................................................................... [3] (b) A monohybrid genetic cross can be carried out to produce an F1 and an F2 generation. • Outline how a monohybrid genetic cross is carried out. • State the expected percentage of each of the different offspring genotypes in the F2 generation. Assume that the inheritance pattern is for autosomal dominant and recessive alleles. ................................................................................................................................................... ................................................................................................................................................... ................................................................................................................................................... ................................................................................................................................................... ................................................................................................................................................... ................................................................................................................................................... ................................................................................................................................................... ................................................................................................................................................... ................................................................................................................................................... ............................................................................................................................................. [5] [Total: 8] Question 3 starts on page 6.
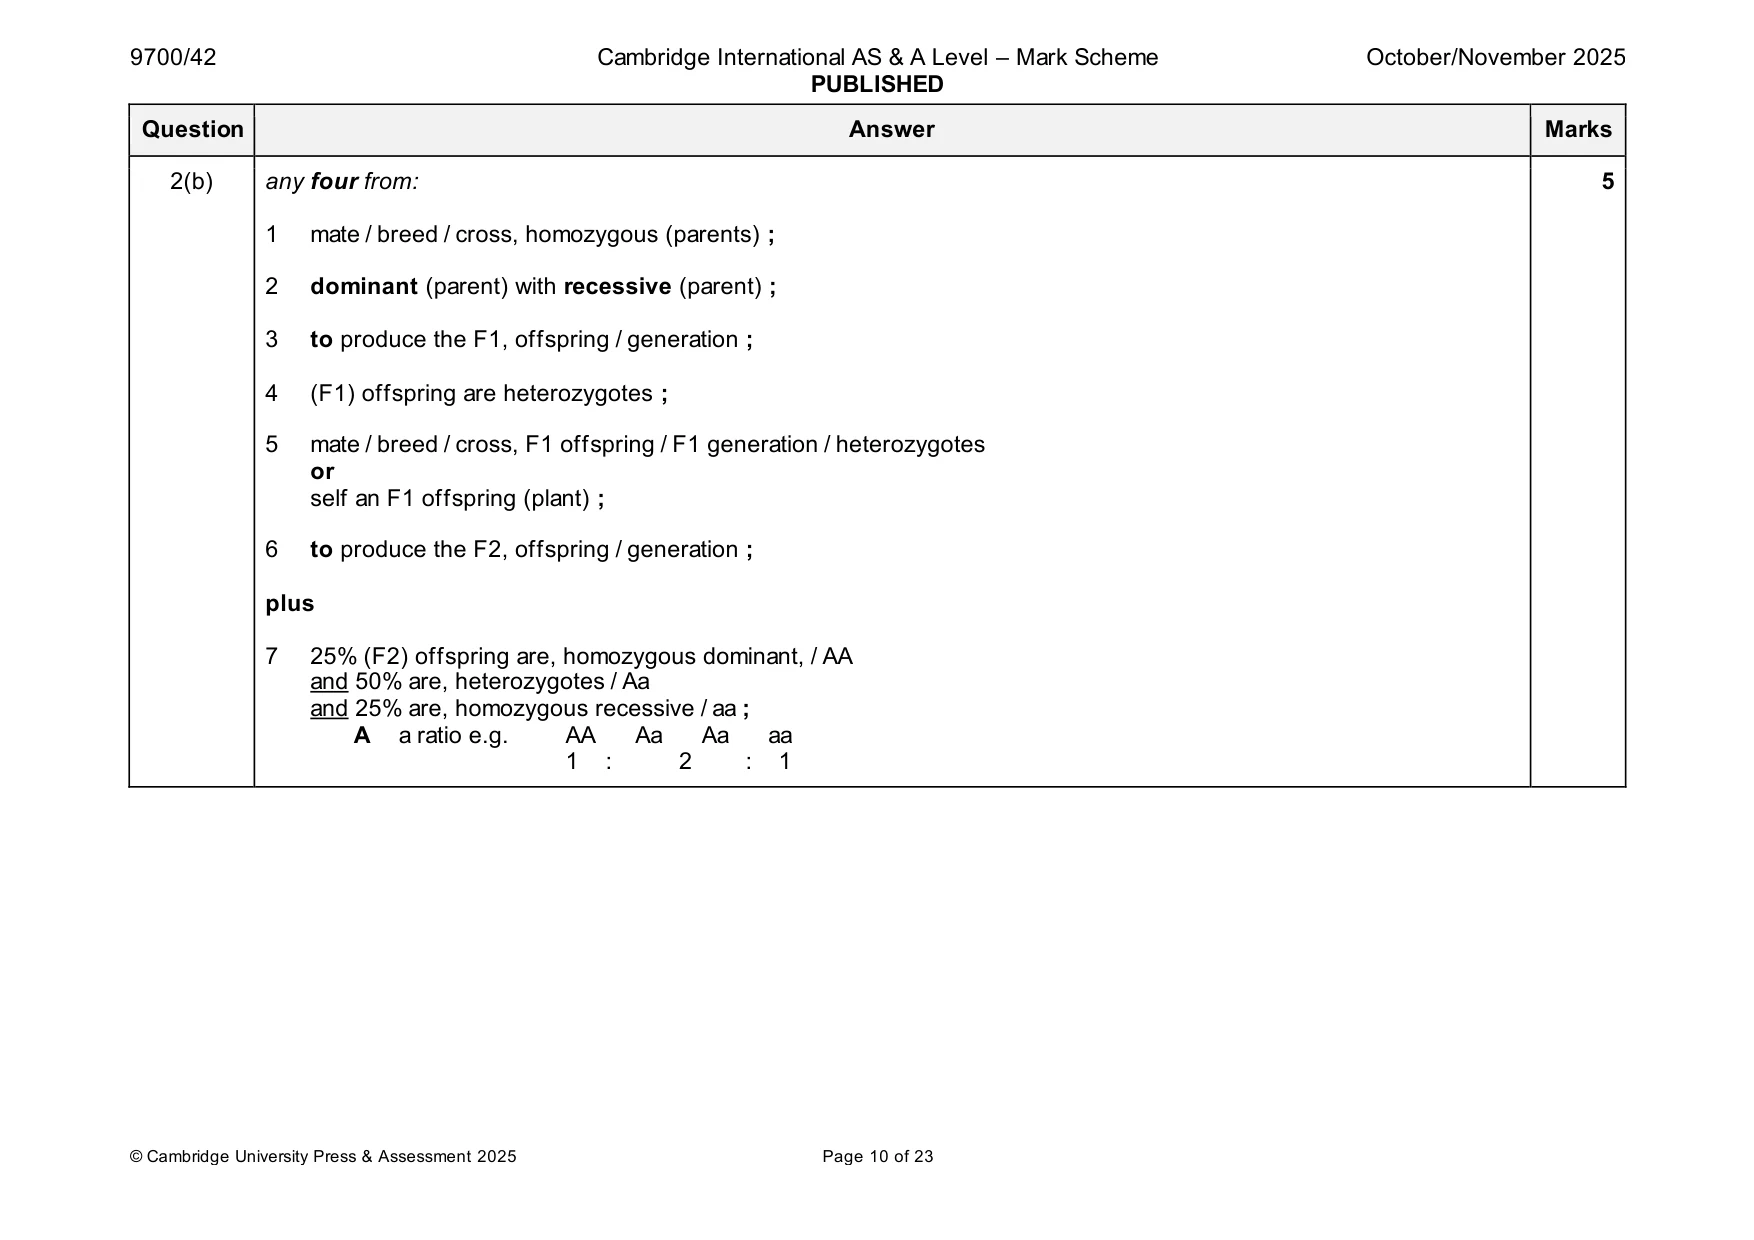
Mark scheme: 2(a) gene 3 a section of DNA / sequence of (DNA) bases, coding for a (specific) polypeptide ; genotype all the alleles / alleles in an organism / (two) alleles of one gene ; phenotype (observable) features / characteristics / traits / appearance, (of an organism) ; 2(b) any four from: 5 1 mate / breed / cross, homozygous (parents) ; 2 dominant (parent) with recessive (parent) ; 3 to produce the F1, offspring / generation ; 4 (F1) offspring are heterozygotes ; 5 mate / breed / cross, F1 offspring / F1 generation / heterozygotes or self an F1 offspring (plant) ; 6 to produce the F2, offspring / generation ; plus 7 25% (F2) offspring are, homozygous dominant, / AA and 50% are, heterozygotes / Aa and 25% are, homozygous recessive / aa ; A a ratio e.g. AA Aa Aa aa 1 : 2 : 1
More questions on Passage of information from parents to offspring
Q3 · The lac operon is present in the genome of the bacterium Escherichia coli
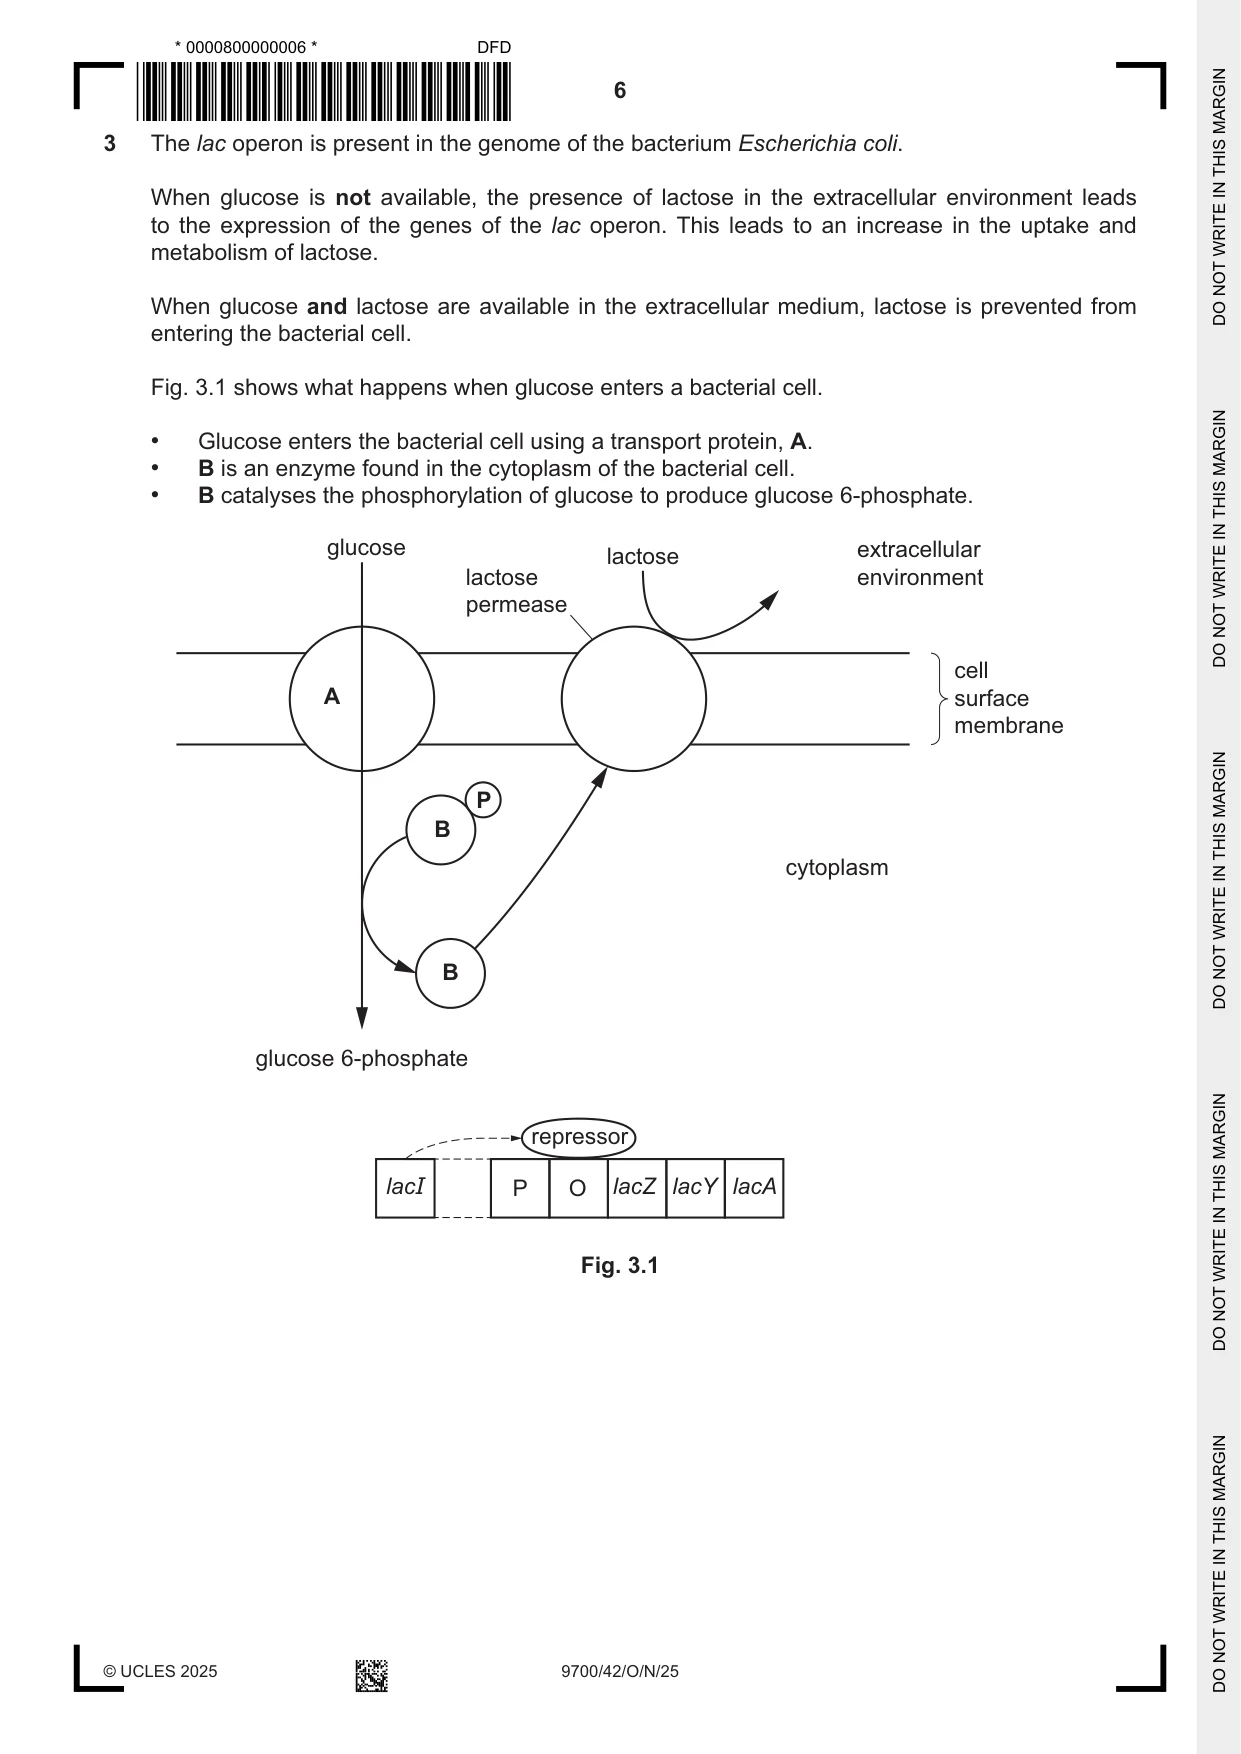
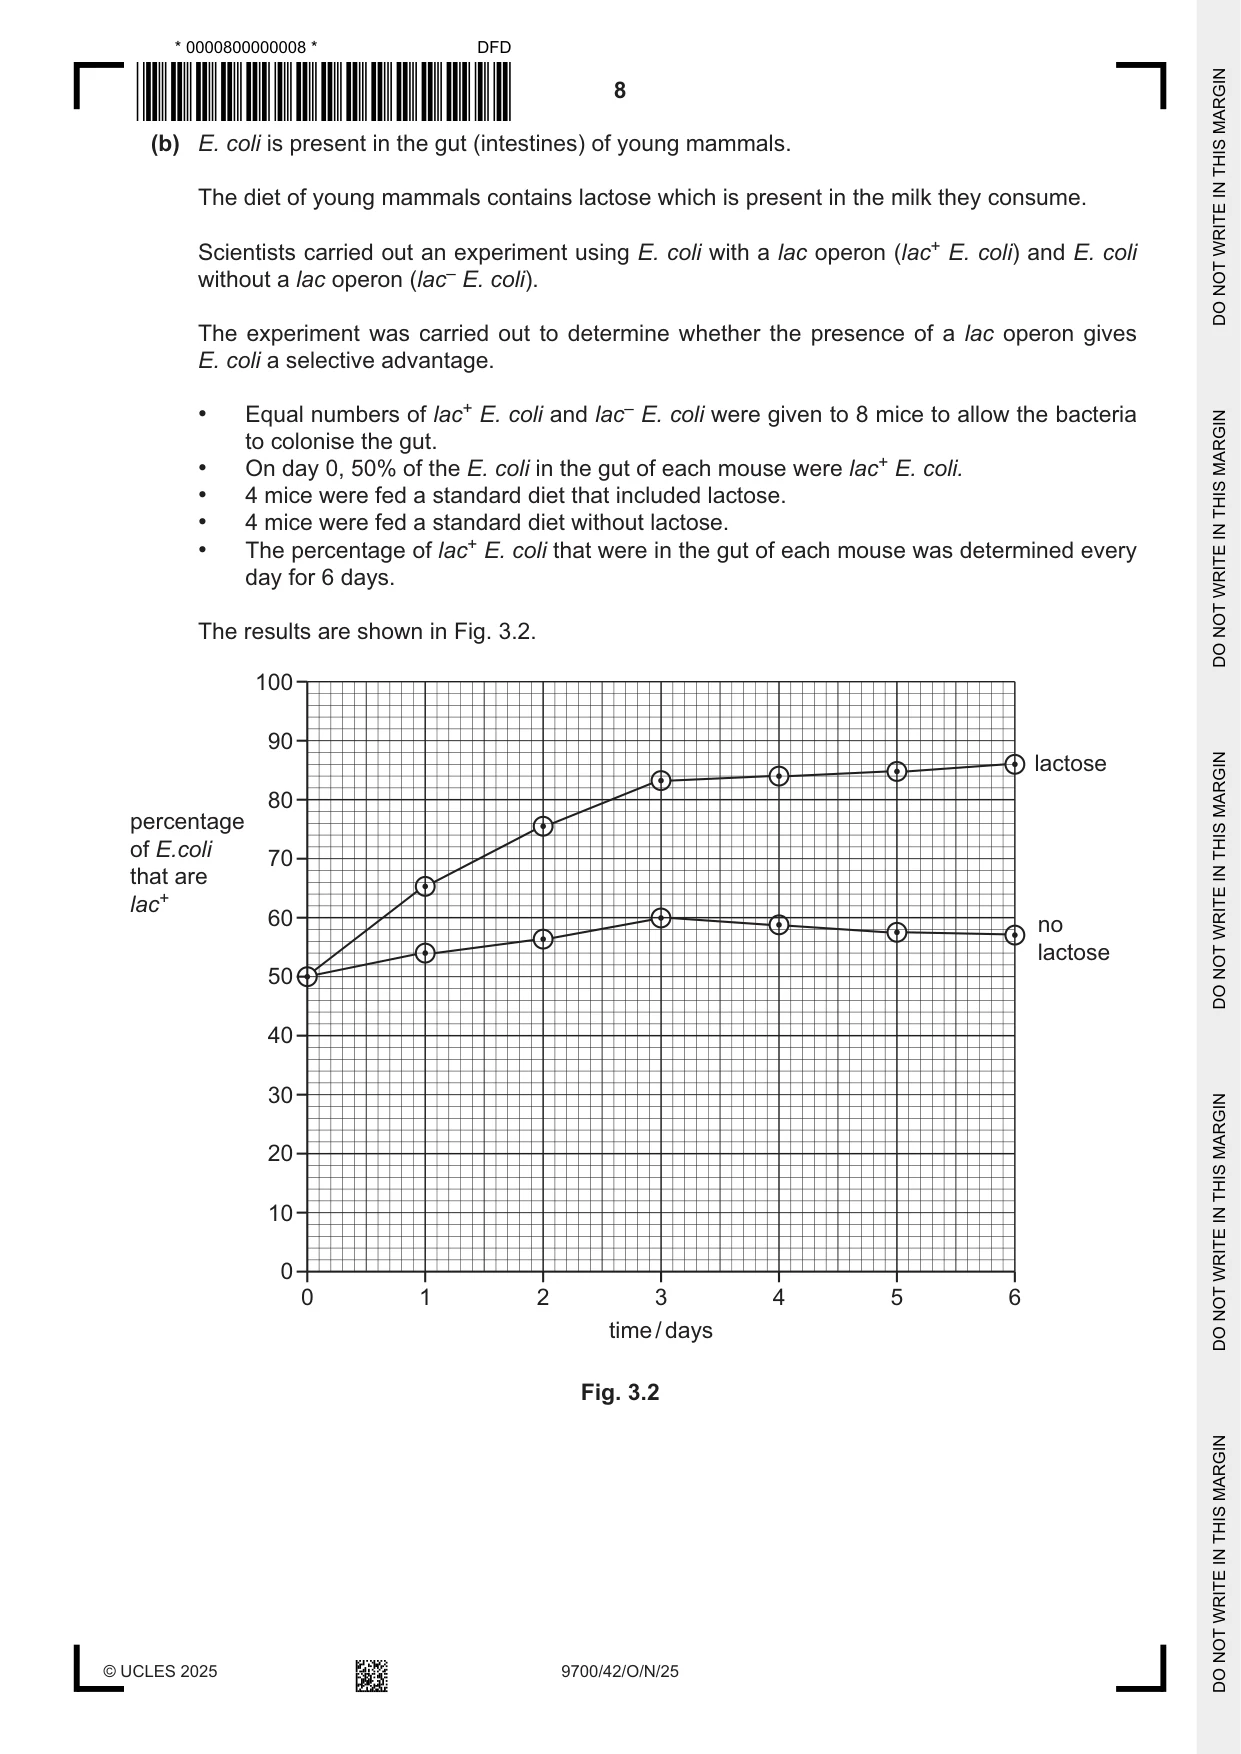
3 The lac operon is present in the genome of the bacterium Escherichia coli. When glucose is not available, the presence of lactose in the extracellular environment leads to the expression of the genes of the lac operon. This leads to an increase in the uptake and metabolism of lactose. When glucose and lactose are available in the extracellular medium, lactose is prevented from entering the bacterial cell. Fig. 3.1 shows what happens when glucose enters a bacterial cell. • Glucose enters the bacterial cell using a transport protein, A. • B is an enzyme found in the cytoplasm of the bacterial cell. • B catalyses the phosphorylation of glucose to produce glucose 6‑phosphate. glucose extracellular lactose lactose environment permease cell A surface membrane P B cytoplasm B glucose 6-phosphate repressor lacI P O lacZ lacY lacA Fig. 3.1 (a) (i) With reference to Fig. 3.1, suggest and explain how the presence of glucose in the extracellular environment prevents lactose entering the bacterial cell. ........................................................................................................................................... ........................................................................................................................................... ........................................................................................................................................... ........................................................................................................................................... ........................................................................................................................................... ........................................................................................................................................... ........................................................................................................................................... ..................................................................................................................................... [3] (ii) Suggest the advantages for the bacterial cell in preventing the entry of lactose when glucose is present in the extracellular environment. ........................................................................................................................................... ........................................................................................................................................... ........................................................................................................................................... ........................................................................................................................................... ..................................................................................................................................... [2] (iii) The glucose 6‑phosphate in the cytoplasm of the bacterial cell is used to produce fructose 1,6‑bisphosphate. Fructose 1,6‑bisphosphate is used in glycolysis. Outline the events that occur in glycolysis following the production of fructose 1,6‑bisphosphate. ........................................................................................................................................... ........................................................................................................................................... ........................................................................................................................................... ........................................................................................................................................... ........................................................................................................................................... ........................................................................................................................................... ........................................................................................................................................... ..................................................................................................................................... [3] (b) E. coli is present in the gut (intestines) of young mammals. The diet of young mammals contains lactose which is present in the milk they consume. Scientists carried out an experiment using E. coli with a lac operon (lac+ E. coli) and E. coli without a lac operon (lac– E. coli). The experiment was carried out to determine whether the presence of a lac operon gives E. coli a selective advantage. • Equal numbers of lac+ E. coli and lac– E. coli were given to 8 mice to allow the bacteria to colonise the gut. • On day 0, 50% of the E. coli in the gut of each mouse were lac+ E. coli. • 4 mice were fed a standard diet that included lactose. • 4 mice were fed a standard diet without lactose. • The percentage of lac+ E. coli that were in the gut of each mouse was determined every day for 6 days. The results are shown in Fig. 3.2. 100 90 lactose 80 percentage of E.coli 70 that are lac+ 60 no lactose 50 40 30 20 10 0 0 1 2 3 4 5 6 time / days Fig. 3.2 (i) With reference to Fig. 3.2, describe the effect of the different diets on the percentage of E. coli that are lac+. ........................................................................................................................................... ........................................................................................................................................... ........................................................................................................................................... ........................................................................................................................................... ..................................................................................................................................... [2] (ii) The scientists concluded that lac+ E. coli had a selective advantage when colonising the gut, but only in the presence of lactose. Suggest why the presence of lactose caused lac+ E. coli to have a selective advantage. ........................................................................................................................................... ........................................................................................................................................... ........................................................................................................................................... ........................................................................................................................................... ........................................................................................................................................... ..................................................................................................................................... [2] [Total: 12]
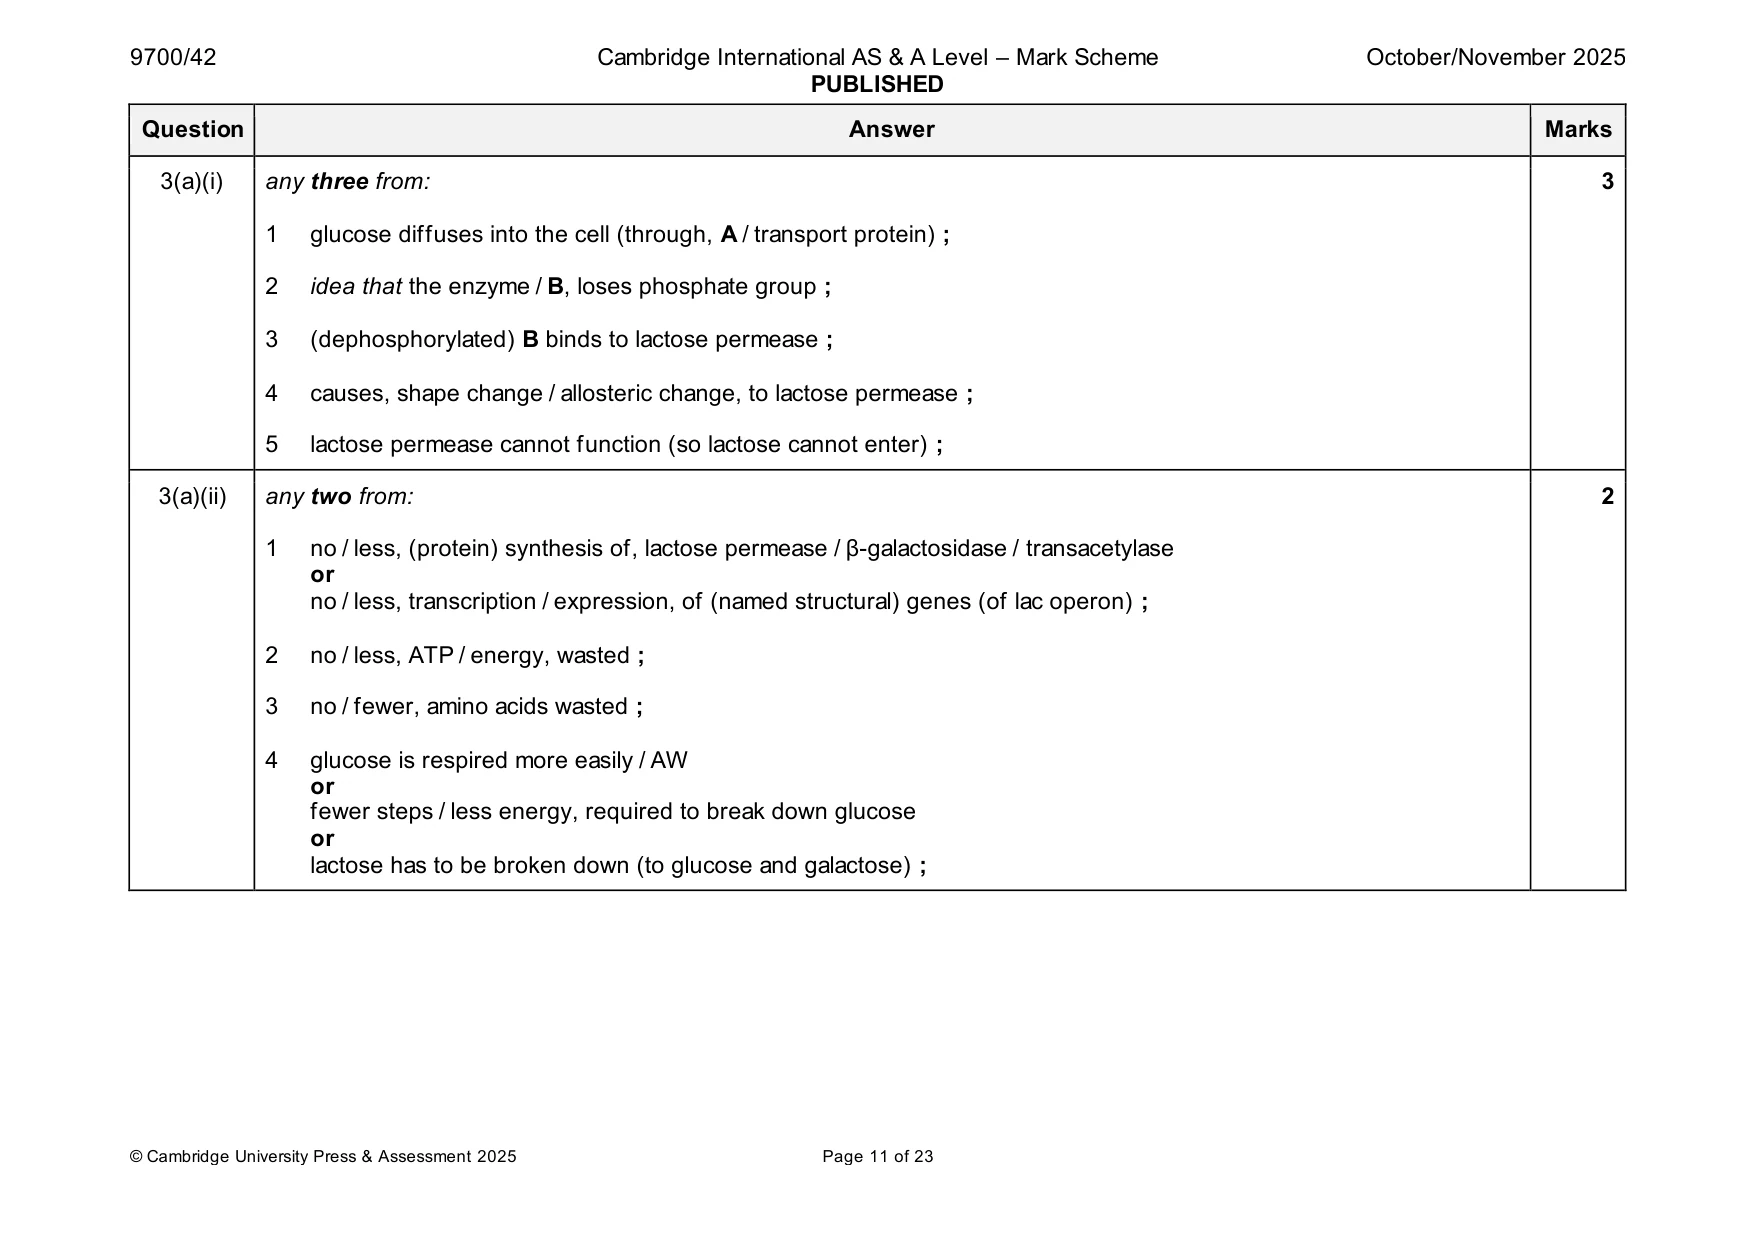
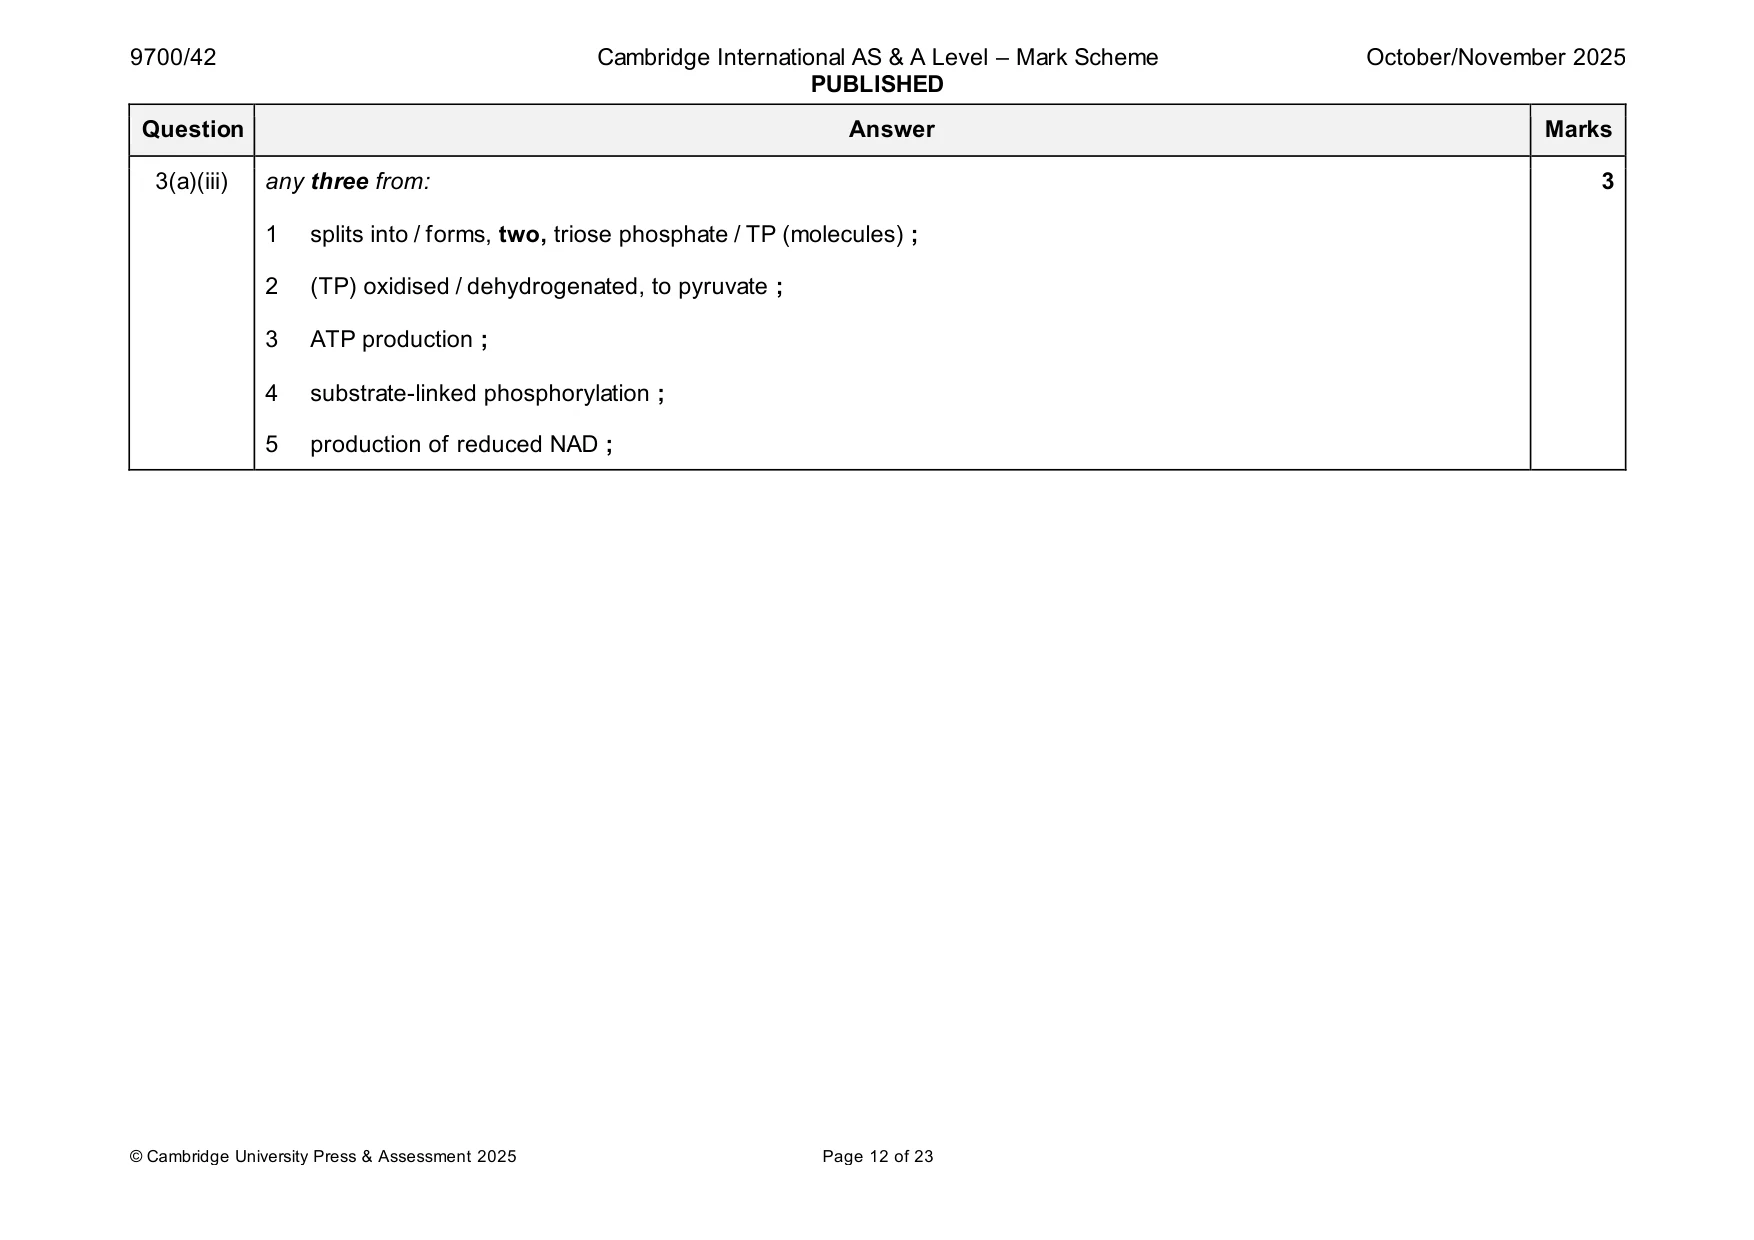
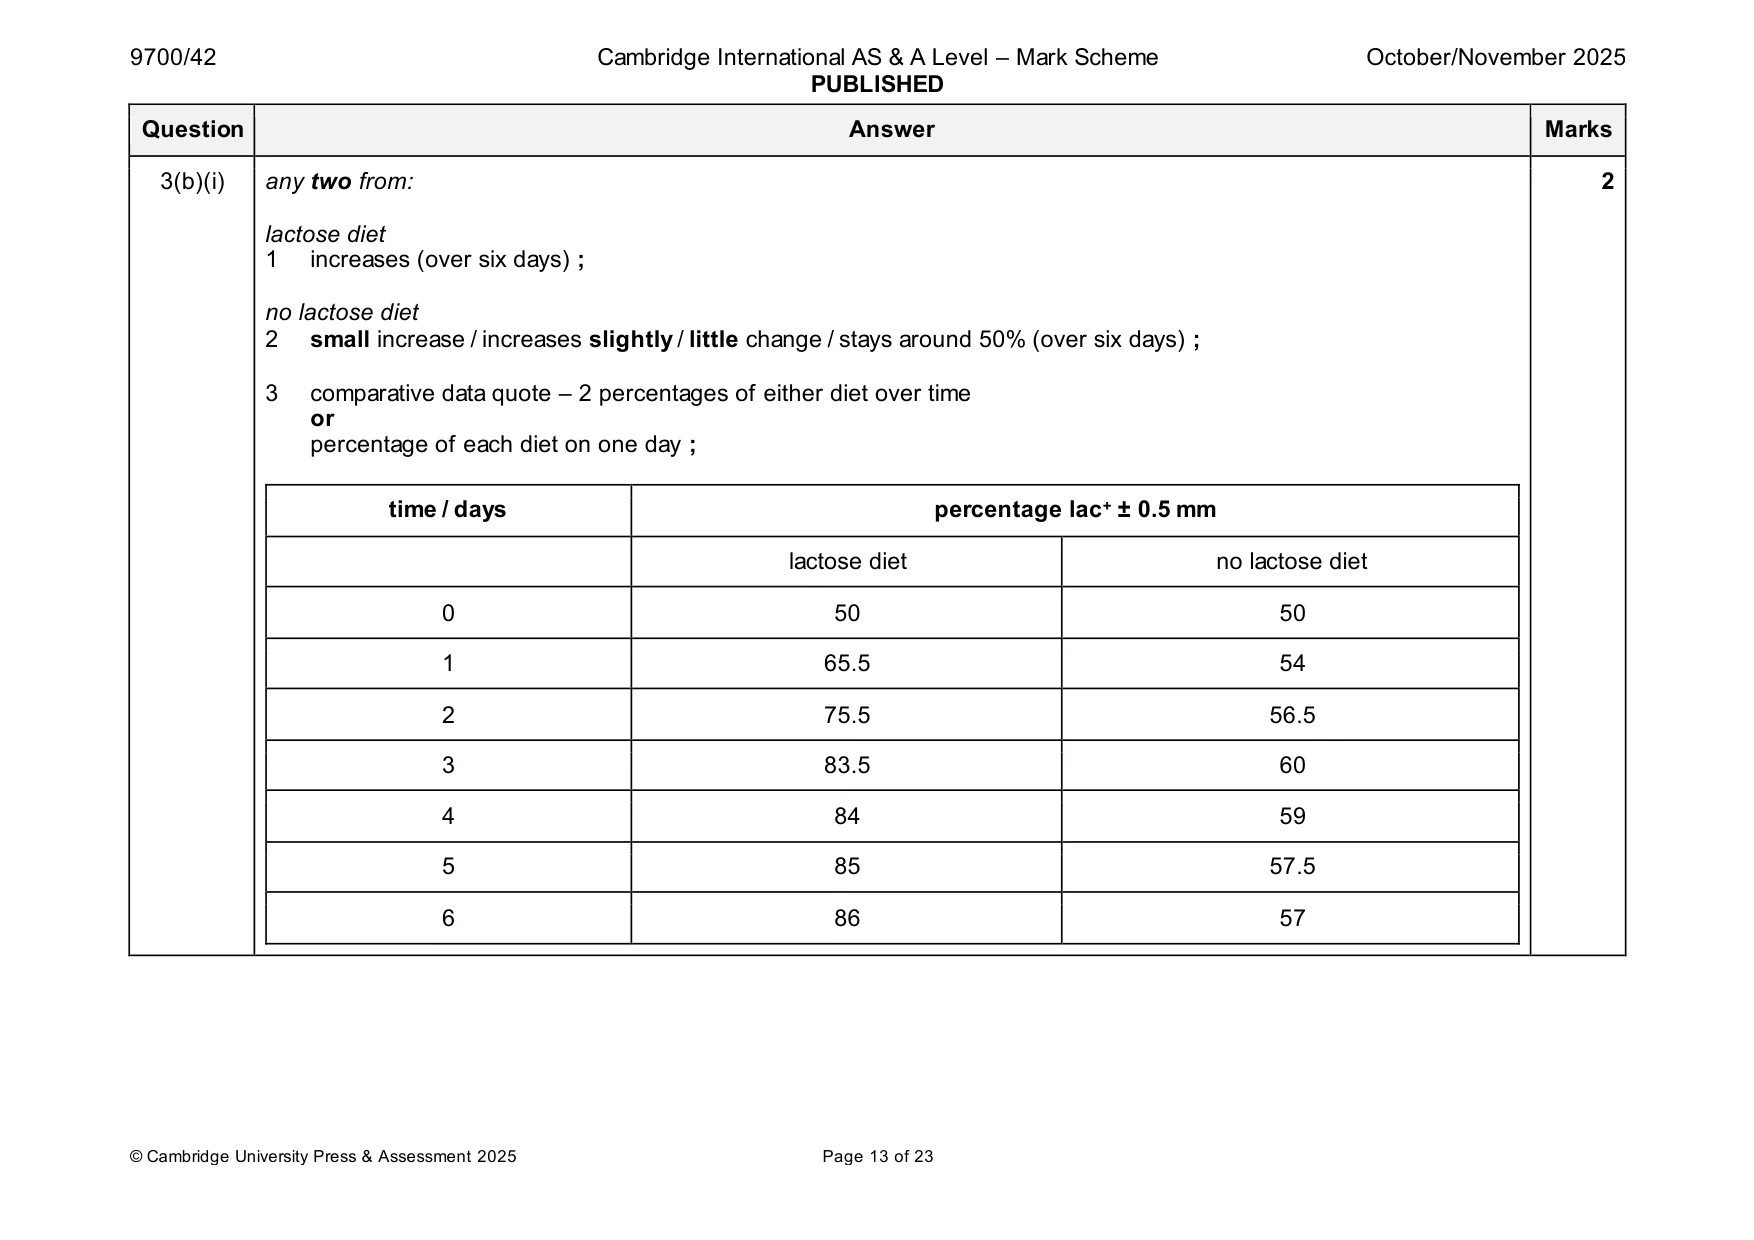
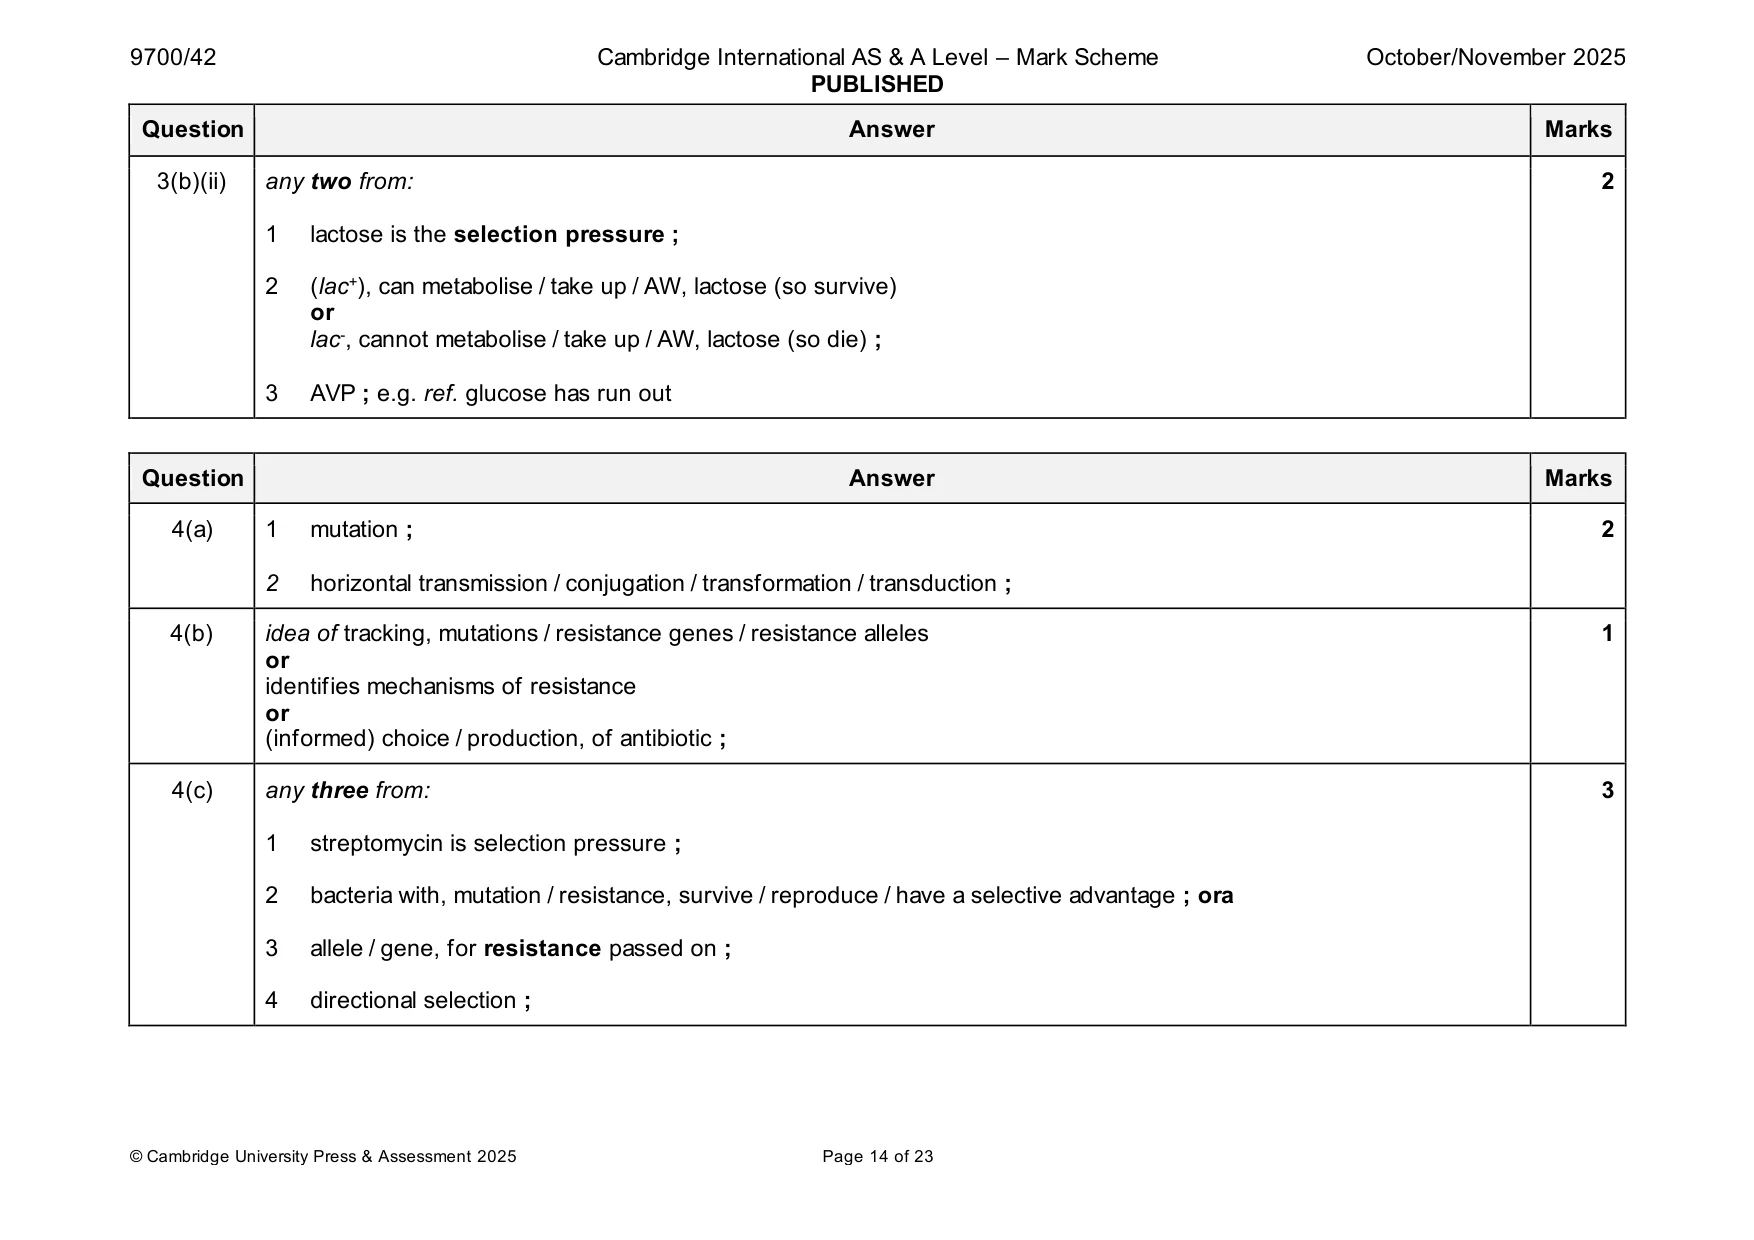
Mark scheme: 3(a)(i) any three from: 3 1 glucose diffuses into the cell (through, A / transport protein) ; 2 idea that the enzyme / B, loses phosphate group ; 3 (dephosphorylated) B binds to lactose permease ; 4 causes, shape change / allosteric change, to lactose permease ; 5 lactose permease cannot function (so lactose cannot enter) ; 3(a)(ii) any two from: 2 1 no / less, (protein) synthesis of, lactose permease / β-galactosidase / transacetylase or no / less, transcription / expression, of (named structural) genes (of lac operon) ; 2 no / less, ATP / energy, wasted ; 3 no / fewer, amino acids wasted ; 4 glucose is respired more easily / AW or fewer steps / less energy, required to break down glucose or lactose has to be broken down (to glucose and galactose) ; 3(a)(iii) any three from: 3 1 splits into / forms, two, triose phosphate / TP (molecules) ; 2 (TP) oxidised / dehydrogenated, to pyruvate ; 3 ATP production ; 4 substrate-linked phosphorylation ; 5 production of reduced NAD ; 3(b)(i) any two from: 2 lactose diet 1 increases (over six days) ; no lactose diet 2 small increase / increases slightly / little change / stays around 50% (over six days) ; 3 comparative data quote – 2 percentages of either diet over time or percentage of each diet on one day ; time / days percentage lac+ ± 0.5 mm lactose diet no lactose diet 0 50 50 1 65.5 54 2 75.5 56.5 3 83.5 60 4 84 59 5 85 57.5 6 86 57 3(b)(ii) any two from: 2 1 lactose is the selection pressure ; 2 (lac+), can metabolise / take up / AW, lactose (so survive) or lac-, cannot metabolise / take up / AW, lactose (so die) ; 3 AVP ; e.g. ref. glucose has run out
Q4 · The evolution of antibiotic resistance in bacteria has occurred as a result of natural…
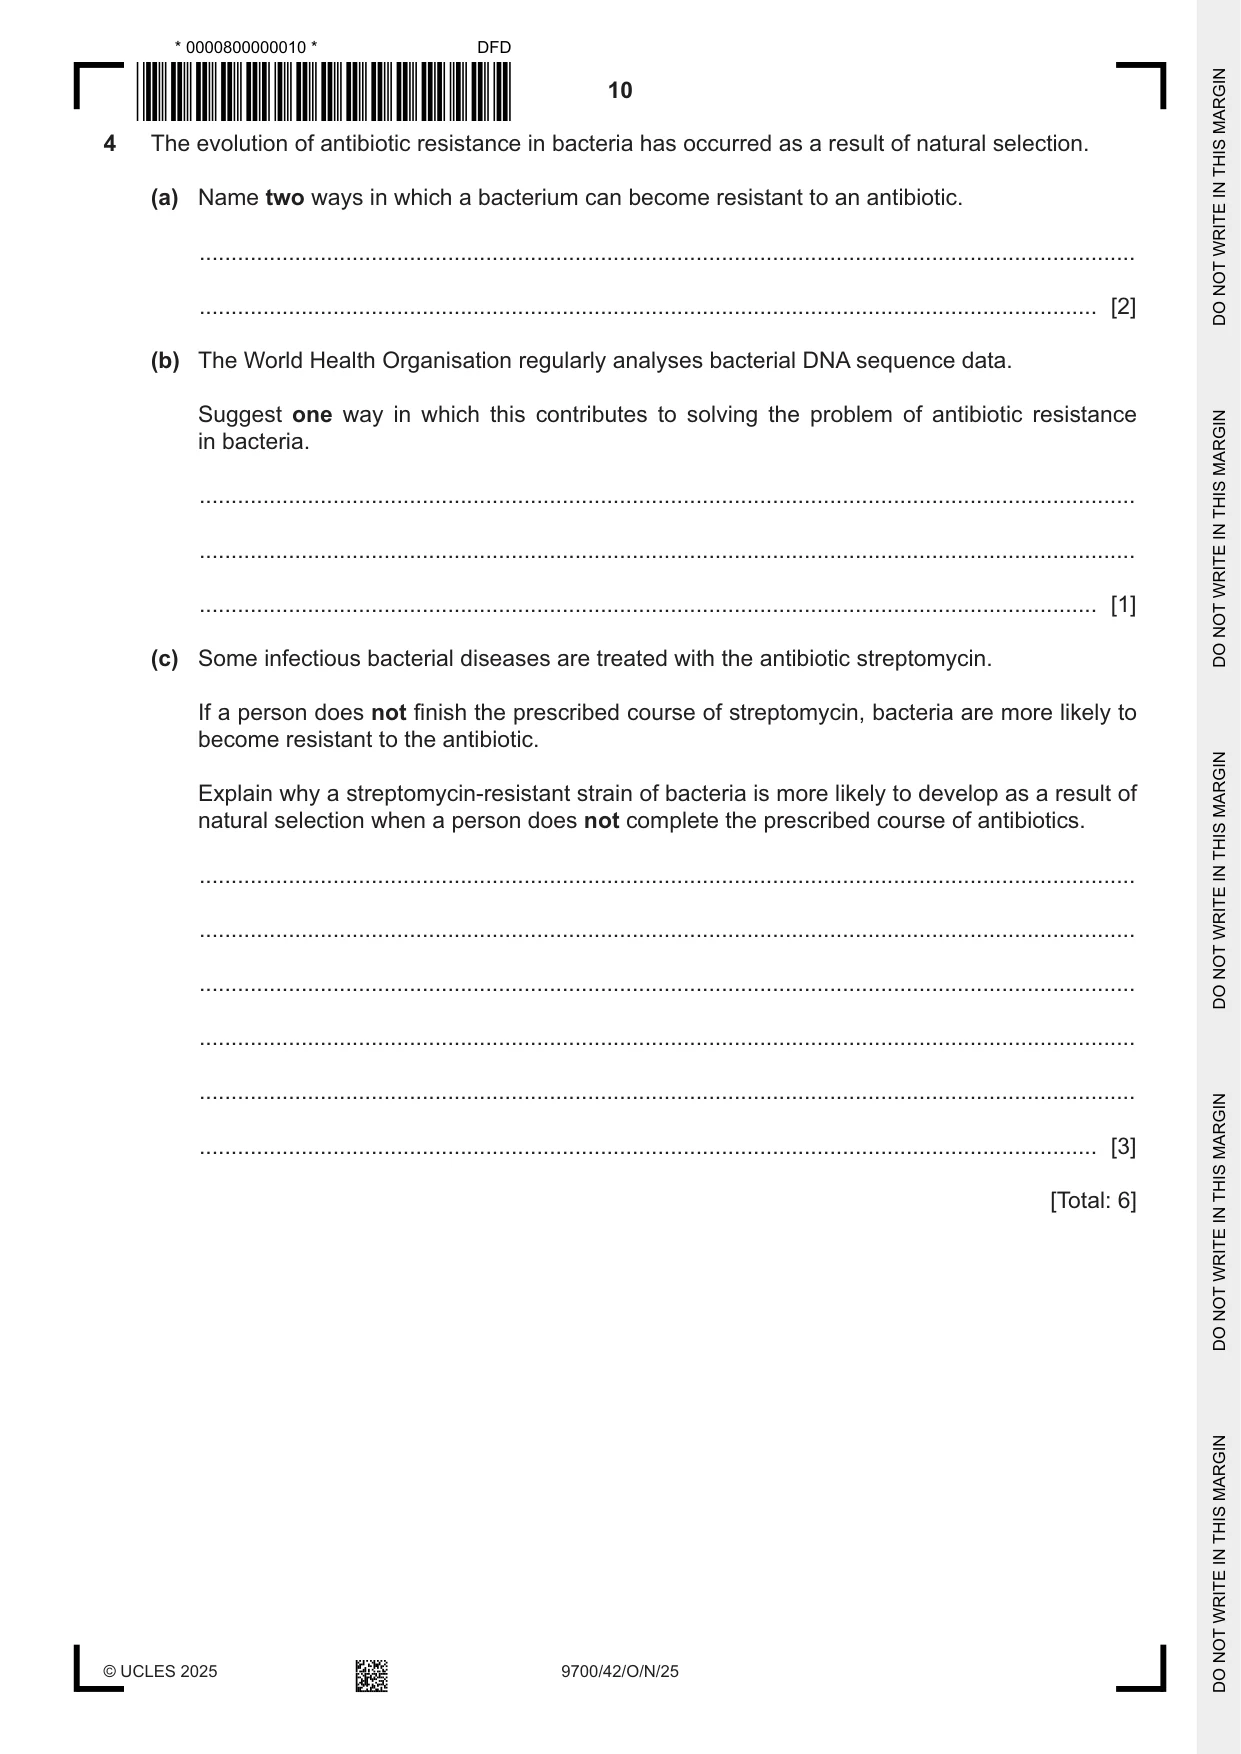
4 The evolution of antibiotic resistance in bacteria has occurred as a result of natural selection. (a) Name two ways in which a bacterium can become resistant to an antibiotic. ................................................................................................................................................... ............................................................................................................................................. [2] (b) The World Health Organisation regularly analyses bacterial DNA sequence data. Suggest one way in which this contributes to solving the problem of antibiotic resistance in bacteria. ................................................................................................................................................... ................................................................................................................................................... ............................................................................................................................................. [1] (c) Some infectious bacterial diseases are treated with the antibiotic streptomycin. If a person does not finish the prescribed course of streptomycin, bacteria are more likely to become resistant to the antibiotic. Explain why a streptomycin‑resistant strain of bacteria is more likely to develop as a result of natural selection when a person does not complete the prescribed course of antibiotics. ................................................................................................................................................... ................................................................................................................................................... ................................................................................................................................................... ................................................................................................................................................... ................................................................................................................................................... ............................................................................................................................................. [3] [Total: 6] Question 5 starts on page 12.
Mark scheme: 4(a) 1 mutation ; 2 2 horizontal transmission / conjugation / transformation / transduction ; 4(b) idea of tracking, mutations / resistance genes / resistance alleles 1 or identifies mechanisms of resistance or (informed) choice / production, of antibiotic ; 4(c) any three from: 3 1 streptomycin is selection pressure ; 2 bacteria with, mutation / resistance, survive / reproduce / have a selective advantage ; ora 3 allele / gene, for resistance passed on ; 4 directional selection ;
Q5 · Metachromatic leukodystrophy (MLD) is a genetic disease that affects the nervous system
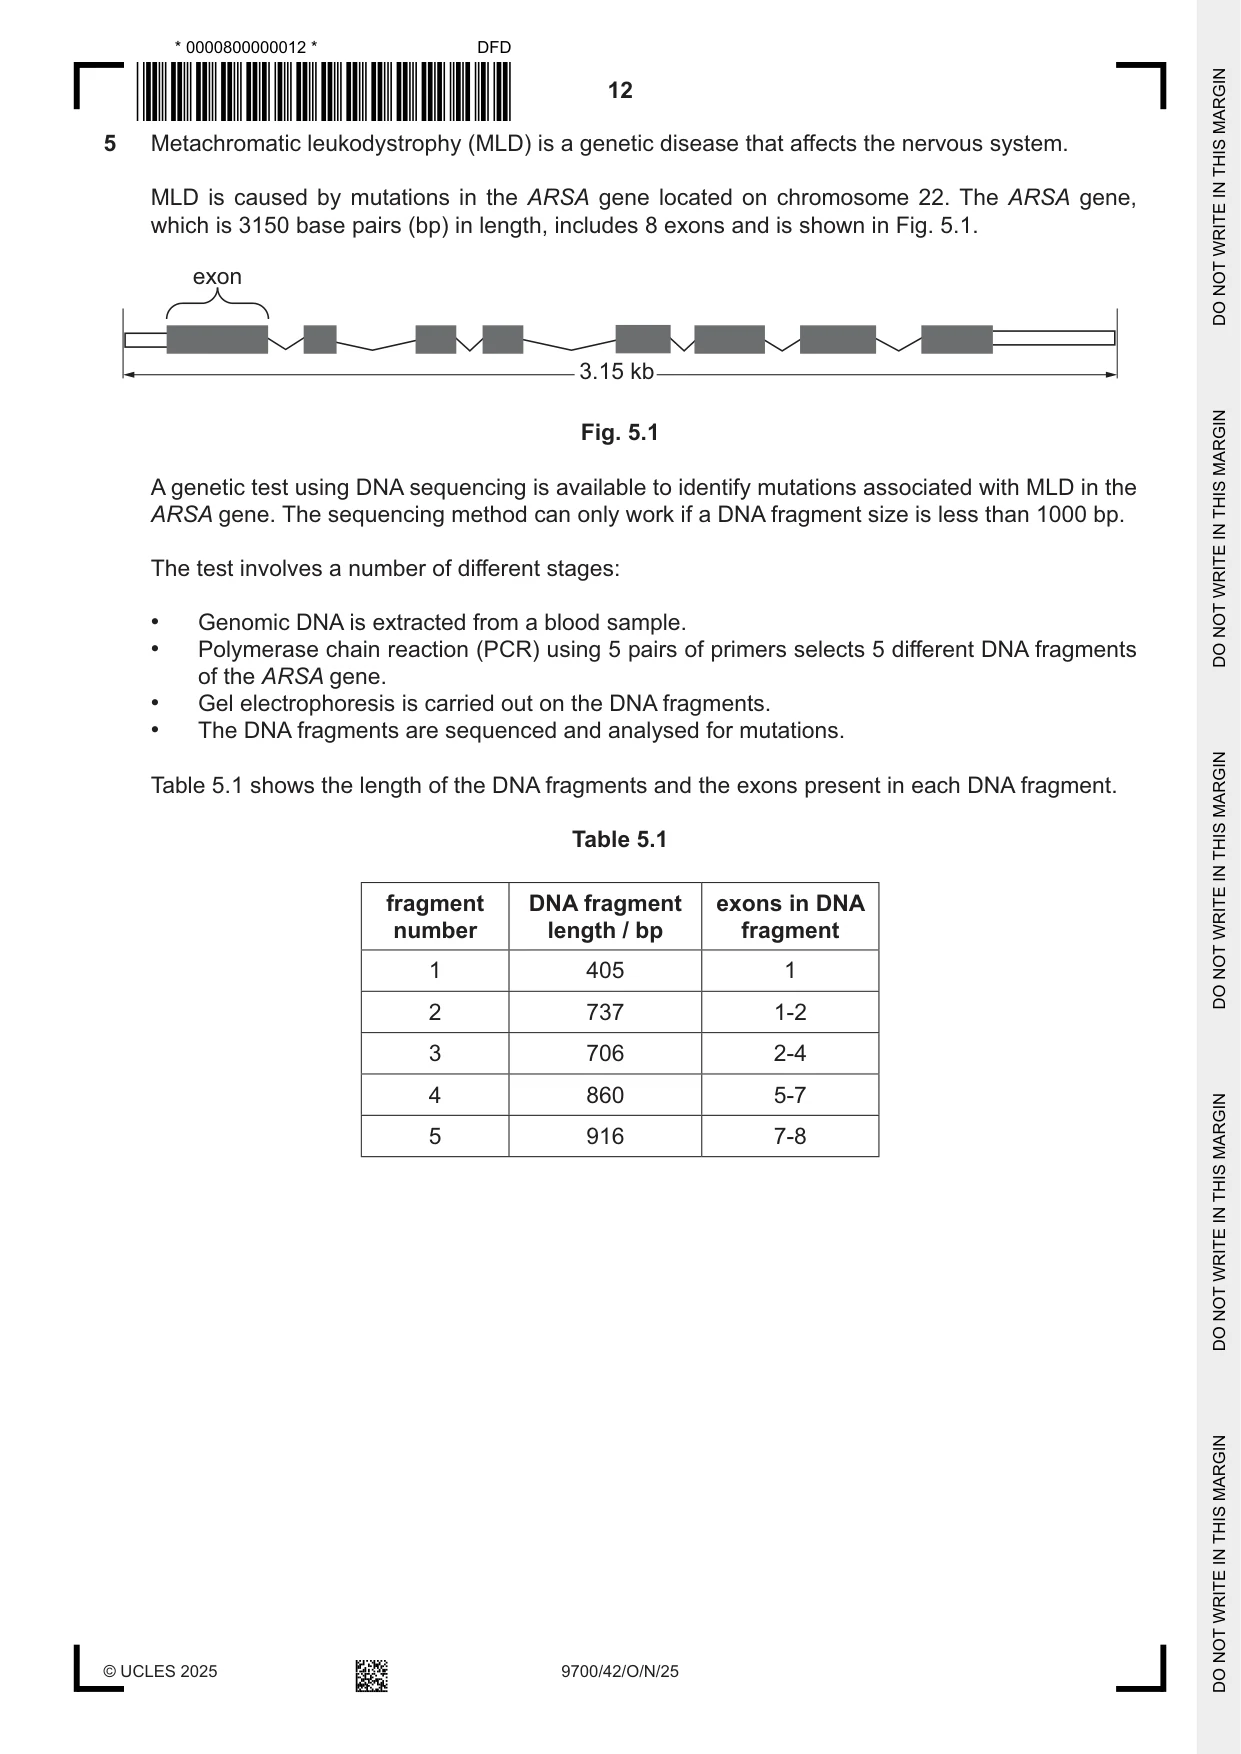
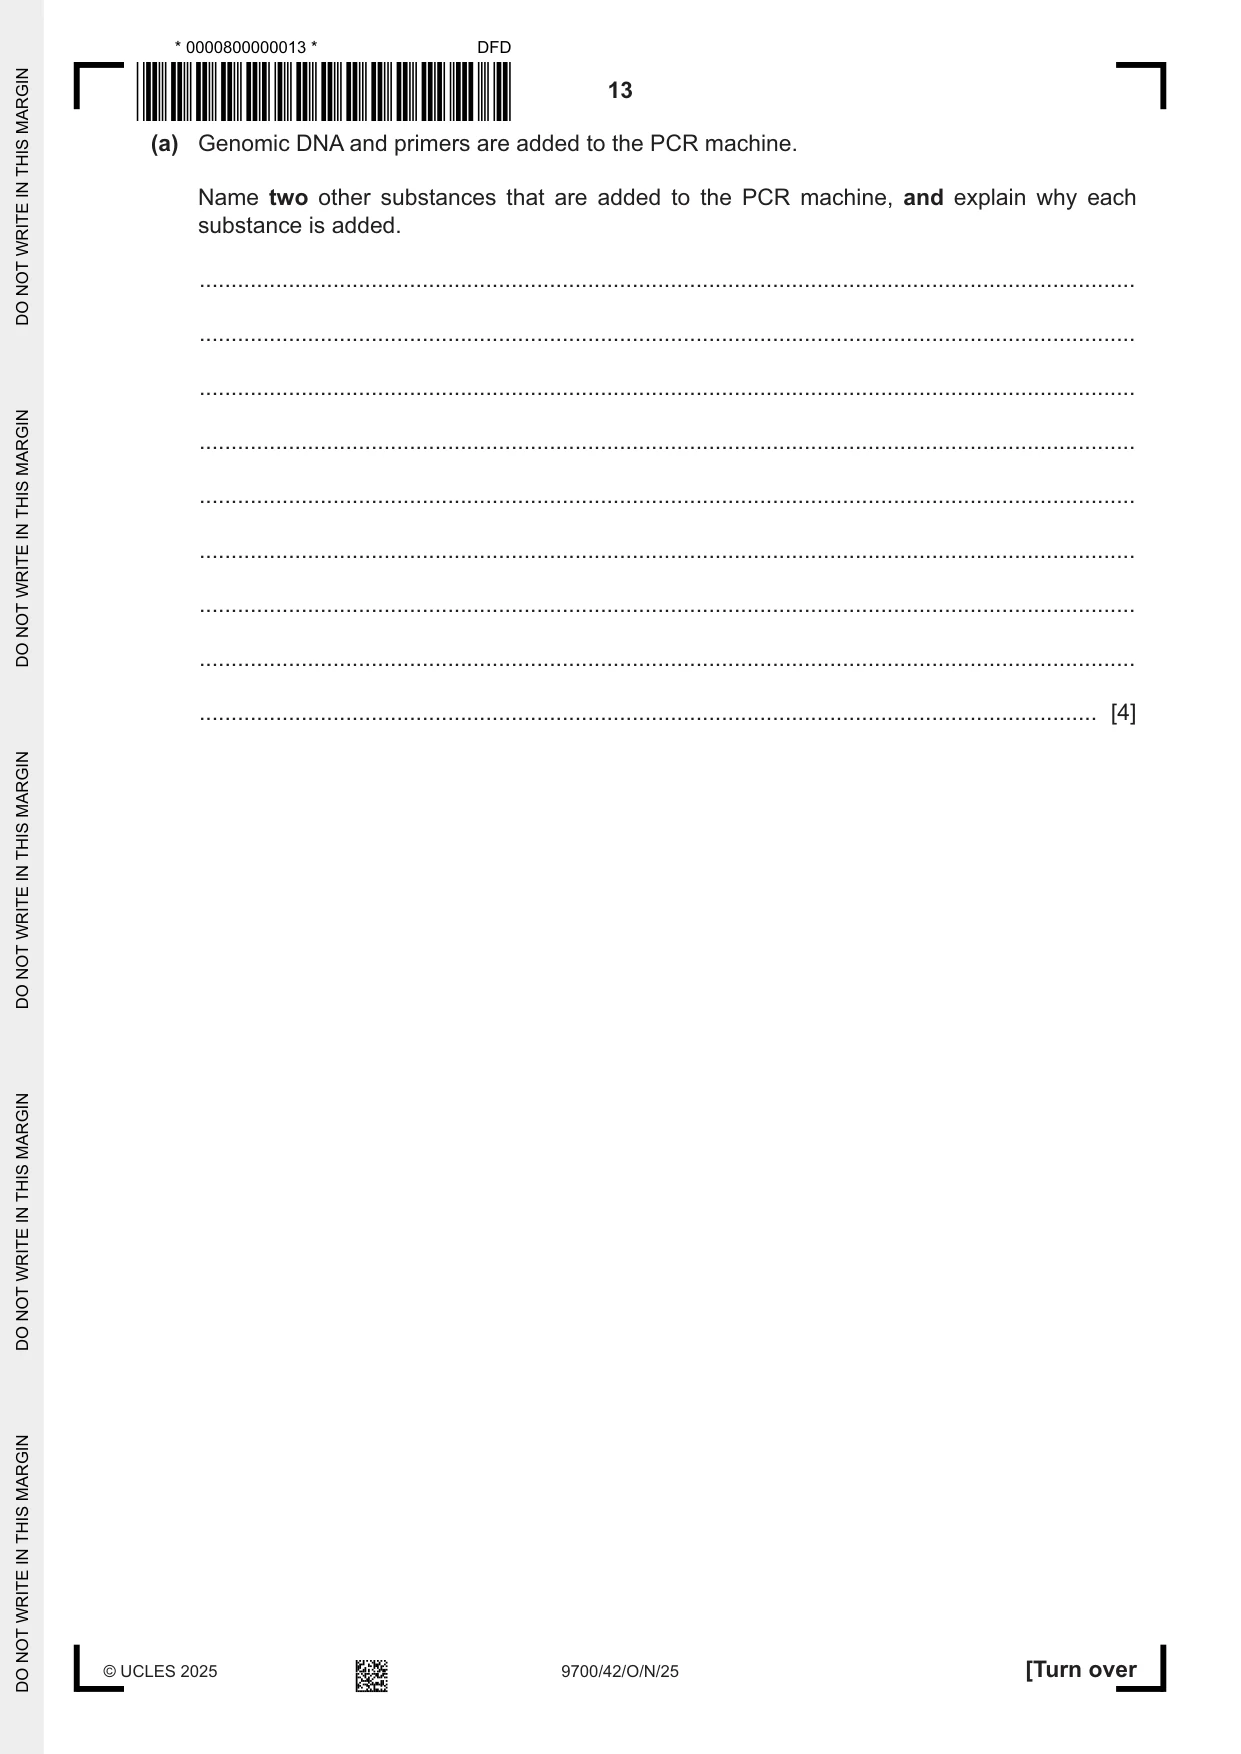
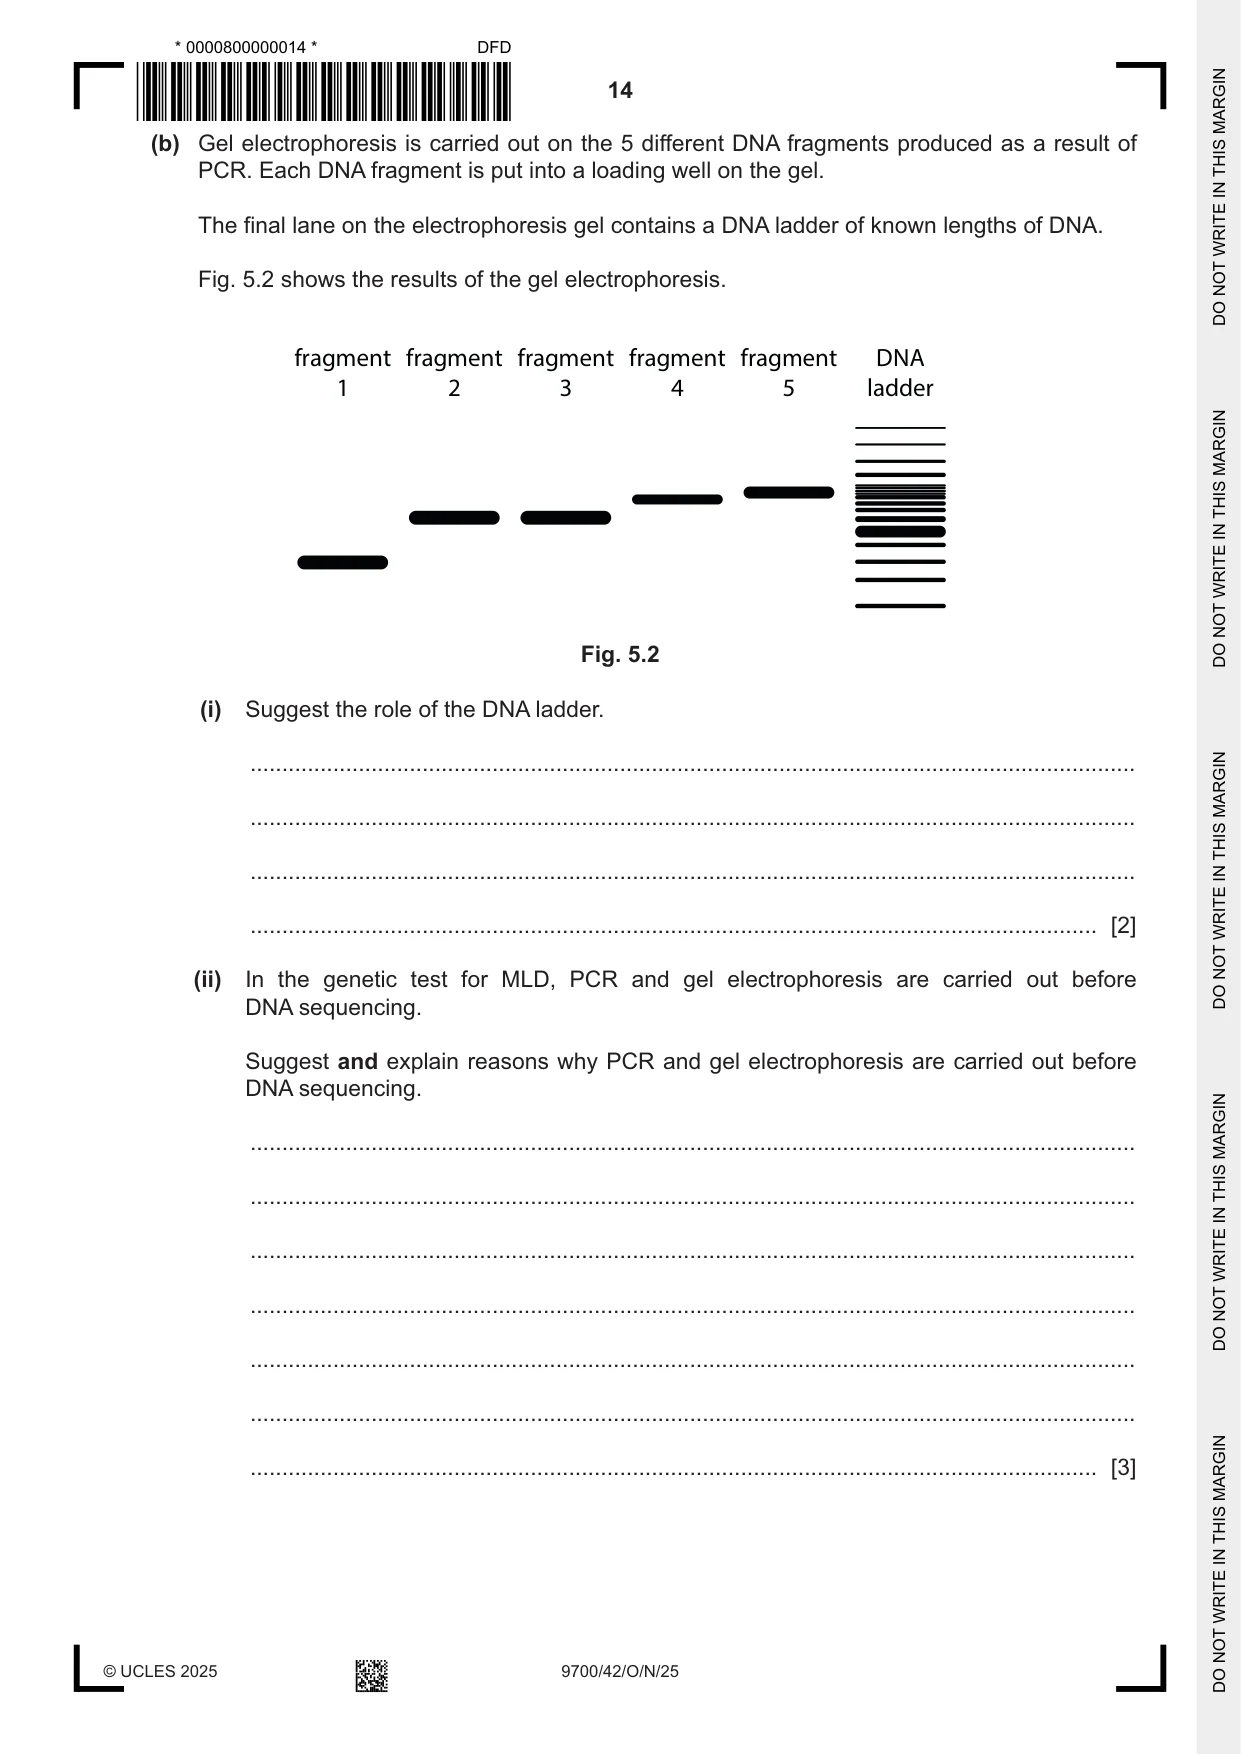
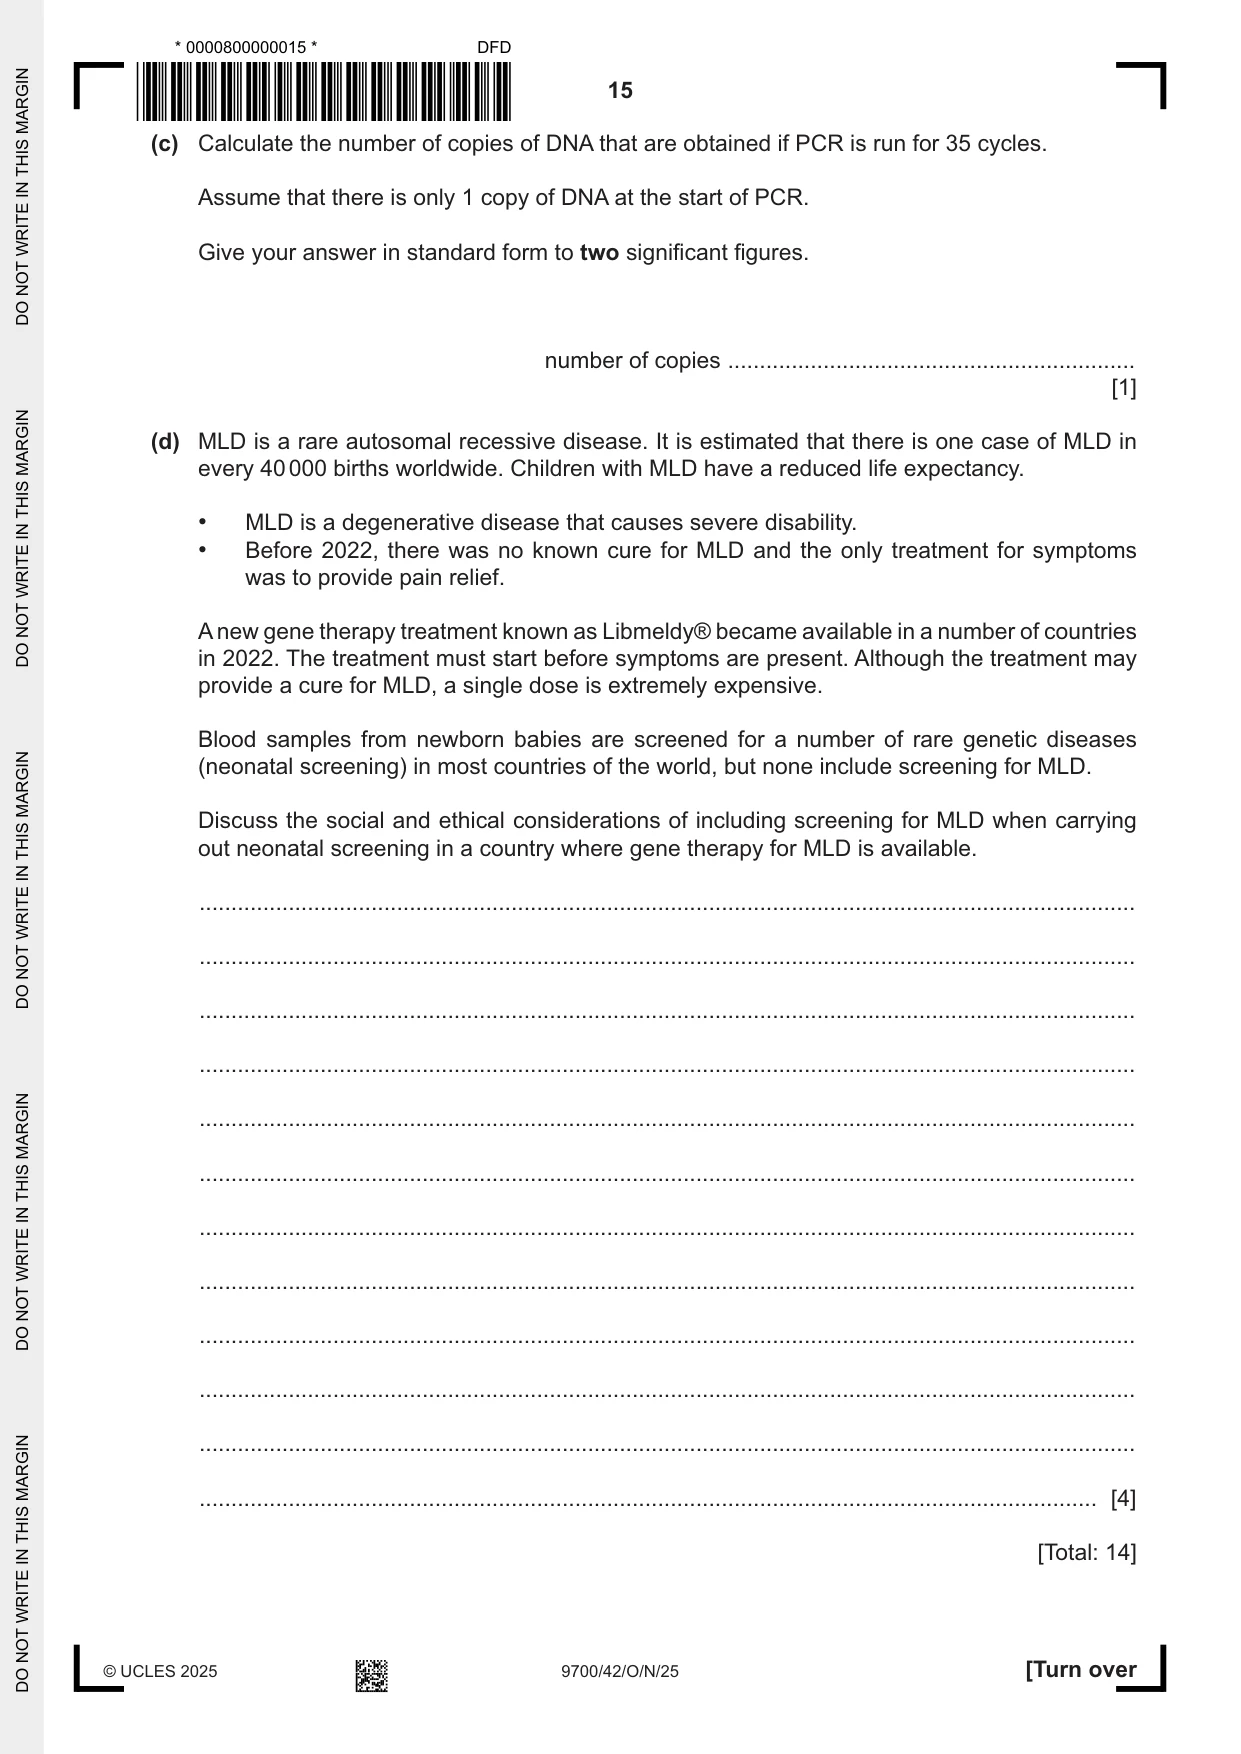
5 Metachromatic leukodystrophy (MLD) is a genetic disease that affects the nervous system. MLD is caused by mutations in the ARSA gene located on chromosome 22. The ARSA gene, which is 3150 base pairs (bp) in length, includes 8 exons and is shown in Fig. 5.1. exon 3.15 kb Fig. 5.1 A genetic test using DNA sequencing is available to identify mutations associated with MLD in the ARSA gene. The sequencing method can only work if a DNA fragment size is less than 1000 bp. The test involves a number of different stages: • Genomic DNA is extracted from a blood sample. • Polymerase chain reaction (PCR) using 5 pairs of primers selects 5 different DNA fragments of the ARSA gene. • Gel electrophoresis is carried out on the DNA fragments. • The DNA fragments are sequenced and analysed for mutations. Table 5.1 shows the length of the DNA fragments and the exons present in each DNA fragment. Table 5.1 fragment DNA fragment exons in DNA number length / bp fragment 1 405 1 2 737 1‑2 3 706 2‑4 4 860 5‑7 5 916 7‑8 (a) Genomic DNA and primers are added to the PCR machine. Name two other substances that are added to the PCR machine, and explain why each substance is added. ................................................................................................................................................... ................................................................................................................................................... ................................................................................................................................................... ................................................................................................................................................... ................................................................................................................................................... ................................................................................................................................................... ................................................................................................................................................... ................................................................................................................................................... ............................................................................................................................................. [4] (b) Gel electrophoresis is carried out on the 5 different DNA fragments produced as a result of PCR. Each DNA fragment is put into a loading well on the gel. The final lane on the electrophoresis gel contains a DNA ladder of known lengths of DNA. Fig. 5.2 shows the results of the gel electrophoresis. fragment fragment fragment fragment fragment DNA 1 2 3 4 5 ladder Fig. 5.2 (i) Suggest the role of the DNA ladder. ........................................................................................................................................... ........................................................................................................................................... ........................................................................................................................................... ..................................................................................................................................... [2] (ii) In the genetic test for MLD, PCR and gel electrophoresis are carried out before DNA sequencing. Suggest and explain reasons why PCR and gel electrophoresis are carried out before DNA sequencing. ........................................................................................................................................... ........................................................................................................................................... ........................................................................................................................................... ........................................................................................................................................... ........................................................................................................................................... ........................................................................................................................................... ..................................................................................................................................... [3] (c) Calculate the number of copies of DNA that are obtained if PCR is run for 35 cycles. Assume that there is only 1 copy of DNA at the start of PCR. Give your answer in standard form to two significant figures. number of copies ................................................................ [1] (d) MLD is a rare autosomal recessive disease. It is estimated that there is one case of MLD in every 40 000 births worldwide. Children with MLD have a reduced life expectancy. • MLD is a degenerative disease that causes severe disability. • Before 2022, there was no known cure for MLD and the only treatment for symptoms was to provide pain relief. A new gene therapy treatment known as Libmeldy® became available in a number of countries in 2022. The treatment must start before symptoms are present. Although the treatment may provide a cure for MLD, a single dose is extremely expensive. Blood samples from newborn babies are screened for a number of rare genetic diseases (neonatal screening) in most countries of the world, but none include screening for MLD. Discuss the social and ethical considerations of including screening for MLD when carrying out neonatal screening in a country where gene therapy for MLD is available. ................................................................................................................................................... ................................................................................................................................................... ................................................................................................................................................... ................................................................................................................................................... ................................................................................................................................................... ................................................................................................................................................... ................................................................................................................................................... ................................................................................................................................................... ................................................................................................................................................... ................................................................................................................................................... ................................................................................................................................................... ............................................................................................................................................. [4] [Total: 14]
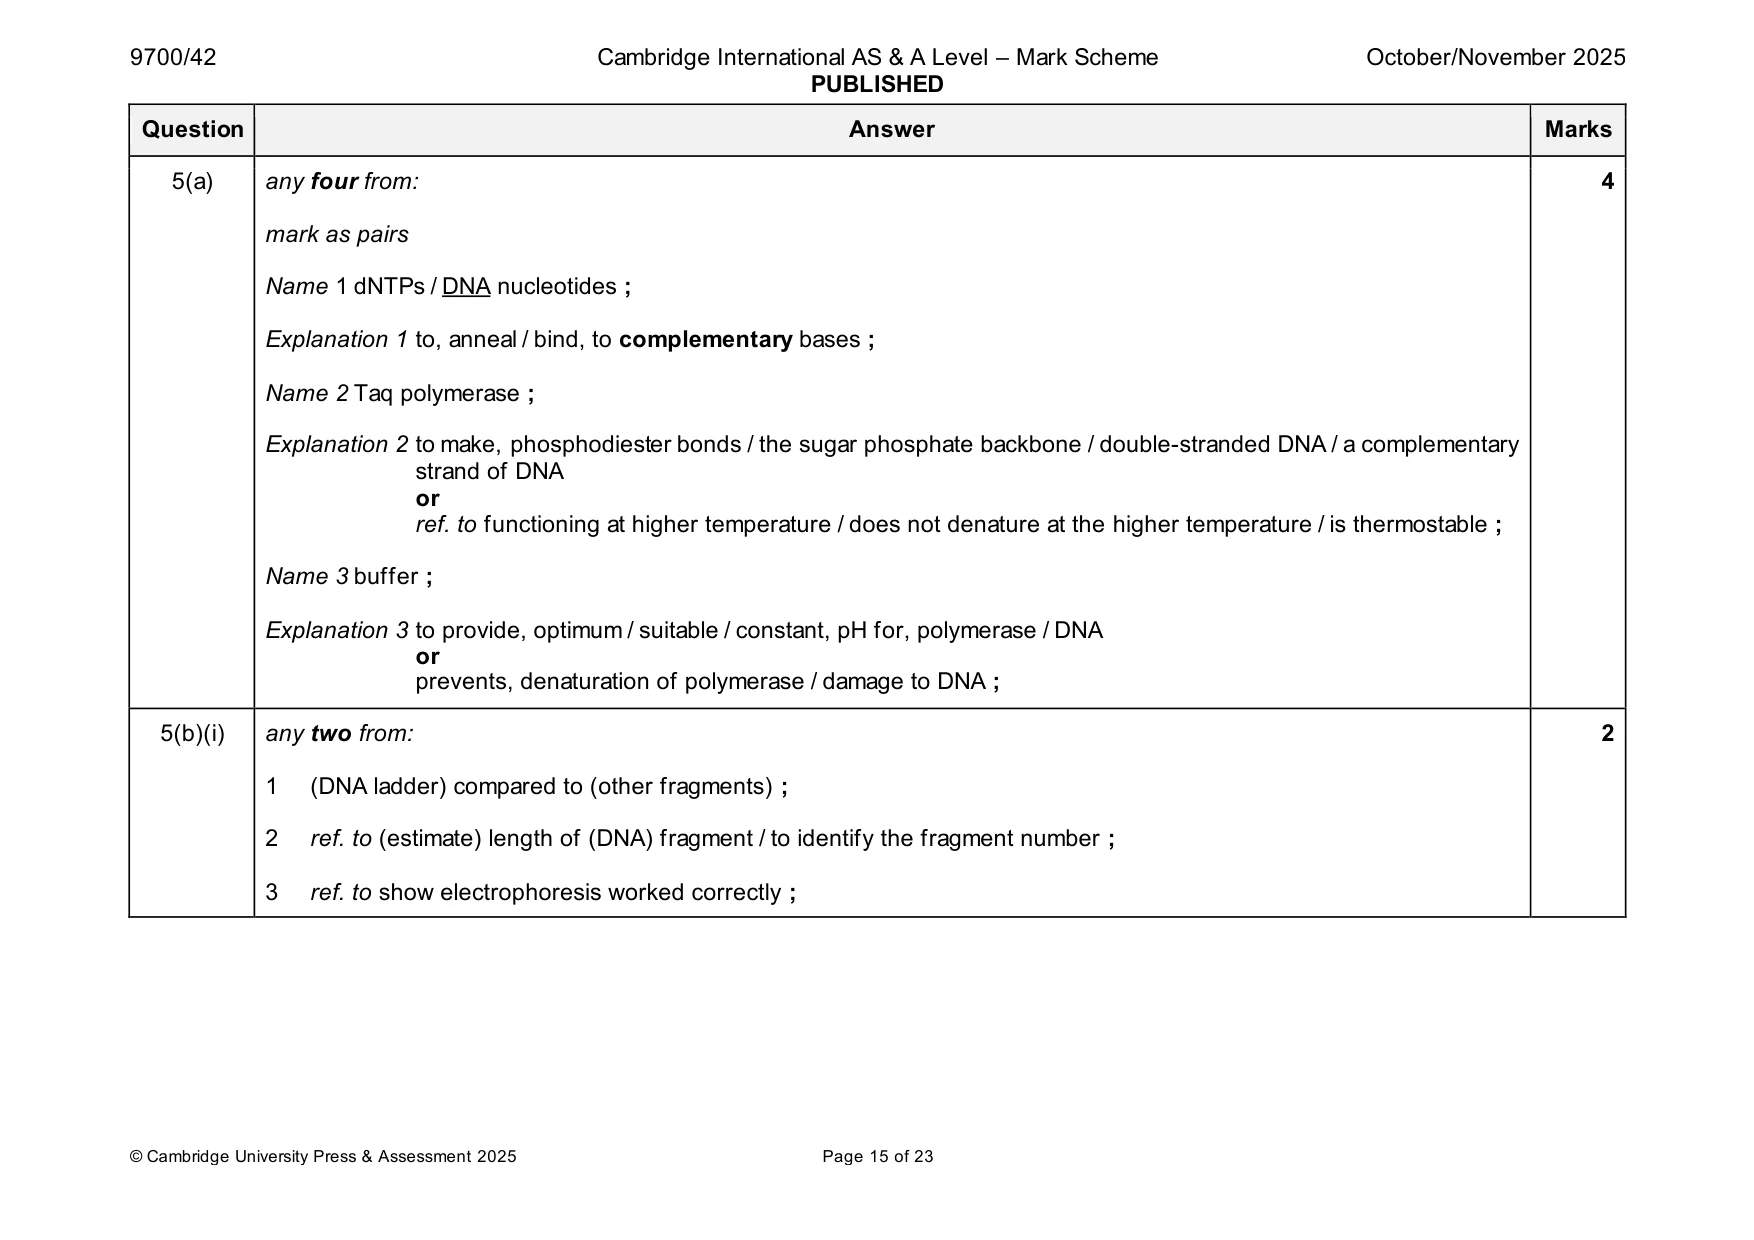
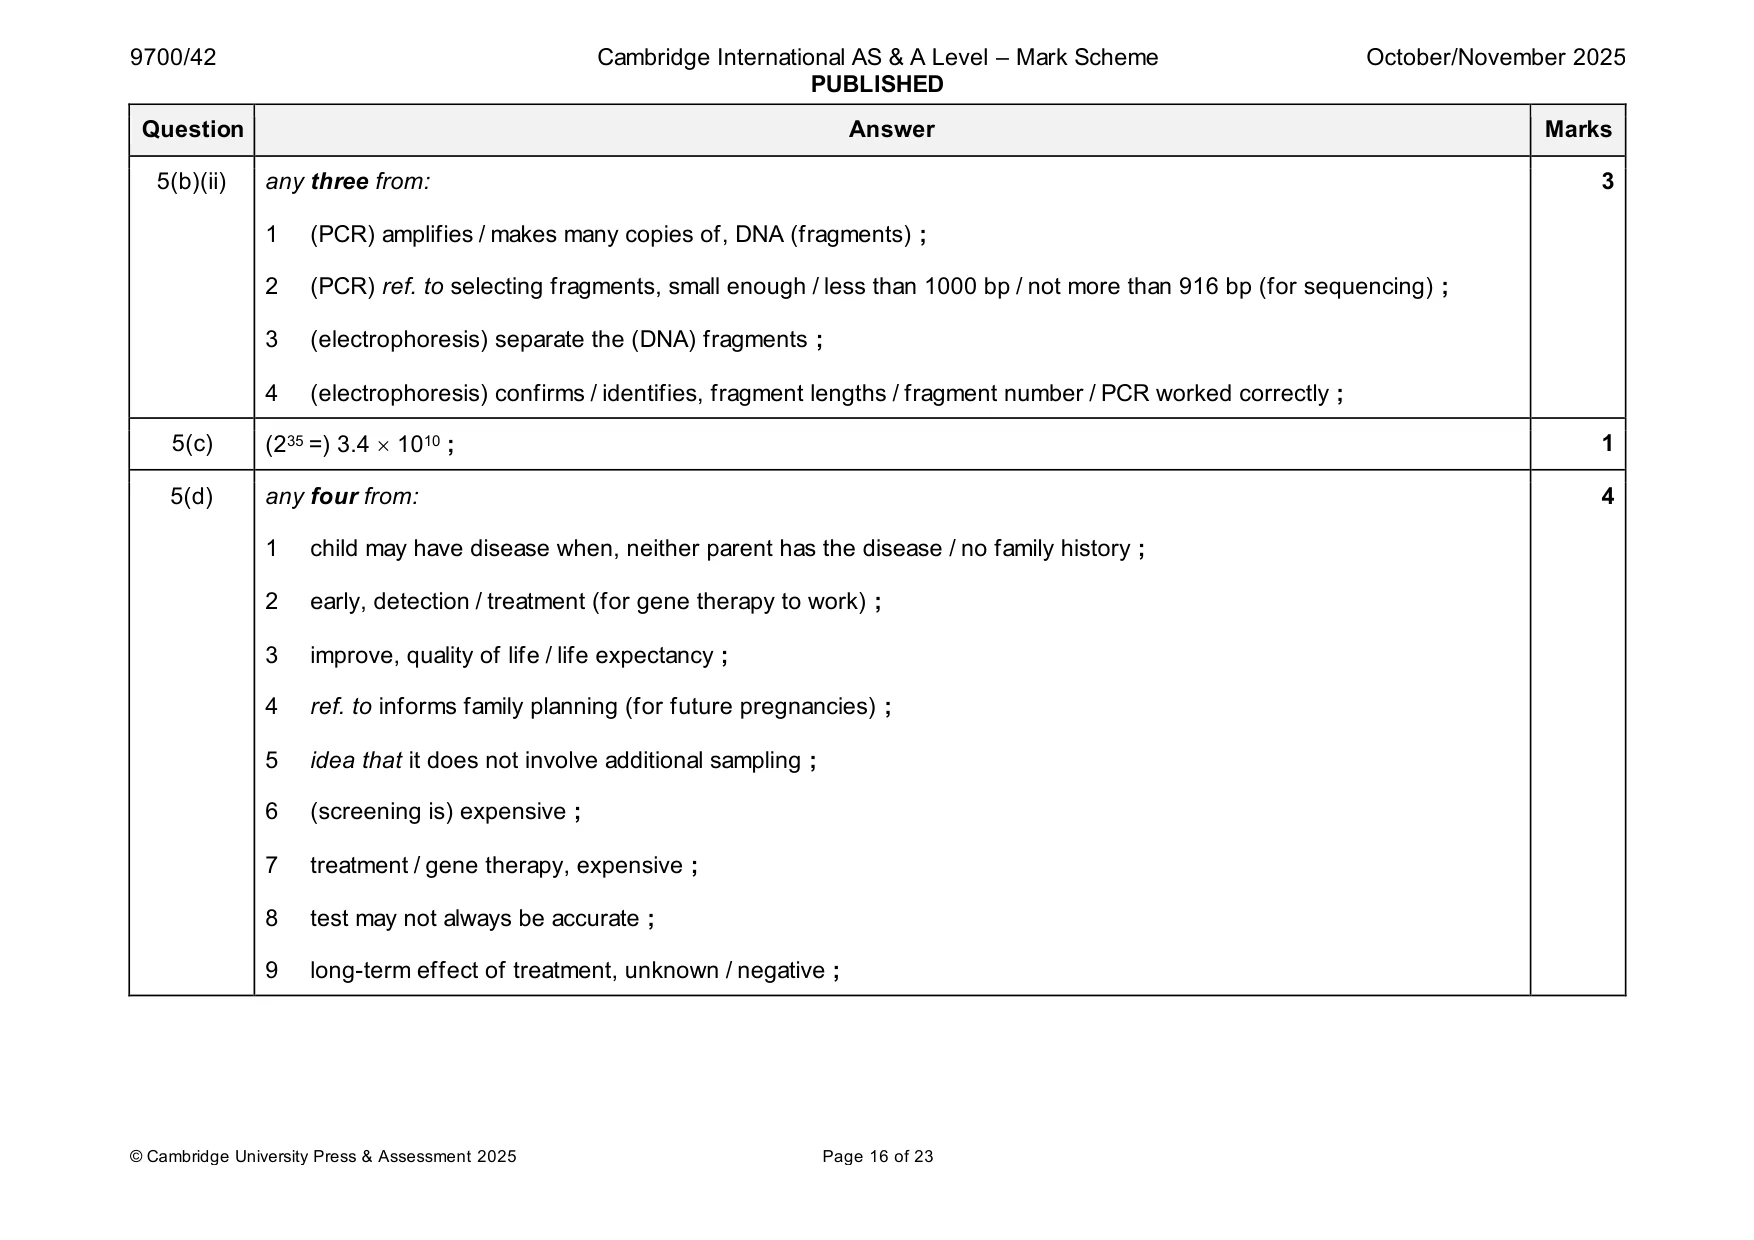
Mark scheme: 5(a) any four from: 4 mark as pairs Name 1 dNTPs / DNA nucleotides ; Explanation 1 to, anneal / bind, to complementary bases ; Name 2 Taq polymerase ; Explanation 2 to make, phosphodiester bonds / the sugar phosphate backbone / double-stranded DNA / a complementary strand of DNA or ref. to functioning at higher temperature / does not denature at the higher temperature / is thermostable ; Name 3 buffer ; Explanation 3 to provide, optimum / suitable / constant, pH for, polymerase / DNA or prevents, denaturation of polymerase / damage to DNA ; 5(b)(i) any two from: 2 1 (DNA ladder) compared to (other fragments) ; 2 ref. to (estimate) length of (DNA) fragment / to identify the fragment number ; 3 ref. to show electrophoresis worked correctly ; 5(b)(ii) any three from: 3 1 (PCR) amplifies / makes many copies of, DNA (fragments) ; 2 (PCR) ref. to selecting fragments, small enough / less than 1000 bp / not more than 916 bp (for sequencing) ; 3 (electrophoresis) separate the (DNA) fragments ; 4 (electrophoresis) confirms / identifies, fragment lengths / fragment number / PCR worked correctly ; 5(c) (235 =) 3.4 1010 ; 1 5(d) any four from: 4 1 child may have disease when, neither parent has the disease / no family history ; 2 early, detection / treatment (for gene therapy to work) ; 3 improve, quality of life / life expectancy ; 4 ref. to informs family planning (for future pregnancies) ; 5 idea that it does not involve additional sampling ; 6 (screening is) expensive ; 7 treatment / gene therapy, expensive ; 8 test may not always be accurate ; 9 long-term effect of treatment, unknown / negative ;
Q6 · Phosphoinositide 3‑kinase (PI3K) and protein kinase B (PKB) are enzymes involved in the…
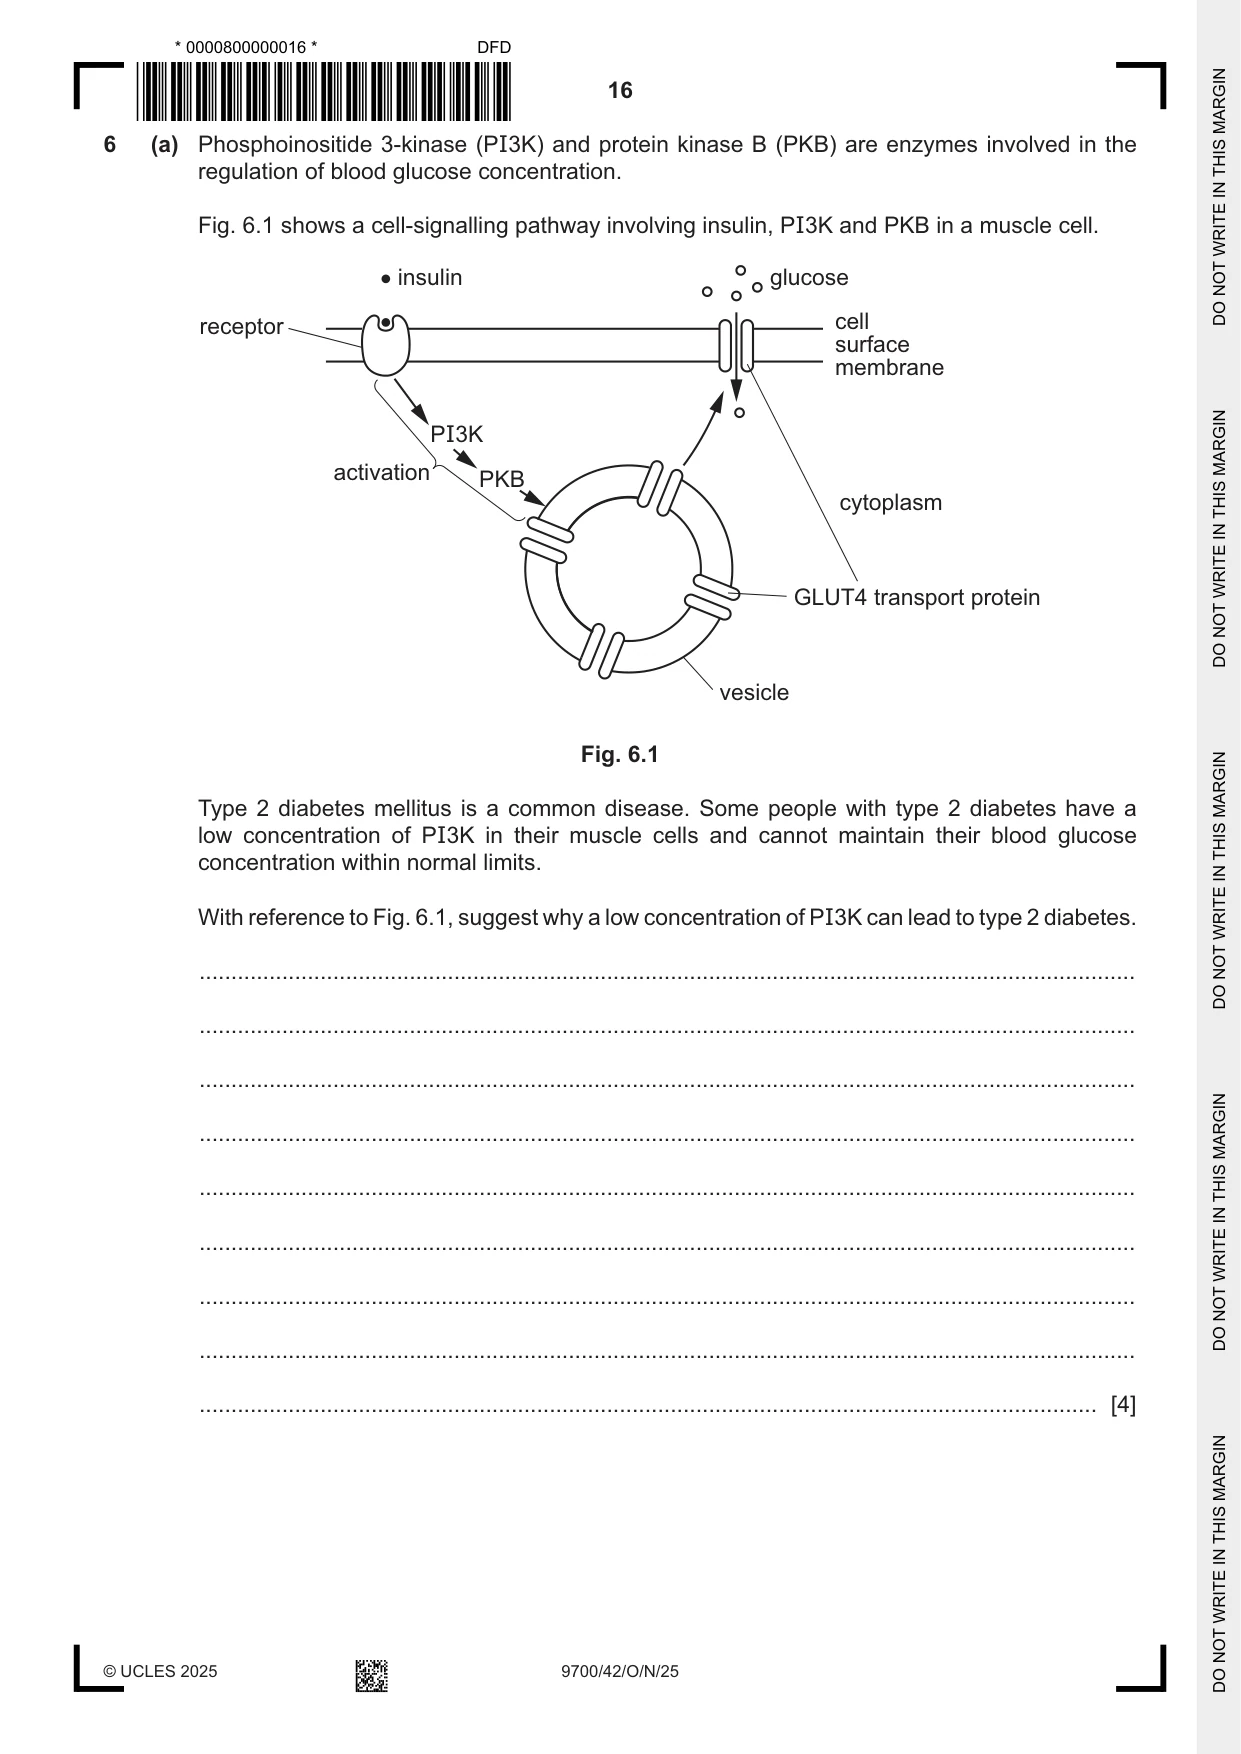
6 (a) Phosphoinositide 3‑kinase (PI3K) and protein kinase B (PKB) are enzymes involved in the regulation of blood glucose concentration. Fig. 6.1 shows a cell‑signalling pathway involving insulin, PI3K and PKB in a muscle cell. insulin glucose receptor cell surface membrane PI3K activation PKB cytoplasm GLUT4 transport protein vesicle Fig. 6.1 Type 2 diabetes mellitus is a common disease. Some people with type 2 diabetes have a low concentration of PI3K in their muscle cells and cannot maintain their blood glucose concentration within normal limits. With reference to Fig. 6.1, suggest why a low concentration of PI3K can lead to type 2 diabetes. ................................................................................................................................................... ................................................................................................................................................... ................................................................................................................................................... ................................................................................................................................................... ................................................................................................................................................... ................................................................................................................................................... ................................................................................................................................................... ................................................................................................................................................... ............................................................................................................................................. [4] (b) Describe how a biosensor can be used to measure blood glucose concentration. ................................................................................................................................................... ................................................................................................................................................... ................................................................................................................................................... ................................................................................................................................................... ................................................................................................................................................... ................................................................................................................................................... ................................................................................................................................................... ................................................................................................................................................... ................................................................................................................................................... ................................................................................................................................................... ................................................................................................................................................... ................................................................................................................................................... ................................................................................................................................................... ................................................................................................................................................... ............................................................................................................................................. [7] [Total: 11]
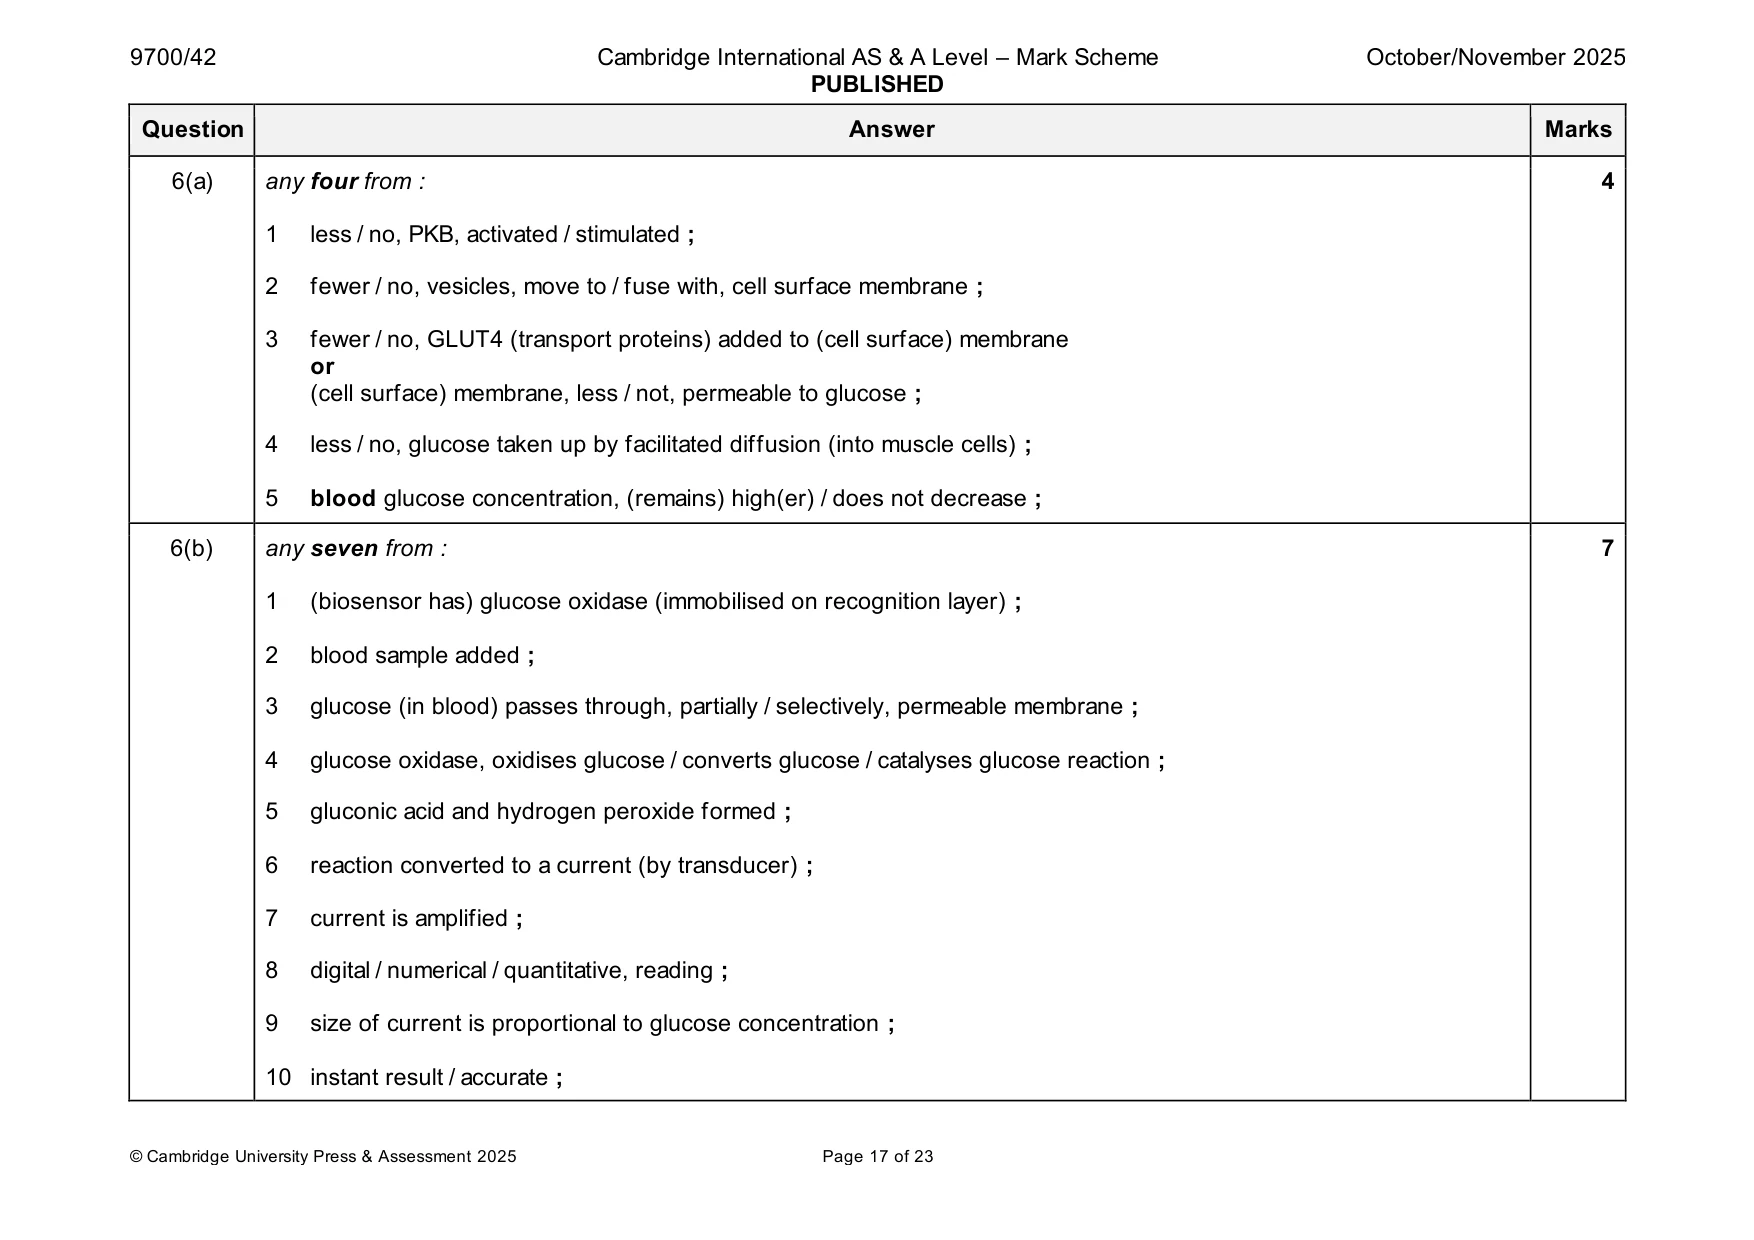
Mark scheme: 6(a) any four from : 4 1 less / no, PKB, activated / stimulated ; 2 fewer / no, vesicles, move to / fuse with, cell surface membrane ; 3 fewer / no, GLUT4 (transport proteins) added to (cell surface) membrane or (cell surface) membrane, less / not, permeable to glucose ; 4 less / no, glucose taken up by facilitated diffusion (into muscle cells) ; 5 blood glucose concentration, (remains) high(er) / does not decrease ; 6(b) any seven from : 7 1 (biosensor has) glucose oxidase (immobilised on recognition layer) ; 2 blood sample added ; 3 glucose (in blood) passes through, partially / selectively, permeable membrane ; 4 glucose oxidase, oxidises glucose / converts glucose / catalyses glucose reaction ; 5 gluconic acid and hydrogen peroxide formed ; 6 reaction converted to a current (by transducer) ; 7 current is amplified ; 8 digital / numerical / quantitative, reading ; 9 size of current is proportional to glucose concentration ; 10 instant result / accurate ;
Q7 · The Venus fly trap, Dionaea muscipula, is a plant that can capture insects
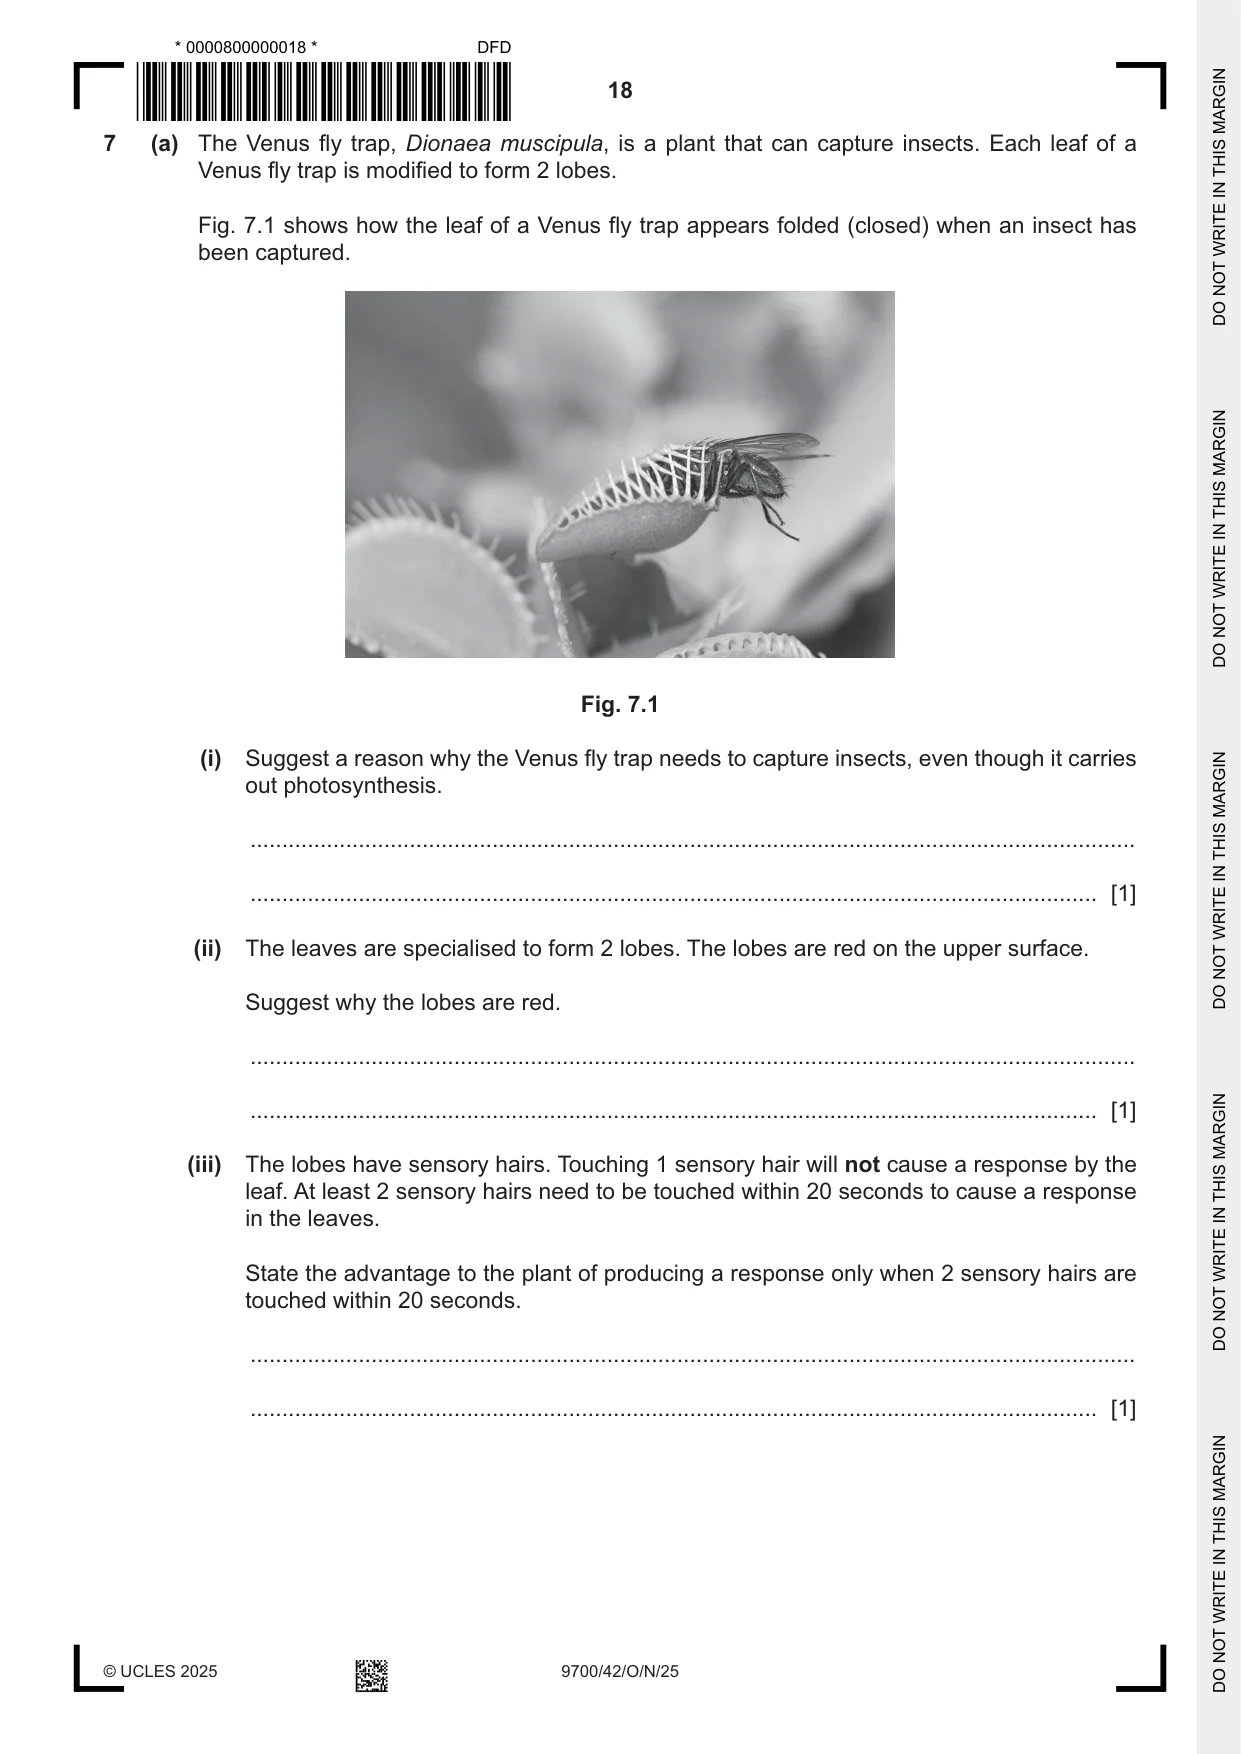
7 (a) The Venus fly trap, Dionaea muscipula, is a plant that can capture insects. Each leaf of a Venus fly trap is modified to form 2 lobes. Fig. 7.1 shows how the leaf of a Venus fly trap appears folded (closed) when an insect has been captured. Fig. 7.1 (i) Suggest a reason why the Venus fly trap needs to capture insects, even though it carries out photosynthesis. ........................................................................................................................................... ..................................................................................................................................... [1] (ii) The leaves are specialised to form 2 lobes. The lobes are red on the upper surface. Suggest why the lobes are red. ........................................................................................................................................... ..................................................................................................................................... [1] (iii) The lobes have sensory hairs. Touching 1 sensory hair will not cause a response by the leaf. At least 2 sensory hairs need to be touched within 20 seconds to cause a response in the leaves. State the advantage to the plant of producing a response only when 2 sensory hairs are touched within 20 seconds. ........................................................................................................................................... ..................................................................................................................................... [1] (iv) When an insect has been trapped, the leaves have to remain closed for a number of days. Suggest why this needs to happen. ........................................................................................................................................... ........................................................................................................................................... ..................................................................................................................................... [1] (b) Action potentials are produced by the Venus fly trap during the closure of a leaf. Each action potential is also associated with a refractory period. This is similar to the action potential and refractory period observed in a mammalian neurone during nerve impulse transmission. Explain the role played by the refractory period in the transmission of an impulse in a mammalian neurone. ................................................................................................................................................... ................................................................................................................................................... ................................................................................................................................................... ................................................................................................................................................... ................................................................................................................................................... ................................................................................................................................................... ............................................................................................................................................. [3] [Total: 7]
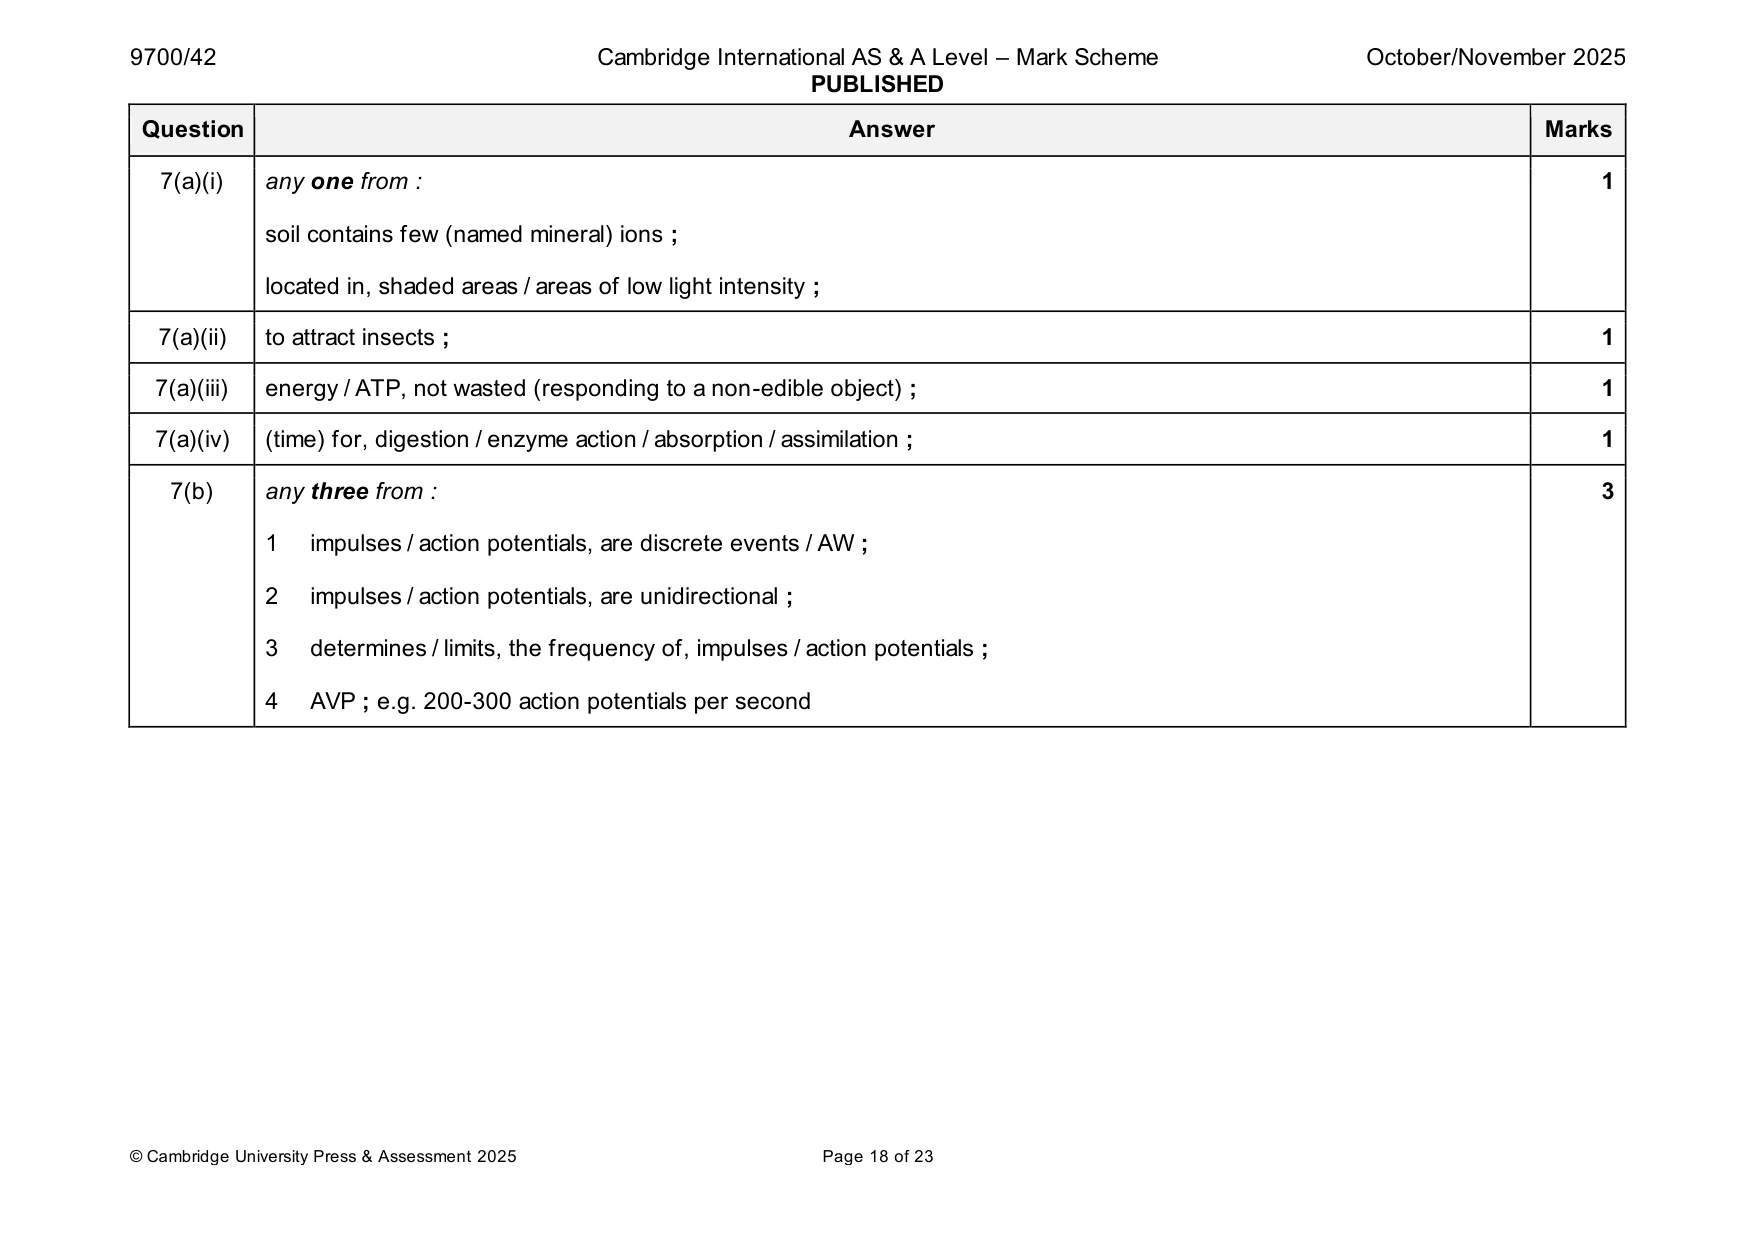
Mark scheme: 7(a)(i) any one from : 1 soil contains few (named mineral) ions ; located in, shaded areas / areas of low light intensity ; 7(a)(ii) to attract insects ; 1 7(a)(iii) energy / ATP, not wasted (responding to a non-edible object) ; 1 7(a)(iv) (time) for, digestion / enzyme action / absorption / assimilation ; 1 7(b) any three from : 3 1 impulses / action potentials, are discrete events / AW ; 2 impulses / action potentials, are unidirectional ; 3 determines / limits, the frequency of, impulses / action potentials ; 4 AVP ; e.g. 200-300 action potentials per second
More questions on Photosynthesis as an energy transfer process
Q8 · Palm oil is the most widely used vegetable oil
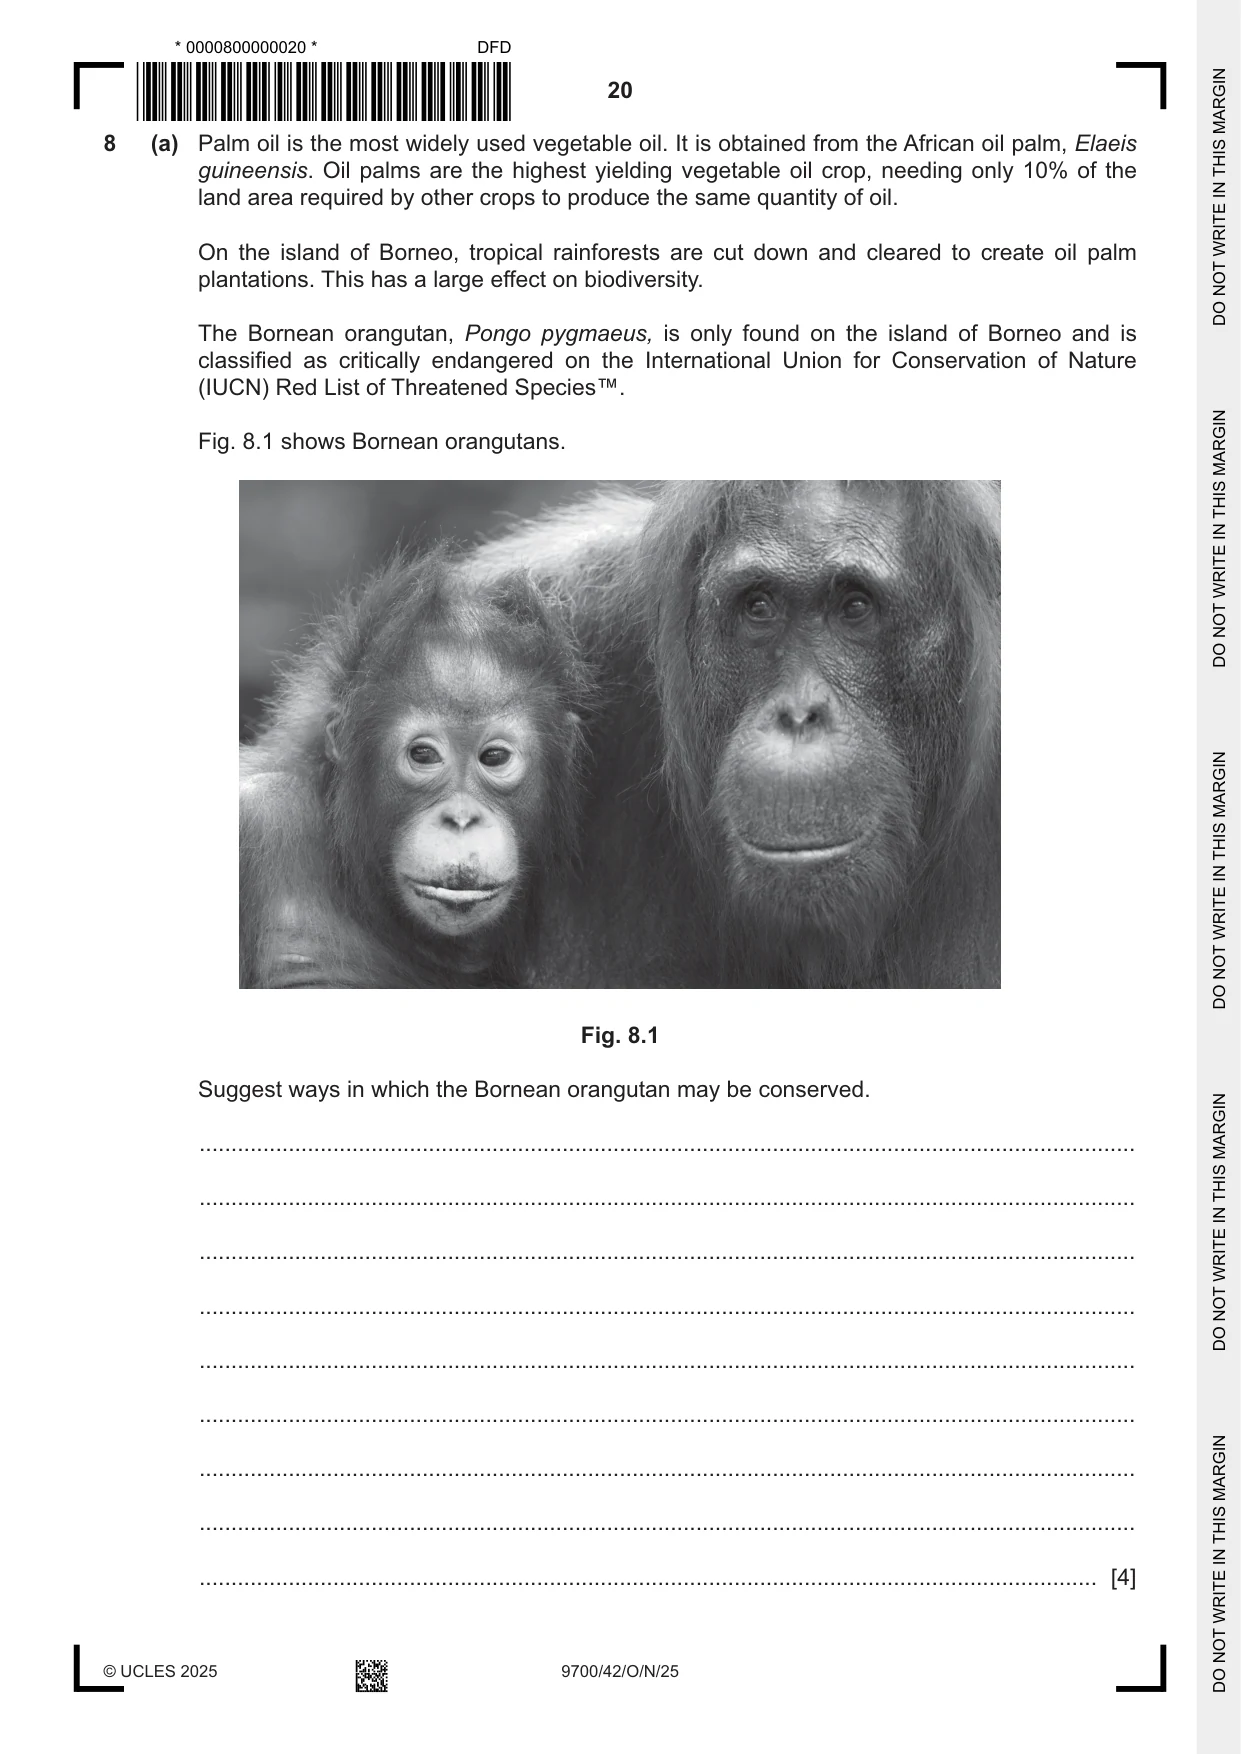
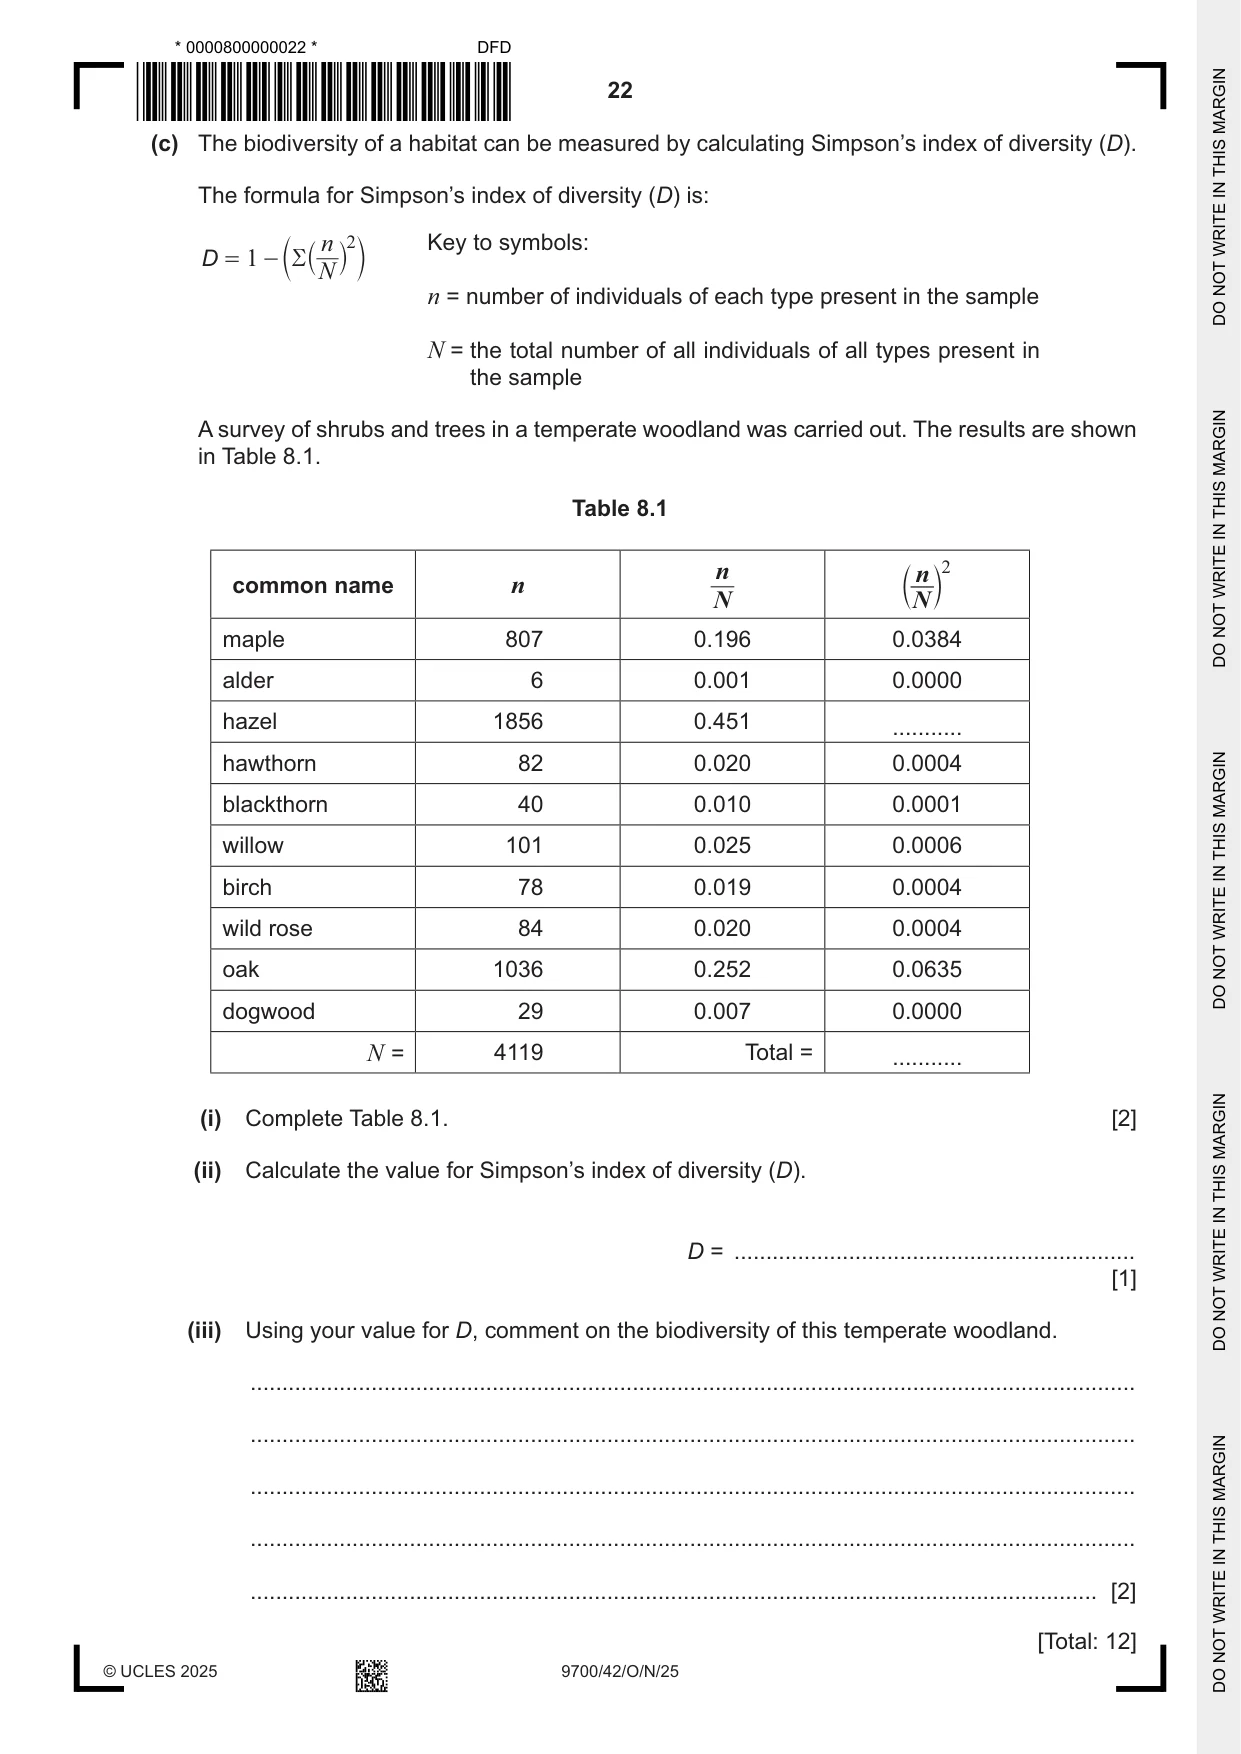
8 (a) Palm oil is the most widely used vegetable oil. It is obtained from the African oil palm, Elaeis guineensis. Oil palms are the highest yielding vegetable oil crop, needing only 10% of the land area required by other crops to produce the same quantity of oil. On the island of Borneo, tropical rainforests are cut down and cleared to create oil palm plantations. This has a large effect on biodiversity. The Bornean orangutan, Pongo pygmaeus, is only found on the island of Borneo and is classified as critically endangered on the International Union for Conservation of Nature (IUCN) Red List of Threatened Species™. Fig. 8.1 shows Bornean orangutans. Fig. 8.1 Suggest ways in which the Bornean orangutan may be conserved. ................................................................................................................................................... ................................................................................................................................................... ................................................................................................................................................... ................................................................................................................................................... ................................................................................................................................................... ................................................................................................................................................... ................................................................................................................................................... ................................................................................................................................................... ............................................................................................................................................. [4] (b) Biodiversity can be assessed at different levels. Outline the main levels at which biodiversity can be assessed. ................................................................................................................................................... ................................................................................................................................................... ................................................................................................................................................... ................................................................................................................................................... ................................................................................................................................................... ............................................................................................................................................. [3] (c) The biodiversity of a habitat can be measured by calculating Simpson’s index of diversity (D). The formula for Simpson’s index of diversity (D) is: n 2 Key to symbols: D = 1 -c R ` j m N n = number of individuals of each type present in the sample N = the total number of all individuals of all types present in the sample A survey of shrubs and trees in a temperate woodland was carried out. The results are shown in Table 8.1. Table 8.1 n n 2 common name n b l N N maple 807 0.196 0.0384 alder 6 0.001 0.0000 hazel 1856 0.451 ........... hawthorn 82 0.020 0.0004 blackthorn 40 0.010 0.0001 willow 101 0.025 0.0006 birch 78 0.019 0.0004 wild rose 84 0.020 0.0004 oak 1036 0.252 0.0635 dogwood 29 0.007 0.0000 N = 4119 Total = ........... (i) Complete Table 8.1. [2] (ii) Calculate the value for Simpson’s index of diversity (D). D = ............................................................... [1] (iii) Using your value for D, comment on the biodiversity of this temperate woodland. ........................................................................................................................................... ........................................................................................................................................... ........................................................................................................................................... ........................................................................................................................................... ..................................................................................................................................... [2] [Total: 12]
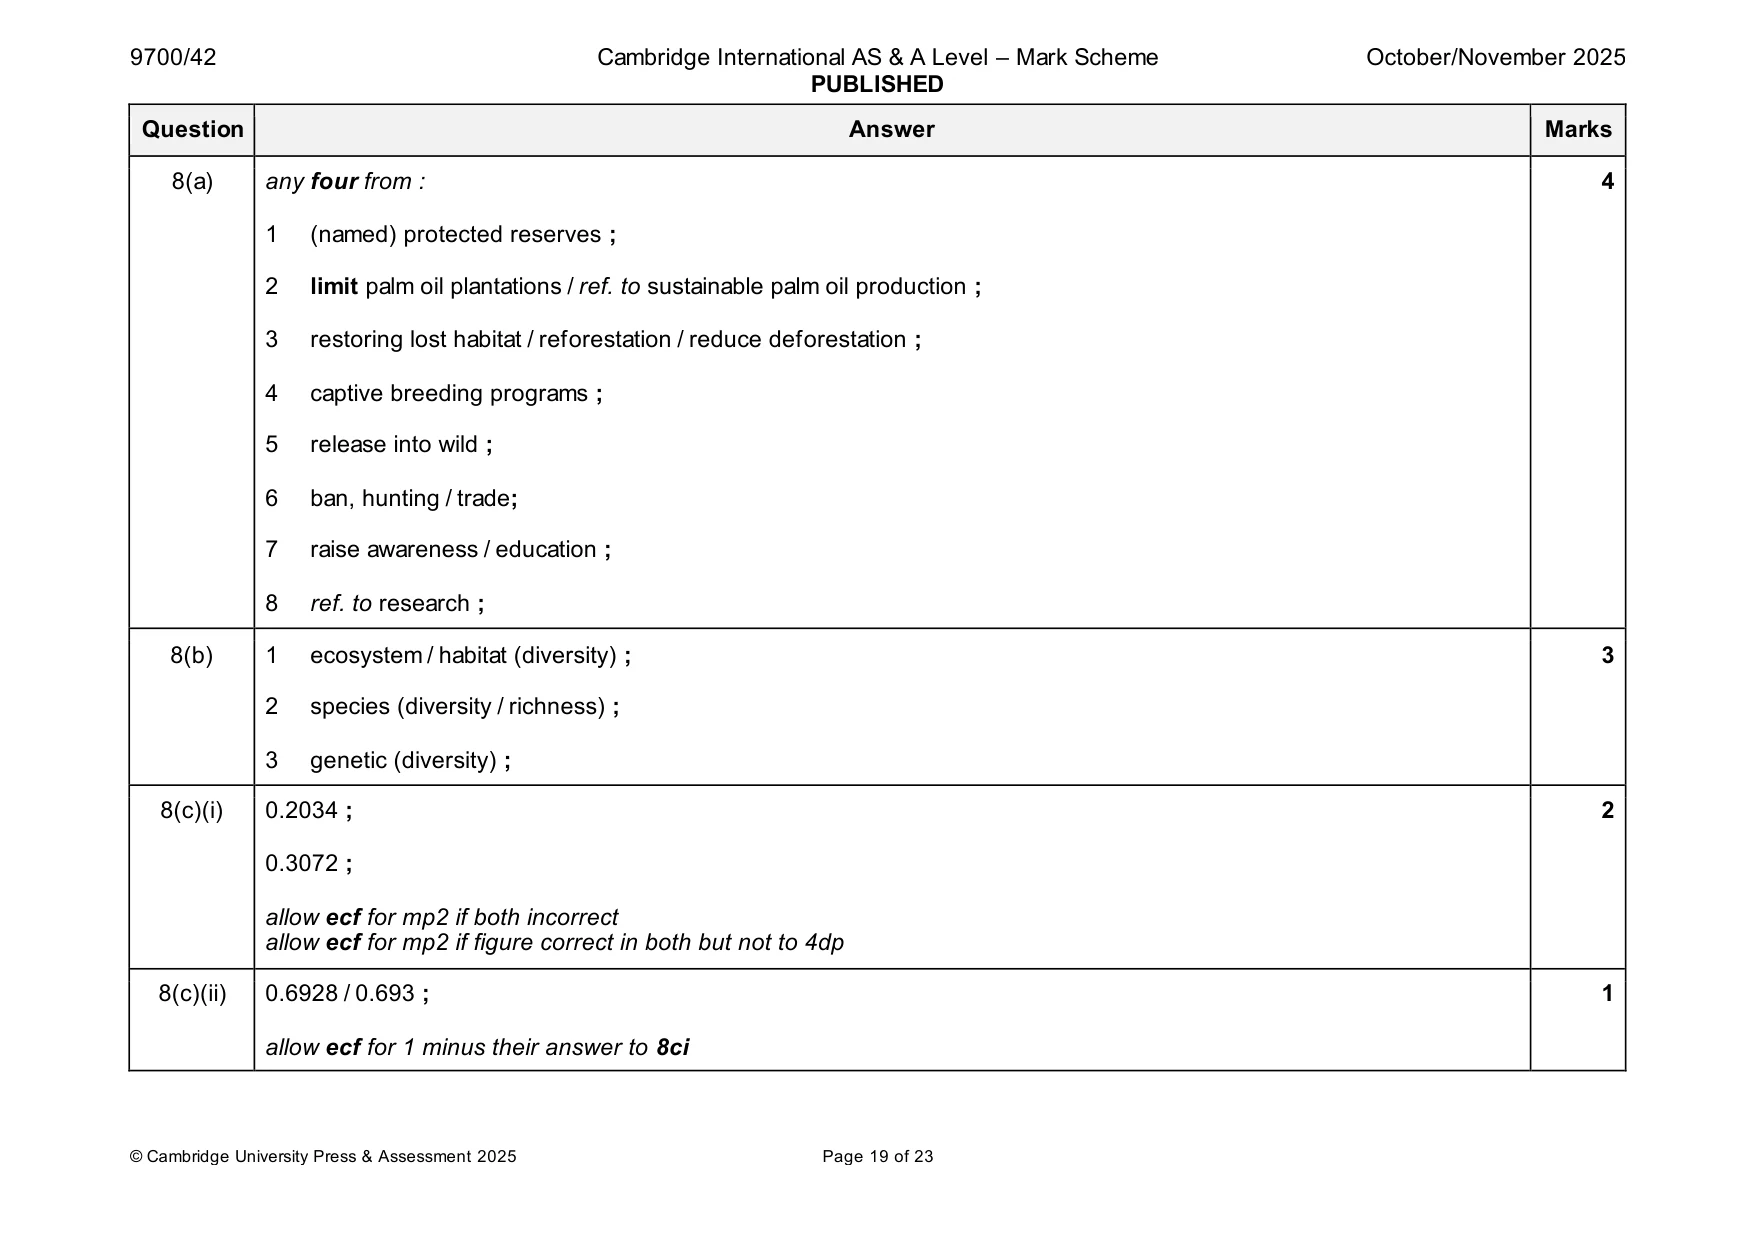
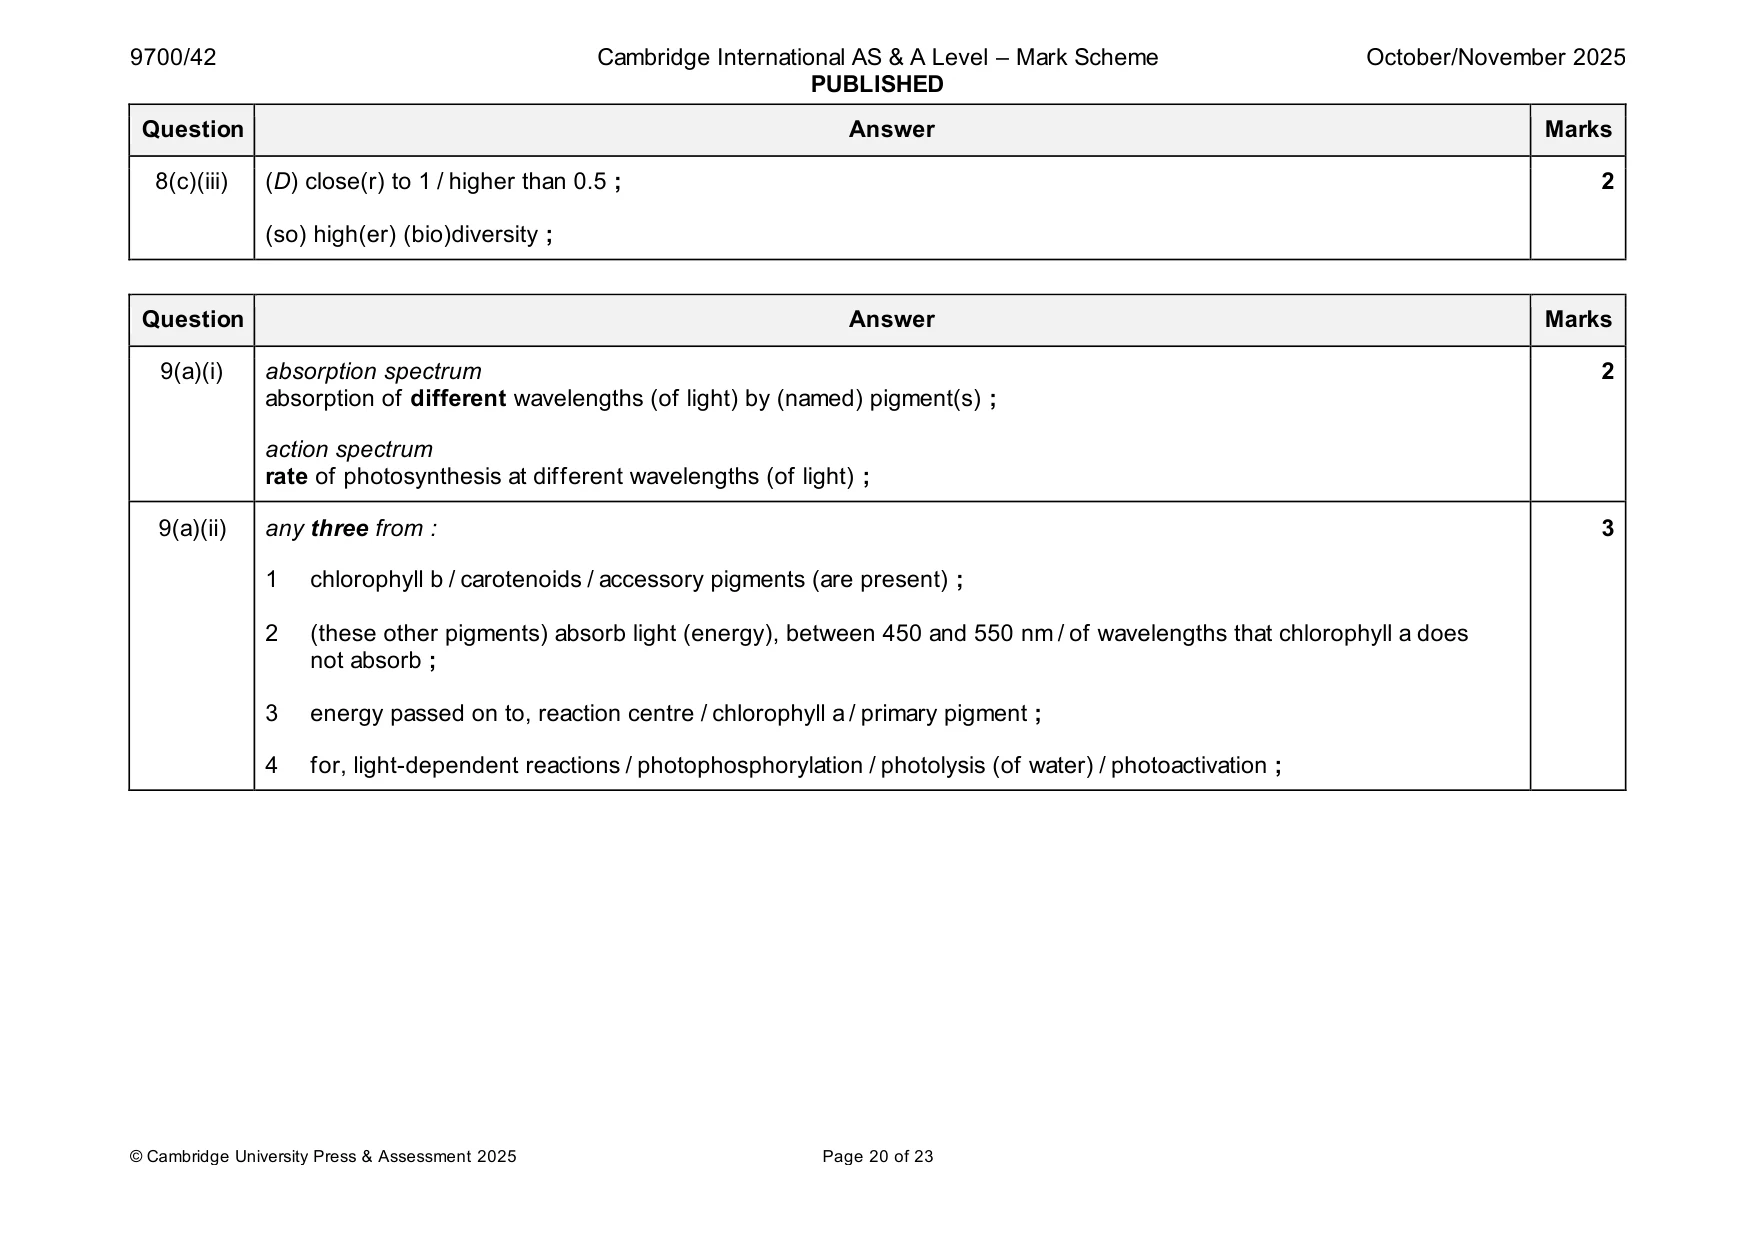
Mark scheme: 8(a) any four from : 4 1 (named) protected reserves ; 2 limit palm oil plantations / ref. to sustainable palm oil production ; 3 restoring lost habitat / reforestation / reduce deforestation ; 4 captive breeding programs ; 5 release into wild ; 6 ban, hunting / trade; 7 raise awareness / education ; 8 ref. to research ; 8(b) 1 ecosystem / habitat (diversity) ; 3 2 species (diversity / richness) ; 3 genetic (diversity) ; 8(c)(i) 0.2034 ; 2 0.3072 ; allow ecf for mp2 if both incorrect allow ecf for mp2 if figure correct in both but not to 4dp 8(c)(ii) 0.6928 / 0.693 ; 1 allow ecf for 1 minus their answer to 8ci 8(c)(iii) (D) close(r) to 1 / higher than 0.5 ; 2 (so) high(er) (bio)diversity ;
Q9 · An absorption spectrum for chlorophyll a and the corresponding action spectrum for a…
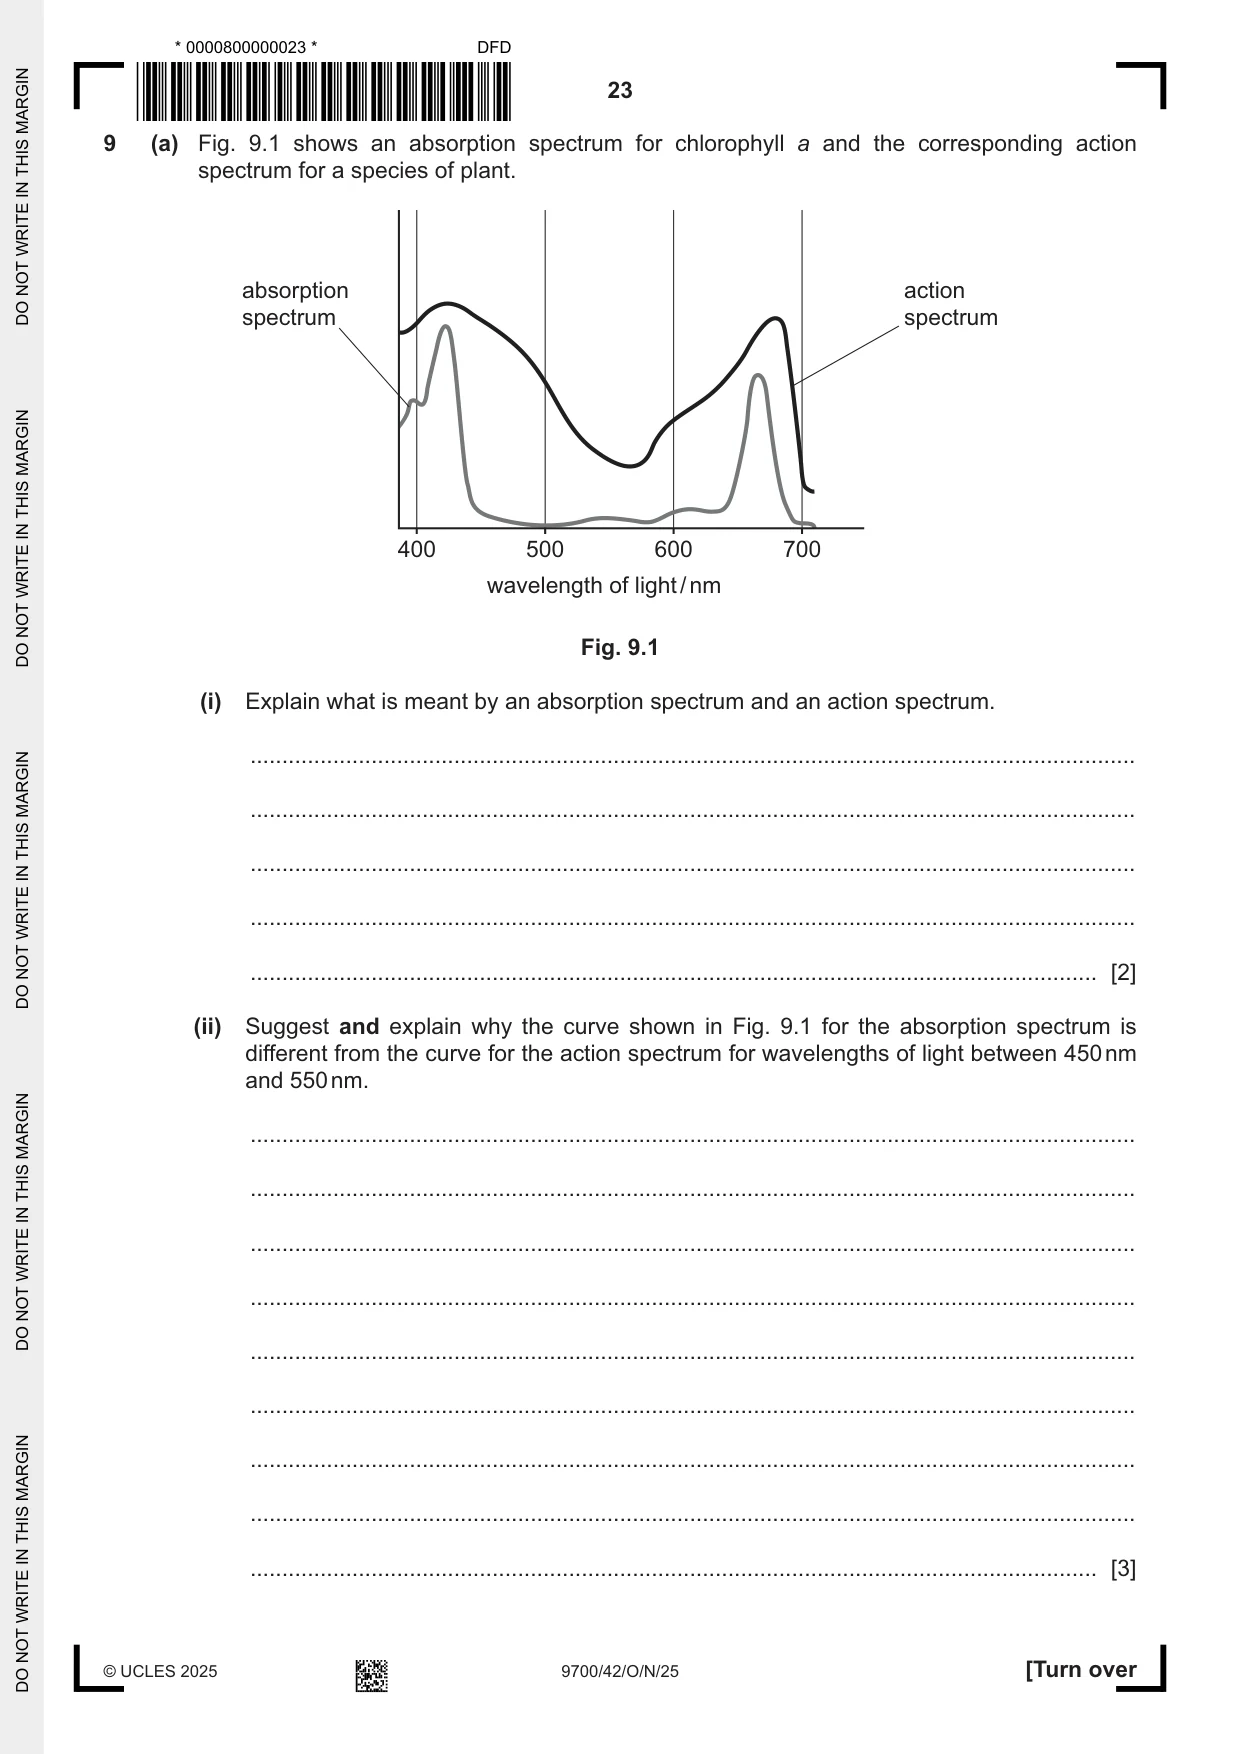
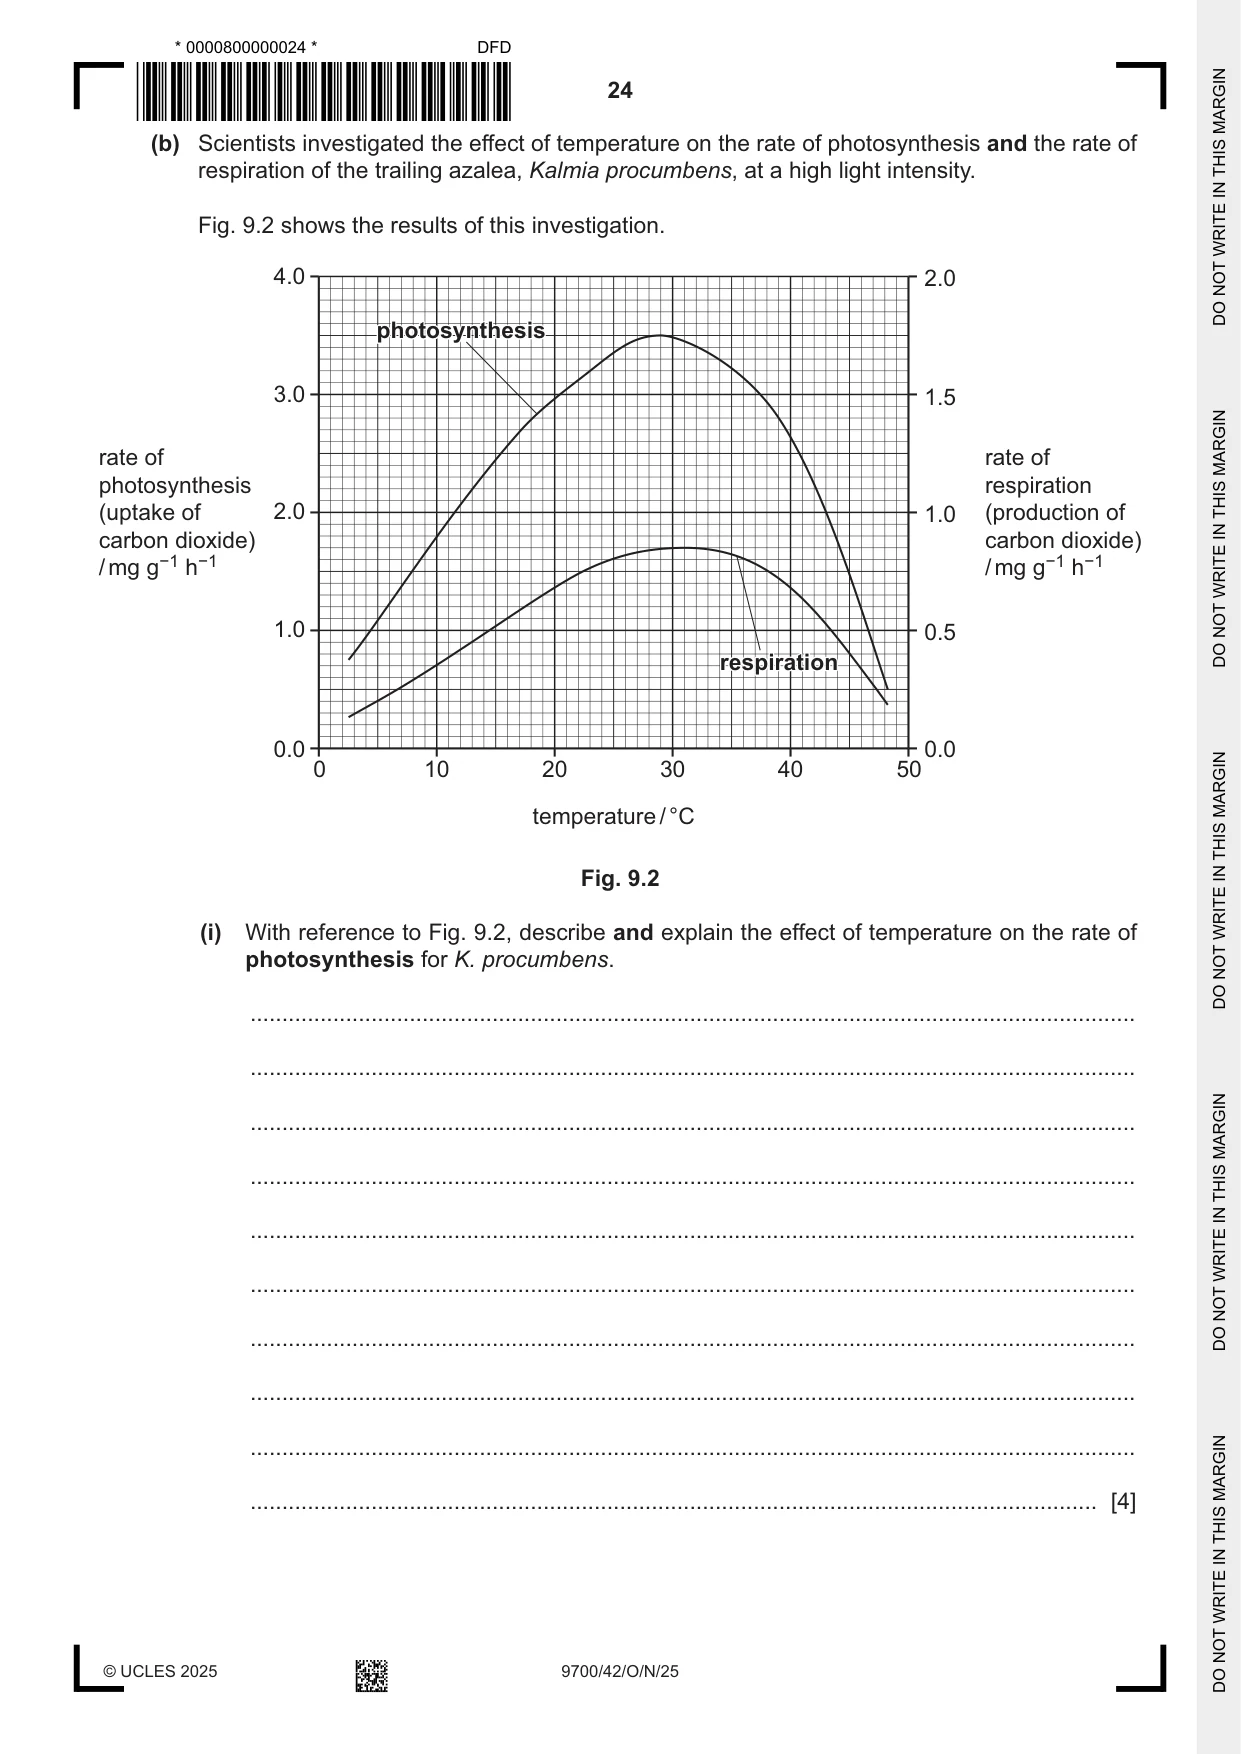
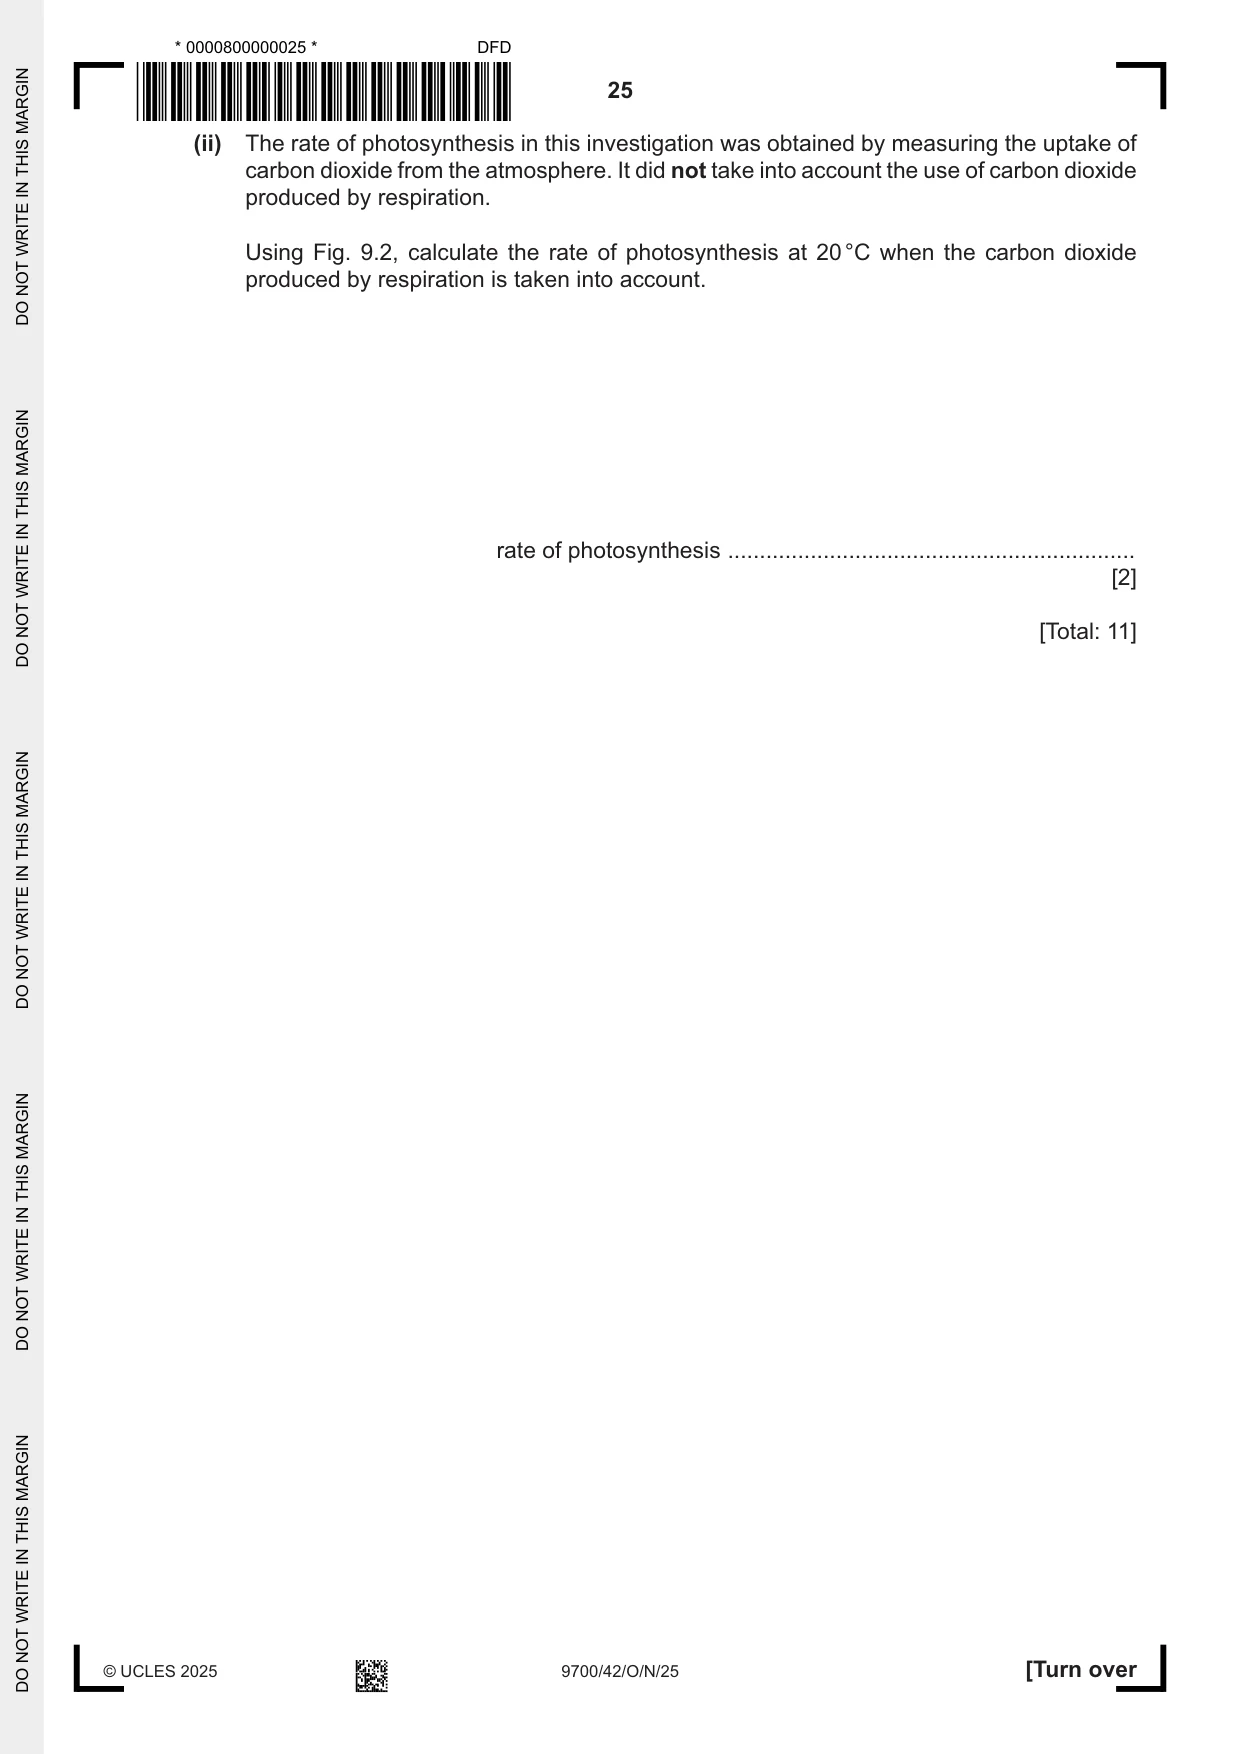
9 (a) Fig. 9.1 shows an absorption spectrum for chlorophyll a and the corresponding action spectrum for a species of plant. absorption action spectrum spectrum 400 500 600 700 wavelength of light / nm Fig. 9.1 (i) Explain what is meant by an absorption spectrum and an action spectrum. ........................................................................................................................................... ........................................................................................................................................... ........................................................................................................................................... ........................................................................................................................................... ..................................................................................................................................... [2] (ii) Suggest and explain why the curve shown in Fig. 9.1 for the absorption spectrum is different from the curve for the action spectrum for wavelengths of light between 450 nm and 550 nm. ........................................................................................................................................... ........................................................................................................................................... ........................................................................................................................................... ........................................................................................................................................... ........................................................................................................................................... ........................................................................................................................................... ........................................................................................................................................... ........................................................................................................................................... ..................................................................................................................................... [3] (b) Scientists investigated the effect of temperature on the rate of photosynthesis and the rate of respiration of the trailing azalea, Kalmia procumbens, at a high light intensity. Fig. 9.2 shows the results of this investigation. 4.0 2.0 photosynthesisphotosynthesis 3.0 1.5 rate of rate of photosynthesis respiration (uptake of 2.0 1.0 (production of carbon dioxide) carbon dioxide) / mg g−1 h−1 / mg g−1 h−1 1.0 0.5 respirationrespiration 0.0 0.0 0 10 20 30 40 50 temperature / °C Fig. 9.2 (i) With reference to Fig. 9.2, describe and explain the effect of temperature on the rate of photosynthesis for K. procumbens. ........................................................................................................................................... ........................................................................................................................................... ........................................................................................................................................... ........................................................................................................................................... ........................................................................................................................................... ........................................................................................................................................... ........................................................................................................................................... ........................................................................................................................................... ........................................................................................................................................... ..................................................................................................................................... [4] (ii) The rate of photosynthesis in this investigation was obtained by measuring the uptake of carbon dioxide from the atmosphere. It did not take into account the use of carbon dioxide produced by respiration. Using Fig. 9.2, calculate the rate of photosynthesis at 20 °C when the carbon dioxide produced by respiration is taken into account. rate of photosynthesis ................................................................ [2] [Total: 11]
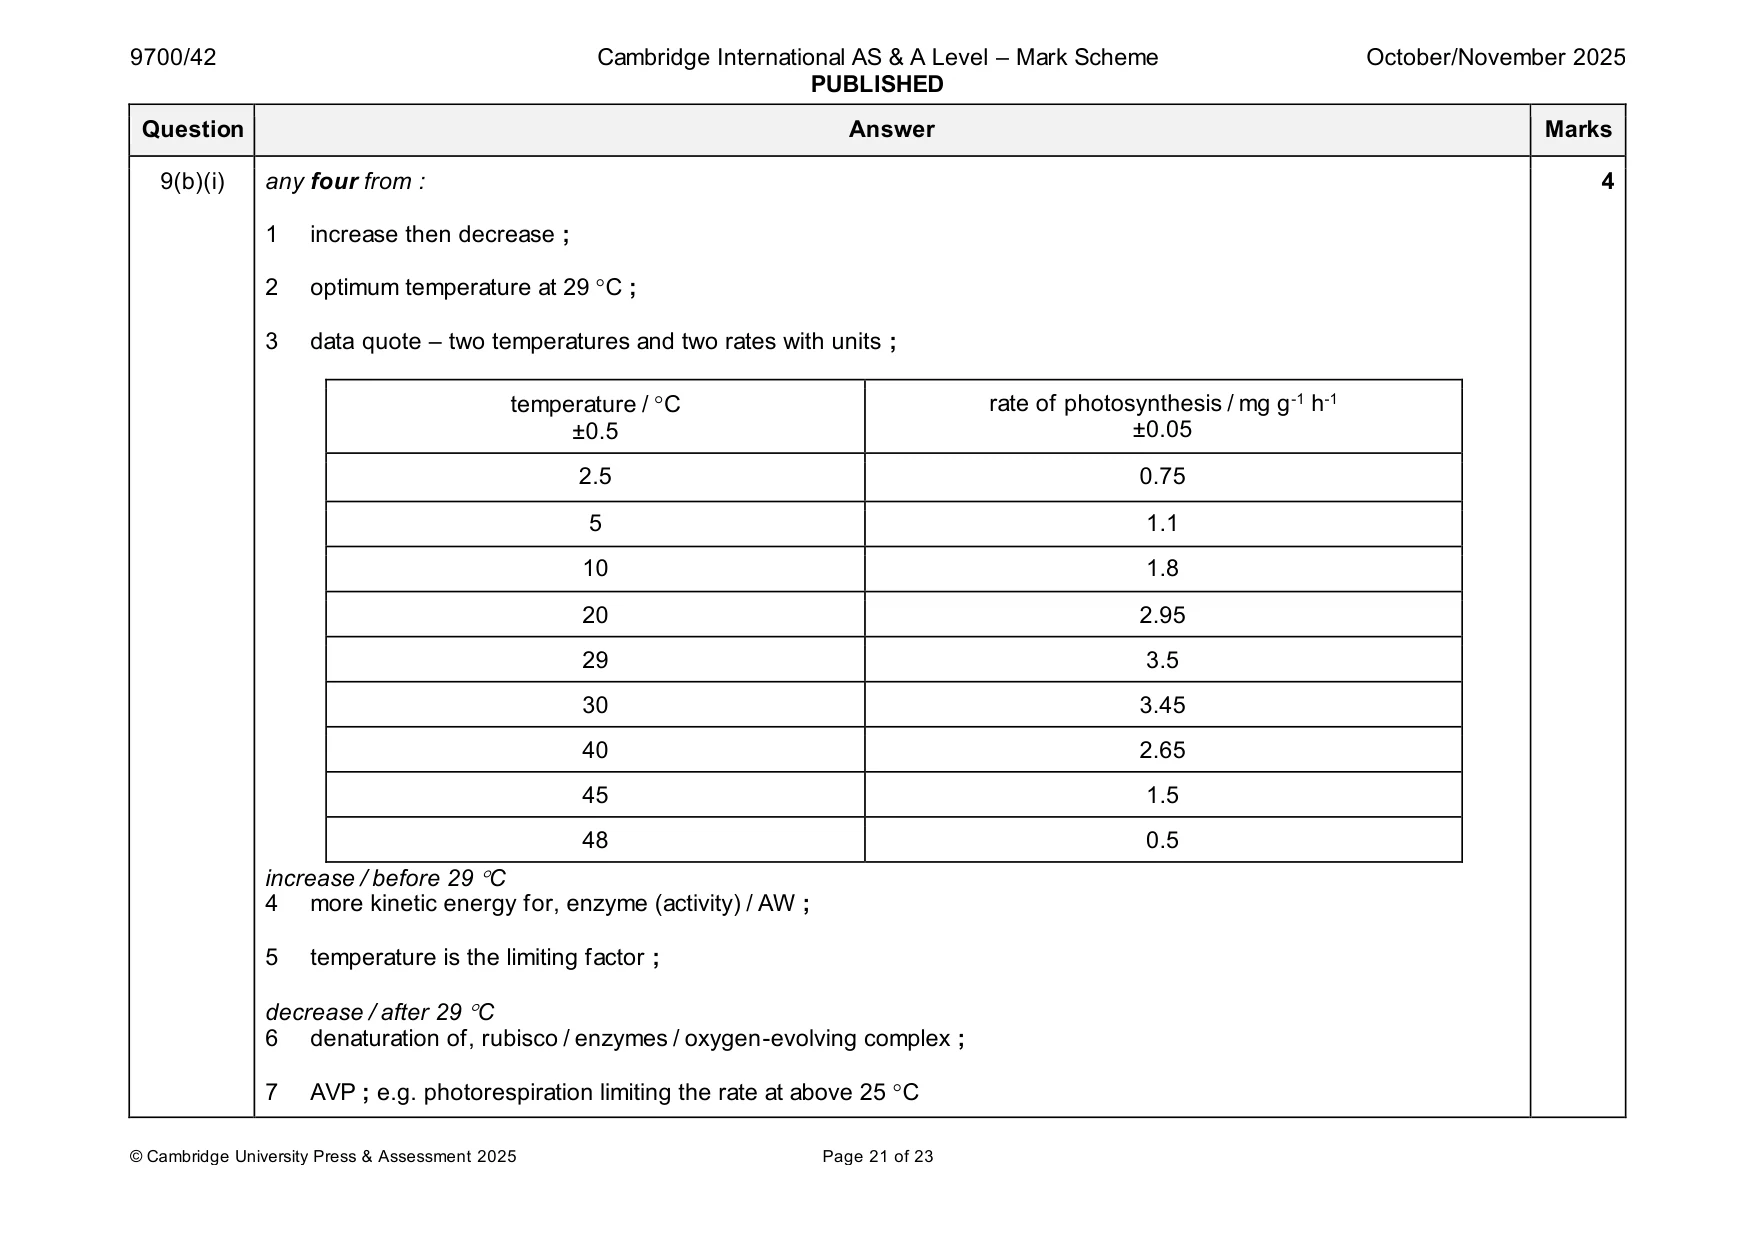
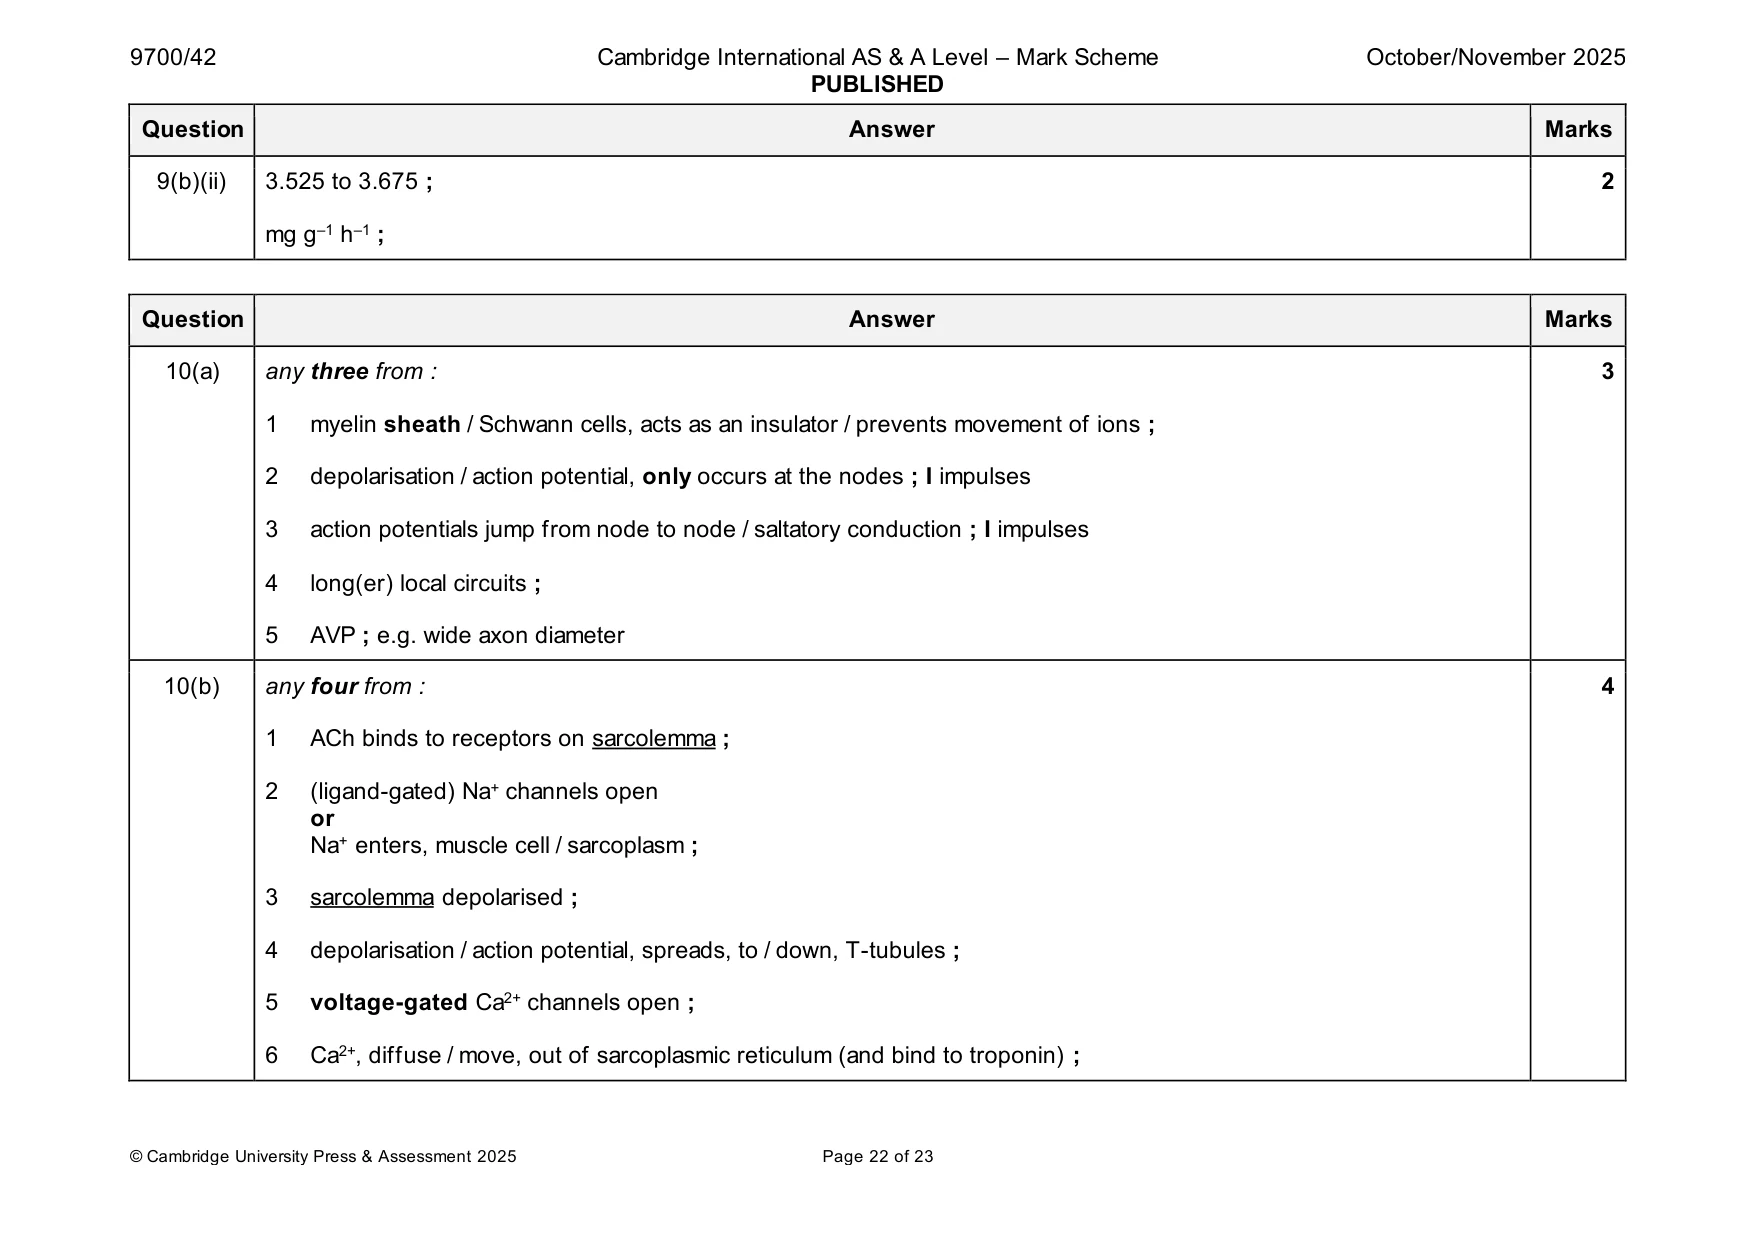
Mark scheme: 9(a)(i) absorption spectrum 2 absorption of different wavelengths (of light) by (named) pigment(s) ; action spectrum rate of photosynthesis at different wavelengths (of light) ; 9(a)(ii) any three from : 3 1 chlorophyll b / carotenoids / accessory pigments (are present) ; 2 (these other pigments) absorb light (energy), between 450 and 550 nm / of wavelengths that chlorophyll a does not absorb ; 3 energy passed on to, reaction centre / chlorophyll a / primary pigment ; 4 for, light-dependent reactions / photophosphorylation / photolysis (of water) / photoactivation ; 9(b)(i) any four from : 4 1 increase then decrease ; 2 optimum temperature at 29 C ; 3 data quote – two temperatures and two rates with units ; temperature / C rate of photosynthesis / mg g-1 h-1 ±0.5 ±0.05 2.5 0.75 5 1.1 10 1.8 20 2.95 29 3.5 30 3.45 40 2.65 45 1.5 48 0.5 increase / before 29 C 4 more kinetic energy for, enzyme (activity) / AW ; 5 temperature is the limiting factor ; decrease / after 29 C 6 denaturation of, rubisco / enzymes / oxygen-evolving complex ; 7 AVP ; e.g. photorespiration limiting the rate at above 25 C 9(b)(ii) 3.525 to 3.675 ; 2 mg g–1 h–1 ;
More questions on Photosynthesis as an energy transfer process
Q10 · Nerve impulses can be transmitted along a myelinated motor neurone to a neuromuscular…
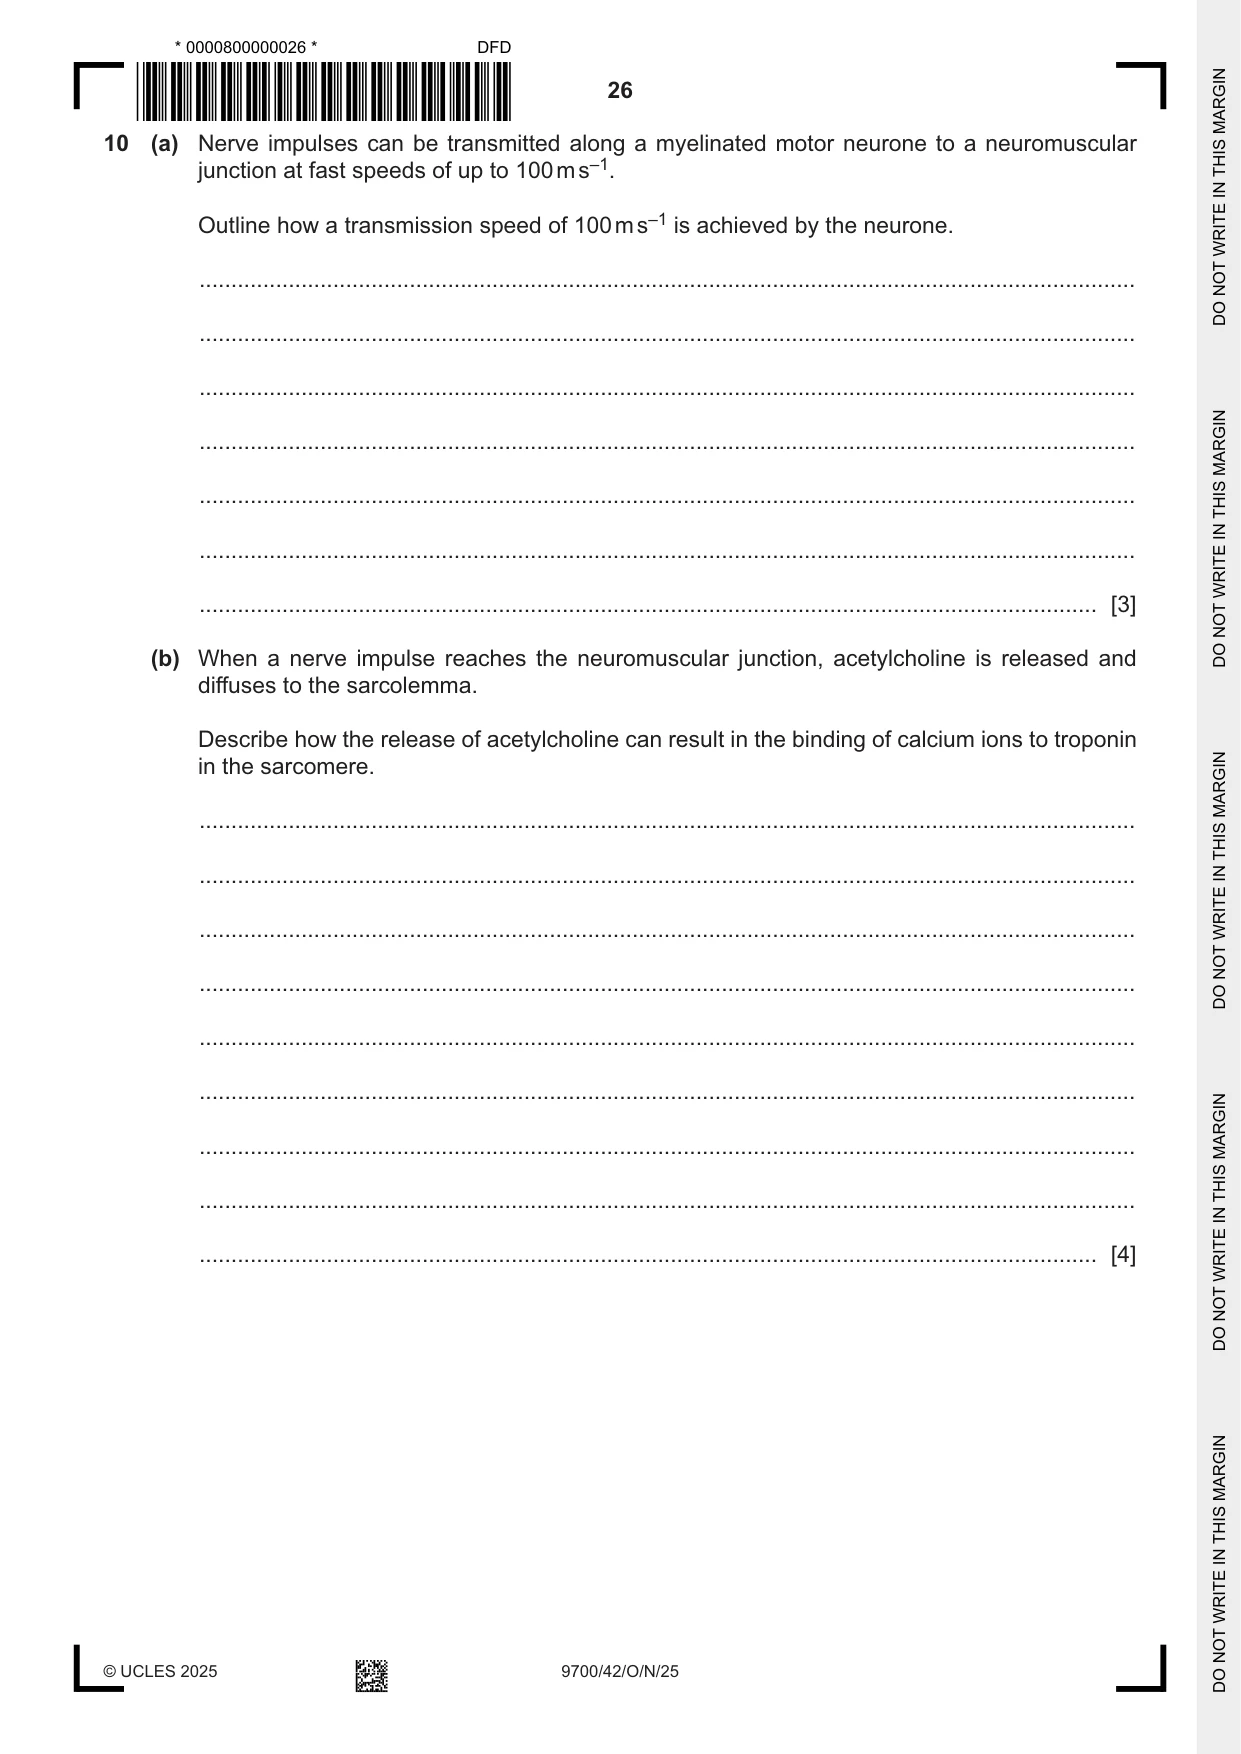
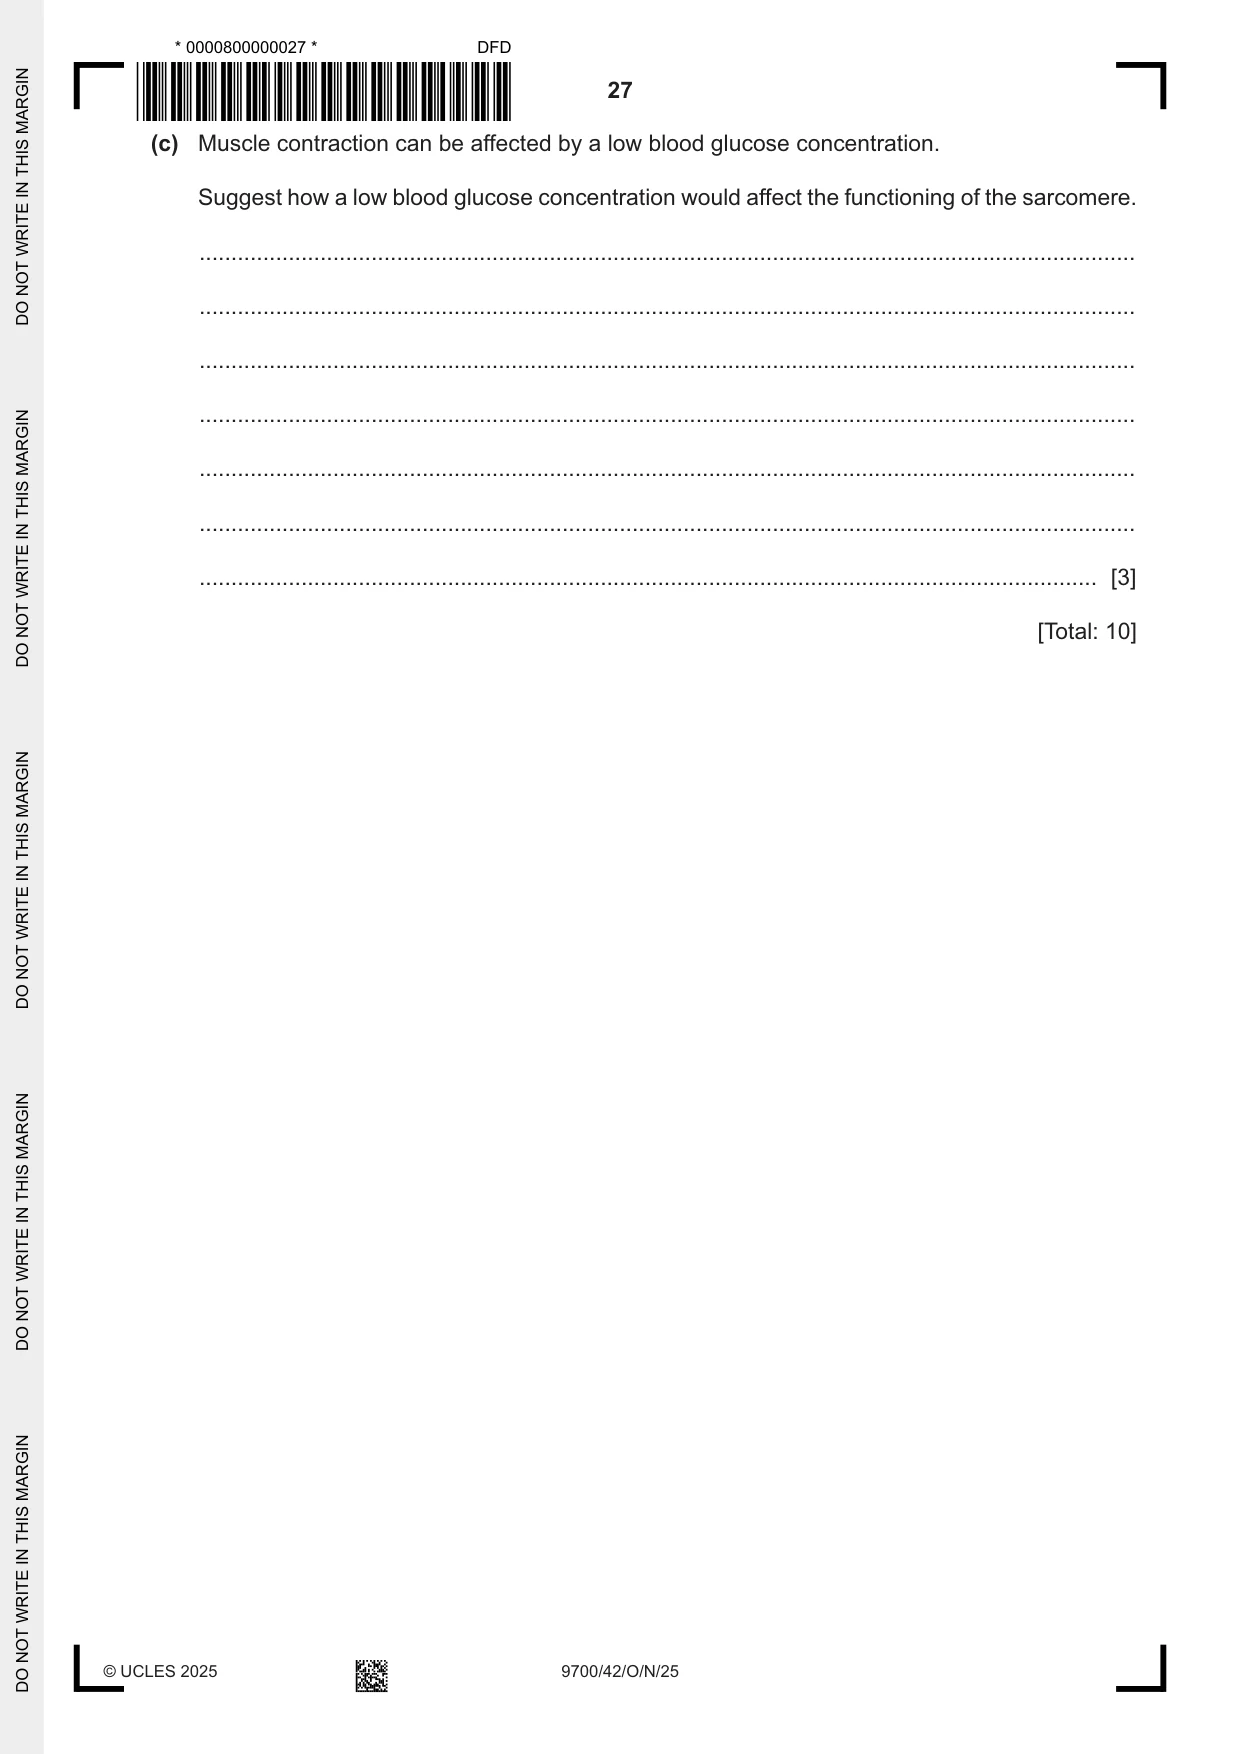
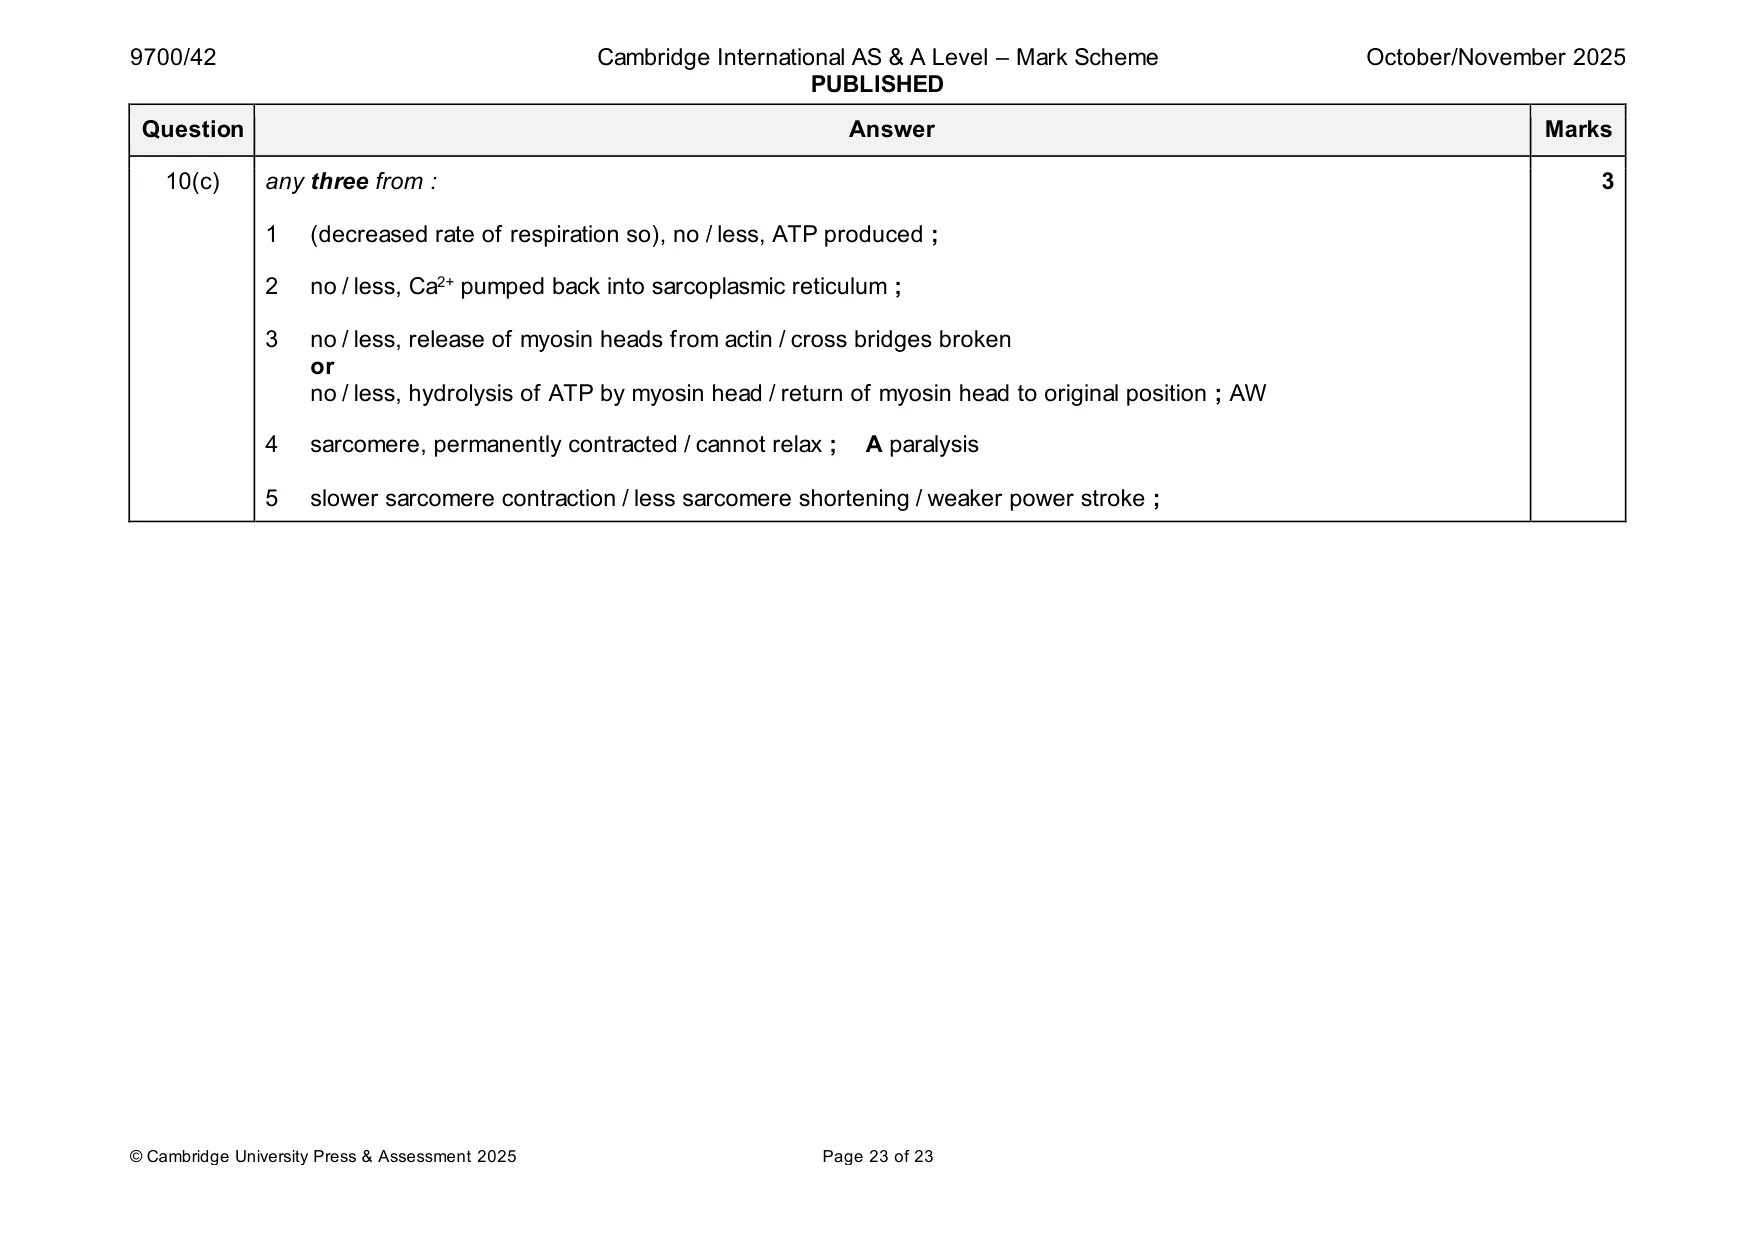
10 (a) Nerve impulses can be transmitted along a myelinated motor neurone to a neuromuscular junction at fast speeds of up to 100 m s–1. Outline how a transmission speed of 100 m s–1 is achieved by the neurone. ................................................................................................................................................... ................................................................................................................................................... ................................................................................................................................................... ................................................................................................................................................... ................................................................................................................................................... ................................................................................................................................................... ............................................................................................................................................. [3] (b) When a nerve impulse reaches the neuromuscular junction, acetylcholine is released and diffuses to the sarcolemma. Describe how the release of acetylcholine can result in the binding of calcium ions to troponin in the sarcomere. ................................................................................................................................................... ................................................................................................................................................... ................................................................................................................................................... ................................................................................................................................................... ................................................................................................................................................... ................................................................................................................................................... ................................................................................................................................................... ................................................................................................................................................... ............................................................................................................................................. [4] (c) Muscle contraction can be affected by a low blood glucose concentration. Suggest how a low blood glucose concentration would affect the functioning of the sarcomere. ................................................................................................................................................... ................................................................................................................................................... ................................................................................................................................................... ................................................................................................................................................... ................................................................................................................................................... ................................................................................................................................................... ............................................................................................................................................. [3] [Total: 10]
Mark scheme: 10(a) any three from : 3 1 myelin sheath / Schwann cells, acts as an insulator / prevents movement of ions ; 2 depolarisation / action potential, only occurs at the nodes ; I impulses 3 action potentials jump from node to node / saltatory conduction ; I impulses 4 long(er) local circuits ; 5 AVP ; e.g. wide axon diameter 10(b) any four from : 4 1 ACh binds to receptors on sarcolemma ; 2 (ligand-gated) Na+ channels open or Na+ enters, muscle cell / sarcoplasm ; 3 sarcolemma depolarised ; 4 depolarisation / action potential, spreads, to / down, T-tubules ; 5 voltage-gated Ca2+ channels open ; 6 Ca2+, diffuse / move, out of sarcoplasmic reticulum (and bind to troponin) ; 10(c) any three from : 3 1 (decreased rate of respiration so), no / less, ATP produced ; 2 no / less, Ca2+ pumped back into sarcoplasmic reticulum ; 3 no / less, release of myosin heads from actin / cross bridges broken or no / less, hydrolysis of ATP by myosin head / return of myosin head to original position ; AW 4 sarcomere, permanently contracted / cannot relax ; A paralysis 5 slower sarcomere contraction / less sarcomere shortening / weaker power stroke ;
What was in this paper
The subtopics covered by these 10 questions, and how many questions each got. Open one in a new tab to see every Cambridge question on it.
What you needed in this session
Cambridge’s own grade thresholds for 2025 Oct/Nov, Paper 4 · Variant 2. A higher threshold means an easier paper — the bar moves with how the cohort did.